Hydro-meteorological drivers and sources of … · Hydro-meteorological drivers and sources of...
18
Hydro-meteorological drivers and sources of suspended sediment flux in the pro-glacial zone of the retreating Castle Creek Glacier, Cariboo Mountains, British Columbia, Canada Michael S. Leggat, 1 Philip N. Owens, 1 * Tim A. Stott, 2 Barry J. Forrester, 2 Stephen J. Déry 1 and Brian Menounos 3 1 Environmental Science Program and Quesnel River Research Centre, University of Northern British Columbia, Prince George, British Columbia, Canada 2 Faculty of Education, Health & Community, Liverpool John Moores University, Liverpool, UK 3 Natural Resources and Environmental Studies Institute and Geography Program, University of Northern British Columbia, Prince George, British Columbia, Canada Received 30 September 2013; Revised 26 March 2015; Accepted 11 May 2015 *Correspondence to: Philip N. Owens, Environmental Science Program and Quesnel River Research Centre, University of Northern British Columbia, Prince George, British Columbia, V2N 4Z9, Canada. E-mail: [email protected] ABSTRACT: Glaciers are major agents of erosion that increase sediment load to the downstream fluvial system. The Castle Creek Glacier, British Columbia, Canada, has retreated ~1.0 km in the past 70 years. Suspended sediment concentration (SSC) and streamflow (Q) were monitored independently at five sites within its pro-glacial zone over a 60 day period from July to September 2011, representing part of the ablation season. Meteorological data were collected from two automatic weather stations proximal to the glacier. The time-series were divided into hydrologic days and the shape and magnitude of the SSC response to hydro- meteorological conditions (‘cold and wet’, ‘hot and dry’, ‘warm and damp’, and ‘storm’) were categorized using principal compo- nent analysis (PCA) and cluster analysis (CA). Suspended sediment load (SSL) was computed and summarized for the categories. The distribution of monitoring sites and results of the multivariate statistical analyses describe the temporal and spatial variability of suspended sediment flux and the relative importance of glacial and para-glacial sediment sources in the pro-glacial zone. During the 2011 study period, ~ 60% of the total SSL was derived from the glacial stream and sediment deposits proximal to the terminus of the glacier; during ‘storm’ events, that contribution dropped to ~40% as the contribution from diffuse and point sources of sediment throughout the pro-glacial zone and within the meltwater channels increased. While ‘storm’ events accounted for just 3% of the study period, SSL was ~600% higher than the average over the monitoring period, and ~20% of the total SSL was generated in that time. Determining how hydro-meteorological conditions and sediment sources control sediment fluxes will assist attempts to predict how pro-glacial zones respond to future climate changes. Copyright © 2015 John Wiley & Sons, Ltd. KEYWORDS: suspended sediment; pro-glacial; British Columbia; sediment budget; turbidity; para-glacial sediment sources Introduction Glaciers in British Columbia (BC), Canada, cover about 3% (~29 000 km 2 ) of the landmass (Moore et al., 2009), and all lost substantial mass in response to regional climate warming of 0.5 to 1.5 °C per century since the end of the Little Ice Age (Schiefer et al., 2007; Bolch et al., 2010; Tennant et al., 2012). Although current global climate models do not explicitly include glacial evolution (Syvitski and Milliman, 2007), it is expected that gla- ciers will continue to retreat in response to the projected 1 to 4 °C increase in global mean surface temperature, depending on the emission scenario, over the next 100 years (Collins et al., 2013). Changes in meteorological conditions and glacial retreat have been linked to increased variability of streamflow in recent decades, specifically the quantity and quality (i.e. temperature, sediment load, chemistry) of water and hydrograph timing (Déry et al., 2012; Kirtman et al., 2013). Consequently, there is much concern associated with the potential impacts of climate change, including glacial retreat, on river flows and sediment fluxes in BC [Fraser Basin Council (FBC), 2008; Moore et al., 2009; Déry et al., 2012]. Glacier retreat exposes unconsolidated sediments that are vulnerable to rapid and extensive erosion and entrainment into the fluvial system (Ballantyne, 2002). These pro-glacial sedi- ment sources tend to be spatially and temporally variable and transient, depending on site specific characteristics (Gurnell et al., 1996; Ballantyne, 2002; Tunnicliffe and Church, 2011). Immediately after exposure, the unconsolidated and water- saturated diamicton in the pro-glacial zone begins to adjust to subaerial conditions; loose sediments consolidate as the EARTH SURFACE PROCESSES AND LANDFORMS Earth Surf. Process. Landforms 40, 1542–1559 (2015) Copyright © 2015 John Wiley & Sons, Ltd. Published online 23 June 2015 in Wiley Online Library (wileyonlinelibrary.com) DOI: 10.1002/esp.3755
Transcript of Hydro-meteorological drivers and sources of … · Hydro-meteorological drivers and sources of...

EARTH SURFACE PROCESSES AND LANDFORMSEarth Surf. Process. Landforms 40, 1542–1559 (2015)Copyright © 2015 John Wiley & Sons, Ltd.Published online 23 June 2015 in Wiley Online Library(wileyonlinelibrary.com) DOI: 10.1002/esp.3755
Hydro-meteorological drivers and sources ofsuspended sediment flux in the pro-glacial zone ofthe retreating Castle Creek Glacier, CaribooMountains, British Columbia, CanadaMichael S. Leggat,1 Philip N. Owens,1* Tim A. Stott,2 Barry J. Forrester,2 Stephen J. Déry1 and Brian Menounos31 Environmental Science Program and Quesnel River Research Centre, University of Northern British Columbia, Prince George,British Columbia, Canada
2 Faculty of Education, Health & Community, Liverpool John Moores University, Liverpool, UK3 Natural Resources and Environmental Studies Institute and Geography Program, University of Northern British Columbia, PrinceGeorge, British Columbia, Canada
Received 30 September 2013; Revised 26 March 2015; Accepted 11 May 2015
*Correspondence to: Philip N. Owens, Environmental Science Program and Quesnel River Research Centre, University of Northern British Columbia, Prince George,British Columbia, V2N 4Z9, Canada. E-mail: [email protected]
ABSTRACT: Glaciers are major agents of erosion that increase sediment load to the downstream fluvial system. The Castle CreekGlacier, British Columbia, Canada, has retreated ~1.0 km in the past 70 years. Suspended sediment concentration (SSC) andstreamflow (Q) were monitored independently at five sites within its pro-glacial zone over a 60 day period from July to September2011, representing part of the ablation season. Meteorological data were collected from two automatic weather stations proximalto the glacier. The time-series were divided into hydrologic days and the shape and magnitude of the SSC response to hydro-meteorological conditions (‘cold and wet’, ‘hot and dry’, ‘warm and damp’, and ‘storm’) were categorized using principal compo-nent analysis (PCA) and cluster analysis (CA). Suspended sediment load (SSL) was computed and summarized for the categories.The distribution of monitoring sites and results of the multivariate statistical analyses describe the temporal and spatial variabilityof suspended sediment flux and the relative importance of glacial and para-glacial sediment sources in the pro-glacial zone. Duringthe 2011 study period, ~ 60% of the total SSL was derived from the glacial stream and sediment deposits proximal to the terminus ofthe glacier; during ‘storm’ events, that contribution dropped to ~40% as the contribution from diffuse and point sources of sedimentthroughout the pro-glacial zone and within the meltwater channels increased. While ‘storm’ events accounted for just 3% of thestudy period, SSL was ~600% higher than the average over the monitoring period, and ~20% of the total SSL was generated in thattime. Determining how hydro-meteorological conditions and sediment sources control sediment fluxes will assist attempts to predicthow pro-glacial zones respond to future climate changes. Copyright © 2015 John Wiley & Sons, Ltd.
KEYWORDS: suspended sediment; pro-glacial; British Columbia; sediment budget; turbidity; para-glacial sediment sources
Introduction
Glaciers in British Columbia (BC), Canada, cover about 3%(~29 000 km2) of the landmass (Moore et al., 2009), and all lostsubstantial mass in response to regional climate warming of 0.5to 1.5 °C per century since the end of the Little Ice Age (Schieferet al., 2007; Bolch et al., 2010; Tennant et al., 2012). Althoughcurrent global climate models do not explicitly include glacialevolution (Syvitski and Milliman, 2007), it is expected that gla-ciers will continue to retreat in response to the projected 1 to 4 °Cincrease in global mean surface temperature, depending on theemission scenario, over the next 100 years (Collins et al., 2013).Changes in meteorological conditions and glacial retreat
have been linked to increased variability of streamflow in recentdecades, specifically the quantity and quality (i.e. temperature,
sediment load, chemistry) of water and hydrograph timing (Déryet al., 2012; Kirtman et al., 2013). Consequently, there is muchconcern associated with the potential impacts of climatechange, including glacial retreat, on river flows and sedimentfluxes in BC [Fraser Basin Council (FBC), 2008; Moore et al.,2009; Déry et al., 2012].
Glacier retreat exposes unconsolidated sediments that arevulnerable to rapid and extensive erosion and entrainment intothe fluvial system (Ballantyne, 2002). These pro-glacial sedi-ment sources tend to be spatially and temporally variable andtransient, depending on site specific characteristics (Gurnellet al., 1996; Ballantyne, 2002; Tunnicliffe and Church, 2011).Immediately after exposure, the unconsolidated and water-saturated diamicton in the pro-glacial zone begins to adjust tosubaerial conditions; loose sediments consolidate as the

1543SUSPENDED SEDIMENT FLUXES IN THE PRO-GLACIAL ZONE
substrate drains, and slope angles decline (Ballantyne, 2002).Over time, the eluviation of fines, surface armouring,reduction in surface slope and vegetation colonization act tostabilize the pro-glacial zone and reduce sediment availabilityfor fluvial entrainment and transport (Warburton, 1990; Gurnellet al., 1999; Orwin and Smart, 2004). Church and Ryder (1972)reported that erosion of glacial deposits in a pro-glacial orpost-glacial fluvial environment results in heightened sedimenttransport that continues as long as the sediment remains easilyaccessible for fluvial erosion and transportation.The pro-glacial zone can function as a significant source or
sink of sediment, which can vary over a single ablation season(Hammer and Smith, 1983; Warburton, 1990; Hodson et al.,1998; Orwin and Smart, 2004; Cockburn and Lamoureux,2008; Stott et al., 2008), over the seasons of a year (Richardsand Moore, 2003), from year to year (Hodgkins et al., 2003;Stott and Mount, 2007), over the para-glacial period due to‘glacially conditioned sediment release’ (Church and Ryder,1972; Ballantyne, 2002), and over longer periods as glaciersexpand and contract in response to broader climatic trends(Church and Slaymaker, 1989; Moore et al., 2009). Abnormallywarm ablation seasons have been shown to increase sedimentyield from the pro-glacial zone (Stott and Mount, 2007),whereas, cooler seasons have been found to increase sedimentstorage (Hodgkins et al., 2003; Richards and Moore, 2003).Sediment sources in the pro-glacial zone also vary in re-
sponse to site and meteorological conditions. Warburton(1990) found that 77% of the sediment output from the BasGlacier d’Arolla in Switzerland was derived from the glacierand snout zone moraine deposits and that channel processeswere primarily responsible for modifying sediment loads withinthe pro-glacial zone. Orwin and Smart (2004) conducted an in-tensive study of suspended sediment fluxes in the pro-glacialzone of the Small River Glacier, BC (located only ~50 km fromthe site of the present study), and found that the pro-glacial areawas the source for up to 80% of the total suspended sedimentyield (SSY) transferred from the basin during part of the 2000ablation season. Furthermore, sub-glacial sediment sourcescan be an important (Warburton, 1990; Swift et al., 2002;Haritashya et al., 2010) or not so important (Hammer and Smith,1983; Orwin and Smart, 2004) component of the pro-glacialsuspended sediment budget, and this depends on the slope ofthe pro-glacial zone and other site specific geologic, glacialand pro-glacial characteristics (Gurnell et al., 1996; Schieferet al., 2001), as well as weather and climate patterns duringthe study (Richards and Moore, 2003; Moore et al., 2009).Given the diversity of findings in terms of the response of pro-
glacial zones to hydro-meteorological drivers and sedimentsources, a better understanding of the processes of sediment ex-change in pro-glacial zones and the effect of meteorological con-ditions on those processes could improve predictivemodelling ofriver sediment dynamics and, thereby, the effect on downstreamaquatic ecosystems and water resources (Milner et al., 2009;Moore et al., 2009; Owen et al., 2009). The anticipated changesin climate (i.e. temperature and precipitation) and the complexityassociated with such changes [Intergovernmental Panel onClimate Change (IPCC), 2013] make it important to understandhow fine-grained sediment fluxes from glacial and para-glacialsources could respond (Moore et al., 2009).The focus of this study is on the flux of fluvial suspended
sediment< 2mm through the pro-glacial zone and the influ-ence of hydro-meteorological conditions. We monitoredstreamflow (Q) and suspended sediment concentration (SSC)in the pro-glacial meltwater channels of the Castle CreekGlacier, BC, during part of the snow-free period in summer2011 and obtained meteorological data from proximal weatherstations to: (i) examine the spatial and temporal response
Copyright © 2015 John Wiley & Sons, Ltd.
pattern of SSC; and, (ii) determine the sources of Q andsuspended sediment load (SSL) under different hydro-meteorological conditions. We hypothesize that: (i) short-termsuspended sediment fluxes within the pro-glacial zone respondto hydro-meteorological conditions; and (ii) exposed sedimentadjacent to the glacier snout contributes substantially to down-stream sediment yield.
Study Area and Methods
Study area
Castle Creek Glacier (CCG) (53°2′ N, 120°24′ W, unofficialname), has an area of ~9 km2, a length of ~6 km, an elevationrange of 1870 to 2850m above sea level (a.s.l.) and is locatedin the Cariboo Mountains of eastern BC, ~180 km southeastof Prince George (Figure 1, Beedle et al., 2009). Beedle et al.(2009) used a series of annual push moraines and aerial photo-graphs to determine that the glacier retreated 886m between1946 and 2007, an average of 14m a�1 (Figure 1). Afterflowing through a small gorge and leaving the recently exposedpro-glacial zone, meltwater draining from CCG flows generallynortheast for ~34 km before flowing into the upper Fraser River,which drains into the Pacific Ocean at Vancouver, BC, after adistance of ~1375 km.
The scope of this study was on the meltwater channels andsediment sources in the pro-glacial area from the snout of theglacier 1870ma.s.l. to the small gorge 1790ma.s.l. The catch-ment area above the gorge was ~16 km2 and was ~60%glacierized in 2011 (Table I), stream distance was ~1.2 km withan average slope of ~3% (Figure 2). The area immediatelydownslope from the snout of the glacier was characterized bylow relief till sheets, outwash fans, abandoned meltwater chan-nels, and bedrock outcrops. The till deposits on the west side ofthe meltwater channel have been substantially eroded andmodified by several abandoned meltwater channels incised tovarying depths (up to 5m) which end at abandoned outwashfans. The east side of the meltwater channel was characterizedby two relatively intact till sheets separated by an outwash fancomplex (Figure 1). Most of the pro-glacial zone is devoid ofvegetation such that sediment is exposed to weathering anderosion. Three streams flow from the receding snout of CCG:(1) a small ice-marginal meltwater stream drains the east sideof the glacier; (2) the main flow emanates from a sub-glacialchannel portal on the northwest side of the glacier’s snout;and (3) a small stream drains a pro-glacial lake perched on a tillsheet that extends out from the terminus of the glacier drainsnorthwest over bedrock into the main channel (Figure 1).
Methods
Streamflow and SSC were monitored for 60 days between 13July and 11 September 2011 (Julian Day (JD) 195–JD 254) atfive stations (Figure 1): three proximal sites (PS1, PS2 andPS3) on the meltwater streams from the glacier (1870ma.s.l.);a middle site (MS) below the confluence of the three streams(~0.65 km from the glacier snout and 1800m a.s.l); and a distalsite (DS) at the bedrock gorge (~1.2 km from the glacier snoutand 1790ma.s.l.). The majority of the seasonal snowpackhad already melted from the pro-glacial area prior to the startof data collection and thus the monitoring period does notrepresent the full ablation period.
Meteorological data were collected from two automaticweather stations (AWSs): one located on a bedrock ridge onthe south side of CCG at 2105ma.s.l.; the other was located
Earth Surf. Process. Landforms, Vol. 40, 1542–1559 (2015)
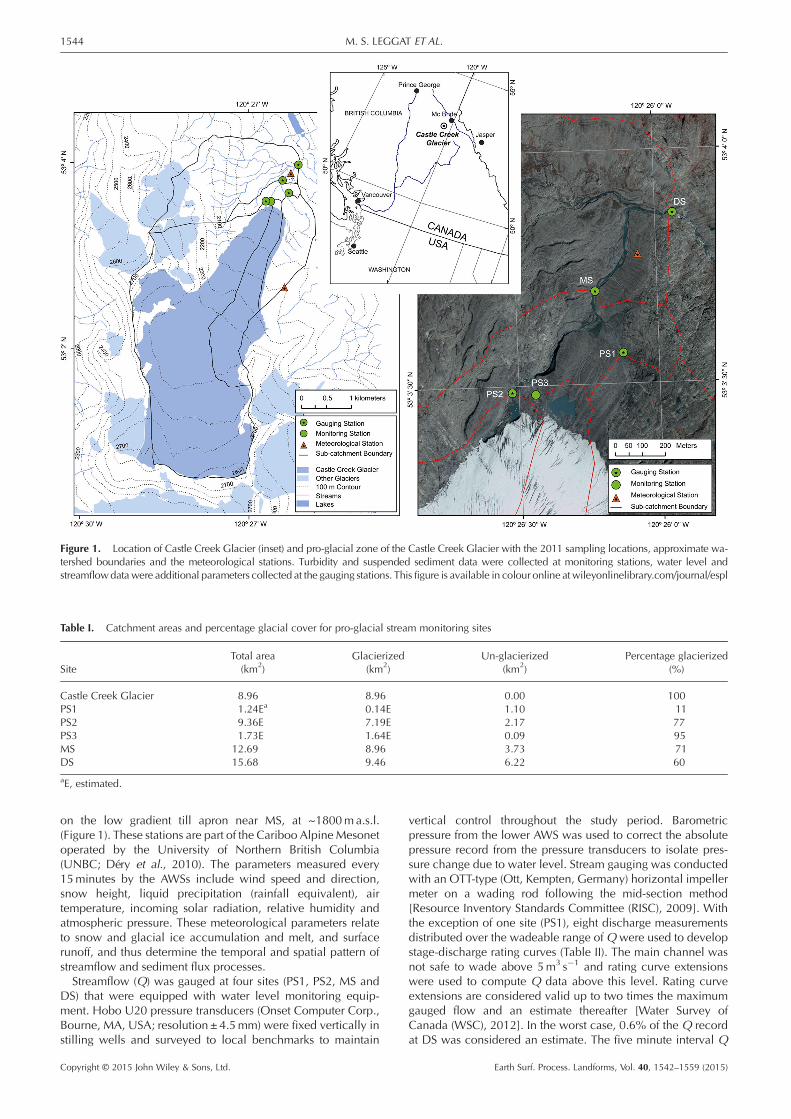
Table I. Catchment areas and percentage glacial cover for pro-glacial stream monitoring sites
SiteTotal area Glacierized Un-glacierized Percentage glacierized(km2) (km2) (km2) (%)
Castle Creek Glacier 8.96 8.96 0.00 100PS1 1.24Ea 0.14E 1.10 11PS2 9.36E 7.19E 2.17 77PS3 1.73E 1.64E 0.09 95MS 12.69 8.96 3.73 71DS 15.68 9.46 6.22 60
aE, estimated.
Figure 1. Location of Castle Creek Glacier (inset) and pro-glacial zone of the Castle Creek Glacier with the 2011 sampling locations, approximate wa-tershed boundaries and the meteorological stations. Turbidity and suspended sediment data were collected at monitoring stations, water level andstreamflowdatawere additional parameters collected at the gauging stations. This figure is available in colour online at wileyonlinelibrary.com/journal/espl
1544 M. S. LEGGAT ET AL.
on the low gradient till apron near MS, at ~1800ma.s.l.(Figure 1). These stations are part of the Cariboo AlpineMesonetoperated by the University of Northern British Columbia(UNBC; Déry et al., 2010). The parameters measured every15minutes by the AWSs include wind speed and direction,snow height, liquid precipitation (rainfall equivalent), airtemperature, incoming solar radiation, relative humidity andatmospheric pressure. These meteorological parameters relateto snow and glacial ice accumulation and melt, and surfacerunoff, and thus determine the temporal and spatial pattern ofstreamflow and sediment flux processes.Streamflow (Q) was gauged at four sites (PS1, PS2, MS and
DS) that were equipped with water level monitoring equip-ment. Hobo U20 pressure transducers (Onset Computer Corp.,Bourne, MA, USA; resolution ±4.5mm) were fixed vertically instilling wells and surveyed to local benchmarks to maintain
Copyright © 2015 John Wiley & Sons, Ltd.
vertical control throughout the study period. Barometricpressure from the lower AWS was used to correct the absolutepressure record from the pressure transducers to isolate pres-sure change due to water level. Stream gauging was conductedwith an OTT-type (Ott, Kempten, Germany) horizontal impellermeter on a wading rod following the mid-section method[Resource Inventory Standards Committee (RISC), 2009]. Withthe exception of one site (PS1), eight discharge measurementsdistributed over the wadeable range of Q were used to developstage-discharge rating curves (Table II). The main channel wasnot safe to wade above 5m3 s�1 and rating curve extensionswere used to compute Q data above this level. Rating curveextensions are considered valid up to two times the maximumgauged flow and an estimate thereafter [Water Survey ofCanada (WSC), 2012]. In the worst case, 0.6% of the Q recordat DS was considered an estimate. The five minute interval Q
Earth Surf. Process. Landforms, Vol. 40, 1542–1559 (2015)
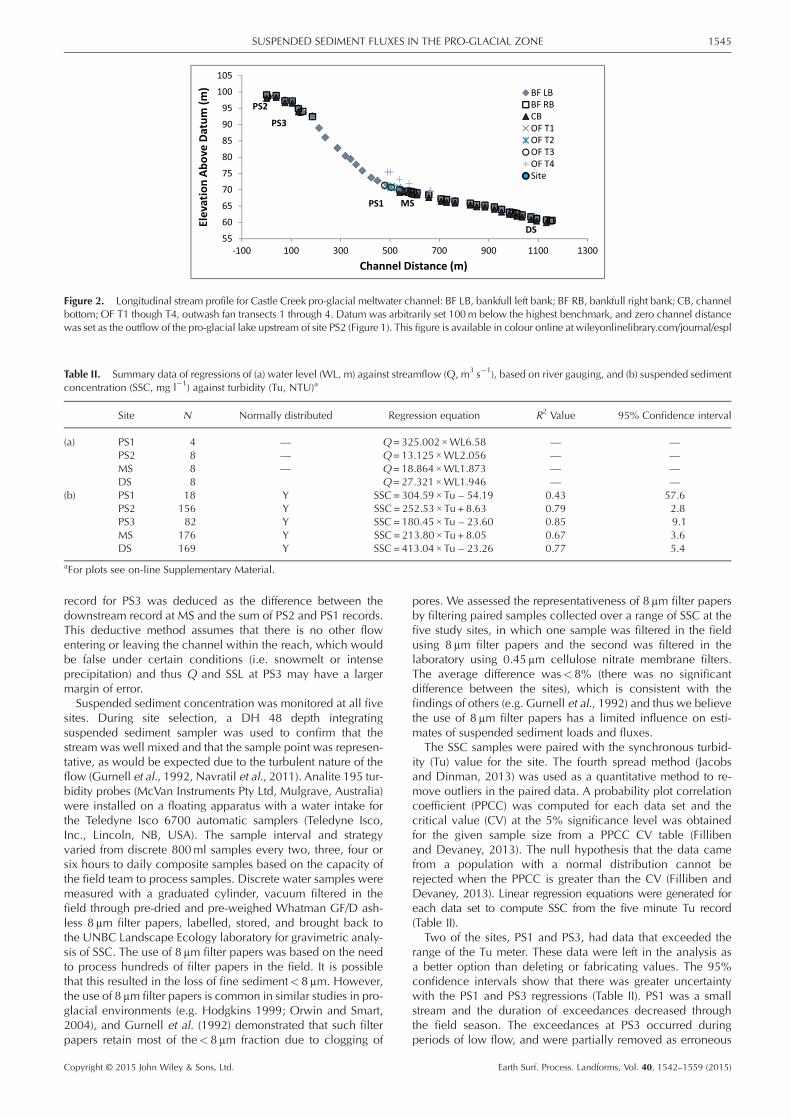
Figure 2. Longitudinal stream profile for Castle Creek pro-glacial meltwater channel: BF LB, bankfull left bank; BF RB, bankfull right bank; CB, channelbottom; OF T1 though T4, outwash fan transects 1 through 4. Datum was arbitrarily set 100m below the highest benchmark, and zero channel distancewas set as the outflow of the pro-glacial lake upstream of site PS2 (Figure 1). This figure is available in colour online at wileyonlinelibrary.com/journal/espl
Table II. Summary data of regressions of (a) water level (WL, m) against streamflow (Q, m3 s�1), based on river gauging, and (b) suspended sedimentconcentration (SSC, mg l�1) against turbidity (Tu, NTU)a
Site N Normally distributed Regression equation R2 Value 95% Confidence interval
(a) PS1 4 — Q = 325.002 ×WL6.58 — —PS2 8 — Q = 13.125 ×WL2.056 — —MS 8 — Q = 18.864 ×WL1.873 — —DS 8 Q = 27.321 ×WL1.946 — —
(b) PS1 18 Y SSC = 304.59 × Tu – 54.19 0.43 57.6PS2 156 Y SSC= 252.53 × Tu + 8.63 0.79 2.8PS3 82 Y SSC = 180.45 × Tu – 23.60 0.85 9.1MS 176 Y SSC= 213.80 × Tu + 8.05 0.67 3.6DS 169 Y SSC = 413.04 × Tu – 23.26 0.77 5.4
aFor plots see on-line Supplementary Material.
1545SUSPENDED SEDIMENT FLUXES IN THE PRO-GLACIAL ZONE
record for PS3 was deduced as the difference between thedownstream record at MS and the sum of PS2 and PS1 records.This deductive method assumes that there is no other flowentering or leaving the channel within the reach, which wouldbe false under certain conditions (i.e. snowmelt or intenseprecipitation) and thus Q and SSL at PS3 may have a largermargin of error.Suspended sediment concentration was monitored at all five
sites. During site selection, a DH 48 depth integratingsuspended sediment sampler was used to confirm that thestream was well mixed and that the sample point was represen-tative, as would be expected due to the turbulent nature of theflow (Gurnell et al., 1992, Navratil et al., 2011). Analite 195 tur-bidity probes (McVan Instruments Pty Ltd, Mulgrave, Australia)were installed on a floating apparatus with a water intake forthe Teledyne Isco 6700 automatic samplers (Teledyne Isco,Inc., Lincoln, NB, USA). The sample interval and strategyvaried from discrete 800ml samples every two, three, four orsix hours to daily composite samples based on the capacity ofthe field team to process samples. Discrete water samples weremeasured with a graduated cylinder, vacuum filtered in thefield through pre-dried and pre-weighed Whatman GF/D ash-less 8μm filter papers, labelled, stored, and brought back tothe UNBC Landscape Ecology laboratory for gravimetric analy-sis of SSC. The use of 8μm filter papers was based on the needto process hundreds of filter papers in the field. It is possiblethat this resulted in the loss of fine sediment<8μm. However,the use of 8μm filter papers is common in similar studies in pro-glacial environments (e.g. Hodgkins 1999; Orwin and Smart,2004), and Gurnell et al. (1992) demonstrated that such filterpapers retain most of the< 8μm fraction due to clogging of
Copyright © 2015 John Wiley & Sons, Ltd.
pores. We assessed the representativeness of 8μm filter papersby filtering paired samples collected over a range of SSC at thefive study sites, in which one sample was filtered in the fieldusing 8μm filter papers and the second was filtered in thelaboratory using 0.45μm cellulose nitrate membrane filters.The average difference was<8% (there was no significantdifference between the sites), which is consistent with thefindings of others (e.g. Gurnell et al., 1992) and thus we believethe use of 8μm filter papers has a limited influence on esti-mates of suspended sediment loads and fluxes.
The SSC samples were paired with the synchronous turbid-ity (Tu) value for the site. The fourth spread method (Jacobsand Dinman, 2013) was used as a quantitative method to re-move outliers in the paired data. A probability plot correlationcoefficient (PPCC) was computed for each data set and thecritical value (CV) at the 5% significance level was obtainedfor the given sample size from a PPCC CV table (Fillibenand Devaney, 2013). The null hypothesis that the data camefrom a population with a normal distribution cannot berejected when the PPCC is greater than the CV (Filliben andDevaney, 2013). Linear regression equations were generated foreach data set to compute SSC from the five minute Tu record(Table II).
Two of the sites, PS1 and PS3, had data that exceeded therange of the Tu meter. These data were left in the analysis asa better option than deleting or fabricating values. The 95%confidence intervals show that there was greater uncertaintywith the PS1 and PS3 regressions (Table II). PS1 was a smallstream and the duration of exceedances decreased throughthe field season. The exceedances at PS3 occurred duringperiods of low flow, and were partially removed as erroneous
Earth Surf. Process. Landforms, Vol. 40, 1542–1559 (2015)

1546 M. S. LEGGAT ET AL.
data due to the sample intake point being too close to thestreambed. Due to low flow volume, the effect of the exceedanceson the SSL results at PS1 and PS3 was limited.The pressure transducers and Tu data loggers were pro-
grammed to observe water level and Tu every minute and tolog an average value every five minutes. During the analysis,the five minute time-series data sets were further smoothed witha seven-point moving average, while maintaining a five minutesample interval. Time-series computations and rating curvedevelopment were performed using the Aquarius WhiteboardTime-Series Software (Aquatic Informatics, Inc., Vancouver,BC, Canada). Data summaries were exported for principalcomponent analysis (PCA) and cluster analysis (CA) in IBM SPSSStatistics 20.0 (IBM Corporation, Armonk, NY, USA).Parts of the statistical analysis and data summaries require
daily values. To minimize the influence of the diurnal peakfrom the previous day, the time-series were divided based onthe timing of diurnal minimum flow, which tended to occur be-tween 06:00 and 08:00 Pacific Standard Time. For this study,06:00 was used to divide the five minute time-series data into‘hydrologic days’ (i.e. 06:00–05:59) whenever daily data wererequired.
Data analysis
The statistical analysis of the meteorological, pro-glacial hydro-metric, and suspended sediment data was guided by the analy-sis of a similar data set by Orwin and Smart (2004) – for thenearby Small River Glacier (SRG), thereby enabling compari-son – which is based on a pro-glacial hydrograph classificationtechnique developed by Hannah et al. (2000). The analysis
Figure 3. Flow chart detailing the classification procedure used to extract s
Copyright © 2015 John Wiley & Sons, Ltd.
uses PCA and CA to reduce large time-series data sets intocategories of similar data while maintaining as much of the un-derlying structure of the data as possible. Hannah et al. (2000)used the analysis to categorize discharge time-series data intocategories of ‘shape’ and ‘magnitude’ based on the diurnalhydrograph. Orwin and Smart (2004) indicate that the analysisis applicable to any time-series data with an underlying cyclicstructure, and expanded the analysis to include pro-glacialsuspended sediment data. Through the analysis, they were ableto infer controls on the pattern of suspended sediment transportusing four separate classification procedures (Figure 3). ThePCA and CA analyses were run on data matrices where ‘cases’refer to rows of data categories down the y-axis; and ‘variables’refer to columns of data categories across the x-axis. Thefollowing sub-sections describe the statistical procedures thatwere performed on the 2011 CCG pro-glacial data (i.e. asshown in Figure 3).
Meteorological periodsThe 15-minute meteorological data sets were averaged over thehydrologic day (06:00–05:59) and a CA was run to group thedaily data into categories of similar conditions. The CA of me-teorological data included cases of daily values for the vari-ables: mean, maximum, and minimum air temperature; totalprecipitation; mean relative humidity; total solar radiation;and mean wind speed. Air temperature records from the upperand lower AWS were averaged for the analysis. The data werestandardized (z-scored) prior to running the CA using Ward’sMethod, and an agglomeration dendrogram was plotted to de-termine the number of meaningful clusters within the data. Theraw data within each cluster were reviewed, and descriptive
uspended sediment transfer patterns (source: Orwin and Smart 2004).
Earth Surf. Process. Landforms, Vol. 40, 1542–1559 (2015)

1547SUSPENDED SEDIMENT FLUXES IN THE PRO-GLACIAL ZONE
titles were assigned, which were broadly similar to thoseassigned by Orwin and Smart (2004).
Streamflow driving factorsTo determine the main driving forces of Q (i.e. from glacialmeltwater or precipitation), the input matrix for PCA had dailyaverageQ for each site, total precipitation, solar radiation, aver-age wind speed, and air temperature minimum, maximum andmean as variables, and hydrologic days as cases. The PCAwasrun using a VARIMAX orthogonal rotation with standard reten-tion criteria. Low communality variables were removed fromthe analysis and the PCAwas re-run on the remaining variables.The Kaiser–Mayer–Olkin (KMO) measure of sampling ade-quacy (Tabachnick and Fidell, 1989) was used to assess the cor-relation matrix and suitability of the data set for PCA. Parallelanalysis was used to identify the statistically significant eigen-value for the data (O’Connor, 2000). Components with signifi-cant eigenvalues were retained to assess the driving factors ofQ and the proportion of variance in the data explained by eachcomponent. A bi-plot of the two dominant components wasgenerated and descriptive titles (i.e. ‘ablation’ or ‘rainfall’) wereassigned after assessing the data explained by the component.
Suspended sediment response shapeTo assess the underlying suspended sediment response shape,an independent PCAwas run on a data matrix with hydrologicdays as variables and a five-minute time step as cases for SSCdata at each site. The PCAwas run using a VARIMAX orthogonalrotation with standard retention criteria. Parallel analysis wasused to identify the statistically significant eigenvalue for thedata (O’Connor, 2000). For each site, a scree plot was generatedto confirm the break point in the principal components, and thatcomponents with eigenvalues>1 were retained. Principalcomponent loading scores were plotted against time to revealthe underlying shape of the five-minute SSC data for each site.Days with similar diurnal suspended sediment response
shape were identified by running a hierarchical CA on theprincipal component loading scores using Ward’s Method. Ob-servations were standardized (z-scored) to remove major varia-tions in SSC magnitude. Low communality variables wereremoved and an agglomeration dendrogram was plotted tovisually identify the number of clusters. The shape structure ofthe raw data in the clusters was examined and appropriate titles(i.e. ‘diurnal’ or ‘irregular’) were assigned.
Suspended sediment response magnitudeThe classification of suspended sediment response magnitudewas determined by running CA on a data matrix with daily SSCmean, minimum, maximum, range, standard deviation and daily
Figure 4. Mean daily air temperature and precipitation with results of cluperiod. Note: x-axis is in Julian Days. This figure is available in colour onlin
Copyright © 2015 John Wiley & Sons, Ltd.
total SSL as variables, with hydrologic days as cases for each site.Data were standardized (z-scored) prior to running the CA usingWard’s Method, and an agglomeration dendrogram was plottedto visually identify the number of clusters. The magnitude struc-ture of the raw data in the clusters was examined and appropriatetitles (i.e. ‘low’, ‘medium’ or ‘high’) were assigned.
Results and Discussion
Meteorological conditions
The weather conditions over the first 24 days of the field sea-son, from JD 195 to JD 218, were variable (Figure 4). Averagedaily temperatures tended to be<8 °C and low to moderateprecipitation was common. This period included one stormevent on JD 211 when daily precipitation exceeded 30mm.After JD 218, the weather conditions tended to persist forperiods; there were three warmer and drier periods, and twocooler and wetter periods. There was another intense stormon JD 234 (Figure 4). During the onset of the intense rain eventon JD 234, the tipping bucket rain gauge was damaged, anddata for this event and thereafter were missed. Data for thisevent and the remainder of the field season were estimatedfrom three nearby meteorological stations; two operated byEnvironment Canada (Cariboo Lodge near Valemount, EC ID1171393; and Crescent Spur, EC ID 1092120) and one by theBC Ministry of Environment (McBride upper snow pillow, BCMOE ID 1A02P). A weighted average based on horizontaland vertical proximity to the study site was used. Fortunately,the remainder of the field season was dominated by a highpressure system and there was minimal precipitation. Field per-sonnel were on site during both storm events and qualitativeobservations were made. The storm event on JD 211 was char-acterized by persistent precipitation throughout the day, whilethe storm event on JD 234 consisted of a series of intensesqualls that began mid-afternoon and ended by early morningon JD 235. The onset of the event on JD 234 was synchronouswith the diurnal peak, andQwas already moderate in responseto warm weather on the previous two days.
The CA of meteorological data allowed the field season to bedivided into four categories that, upon reviewing the raw datawithin the category, were described based on air temperatureand precipitation conditions (Figure 4). Those categories andthe percentage of the field season that they represent are: ‘coldand wet’ (17/60, 28%), ‘warm and damp’ (15/60, 25%), ‘hotand dry’ (26/60, 43%), and ‘storm event’ (2/60, 3%). Thesecategories were used for comparison of Q and suspendedsediment response under different meteorological conditions.
ster analysis for dominant meteorological conditions during the studye at wileyonlinelibrary.com/journal/espl
Earth Surf. Process. Landforms, Vol. 40, 1542–1559 (2015)

1548 M. S. LEGGAT ET AL.
Nine of the ‘hot and dry’ days occurred in early Septemberwhen the approaching autumnal equinox limited the amount ofdaily insolation and the potential for ablation. Additionally, bythis point in the field season, the annual snowpack had all butretreated from the pro-glacial zone and ablation zone of the gla-cier, leaving primarily ice melt to augment Q. Had this ‘hot anddry’ weather occurred earlier in the field season when the dayswere longer and annual snowpack was still present, the Q andSSC response could have been much different. Without these
Figure 5. Streamflow (Q) and suspended sediment concentration (SSC) timefor the period Julian Day (JD) 195–JD 254, 2011. Scale of y-axis varies acco
Copyright © 2015 John Wiley & Sons, Ltd.
nine days in the data set, the field season was nearly balancedbetween the three main categories of meteorological conditions.
Streamflow
Streamflow (Q) during the field seasonwas predominantly charac-terized by a diurnal pattern in response to air temperatures andmeteorological conditions that cause snowand icemelt (Figure 5).
-series (five minute data interval) from five pro-glacial monitoring sites,rding to range of data.
Earth Surf. Process. Landforms, Vol. 40, 1542–1559 (2015)

Figure 5. (Continued)
igure 6. Principal component loading of daily meteorological andtreamflow (Q) variables on principal component one (PC1) and PC2xplained 42% (PC1) and 30% (PC2) of the total variance in the princi-al component analysis (PCA). Distance of the variable from the origindicates relative dominance of the Q generating processes; PC1 andC2 were interpreted as ‘Rainfall’ and ‘Ablation’, and have been titledccordingly on the axes of the figure.
1549SUSPENDED SEDIMENT FLUXES IN THE PRO-GLACIAL ZONE
IncreasedQ due to precipitation events can be thought of as beingsuperimposed on this underlying diurnal response pattern.The PCA of Q and meteorological conditions reduced the
data to their underlying components. The two dominanteigenvalues> 1 were used to generate a bi-plot, and descrip-tive titles were assigned (Figure 6). The KMO measure of sam-pling adequacy index for the correlation matrix was 0.532which indicated that the PCAwas a suitable analysis; as a ruleof thumb, if the KMO is> 0.5, PCA is a suitable analysis(Tabachnick and Fidell, 1989).The two components that were retained from the analysis
explained 72% of the total variance in Q data (Figure 6). Thefirst component was interpreted as ‘rainfall’ or stormy condi-tions and explained 42% of the variance in Q. The secondcomponent was interpreted as ‘ablation’ and explained 30%of the variance in Q. Distance from the origin (0.0, 0.0) wasinterpreted as dominance of the driving factor on Q patternfor the site. Orwin and Smart (2004) found that the two compo-nent solution explained 77% of the total variability in the datafrom the 2000 field season at SRG; 55% was attributed to ‘ab-lation’, and 22%was attributed to ‘rainfall’. In the CCG analysisthe days that were represented by ‘rainfall’were not necessarilydays with substantial precipitation, they may have just notscored as ‘ablation’ driven days because they were overcast,cool and/or windy; thus, stormy conditions may be an equallyapplicable title for the component. The greater influence ofthe ‘rainfall’ component on Q in the CCG analysis may be aresult of the later field season (JD 194–JD 254 at CCG versusJD 188–JD 238 at SRG), and thus a lower influence of annual
Copyright © 2015 John Wiley & Sons, Ltd.
snowmelt ablation in the 2011 Q data for CCG than in the2000 Q data for SRG (Orwin and Smart, 2004).
In general, all of the sites plot strongly positive on the‘rainfall’ axis, but show less variation from the origin on the‘ablation’ axis. Sites PS2, MS and DS were along the main stem
FsepinPa
Earth Surf. Process. Landforms, Vol. 40, 1542–1559 (2015)

1550 M. S. LEGGAT ET AL.
of the Castle Creek meltwater channel, and all plot close to-gether, and were strongly influenced by ‘rainfall’ and moder-ately influenced by ‘ablation’. As the distance from the glacierincreased, the influence of ‘ablation’ on Q patterns decreasedand the influence of ‘rainfall’ increased; which was consistentwith the results of Orwin and Smart (2004). Although the PS3catchment had the greatest percentage glacial cover, it was lessinfluenced by ‘ablation’ and ‘rainfall’ than the sites along themain channel, which suggests a more stable source of flowfrom deeper within the glacier than the active ablation zone(Swift et al., 2002). PS1 plots negatively on the ‘ablation’ axis,which was interpreted as a stronger influence of ‘rainfall’ onQ than ‘ablation’ due to the small proportion of glacierizedcatchment area.The precipitation variable plotted positively on the ‘rainfall’
axis and negatively on the ‘ablation’ axis, while solar radiationplotted positively on the ‘ablation’ axis and negatively on the‘rainfall’ axis; which was interpreted as ablation being gener-ated by sunny days, and that cloudy days generated precipita-tion. The air temperature variables indicate a strong positiverelation on the ‘ablation’ axis and near neutral on the ‘rainfall’axis; which was interpreted as warm weather generated abla-tion, and that rainy weather was not necessarily cool. The windspeed variable plots neutral on the ‘ablation’ axis, which couldbe a result of net balance in the data, rather than no effect, andpositive on the ‘rainfall’ axis, indicating that wind speedincreased during rainy or stormy weather. The trend of kata-batic winds would have been observed more strongly at thelower meteorological station; this trend was muted by averag-ing the wind speed data from the upper and lower meteorolog-ical stations. It is likely that wind speed from the lowermeteorological station alone would have plotted more positivelyon the ‘ablation’ axis.
Suspended sediment concentration responsepattern
Suspended sediment concentration (SSC) responded similarlyto Q; however, there are several instances of striking indepen-dence between the SSC andQ time-series at each site (Figure 5).The ‘shape’ and ‘magnitude’ of suspended sediment responsewas categorized using PCA and CA. For this part of the analysis,the exceedances were left in the data sets; however, missing
Table III. Turbidity (Tu) data summary for the pro-glacial monitoring sites f
Data record PS1
Total days with data record 60Number of days JD 195–JD 254 58Partial days 10Partial day exceedance d 48Missing days 2a
Full day exceedances d 4Useable days within JD 195–JD 254 d 58a
Percentage of record useable 97Number of five minute data points 16134 16Number of five minute exceedances 6332Percentage of data within Tu range 61Maximum SSC d 707.1
aLate start of data collection.bLow water.cTwo days of erroneous data excluded.dMaximum suspended sediment concentration (SSC; mg l�1) value as comp
Copyright © 2015 John Wiley & Sons, Ltd.
and partial days of data were omitted. The total number of use-able days within the study period is reported in Table III.
Suspended sediment response shapeThe PCA that was run on the five minute SSC data retained threecomponents for each site. Principal loading scores on the threecomponents were generated and plotted against time to revealthe underlying ‘shape’ of the components (Figure 7). Time isreported in decimal days counting up from zero, and data arefor the hydrologic day (06:00–05:59). For instance, the first sam-ple of the day is at 06:00, which is 6/24, or 0.25 of a day.
The percentage of data that was represented by each princi-pal component is reported for each site in Figure 7. Since theanalyses were run independently for each site, the ‘shape’ ofthe principal component was not necessarily comparableacross sites; the days that make up the first principal compo-nent (PC1) at one site might fall into the second principal com-ponent (PC2) at another site. Overall, PC1 and PC2 representedan average of 36% and 21% of the data, the third principalcomponent (PC3) represented an average of 8.5% of the data,and an average of 35% of the data was not represented bythe any of the three principal components. All three principalcomponents appeared to have a relatively well-defined patternfor PS1, PS3, MS and DS. The PC3 pattern appeared to be morestochastic for PS2, and appears to be double peaked at PS3, MSand DS. The results presented by Orwin and Smart (2004) weresimilar; PC1, PC2 and PC3 represented an average of 37%,20%, and 10%, respectively, of their suspended sediment dataand PC3 also showed a more irregular response pattern.
A CA was run on the principal component loading scores,and the two cluster solution was used to categorize days as‘diurnal’ or ‘irregular’ suspended sediment response shape(Table IV). Comparisons of these results with the results fromthe regression score loading plots (Figure 7) confirm that PC1and PC2 roughly represent the ‘diurnal’ data as a percentage,while PC3 and the remaining data that were not representedby a principal component make up the ‘irregular’ data. The dis-tribution of ‘diurnal’ and ‘irregular’ response days is presentedin Figure 8 with the hydrographs and sedigraphs, and Table IVshows the distribution within the meteorological categories.
Suspended sediment response magnitudeThe CA of the SSC magnitude parameters separated the dailydata into ‘high’, ‘medium’ and ‘low’ categories (Figure 8,
or 2011 field season
Site
PS2 PS3 MS DS
63 62 62 6460 60 60 603b 2b — —
— 13 — 11b 3b — —
— 2c — —56b 53b 60 6089 85 97 94534 15567c 17280 17280
0 1707 0 33100 89 100 100
427.4 1009.1
uted by regression equation.
Earth Surf. Process. Landforms, Vol. 40, 1542–1559 (2015)
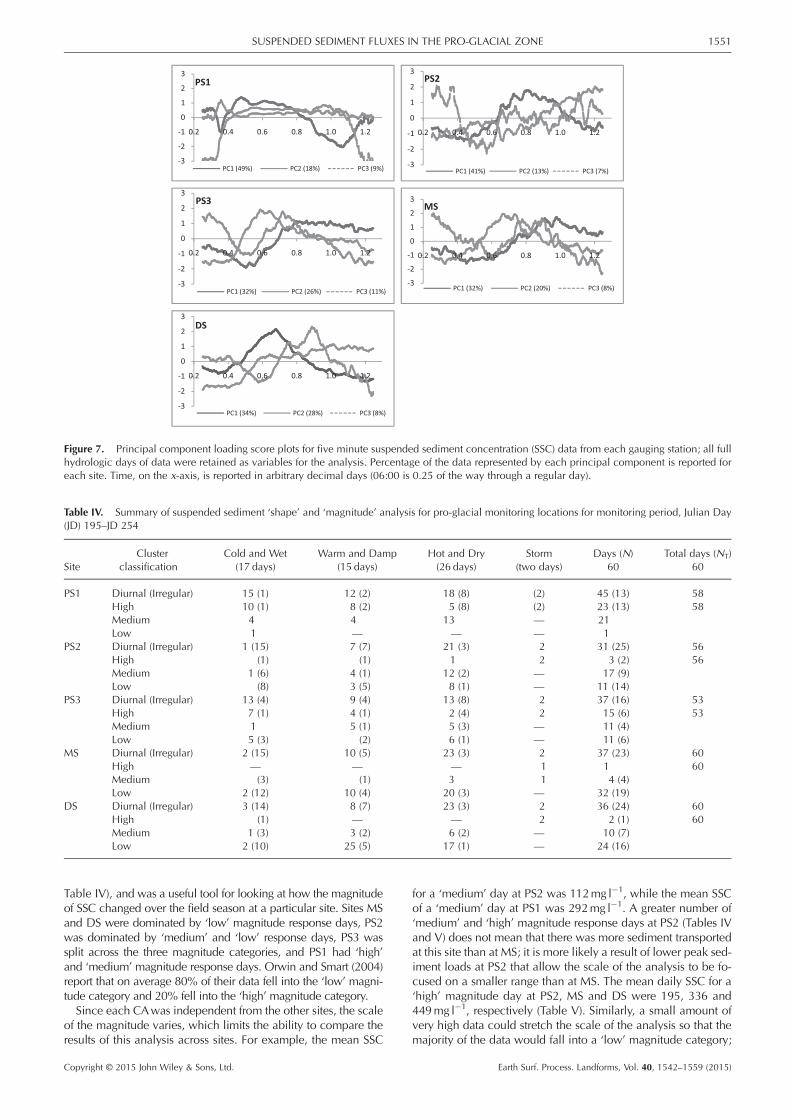
Figure 7. Principal component loading score plots for five minute suspended sediment concentration (SSC) data from each gauging station; all fullhydrologic days of data were retained as variables for the analysis. Percentage of the data represented by each principal component is reported foreach site. Time, on the x-axis, is reported in arbitrary decimal days (06:00 is 0.25 of the way through a regular day).
Table IV. Summary of suspended sediment ‘shape’ and ‘magnitude’ analysis for pro-glacial monitoring locations for monitoring period, Julian Day(JD) 195–JD 254
SiteCluster
classificationCold and Wet Warm and Damp Hot and Dry Storm Days (N) Total days (NT)
(17 days) (15 days) (26 days) (two days) 60 60
PS1 Diurnal (Irregular) 15 (1) 12 (2) 18 (8) (2) 45 (13) 58High 10 (1) 8 (2) 5 (8) (2) 23 (13) 58Medium 4 4 13 — 21Low 1 — — — 1
PS2 Diurnal (Irregular) 1 (15) 7 (7) 21 (3) 2 31 (25) 56High (1) (1) 1 2 3 (2) 56Medium 1 (6) 4 (1) 12 (2) — 17 (9)Low (8) 3 (5) 8 (1) — 11 (14)
PS3 Diurnal (Irregular) 13 (4) 9 (4) 13 (8) 2 37 (16) 53High 7 (1) 4 (1) 2 (4) 2 15 (6) 53Medium 1 5 (1) 5 (3) — 11 (4)Low 5 (3) (2) 6 (1) — 11 (6)
MS Diurnal (Irregular) 2 (15) 10 (5) 23 (3) 2 37 (23) 60High — — — 1 1 60Medium (3) (1) 3 1 4 (4)Low 2 (12) 10 (4) 20 (3) — 32 (19)
DS Diurnal (Irregular) 3 (14) 8 (7) 23 (3) 2 36 (24) 60High (1) — — 2 2 (1) 60Medium 1 (3) 3 (2) 6 (2) — 10 (7)Low 2 (10) 25 (5) 17 (1) — 24 (16)
1551SUSPENDED SEDIMENT FLUXES IN THE PRO-GLACIAL ZONE
Table IV), and was a useful tool for looking at how the magnitudeof SSC changed over the field season at a particular site. Sites MSand DS were dominated by ‘low’ magnitude response days, PS2was dominated by ‘medium’ and ‘low’ response days, PS3 wassplit across the three magnitude categories, and PS1 had ‘high’and ‘medium’ magnitude response days. Orwin and Smart (2004)report that on average 80% of their data fell into the ‘low’ magni-tude category and 20% fell into the ‘high’magnitude category.Since each CAwas independent from the other sites, the scale
of the magnitude varies, which limits the ability to compare theresults of this analysis across sites. For example, the mean SSC
Copyright © 2015 John Wiley & Sons, Ltd.
for a ‘medium’ day at PS2 was 112mg l�1, while the mean SSCof a ‘medium’ day at PS1 was 292mg l�1. A greater number of‘medium’ and ‘high’ magnitude response days at PS2 (Tables IVand V) does not mean that there was more sediment transportedat this site than at MS; it is more likely a result of lower peak sed-iment loads at PS2 that allow the scale of the analysis to be fo-cused on a smaller range than at MS. The mean daily SSC for a‘high’ magnitude day at PS2, MS and DS were 195, 336 and449mg l�1, respectively (Table V). Similarly, a small amount ofvery high data could stretch the scale of the analysis so that themajority of the data would fall into a ‘low’ magnitude category;
Earth Surf. Process. Landforms, Vol. 40, 1542–1559 (2015)

Figure 8. Composite figures showing suspended sediment shape (diurnal or irregular) and magnitude (1 = low; 2 =medium; 3 = high) classificationresults from principal component analysis and cluster analysis and daily mean streamflow (Q) and suspended sediment concentration (SSC) for eachof the pro-glacial monitoring sites. PS1, PS2, and PS3 are missing days in the shape and magnitude classification due to low water, partial days of data,erroneous data or no data (see Table III). Note: x-axes in Julian Days.
1552 M. S. LEGGAT ET AL.
in which case, the detail of the time-series data could becomelost or obscured. Differences in scale between the sites were alsoreported for a similar analysis on the data fromSRGbyOrwin andSmart (2004), which they attributed to sediment availability in thecontributing catchment area.
Suspended sediment load response tometeorological conditions
Suspended sediment load was computed from the five minutetime-series data, and summarized into hydrologic days. Thetime-series were then divided into the categories determined
Copyright © 2015 John Wiley & Sons, Ltd.
through PCA and CA. The quantity of sediment generated underthe various conditions was computed and summarized as dailyaverages (Table VI). The values are reported in kilograms perday for the specified category; totals can be computed by multi-plying values in Table VI by the corresponding values for numberof days in Table IV.
From the information in Table VI, it is possible to determinewhere, when and how much sediment was generated,transported, stored and evacuated from the basin during the2011 field season. To simplify the information, it could be pre-sented as percentage of total; however, the distribution of daysacross categories varied by site and is specific to the 2011 fieldseason, which would make comparisons between locations or
Earth Surf. Process. Landforms, Vol. 40, 1542–1559 (2015)

Figure 8. (Continued)
Table V. Summary of suspended sediment response magnitude parameters and cluster analysis results
Site
SSCMagnitude
class
AverageSSCmin
(mg l�1)
AverageSSCmax
(mg l�1)SSCmean
(mg l�1)
AverageSSCrange
(mg l�1)
AverageSSCStd.Dev.
(mg l�1)
Averagestandard
SSCrange (ratio)Average SSL(kg day�1)
Days(N)
Total days(NT)
PS1 High 433 (168) 707 (0) 644 (63) 284 (168) 80 (55) 1.0 (1.0) 5619 (3698) 36 58Medium 16 (40) 683 (52) 292 (99) 667 (54) 233 (36) 27 (196) 2313 (577) 21Low 0 122 38 146 41 6.0 640 1
PS2 High 119(44) 356 (84) 196 (58) 236 (50) 58 (14) 2.2 (0.8) 108893 (68359) 5 56Medium 80 (17) 176 (32) 112 (19) 96 (35) 20 (8) 1.3 (0.6) 29072 (9564) 26Low 65 (10) 111 (18) 81 (13) 45 (14) 9 (3) 0.7 (0.3) 17323 (5572) 25
PS3 High 174 (92) 393 (70) 306 (90) 219 (81) 63 (33) 2.0 (1.6) 13387 (6898) 21 53Medium 102 (32) 319 (74) 199 (49) 216 (60) 54 (20) 2.3 (0.8) 7211 (2628) 15Low 43 (28) 192 (78) 92 (40) 149 (71) 33 (16) 4.9 (3.3) 2817 (2305) 17
MS High 193 499 336 305 84 1.6 301577 1 60Medium 88 (30) 311 (72) 161 (39) 233 (53) 47 (12) 2.7 (0.7) 68120 (35730) 8Low 74 (17) 147 (35) 103 (24) 73 (26) 16 (6) 1.0 (0.4) 28630 (13223) 51
DS High 211 (108) 968 (45) 449 (152) 757 (71) 189 (50) 5.0 (3.0) 367279 (249474) 3 60Medium 162 (41) 396 (116) 238 (53) 233 (120) 51 (25) 1.6 (1.2) 100484 (49369) 17Low 97 (22) 210 (55) 143 (32) 113 (45) 26 (12) 1.2 (0.5) 41631 (15893) 40
Note: Values computed from daily data. Standard deviations are reported in parentheses.
1553SUSPENDED SEDIMENT FLUXES IN THE PRO-GLACIAL ZONE
over different field seasons difficult; Hannah et al. (2000) also re-port this limitation with the analysis. As described previously,‘shape’ and ‘magnitude’ parameters were essentially driven byhydro-meteorological conditions at the time of monitoring. Thus,the most applicable division of the field season is into the hydro-meteorological periods. From there, similar computations oftotals and averages can be made, but reported in a simplified for-mat that will be more useful for modelling applications, assessingsubsequent years of data, or comparing data from other sites.Suspended sediment load andQ in Table VII were computed
as a percentage of the daily average at DS for the specified
Copyright © 2015 John Wiley & Sons, Ltd.
meteorological category; the daily average SSL and Q valuesfor each meteorological category at DS were included for backcalculation purposes. Differences in source contribution to thetotal SSL at DS during the defined hydro-meteorological cate-gories can be compared in Table VII and Figure 9.
Mean daily SSL and Q were similar during ‘cold and wet’and ‘hot and dry’ conditions at the catchment outlet, althoughthe percentage contribution from the monitoring locations tothe total at DS varies. Glacial melt decreased during ‘coldand wet’ conditions, and while precipitation activated somein-channel and pro-glacial sediment sources, low stream
Earth Surf. Process. Landforms, Vol. 40, 1542–1559 (2015)

Table VI. Summary of average suspended sediment load (in kg day�1) for each sub-category
Site Cluster classification Cold and Wet Warm and Damp Hot and Dry Storm Weighted average Average
PS1 Diurnal (Irregular) 4927 (5829) 3567 (4736) 2866 (4188) (17200) 3740 (6400) 4336High 6430 (5829) 4320 (4736) 4044 (4188) (17200) 5177 (6400) 5619Medium 2240 2061 2413 — 2313 2313Low 640 — — — 640 640
PS2 Diurnal (Irregular) 20774 (23451) 26874 (30702) 27595 (30822) 142879 34650 (26366) 30952High (74606) (109527) 74572 142879 120110 (92067) 108893Medium 20774 (26345) 37951 (23263) 28013 (32911) — 29926 (27462) 29072Low (14886) 12105 (16425) 21096 (26643) — 18644 (16275) 17323
PS3 Diurnal (Irregular) 7625 (8329) 8568 (5267) 4642 (10877) 29600 7994 (8838) 8249High 10932 (15130) 11378 (10915) 11824 (12552) 29600 13659 (12709) 13387Medium 8460 6320 (9060) 5818 (9982) — 6286 (9752) 7211Low 2829 (6062) (547) 1268 (6863) — 1978 (4357) 2817
MS Diurnal (Irregular) 33109 (29683) 24089 (58396) 32791 (41514) 191799 39051 (37468) 38444High — — — 301577 301577 301577Medium (53905) (138134) 54363 82021 61278 (74962) 68120Low 33109 (23627) 24089 (38462) 29555 (41514) — 28069 (29574) 28630
DS Diurnal (Irregular) 50233 (61070) 53448 (85171) 58527 (70122) 444324 78140 (69231) 74577High (213187) — — 444324 444324 (213187) 367279Medium 56034 (95476) 82680 (203185) 93841 (74156) — 86712 (120159) 100484Low 47332 (35537) 35908 (37966) 46063 (62054) — 44053 (37953) 41613
Note: Averages for ‘irregular’ response shape data are reported in brackets. The values reported in the body of the table are arithmetic means for thegiven category. Weighted averages were used to account for the disproportionate number of days in each category for the ‘shape’ and ‘magnitude’,and total summary. Table IV reports the the number of days in each category.
Table VII. Percentage (%) of mean daily suspended sediment load (SSL) and streamflow (Q) relative to the distal site (DS) during meteorologicalperiods determined by principal component analysis (PCA)
Meteorologicalperiod
Cold and Wet Warm and Damp Hot and Dry Storm Seasonal28% (17 days) 25% (15 days) 44% (26 days) 3% (two days) 100% (60 days)
Site
Percentageof meanSSL at DS
Percentageof meanQ at DS
Percentageof meanSSL at DS
Percentageof meanQ at DS
Percentageof meanSSL at DS
Percentageof meanQ at DS
Percentageof meanSSL at DS
Percentageof meanQ at DS
Percentageof meanSSL at DS
Percentageof meanQ at DS
PS1 8 3 5 2 6 2 4 4 6 2PS2 39 71 42 76 47 77 32 75 42 75PS3 13 10 11 10 12 10 7 11 11 10∑ PS1 + PS2 + PS3 61 84 59 87 64 89 43 89 59 87MS 51 84 52 88 56 89 43 88 52 87DSa 100
(59158)100(3.60)
100(68252)
100(3.69)
100(59865)
100(3.69)
100(444324)
100(8.05)
100(74577)
100(3.81)
aMean SSL (kg day�1) and Q (m3 s�1) have been included for DS for back calculation purposes
1554 M. S. LEGGAT ET AL.
competency allowed storage on the outwash fan complex.There was a greater contribution from PS2 during ‘hot anddry’ conditions in response to ablation. MeanQ at DS was sim-ilar for ‘warm and damp’ and ‘hot and dry’, but mean SSL wasgreater for ‘warm and damp’ conditions and less SSL was de-rived from the three proximal sites. Aside from inputs down-stream of MS, PS2 contributes the majority of the sedimentload throughout the study period, varying between 32% during‘storm’ events and 47% during ‘hot and dry’ periods (Figure 9).The SSL increased significantly in the reach between MS
and DS (MS–DS) for all of the hydro-meteorological periods;a minimum of 44% during ‘hot and dry’ conditions and amaximum of 57% during ‘storm’ events (Figure 9). The mainsource of sediment in the MS–DS reach was likely to be themain tributary stream in the study area which is confluentwith the main stem of Castle Creek ~150m upstream of DS(Figure 1). This tributary drains a small cirque glacier on theadjacent peak and the western slope of the pro-glacial zone(Figure 1). Field observations found abundant unconsolidatedsediment within and adjacent to the meltwater stream flowingfrom the cirque glacier. It was not possible to adequately
Copyright © 2015 John Wiley & Sons, Ltd.
monitor SSL from the tributary during the 2011 field seasondue to low flow volume and high bedload transport. However,the main channel in the MS–DS reach was well established, andit was presumed that the majority of the SSL increase in the reachwas from the tributary stream; diffuse para-glacial and channelmarginal sediment sources within the reach would only be acti-vated by snowmelt, intense precipitation or very highQ. As a sea-sonal average, there was a ~13% increase in flow and a ~48%increase in SSL in the MS–DS reach (Table VII and Figure 9).
The sum of the SSL from the three proximal streams wasgreater than that of MS for ‘cold and wet’, ‘warm and damp’,and ‘hot and dry’ conditions, indicating that there was sedi-ment storage upstream of MS. Based on site observations andthe longitudinal profile (Figure 2), storage predominantly oc-curred on the low gradient outwash fan complex immediatelyupstream of MS. The amount of storage on the outwash fan var-ied slightly over the three main hydro-meteorological periods,and was ~7% as an average for the study period. However, dur-ing the observed ‘storm’ events, the SSL output from the threeproximal stations was equal to the SSL at MS, indicating thatsediment storage on the outwash fan complex was balanced
Earth Surf. Process. Landforms, Vol. 40, 1542–1559 (2015)

Figure 9. Schematic diagram of percentage (%) contribution of suspended sediment load (SSL) and streamflow (Q) relative to the total at the down-stream gauging site (DS) over the 2011 field season and during the four defined hydro-meteorological categories. This figure is available in colouronline at wileyonlinelibrary.com/journal/espl
1555SUSPENDED SEDIMENT FLUXES IN THE PRO-GLACIAL ZONE
with sediment evacuation and other sediment contributionsupstream of MS triggered by high stream competency.While the balance of SSL and Q contribution shifts moder-
ately under meteorological and Q conditions that account for97% of the study period, ‘storm events’ were remarkably differ-ent as sediment contribution from the proximal sites becameless important when channel processes, slope inputs and ero-sion of valley sandur were more active. During the two stormdays that accounted for 3% of the study period, SSL and Q atDS were 596% and 211%, respectively, of the seasonal aver-age. However, the percentage of the total SSL that was deriveddownstream of MS increased to 57% as diffuse and pointsources of sediment within the MS–DS contributing area weretriggered by intense precipitation and high water levels. Inter-estingly, the proportion of Q input downstream of MS was sim-ilar to other hydro-meteorological periods. Five grab sampleswere collected in the MS–DS catchment as the JD 234 event
Copyright © 2015 John Wiley & Sons, Ltd.
peaked. Two were collected from ephemeral channels thatdrained directly into Castle Creek, one upstream of the tribu-tary, and one downstream of the tributary; they were measuredat ~3600mg l�1 and ~2000mg l�1, respectively. The grab sam-ple from the tributary was measured at ~4200mg l�1, and themain flow of Castle Creek upstream and downstream of theconfluence with the tributary was measured at ~1300mg l�1
and ~2700mg l�1, respectively. These peak values are compa-rable to those observed by other researchers (Gurnell et al.,1996; Hodson et al., 1998), but much less than the ~12000mg l�1 reported by Orwin and Smart (2004).
In Table VIII, values were computed based on the total SSLand mean Q for the study period to show the contribution dur-ing the specified meteorological category for each of the sites.Interestingly, ~20% of the total seasonal SSL at DS was evacu-ated during the ‘storm’ events, which was ~4% higher than PS2and MS (Table VIII). The SSL increase in the MS–DS reach was
Earth Surf. Process. Landforms, Vol. 40, 1542–1559 (2015)
1556 M. S. LEGGAT ET AL.
attributed to the contribution of sediment from diffuse pro-glacialsources via ephemeral channels and the activation of sedimentsources along the channel of the tributary stream. PS1 and PS3had a lower percentage of their total SSL transported during‘storm’ events than PS2, which is likely because of the domi-nance of bedrock in the PS1 catchment and glacial ice in thePS3 catchment, and because of lower abundance of sedimentsources that are activated by ‘storm’ events in these catchments.The response pattern of MS was very similar to PS2 because75% and 86%, respectively, of the total SSL andQ were derivedfrom PS2. The SSL at PS2 showed a greater increase with ‘storm’events than the other proximal sites because unconsolidatedextra-channel sediment sources proximal or adjacent to the gla-cier were activated by precipitation and increased streamflow.Daily SSY in Table IX was computed by dividing the mean
sediment load for a given period (Table VII) by the contributingcatchment area (Table I). For total yield, the mean daily SSYvalues are multiplied by the respective number of days of ob-servation in the category (note that some sites are missing days,as reported in Table III). Interestingly, the SSY of the proximalsites tended to be greater than the SSYof MS. However, SSY be-tween MS and DS increased with catchment area, which, asexpected (Church and Slaymaker, 1989; Gurnell et al., 1996;Schiefer et al., 2001; Tunnicliffe and Church, 2011), disagreeswith conventional sediment yield models (Syvitski andMilliman, 2007). During ‘cold and wet’ conditions the SSY atPS1 was greater than PS2, while it was less than PS2 for theother three meteorological conditions. SSY at MS was typicallyless than any of the proximal sites, indicating sediment storagewithin the pro-glacial channel network upstream of MS. The ef-fect of ‘storm’ events on SSY was striking; compared to themean for the study period, the minimum increase was 260%for PS3 and the maximum increase was 496% for DS. Thedownstream trend of increasing relative SSY during ‘storm’events was likely because of ephemeral stream inputs from dif-fuse pro-glacial sediment sources during the events. Warburton(1990) found that a large proportion of the SSY can be gener-ated in a short period of high stream competency, and Orwinand Smart (2004) also found that sediment was evacuated dur-ing storm events. This triggered response from the pro-glacialzone should be expected to continue, in declining magnitude,until the end of the para-glacial period (Church and Ryder,1972; Church and Slaymaker, 1989; Gurnell et al., 1996;Ballantyne, 2002).
Pro-glacial suspended sediment budget
Based on the preceding analysis and field observations, a basicpro-glacial suspended sediment flux budget was developed to
Table VIII. Meteorological summary of suspended sediment load (SSL) and
Meteorologicalperiod
Cold and Wet Warm and Damp28% (17 days) 25% (15 days)
Site
Percentageof seasonal
SSL
Percentageof seasonal
Q
Percentageof seasonal
SSL
Percentageof seasonal
Q
Po
PS1 32 37 21 19PS2 22 25 23 25PS3 30 27 23 24∑ PS1 + PS2 + PS3 24 26 23 24MS 22 26 23 24DS 23 27 23 24
Note: Values computed as a percentage of the seasonal total SSL and season
Copyright © 2015 John Wiley & Sons, Ltd.
ascribe SSL to various sources based on the parameters definedby Warburton (1990). It was assumed that the error was nor-mally distributed within the data and that the relative accuracywas valid. Again, it is important to emphasize that the sedimentbudget only applies to the study period, which represents partof the ablation season. The SSL contribution from the proximalsites was a combination of direct input from the glacier (GL),and input from moraine deposits at the terminus (MD). Basedon field observations, the SSL for PS1 was predominantly fromMD, while PS2 was mostly (80%) GL and PS3 may be splitequally. Change in valley sandur (ΔVS) occurred on the out-wash fan upstream of MS. With the exception of storm events,there was sediment stored upstream of MS, which can be de-fined as the difference between the input of sediment fromthe proximal sites and the amount of sediment measured atMS. The increase in the MS–DS reach was substantial through-out the field season. Based on field observations and acceptingthe limitations of the monitoring programme (cf. Gurnell et al.,1992), the increase in the MS–DS reach was attributed to tribu-tary channel inputs (TR) with the exception of ‘storm’ eventswhen ephemeral channels were observed to be actively con-tributing to SSL, and thus a portion of SSL would be fromΔVS. Direct hillslope inputs (SL) were observed along the rightbank of the meltwater channel, upstream from the outwash fanand immediately downstream from the confluence of PS2 andPS3. The SL contribution is typically small, but episodic in-creases can be expected when triggered by high streamflowor spring snowmelt and freeze–thaw cycles. The total yield(Y) from the pro-glacial catchment was measured at DS. Fol-lowing this premise, the suspended sediment budget for theCCG pro-glacial zone can be defined as:
Y 100%ð Þ ¼ GL 39%ð Þ þMD 20%ð Þ þ ΔVS –7%ð ÞþSL 0:5%ð Þ þ TR 49%ð Þ (1)
Values were used directly or subdivided, as stated in the pre-ceding paragraph, from the percentage of mean daily SSL and,following the same premise, a suspended sediment budgetcould be drawn for any of the hydro-meteorological categories(Table VII). In the overall suspended sediment budget for theCCG pro-glacial zone, GL and MD in the active meltwaterchannels at the snout of the glacier accounted for 59% of theSSL input. For the budget, ΔVS was computed as �7%, show-ing sediment storage on the outwash fan complex upstream ofMS. The difference between MS and DS was 49% as anaverage, and attributed to TR; however, this reach was not ad-equately quantified and a portion can be expected to be gener-ated from ΔVS during snowmelt, ‘storm’ events and high flow.
streamflow (Q) for each site
Hot and Dry Storm Seasonal44% (26 days) 3% (two days) 100% (60 days)
ercentagef seasonal
SSL
Percentageof seasonal
Q
Percentageof seasonal
SSL
Percentageof seasonal
QTotalSSL (t)
Mean Q(m3 s�1)
34 34 14 11 251 0.0939 43 17 7 1733 2.8534 41 14 8 437 0.3837 43 16 7 2421 3.3638 43 17 7 2307 3.3235 42 20 7 4475 3.81
al mean Q.
Earth Surf. Process. Landforms, Vol. 40, 1542–1559 (2015)

Table IX. Suspended sediment yield (SSY) for the Castle Creek Glacier catchment during the 2011 field season, expressed as mean daily SSY(in t km�2 day�1) and total SSY (in t km�2) (in parentheses) for each sub-basin
Site (km2) Cold and Wet Warm and Damp Hot and Dry Storm Seasonal(17 days) (15 days) (26 days) (two days) (60 days)
Mean daily (Total) Mean daily (Total) Mean daily (Total) Mean daily (Total) Mean daily (Total)
PS1 (1.24) 4.01 (64.3) 3.00 (42.0) 2.64 (68.6) 13.9 (27.7) 3.49 (202)PS2 (9.36) 2.48 (39.7) 3.08 (43.1) 2.99 (71.8) 15.3 (30.6) 3.31 (185)PS3 (1.73) 4.49 (76.3) 4.37 (56.8) 4.05 (85.0) 17.1 (34.2) 4.76 (253)MS (12.69) 2.37 (40.3) 2.80 (42.0) 2.66 (69.3) 15.1 (30.3) 3.03 (182)DS (15.68) 3.77 (64.1) 4.35 (65.3) 3.82 (99.2) 28.3 (56.6) 4.76 (285)
1557SUSPENDED SEDIMENT FLUXES IN THE PRO-GLACIAL ZONE
Intensive field measurements were conducted by Warburton(1990) to define the pro-glacial fluvial sediment budget for JD134–JD 211 of the 1987 ablation season at the Bas Glacierd’Arolla, Switzerland. The sediment yield was measured atproximal and distal ends of a 300m pro-glacial reach. At thedistal site, the catchment area was ~8 km2 and 70% glaciated.Using various sampling approaches, Y, SL, TR, MD and ΔVSwere measured or estimated. Pro-glacial sediment sourcescontributed 23% of the sediment received at the catchmentoutlet, and 95% of that contribution was generated frombank and channel erosion of valley sandur during a short pe-riod of meltwater flooding from JD 197 to JD 199. While SLand TR accounted for a small percentage of the total SSY, theGL and MD contribution accounted for ~77%. The ΔVS wasof overwhelming importance in modifying the sediment loadfrom GL and four basic fluvial process subsets were identi-fied: (1) channel marginal; (2) channel; (3) hillslope; (4)slopewash. Since the GL component was estimated by quan-tifying the other variables and subtracting their total from theoverall sediment yield, Y, the budget was not truly ‘closed’,and the cumulative error in the measurement of the otherterms of the equation made the estimate precise to only± 26% (Warburton, 1990).Orwin and Smart (2004) found that SL and ΔVS in the
pro-glacial zone were the source of 80% of the suspendedsediment flux for the central stream, and 30% for the northstream during the 2000 field season at SRG. They citesediment availability within the pro-glacial channels, SSCand Q of glacial inputs, and contribution from extra-channelsediment sources as key differences between the streams theymonitored.The SRG is a small (~7 km2) cirque glacier with a relatively
steep and small pro-glacial zone (~14% and 2 km2) comparedto that of CCG (~3% and 6 km2), which is an alpine valley gla-cier (~16 km2). Also, the de-glacierized study area at SRG had agreater elevation range (~450m) compared to CCG (~70m).The differences in the characteristics of the glacier and studysite may partially explain the contrasting results. However,inter-annual variability of hydro-meteorological conditionsand antecedent conditions, such as seasonal snowpack, canstrongly influence pro-glacial Q and SSC which would affectthe results of the analyses and thus comparisons between differ-ent sites and years of data (Gurnell et al., 1996; Swift et al.,2002; Richards and Moore, 2003; Cockburn and Lamoureux,2008; Haritashya et al., 2010). For instance, a pilot study atthe CCG in 2008, based on monitoring of Q and SSC at onlythree sites over 34 days, found a 35% increase in the MS–DSreach (Stott et al., 2009); in 2011 the increase in that reachwas 49%. The early study also documented that the reach be-tween the glacier snout site and MS was a net sediment source;although the area immediately in front of the snout in 2008 wasconsiderably different than that in 2011. This helps to illustratethe dynamic nature of the pro-glacial zone over a short period,
Copyright © 2015 John Wiley & Sons, Ltd.
and the need for further monitoring at this and other studyareas.
Conclusions and Perspective
The data collected from the July–September part of the 2011ablation season showed that sub-glacial processes and morainedeposits exposed within the last few years were the dominantcontrol on sediment flux patterns in the pro-glacial zone ofthe CCG. The meteorological conditions that drive Q andsuspended sediment response will temporally vary, and furtherinvestigation would aid in the assessment of inter-annual vari-ability. However, the results of the ‘shape’ and ‘magnitude’analysis of the suspended sediment response pattern under thedefined hydro-meteorological categories can be summarizedfor the sites along the main Castle Creek meltwater channelas: ‘warm and damp’ conditions generated a mixed responsepattern that was influenced by antecedent conditions; ‘hot anddry’ conditions generated a strong diurnal response pattern thatevolved through the season as annual snow cover waned; and,‘cold and wet’ conditions and ‘storm events’ tended to generateirregular data. SSY increased by ~500% of the seasonal meanduring ‘storm’ events, which represented 3% of the data set.As such, the findings support our two hypotheses. The dominantsource(s) of sediment to the pro-glacial channel will evolve asthe glacier retreats (or advances) and new sediment sources be-come active while older sources become exhausted or stabi-lized. However, episodic pulses of high sediment loadstriggered by storm events and high Q are likely to continuethroughout the para-glacial period.
The similarity and contrast of these results with the findingsof other researchers, in addition to an early pilot study at thissite, highlight the importance of seasonal conditions and sitespecific characteristics in determining the suspended sedimentflux patterns. Additional research in targeted pro-glacial areasfollowing this spatially distributed monitoring approach andanalysis technique (Hannah et al., 2000; Orwin and Smart,2004) would help establish glacial input end members forlarger sediment budget and climate change models.
Acknowledgements—MSL and PNO would like to acknowledgefunding via a Forest Renewal BC operating grant, an NSERC Discoverygrant, and a UNBC Seed Grant. BF and TAS wishes to acknowledgefunding from a Liverpool John Moores University (LJMU) Learningand Teaching Award which partly funded this expedition. Cariboo Al-pine Mesonet equipment purchases were supported by the CanadaFoundation for Innovation, the British Columbia Knowledge Develop-ment Fund, and UNBC; additional funding was provided by the Cana-dian Foundation for Climate and Atmospheric Sciences through theWestern Canadian Cryospheric Network, NSERC, and the Canada Re-search Chair programme of the Government of Canada to SJD. Thanksare extended to John Rex, Scott Jackson and James Jacklin (BC Ministryof Forests, Lands and Natural Resource Operations) for the use of ISCO
Earth Surf. Process. Landforms, Vol. 40, 1542–1559 (2015)

1558 M. S. LEGGAT ET AL.
water samplers, Analite turbidity probes and data loggers, to Maud Bar-rel, Sonja Ostertag and Natalie Vogt for assistance with fieldwork, andto Matt Beedle and Leticia Gaspar for assistance with the preparationof some of the diagrams. The authors thank the staff at UNBC’s QuesnelRiver Research Centre (QRRC) for supporting the laboratory work asso-ciated with this study and for essential field equipment loan. This workbenefited from discussions with Jeff Warburton. This contribution repre-sents part of the QRRC publication series.
ReferencesBallantyne CK. 2002. A general model of paraglacial landscape re-sponse. The Holocene 12: 371–376.
Beedle MJ, Menounos B, Luckman BH, Wheate R. 2009. Annual pushmoraines as climate proxy.Geophysical Research Letters 36: L20501.DOI: 10.1029/2009GL039533
Bolch T, Menounos B, Wheate R. 2010. Landsat-based inventory of gla-ciers in western Canada, 1985–2005. Remote Sensing of the Environ-ment 114: 127–137.
Church M, Ryder JM. 1972. Paraglacial sedimentation: a considerationof fluvial processes conditioned by glaciation. Geological Society ofAmerica Bulletin 83(10): 3059–3072.
Church M, Slaymaker O. 1989. Disequilibrium of Holocene sedimentyield in glaciated British Columbia. Nature 337(6206): 452–454.
Cockburn JMH, Lamoureux SF. 2008. Hydroclimatic controls over sea-sonal sediment yield in two adjacent high arctic watersheds. Hydro-logical Processes 22: 2013–2027.
Collins M, Knutti R, Arblaster J, Dufresne J-L, Fichefet T, Friedlingstein P,Gao X, Gutowski WJ, Johns T, Krinner G, Shongwe M, Tebaldi C,Weaver AJ, Wehner M. 2013. Long-term climate change: projections,commitments and irreversibility. In Climate Change 2013: ThePhysical Science Basis. Contribution of Working Group I to the FifthAssessment Report of the Intergovernmental Panel on ClimateChange, Stocker TF, Qin D, Plattner G-K, Tignor M, Allen SK,Boschung J, Nauels A, Xia Y, Bex V, Midgley PM (eds). CambridgeUniversity Press: Cambridge.
Déry SJ, Clifton A, MacLeod S, Beedle MJ. 2010. Blowing snow fluxesin the Cariboo Mountains of British Columbia, Canada. Arctic, Ant-arctic and Alpine Research 42: 188–197.
Déry SJ, Hernández-Henríquez MA, Owens PN, Parkes MW, PetticrewEL. 2012. A century of hydrological variability and trends in the Fra-ser River Basin. Environmental Research Letters 7(2): 024019. DOI:10.1088/1748-9326/7/2/024019
Filliben JJ, Devaney J. 2013. Critical values of the normal PPCCdistribution. NIST/SEMATECH e-Handbook of Statistical Methods.http://www.itl.nist.gov/div898/handbook/eda/section3/eda3676.htm[1 March 2014].
Fraser Basin Council (FBC). 2008. Fraser Basin Council: Vancouver, BC.http://www.fraserbasin.bc.ca [5 December 2011].
Gurnell AM, Clark MJ, Hill CT, Greenhalgh J. 1992. Reliability andrepresentativeness of a suspended sediment concentration monitor-ing programme for a remote alpine proglacial river. In Erosion andSediment Transport Monitoring in River Basins, Bogen J, WallingDE, Day T (eds), IAHS Publication 210. IAHS Press: Wallingford;191–200.
Gurnell AM, Edwards PJ, Petts GE, Ward JV. 1999. A conceptual modelfor an alpine proglacial river channel evolution under changing cli-matic conditions. Catena 38: 223–242.
Gurnell AM, Hannah D, Lawler D. 1996. Suspended sediment yieldfrom glacier basins. In Erosion and Sediment Yield: Global and Re-gional Perspectives, Walling DE, Webb BW (eds), IAHS Publication236. IAHS Press: Wallingford; 97–104.
Hammer KM, Smith ND. 1983. Sediment production and transport in aproglacial stream: Hilda Glacier, Alberta, Canada. Boreas 12:91–106.
Hannah DM, Smith BPG, Gurnell AM, McGregor GR. 2000. An ap-proach to hydrograph classification. Hydrological Processes 14:317–338.
Haritashya UK, Kumar A, Singh P. 2010. Particle size characteristics ofsuspended sediment transported in meltwater from the GangotriGlacier, central Himalaya – an indicator of subglacial sedimentevacuation. Geomorphology 122: 140–152.
Copyright © 2015 John Wiley & Sons, Ltd.
Hodgkins R. 1999. Controls on suspended sediment transfer at a high-Arctic glacier determined from statistical modelling. Earth SurfaceProcesses and Landforms 24: 1–21.
Hodgkins R, Cooper R, Wadham J, Tranter M. 2003. Suspended sedi-ment fluxes in a high-Arctic glacierised catchment: implications forfluvial sediment storage. Sedimentary Geology 162: 105–117.
Hodson A, Gurnell A, Tranter M, Bogen J, Hagen JO, Clark M.1998. Suspended sediment yield and transfer processes in a smallhigh-Arctic glacier basin, Svalbard. Hydrological Processes 12:73–86.
Intergovernmental Panel on Climate Change (IPCC). 2013. ClimateChange 2013: The Physical Science Basis. Contribution of WorkingGroup 1 to the Fifth Assessment Report of the IntergovernmentalPanel on Climate Change, Stocker TF, Qin D, Plattner GK, TignorM, Allen SK, Boschung J, Nauels A, Xia Y, Bex V, Midgley PM (eds).Cambridge University Press: Cambridge; 1535 pp.
Jacobs JL, Dinman JD. 2013. Systematic analysis of bicistronic reporterassay data. Online tutorial. http://dinmanlab.umd.edu/statistics/tuto-rial.html#0 [2 April 2013].
Kirtman B, Power SB, Adedoyin JA, Boer GJ, Bojariu R, Camilloni I,Doblas-Reyes FJ, Fiore AM, Kimoto M, Meehl GA, Prather M, SarrA, Schär C, Sutton R, van Oldenborgh GJ, Vecchi G, Wang HJ.2013. Near-term climate change: projections and predictability. InClimate Change 2013: The Physical Science Basis. Contribution ofWorking Group I to the Fifth Assessment Report of the Intergovern-mental Panel on Climate Change, Stocker TF, Qin D, Plattner G-K,Tignor M, Allen SK, Boschung J, Nauels A, Xia Y, Bex V, MidgleyPM (eds). Cambridge University Press: Cambridge.
Milner AM, Brown LE, Hannah DM. 2009. Hydroecological responseof river systems to shrinking glaciers. Hydrological Processes 23:62–77.
Moore RD, Fleming SW, Menounos B, Wheate R, Fountain A, Stahl K,Holm K, Jakob M. 2009. Glacier change in western North America:influences on hydrology, geomorphic hazards and water quality. Hy-drological Processes 23: 42–61.
Navratil O, Esteves M, Legout C, Gratiot N, Nemery J, Willmore S,Grangeon T. 2011. Global uncertainty analysis of suspended sedi-ment monitoring using turbidimeter in a small mountainous rivercatchment. Journal of Hydrology 398: 246–259.
O’Connor BP. 2000. SPSS and SAS programs for determining thenumber of components using parallel analysis and Velicer’s MAPtest. Behavior Research Methods, Instrumentation, and Computers32: 396–402.
Orwin JF, Smart CC. 2004. Short-term spatial and temporal patterns ofsuspended sediment transfer in pro-glacial channels, Small RiverGlacier, Canada. Hydrological Processes 18: 1521–1542.
Owen LA, Thackray G, Anderson RS, Briner J, Kaufman D, Roe G,Pfeffer W, Yi C. 2009. Integrated research on mountain glaciers:current status, priorities and future prospects. Geomorphology 103:158–171.
Resource Inventory Standards Committee (RISC). 2009. Manual ofBritish Columbia Hydrometric Standards. Prepared by the Ministryof Environment Science and Information Branch. V 1.0. http://www.ilmb.gov.bc.ca/risc [7 June 2011].
Richards G, Moore RD. 2003. Suspended sediment dynamics in a
steep, glacier-fed mountain stream, Place Creek, Canada. Hydrolog-
ical Processes 17: 1733–1753.Schiefer E, Menounos B, Wheate R. 2007. Recent volume loss of BritishColumbian glaciers, Canada. Geophysical Research Letters 34:L16503. DOI: 10.1029/2007GL030780
Schiefer E, Slaymaker O, Klinkenberg B. 2001. Physiographically con-trolled allometry of specific sediment yield in the Canadian Cordil-lera: a lake sediment-based approach. Geografiska Annaler 83(A):55–65.
Stott TA, Mount NJ. 2007. Alpine proglacial suspended sediment dy-namics in warm and cool ablation seasons: implications for globalwarming. Journal of Hydrology 332: 259–270.
Stott TA, Nuttall A, Eden N, Smith K, Maxwell D. 2008. Suspended sed-iment dynamics in the Morteratsch proglacial zone, Bernina Alps,Switzerland. Geografiska Annaler 90A: 299–313.
Stott TA, Owens PN, Forrester, BJ, Lee J. 2009. Suspended sedimentfluxes in the Castle Creek Glacier proglacial zone, Cariboo Moun-tains, British Columbia. Innovations in Practice 3: 49–70.
Earth Surf. Process. Landforms, Vol. 40, 1542–1559 (2015)

1559SUSPENDED SEDIMENT FLUXES IN THE PRO-GLACIAL ZONE
Swift DA, Nienow PW, Spedding N, Hoey TB. 2002. Geomorphic im-plications of subglacial drainage configuration: rates of basal sedi-ment evacuation controlled by seasonal drainage system evolution.Sedimentary Geology 149: 5–19.
Syvitski JPM, Milliman JD. 2007. Geology, geography, and humans bat-tle for dominance over the delivery of fluvial sediment to the coastalocean. The Journal of Geology 115: 1–19.
Tabachnick BG, Fidell LS. 1989.Using multivariate statistics, (2nd edn).Harper and Row: New York.
Tennant C, Menounos B, Wheate R, Clague JJ. 2012. Area change ofglaciers in the Canadian Rocky Mountains, 1919 to 2006. TheCryosphere 6(6): 1541–1552.
Tunnicliffe JF, Church M. 2011. Scale variation of post-glacial sedimentyield in Chilliwack Valley, British Columbia. Earth Surfaces Processesand Landforms 36: 229–243.
Copyright © 2015 John Wiley & Sons, Ltd.
Warburton J. 1990. An alpine proglacial fluvial sediment budget.Geografiska Annaler 72A: 261–272.
Water Survey of Canada (WSC). 2012. Hydrometric manual: datacomputations. Weather and Environmental Monitoring Directorate, is-sued under the authority of the Assistant Deputy Minister, Meteorolog-ical Services of Canada. qSOP-NA037 (Beta Version) 2012-12-17.Water Survey of Canada. http://www.wsc.ec.gc.ca [21 January 2013].
Supporting Information
Additional supporting information may be found in the onlineversion of this article at the publisher’s website.
Earth Surf. Process. Landforms, Vol. 40, 1542–1559 (2015)