Hydraulic fracture design optimization for Nubian ...
100
Scholars' Mine Scholars' Mine Masters Theses Student Theses and Dissertations Fall 2018 Hydraulic fracture design optimization for Nubian sandstone Hydraulic fracture design optimization for Nubian sandstone formation in Libya formation in Libya Housameddin Mohamed Sherif Follow this and additional works at: https://scholarsmine.mst.edu/masters_theses Part of the Petroleum Engineering Commons Department: Department: Recommended Citation Recommended Citation Sherif, Housameddin Mohamed, "Hydraulic fracture design optimization for Nubian sandstone formation in Libya" (2018). Masters Theses. 7835. https://scholarsmine.mst.edu/masters_theses/7835 This thesis is brought to you by Scholars' Mine, a service of the Missouri S&T Library and Learning Resources. This work is protected by U. S. Copyright Law. Unauthorized use including reproduction for redistribution requires the permission of the copyright holder. For more information, please contact [email protected].
Transcript of Hydraulic fracture design optimization for Nubian ...

Scholars' Mine Scholars' Mine
Masters Theses Student Theses and Dissertations
Fall 2018
Hydraulic fracture design optimization for Nubian sandstone Hydraulic fracture design optimization for Nubian sandstone
formation in Libya formation in Libya
Housameddin Mohamed Sherif
Follow this and additional works at: https://scholarsmine.mst.edu/masters_theses
Part of the Petroleum Engineering Commons
Department: Department:
Recommended Citation Recommended Citation Sherif, Housameddin Mohamed, "Hydraulic fracture design optimization for Nubian sandstone formation in Libya" (2018). Masters Theses. 7835. https://scholarsmine.mst.edu/masters_theses/7835
This thesis is brought to you by Scholars' Mine, a service of the Missouri S&T Library and Learning Resources. This work is protected by U. S. Copyright Law. Unauthorized use including reproduction for redistribution requires the permission of the copyright holder. For more information, please contact [email protected].

HYDRAULIC FRACTURE DESIGN OPTIMIZATION FOR NUBIAN SANDSTONE
FORMATION IN LIBYA
by
HOUSAMEDDIN MOHAMED SHERIF
A THESIS
Presented to the Faculty of the Graduate School of the
MISSOURI UNIVERSITY OF SCIENCE AND TECHNOLOGY
In Partial Fulfillment of the Requirements for the Degree
MASTER OF SCIENCE IN PETROLEUM ENGINEERING
2018
Approved by:
Dr. Shari Dunn-Norman, Advisor Prof. Larry K. Britt,
Dr. Abdulmohsin Imqam

Ó 2018
Housameddin Mohamed Sherif
All Rights Reserved
iii
ABSTRACT
There is growing interest in developing unconventional oil and gas reserves in
Libya, such as the tight portions of the Nubian sandstone.
Well-X7 is a development well drilled to a TD of 13,005' penetrating the Upper
Nubain Sandstone (UNSS) at 12,122'-12,207' and the Lower Nubain Sandstone (LNSS) at
12,524'-12,880' KB. Based on open hole logs, the UNSS has 71 ft of net pay and the LNSS
was found to have 295 ft of net pay. Openhole logs also showed low permeabilities of 2.5
and 3 md for the UNSS and LNSS, respectively. The well was initially perforated in both
zones and tested 385 bopd. Hydraulic fracturing is to be applied to this well in the future.
This study evaluated 13 different stimulation treatments for the X-7 well. F300
frac fluid was used with varying proppant type and size, including Ottawa sand, Brady sand
and Carbo Lite ceramic. 20-40 Carbo Lite ceramic was used with four different frac fluids,
including slickwater. Results for all cases compared IP and 24-month cumulative recovery.
Results show that a combination of F300 frac fluid and 20-40 Carbo Lite ceramic proppant
give highest production rates. However, cases evaluated had low FCD suggesting
conductivity should be increased, and treatment size can be reduced in a final treatment
design.
iv
ACKNOWLEDGMENTS
I would like to first thank Allah Sbhano wa talla for helping through my study
journey, and giving me the strength and ability to complete this research.
I would like to express my special gratitude and thanks to my advisor Dr. Shari
Dunn-Norman, for sharing her knowledge, and dedicated time for my research. Thank you
to Dr. Shari again for the opportunity to accomplish my graduate degree at Missouri S&T
and the privilege of her guidance.
I would like to thank my petroleum engineer committee Pr. Larry Britt for his
Valuable suggestions regarding my work Dr. Abdulmohsin Imqam for his assistance in the
department.
I would like to send my thanks and gratitude to Ministry of Education in Libya for
its financial support throughout my academic years.
I am really thankful to Dr. Michael B. Smith, (President of NSI Technologies, a
Premier Oilfield Group Company), Suhaib Ftaita (Frac engineer at Schlumberger), and Ms.
Emily Seals (Technical Editor at Missouri S&T), Eng. Mohamed Zbeda (Reservoir
engineer at NOC) for their invaluable time and explanation to go through this research.
Lastly and most importantly, thank you to my father whom I wish was with us
today, thank you to my mother who always believes in me. Thank you to each member in
my family for his/her support all the time, and my friends who were like family for me here
throughout the study period in Rolla, Missouri. I hope this effort will be beneficial for some
people in the future.
v
TABLE OF CONTENTS
Page
ABSTRACT ....................................................................................................................... iii
ACKNOWLEDGMENTS ................................................................................................. iv
LIST OF ILLUSTRATIONS ........................................................................................... viii
LIST OF TABLES ...............................................................................................................x
SECTIONS
1.INTRODUCTION ...................................................................................................... 2
1.1.SIGNIFICANCE OF THE PROBLEM ............................................................. 2
1.2.OBJECTIVE ....................................................................................................... 5
2.HYDRAULIC FRACTURE BACKGROUND ......................................................... 6
2.1.HYDRAULIC FRACTURING PROCESS ....................................................... 8
2.2.HYDRAULIC FRACTURE TECHNOLOGIES ............................................. 10
2.3.GEOLOGIC STUDY ....................................................................................... 12
Drainage Area. ....................................................................................... 12
2.3.2. Lithology……………………………………………………………….12
2.3.3. Clay Content. .......................................................................................... 13
2.3.4. Fault Patterns. ......................................................................................... 14
2.4.MECHANICAL PROPERTIES ....................................................................... 15
2.5. IN-SITU STRESSES AND STRESS PROFILE ............................................. 17
2.6.HYDRAULIC FRACTURE SOFTWARE ...................................................... 19
3.LITERATURE REVIEW ......................................................................................... 22
vi
3.1. IN-SITU STRESSES ........................................................................................ 22
3.2.TREATMENT aND CHARACTERIZATION DESIGN OF FRACTURING FLUID .............................................................................................................. 25
3.3.PROPPANT SELECTION ............................................................................... 28
3.4.GEOLOGY ....................................................................................................... 32
3.5.SIMULATIONS OF HYDRAULIC FRACTURE .......................................... 35
4.HYDRAULIC FRACTURE OPTIMIZATION DESIGN ....................................... 42
4.1.WELL BACKGROUND AND FIELD HISTORY ......................................... 42
4.2.X-7 WELL CONFIGURATION AND HISTORY .......................................... 44
4.3.LOG ANALYSIS ............................................................................................. 45
X-7 Log Data. ........................................................................................ 47
Identification of Lithology and Layers. ................................................. 50
Pressure and Production Rate Analysis. ................................................ 54
Hydraulic Fracture Design. .................................................................... 56
Linear Gel (F300) Cases 1-9. ................................................................. 60
4.3.5.1.Ottawa sand cases 1-3. ...............................................................60
4.3.5.2.Brady sand cases 4-6. .................................................................61
4.3.5.3.Carbo lite ceramic cases 7-9. .....................................................62
Carbo Lite Ceramic Cases 10-13. .......................................................... 64
4.3.6.1.X-Link#30, case 10. ...................................................................65
4.3.6.2.Gel F160, case 11. ......................................................................65
4.3.6.3.Slickwater, case 12. ....................................................................66
4.3.6.4.Gel F300, case 13. ......................................................................66
vii
5.RESULTS ................................................................................................................. 70
5.1.RESULTS FOR PROPPANT CASES ............................................................. 70
Ottawa Sand Cases 1-3. ......................................................................... 70
F300 Fluid, Brady Sand Cases 4-6. ....................................................... 71
F300 Fluid, Carbo Lite Ceramic Cases 7-9. .......................................... 74
5.2.RESULTS FOR FLUID CASES ...................................................................... 75
Carbo L Ceramic, XL-30#, Case 10. ..................................................... 75
Carbo L Ceramic, F160 Linear Gel, Case 11. ....................................... 76
Carbo L Ceramic, Slickwater, Case 12. ................................................. 77
5.2.4. Carbo L Ceramic, F300 Linear Gel, Case 12. ........................................ 78
6.DISCUSSION ........................................................................................................... 82
7.CONCLUSIONS AND FUTURE WORK ............................................................... 83
BIBLIOGRAPHY ..............................................................................................................85
VITA ..................................................................................................................................89

viii
LIST OF ILLUSTRATIONS
Page
Figure 1.1. Permeability range of producing formations ................................................... 2
Figure 1.2. The location of the onshore basins in Libya ..................................................... 3
Figure 2.1. Hugoton gas field, Kansas ................................................................................ 6
Figure 2.2. Pad stage and slurry stage process. ................................................................... 9
Figure 2.3. Foam technology. ........................................................................................... 11
Figure 2.4. Permeability relationship of clay sandstones ................................................. 13
Figure 2.5. Sonic wave form in borehole. ......................................................................... 15
Figure 2.6. Well log example cross plot ........................................................................... 16
Figure 2.7. Effect of stress field on fracture propagation. ................................................ 17
Figure 2.8. The hydraulic fracture stresses application. ................................................... 18
Figure 3.1. Nubain sandstone Sirte Basin ......................................................................... 33
Figure 3.2. The hydraulic fracture propagation toward the natural fracture. ................... 41
Figure 4.1. Location map of the study area in Sirte Basin, Libya. ................................... 44
Figure 4.2. Well X-7 schematic ........................................................................................ 45
Figure 4.3. X-7 Well log response to 10,700 ft ................................................................ 47
Figure 4.4. X-7 Well log response Middle and Upper Nubain sandstone ........................ 48
Figure 4.5. X-7 Well log response through Lower Nubain sandstone .............................. 49
Figure 4.6. STIMPLAN layering identified based on LAS file ........................................ 51
Figure 4.7. STIMPLAN input for determining log stresses .............................................. 52
Figure 4.8. Fracture height growth in Middle Nubian sandstone ..................................... 54
ix
Figure 4.9. Import of production and injection data to STIMPLAN ................................ 56
Figure 4.10. Production test data for well X-7 .................................................................. 57
Figure 4.11. Reservoir data ............................................................................................... 58
Figure 4.12. Fluid data ...................................................................................................... 58
Figure 4.13. Proppant conductivity of ottawa sand .......................................................... 61
Figure 4.14. Proppants conductivity of brady sand .......................................................... 62
Figure 4.15. Proppant conductivity of carbo lite ceramic ................................................. 64
Figure 4.16. Fluid loss for different kinds of fracture fluid .............................................. 68
Figure 4.17. The net pressure plot for treatment ............................................................... 69
Figure 5.1. Cases 1-3 production rate versus time for 24 months .................................... 71
Figure 5.2. Cases 1-3 cumulative production versus time for 24 months ......................... 72
Figure 5.3. Cases 4-6 production rate versus time for 24 months .................................... 73
Figure 5.4. Cases 4-6 cumulative production versus time for 24 months ......................... 73
Figure 5.5. Cases 7-9 production rate versus time for 24 months .................................... 75
Figure 5.6. Cases 7-9 cumulative production versus time for 24 months ......................... 76
Figure 5.7. 2-D fracture morphology summary plot of the X-link #30 design ................. 77
Figure 5.8. 2-D fracture morphology summary plot of the F160 gel design .................... 78
Figure 5-9. 2-D fracture morphology summary plot of the slickwater ............................. 79
Figure 5-10. 2-D fracture morphology summary plot of the F300 linear gel design ........ 80
Figure 5.11. Cases 10-12 production rate versus time for 24 months .............................. 80
Figure 5.12. Cases 10-12 cumulative production versus time for 24 months ................... 81

x
LIST OF TABLES
Page
Table 1.1. Technically recoverable shale oil. ..................................................................... 5
Table 2.1. Velocity ratio from cross plot .......................................................................... 16
Table 3.1. M-Frac hydraulic fracture inputs ..................................................................... 38
Table 3.2. Flow rate versus fracture length ....................................................................... 38
Table 4.1. Reservoir summary of the well X-7 ................................................................ 50
Table 4.2. Summary of cases evaluation in this study. ..................................................... 59
Table 4.3. Fracture design with different sizes of ottawa sand ......................................... 60
Table 4.4. Hydraulic fracture design with brady sand ...................................................... 61
Table 4.5. Hydraulic fracture design of carbo lite ceramic ............................................... 63
Table 4.6. X-Link#30 fracture design ............................................................................... 65
Table 4.7. Gel F160 hydraulic fracture design ................................................................. 65
Table 4.8. Slickwater hydraulic fracture design ............................................................... 66
Table 4.9. Gel 300F hydraulic fracture design ................................................................. 67
Table 5.1. Presents a summary of the resulting fracture geometry for these cases .......... 70
Table 5.2. Presents a summary of the resulting fracture geometry for these cases .......... 72
Table 5.3. Presents a summary of the resulting fracture geometry for these cases .......... 74
1. INTRODUCTION
There is continuing controversy over the occurrence of worldwide ‘peak oil’, which
is the point in time marking a continuous decline in worldwide oil production. Although
production for the Middle East is not always publically documented, there is speculation
that the oil production from conventional reservoirs in the region has already ‘peaked’.
This understanding is reinforced by Kerr (2011), who indicates that OPEC’s conventional
oil production leveled off in 2011. Such indicators have led to a growing interest in
developing ‘unconventional’ reservoirs worldwide.
The term ‘unconventional reservoir’ has become synonymous with shale play
development in the United States, due to the successful production of oil and gas from
reservoirs with permeability ~0.00001 mD. However, the United States actually began
developing what was considered to be ‘unconventional’ reservoirs in the 1980s, when
industry began experimenting with stimulation treatments in ‘tight’ sands. Tight
formations were considered to be <0.1 mD for gas production and <10 mD for oil
production.
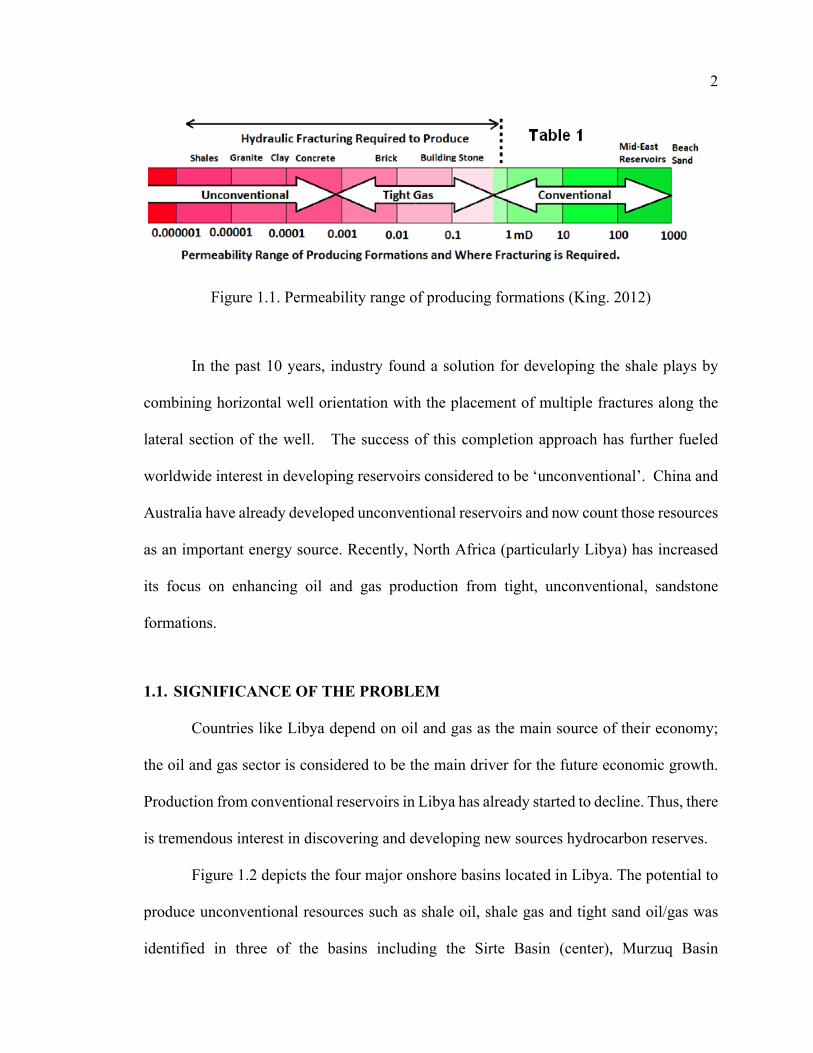
King (2012) provides an illustration of formation permeability along a scale ranging
from shales (0.00001 mD) to conventional reservoirs, shown in the green highlighted areas
of Figure 1.1. Hydraulic fracturing is required to establish commercial production or all
‘tight gas’ to ‘unconventional’ permeability ranges shown in the figure. Hydraulic
fracturing may or may not be used to enhance production or stabilize sand production
tendencies in higher permeability formations.
2
Figure 1.1. Permeability range of producing formations (King. 2012)
In the past 10 years, industry found a solution for developing the shale plays by
combining horizontal well orientation with the placement of multiple fractures along the
lateral section of the well. The success of this completion approach has further fueled
worldwide interest in developing reservoirs considered to be ‘unconventional’. China and
Australia have already developed unconventional reservoirs and now count those resources
as an important energy source. Recently, North Africa (particularly Libya) has increased
its focus on enhancing oil and gas production from tight, unconventional, sandstone
formations.
1.1. SIGNIFICANCE OF THE PROBLEM
Countries like Libya depend on oil and gas as the main source of their economy;
the oil and gas sector is considered to be the main driver for the future economic growth.
Production from conventional reservoirs in Libya has already started to decline. Thus, there
is tremendous interest in discovering and developing new sources hydrocarbon reserves.
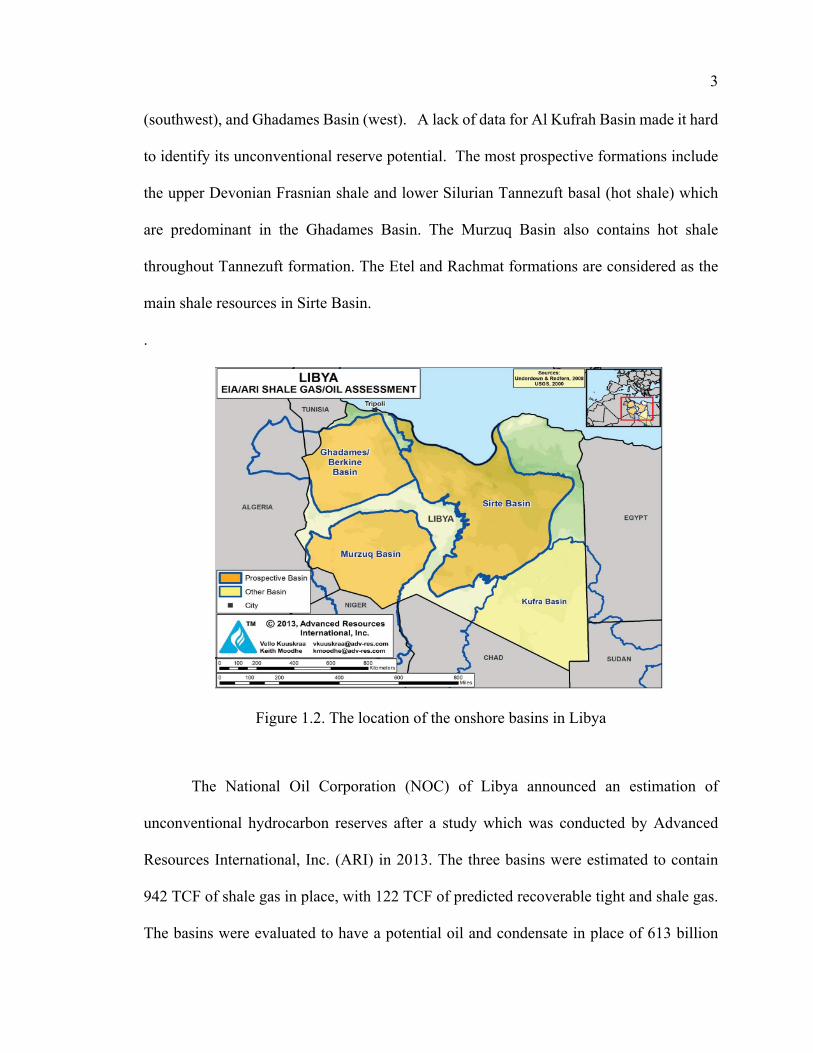
Figure 1.2 depicts the four major onshore basins located in Libya. The potential to
produce unconventional resources such as shale oil, shale gas and tight sand oil/gas was
identified in three of the basins including the Sirte Basin (center), Murzuq Basin
3
(southwest), and Ghadames Basin (west). A lack of data for Al Kufrah Basin made it hard
to identify its unconventional reserve potential. The most prospective formations include
the upper Devonian Frasnian shale and lower Silurian Tannezuft basal (hot shale) which
are predominant in the Ghadames Basin. The Murzuq Basin also contains hot shale
throughout Tannezuft formation. The Etel and Rachmat formations are considered as the
main shale resources in Sirte Basin.
.
Figure 1.2. The location of the onshore basins in Libya
The National Oil Corporation (NOC) of Libya announced an estimation of
unconventional hydrocarbon reserves after a study which was conducted by Advanced
Resources International, Inc. (ARI) in 2013. The three basins were estimated to contain
942 TCF of shale gas in place, with 122 TCF of predicted recoverable tight and shale gas.
The basins were evaluated to have a potential oil and condensate in place of 613 billion
4
barrels, with 26.1 billion barrels of recoverable tight and shale oil. Hence Libya holds great
potential for unconventional resource development in North Africa, which has been
estimated to have total unconventional reserves almost as large as the United States.
However, exploration and development of this resource in Libya, as well as throughout
North Africa, is still very limited. (Melo et al., 2012)
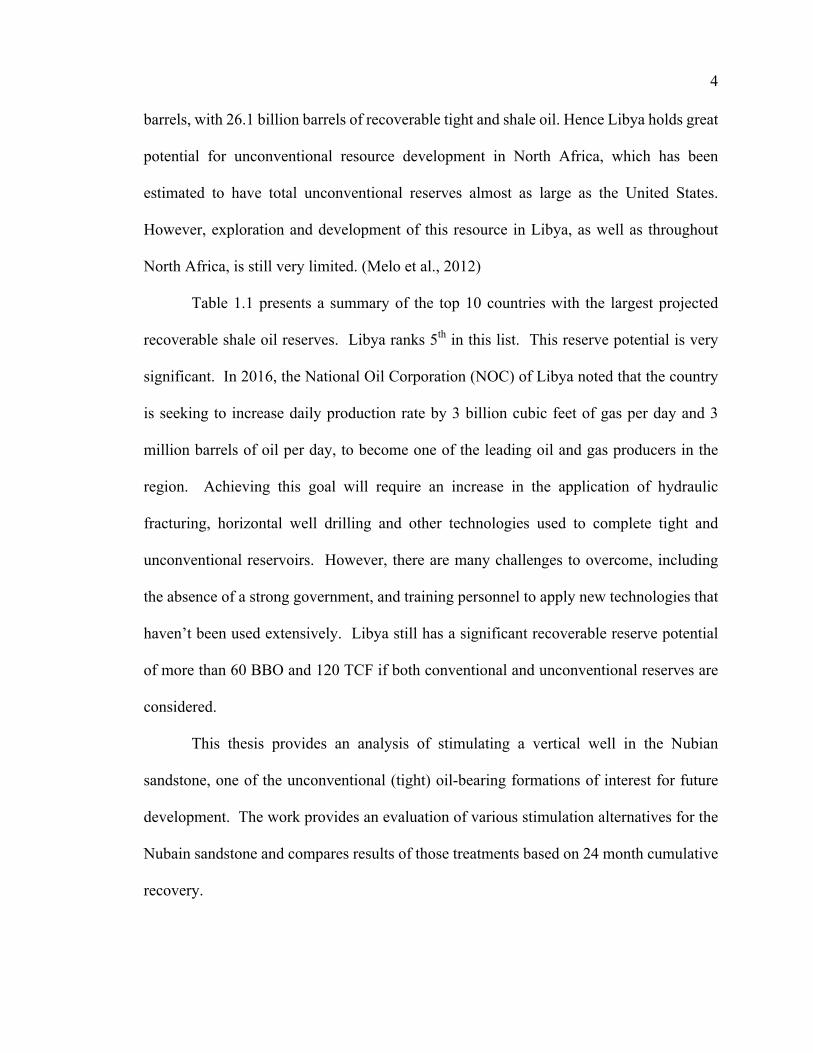
Table 1.1 presents a summary of the top 10 countries with the largest projected
recoverable shale oil reserves. Libya ranks 5th in this list. This reserve potential is very
significant. In 2016, the National Oil Corporation (NOC) of Libya noted that the country
is seeking to increase daily production rate by 3 billion cubic feet of gas per day and 3
million barrels of oil per day, to become one of the leading oil and gas producers in the
region. Achieving this goal will require an increase in the application of hydraulic
fracturing, horizontal well drilling and other technologies used to complete tight and
unconventional reservoirs. However, there are many challenges to overcome, including
the absence of a strong government, and training personnel to apply new technologies that
haven’t been used extensively. Libya still has a significant recoverable reserve potential
of more than 60 BBO and 120 TCF if both conventional and unconventional reserves are
considered.
This thesis provides an analysis of stimulating a vertical well in the Nubian
sandstone, one of the unconventional (tight) oil-bearing formations of interest for future
development. The work provides an evaluation of various stimulation alternatives for the
Nubain sandstone and compares results of those treatments based on 24 month cumulative
recovery.
5
Table 1.1. Technically recoverable shale oil (EIA, 2015)
Rank Country Unconventional oil (billion bbl)
1 Russia 75 2 U.S. 58
3 China 32
4 Argentina 27
5 Libya 26
6 Australia 18
7 Venezuela 13
8 Mexico 13
9 Pakistan 9
10 Canada 9
Total World 345
1.2. OBJECTIVE
The main objective of this work is to use field data acquired from Well-X7, a
development well in North field-X, penetrating the UNSS (Upper Nubian Sandstone) at
12,122'-12,207', NMS (Nubian Middle Sandstone) at 12,207'- 12,524' KB and the LNSS
(Lower Nubian Sandstone) at 12,524'-12,880', to identify an optimum method of
hydraulically fracturing this formation. Open hole logs indicate the upper Nubian and lower
Nubian are productive, whereas the middle Nubian is not. Hence, the objective first
required identifying the overall perforating and stimulation approach, and then evaluating
changes in fracturing fluid, proppant type and size, and other treatment parameters, to
identify the optimum stimulation treatment based on 24-month cumulative production.

6
2. HYDRAULIC FRACTURE BACKGROUND
Hydraulic fracturing has been deployed inthe oil and gas industry since 1947. The
first announced application for the hydraulic fracture process for stimulation was in the
Hugoton gas field in western Kansas, in 1947. The well was completed with four gas-
producing intervals. The approved fluid used for the job was war-surplus napalm which is
considered one of the most hazardous materials. According to the Halliburton reports,
3000 gallons were pumped in each formation. Hydraulic fracturing has become a standard
treatment for stimulation of oil and gas wells. A large number of fields only produce
because of the application of hydraulic fracturing technology. Figure 2.1 shows a picture
from the first hydraulic fracturing treatment conducted in the Hugoton gas field in Kansas.
Figure 2.1. Hugoton gas field, Kansas (Michael J. Economides, T. M.2007)
Mixing Tank
Mixing Pump
High pressure Displ Pump

7
In 1981 more than a million fracture treatments were performed all over the world
mostly in low permeability tight formation gas (TFG) and tight oil reservoirs. In tight gas
and oil formations, for example, reservoir permeability is in the micro-darcy range. In these
low permeability reservoirs hydrocarbons do not flow to the wellbore without a propped
and effective hydraulic fracture. In unconventional shale plays (gas and oil) where the
permeability is in the nano-darcy range none of the hydrocarbons are recoverable without
hydraulic fracturing. Currently, fifty five percent of the oil (6 MBOPD) and fifty three
percent of the gas (50 BCFPD) being produced in the United States are produced from
resources to low of permeability to produce without hydraulic fracturing. The expeditious
development of unconventional sources of hydrocarbons which was donene by hydraulic
fracturing had a positive effect on the oil and gas industry (Gandossi, L., 2013).Hydraulic
fracturing treatments are even done in higher permeability reservoirs where hydrocarbons
can be produce without fracturing. In these reservoirs, the hydraulic fracture can minimize
the effects of wellbore damage, improve the production rate and rate of recovery, and
extend the economic life of the well.
Throughout the world between 1993 and 2005 nearly 40% of oil wells and 70% of
gas wells were completed by hydraulic fracturing. In addition in some parts of North Africa
such as Algeria nearly 20 hydraulic fracturing operations were done in Hessy Masoud field
between 1970 and 1980 and then 150 wells were completed between 1980 and 2005. In
Libya, 9 wells in the Raguba field between 1988 and 1995 with another 134 wells
completed by 2005.

8
2.1. HYDRAULIC FRACTURING PROCESS
Hydraulic fracturing or “fracking” is described as a technique utilized in
unconventional hydrocarbon resources to access previously unaccessable hydrocarbon
reserves. In the mid-1990s and early 2000s, many energy companies’ started integrating
hydraulic fracturing with horizontal drilling to enhance the reserve recovery (Armstrong et
al., 1995). Fracture treatments are carried out at the well site, using heavy equipment
including pump trucks, blenders, proppant tanks, and fluid tanks. A fracture treatment can
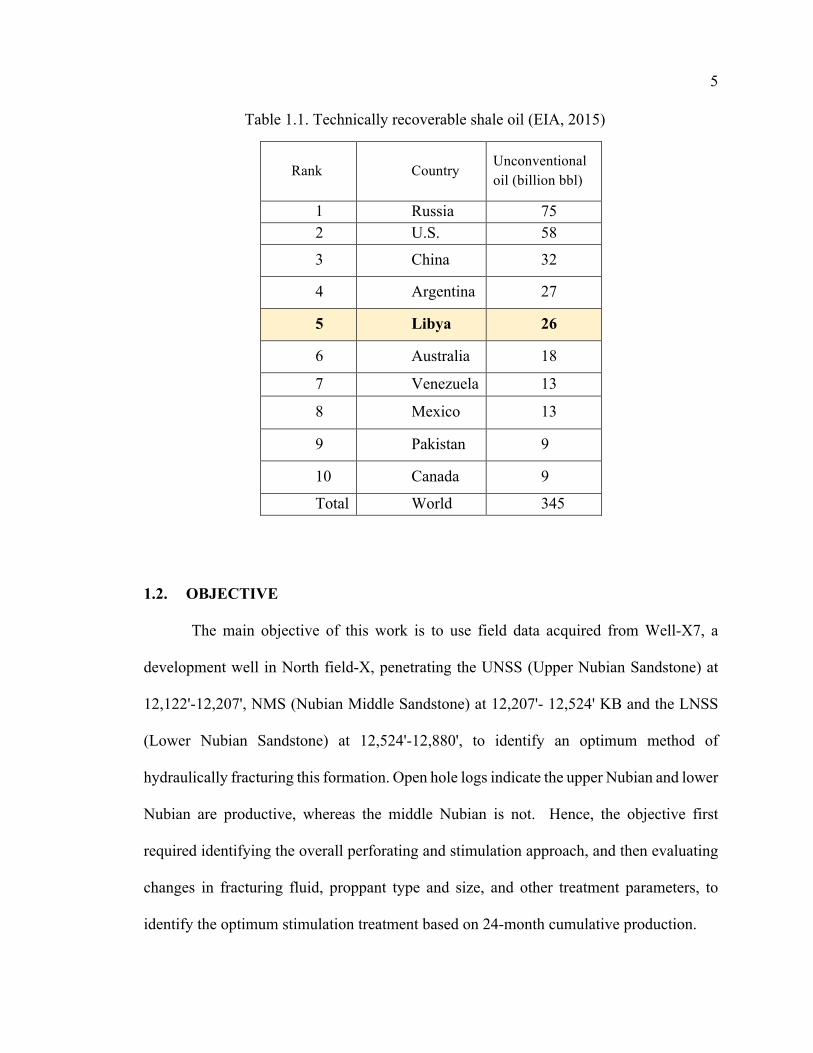
be divided into stages: the pad stage, the slurry stage, and the displacement or flush stage.
In the pad stage a fracturing fluid (water, gel, etc...) is injected to break down the target
formation, create and propagate a fracture, and to act as sacrificial fluid for leak-off during
the rest of the treatment. Following the pad stage the proppant slurry is pumped which
includes. Fracture fluid mixed with proppant (sand, resin coated sand, ceramic...etc.) in
ever increasing concentrations depending on the desired/planned fracture conductivity.
Lastly, as the proppant in the slurry nears the fracture tip and the pad fluid is nearly all
leaked-off the slurry stage is displaced to the perforations to clean the wellbore and make
it suitable for flow-back. As the flush reaches the perforations, to the pumps are shut down
and the fracturing equipment is removed. The main purpose for injecting the proppant
(slurry) is to hold the fracture open so that hydrocarbons can be produced through the
fracture back to the wellbore. Figure 2.2 shows a schematic diagram of the pad and slurry
stages (Boyun Guo, 2017).
9
Figure 2.2. Pad stage and slurry stage process
Sand (proppant) and other chemicals have the potential to create and prop cracks in
the formation and facilitate a pathways for the hydrocarbons (oil and gas) entering the
wellbore (Pye and Pye, 1973). In fact, these cracks which are made by fracturing
operations, can be a valuable technology for enhancing the productivity of oil and gas
wells. Looking to the field of environmental engineering, hydraulic fracturing is an
effective method in increasing the efficiency of the soil in-situ remediation technique. This
method can illustrate the residual stress field that are widely used because its simplicity.
Beside, underground disposal of waste and toxic fluids, stimulation of water wells to
produce water and in mining industries as backup system specially in large scale excavation
of ores. According to the U.S. Department of Energy and Ground water production
Council, 99.5 percent of the fracturing operations used to develop shale formations is fresh
water and sand. The other 0.5 percent are small amounts of chemical additives which are
specially designed from site engineers and generally depends on the formation type and
usually these additives are environmentally friendly (green).
10
2.2. HYDRAULIC FRACTURE TECHNOLOGIES
Many technologies are used today in the oil and gas industry for formation
stimulation, hydraulic fracturing is just one of them. However, low quality fracturing
operations can cause a risk to the environment. For example, a massive fracture treatment
conducted on a shallow formation near the water table can cause methane infiltration in the
aquifer or aquifer contamination. Further, underground disposal of drilling, completion,
and fracturing fluids can cause induced local seismicity and earthquakes. Fortunately, most
hydrocarbon producing formations are at much greater depths than the water table making
communication unlikely and clean-up and reuse of fracturing fluids can limit the induced
seismicity by minimizing the disposal. Additionally, research is being done in many
universities, institutes, and companies focusing on the development of new technologies
which can reduce the impact of well stimulation on the environment.
As an example, some of the research has been done on fracturing fluids over the years. As
previously mentioned one of the early fluids used in fracturing was napalm but it was
deemed unsafe and quit being used. Oil was used as a fracturing fluid but it didn’t make
much economic sense, unless in an artic environment (Canada and Russia), to pump oil to
stimulate the well when that was what you wanted to produce and sell in the first place.
Water, linear gel, and cross-linked fracturing fluids have been the main fluids used by the
industry but there have been variations developed and used over the years like the use of
foam technology. Nitrogen and carbon dioxide foams have been used to fracture stimulate
wells and though it can limit the water usage it quite expensive. Also, pre-fracture handling
of the nitrogen or carbon dioxide and post fracture back production of either gas can result
in some environmental concerns (leaks, excessive gas flaring, and clean-up). As a result,
11
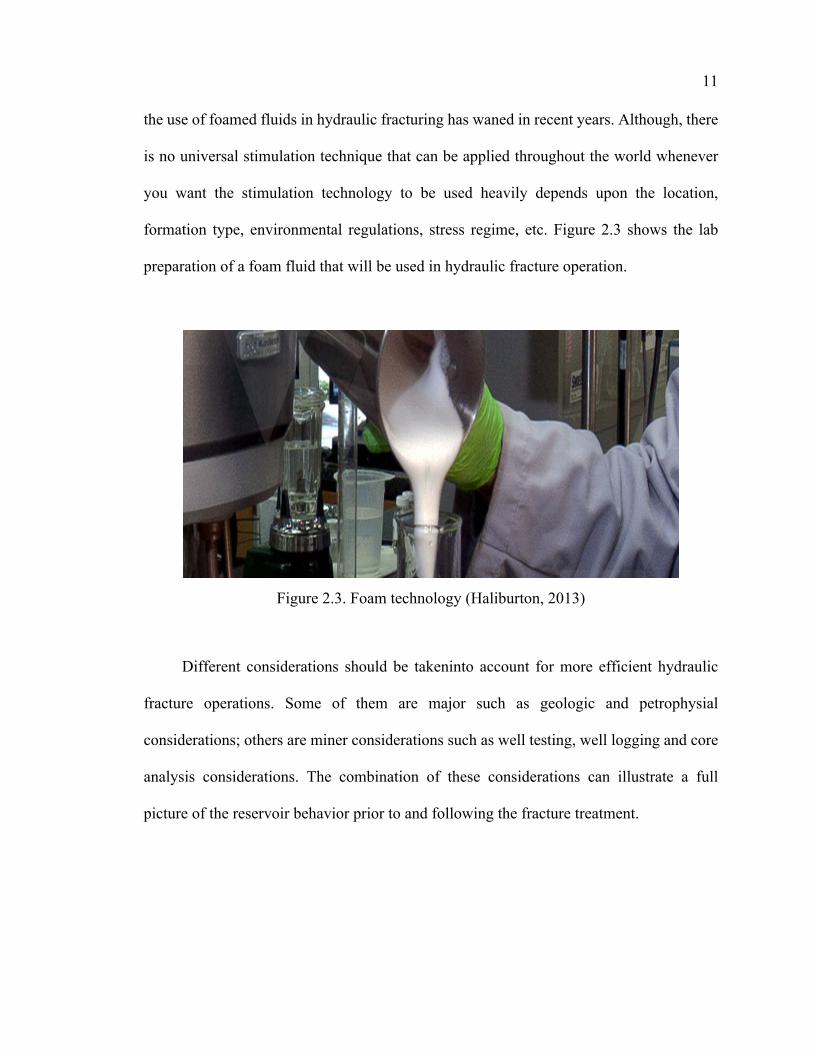
the use of foamed fluids in hydraulic fracturing has waned in recent years. Although, there
is no universal stimulation technique that can be applied throughout the world whenever
you want the stimulation technology to be used heavily depends upon the location,
formation type, environmental regulations, stress regime, etc. Figure 2.3 shows the lab
preparation of a foam fluid that will be used in hydraulic fracture operation.
Figure 2.3. Foam technology (Haliburton, 2013)
Different considerations should be takeninto account for more efficient hydraulic
fracture operations. Some of them are major such as geologic and petrophysial
considerations; others are miner considerations such as well testing, well logging and core
analysis considerations. The combination of these considerations can illustrate a full
picture of the reservoir behavior prior to and following the fracture treatment.
12
2.3. GEOLOGIC STUDY
Several parameters should be considered while doing the geologic study such as:
Drainage Area. Represents the area from which hydrocarbons are
recovered such that the size and shape.
Which is a function of geology (formation thickness, pinchouts, faults, channels,
permeability, etc.) and the fracture dimensions (the fracture length, height, and
conductivity). For example, in a low permeability reservoir with a long and highly
conductive fracture the shape of the drainage area will be “cigar shaped” even if the
geologic considerations are benign. In permeable reservoirs, however, the size and
conductivity of the propped fracture has little to do with the size and shape of the drainage
area.In other words the drainage area represents the ration of the fracture length (LF) to the
drainage radius (re), these have to be optimized to optimize the hydraulic fracture
treatment. It is possible to determine optimum fracture length and drainage radius by
constructing a relationship between flow rate and time as function of fracture length and
drainage radius. In contrast, lenticular reservoir drainage radius is a fixed parameter and
not a function of the fracture treatment. Most engineers can optimize the propped fracture
length by optimizing (LF/re) ratio. Understanding the geologic deposition pattern is
important before designing a specific fracture treatment to get the probable size of the
reservoir for design and stimulation treatment.
2.3.2. Lithology. It is important to study the reservoir lithology before designing a
fracture treatment. For example, in sandstone reservoirs, a water or oil based fracturing
fluid will probably be selected. In shallow carbonate reservoirs, acid based fluid is probably
can be applied. The lithology of a reservoir is an important factor for analysis of open-hole
13
geophysical logs as well. Furthermore, lithology can be important depending upon certain
geologic environment. For instance, cementing material might be crucial importance in
cases where cement is holding together a fairly soft rock, acid should not be used then to
break down the perforations or stimulate the reservoir.
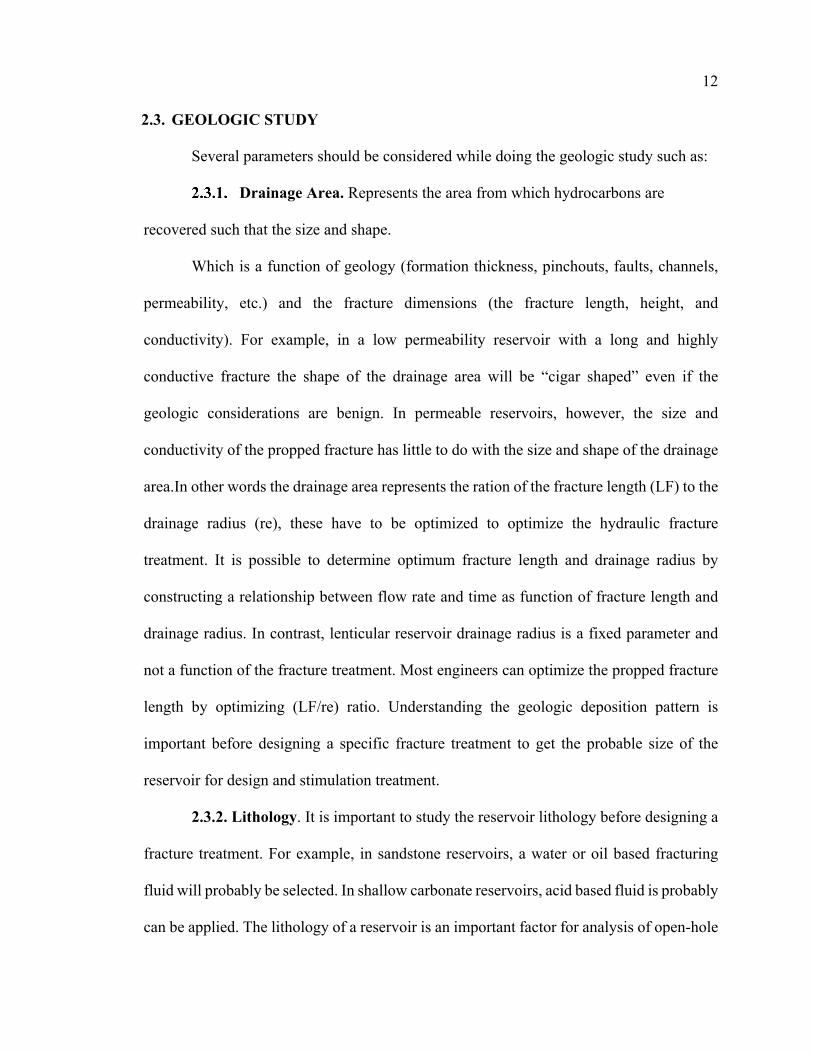
2.3.3. Clay Content. Knowing the type and distribution of the materials that fills
the pores is very important. Many low permeability reservoirs contain a large quantity of
clay minerals in the rock fabric and pore space.
Scanning electron microscope (SEM’s) and X-ray diffraction analysis can be useful
to understand the type of clay and its distribution in a particular formation.Different types
of clayscan affect and reduce the permeability of a sandstone reservoir. It is a fact that
different types of clay can affect the permeability of a sandstone formation as shown in
Figure 2.4.
Figure 2.4. Permeability relationship of clay sandstones (John Gidley, 1990)

14
2.3.4. Fault Patterns. Any geological study must consider the knowledge of
regional and local stress pattern in the study area. In-situ stresses are very important in the
design of a hydraulic fracture treatment. Hubbert and Willis explained that localized and
regional stress pattern in an area are controlling factors in determining to orientation of the
hydraulic fracture and that state of stress underground is not hydrostatic but depends on
tectonic conditions. (Willis, 1957).We also should consider other aspects to get better
results, such as well logging, mechanical properties, and stress profile.
Well logging is used to obtain geomechanical logs of a particular formation by
using well logs. A conventional log analysis usually provides values of porosity, water
saturation and net thickness of the pay zone formation. These results from well logging
plus PVT properties which has obtained from the laboratory measurement of the reservoir
fluid, can be used to estimate oil and gas in place by the volumetric method as shown
below.
Where:
𝐴 = The drainage area of the reservoir, (acer)
ℎ = net pay thickness, (ft)
∅ = reservoir porosity, (friction)
𝑆%& = reservoir water saturation, (friction)
𝛽(& = oil formation volume factor, (bbl/stb)
𝐴 = 𝜋𝑟, (2.1)
𝑂𝑂𝐼𝑃 =
𝐴×ℎ×∅× 1 − 𝑠𝑤𝑖𝛽(&
(2.2)
15
Recognize, that a small error in porosity or water saturation can led to a difference
in the estimation of reserves. So, it’s important to get good quality logs and analysis results
to avoid any issues determining resource size estimation.
2.4. MECHANICAL PROPERTIES
Knowledge of a hydrocarbon producing formation and its surrounding formations
is very important to predict the hydraulic fracture dimensions. These mechanical properties
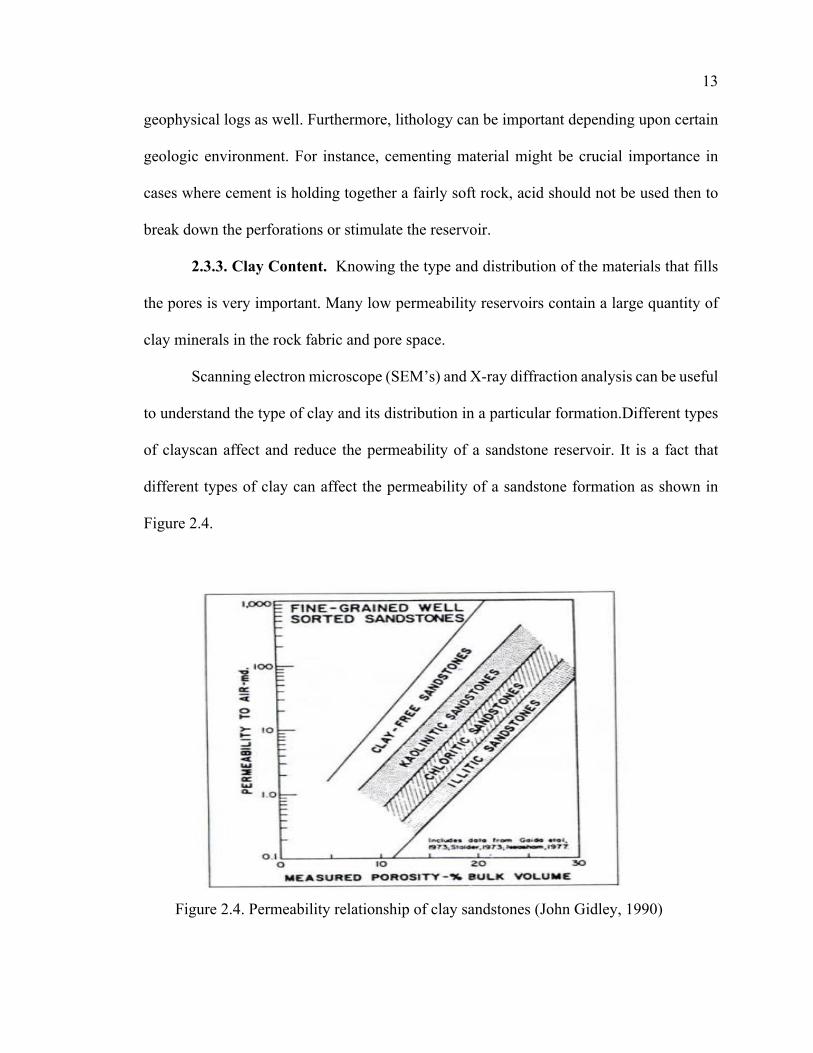
include Young’s modulus, shear modulus, Poisson’s ratio, and compressibility. The best
value of compressional wave velocity and shear wave velocity are obtained by recording a
full wave form sonic signal from a long spaced dipole sonic log or sonic scanner as shown
in the Figure 2.5.
Figure 2.5. Sonic wave form in borehole ( John L. Gidley, 1990)
The determination of mechanical properties requires obtaining both compressional
and shear wave travel times for the formations. It was first recommended by Pickett that
the ratio of shear wave travel time and compressional wave travel time was a function of
lithology. With that being said, the relation between compressional wave and shear wave
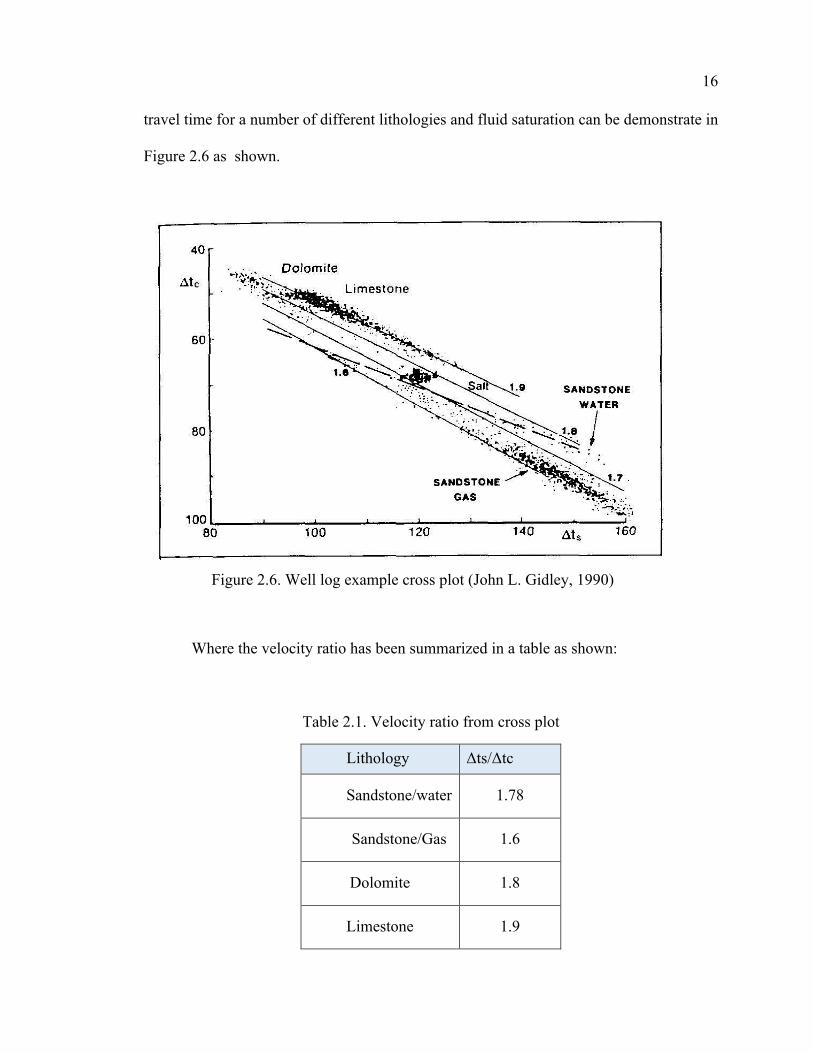
16
travel time for a number of different lithologies and fluid saturation can be demonstrate in
Figure 2.6 as shown.
Figure 2.6. Well log example cross plot (John L. Gidley, 1990)
Where the velocity ratio has been summarized in a table as shown:
Table 2.1. Velocity ratio from cross plot
Lithology Δts/Δtc
Sandstone/water 1.78
Sandstone/Gas 1.6
Dolomite 1.8
Limestone 1.9

17
Fromthe above relationship we can determine the amount of dolomite, limestone,
shale and probable fluid content then an estimation of shear wave travel time. Once velocity
ratio is estimated then the value of Poisson’s ratio and Young’s modulus can be calculated.
2.5. IN-SITU STRESSES AND STRESS PROFILE
In-situ stresses and the stress profile is decisive in designing a fracture treatment that
is confined within the productive interval. Figure 2.7 shows the effect of the stress field on
fracture propagation. The in-situ stresses control fracture azimuth and orientation (Vertical
and horizontal), fracture height growth, fracture width, treatment pressure and fracture
conductivity. Fractures grow perpendicular to the minimum in-situ stress direction, thus,
stress direction can affect well-placement and spacing decisions (Willis, 1957).
Figure 2.7. Effect of stress field on fracture propagation (John L. Gidley, 1990)
There are many techniques available today for estimating stress orientation,
including tiltmeters, microseismic surveys, fracture image logs, and core-based
measurements. Fracture height growth and fracture width affect the propped fracture half-
18
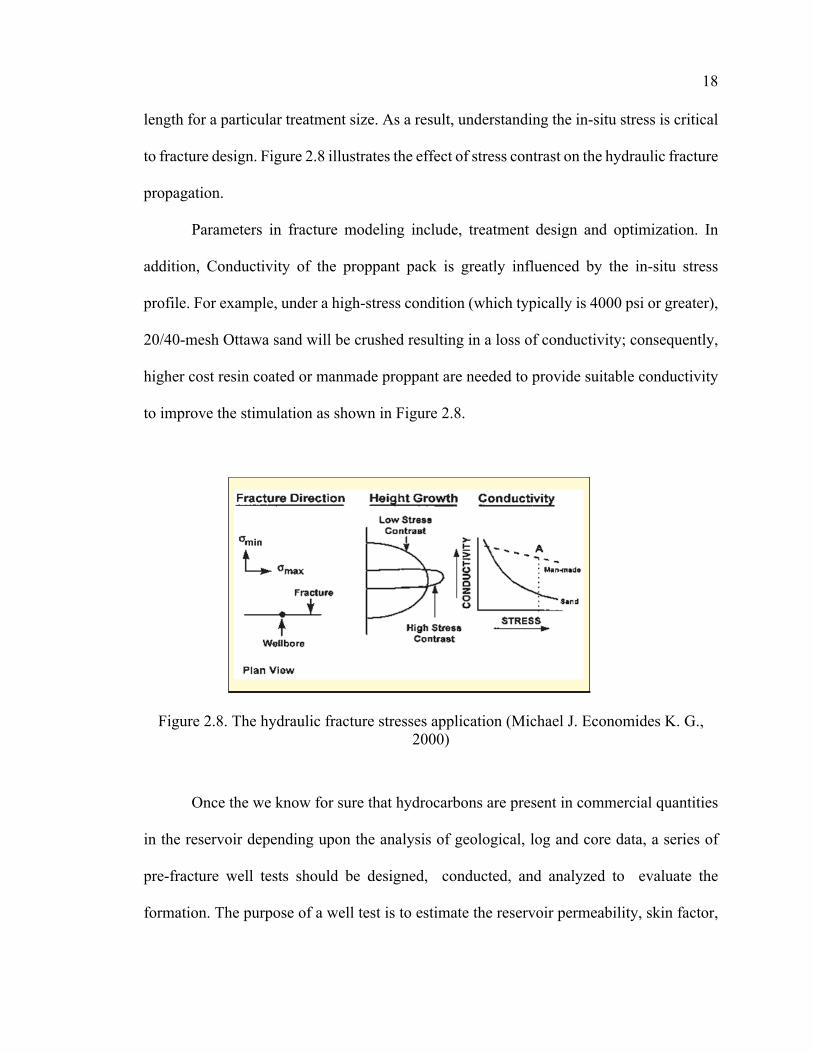
length for a particular treatment size. As a result, understanding the in-situ stress is critical
to fracture design. Figure 2.8 illustrates the effect of stress contrast on the hydraulic fracture
propagation.
Parameters in fracture modeling include, treatment design and optimization. In
addition, Conductivity of the proppant pack is greatly influenced by the in-situ stress
profile. For example, under a high-stress condition (which typically is 4000 psi or greater),
20/40-mesh Ottawa sand will be crushed resulting in a loss of conductivity; consequently,
higher cost resin coated or manmade proppant are needed to provide suitable conductivity
to improve the stimulation as shown in Figure 2.8.
Figure 2.8. The hydraulic fracture stresses application (Michael J. Economides K. G., 2000)
Once the we know for sure that hydrocarbons are present in commercial quantities
in the reservoir depending upon the analysis of geological, log and core data, a series of
pre-fracture well tests should be designed, conducted, and analyzed to evaluate the
formation. The purpose of a well test is to estimate the reservoir permeability, skin factor,
19
and initial reservoir pressure along with geomechanical properties such as in-situ stress and
the fluid loss coefficient. The skin factor is a quantitative measure of the formation damage.
If we have damage then the value of skin is positive but if the formation is stimulated the
skin value will be negative. It isn’t easy to analyses post fracture well tests, optimize
fracture length and to design the optimum proppant for fracture treatment if the value of
in-situ permeability is not known are determined from pre-fracture well tests.
2.6. HYDRAULIC FRACTURE SOFTWARE
There are principally five commercial software packages that are available in the
oil and gas industry, which utilize a 3-D (three dimensional) model of the hydraulic fracture
treatment. These software systems include FracPRO, FracCADE, MFRAC, GOPHER, and
STIMPLAN. While the first three of these models are pseudo-3D models GOPHER and
STIMPLAN are truly fully 3D models. GOPHER is a three dimensional finite difference
model while STIMPLAN is a fully three dimensional finite element model. Due to a lack
of software availability a complete comparison of these software systems is beyond this
study. However, the study will focus constructing a fracture model to determine the
optimum fracture design. (Carter J. et al, 2000). STIMPLAN was used for this purpose.
STIMPLAN (NSI Technologies, Inc.) is a software package that contains both
pseudo 3-D and true fully 3-D finite element numerical model. STIMPLAN finds implicit
finite difference solutions to basic equations of mass balance, fluid flow, height growth,
and elasticity. The software provides modeling capability for complex hydraulic fracture
situations; for instance, fracture height growth, foam fluids, tip screen-out, and proppant
settling.
20
STIMPLAN has the ability to allow the user to import log data, which helps in
developing a geomechanical description of the reservoir. Based on an input pumping
schedule, the software provides a predicted fracture height, width, and length, based on
fracture fluid, pump rate and proppant concentrations. The model can run in real time to
track the treatment as it is performed in the field. STIMPLAN also can provide a prediction
or history match of the production data from a fractured well (using a single phase
numerical simulator), and use an economic routine for determining the net present value of
the particular treatments production profile. The software also generates hydraulic fracture
optimization, design, and stimulation post appraisal reports for the user.
Hydrocarbon production from low permeability formations has been appealing in
the last 20 years across the globe as part of the economic developments more precisely in
the Middle-East. With that being said, such reservoir formations require a special technique
for stimulating this kind of rock. The most commonly used technique to recover
hydrocarbons from these resources economically is hydraulic fracturing. Hydraulic
fracturing is considered one of the most valuable stimulation techniques for enhancing the
rate of recovery of hydrocarbons (oil & gas).
Hydraulic fracturing can also extendhydrocarbon production from older fields. It is
the best technique so far that challenges geologists who believed that it is impossible to
produce oil and gas from a formation such as shale gas, coalbed methane, and/or tight sand.
Hydraulic fracturing also has long term economic effectiveness that is too obvious to
ignore. The laboratory testing and mathematical simulation of fracture geometry work
effectively to mitigate any risk that might appear during the operation (Economidos et al.,
2010).

21
Many factors have led to rapid growth of the use of hydraulic fracture technology for
most of the unconventional formations. One of the most positive impacts is combining of
horizontal drilling with hydraulic fracturing to extract the natural resources economically
with faster return. At the starting of the rapid development of the industry, gas prices were
significantly increased causing this profitable industry to associate. The industry has
moreover been exempted totally or mostly from the Safe Drinking Water Act, Clean Water
Act, Clean Air Act, Comprehensive Environment Response Compensation and Liability
Act, Emergency Planning and Community Right to Know Act, Endangered Species Act
and the Resource Conservation and Recovery Act. These exemptions mean that gas
producers’ openings contribute intensely in hydraulic fracturing with few regulations
(Biello, 2010; Trotta, 2011. U.S. EIA 2012).
The expanding amount of the hydraulic fracture operations all over the world can
give us a great indication of how helpful and useful such a technique is to perform more
on tight sand formation, especially in the Middle East and North Africa. This research tries
to approach with realistic fracture design at in-situ condition, fluid and proppant selection,
pump rate, and pad size. The theory behind this concept has been illustrated and supported
with case studies where it took place from oil and gas field in Libya with tight sandstone
formation.
22
3. LITERATURE REVIEW
This literature review covers studies related to previous work conducted in tight
sand formations and previous work of interest to hydraulic fracture design. This literature
review helps provide an understanding of hydraulic fracture optimization design process.
3.1. IN-SITU STRESSES
In the past ten years, the growth of producing hydrocarbon from unconventional
resources such as shale and tight sandstone formations has attracted the attention of
companies across the globe. The optimum fracture treatment depends on dimensions of the
hydraulic fracture; therefore, any change in the in-situ stresses will greatly impact on the
fracture dimensions. Microseismic devices provide field engineers with ideas about
fracture dimensions. In the field, focusing on programs including downhole arrays or
surface sensors is mainly used for calibration.
Chitrala et al. (2011) performed a laboratory experiment to study different applied
stresses for tight sandstone formations. In their experiment, proper fracture azimuth was
determined with arrays. Furthermore, they duplicated the principle stresses, which are the
main controller of the hydraulic fracture orientation, by applying horizontal stress. Their
theory is that it is possible to understand the orientation and dimension of the fracture by
only applying a different magnitude of horizontal stress. They used sixteen transducers
with a frequency range from 50 KHz to 1.5 MHz to translate the seismic waveforms. The
sample used in this experiment has been taken from the Lyons sandstone, Oklahoma. The
determination of azimuth velocity was performed via circumferential velocity analysis
23
(CVA). The CVA is a pulse transmission technique where the velocity is a function of
azimuth. The experimental results showed a very thin symmetric fracture when high
external stress values reaching 4000 psi were applied and shear failure was shown to be
responsible for most of the failure mechanisms in the experiment.
Hagemann and Ganzer (2012) conducted a study about the reorientation of the
hydraulic fracture in tight sandstone formations. Their research claimed that hydraulic
fracture orientation mainly depends on the stress state of the target formation. Hagemann
and Ganzer built their model to investigate the poroelastic effect, which is a theory created
by Biot in 1935. The concept of poroelasticity is when porous media allows fluid in solid
rock to move freely in the pores and rock framework. These two will interact in one system
and can help increase the pore pressure in case the fluid is still inside the rock. By
generating a model, this investigation showed the physics of the interface’s poroelasticity.
Hagemann and Ganzer also provided input to this study that included an isothermal
formation, constant wellbore flowing pressure, no flow boundary, single-phase Darcy’s
law flow behavior, and uniform initial stress state. The model was performed in two
dimensions, emulating a reservoir with infinite thickness. These dimensions were 1600 m
in x-direction and 1200 m in y-direction. The reservoir was saturated 100% with gas, and
the temperature was constant at 110 °F. The conclusion of their study showed that if there
is a small difference between the minimum and maximum horizontal stress, then the
reservoir characteristics will be influenced and the propagation and the direction of the
fracture will have a significant height growth.
Ohati and Mikada (2017) examined the differential stresses and anisotropy of
different kinds of formations. They claimed that it is common knowledge that hydraulic
24
fractures propagate in the direction of maximum stress. However, some types of rocks have
strength anisotropy that can form a failure plane over the weak plane. In their experiment,
they used a numerical model called DEM (discrete element method) to show the brittle
condition of rock. At the beginning, they performed a calibration process to avoid any error
when measuring the anisotropic properties via DEM. Following the calibration, the
propagating direction of the hydraulic fracture was illustrated based on both the anisotropic
properties and differential stress magnitude. The results showed that when the anisotropy
is in medium range, the propagation of the hydraulic fracture will be in the direction of
maximum principal stress. In contrast, the strong anisotropy will show a failure along a
weak plane and the fracture will propagate in the direction of the minimum horizontal
stress.
Baig and Urbancic (2015) made an evaluation regarding stress and strain during the
fracture operation. The evaluation was based on multiple well records of microseismic
reading in order to observe the strain and stress in the reservoir. Geomechanical models
were also used in the evaluation to assign the dynamic stress regime, which controls the
propagation of the hydraulic fracture. The authors started by examining the mechanism
that activates several fracture sets in the reservoir, which can create a damage zone. They
then analyzed and measured the clustering methodology around the wellbore. The
evaluation showed how directly the dynamic strain is important during the treatment
because it affects deformation. This information is especially important in calibrations of
the geomechanical models because it shows that propagation and fracture geometry are
controlled by stress and strain.
25
3.2. TREATMENT AND CHARACTERIZATION DESIGN OF FRACTURING FLUID
The selection of hydraulic fracture fluid is very important for better proppant
transport in the fracture. Many companies these days have put a lot of effort into developing
different kinds of hydraulic fracture fluid that are cheaper and not harmful to the
environment. Fracture fluid relies on reservoir properties such as reservoir fluid properties,
bottomhole static temperature, rock mechanical properties, and formation permeability.
The development of hydraulic fracture fluid over the years has encouraged many operation
companies to use fluids that are more viscous in order to carry higher concentrations of
proppant to create conductive fractures in higher permeability formations. In the early
1960s, the main fracture fluid was water, which carried a low proppant concentration. This
was called slickwater fracture treatment. By the 1970s, viscous fluids such as cross-linked
polymer fluids had been introduced to the industry,. The new fluids had the ability to carry
more proppant than water (Sharma et al., 2004). In recent years, as the fracturing activity
in the low permeability unconventional shale market has dramatically increased the need
for higher proppant concentrations has been reduced and slickwater fracturing has had a
resurgence.
Holditch and Ely (1973) performed a comparison between wells stimulated with
high viscous fluid and high proppant concentrations and wells with low viscosity fluid and
low proppant concentrations. The study was applied to compare the long-term productivity
of gas wells and the fluid carrying the proppant with different concentrations in a sandstone
formation in South Texas. The average depth for the wells was 11,000 ft, and the average
bottomhole temperature was 275 °F. All the wells had low permeability and porosity. The
authors noticed that the change in the productivity index before and after the treatment in

26
high viscous fluid carrying a higher proppant concentration was 5.2, while the productivity
index for the low viscous fluid carrying a low proppant concentration was 10. However,
most wells stimulated with high viscous fluid sustained higher productivity over time than
the wells stimulated with lower viscous fluid. The study was performed again for the same
wells after two years, where the average productivity index for high viscous fluid wells
was three times higher than the wells with low viscosity fluid. The conclusion of their study
was that the reservoir temperature enhanced the gel fluid, which allowed it to break and
clean-up the fracture fluid in the fracture. In summary, when the temperature of the
formation is high and there is low permeability covering the whole formation, it is better
to pump higher proppant concentration and use a highly viscous fluid in order to increase
the productivity index of the well.
Wenjun (2010) conducted a laboratory study of a new type of fracturing fluid that
is suitable for a low-pressure and low temperature formation. The study was performed for
eight wells in Daqing oil field in China. Dealing with a shallow reservoir with low
temperature made Wenjun choose organic titanium and organic zirconium as cross-linked
base fluids in the hydraulic fracture application for all the wells. The fluids had strong
intermolecular bonding force that is recommended in low temperature formation, and it is
easy to flow back. According to the laboratory study, the cross-linked fluid was broken and
the viscosity of the fracture fluid remained almost constant after four hours from first
pumping. The ratio of flow-back fluid improved by 35% more than any other fluid
before.ohnson and Wright (1993) performed on-site analysis of hydraulic fracture fluid
injection by using a foam technology. They tried to study the responses of the reservoir
toward foam that would be used as carrying fluid for the proppant. Around 75 gal of foam

27
was pumped into the well. Fortunately, the leakoff was below 2%, and net pressure showed
no reaction of stresses that might resist the fracture growth. However, initial pressure
rapidly declined, and closure pressure occurred after 20 minutes, which reduced the
convection. By the end of pumping the foam, the researchers concluded that installing the
foam technology in the sandstone formation made it very difficult to gain the fracture pack
due to the high value of fluid efficiency and lower proppant concentration that would be
pumped with such technology.
Smith (1965) conducted a study to determine the most stable treatment fluid that
should be used in hydraulic fracture applications. Smith explained in his paper that
hydraulic fracture treatments depend on factors such as orientation of induced fracture
because it dictates that the suitable procedure should be employed in designing the fracture
fluid. He classified the fracture fluid to two categories: The first is Newtonian fluids, which
are defined as fluids with constant viscosities, such as crude oil, fresh water, salt water, and
some acids. The second is non-Newtonian fluids, which are defined as the fluids with
viscosities that are not constant, normally a Newtonian fluid converted to a non-Newtonian
fluid when additives are introduced to the fluid, such as gelling agents, emulsifiers, friction
reducers, water-based gel, and hydrocarbon gel. In the study, he applied a vertical fracture
treatment design in laboratory to detect the best fluid that can be used in the fracture
application. After he tried thirteen types of fluids, he concluded that gel has the ability to
adopt a higher proppant concentration than any other fluid he used in the experiment (i.e.,
a large amount of viscous gel can create a vertical fracture very easily).
Friehauf and Sharma (2005) performed an evaluation study for different designs to
add more energy to the fracture fluid. Enhancing or energizing the fracture fluid creates a

28
high gas saturation around the wellbore, more precisely, in the invaded zone, which makes
the gas more functional for flow back. One third of the fracture operations in North
America perform by energized gaseous phase. Most of the energized fluid is used in
reservoirs with very low pore pressure, low permeability, and water-sensitive formation
(Gabris, 1986; Mazza, 2001). Friehauf and Sharma presented a sensitivity analysis study
to address the effective parameter that can be modified for optimum fracture design without
any field trails. Their model showed that gases with high solubility perform better than
gases that are not soluble. For example, co2 has higher solubility range than n2, so they
eliminated n2 from the study and focused more on co2, where they started with adding
methanol in liquid phase in order to increase the solubility of CO2 which will reduce
swelling of the clay in the formation.
They concluded that before energizing the fracture fluid, the phase behavior must
first be used to control leakoff of the fluid. If the drawdown pressure is more than capillary
pressure, we can remove the damage in the fracture face generated by loss of water-based
fracturing fluid. The energized technique is most likely applied to formations in case the
drawdown pressure is not enough to remove the liquid. High solubility will promote the
fluid’s ability to avoid any damage near the wellbore.
3.3. PROPPANT SELECTION
The first hydraulic fracture treatment was performed without proppant in 1946, but
the fracture did not remain open for long. In 1947, sand from the Arkansas River was
introduced to the industry and used to prop the first fracture. The development of the
proppedt fracture expanded in the early 1960s with the use of resin-coated sands and
29
bauxite, which can keep the fracture open for long time. The main role of the proppant is
to keep the hydraulic fracture open in order to preserve the well conductivity, which can
make the well operate in an economical way. Nowadays, choosing the proper proppant for
the specific hydraulic fracture application has become very important for cost-effective
reservoir conditions and long term well stability.
Leshchyshyn (2003) performed a field study about the effect of proppant selection
on well productivity for a sandstone formation in Alberta, Canada. He used nine fractured
wells with ceramic proppant and compared with three wells fractured with sand proppant.
Leshchyshyn additionally examined the hydraulic fracture productivity. The wells in this
study were stimulated with 185 tons of proppant for each well from one to five stages.
After the first year, the production of fracture sand wells was 302 MMscf of gas, while the
production of the fracture ceramic wells was 402 MMscf. He noticed that the returned cost
of ceramic proppant was recovered after 31 days, which is considered a profitable increase.
He recommended using ceramic proppant, which is rounder and more spherical with afiner
size distribution to improve the fracture conductivity over sand. The higher the fracture
conductivity is, the higher the production rate is during transient flow.
Rixe et al. (1963) presented a procedure to estimate the embedment pressure of the
target formation, which can give a great indication of the rock resistance to embedment
throughout a proppant agent life. Rixe and his colleagues performed an experiment to
obtain the hydraulic fracture capacity in order to select the best propping agent. They built
correlations based on the long-term and short-term hydraulic fracture capacity just to
eliminate the nonfunctional proppant agent. The types of samples used in the experiment
were taken from formations in different zones starting with carbonate from Louisiana, sand
30
from Oklahoma, sand from Canada, lime from Texas, and sand from Wyoming. To
estimate the embedment pressure of the formation, they used a steel ball with 0.05 in.
diameter located on the top part of the platen of the hydraulic compression machine. The
samples were placed on the lower part of the platen of the machine. The purpose of the
steel ball was to embed to a certain depth; for instance, the ball in the experiment was
embedded to a depth of 0.00625 in. The load required to reach this depth was recorded.
The results showed that the diameter of pore space increased as the embedment pressure
decreased. The form of pore space was normally made by the mechanical properties of the
formation. The formation embedment-pressure test can measure the resistance of the rock
inside the formation to embedment by using proppant agent. The correlation of Rixe can
be used to aid in the selection of the proppant_agent for the desirable hydraulic fracture
capacity.
Anderson and Seccombe (1982) applied a study to evaluate the performance of
bauxite as a proppant agent in hydraulic fracture application for a tight sandstone formation
in Wyoming. Generally, bauxite proppant is used when the fracture pressure or closure
pressure is above 8000 psi. When the pressure exceeds 8000 psi, sand tolerates
considerable crushing, generating a large reduction in permeability. On the other hand, the
areas where the closure pressure ranges between 6000 to 8000 psi, it is difficult to assume
which kind of proppant to use: either sand or bauxite, depending on the reservoir condition.
In addition, an economical model and simulation study were used for the optimization of
the proppant fracture and fracture length. These two models can help to ensure that bauxite
is the best choice for this reservoir in Wyoming. At the end of the evaluation, Anderson
and Seccombe recommended that bauxite should be assigned as fracture proppant in this

31
reservoir because economically it is greater than sand as a proppant agent at high reservoir
permeability. The fracture half-length increases with decrease in the permeability.
David (1985) performed an experiment to evaluate the optimum proppant that can
be used in deep wells with high closure pressure. Different kinds of proppants were used
in the experiment, such as sintered bauxite, ceramic, and resin-coated sand. David used 15
lbs. of 20/40 mesh sand after it was heated in the oven to reach 450 °F. The sand was
steamed inside the muller and the temperature was monitored as it declined. These
procedures were performed for the resin-coated sand because the phenol-formaldehyde in
resin-coated sand is a function of temperature and time. Based on his results, David
concluded that resin-coated sand can provide a high conductivity fracture in deep wells at
closure pressures less than 6000 psi.
In the last twenty years, many companies have started to perform site tests for the
proppant that will be used in fracture treatments. The idea of verifying proppant capability
before and after the hydraulic fracture treatment can add an important value to the fracture
stimulation. For instance, Freeman et al. (2009) developed a field test protocol for use by
an operating company to ensure that a proppant can meet the job expectation. The company
established new technology that created quality-control data at the wellsite to use for
comparison with public domain data. These data give the site engineers insight into how
the chosen proppant will perform, and help to avoid running an expensive conductivity test
on every job. This technology can easily sample the proppant at a well site before the
fracture treatment. However, this technology requires that the proppant follow the
American Petroleum Institute (API) and the International Organization for Standardization
(ISO) regulations. In 2005, Freeman and his team introduced their technology in Zapata

32
County of south Texas, USA, in order to apply it to a multi-stage fracture job for tight
sandstone formation. Twenty fracture treatments were sampled, and the proppants that
were used are listed below:
1. Premium-resin-coated curable sand
2. Resin-coated economy ceramic
3. Resin-coated lightweight ceramic
4. Intermediate-strength ceramic
The results showed that resin-coated sand had a negative effect on conductivity
when it was compared to the public domain database. Resin-coated economy ceramic has
a high chance to be crushed in about 10 months compared with the public domain database.
Resin-coated lightweight ceramic and intermediate-strength ceramic showed great
conductivity and resistance to crushing inside the fracture compared with the public
domain data.
3.4. GEOLOGY
Reservoir characteristics are very important to understand the geological
description which can reduce the time spent on history matching with a reservoir model. A
few studies were conducted of the Nubain Sandstone Formation. Patrick and Noreddin
(2010) studied the geology and petrophysical approach in regard to the Nubain Sandstone
Formation. The study was based on the laboratory measurement of different cores that had
been taken from six oil wells in the Sirte Basin, Libya. They used the petrophysical element
approach in order to improve the reservoir description and identify geological and
petrophysical rock types for the formation. Based on the cores in the experiment and
33
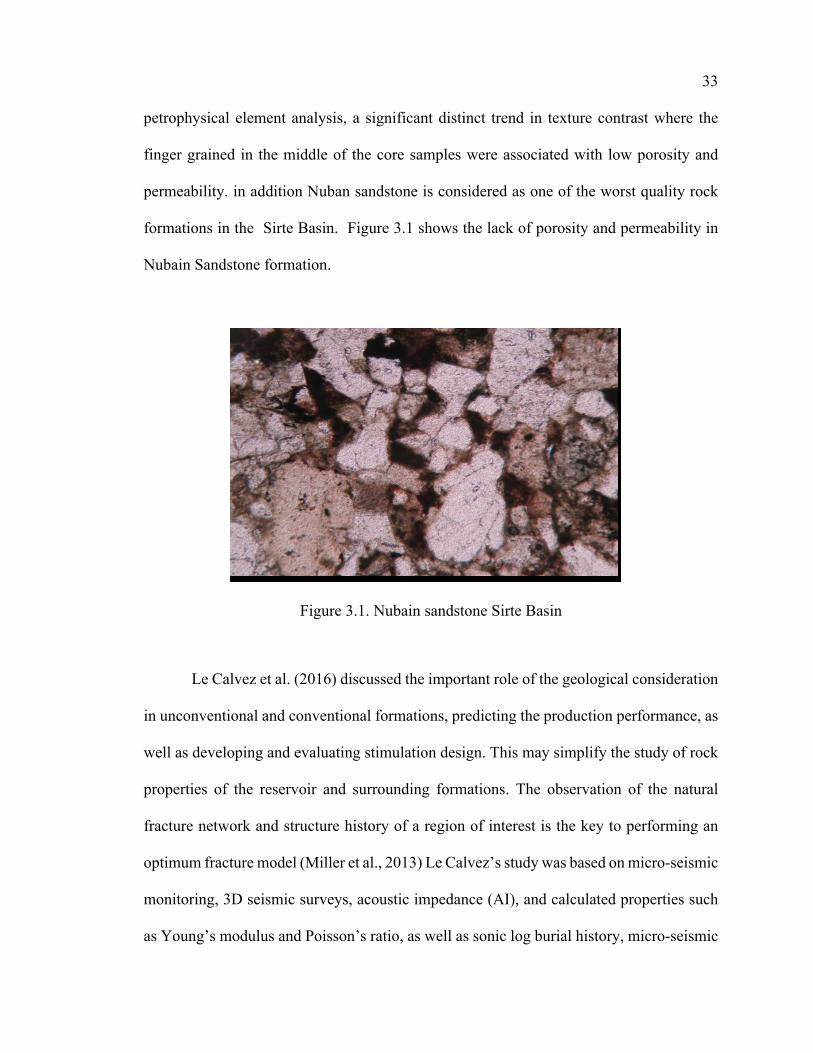
petrophysical element analysis, a significant distinct trend in texture contrast where the
finger grained in the middle of the core samples were associated with low porosity and
permeability. in addition Nuban sandstone is considered as one of the worst quality rock
formations in the Sirte Basin. Figure 3.1 shows the lack of porosity and permeability in
Nubain Sandstone formation.
Figure 3.1. Nubain sandstone Sirte Basin
Le Calvez et al. (2016) discussed the important role of the geological consideration
in unconventional and conventional formations, predicting the production performance, as
well as developing and evaluating stimulation design. This may simplify the study of rock
properties of the reservoir and surrounding formations. The observation of the natural
fracture network and structure history of a region of interest is the key to performing an
optimum fracture model (Miller et al., 2013) Le Calvez’s study was based on micro-seismic
monitoring, 3D seismic surveys, acoustic impedance (AI), and calculated properties such
as Young’s modulus and Poisson’s ratio, as well as sonic log burial history, micro-seismic
34
surveys, and petrophysical measurements from well logging. He concluded that it is not
possible to build a hydraulic fracture model without integration of the fracturing model
with a geologic and structure model to estimate the different completion strategies and the
optimum stimulation plan.
Van Dam (2000) performed a laboratory experiment on artificial soft rock, which
has properties more than 90% similar to sandstone, to study the behavior of closure and
fracture propagation. In addition, he developed a simulation model that can help in
interpreting and extrapolating the measurement results to field scale. He focused more on
rock plasticity regarding the hydraulic fracture. He claimed that such plastic behavior may
persuade high tip pressure and will consequently increase wellbore pressure and make the
fracture wider and shorter. Then, he used the simulation model for comparison with the
experimental results, where he concluded that rock behavior at the fracture tip can be
obtained with a consistent zone over which the rock loses its bearing capacity. The
experiment results showed that interpreting fracture geometry by relying only on pressure
measurement is insufficient. Closure pressure in the experimental rock showed a stress
section lower than field stress on the fracture plane.
Zhang and Jeffrey (2007) applied a study about the effect of frictional geological
discontinuities. The study was based on sedimentary rock and the affects that fluid flow
and frictional slippages will have on the interaction of elastic deformation. This kind of
interaction can be generated in fracture blunting crossing the stress contrasts, and
sometimes shear strength of discontinuity. Zhang and Jeffrey made a comparison between
the results obtained from the simulation study and field observations. They noticed that
when the fracture interacts with long geological discontinuities, the fracture growth can be
35
eliminated by the process, while treating pressure increases significantly by high-pressure
gradient, which has been made at offsets in fracture channels. The study also revealed that
proppant transport may be encumbered due to association with this offset, narrowing
fracture width. At the end of the study, they concluded that the increase of vertical stress
might lead to decent widths across the interface of different layers.
The importance of hydraulic toughness in hydraulic fracturing is not easy to
understand because of the effect of some factors, such as in-situ stress, containment, and
the dominate fracture geometry. After his laboratory experiment on sandstone core taken
from different wells in Colorado, Rubian (1983) found that fracture toughness has to be
included in any design and numerical model for hydraulic fracturing. However, some
researchers claimed that stress intensity at the front the tip of the fracture is more likely to
be greater than fracture toughness of the rock. Therefore, toughness may not be important
in fracture design. Barker (1977) performed an experiment to measure the fracture
toughness of sandstone, shale, and siltstones. From the experiment, Barker was able to find
the toughness of each type of rock; for example, fracture toughness for sandstone had an
average of 1.27 MPa.m^1/2, while shale had an average of 1.46 MPa.m^1/2. He concluded
that the toughness of sandstone is 15% less than shale, which can provide great
understanding of fracture toughness in the determination of fracture containment and
geometry.
3.5. SIMULATIONS OF HYDRAULIC FRACTURE
As hydraulic fracturing has become a significant stimulation technique for
development of the tightest formations and low permeability reservoirs, the use of

36
computing models has also become very important. Simulators have the ability to predict
treatment designs, additives, pump schedule, injection rate, proppant selection, and fracture
propagation. Hydraulic fracture simulators are performed based on realistic values in order
to investigate fracture width and geometry, volumetric injection rate of the proppant,
optimum pump rate, and the number of stages that can be assigned. Most hydraulic fracture
simulators contain three physical processes: fluid flow in the porous media, fracture
propagation for both existing fractures and the new fracture, and the deformity of the matrix
throughout the formation (Shlyapobersky, 1985; Adachi et al., 2007).
Producing hydrocarbon from tight sandstone formations is growing rapidly, and
the use of hydraulic fracturing is the optimum application for that. Sarmadivaleh and
Ramses (2012) performed a numerical simulation model by using PFC2D (Particle Flow
Code) software to examine the differences and their effectiveness on the interaction
mechanism. The model results were conducted from a lab experiment of a sample of
sandstone to determine bond strength and friction, which are inputs of the PFC. They
initiated the fracture in the center of the sample, and the magnitude and direction of all the
stresses were calculated as follows:
σv =2500 psi, σH =2000 psi, and σh =500 psi, where
σv = overburden pressure, psi
σH = Maximum horizontal stress, psi
σh = Minimum horizontal stress, psi
The sample was tested in lab by using the PFC simulator. The results that appeared
on the PFC showed that fracture propagation is a function of rock properties in which the
37
fracture starts its direction. Friction coefficient was also a very important property that can
play a big role in changing interaction mechanisms.
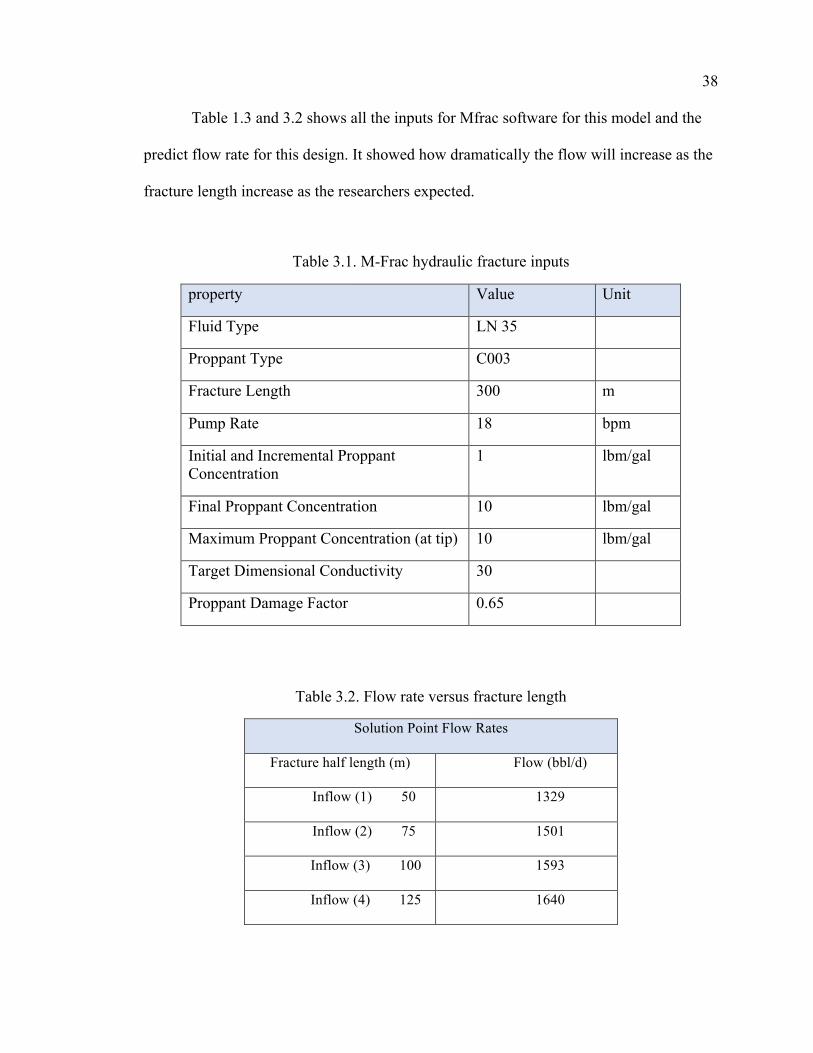
In the past ten years, many offshore fields in southern Asia have been producing
with a high rate; but recently, their production has been decreasing. Nguyen and Bae (2013)
applied a simulation study on one of the Vietnamese fields. They used real reservoir data
to approach the optimum fracture design technically and economically. The MFrac
simulator was used in this study for estimating the best fracture design.
The type of the formation is tight sandstone with a permeability range of 0.1 md to
2 md and porosity from 12% to 16% with natural fracture all over the field. They built a
strategy based on the optimum fracture procedure that guarantees actual results based on
perforation design, fracture fluid, optimum proppant type, and the reservoir parameters.
Based on the software results, the fracture half-length should be between 90-200 m to
maximize the net pressure value, and 150,000 lbs of intermediate strength proppant is
needed to create this fracture length. The MFrac software used the steady-state fracture
model for primary prediction of production rate from the well. Tables 1a and 1b show the
input data of the software and an estimation of the production rate.
In some cases, a hydraulic fracture may propagate into different layers. This is a
common scenario that occurs in multiple layered formations depending on the magnitude
of the fracture stimulation net pressure and the in-situ stress profile and formation
thickness. Therefore, it is important to know whether one treatment design or multiple
treatment designs should be used. Desroches and Elbel (2000) applied a simulation model
for a multi-layer hydraulic fracture design for field X.
38
Table 1.3 and 3.2 shows all the inputs for Mfrac software for this model and the
predict flow rate for this design. It showed how dramatically the flow will increase as the
fracture length increase as the researchers expected.
Table 3.1. M-Frac hydraulic fracture inputs
property Value Unit
Fluid Type LN 35
Proppant Type C003
Fracture Length 300 m
Pump Rate 18 bpm
Initial and Incremental Proppant Concentration
1 lbm/gal
Final Proppant Concentration 10 lbm/gal
Maximum Proppant Concentration (at tip) 10 lbm/gal
Target Dimensional Conductivity 30
Proppant Damage Factor 0.65
Table 3.2. Flow rate versus fracture length
Solution Point Flow Rates
Fracture half length (m) Flow (bbl/d)
Inflow (1) 50 1329
Inflow (2) 75 1501
Inflow (3) 100 1593
Inflow (4) 125 1640

39
The computer simulator calculates the flow rate through multiple layers and
multiple fractures based on the material balance equation (mass conservation and pressure
continuity). The simulator treats the fracture in each layer as a pseudo-three-dimensional
(P3D) fracture model, which can allow fracture height growth into the closet layer. In
addition, the simulator consists of two parts, the rate distribution through multiple layers,
and a model for a single fracture layer. The inputs of the simulator are pay zone gross
height, in-situ stress pay zone, in-situ stress above, in-situ stress below, Poisson’s ratio,
Young’s modulus, and leak-off fluid coefficient. Desroches and Elbel (2000) showed in
their results that near-wellbore screen-out will turn the flow rate into other fractures.
Furthermore, due to the increase of the pressure during the screen-out, it will be difficult
to carry out the fracture fluid from the wellbore. They recommended a “limited entry
treatment technique” to achieve an optimum design for higher flow rate.
Nowadays, simulation engineers have the ability to use a different kind of grid
technique, but they have to choose which grid is capable of solving the problem they have.
Bhore (2017) conducted a simulation study of hydraulic fracture performance and
production rate of tight sand and shale formation. The idea of his study is basically built
on two types of grid techniques under the dynamic model of the reservoir: locally
orthogonal gridding (PeBi) and hybrid Cartesian gridding. Saphir software was utilized to
build a 2D PEBi model in order to perform a horizontal fracture with an optimum rate of
100 bbl/D for 100 hr. Bhore (2017) started with a three-layered homogenous tight reservoir
model with multiple thicknesses. In addition, a single horizontal well was multi-fractured
in the model to estimate the rate profile and pressure transient for 11 months. The materials
used in this model were sandstone, shale, and carbonate. The horizontal well had a length

40
of 1000 ft and total vertical depth of 6114 ft with infinite fracture conductivity. After
running the simulator, the results showed that the PeBi grid has detailed information about
the near-wellbore geometry, and this grid technique becomes accurate in early time
transient pressure models. Bhore compared the numerical results and analytical results that
had been made prior to the simulation model, which were almost identical. The Pebi grid
helped to perform an evaluation of the transverse fracture for the horizontal wells. PeBi
has more of an advantage to offer a solution for inflow performance than the analytical
solution, which can save more time.
Chen et al. (2015) discussed the effect of hydraulic fracture interaction with natural
fractures that already existed on the pay zone formation via a finite element model. They
investigated fluid flow inside the hydraulic fracture, elastic deformation, and fracture
propagation. They focused in their study on reservoir conditions such as geomechanical
and geometrical properties, intersection angle, in-situ stresses, and treatment parameters
which include fracture fluid viscosity and injection rate. The finite element software
allowed them to study the effect of the leak-off fluid and height growth in nonhomogeneous
formation. The study was built based on tight sandstone, with constant injection rate
through a homogenous formation. The distance between the injection point (wellbore) and
the natural fracture is 10.3 m. The left side of the injection point is 1.7 m long. Other
properties were also determined in the study, such as fracture energy (Gc) = 100J/m^2,
tensile strength (To) = 1 MPa, and the natural fracture, which has a 10 m height in the Y
direction. The authors concluded that the hydraulic fracture tends to intersect with the
natural fracture faster when injected with high fluid viscosity and rate. In low stress, the
initial conductivity of the natural fracture may affect the intersection between the hydraulic

41
fracture and natural fracture. Figure 3.2 shows the estimated angle that will reach the
natural fracture.
Figure 3.2. The hydraulic fracture propagation toward the natural fracture
42
4. HYDRAULIC FRACTURE OPTIMIZATION DESIGN
This section discusses the methods used to determine the optimum fracture design
for the Nubain sandstone formation in vertical well X-7, field-H, in Libya. This section
also details how all available data were used in the study. The calibration data needed for
the software were provided from an operating company, which will be called Company-M
for confidential purposes. STIMPLAN software was used to build an optimum hydraulic
fracture model.
In order to investigate fracturing alternatives for any well in field-H, it is necessary
for the model to first match known performance of a vertical fractured well. Well X-7 was
selected for this purpose and calibrated using STIMPLAN. The average permeability
values for the reservoir were lower than expected for the sandstone formation in the area.
Well X-7 was selected mainly because it was noticed that the production rate declined
suddenly even though the reservoir properties did not change. Also it was one of the wells
recently planned to be fractured, and data were available in a digital format. Due to the
political situation in the country, the company could not yet perform a fracturing
stimulation on this well.
4.1. WELL BACKGROUND AND FIELD HISTORY
The producing reservoirs in Sirte Basin mostly start from Precambrian basement
(igneous rocks) to Olgocene sand, which are considered the main precursor to form fracture
porosity in Sirte Basin. Amal, Messlah, Bu Attifel, Masrab, and Gialo fields are the most
famous fields in Sirte Basin. Many studies were performed to address the types of the

43
formation in Sirte Basin. However, to date there are some areas still undeveloped. A recent
study by Rusk (2017) indicates a presence of outstanding source rock called (Cretaceous
Sirte Rachmat Shale).
Field-H was discovered in 1974 with the drilling of the X-1 well. The discovery
was appraised in 1982 with the X-2 well, and finally put on production in July 1996 during
the drilling of X-3 deviated well. Wells X-4, X-5, X-6 were drilled in the west during
1996, followed by X-7 which was temporarily abandoned despite showing oil due to some
mechanical problems after encountering a fault zone. Activity level changed significantly
in late 2000, when it was decided to drill the X-8 deviated well. The X-9 and X-10 wells
were both vertical and drilled in 2002 to test the easternmost portion of the field and results
of the first seismic reservoir characterization study, which were incorporated with positive
results. The X-11 well was drilled in late 2002 in the far south of the field. Seismic results
of this well showed thick sand in the area, and it was presumed to have undepleted pressure.
Well X-7 is a development well drilled to a TD of 13,005 ft., penetrating the UNSS
(Upper Nubian Sand-Stone) at 12,122'-12,207' KB, NMS (Nubian Middle Shale) at
12,207- 12,524 ft and the LNSS (Lower Nubian Sand-Stone) at 12,524-12,880 ft. Based
on open hole logs conducted in July-2013. The UNSS and LNSS are the targeted reservoirs
with pay zones of 61 ft and 286 ft, respectively, whereas the NMS is considered non-
reservoir. Open hole (OH) logs showed low porosities of 7.4% and 7.9% and poor (tight)
permeabilities of 2.5 md and 3 md for the UNSS and LNSS, respectively. The operator
initially planned to perforate, fracture and test these two formations separately. Figure 4.1
shows the location of the well X-7.
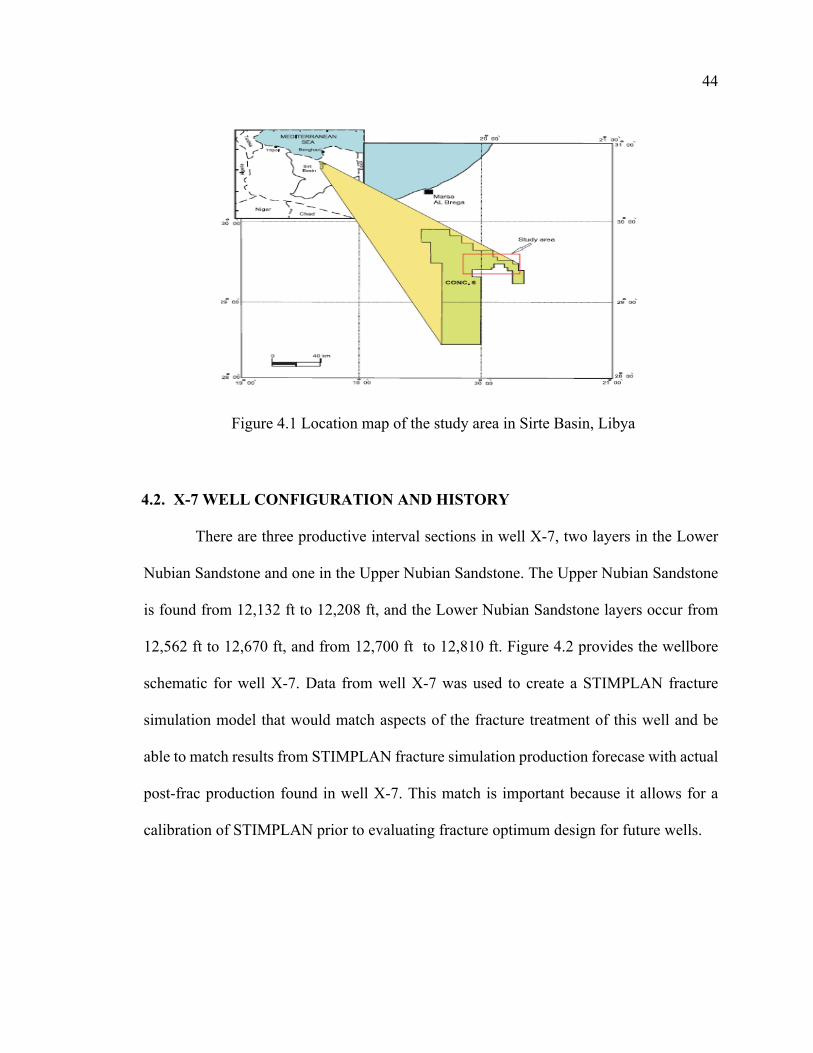
44
Figure 4.1 Location map of the study area in Sirte Basin, Libya
4.2. X-7 WELL CONFIGURATION AND HISTORY
There are three productive interval sections in well X-7, two layers in the Lower
Nubian Sandstone and one in the Upper Nubian Sandstone. The Upper Nubian Sandstone
is found from 12,132 ft to 12,208 ft, and the Lower Nubian Sandstone layers occur from
12,562 ft to 12,670 ft, and from 12,700 ft to 12,810 ft. Figure 4.2 provides the wellbore
schematic for well X-7. Data from well X-7 was used to create a STIMPLAN fracture
simulation model that would match aspects of the fracture treatment of this well and be
able to match results from STIMPLAN fracture simulation production forecase with actual
post-frac production found in well X-7. This match is important because it allows for a
calibration of STIMPLAN prior to evaluating fracture optimum design for future wells.

45
Figure 4.2. Well X-7 schematic
4.3. LOG ANALYSIS
This section discusses log analysis, and how logs are used to determine formation
lithology, layering, geomechanical profile, and ultimately define a stress profile for the
formations the stress profile determines stress contrasts, which can control fracture height
growth.
The most common types of logs include gamma-ray, resistivity, caliper, neutron
porosity, and density porosity. The gamma-ray has the ability to read natural gamma-ray
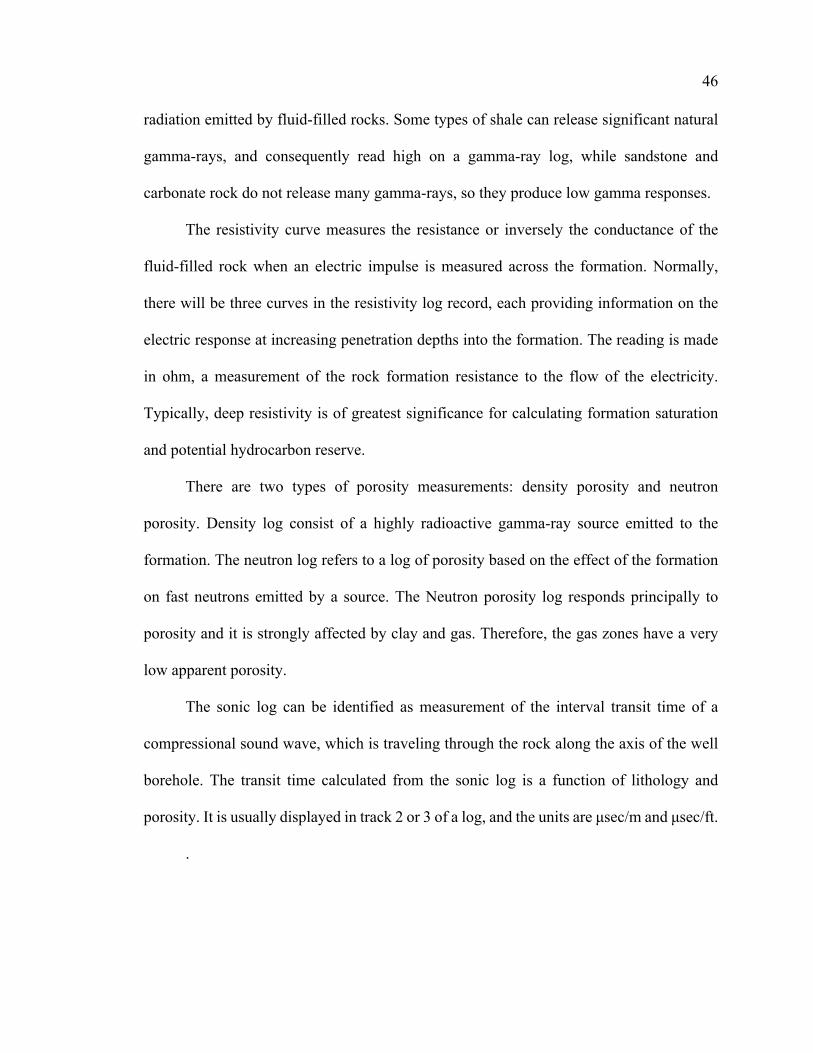
46
radiation emitted by fluid-filled rocks. Some types of shale can release significant natural
gamma-rays, and consequently read high on a gamma-ray log, while sandstone and
carbonate rock do not release many gamma-rays, so they produce low gamma responses.
The resistivity curve measures the resistance or inversely the conductance of the
fluid-filled rock when an electric impulse is measured across the formation. Normally,
there will be three curves in the resistivity log record, each providing information on the
electric response at increasing penetration depths into the formation. The reading is made
in ohm, a measurement of the rock formation resistance to the flow of the electricity.
Typically, deep resistivity is of greatest significance for calculating formation saturation
and potential hydrocarbon reserve.
There are two types of porosity measurements: density porosity and neutron
porosity. Density log consist of a highly radioactive gamma-ray source emitted to the
formation. The neutron log refers to a log of porosity based on the effect of the formation
on fast neutrons emitted by a source. The Neutron porosity log responds principally to
porosity and it is strongly affected by clay and gas. Therefore, the gas zones have a very
low apparent porosity.
The sonic log can be identified as measurement of the interval transit time of a
compressional sound wave, which is traveling through the rock along the axis of the well
borehole. The transit time calculated from the sonic log is a function of lithology and
porosity. It is usually displayed in track 2 or 3 of a log, and the units are µsec/m and µsec/ft.
.
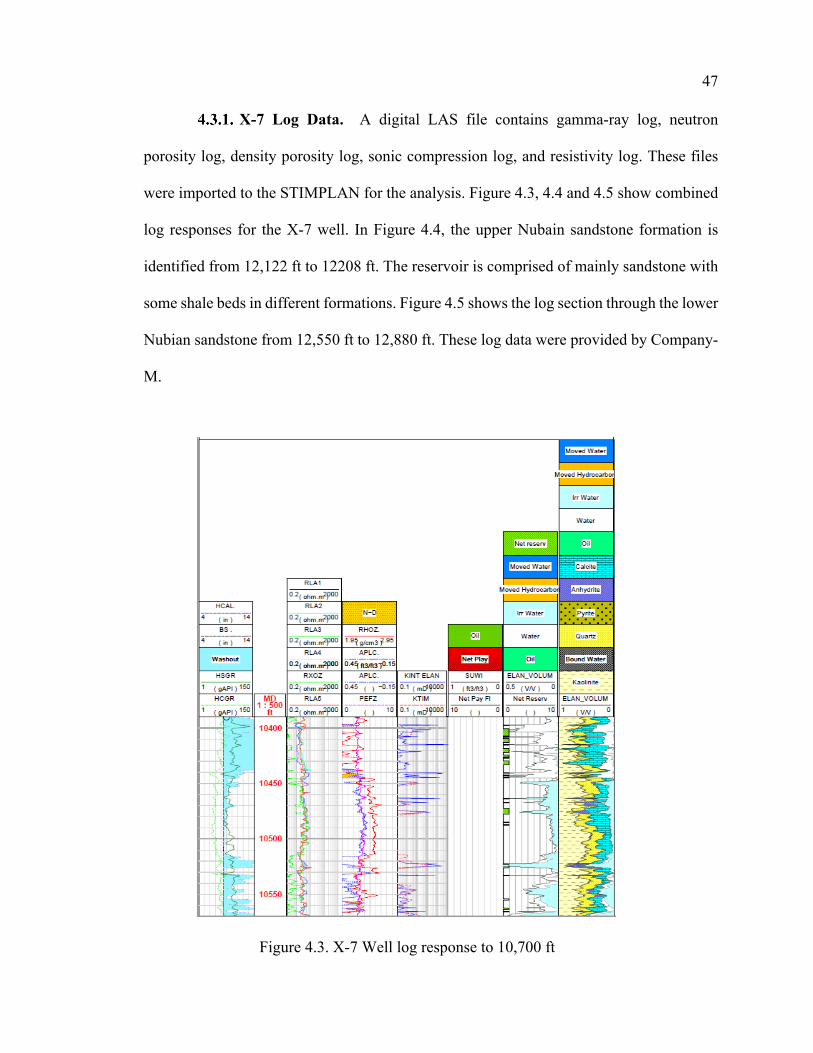
47
X-7 Log Data. A digital LAS file contains gamma-ray log, neutron
porosity log, density porosity log, sonic compression log, and resistivity log. These files
were imported to the STIMPLAN for the analysis. Figure 4.3, 4.4 and 4.5 show combined
log responses for the X-7 well. In Figure 4.4, the upper Nubain sandstone formation is
identified from 12,122 ft to 12208 ft. The reservoir is comprised of mainly sandstone with
some shale beds in different formations. Figure 4.5 shows the log section through the lower
Nubian sandstone from 12,550 ft to 12,880 ft. These log data were provided by Company-
M.
Figure 4.3. X-7 Well log response to 10,700 ft
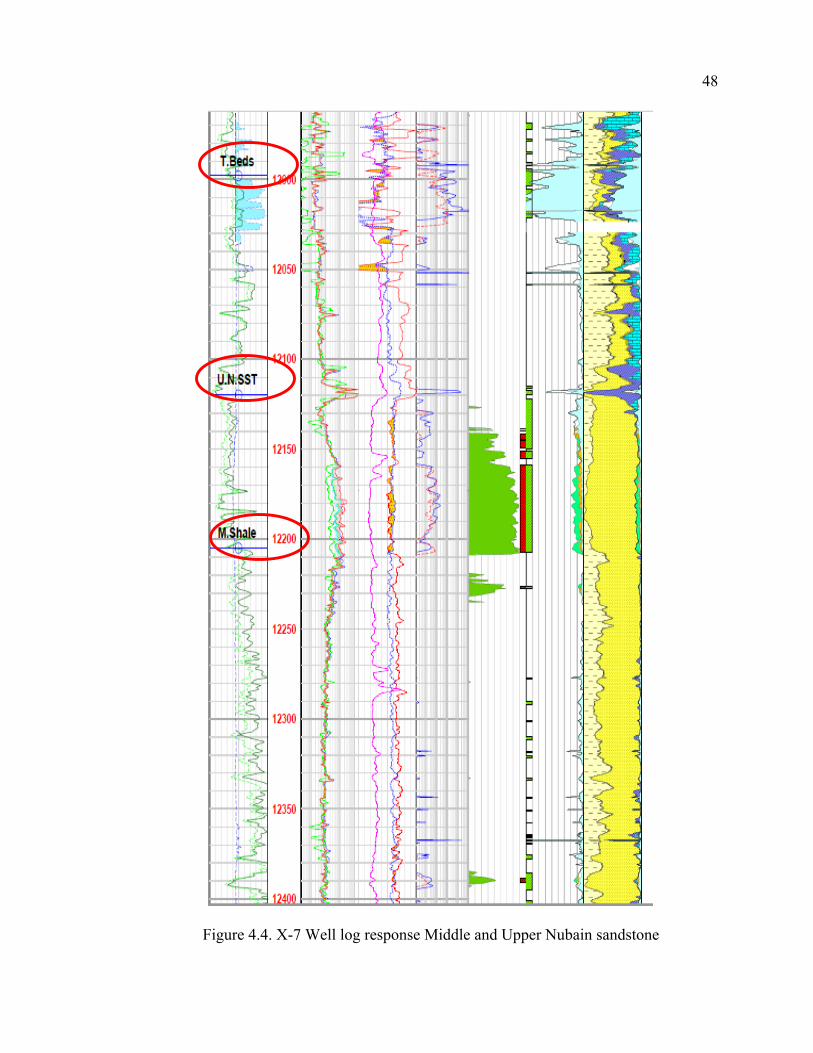
48
Figure 4.4. X-7 Well log response Middle and Upper Nubain sandstone
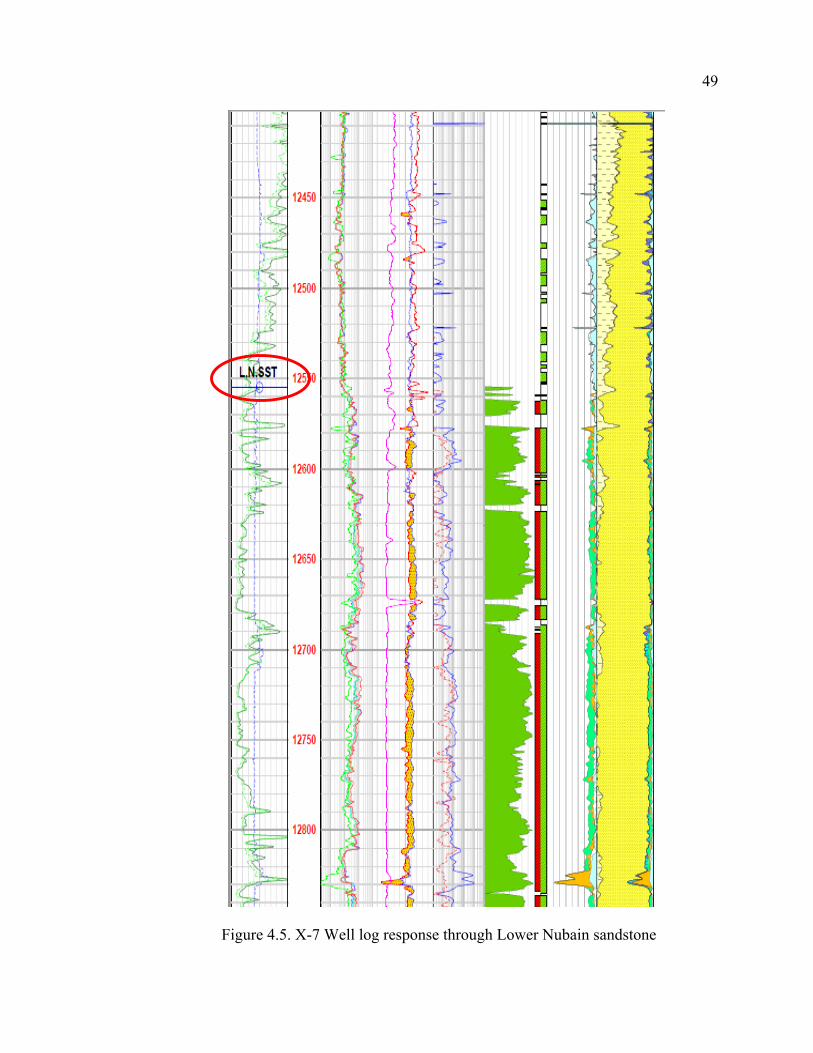
49
Figure 4.5. X-7 Well log response through Lower Nubain sandstone

50
Techlog software was used to analyze the well log data. Table 4.1 summarizes the
formation top and bottom depths, net pay, average porosity, average permeability, and
average water saturation for each zone.
Table 4.1. Reservoir summary of the well X-7
As shown in Table 4.1, the Lower Nubian sandstone has a reservoir pay section
much thicker than the upper Nubian sandstone. Therefore, the Lower Nubian sandstone
was the focus for determining an optimum hydraulic fracturing treatment.
Identification of Lithology and Layers. It is important to create a stress
profile and geomechanical model for the formation and surrounding lithology, to determine
fracture height growth or containment for the stimulation treatment. The available data of
the LAS file were imported to STIMPLAN to identify geological layers.
Figure 4.6 shows the results of importing gamma-ray, density, resistivity, and sonic
files, and the resultant layering. Three distinct layers were identified within the Lower
Zone Top ft Bottom
ft
Net ft Avg Phi Avg K
md
Avg
SW
Phi*
H ft
Upper
Nubian ss
12,122 12,207 70.75 0.087 2.5 0.183 6.13
Middle
Shale
12,207 12,524 22.25 0.073 0.38 0.475 2.96
Lower
Nubian ss
12,524 13,000 295.25 0.87 3.1 0.204 25.65
All Zones 12,122 13,000 371.5 0.087 2.6 0.194 32.41
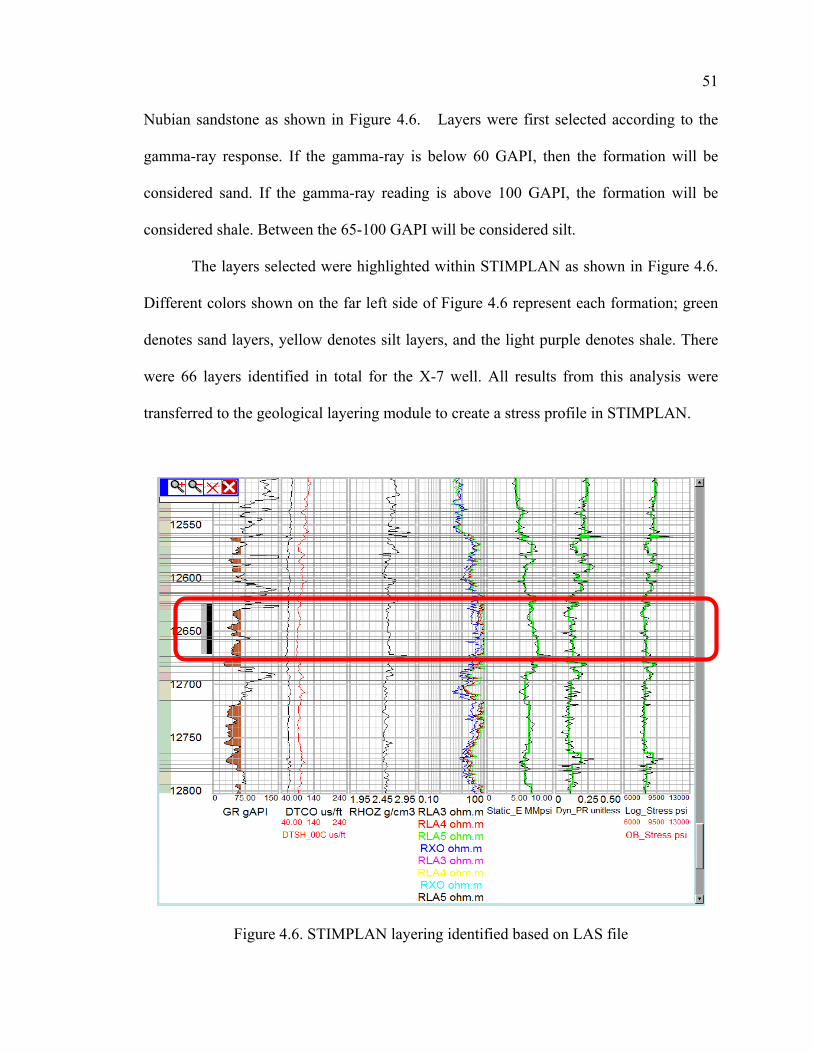
51
Nubian sandstone as shown in Figure 4.6. Layers were first selected according to the
gamma-ray response. If the gamma-ray is below 60 GAPI, then the formation will be
considered sand. If the gamma-ray reading is above 100 GAPI, the formation will be
considered shale. Between the 65-100 GAPI will be considered silt.
The layers selected were highlighted within STIMPLAN as shown in Figure 4.6.
Different colors shown on the far left side of Figure 4.6 represent each formation; green
denotes sand layers, yellow denotes silt layers, and the light purple denotes shale. There
were 66 layers identified in total for the X-7 well. All results from this analysis were
transferred to the geological layering module to create a stress profile in STIMPLAN.
Figure 4.6. STIMPLAN layering identified based on LAS file

52
After transferring all the log data, a geomechnical profile was developed by adding
Young’s modulus (dynamic and static), Poisson’s ratio, log stress, and the overburden
stress. The stress profile is generated by importing bulk density readings from the density
log (RHOZ g/cc), compression travel time (DTCO us/ft), and shear travel time (DTSH
us/ft) from the acoustic sonic log. These values were entered in STIMPLAN as shown in
Figure 4.7.
Figure 4.7. STIMPLAN input for determining log stresses
A single value of overburden is required in the calculation of stress. This value must
be entered as a gradient. For sandstone, the common value was determined to be 1.12 psi/ft.
For the calculation of stress profile, it is necessary to define reservoir pressure and
overburden for the type of formation (sand, shale, silt). In the analysis, an initial reservoir
53
pressure of 6000 psi was used, and the gradient was calculated using this pressure and
divided by the depth of the target layer.
A stress profile was determined from 10360 ft to 12925 ft, as shown in the right
hand track of Figure 4.6. This geomechanical profile is used in the fracture design.
It was assumed that a single hydraulic fracturing treatment, stimulating the most
net pay, would provide the greatest economic benefit. Given three distinct layers (one layer
in UNSS, two layers in LNSS), the question was how to effectively perforate and stimulate
three layers in one treatment. To investigate this, STIMPLAN was used to simulate
perforating the UNSS only, the bottom layer of LNSS only, and then the middle LNSS
layer only (using existing LNSS perforation depths in well X-7), to model the fracture
growth in each case. This analysis showed that perforating the middle layer through
existing well X-7 perforations resulted in the greatest amount of stimulated net pay. These
perforations are 75 ft above the original oil water contact. The perforations and layer
selected for injection are highlighted in red in Figure 4.6 and Figure 4.8 shows fracture
height growth through these perforations.
In all cases the fracture initiation from the lower Nubian sandstone formation grew
beyond the oil-water contact regardless of whether water, linear gel, or cross-linked fluid
was used. The implication of perforating the upper Nubian sandstone is that whether a
vertical well completion or horizontal well completion the Upper Nubian sandstone is
landing interval. If the upper Nubian sandstone was perforated the fracture growth could
be limited to above the oil-water contact.

54
Figure 4.8. Fracture height growth in Middle Nubian sandstone
Pressure and Production Rate Analysis. STIMPLAN’S pressure analysis
allows fracture pressure and post-production appraisal from fall off and buildup pressure
data provided by the operating company. The pressure decline analysis function allows the
user to interpret mini-frac pressure decline data using fracture diagnostics to determine
fluid efficiency and leak-off coefficient. In addition, STIMPLAN has the ability to support
production history matching with a 3-D numerical reservoir simulator to appraise effects
of simulation and provide insights for any upcoming design. Production type curve analysis
also provides for quick user-friendly post. (http://www.nsitech.com/software/index.htm)
At the outset of the study, it was expected that full well performance data from well
X-7 would be available to match and to calibrate the STIMPLAN model. However, only
production data and injection data from the main fracture treatment were available for
analysis. The step-rate test and pressure fall off were not available for this study. This is
X
Fracture Penetration (ft)100 200 300 400 500
1079.30 minTVDft
12600
12700
12800
12900
13000
Stress (psi)7500 8500 9500
Oil
Silty
55
somewhat limiting because without fall off data, it is difficult to completely verify the well
performance match.
Production data analysis for Well X-7 were used to match predicted well
performance with the fracture design parameters. Five months of production data were
available for analysis. The data were provided in an excel spreadsheet which included
flowing time (min), bottomhole pressure (psi), and oil production rate (BOPD). Due to
confidentiality, a complete copy of the excel spreadsheet of production data is not included
in this report.
Since the GOR and the water cut are at acceptable range with 1200 scf/bbl and 11%
respectively, only the production rate was used to match well performance with predicted
fracture performance. Figure 4.9 shows a screenshot of how the wellbore pressure and rate
are imported to STIMPLAN. A production data plot of rate (BOPD) versus time (min) is
shown in Figure 4.10. The production test was performed on fixed choke size 32/64” to
control the water production from the formation. The production test continued for 28 hrs
and was monitored by the service company and the other parties.
This step was made to get a prediction about the efficiency, fluid coefficient, and
closure pressure. Due to the lack of data on the lAS file we could not make a full
performance of mini frac, but the research instead used the two days production test to
study to efficiency of the treatment that will be use on this research.
This study utilized reservoir, fluid, pressure and production data to build a
STIMPLAN model for well X-7 in the Nubian sandstone, from which various hydraulic
fracturing alternatives are evaluated. Production rate data for two days, (January 4-5, 2014)
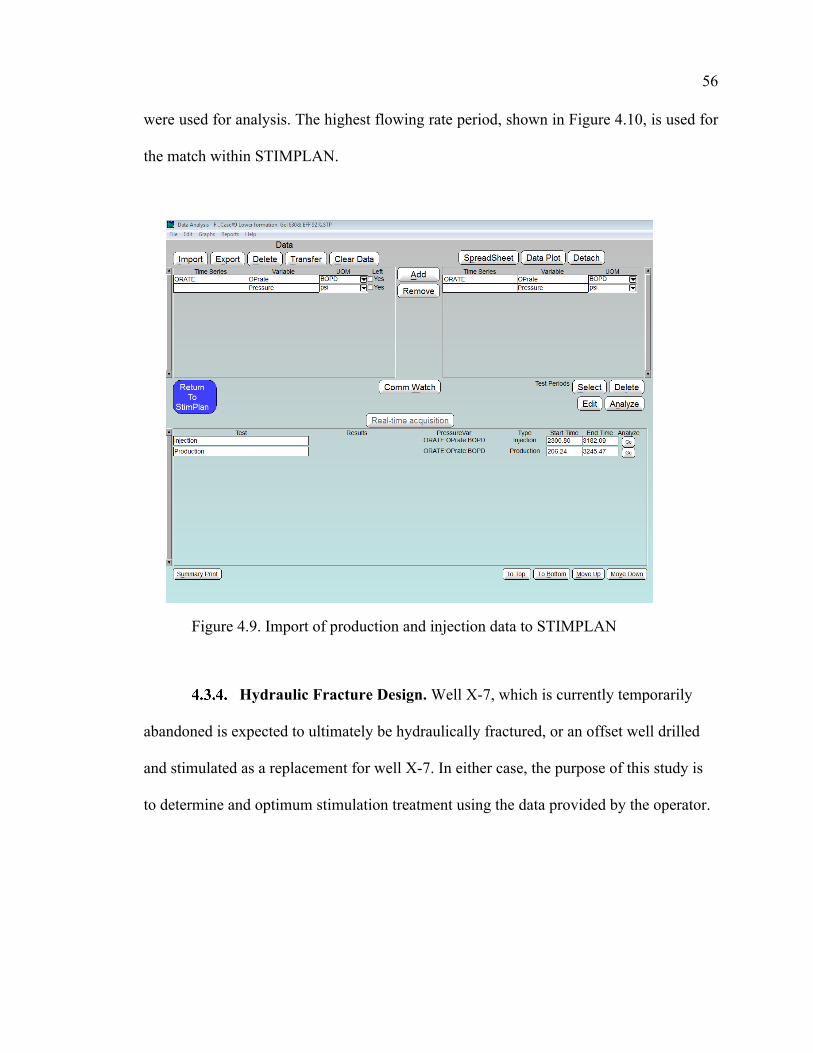
56
were used for analysis. The highest flowing rate period, shown in Figure 4.10, is used for
the match within STIMPLAN.
Figure 4.9. Import of production and injection data to STIMPLAN
Hydraulic Fracture Design. Well X-7, which is currently temporarily
abandoned is expected to ultimately be hydraulically fractured, or an offset well drilled
and stimulated as a replacement for well X-7. In either case, the purpose of this study is
to determine and optimum stimulation treatment using the data provided by the operator.
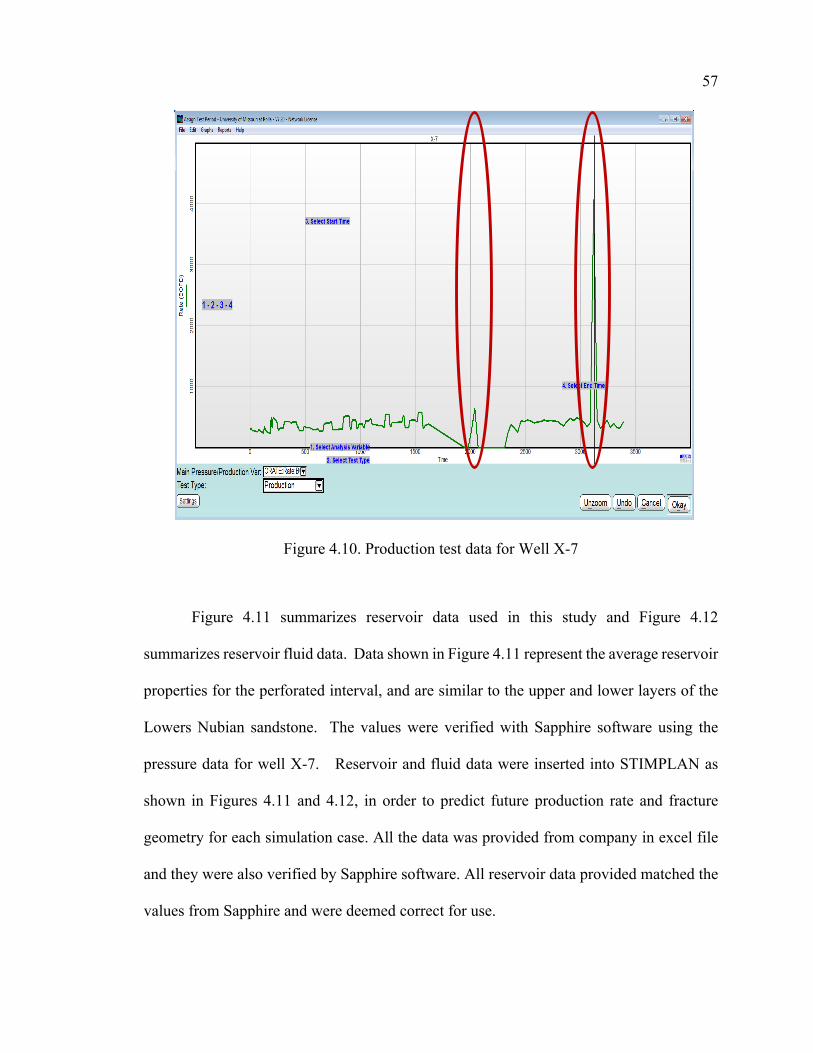
57
Figure 4.10. Production test data for Well X-7
Figure 4.11 summarizes reservoir data used in this study and Figure 4.12
summarizes reservoir fluid data. Data shown in Figure 4.11 represent the average reservoir
properties for the perforated interval, and are similar to the upper and lower layers of the
Lowers Nubian sandstone. The values were verified with Sapphire software using the
pressure data for well X-7. Reservoir and fluid data were inserted into STIMPLAN as
shown in Figures 4.11 and 4.12, in order to predict future production rate and fracture
geometry for each simulation case. All the data was provided from company in excel file
and they were also verified by Sapphire software. All reservoir data provided matched the
values from Sapphire and were deemed correct for use.
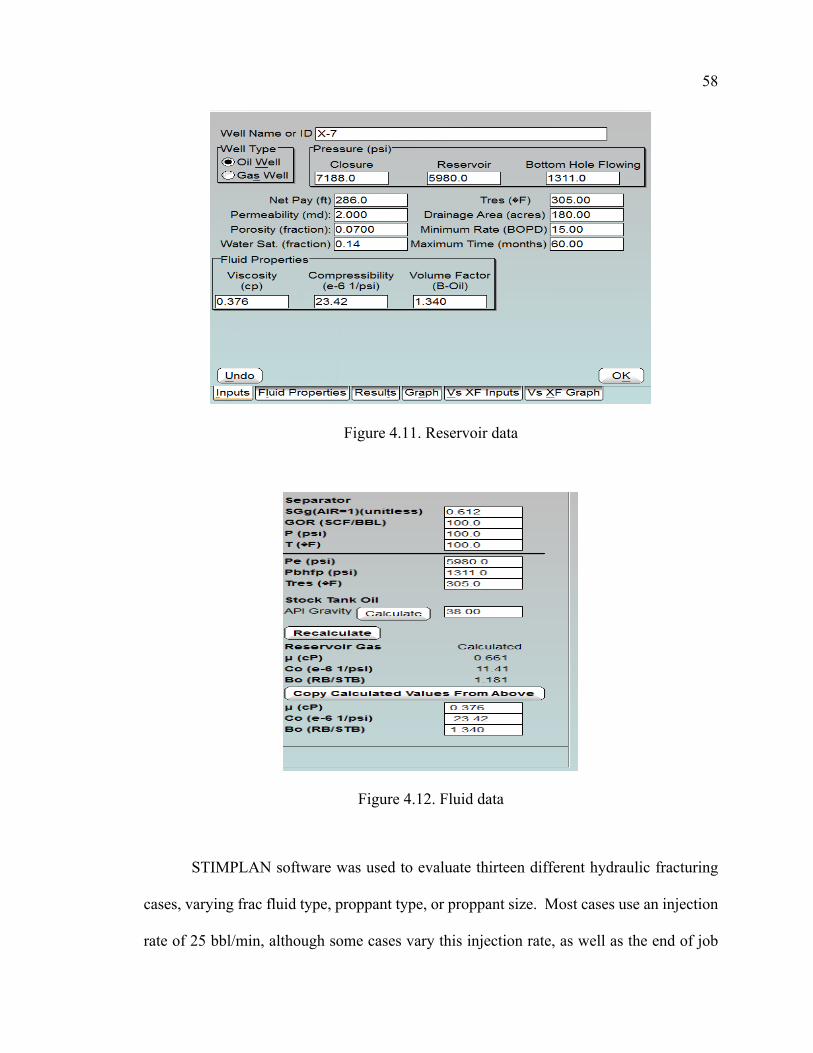
58
Figure 4.11. Reservoir data
Figure 4.12. Fluid data
STIMPLAN software was used to evaluate thirteen different hydraulic fracturing
cases, varying frac fluid type, proppant type, or proppant size. Most cases use an injection
rate of 25 bbl/min, although some cases vary this injection rate, as well as the end of job

59
proppant concentration or number of stages pumped. In all but one case (case 12) proppant
concentration starts from 1 ppg and increases at a constant rate until the end of job
concentration. Case 12 is slickwater which starts with a proppant concentration of 0.5 ppg.
Table 4.2 presents a summary of the cases evaluated in this study. These data are combined
with all previous information to predict the future production rate, cumulative recover and
fracture geometry for each fracturing alternative.
Table 4.2. Summary of cases evaluation in this study
Case# Fluid type Proppant type
Proppant size
Inj. Rate EOJ
1 F-300 Linear gel Ottawa Sand 20-40 25 7 2 F-300 Linear gel Ottawa Sand 16-30 25 7 3 F-300 Linear gel Ottawa Sand 12-20 25 7 4 F-300 Linear gel Brady Sand 20-40 25 7 5 F-300 Linear gel Brady Sand 16-30 25 7 6 F-300 Linear gel Brady Sand 12-20 25 7
7 F-300 Linear gel Carbo Ceramic 20-40 25 7
8 F-300 Linear gel Carbo Ceramic 16-20 25 7
9 F-300 Linear gel Carbo Ceramic 12-18 25 7
10 XL-#30 Gaure Carbo Ceramic 20-40 25 7
11 F-160 Linear gel Carbo Ceramic 20-40 20 6
12 Slickwater Carbo Ceramic 20-40 40 4
13 F-300 Linear gel Carbo Ceramic 20-40 25 8
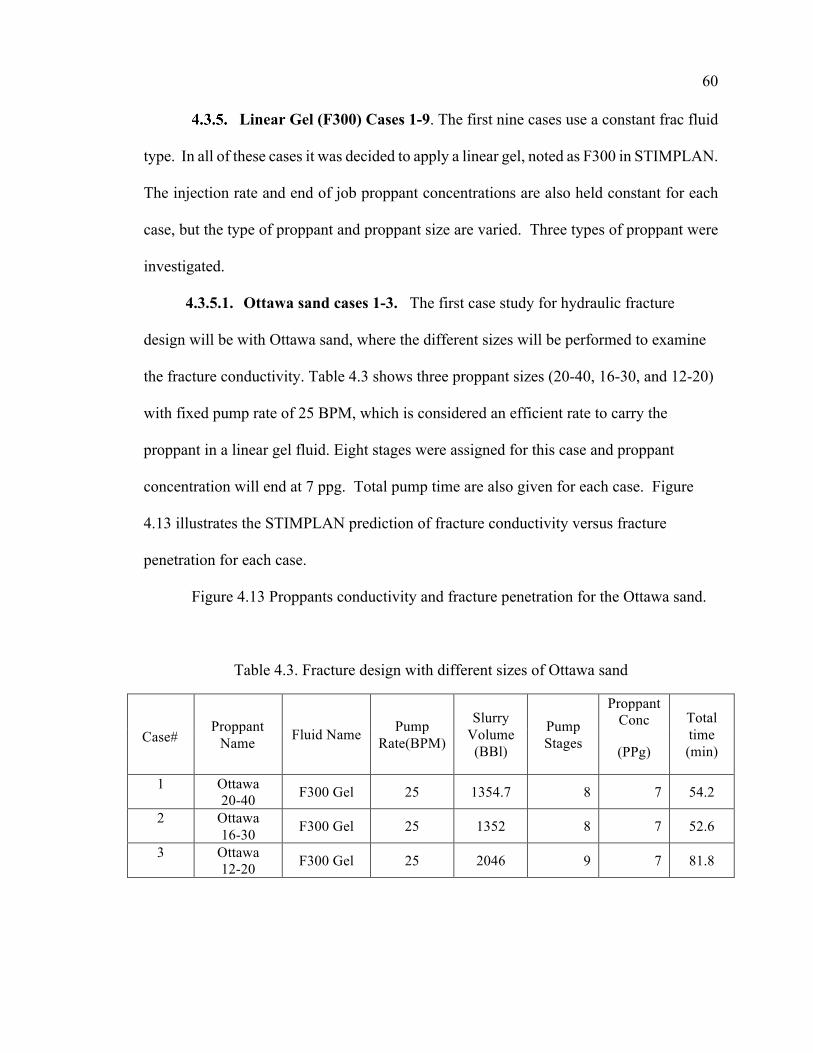
60
Linear Gel (F300) Cases 1-9. The first nine cases use a constant frac fluid
type. In all of these cases it was decided to apply a linear gel, noted as F300 in STIMPLAN.
The injection rate and end of job proppant concentrations are also held constant for each
case, but the type of proppant and proppant size are varied. Three types of proppant were
investigated.
4.3.5.1. Ottawa sand cases 1-3. The first case study for hydraulic fracture
design will be with Ottawa sand, where the different sizes will be performed to examine
the fracture conductivity. Table 4.3 shows three proppant sizes (20-40, 16-30, and 12-20)
with fixed pump rate of 25 BPM, which is considered an efficient rate to carry the
proppant in a linear gel fluid. Eight stages were assigned for this case and proppant
concentration will end at 7 ppg. Total pump time are also given for each case. Figure
4.13 illustrates the STIMPLAN prediction of fracture conductivity versus fracture
penetration for each case.
Figure 4.13 Proppants conductivity and fracture penetration for the Ottawa sand.
Table 4.3. Fracture design with different sizes of Ottawa sand
Case# Proppant
Name Fluid Name Pump Rate(BPM)
Slurry Volume (BBl)
Pump Stages
Proppant Conc Total
time (min) (PPg)
1 Ottawa 20-40 F300 Gel 25 1354.7 8 7 54.2
2 Ottawa 16-30 F300 Gel 25 1352 8 7 52.6
3 Ottawa 12-20 F300 Gel 25 2046 9 7 81.8

61
Figure 4.13. Proppant conductivity of Ottawa sand
4.3.5.2. Brady sand cases 4-6. Brady sand is considered one of the best proppants
in the industry that can handle stress up to 8500 psi. Brady sand will be used in the fracture
design of this study to see its effect on the fracture propagation and to test the proppant
conductivity in different sizes. Table 4.4 summarizes these cases and provides the total
pump time for each case. End of job proppant concentration remains the same, although
pump stages vary slightly.
Table 4.4. Hydraulic fracture design with Brady sand
050
100150200250300350400450500550600650700750800850900
0 50 100 150 200 250 300 350 400 450 500 550 600 650 700 750 800
KfW
(md-
ft)
Fracture Penetration (ft)
12-20
16-30
16-30
Cases# Proppant
Name Fluid Name Pump Rate(BPM)
Slurry Volume (BBl)
Pump Stages
Proppant Conc
Total time (min) (PPg)
4 Brady 20-40 F300 Gel 25 1466 7 7 58.7 5 Brady 16-30 F300 Gel 25 1220 9 7 48.8 6 Brady 12-20 F300 Gel 25 992 7 7 39.7

62
Figure 4.14 illustrates the STIMPLAN prediction of fracture conductivity versus
fracture penetration for each case.
Figure 4.14 Proppants conductivity of Brady sand
4.3.5.3. Carbo lite ceramic cases 7-9. Ceramic proppant is a man-made,
commonly using a bauxite material. It is the most expensive type of proppant. However,
because it is manufactured (not mined), companies have the ability control to control it’s
physical properties such as roundness and sphericity, thus increasing fracture conductivity.
In addition, ceramic proppant has high strength, which provides the ability to
handle the high stress encountered at deeper depths (> 6000 ft). Presently, many companies
0
50
100
150
200
250
300
350
400
450
500
550
600
650
700
750
800
0 50 100 150 200 250 300 350 400 450 500 550 600 650 700 750
KfW
(md-
ft)
Fracture Penetration (ft)
12-20
16-30
20-40

63
in the Middle East recommend using ceramic in deep sandstone formations with
permeability below 10 md. Therefore, the research examined one type of ceramic called
carbo lite in different sizes. Table 4.5 shows the different cases, estimated slurry volume
and pump time. The fluid type and pump rate remain the same as in previous cases.
Table 4.5. Hydraulic fracture design of Carbo Lite ceramic
Figure 4.15 illustrates the STIMPLAN prediction of fracture conductivity versus
fracture penetration for each case using Caro Lite ceramic proppant.
Comparing Figure 4.15 fracture conductivity with that shown for sand (Figures
4.13 and 4.14) it is evident the Carbo Lite ceramic provides far greater fracture
conductivity. The Nubian sandstone is found at depths exceeding 12,000 ft, and the
ceramic proppant is preferred in this high stress situation. Based on these considerations
three hydraulic fracture design cases were evaluated for ceramic proppant as a constant,
but varying types of frac fluids.
Cases # Proppant
Name Fluid Name
Pump Rate(BPM)
Slurry Volume (BBl)
Pump Stages
Proppant Conc
Total time (min) (PPg)
7 Carbo L 20-40 F300 Gel 25 1357 11 7 55
8 Carbo L 16-20 F300 Gel 25 1350 8 7 54
9 Carbo L 12-18 F300 Gel 25 2046 10 7 82

64
Figure 4.15. Proppant conductivity of Carbo Lite ceramic
Carbo Lite Ceramic Cases 10-13. Cases 10-13 all use 20-40 Carbo Lite
ceramic proppant, but vary the type of frac fluid. Four fracture fluids types were selected
for this evaluation based on formation properties and cost. Each frac fluid type has a
different pump rate because the fluid viscosity and proppant carrying capacity are
significantly different.
In considering these different frac fluids it was important to evaluate fluid loss and
fluid efficiency. Fluid loss and fluid efficiency have a significant impact on fracture
morphology, even in tight sandstones such as the Nubian.
0
500
1000
1500
2000
2500
3000
3500
4000
0 50 100 150 200 250 300 350 400 450 500 550 600 650 700 750 800 850 900
KfW
(md-
ft)
Fracture Penetration (ft)
20-40
16-20
12-18
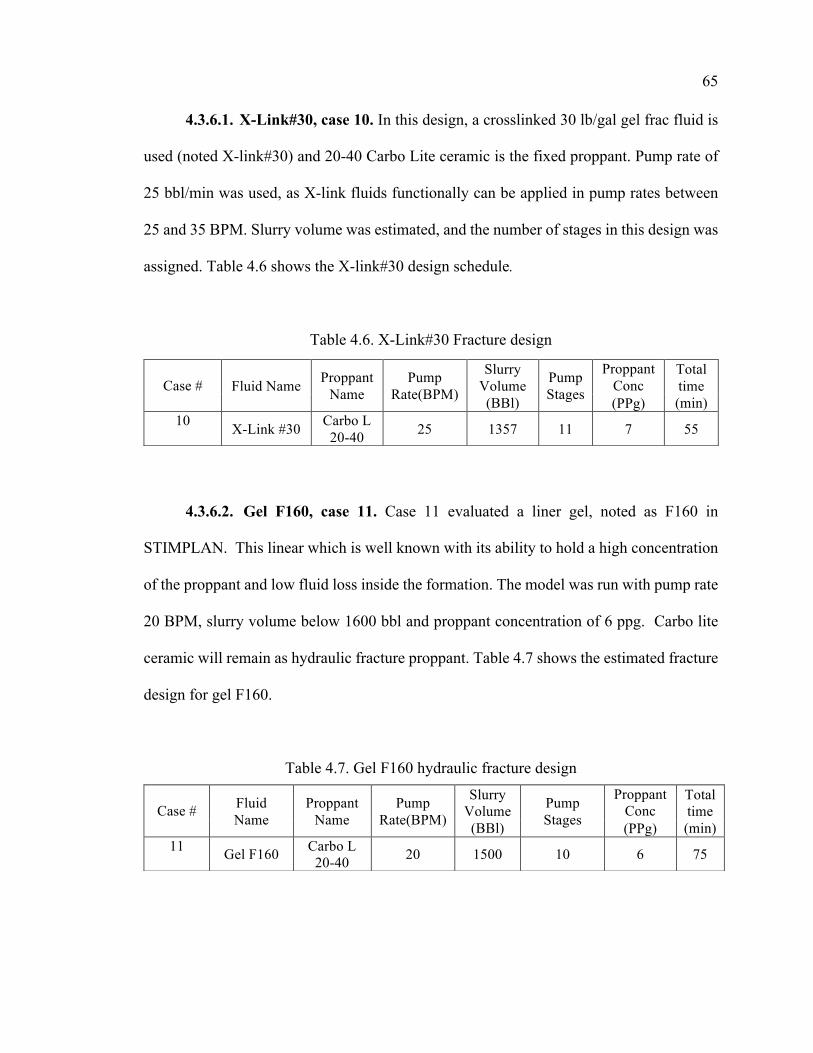
65
4.3.6.1. X-Link#30, case 10. In this design, a crosslinked 30 lb/gal gel frac fluid is
used (noted X-link#30) and 20-40 Carbo Lite ceramic is the fixed proppant. Pump rate of
25 bbl/min was used, as X-link fluids functionally can be applied in pump rates between
25 and 35 BPM. Slurry volume was estimated, and the number of stages in this design was
assigned. Table 4.6 shows the X-link#30 design schedule.
Table 4.6. X-Link#30 Fracture design
4.3.6.2. Gel F160, case 11. Case 11 evaluated a liner gel, noted as F160 in
STIMPLAN. This linear which is well known with its ability to hold a high concentration
of the proppant and low fluid loss inside the formation. The model was run with pump rate
20 BPM, slurry volume below 1600 bbl and proppant concentration of 6 ppg. Carbo lite
ceramic will remain as hydraulic fracture proppant. Table 4.7 shows the estimated fracture
design for gel F160.
Table 4.7. Gel F160 hydraulic fracture design
Case # Fluid Name Proppant
Name Pump
Rate(BPM)
Slurry Volume (BBl)
Pump Stages
Proppant Conc
Total time (min) (PPg)
10 X-Link #30 Carbo L 20-40 25 1357 11 7 55
Case # Fluid
Name Proppant
Name Pump
Rate(BPM)
Slurry Volume (BBl)
Pump Stages
Proppant Conc
Total time (min) (PPg)
11 Gel F160 Carbo L 20-40 20 1500 10 6 75
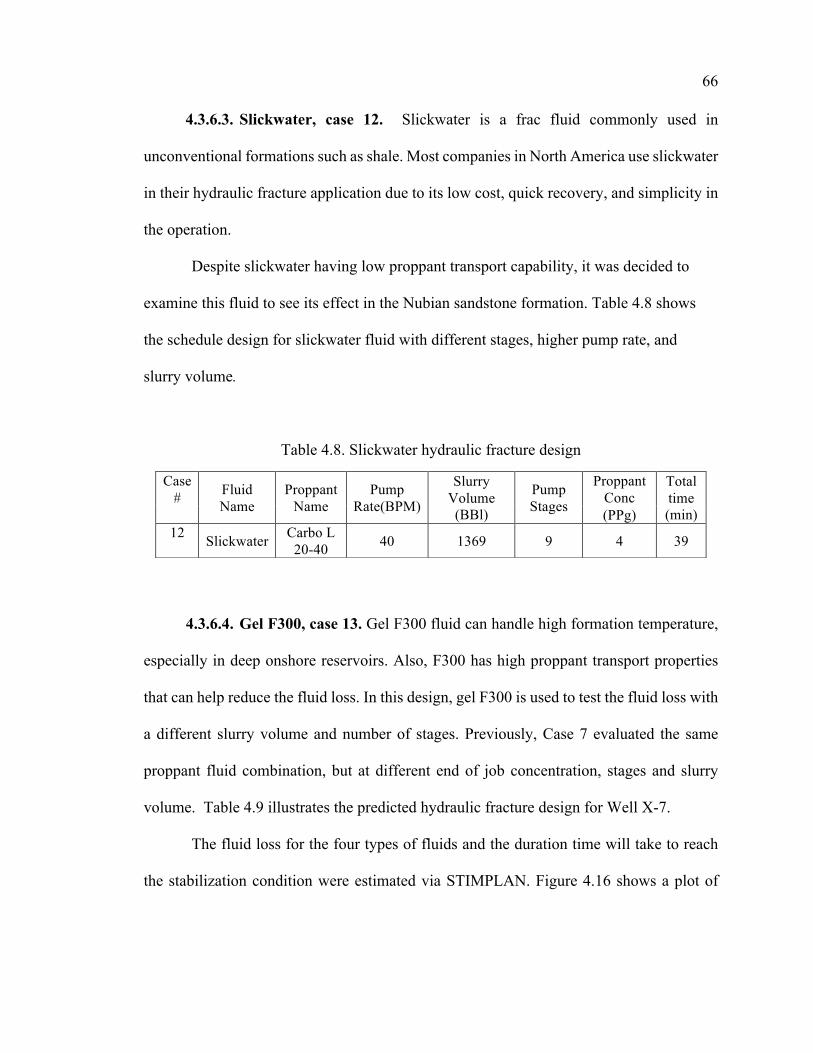
66
4.3.6.3. Slickwater, case 12. Slickwater is a frac fluid commonly used in
unconventional formations such as shale. Most companies in North America use slickwater
in their hydraulic fracture application due to its low cost, quick recovery, and simplicity in
the operation.
Despite slickwater having low proppant transport capability, it was decided to
examine this fluid to see its effect in the Nubian sandstone formation. Table 4.8 shows
the schedule design for slickwater fluid with different stages, higher pump rate, and
slurry volume.
Table 4.8. Slickwater hydraulic fracture design
4.3.6.4. Gel F300, case 13. Gel F300 fluid can handle high formation temperature,
especially in deep onshore reservoirs. Also, F300 has high proppant transport properties
that can help reduce the fluid loss. In this design, gel F300 is used to test the fluid loss with
a different slurry volume and number of stages. Previously, Case 7 evaluated the same
proppant fluid combination, but at different end of job concentration, stages and slurry
volume. Table 4.9 illustrates the predicted hydraulic fracture design for Well X-7.
The fluid loss for the four types of fluids and the duration time will take to reach
the stabilization condition were estimated via STIMPLAN. Figure 4.16 shows a plot of
Case # Fluid
Name Proppant
Name Pump
Rate(BPM)
Slurry Volume (BBl)
Pump Stages
Proppant Conc
Total time (min) (PPg)
12 Slickwater Carbo L 20-40 40 1369 9 4 39

67
fluid loss versus time for the four frac fluids evaluated in cases 10-13. As shown,
slickwater has high fluid loss compared to the gel frac fluids.
Table 4.9. Gel 300F hydraulic fracture design
The erratic pressure response of slickwater shown in Figure 4.16 is of an indication
that the fracture was refusing higher proppant concentration. This might have been due to
near wellbore tortuosity. Spontaneous pressure drops were interpreted to correlate to
sudden height growth that occurs when the fracture breaks another stress barrier such as
shale beds.
In the slickwater case, proppant concentration during pumping was kept between 5
to 8 lb/gal in order to place the maximum amount of proppant in the fracture. There was
some indication of tip screenout action, which might occur late during in the pumping
schedule.
Most of the pressure data provided were also imported to STIMPLAN for analysis.
During the treatment, there were no bottomhole gauges in the well and bottomhole pressure
can only be estimated with approximated friction losses. Friction losses may be significant
as the treatment is pumped down the casing.
Closure stress was estimated by company-M from their software analysis of the
pressure fall off data. Their estimation of closure stress was approximately 7,188 psi. A
Case # Fluid
Name Proppant Name
Pump Rate(BPM)
Slurry Volume (BBl)
stages Proppant Conc
Total time (min) (PPg)
13 Gel F300 Carbo L 20-40 25 2116 13 8 124.7

68
mathematical estimation of the closure stress was performed for comparison, using Eaton’s
equation, which was 7,095 psi:
(3)
Figure 4.16. Fluid loss for different kinds of fracture fluid
where,
= minimum horizontal stress
n = Poisson’s ratio
Pres = Reservoir pressure
Ptectonic = Strain component of the stress
)( tectonicresresvh Pppvv
++-÷øö
çèæ-
= ss1min
0
1
2
3
4
5
6
7
0 500 1000 1500 2000
Loss
rate
(bbl
)
Time (min)
Gel F300
X-Link#30
Slickwater
Gel F160
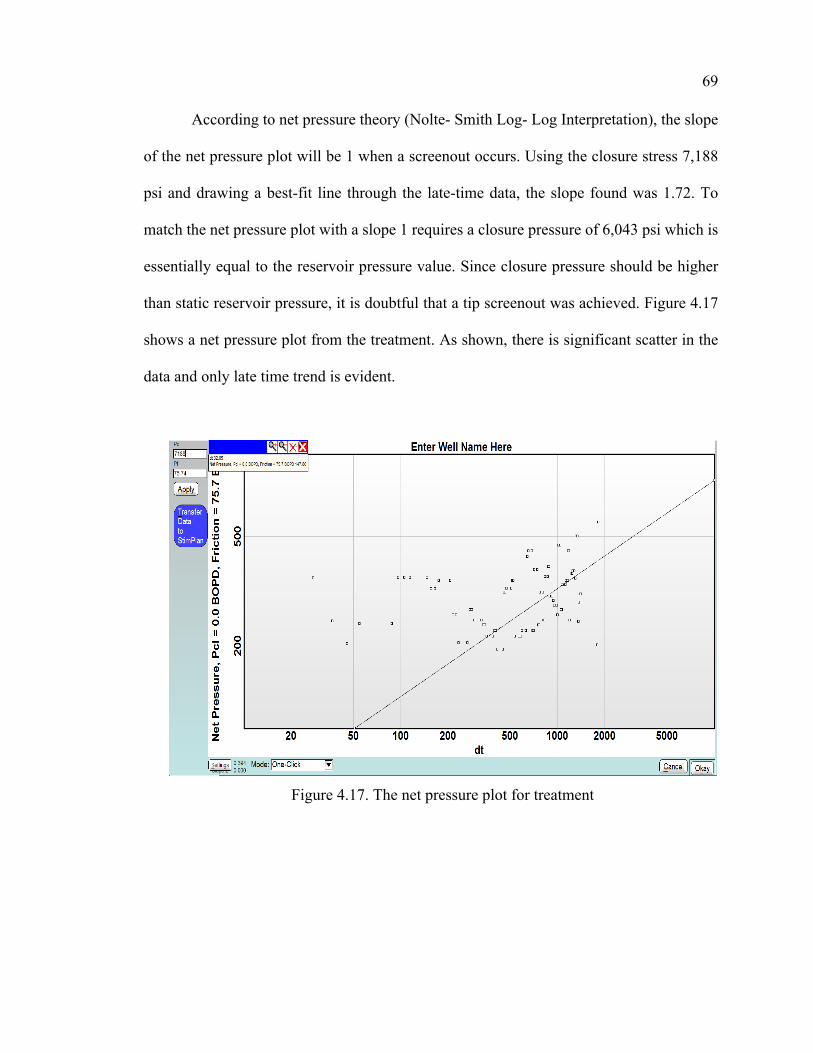
69
According to net pressure theory (Nolte- Smith Log- Log Interpretation), the slope
of the net pressure plot will be 1 when a screenout occurs. Using the closure stress 7,188
psi and drawing a best-fit line through the late-time data, the slope found was 1.72. To
match the net pressure plot with a slope 1 requires a closure pressure of 6,043 psi which is
essentially equal to the reservoir pressure value. Since closure pressure should be higher
than static reservoir pressure, it is doubtful that a tip screenout was achieved. Figure 4.17
shows a net pressure plot from the treatment. As shown, there is significant scatter in the
data and only late time trend is evident.
Figure 4.17.
The net pressure plot for treatment
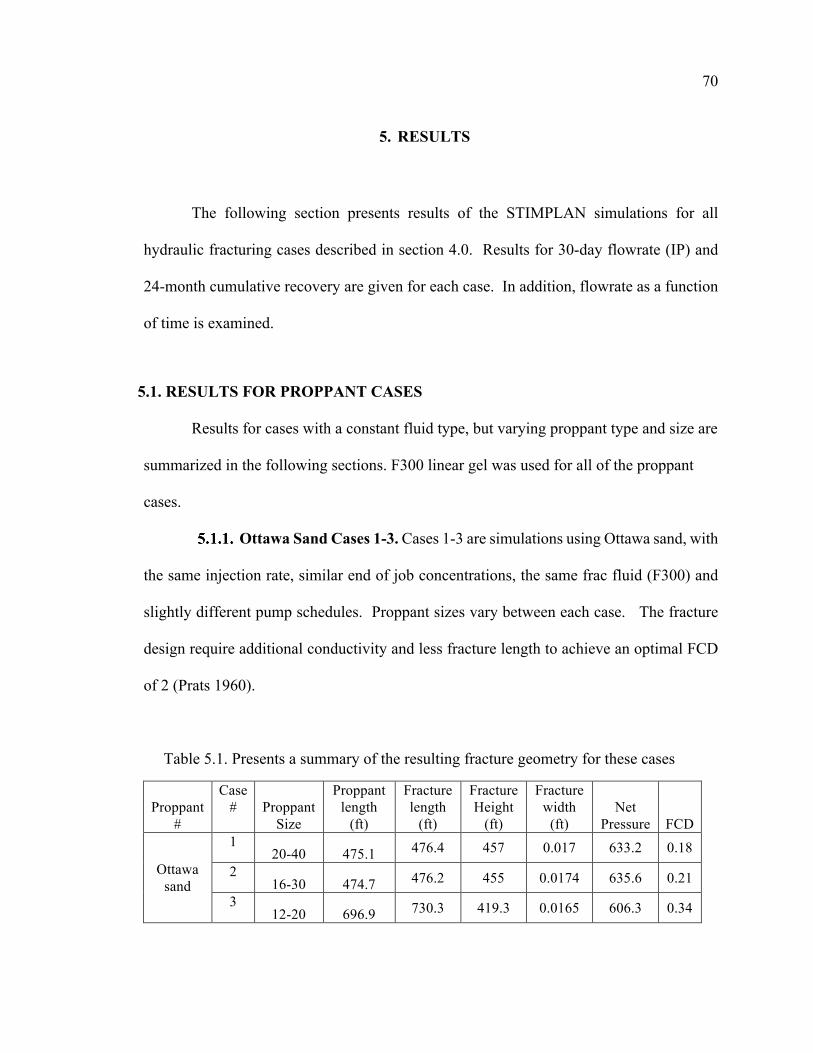
70
5. RESULTS
The following section presents results of the STIMPLAN simulations for all
hydraulic fracturing cases described in section 4.0. Results for 30-day flowrate (IP) and
24-month cumulative recovery are given for each case. In addition, flowrate as a function
of time is examined.
5.1. RESULTS FOR PROPPANT CASES
Results for cases with a constant fluid type, but varying proppant type and size are
summarized in the following sections. F300 linear gel was used for all of the proppant
cases.
Ottawa Sand Cases 1-3. Cases 1-3 are simulations using Ottawa sand, with
the same injection rate, similar end of job concentrations, the same frac fluid (F300) and
slightly different pump schedules. Proppant sizes vary between each case. The fracture
design require additional conductivity and less fracture length to achieve an optimal FCD
of 2 (Prats 1960).
Table 5.1. Presents a summary of the resulting fracture geometry for these cases
Proppant #
Case # Proppant
Size
Proppant length
(ft)
Fracture length
(ft)
Fracture Height
(ft)
Fracture width
(ft) Net
Pressure FCD
Ottawa sand
1 20-40 475.1 476.4 457 0.017 633.2 0.18
2 16-30 474.7 476.2 455 0.0174 635.6 0.21
3 12-20 696.9 730.3 419.3 0.0165 606.3 0.34

71
Table 5.1 STIMPLAN fracture dimensions created for Cases 1-3 Figure 5.1
presents plots of flowrate versus time and Figure 5.2 presents a summary of 24-month
cumulative production for the Cases 1-3.
Figure 5.1. Cases 1-3 production rate versus time for 24 months
The IP for the three proppant sizes were 2844 BOPD for Ottawa 20-40, 2292 BOPD
for Ottawa 16-30 and 3705 BOPD for Ottawa 12-20.
The 24 month cumulative production was found to be 478.2 MBO for Ottawa 20-
40, 457.3 MBO for Ottawa 16-30 and 474.3 MBO for Ottawa 12-20.
F300 Fluid, Brady Sand Cases 4-6. Cases 4-6 are simulations using
Brady sand, with the same injection rate, similar end of job concentrations, the same frac
fluid (F300) and slightly different pump schedules. Proppant sizes vary between each case.
The fracture design require additional conductivity and less fracture length to achieve an
optimal FCD of 2 (Prats 1960).
0
500
1000
1500
2000
2500
3000
3500
4000
0 5 10 15 20 25 30
Rat
e (B
OPD
)
Time (months)
20-40
16-30
12-20*
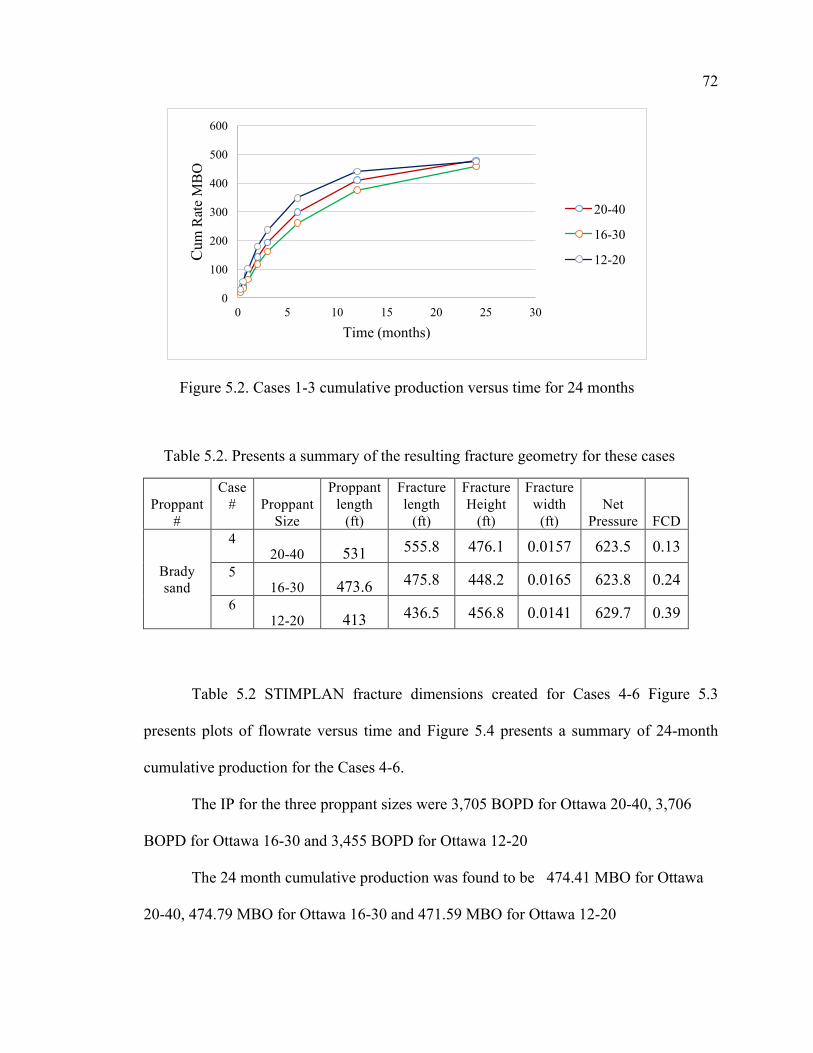
72
Figure 5.2. Cases 1-3 cumulative production versus time for 24 months
Table 5.2. Presents a summary of the resulting fracture geometry for these cases
Proppant #
Case # Proppant
Size
Proppant length
(ft)
Fracture length
(ft)
Fracture Height
(ft)
Fracture width
(ft) Net
Pressure FCD
Brady sand
4 20-40 531 555.8 476.1 0.0157 623.5 0.13
5 16-30 473.6 475.8 448.2 0.0165 623.8 0.24
6 12-20 413 436.5 456.8 0.0141 629.7 0.39
Table 5.2 STIMPLAN fracture dimensions created for Cases 4-6 Figure 5.3
presents plots of flowrate versus time and Figure 5.4 presents a summary of 24-month
cumulative production for the Cases 4-6.
The IP for the three proppant sizes were 3,705 BOPD for Ottawa 20-40, 3,706
BOPD for Ottawa 16-30 and 3,455 BOPD for Ottawa 12-20
The 24 month cumulative production was found to be 474.41 MBO for Ottawa
20-40, 474.79 MBO for Ottawa 16-30 and 471.59 MBO for Ottawa 12-20
0
100
200
300
400
500
600
0 5 10 15 20 25 30
Cum
Rat
e M
BO
Time (months)
20-40
16-30
12-20
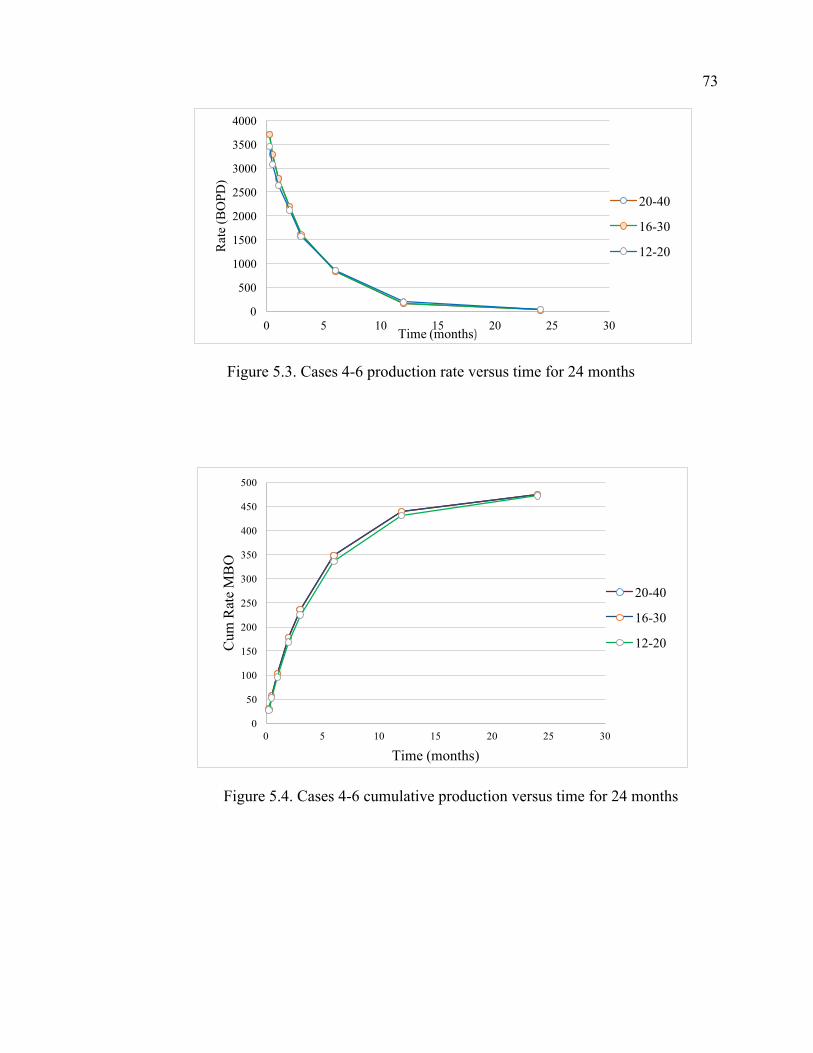
73
Figure 5.3. Cases 4-6 production rate versus time for 24 months
Figure 5.4. Cases 4-6 cumulative production versus time for 24 months
0
500
1000
1500
2000
2500
3000
3500
4000
0 5 10 15 20 25 30
Rat
e (B
OPD
)
Time (months)
20-40
16-30
12-20
0
50
100
150
200
250
300
350
400
450
500
0 5 10 15 20 25 30
Cum
Rat
e M
BO
Time (months)
20-40
16-30
12-20
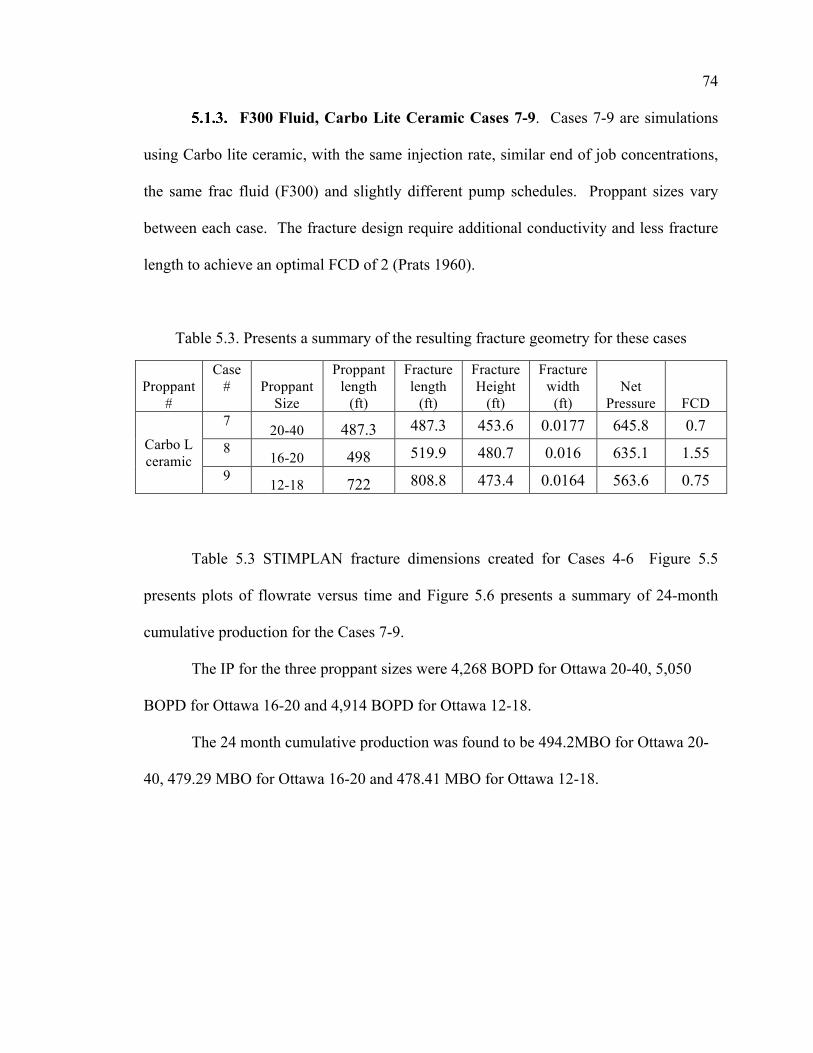
74
F300 Fluid, Carbo Lite Ceramic Cases 7-9. Cases 7-9 are simulations
using Carbo lite ceramic, with the same injection rate, similar end of job concentrations,
the same frac fluid (F300) and slightly different pump schedules. Proppant sizes vary
between each case. The fracture design require additional conductivity and less fracture
length to achieve an optimal FCD of 2 (Prats 1960).
Table 5.3. Presents a summary of the resulting fracture geometry for these cases
Proppant #
Case # Proppant
Size
Proppant length
(ft)
Fracture length
(ft)
Fracture Height
(ft)
Fracture width
(ft) Net
Pressure FCD
Carbo L ceramic
7 20-40 487.3 487.3 453.6 0.0177 645.8 0.7
8 16-20 498 519.9 480.7 0.016 635.1 1.55
9 12-18 722 808.8 473.4 0.0164 563.6 0.75
Table 5.3 STIMPLAN fracture dimensions created for Cases 4-6 Figure 5.5
presents plots of flowrate versus time and Figure 5.6 presents a summary of 24-month
cumulative production for the Cases 7-9.
The IP for the three proppant sizes were 4,268 BOPD for Ottawa 20-40, 5,050
BOPD for Ottawa 16-20 and 4,914 BOPD for Ottawa 12-18.
The 24 month cumulative production was found to be 494.2MBO for Ottawa 20-
40, 479.29 MBO for Ottawa 16-20 and 478.41 MBO for Ottawa 12-18.

75
5.2. RESULTS FOR FLUID CASES
Results for cases with a constant proppant type and size, but varying fluid types are
summarized in the following sections. Carbo lite ceramic 20-40 proppant have been used
in all cases.
Figure 5.5. Cases 7-9 production rate versus time for 24 months
Carbo L Ceramic, XL-30#, Case 10. Figure 5.7 shows a 2-D prediction
of fracture growth if cross linked 30 lb/gal frac fluid and carbo lite ceramic 20-40. The
injection rate is 25 bpm, end of job concentration is 7 lb/gal and 11 pump stages were used.
Cross linked frac fluids provide high viscosity and the capacity to carry higher proppant
concentrations
0
1000
2000
3000
4000
5000
6000
0 5 10 15 20 25 30
Rat
e B
OPD
Time (months)
20-40
16-20
12-18*
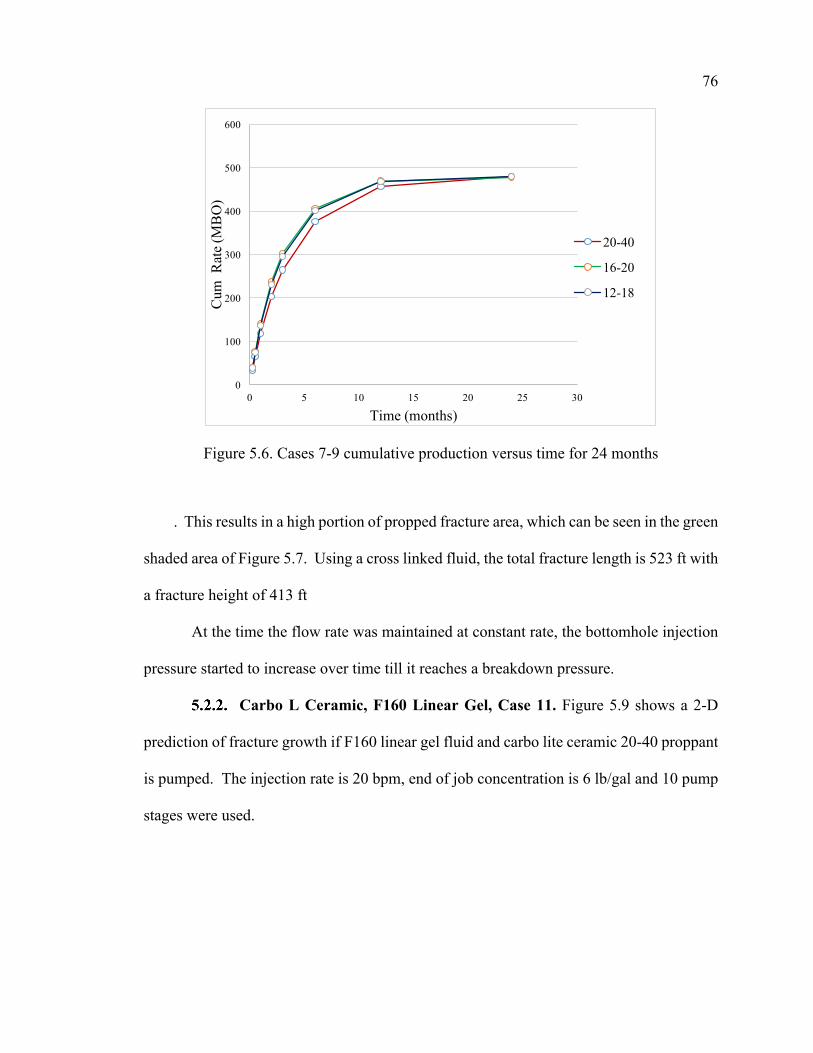
76
Figure 5.6. Cases 7-9 cumulative production versus time for 24 months
. This results in a high portion of propped fracture area, which can be seen in the green
shaded area of Figure 5.7. Using a cross linked fluid, the total fracture length is 523 ft with
a fracture height of 413 ft
At the time the flow rate was maintained at constant rate, the bottomhole injection
pressure started to increase over time till it reaches a breakdown pressure.
Carbo L Ceramic, F160 Linear Gel, Case 11. Figure 5.9 shows a 2-D
prediction of fracture growth if F160 linear gel fluid and carbo lite ceramic 20-40 proppant
is pumped. The injection rate is 20 bpm, end of job concentration is 6 lb/gal and 10 pump
stages were used.
0
100
200
300
400
500
600
0 5 10 15 20 25 30
Cum
Rat
e (M
BO
)
Time (months)
20-40
16-20
12-18

77
Figure 5.7. 2-D fracture morphology summary plot of the X-link #30 design
Linear gels have less viscosity than cross linked fluids, and less capacity to carry
higher proppant concentrations. Despite this, there is a high portion of propped fracture
area over a majority of the total fracture area, which can be seen in the green shaded area
of Figure 5.7. Using a F160 linear gel fluid, the total fracture length is 596 ft with a fracture
height of 500 ft.
Carbo L Ceramic, Slickwater, Case 12. Figure 5.11 shows a 2-D
prediction of fracture growth if slickwater frac fluid pumped with carbo lite ceramic 20-40
proppant.
X
Fracture Penetration (ft)100 200 300 400 500
1079.30 minTVDft
12600
12700
12800
12900
13000
Stress (psi)7500 8500 9500
Oil
Silt
y
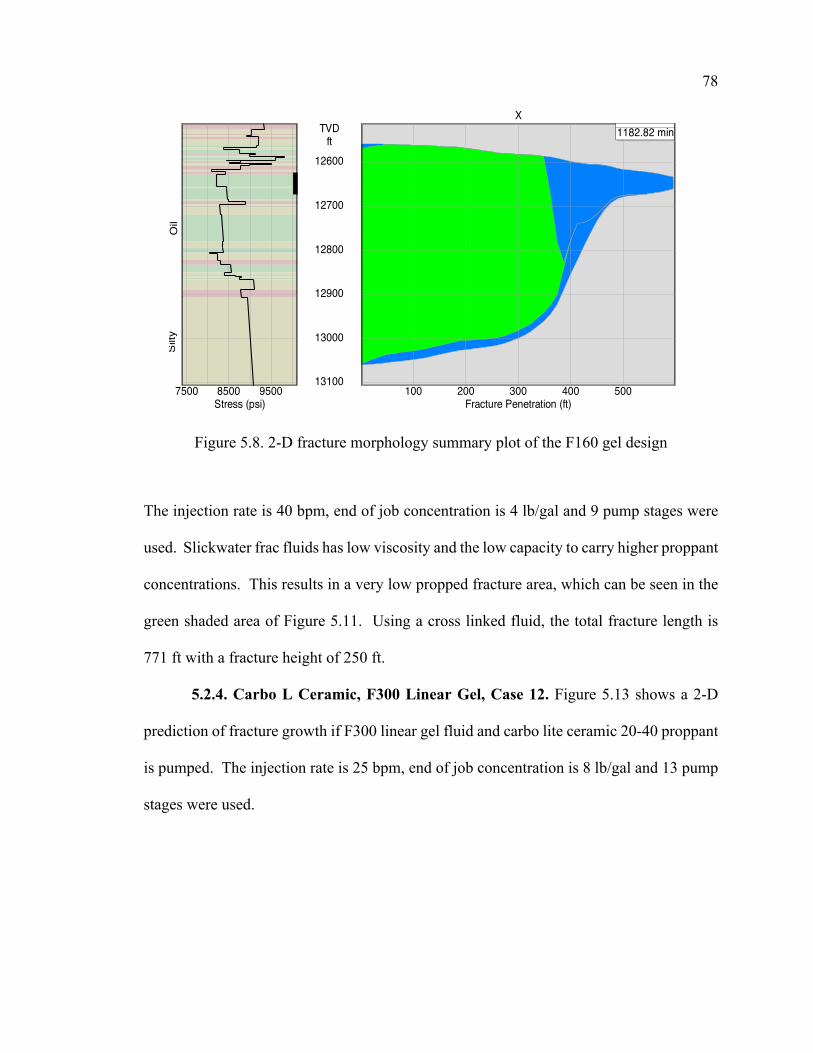
78
Figure 5.8. 2-D fracture morphology summary plot of the F160 gel design
The injection rate is 40 bpm, end of job concentration is 4 lb/gal and 9 pump stages were
used. Slickwater frac fluids has low viscosity and the low capacity to carry higher proppant
concentrations. This results in a very low propped fracture area, which can be seen in the
green shaded area of Figure 5.11. Using a cross linked fluid, the total fracture length is
771 ft with a fracture height of 250 ft.
5.2.4. Carbo L Ceramic, F300 Linear Gel, Case 12. Figure 5.13 shows a 2-D
prediction of fracture growth if F300 linear gel fluid and carbo lite ceramic 20-40 proppant
is pumped. The injection rate is 25 bpm, end of job concentration is 8 lb/gal and 13 pump
stages were used.
X
Fracture Penetration (ft)100 200 300 400 500
1182.82 minTVDft
12600
12700
12800
12900
13000
13100
Stress (psi)7500 8500 9500
Oil
Silt
y
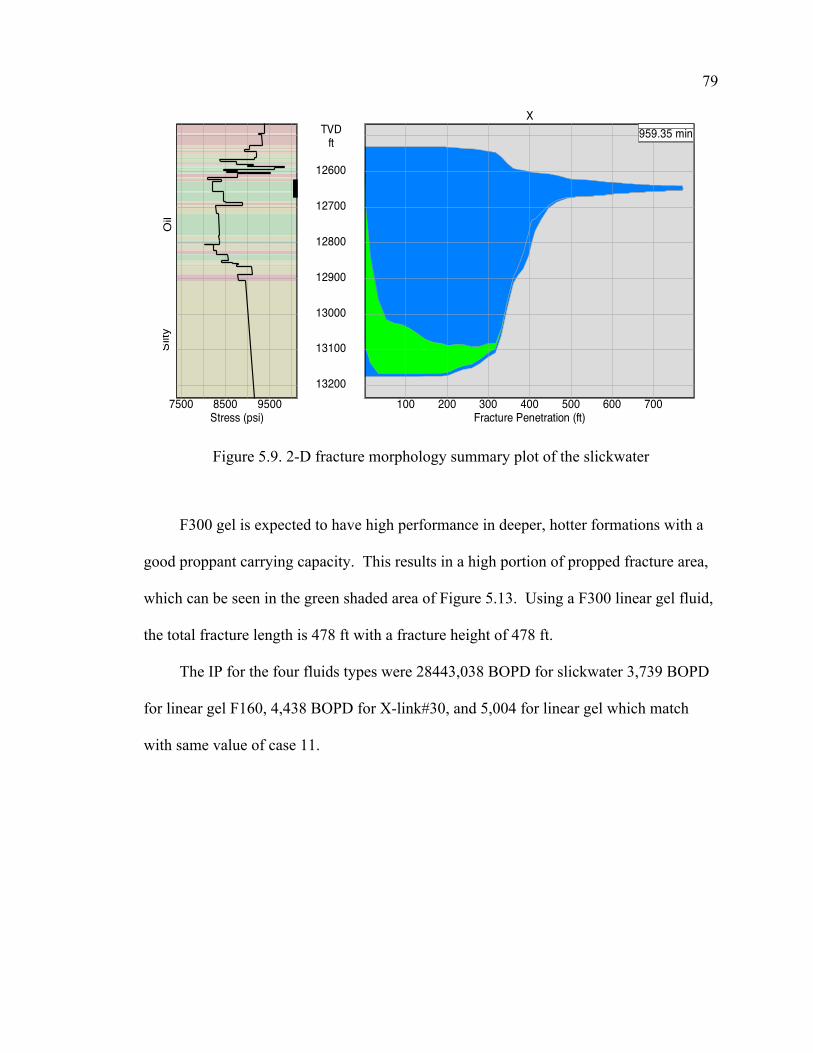
79
Figure 5.9. 2-D fracture morphology summary plot of the slickwater
F300 gel is expected to have high performance in deeper, hotter formations with a
good proppant carrying capacity. This results in a high portion of propped fracture area,
which can be seen in the green shaded area of Figure 5.13. Using a F300 linear gel fluid,
the total fracture length is 478 ft with a fracture height of 478 ft.
The IP for the four fluids types were 28443,038 BOPD for slickwater 3,739 BOPD
for linear gel F160, 4,438 BOPD for X-link#30, and 5,004 for linear gel which match
with same value of case 11.
X
Fracture Penetration (ft)100 200 300 400 500 600 700
959.35 minTVDft
12600
12700
12800
12900
13000
13100
13200
Stress (psi)7500 8500 9500
Oil
Silt
y

80
Figure 5.10. 2-D fracture morphology summary plot of the F300 linear gel design
Figure 5.11. Cases 10-12 production rate versus time for 24 months
X
Fracture Penetration (ft)100 200 300 400
991.92 minTVDft
12700
12800
12900
13000
Stress (psi)7500 8500 9500
Oil
Silty
0
1000
2000
3000
4000
5000
6000
0 5 10 15 20 25 30
Prod
uctio
n ra
te (b
b/D
)
Time (months)
Gel F300
X-link#30 Gel F160
Slickwater
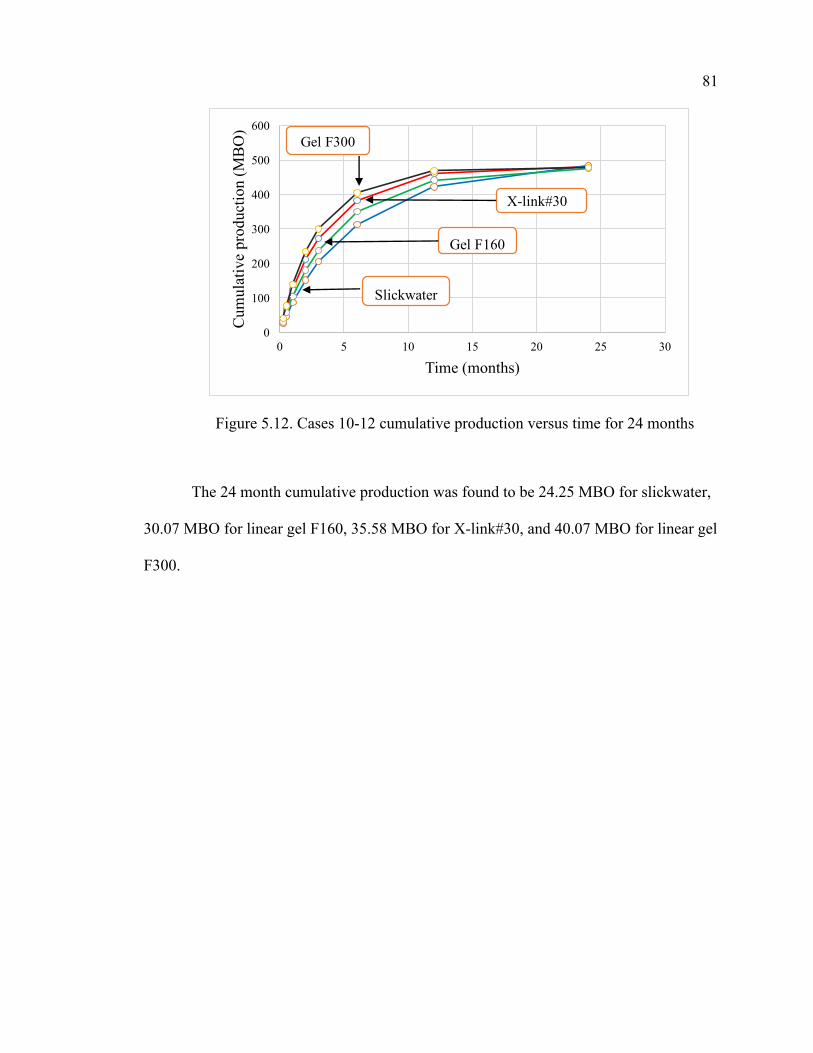
81
Figure 5.12. Cases 10-12 cumulative production versus time for 24 months
The 24 month cumulative production was found to be 24.25 MBO for slickwater,
30.07 MBO for linear gel F160, 35.58 MBO for X-link#30, and 40.07 MBO for linear gel
F300.
0
100
200
300
400
500
600
0 5 10 15 20 25 30
Cum
ulat
ive
prod
uctio
n (M
BO
)
Time (months)
X-link#30
Gel F160
Slickwater
Gel F300
82
6. DISCUSSION
Thirteen different cases were evaluated in this study to determine an optimum
hydraulic fracture design for the Nubian sandstone in Libya. These cases focused on
stimulating only the Lower Nubian sandstone in a single treatment. Results of these
cases compare IP and 24 month cumulative recovery for these cases.
This analysis indicates that while many fracturing alternatives produce similar
fracture geometry, the combination of F300 gel with 20-40 Carbo Lite proppant suggests
the highest fracture conductivity and production performance. All cases evaluated have
low values of FCD suggesting that conductivity could be increased.
It should be noted that economics have not been considered in this study. Ideally
the highest production at lowest cost will produce the greatest economic benefit.
However, in this study, only cumulative production has been considered.
The Nubian sandstone is found at significant depths of greater than 12,000 ft. It
should be noted that regardless of the fluid selected for treatment, ceramic proppant will
provide a greater strength and resistance to crushing than sand. Given the fracture
conductivity of ceramic proppant is three times that of all cases using sand, it is likely
this will be of greatest benefit even if economic analysis is included.
83
7. CONCLUSIONS AND FUTURE WORK
The following conclusions can be made from this research and evaluation:
1. Libya contains significant ‘unconventional’ oil and gas reserves found in mid-range
permeability such as the Nubian sandstone, to ultra-tight shale formations.
2. The H-field demonstrated potential for development of the Nubian sandstone, although
well stimulation has been delayed for various reasons
3. Log analysis indicates 71 feet of pay in the Upper Nubian sandstone and 295 feet in the
Lower Nubian. This mean lower Nubian formation is almost four times thicker than
upper Nubian formation and was selected as the focus of the stimulation design.
4. This study utilized reservoir, fluid, pressure and production data to build a STIMPLAN
model for well X-7 in the Nubian sandstone, from which various hydraulic fracturing
alternatives are evaluated.
5. Thirteen cases evaluated hydraulic fracturing alternatives for different frac fluids,
proppant type and proppant sizes. All cases evaluated had low FCD and could benefit
from increased conductivity.
6. Ceramic proppant provides the best fracture conductivity regardless of the type of
fracturing fluid used. However, slickwater showed a poor propped fracture area with
slickwater.
7. F300 linear gel and 20-40 Carbo Lite proppant provide an excellent recovery for the
perforations assumed in the middle layer of the Lower Nubian sandstone.
8. This study has evaluated fracturing alternatives based on well production and 24-month
cumulative recovery. Economics have not been considered.
84
• FUTURE WORK
The following additional work is suggested to further advance the current
study of hydraulic fracturing in the Nubian sandstone in Libya:
• It is suggested that an economic analysis be performed in addition to the hydraulic
fracture modeling. This would provide a more complete comparison of the cases.
• This study includes 13 cases which combine different types of fracture fluids,
proppant type and size. Future work could consider a wider range of choices in the
many variables of hydraulic fracture design, and particularly investigate higher
conductivity with resulting FCD closer to 2.0.
• Future designs should consider an approach for stimulating both the Upper and
Nubian sandstone formations, even if in separate treatments.
• Other fields in Libya which have unconventional reservoirs should be considered for
analysis in the future.

85
BIBLIOGRAPHY
1. Aadnoy, B. S., and Belayneh, M. 2004. Elasto-plastic fracturing model for wellborestability using non-penetrating fluids. Journal of Petroleum Science and Engineering,45, 179-192.
2. Adachi, J., E. Siebrits, A. Peirce, and J. Desroches. 2007. Computer simulation ofhydraulic fractures. International Journal of Rock Mechanics and Mining Sciences.44: 739-757.
3. Baig, A. M., and T. I. Urbancic, 2015. “Evolution of Stress During Hydraulic FractureCompletions”, SEG Technical Program New Orleans Annual Meeting.
4. Barker, L. M., 1977, "A Simplified Method for Measuring Plane Strain FractureToughness," Engineering Fracture Mechanics, Vol. 9, pp. 361-369.
5. Britt, L., Smith, M., Haddad, Z., & Lawrence, P. 2006. A Multidisciplinary Approachof Multiple Fractured Transverse Horizontal Wells vs Longitudinal Wells in Tight andUnconventional Reservoir with Stress Dependent Permeability. SPE Asia HydraulicFracture Conference held in Beijing, China, 24-26 August 2016.
6. Hydraulic Fracturing in the South Texas Wilcox Formation. SPE 102226, Presented atSPE Annual Technical Conference and Exhibition, 24-27 September 2006, SanAntonio, Texas.
7. Camilo Moreno, Yashwanth Chitrala*, Carl Sondergeld and Chandra Rai; "Laboratorystudies of hydraulic fractures in tight sands at different applied stresses", SEG AnnualFall Meeting of the SEG San Antonio, TX. 2011.
8. D.B. van Dam, (2000), “Impact of Rock Plasticity on Hydraulic Fracture Propagationand Closure”, SPE Paper Proc. 63172 SPE Annual Technical Conference and Exhibitionheld in Dallas, Texas, 1–4 October 2000.
9. David R. Underdown. “New Proppant for Deep Hydraulic Fracturing,” SPE, ARCO Oiland Gas Co. Kamalendu Das, SPE, Baker Sand Control, Houston, Oct. 1-3, 1982.
10. Danh Huu Nguyen and Wisup Bae. “Design Optimization of Hydraulic Fracture forOligocene Reservoir in Offshore Vietnam”. International Petroleum TechnologyConference, Beijing, China, 26-28 March 2013.

86
11. Edres A. Abualkhir1, 2013. Libya and the Great Challenges of Overcoming Difficultiesto Exploring and Producing Shale Gas, and Tight Reservoirs (Sandstone) Potential.Geology of Al Kufrah Basin, Libya, in M.J. Salem, A.M. Sbeta, and M.R. Bakbak, eds.,The Geology of Libya, Elsevier, Amsterdam. Search and Discovery Article #10850.
12. E.R. Freeman, D.A. Anschutz, and J.J. Renkes.” Qualifying Proppant Performance”.Annual Technical Conference and Exhibition, San Antonio, Texas, 24-27 March2009.
13. F. H. RIXE, C. R. FAST, and G. C. HOWAR: Selection of Propping Agents forHydraulic Fracturing, spring meeting of the Rocky Mountain District, API Divisionof Production, TuLAS, Oklahoma, April 1963.
14. Friehauf, K.E., and Sharma M.M. 2009. Fluid Selection for Energized HydraulicFracture. SPE paper 124361 presented at the 2009 SPE Annual Technical Conferenceand Exhibition held in New Orleans, Louisiana, 4-7 October.
15. Gabris, S.J., and Taylor, JL. III. 1986. The Utility of CO2 as an Energized Componentfor Fracture Fluid, SPE Production Engineering, 1-3 September.
16. H. Gu, J. Desroches and J.L. Elbel. “Computer Simulation of Multilayer HydraulicFractures”. SPE International Oil and Gas Conference and Exhibition in Beijing,China, 7–10 November 2000.
17. Hayate Ohtani*, Hitoshi Mikada, Junichi Takekawa B. Hagemann, J. Wegner, and L.Ganzer “Hydraulic fracturing simulation in different differential stresses andanisotropic media”, SEG International Exposition and 87th Annual Meeting, Houston,TX, 2017.
18. Holditch, S.A., and Ely, J. “Successful Stimulation of deep Wells Using HighProppant Concentration” JPT, August 1973.
19. John E. Smith: “Design of Hydraulic Fracture Treatment”, 40th Annual Fall Meetingof the Society of Petroleum Engineer, Dallas, Texas, 1965.
20. M. Sarmadivaleh, V. Rasouli &W. Ramses. “Numerical simulations of hydraulicfracture intersecting an interbed of sandstone”. Harmonising Rock Engineering andthe Environment – Qian & Zhou (eds). 2012 Taylor & Francis Group, London, ISBN978-0-415-80444-8
21. Mazza, R.L. 2001. Liquid-Free CO2/Sand Stimulation: An Overlooked Technology-Production Update. Paper SPE 72383 presented at the SPE Eastern Regional Meeting,Canton, Ohio, 17-19 October.

87
22. Michael J. Economides, K. G. (2000). Reservoir Stimulation, 3rd Edition .Chichester, West Sussex: John Wiley & Sons Ltd.Gandossi, L. (2013).
23. Miller, C., Hamilton, D., Sturm, S., Waters, G., Taylor, T., Le Calvez, J., and Singh,
M. 2013. Evaluating the Impact of Mineralogy, Natural Fractures and In Situ Stresses on Hydraulically Induced Fracture System Geometry in Horizontal Shale Wells. Presented at the SPE Hydraulic Fracturing Technology Conference, Woodlands, 4-6February, SPE-163878-MS.
24. Niranjan Bhore. An Investigation on Qualitative Analysis of Hydraulic Fracture
Simulation for Field Development Planning”. SPE Annual Technical Conference and Exhibition in San Antonio, 9-11 October 2017.
25. Patrick W. M. Corbett, and Noreddin I. A. Mousa. 2010. Petrotype-based Sampling
Applied in a Saturation Exponent Screening Study, Nubian Sandstone Formation, SirteBasin, Libya. Petrophysics, VOL. 51, NO. 4 (August 2010); P. 264-270.
26. Rubin, M. B•, 1983, "Experimental Study of Hydraulic Fracturing in an Impermeable
Material," Journal of Energy Resources Technology, Vol. 105, June, pp. 116-124.
27. Shlyapobersky, J., Energy Analysis of Hydraulic Fracturing. 1985. A. A. Balkema, Rotterdam.
28. Sharma et al.:” Slick Water and Hybrid Fracs in Bossier: some lessons learnt” SPE
89876. Annual Technical Conference and Exhibition, Houston, Texas, September 2004.
29. T.T. LESHCHYSHYN,” Field Results: Effect of Proppant Selection on Well
Productivity-Cardium Formation”, the Petroleum Society’s 6th Canadian International Petroleum Conference. 56th Annual Technical Meeting in Alberta, Canada, June 7 – 9, 2005.
30. Tinsley, J.M., Williams Jr., J.R., Tiner, R.L., Malone, W.T., 1969. Vertical fracture
heightIts effect on steady-state production increase. J. Pet. Technol. 21 (5), 633-638.
31. Wang Wenjun, 2010. “Hydraulic Fracture in Low Temperature Horizontal Wells: A Case Study from Daqing Oil Field, China.” SPE 127266. This paper was prepared for presentation at the SPE oil and gas in India conference and exhibition held in Mumbai, India 20-22 January 2010.
32. Willis, M. H. (1957).Mechanics of Hydraulic Fracturing. Petroleum Branch Fall
Meeting (pp. 153-168). Los Angeles: Petroleum Transactions, AIME, Vol. 210, 1957.

88
33. Wright, T.B and D.E. Johnson, "Real-Data On-Site Analysis of Hydraulic Fracturing Generates Optimum Procedures for Job Design and Execution", SPE Rocky Mountain Regional/Low Permeability Reservoirs Symposium held in Denver, CO, U.S.A., 12-14 April, 1993.
34. X.Zhang, SPE, and R.G.Jeffrey Effects of Frictional Geological Discontinuities on
Hydraulic Fracture Propagation. In Proceedings of the SPE 2007 Hydraulic Fracture Technology Conference held in college Station, Texas, U.S.A, 29-31 January 2007. SPE 106111.
35. Zourong Chen, Robert G. Jeffery, and James Kear.”Finite Element Simulation of
Hydraulic Fracture Interacting with a Natural Fracture”. SPE Asia Pacific Unconventional Resources Conference and Exhibition, Brisbana, Australia, 9-11 November 2015.
89
VITA
Housameddin Mohamed Sherif was born in 1985 in Tripoli, Libya. In August 2010,
he received his bachelor’s degree in petroleum engineer from University of Tripoli, Libya.
After graduation, he was employed by Mellitah Oil and Gas company (Mellitah oil
company, Libya) as production engineer from October 2011 to September 2012. He was
employed by ENI Company as reservoir engineer from September 2012 to April 2015. He
came to Missouri University of Science and Technology, Rolla, Missouri. He started to
pursue his master’s degree in Petroleum Engineering at Missouri University of Science and
Technology in June 2017. He joined Dr. Shari Dunn-Norman research group from January,
2017 and worked as a researcher in lab. He received his master’s degree in Petroleum
Engineering from Missouri University of Science and Technology in December 2018.