Hydrate Core Drilling Tests - Digital Library/67531/metadc740813/m2/1/high...Hydrate Core Drilling...
61
Hydrate Core Drilling Tests Topical Report Reporting Period: September 2002 by: John H. Cohen Thomas E. Williams MAURER TECHNOLOGY INC. Ali G. Kadaster Bill V. Liddell ANADARKO PETROLEUM CORP. November 2002 DE-FC26-01NT41331 Maurer Technology Inc. 2616 West T.C. Jester Houston, TX 77018 TR02-40
-
Upload
nguyenkiet -
Category
Documents
-
view
224 -
download
5
Transcript of Hydrate Core Drilling Tests - Digital Library/67531/metadc740813/m2/1/high...Hydrate Core Drilling...
Hydrate Core Drilling Tests
Topical Report
Reporting Period: September 2002
by:
John H. Cohen
Thomas E. Williams
MAURER TECHNOLOGY INC.
Ali G. Kadaster
Bill V. Liddell
ANADARKO PETROLEUM CORP.
November 2002
DE-FC26-01NT41331
Maurer Technology Inc.
2616 West T.C. Jester
Houston, TX 77018
TR02-40
DE-FC26-01NT41331 - ii - Maurer Technology Inc.
Disclaimer
This report was prepared as an account of work sponsored by an agency of the
United States Government. Neither the United States Government nor any agency
thereof, nor any of their employees, makes any warranty, express or implied, or
assumes any legal liability or responsibility for the accuracy, completeness, or
usefulness of any information, apparatus, product, or process disclosed, or represents
that its use would not infringe privately owned rights. Reference herein to any specific
commercial product, process, or service by trade name, trademark, manufacturer, or
otherwise does not necessarily constitute or imply its endorsement, recommendation, or
favoring by the United States Government or any agency thereof. The views and
opinions of authors expressed herein do not necessarily state or reflect those of the
United States Government or any agency thereof.

DE-FC26-01NT41331 - iii - Maurer Technology Inc.
Abstract
The “Methane Hydrate Production from Alaskan Permafrost” project is a three-
year endeavor being conducted by Maurer Technology Inc. (MTI), Noble, and Anadarko
Petroleum, in partnership with the U.S. DOE National Energy Technology Laboratory
(NETL). The project’s goal is to build on previous and ongoing R&D in the area of
onshore hydrate deposition. The project team plans to design and implement a
program to safely and economically drill, core and produce gas from arctic hydrates.
The current work scope includes drilling and coring one well on Anadarko leases
in FY 2003 during the winter drilling season. A specially built on-site core analysis
laboratory will be used to determine some of the physical characteristics of the hydrates
and surrounding rock. Prior to going to the field, the project team designed and
conducted a controlled series of coring tests for simulating coring of hydrate formations.
A variety of equipment and procedures were tested and modified to develop a practical
solution for this special application. This Topical Report summarizes these coring tests.
A special facility was designed and installed at MTI’s Drilling Research Center
(DRC) in Houston and used to conduct coring tests. Equipment and procedures were
tested by cutting cores from frozen mixtures of sand and water supported by casing and
designed to simulate hydrate formations. Tests were conducted with chilled drilling
fluids. Tests showed that frozen core can be washed out and reduced in size by the
action of the drilling fluid. Washing of the core by the drilling fluid caused a reduction in
core diameter, making core recovery very difficult (if not impossible). One successful
solution was to drill the last 6 inches of core dry (without fluid circulation). These tests
demonstrated that it will be difficult to capture core when drilling in permafrost or
hydrates without implementing certain safeguards.
Among the coring tests was a simulated hydrate formation comprised of coarse,
large-grain sand in ice. Results with this core showed that the viscosity of the drilling
fluid must also be carefully controlled. When coarse sand was being cored, the core
barrel became stuck because the drilling fluid was not viscous enough to completely
remove the large grains of sand. These tests were very valuable to the project by
showing the difficulties in coring permafrost or hydrates in a laboratory environment (as
DE-FC26-01NT41331 - iv - Maurer Technology Inc.
opposed to a field environment where drilling costs are much higher and the potential
loss of equipment greater).
Among the conclusions reached from these simulated hydrate coring tests are the
following:
Ø Frozen hydrate core samples can be recovered successfully
Ø A spring-finger core catcher works best for catching hydrate cores
Ø Drilling fluid can erode the core and reduces its diameter, making it more
difficult to capture the core
Ø Mud must be designed with proper viscosity to lift larger cuttings
Ø The bottom 6 inches of core may need to be drilled dry to capture the core
successfully
DE-FC26-01NT41331 - v - Maurer Technology Inc.
Table of Contents
Disclaimer .................................................................................................................................... ii
Abstract ....................................................................................................................................... iii
Table of Contents.......................................................................................................................v
List of Figures ............................................................................................................................vi
1. Introduction .........................................................................................................................1
1.1 Description of Effort .............................................................................................1
1.2 Background ...........................................................................................................1
1.3 Objectives ..............................................................................................................2
2. Core Test Equipment and Procedures.........................................................................3
2.1 Background ...........................................................................................................3
2.2 Drilling/Freezing Facility......................................................................................3
2.3 Coring Equipment.................................................................................................9
2.4 Drilling Fluid.........................................................................................................11
3. Coring Test Results.........................................................................................................12
3.1 Cylinders for Coring Tests ................................................................................12
3.2 Coring Results ....................................................................................................12
3.3 Summary..............................................................................................................15
4. Conclusions.......................................................................................................................17
5. References.........................................................................................................................18
Appendix A: Hydrate Test Coring Apparatus: Report on the Tests Conducted at
the Maurer’s Drilling Research Center (by The University of Oklahoma)
Appendix B: Hydrate Test Log
DE-FC26-01NT41331 - vi - Maurer Technology Inc.
List of Figures
Figure 1. Methane Hydrate ..................................................................................................... 1
Figure 2. Core Drilling/Freezing Facility Schematic............................................................ 4
Figure 3. Freezing Chamber................................................................................................... 4
Figure 4. Drilling Chamber ...................................................................................................... 5
Figure 5. Partially Frozen Simulated Hydrate Cylinder ...................................................... 6
Figure 6. OU Prototype Freezing Apparatus ........................................................................ 7
Figure 7. Liquid Nitrogen Tanks ............................................................................................. 7
Figure 8. Vacuum Filling Freezing Chamber ....................................................................... 8
Figure 9. Storing Simulated Hydrate Cylinder in Freezer Truck ....................................... 8
Figure 10. Environmental Coring Rig ...................................................................................... 9
Figure 11. Core Bits .................................................................................................................10
Figure 12. Core Catchers ........................................................................................................11
Figure 13. Drilling/Coring Operation ......................................................................................13
Figure 14. Ice Core...................................................................................................................14
Figure 15. Core from Sample with Coarse Number 1 Sand ..............................................15

DE-FC26-01NT41331 - 1 - Maurer Technology Inc.
1. Introduction
1.1 Description of Effort
This Topical Report provides a summary of facility preparation and core-drilling
tests conducted at the Drilling Research Center (DRC) in Houston, Texas in support of
the Department of Energy (NETL) Alaskan Hydrate drilling project. Anadarko Petroleum
and Maurer Technology are conducting this work under contract to the DOE. Funding is
provided by both the DOE and the participants, with the participants cost-sharing the
work at a rate of approximately 50%.
The purpose of this project is to plan, design and implement a program that will
safely and economically drill/core and produce natural gas from arctic hydrates. A
significant amount of research has been conducted on naturally occurring gas hydrates,
and the project team (Maurer, Anadarko and Noble) will adapt and apply laboratory
R&D and technology to hydrate wells in the field.
1.2 Background
Natural-gas hydrates (Figure 1) beneath the permafrost
have been encountered by the oil and gas industry for years.
Numerous drilling problems, including gas kicks and uncontrolled
gas releases, have been well documented in the arctic regions by
Russian, USA and Canadian engineers. Substantial reserves of
natural gas are present around the world in the form of frozen
hydrates. Hydrates are natural gas trapped in a frozen mixture of
water and earth. Conditions required for hydrates to form include
cold temperatures, such as at the bottom of the sea floor and in
arctic areas where permafrost exists. One such area is under the
tundra of Alaska. Figure 1. Methane Hydrate
DE-FC26-01NT41331 - 2 - Maurer Technology Inc.
Little is currently know about the best methods to drill through and produce
hydrates. It is the objective of this project to drill in Alaska in an area where hydrates
are believed to exist and to collect information to help in future production of this
resource. Core drilling will be employed on this project to maximize the amount of data
that can be collected and to study the hydrate material so that safe and effective drilling
and production methods can be developed for the future.
1.3 Objectives
The overall objectives of this gas-hydrate project are to:
1. Analyze existing geological and geophysical data and obtain new field
data required to predict hydrate occurrences
2. Test the best methods and tools for drilling and recovering hydrates
3. Plan, design, and implement a program to safely and economically drill
and produce gas from hydrates.
Prior to drilling/coring wells in Alaska, it was deemed necessary to conduct coring
tests in a controlled setting at the Drilling Research Center in Houston. Coring
equipment and procedures were tested by cutting cores from several frozen cylinders of
water and sand designed to simulate hydrates. Objectives including developing
methods for coring and retrieving frozen cores intact, as well as testing various bits,
core barrels, core catchers, and drilling fluids.
DE-FC26-01NT41331 - 3 - Maurer Technology Inc.
2. Core Test Equipment and Procedures
2.1 Background
A test facility was successfully designed and constructed at MTI’s Drilling
Research Center (DRC) in Houston and used to conduct a series of hydrate coring
tests. Coring equipment and procedures were tested by cutting cores from frozen
cylinders of water and sand designed to simulate hydrates. These test cylinders were
fabricated in a facility adjacent to the drilling site. Oklahoma University (OU) has
previously developed a method to freeze sand and water using liquid nitrogen as a
technique to simulate properties of permafrost and hydrate that will be drilled in Alaska.
A report (De Sousa, 2002) prepared by OU describing the development of this artificial
permafrost/hydrate is included in Appendix A.
The sample preparation method was transferred to the DRC where, with the
assistance and oversight of Dr. Joao Tadeu Vidal De Sousa (OU), seven simulated
hydrate mixtures were frozen in cylinders and cored during the tests. Composition of
the cylinders ranged from pure water, to water and sand. Two different sizes of sand
were used: medium and coarse grades. Core barrel design was also varied by
changing the liner, bit, and core catcher. This was done to determine the best
configuration for collecting frozen cores in the field.
2.2 Drilling/Freezing Facility
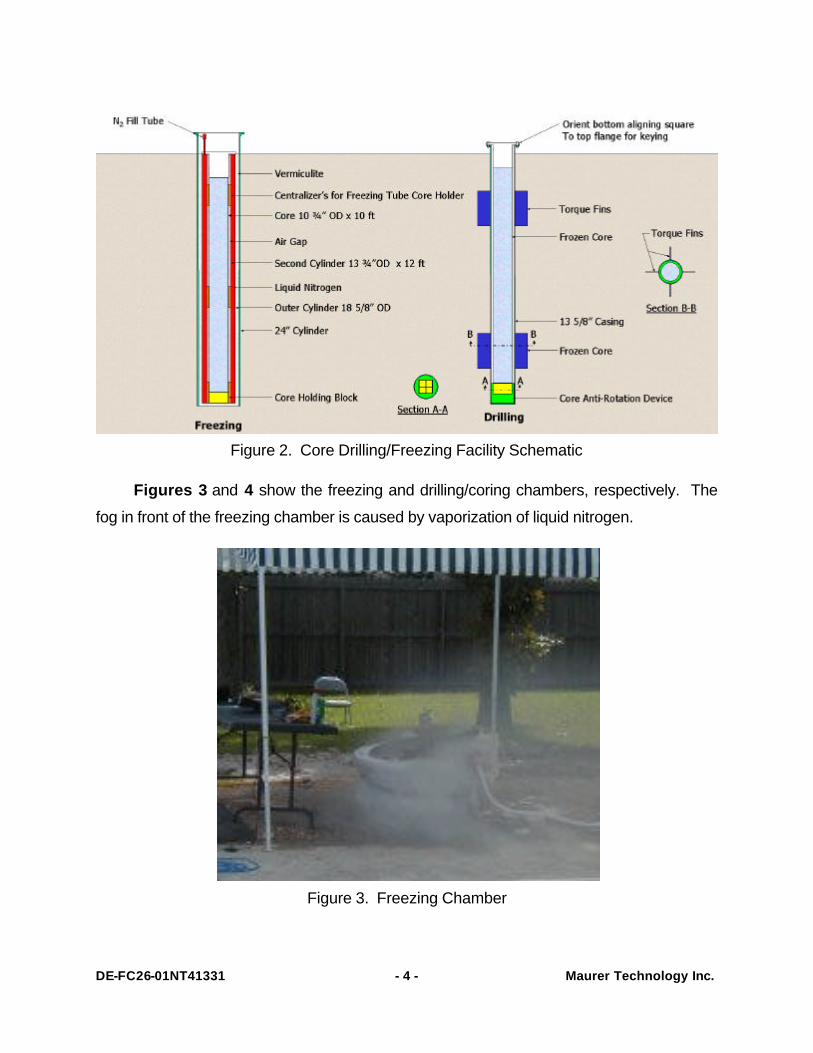
A core drilling and freezing facility was installed at the DRC. This facility consisted
of two pieces of casing (approximately 15 ft in length) placed in the ground (Figure 2).
The tube on the left is the freezing chamber, and is used with equipment built by OU to
freeze simulated hydrate cylinders. The tube on the right is the drilling chamber.
Samples frozen in the freezing chamber are transferred to the drilling chamber where
they are cored.
DE-FC26-01NT41331 - 4 - Maurer Technology Inc.
Figure 2. Core Drilling/Freezing Facility Schematic
Figures 3 and 4 show the freezing and drilling/coring chambers, respectively. The
fog in front of the freezing chamber is caused by vaporization of liquid nitrogen.
Figure 3. Freezing Chamber
DE-FC26-01NT41331 - 5 - Maurer Technology Inc.
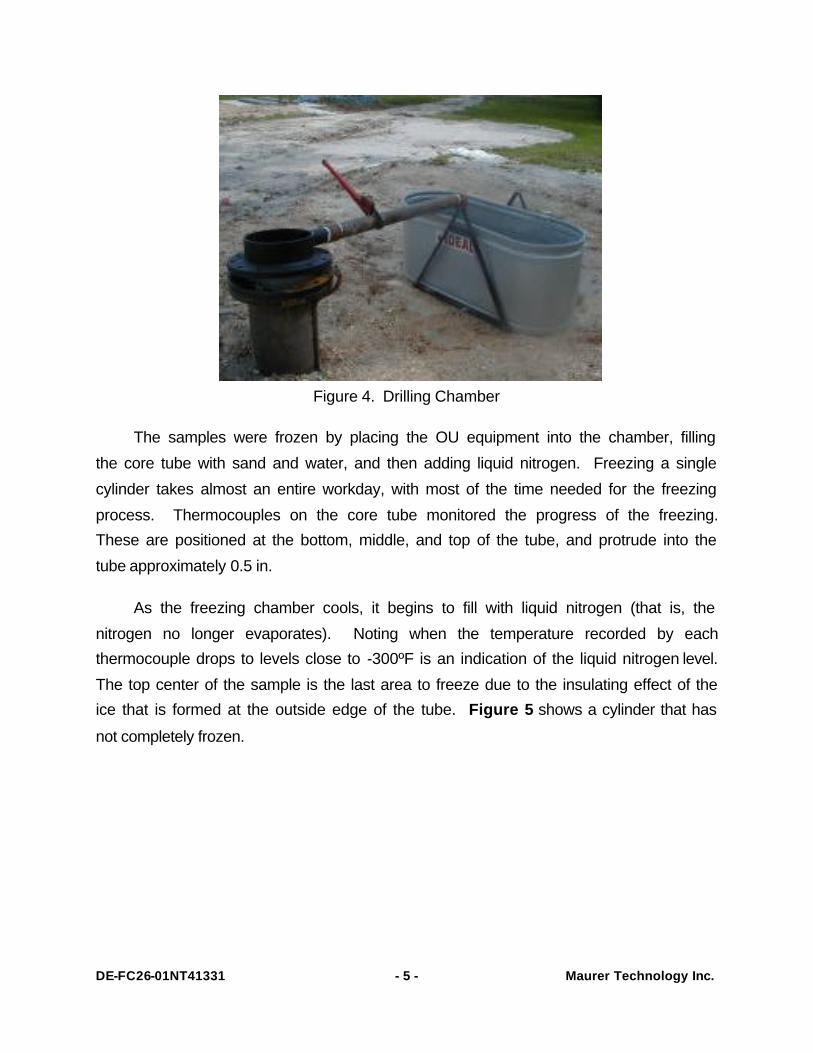
Figure 4. Drilling Chamber
The samples were frozen by placing the OU equipment into the chamber, filling
the core tube with sand and water, and then adding liquid nitrogen. Freezing a single
cylinder takes almost an entire workday, with most of the time needed for the freezing
process. Thermocouples on the core tube monitored the progress of the freezing.
These are positioned at the bottom, middle, and top of the tube, and protrude into the
tube approximately 0.5 in.
As the freezing chamber cools, it begins to fill with liquid nitrogen (that is, the
nitrogen no longer evaporates). Noting when the temperature recorded by each
thermocouple drops to levels close to -300ºF is an indication of the liquid nitrogen level.
The top center of the sample is the last area to freeze due to the insulating effect of the
ice that is formed at the outside edge of the tube. Figure 5 shows a cylinder that has
not completely frozen.

DE-FC26-01NT41331 - 6 - Maurer Technology Inc.
Figure 5. Partially Frozen Simulated Hydrate Cylinder
The prototype apparatus developed by OU (Figure 6) consists of three nested
tubes, with the inner tube forming a chamber for the simulated hydrate sample, and the
outer two the freezing and nitrogen chambers. The original design placed the liquid
nitrogen in the outer annulus and left an air gap between the nitrogen and core
chamber. This was done to slow the freezing process and increase temperature
uniformity of the frozen cylinder. This approach was based on the assumption that the
cylinder would be moved directly from the freezing chamber to the drilling chamber.
However, during the coring tests, the simulated hydrate cylinders were stored in a
freezer truck overnight so that they could finish freezing and achieve uniform
temperature.
DE-FC26-01NT41331 - 7 - Maurer Technology Inc.
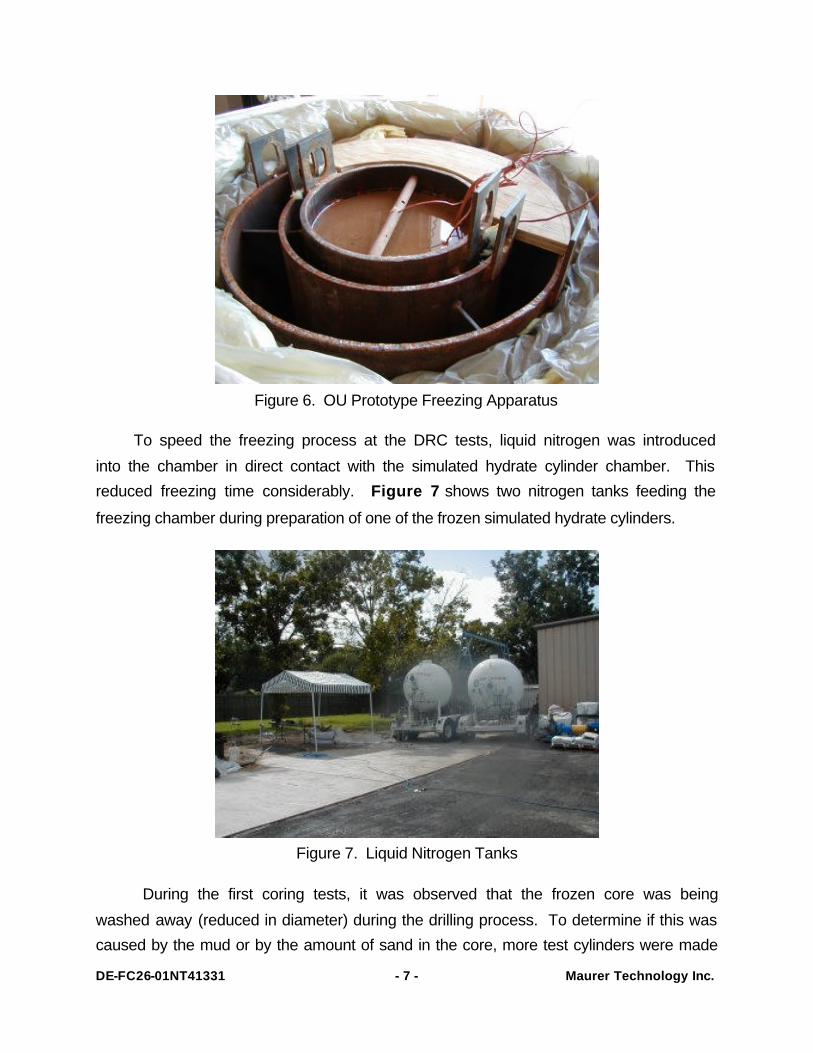
Figure 6. OU Prototype Freezing Apparatus
To speed the freezing process at the DRC tests, liquid nitrogen was introduced
into the chamber in direct contact with the simulated hydrate cylinder chamber. This
reduced freezing time considerably. Figure 7 shows two nitrogen tanks feeding the
freezing chamber during preparation of one of the frozen simulated hydrate cylinders.
Figure 7. Liquid Nitrogen Tanks
During the first coring tests, it was observed that the frozen core was being
washed away (reduced in diameter) during the drilling process. To determine if this was
caused by the mud or by the amount of sand in the core, more test cylinders were made

DE-FC26-01NT41331 - 8 - Maurer Technology Inc.
with water only. For solid ice cylinders, the freezing chamber was evacuated before
being filled with water so that the ice would be homogeneous with no entrapped air.
Figure 8 shows the vacuum pump on the table and the bucket in front from which water
was drawn during the filling process.
Figure 8. Vacuum Filling Freezing Chamber
After freezing, the cylinders were removed from the freezing chamber and stored
in a freezer truck (Figure 9). This allowed each cylinder to achieve a uniform
temperature before it was moved to the drilling chamber.
Figure 9. Storing Simulated Hydrate Cylinder in Freezer Truck
DE-FC26-01NT41331 - 9 - Maurer Technology Inc.
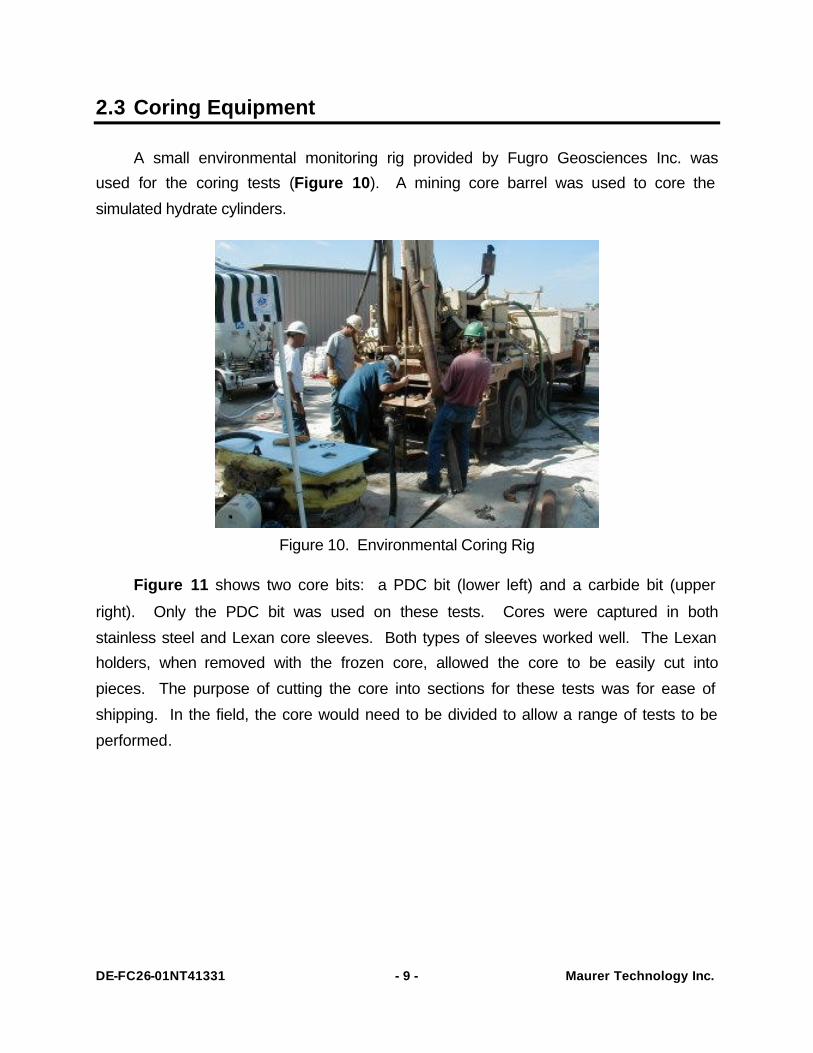
2.3 Coring Equipment
A small environmental monitoring rig provided by Fugro Geosciences Inc. was
used for the coring tests (Figure 10). A mining core barrel was used to core the
simulated hydrate cylinders.
Figure 10. Environmental Coring Rig
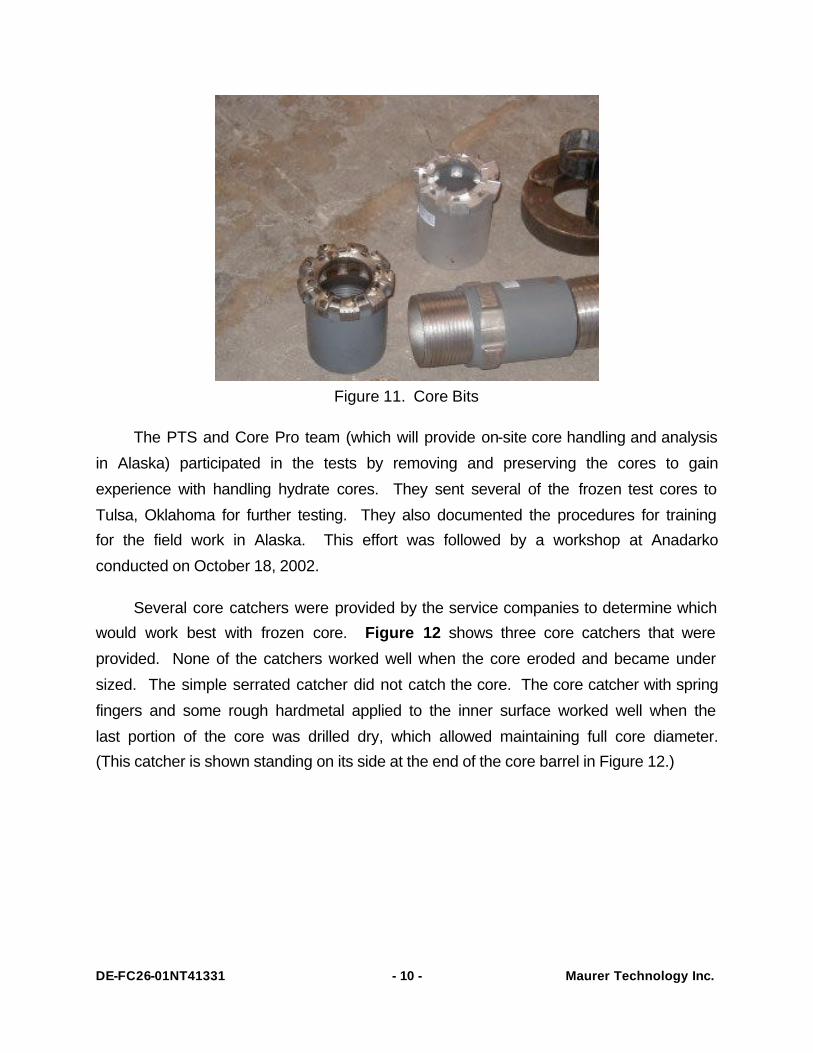
Figure 11 shows two core bits: a PDC bit (lower left) and a carbide bit (upper
right). Only the PDC bit was used on these tests. Cores were captured in both
stainless steel and Lexan core sleeves. Both types of sleeves worked well. The Lexan
holders, when removed with the frozen core, allowed the core to be easily cut into
pieces. The purpose of cutting the core into sections for these tests was for ease of
shipping. In the field, the core would need to be divided to allow a range of tests to be
performed.
DE-FC26-01NT41331 - 10 - Maurer Technology Inc.
Figure 11. Core Bits
The PTS and Core Pro team (which will provide on-site core handling and analysis
in Alaska) participated in the tests by removing and preserving the cores to gain
experience with handling hydrate cores. They sent several of the frozen test cores to
Tulsa, Oklahoma for further testing. They also documented the procedures for training
for the field work in Alaska. This effort was followed by a workshop at Anadarko
conducted on October 18, 2002.
Several core catchers were provided by the service companies to determine which
would work best with frozen core. Figure 12 shows three core catchers that were
provided. None of the catchers worked well when the core eroded and became under
sized. The simple serrated catcher did not catch the core. The core catcher with spring
fingers and some rough hardmetal applied to the inner surface worked well when the
last portion of the core was drilled dry, which allowed maintaining full core diameter.
(This catcher is shown standing on its side at the end of the core barrel in Figure 12.)

DE-FC26-01NT41331 - 11 - Maurer Technology Inc.
Figure 12. Core Catchers
2.4 Drilling Fluid
Special drilling fluids are needed for hydrate drilling and coring because they must
be maintained at temperatures below freezing to prevent the ice from melting. For this
test we used a potassium chloride water-based mud system. The mud contained 10%
salt by weight. This mud worked well for the tests, except that it needed to be thickened
with polymer to improve hole cleaning. Without polymer, the mud was too thin to
transport coarse sand, resulting in the core barrel becoming stuck.
The mud was stored in a 250-gallon tank that was placed in the freezer truck at
night. If the mud temperature rose above the limit during coring operations, dry ice was
added to the mud. This approach worked very well. The mud was also cooled during
drilling/coring operations since the simulated hydrate cylinders were kept very cold
(below 28ºF and sometimes as low as 0ºF).
DE-FC26-01NT41331 - 12 - Maurer Technology Inc.
3. Coring Test Results
3.1 Cylinders for Coring Tests
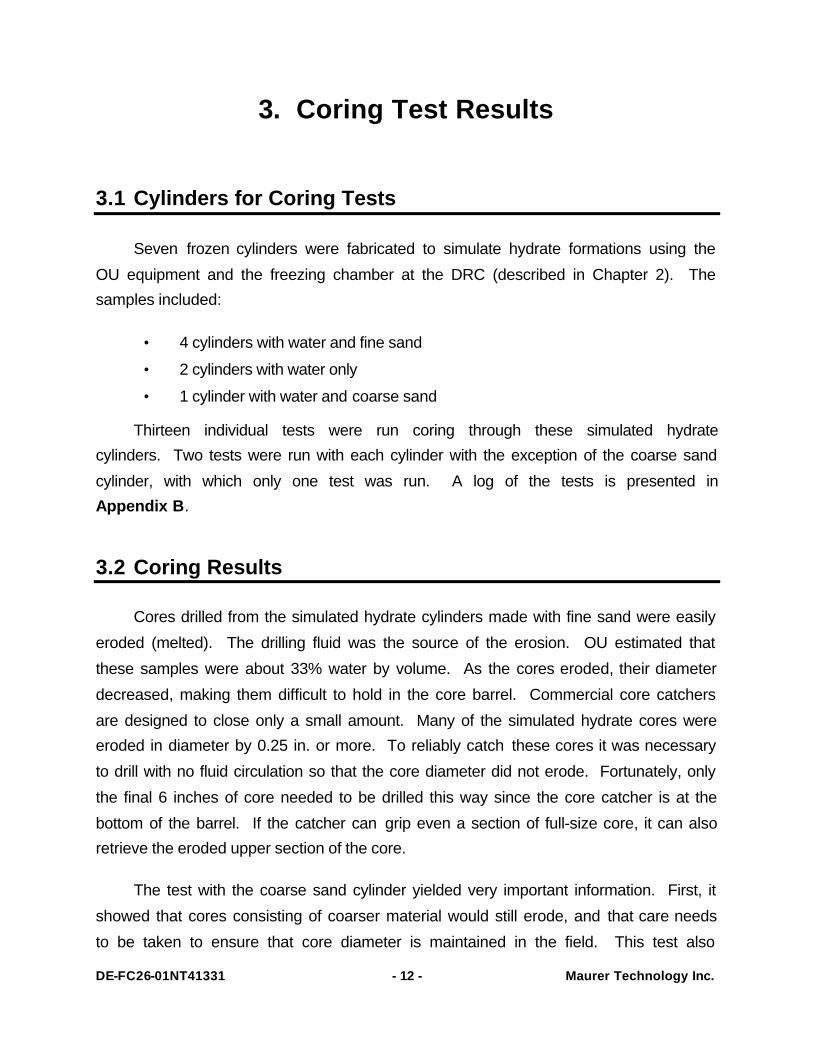
Seven frozen cylinders were fabricated to simulate hydrate formations using the
OU equipment and the freezing chamber at the DRC (described in Chapter 2). The
samples included:
• 4 cylinders with water and fine sand
• 2 cylinders with water only
• 1 cylinder with water and coarse sand
Thirteen individual tests were run coring through these simulated hydrate
cylinders. Two tests were run with each cylinder with the exception of the coarse sand
cylinder, with which only one test was run. A log of the tests is presented in
Appendix B.
3.2 Coring Results
Cores drilled from the simulated hydrate cylinders made with fine sand were easily
eroded (melted). The drilling fluid was the source of the erosion. OU estimated that
these samples were about 33% water by volume. As the cores eroded, their diameter
decreased, making them difficult to hold in the core barrel. Commercial core catchers
are designed to close only a small amount. Many of the simulated hydrate cores were
eroded in diameter by 0.25 in. or more. To reliably catch these cores it was necessary
to drill with no fluid circulation so that the core diameter did not erode. Fortunately, only
the final 6 inches of core needed to be drilled this way since the core catcher is at the
bottom of the barrel. If the catcher can grip even a section of full-size core, it can also
retrieve the eroded upper section of the core.
The test with the coarse sand cylinder yielded very important information. First, it
showed that cores consisting of coarser material would still erode, and that care needs
to be taken to ensure that core diameter is maintained in the field. This test also

DE-FC26-01NT41331 - 13 - Maurer Technology Inc.
showed that the drilling fluid must be carefully designed not only to minimize melting the
core, but also to remove larger cuttings. If the mud is not viscous enough to suspend
coarser sand, cuttings can build up around the core barrel and cause it to become stuck
in the well.
The cylinders made with water only were easier to core. Except for cases when
the core catcher was damaged, full cores were caught on these tests. The composition
of the hydrate in Alaska will dictate how difficult it will be to retrieve core. If the hydrate
is primarily sand, more care will be needed to successfully obtain a good core. If the
hydrate is primarily water, coring will be easier.
Figure 13 shows the core barrel during the drilling operation. Two 5-ft cores were
taken from each of the cylinders. This procedure was adopted (as opposed to a single
long core) to increase the experience handling the cores and because a larger rig with
enough space to clear a 10 ft barrel below the mast was too costly for the test budget.
The increased core-handling experience proved to be very valuable since it allowed us
to determine the difficulties keeping the core the correct size during drilling and what
drilling techniques world yield the best core. Discovering that core could not be
successfully recovered except by drilling without circulation would have been a very
costly lesson if learned on site in Alaska.
Figure 13. Drilling/Coring Operation
DE-FC26-01NT41331 - 14 - Maurer Technology Inc.
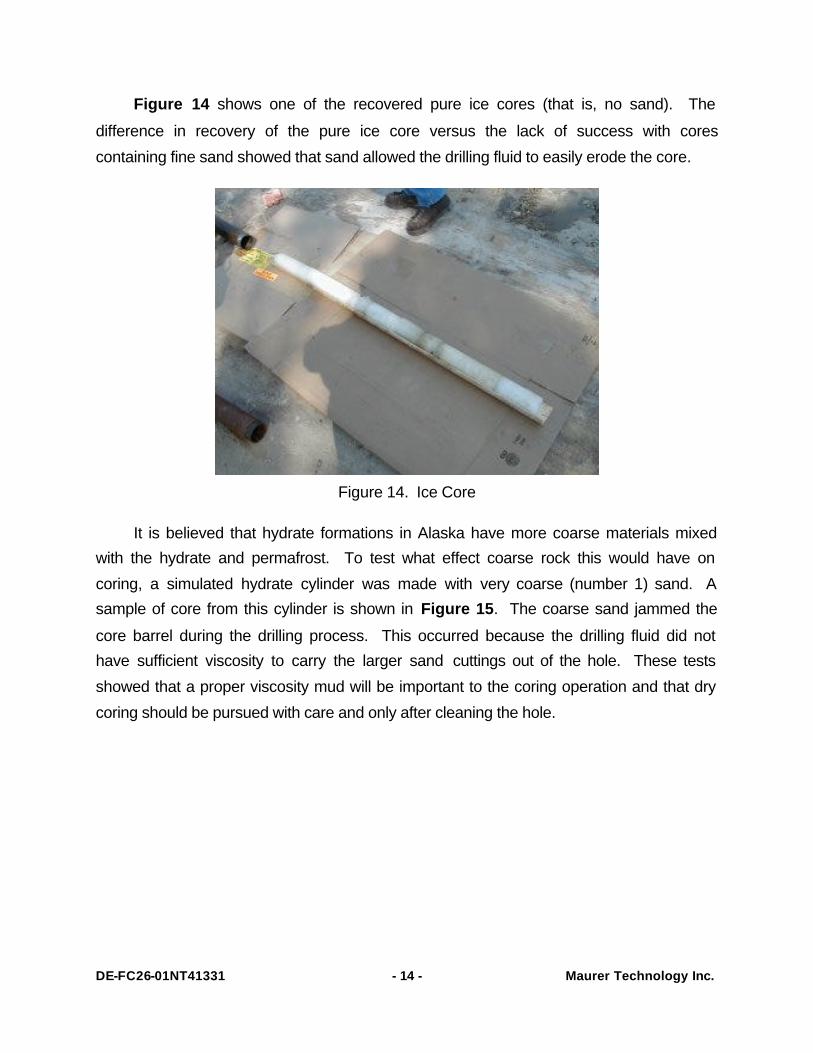
Figure 14 shows one of the recovered pure ice cores (that is, no sand). The
difference in recovery of the pure ice core versus the lack of success with cores
containing fine sand showed that sand allowed the drilling fluid to easily erode the core.
Figure 14. Ice Core
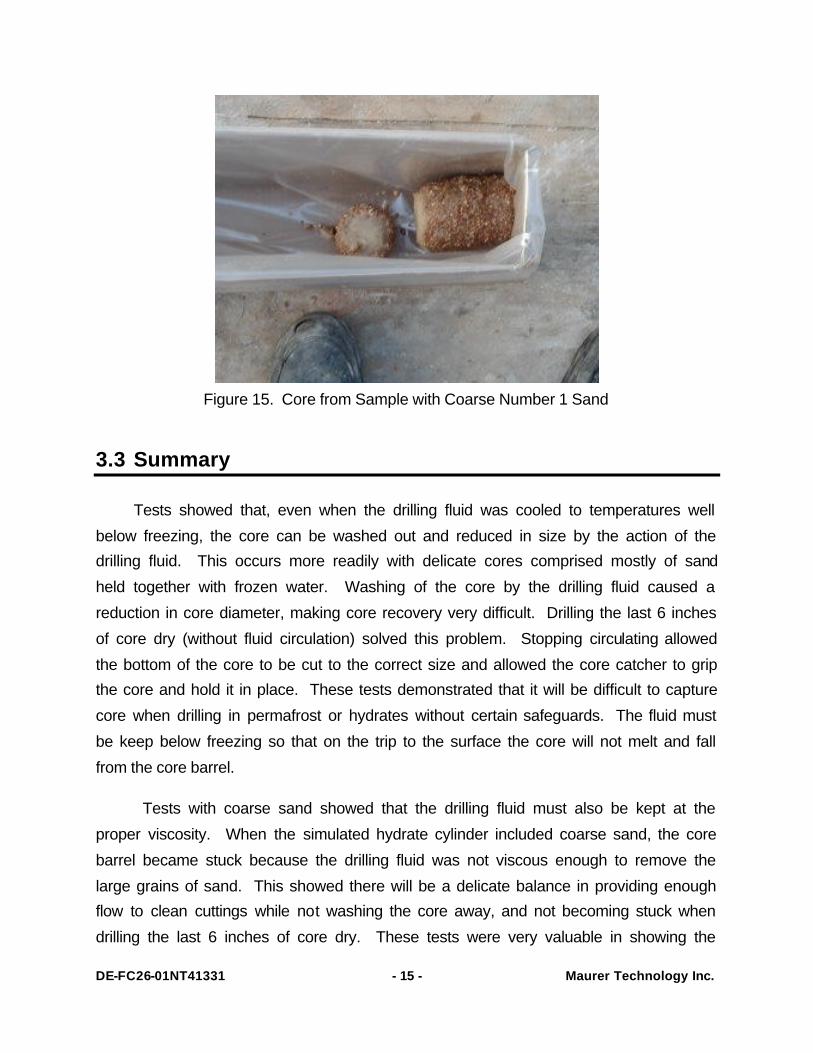
It is believed that hydrate formations in Alaska have more coarse materials mixed
with the hydrate and permafrost. To test what effect coarse rock this would have on
coring, a simulated hydrate cylinder was made with very coarse (number 1) sand. A
sample of core from this cylinder is shown in Figure 15. The coarse sand jammed the
core barrel during the drilling process. This occurred because the drilling fluid did not
have sufficient viscosity to carry the larger sand cuttings out of the hole. These tests
showed that a proper viscosity mud will be important to the coring operation and that dry
coring should be pursued with care and only after cleaning the hole.
DE-FC26-01NT41331 - 15 - Maurer Technology Inc.
Figure 15. Core from Sample with Coarse Number 1 Sand
3.3 Summary
Tests showed that, even when the drilling fluid was cooled to temperatures well
below freezing, the core can be washed out and reduced in size by the action of the
drilling fluid. This occurs more readily with delicate cores comprised mostly of sand
held together with frozen water. Washing of the core by the drilling fluid caused a
reduction in core diameter, making core recovery very difficult. Drilling the last 6 inches
of core dry (without fluid circulation) solved this problem. Stopping circulating allowed
the bottom of the core to be cut to the correct size and allowed the core catcher to grip
the core and hold it in place. These tests demonstrated that it will be difficult to capture
core when drilling in permafrost or hydrates without certain safeguards. The fluid must
be keep below freezing so that on the trip to the surface the core will not melt and fall
from the core barrel.
Tests with coarse sand showed that the drilling fluid must also be kept at the
proper viscosity. When the simulated hydrate cylinder included coarse sand, the core
barrel became stuck because the drilling fluid was not viscous enough to remove the
large grains of sand. This showed there will be a delicate balance in providing enough
flow to clean cuttings while not washing the core away, and not becoming stuck when
drilling the last 6 inches of core dry. These tests were very valuable in showing the
DE-FC26-01NT41331 - 16 - Maurer Technology Inc.
difficulties in coring permafrost or hydrates in a laboratory environment (as opposed to a
field environment where drilling costs are much higher and the potential loss of
equipment greater).
DE-FC26-01NT41331 - 17 - Maurer Technology Inc.
4. Conclusions
Seven frozen cylinders were fabricated with fine sand and water, water only, and
coarse sand and water. These were cored to simulate operations in hydrate formations.
Valuable lessons were learned regarding equipment and procedures for field operations
in the Alaskan tundra.
The following conclusions were reached as a result of these tests:
1. Hydrate core samples can be recovered successfully
2. Mining core barrels can recover hydrate cores
3. A spring-finger core catcher works best for catching the cores
4. Either stainless steel or Lexan core sleeves will work for this application
5. Lexan core sleeves made it easier to divide the cores
6. PDC core bits worked well for drilling the frozen hydrate cylinders
7. Chilled potassium chloride water-based mud works well for drilling frozen
cores
8. Mud must be designed with proper viscosity to lift larger cuttings
9. Drilling fluid can erode the core and reduces its diameter, making it more
difficult to capture the core
10. The bottom 6 inches of core may need to be drilled dry to capture the core
successfully
DE-FC26-01NT41331 - 18 - Maurer Technology Inc.
5. References
1. De Sousa, J.T.V. (2002): “Report on the Tests Conducted at the Maurer’s Drilling
Research Center, Houston, TX, September 16-19, 2002,” The University of Oklahoma, Well Construction Technology Center, October. (Included as
Appendix A)
DE-FC26-01NT41331 - 19 - Maurer Technology Inc.
Appendix A
Hydrate Test Coring Apparatus
HYDRATE TEST CORING APPARATUS
Report on the Tests Conducted at the
Maurer’s Drilling Research Center, Houston, TX September 16 – 19, 2002
Submitted to Mr. Bill V. Liddell
Anadarko Petroleum Corporation 17001 Northchase Drive
Houston, TX 77060
Prepared by Dr. Joāo Tadeu Vidal de Sousa
The Well Construction Technology Center Mewbourne School of Petroleum & Geological Engineering
The University of Oklahoma 1101 Lexington Avenue
Norman, OK 73069-8425
October 2002
WELL CONSTRUCTION TECHNOLOGY CENTER
The University of Oklahoma
TABLE OF CONTENTS 1. INTRODUCTION...……………………………….…………………………… 1 2. WORK DESCRIPTION ...……..……...…..…………………………………… 1 3. CORING OPERATIONS ……………………………………………………… 5 4. GUIDELINES TO EFFICIENTLY PRODUCE FROZEN CORES USING THE HYDRATE CORING APPARATUS …………………………. 5 5. CONCLUSIONS ……………………..…………….……………………………6 6. REFERENCES ………………………………….……………………………….7 Appendix A-1: Testing Results Appendix A-2: Pictures – Tests Details
WELL CONSTRUCTION TECHNOLOGY CENTER
The University of Oklahoma
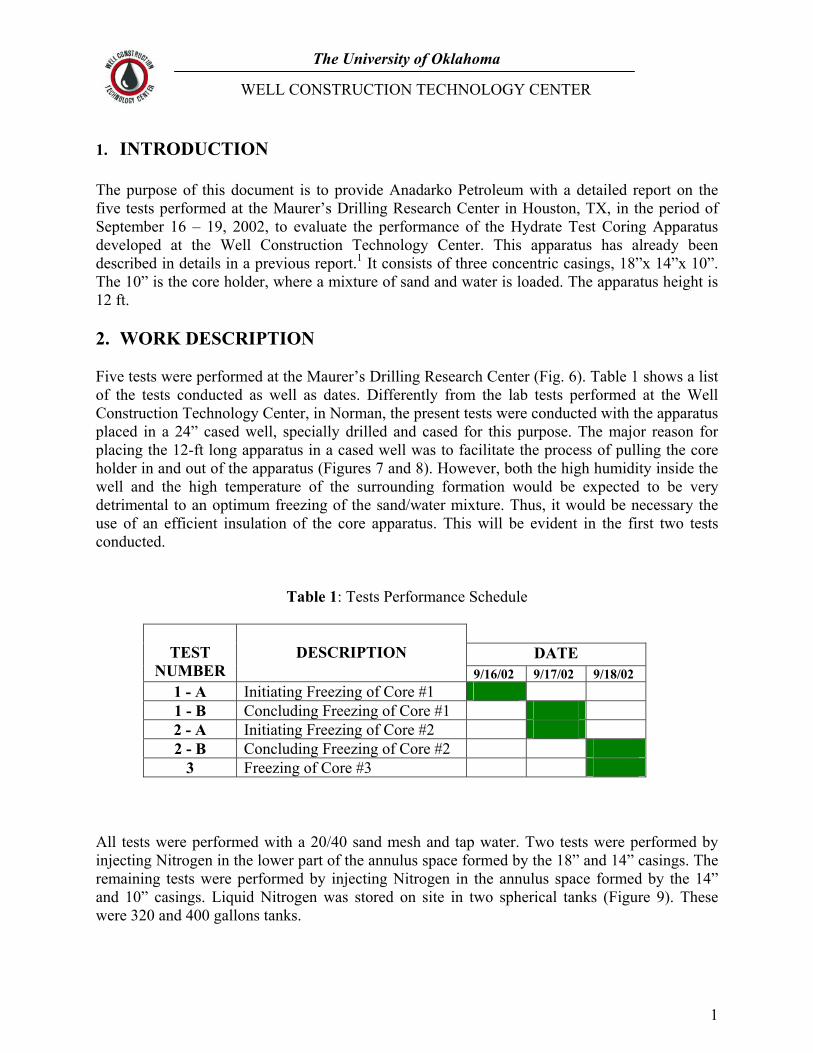
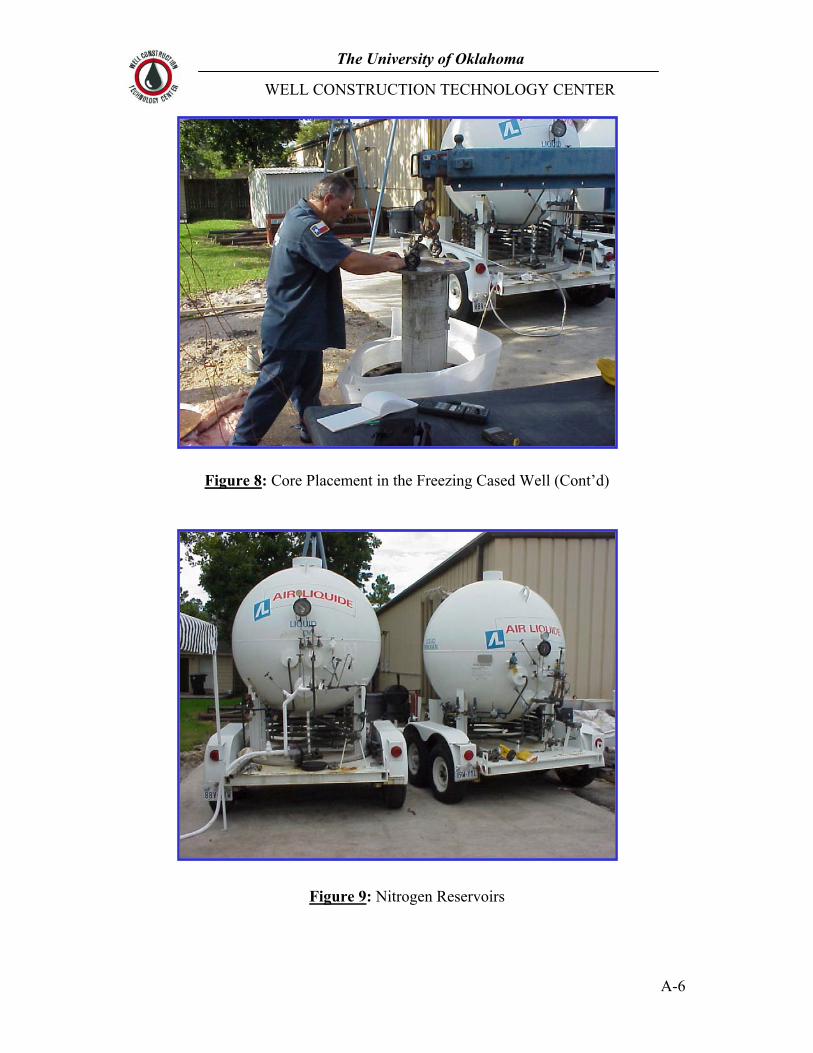
1. INTRODUCTION The purpose of this document is to provide Anadarko Petroleum with a detailed report on the five tests performed at the Maurer’s Drilling Research Center in Houston, TX, in the period of September 16 – 19, 2002, to evaluate the performance of the Hydrate Test Coring Apparatus developed at the Well Construction Technology Center. This apparatus has already been described in details in a previous report.1 It consists of three concentric casings, 18”x 14”x 10”. The 10” is the core holder, where a mixture of sand and water is loaded. The apparatus height is 12 ft. 2. WORK DESCRIPTION Five tests were performed at the Maurer’s Drilling Research Center (Fig. 6). Table 1 shows a list of the tests conducted as well as dates. Differently from the lab tests performed at the Well Construction Technology Center, in Norman, the present tests were conducted with the apparatus placed in a 24” cased well, specially drilled and cased for this purpose. The major reason for placing the 12-ft long apparatus in a cased well was to facilitate the process of pulling the core holder in and out of the apparatus (Figures 7 and 8). However, both the high humidity inside the well and the high temperature of the surrounding formation would be expected to be very detrimental to an optimum freezing of the sand/water mixture. Thus, it would be necessary the use of an efficient insulation of the core apparatus. This will be evident in the first two tests conducted.
Table 1: Tests Performance Schedule
DATE
TEST NUMBER
DESCRIPTION
9/16/02 9/17/02 9/18/02 1 - A Initiating Freezing of Core #1 1 - B Concluding Freezing of Core #1 2 - A Initiating Freezing of Core #2 2 - B Concluding Freezing of Core #2
3 Freezing of Core #3 All tests were performed with a 20/40 sand mesh and tap water. Two tests were performed by injecting Nitrogen in the lower part of the annulus space formed by the 18” and 14” casings. The remaining tests were performed by injecting Nitrogen in the annulus space formed by the 14” and 10” casings. Liquid Nitrogen was stored on site in two spherical tanks (Figure 9). These were 320 and 400 gallons tanks.
1
WELL CONSTRUCTION TECHNOLOGY CENTER
The University of Oklahoma
The hydrate core apparatus was placed in the cased freezing well (φ = 24”) without any load of sand or water (Figure 10). With the core holder in place (10” casing), it was then filled with sand and finally water was added (Figure 11). Because of the water expansion at low temperatures, the sand and water mixture level was kept one foot below the top of the core holder. The top of the sand/water mixture was covered with a metallic lid to improve heat transfer (Figure 12). In the first three tests, the apparatus was equipped with five thermocouples. Two of these were used to measure temperatures in the annulus space formed by the 18” and 14” casings. They were placed at 10” and 6” from the bottom of the apparatus. Because these thermocouples were placed in the annulus originally designed to inject Nitrogen, they were labeled Nitrogen (top) and Nitrogen (middle), respectively. Three other thermocouples were placed in the 10” casing to measure the peripheral temperature of the core. These thermocouples were placed at 1 ft, 6 ft, and 11 feet from the bottom of the apparatus. They were labeled core (bottom), core (middle), and core (top), respectively. In tests four and five, a sixth thermocouple was placed in the very center of the core, at about 1.5 ft from the top. This thermocouple was labeled core (top/center). In addition, the ambient temperature was also measured in all tests. Thermocouple readers were used to exhibit the temperatures during the tests. These temperature measurements were recorded by hand on a report notebook (Figure 13). Next, detailed discussions on all tests conducted are provided.
a) Test #1 – A (Core #1):
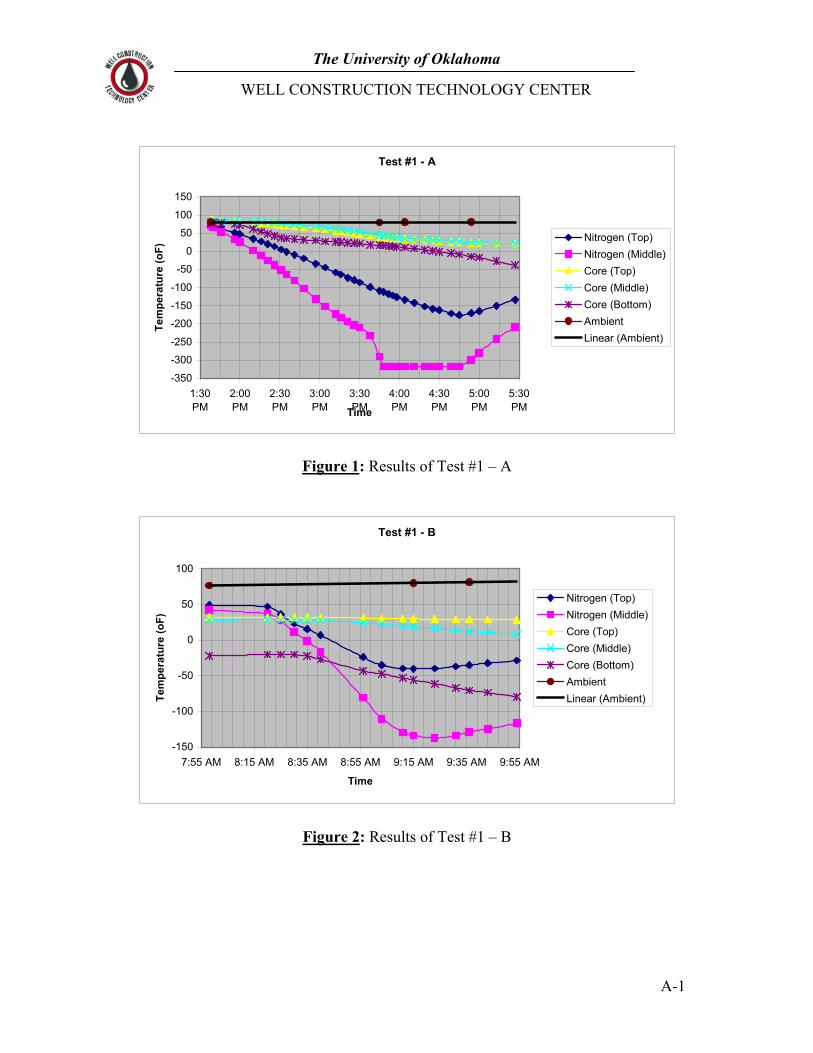
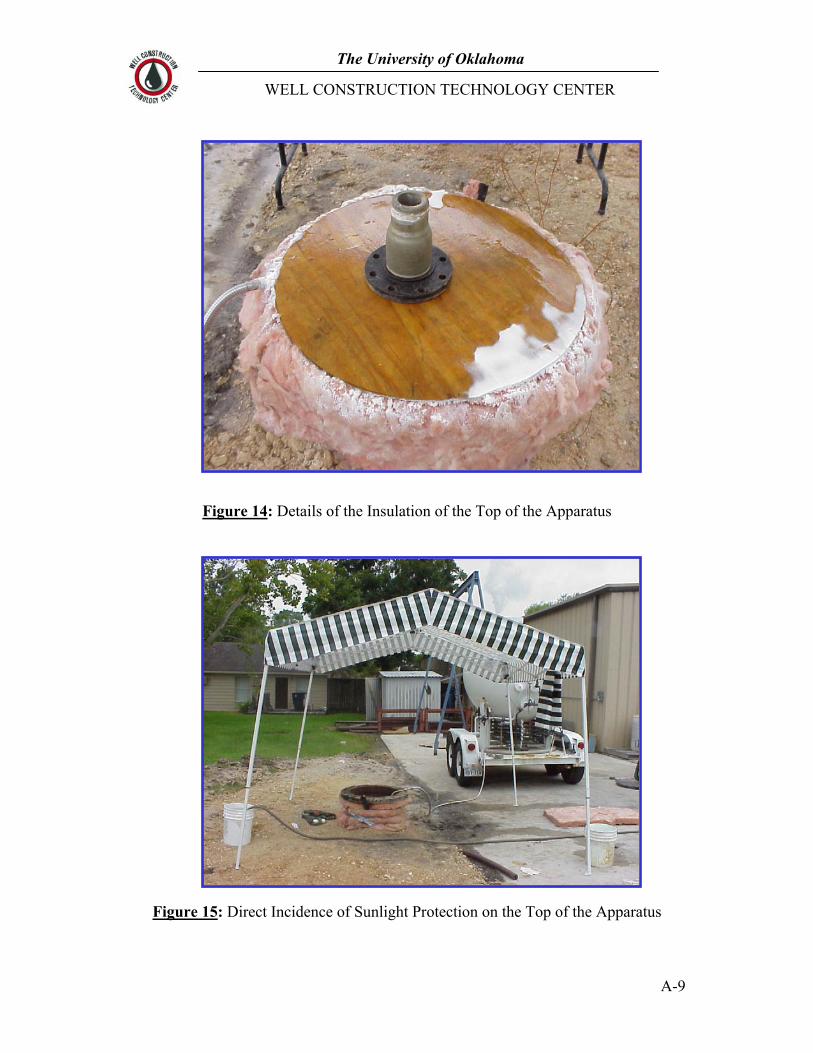
This test was conducted on Monday, September 16, 2002, from 1:37 pm to 5:27 pm. The ambient temperature was in the range of 79.8 o F to 80.6 o F. For this test, the core apparatus was not insulated from the freezing cased well, except for the top that was exposed to the ambient. Improvised pieces of fiberglass insulation material were used (Figure 14). A canopy was used to prevent direct incidence of sunlight on the top of the apparatus (Figure 15). Before starting the test, the Nitrogen tank was vented to reduce the pressure to 22 psi. Nitrogen was injected in the annulus space formed by the 18” and 14” casings. The injection was at a low rate by keeping the injection valve ¼ open. Nitrogen injection was stopped at 4:46 pm, but temperature measurements were taken until 5:27 pm. The core was left in the freezing cased well until next morning. All test temperatures are shown in Figure 1.
Comments on the test results: Figure 1 clearly shows that the annulus where Nitrogen was injected was half-filled with liquid Nitrogen from 3:45 pm to 4:46 pm (Nitrogen (middle) = -318 oF). As soon as the Nitrogen injection was ceased at 4:46 pm, the Nitrogen (top) and Nitrogen (middle) temperatures increased dramatically, which can be explained by a rapid transformation of liquid Nitrogen into gas due to the lack of insulation of the apparatus. At 5:30 pm, when the test was concluded, only the lower-mid part of the core was properly frozen. In the upper-mid part, the core center was still unfrozen. The core was left in place until next morning. The next test is a sequence of this test.
2
WELL CONSTRUCTION TECHNOLOGY CENTER
The University of Oklahoma
b) Test #1 – B (Core #1):
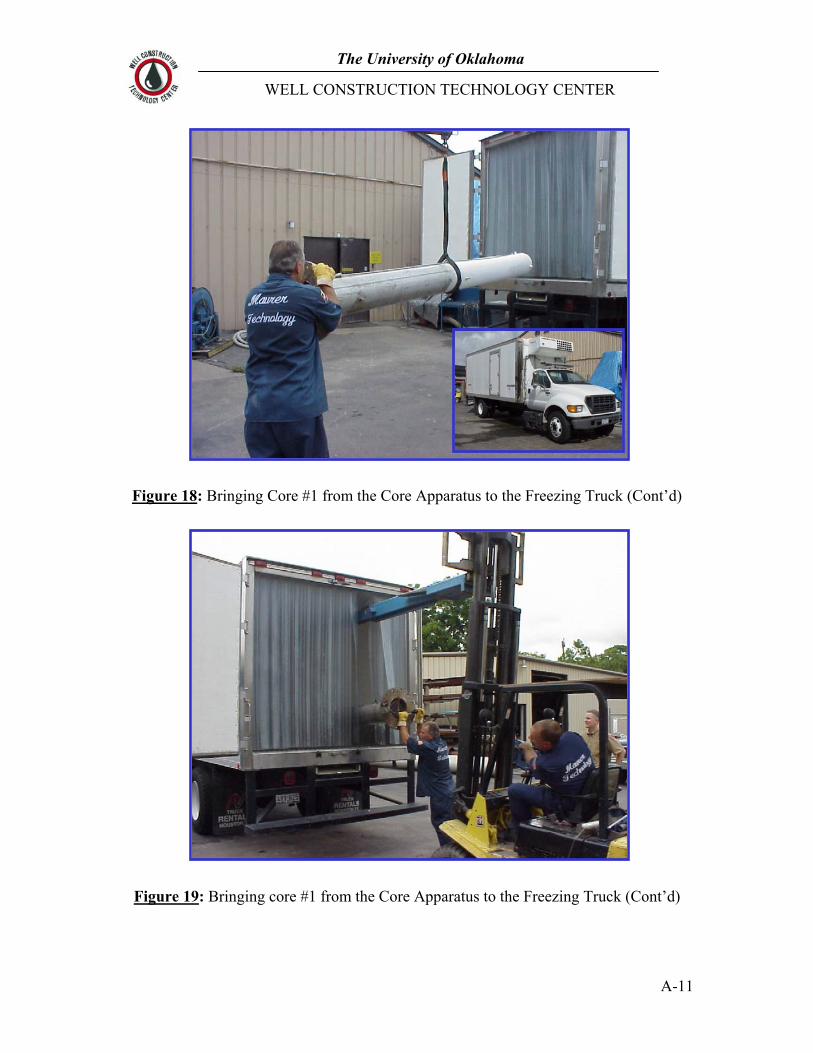
This test was run on Tuesday, September 17, 2002, from 8:20 am to 9:54 am. The ambient temperature was in the range of 76.6 o F to 80.6 o F. This test is a continuation of Test #1 – A. With the core holder in place, and as the core temperature increased over night due to the lack of insulation, Nitrogen was injected in the same way previously described to reduce the core temperature. At 9:54 am, when the temperatures of the Nitrogen (top), Nitrogen (middle), core (top), core (middle), and core (bottom) dropped to –28.5 o F, -116.6 o F, 28.6 oF, 8.3 o F, -79.6 o F, respectively, the Nitrogen injection was ceased. At about 11:00 pm, the core holder was removed from the apparatus and placed in the freezing truck (Figures 16 – 19). The freezing truck temperature was set to 25 o F. All test temperatures are shown in Figure 2. Comments on the test results: Based on the results of this test and test 1-A, it became evident that the core apparatus should be pulled out of the 24” cased well and properly insulated before proceeding with the next test. On 9/17/02, at 4:35 pm, after 25 hours since the core #1 had been placed in the freezing truck, the core (top), core (middle), and core (bottom) temperatures were 30 o F, 24 o F, -6 o F. The temperatures had increased significantly and the core top (central part) was not completely frozen and should be placed again in the core apparatus for additional cooling before it could be used for coring.
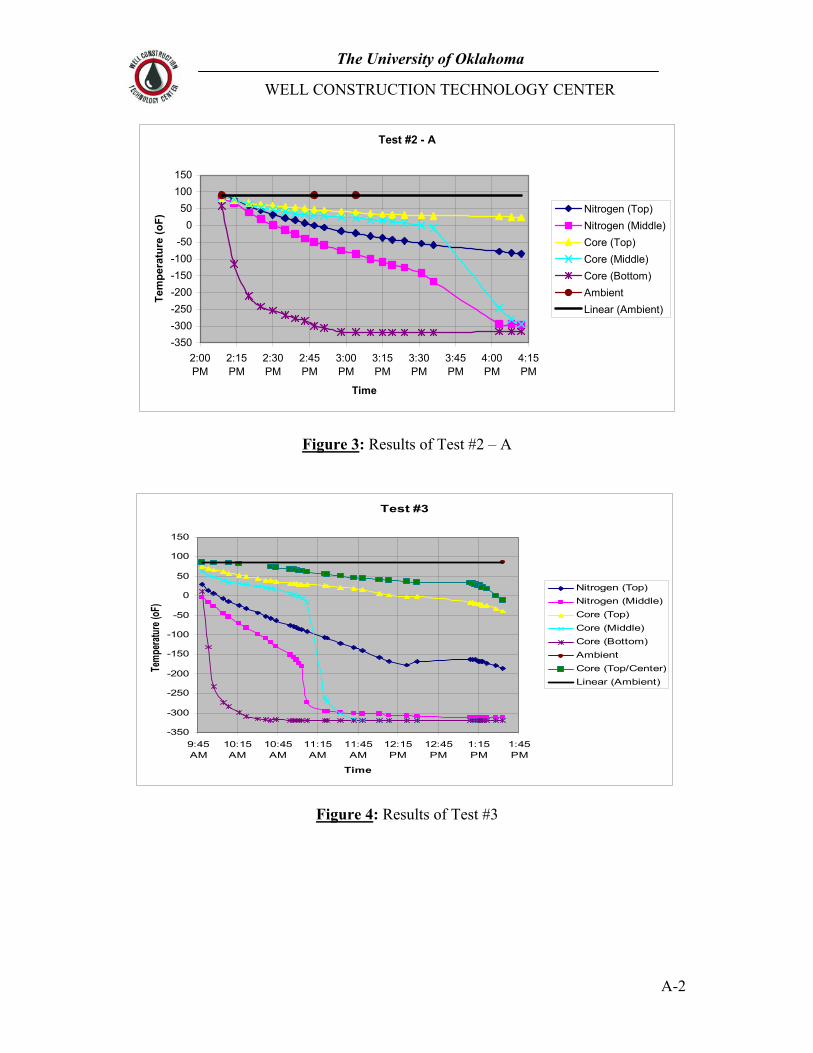
c) Test #2 – A (Core #2):
This test was performed on Tuesday, September 17, 2002, from 2:05 pm to 4:13 pm. The ambient temperature was about 90o F. Before starting this test, based on the results of the previous test, a decision was made to pull the apparatus out of the 24” cased hole and insulate it. As no proper insulation material was available on site, three layers of a white wrapping foam material were used around the 20” casing. The bottom of the apparatus was insulated from the ground by placing two layers of hard foam on a wooden plate. With the insulated apparatus in place, testing was commenced. Similarly to the other two previous tests, Nitrogen was injected at a low rate (valve ¼ open). However, Nitrogen was injected in the annulus formed by the 14" casing and the core holder. This was done to ensure that a fully frozen core would be obtained with the poor quality insulation material provided in a reasonable time.
At 4:13 pm, when the Nitrogen (top), Nitrogen (middle), core (top), core (middle), and core (bottom) temperatures were –84.9 o F, -297.5 o F, 23.6 o F, -294.3 o F, -316 o F, respectively, the test was terminated and the core stored in the freezing truck. Although the core top was not completely frozen, the test had to be stopped because no personnel would be available on site for assistance afterward. The test temperatures are shown in Figure 3. Comments on the test results: Figure 3 shows that although the quality of the insulation material used was not ideal, it was acceptable since very cold core temperatures were
3
WELL CONSTRUCTION TECHNOLOGY CENTER
The University of Oklahoma
obtained in about two hours. The test results also showed that the decision of injecting Nitrogen in the annulus just outside the core holder (10” casing) was right. Nitrogen was injected in the same way in all subsequent tests.
d) Test #3 (Core #3):
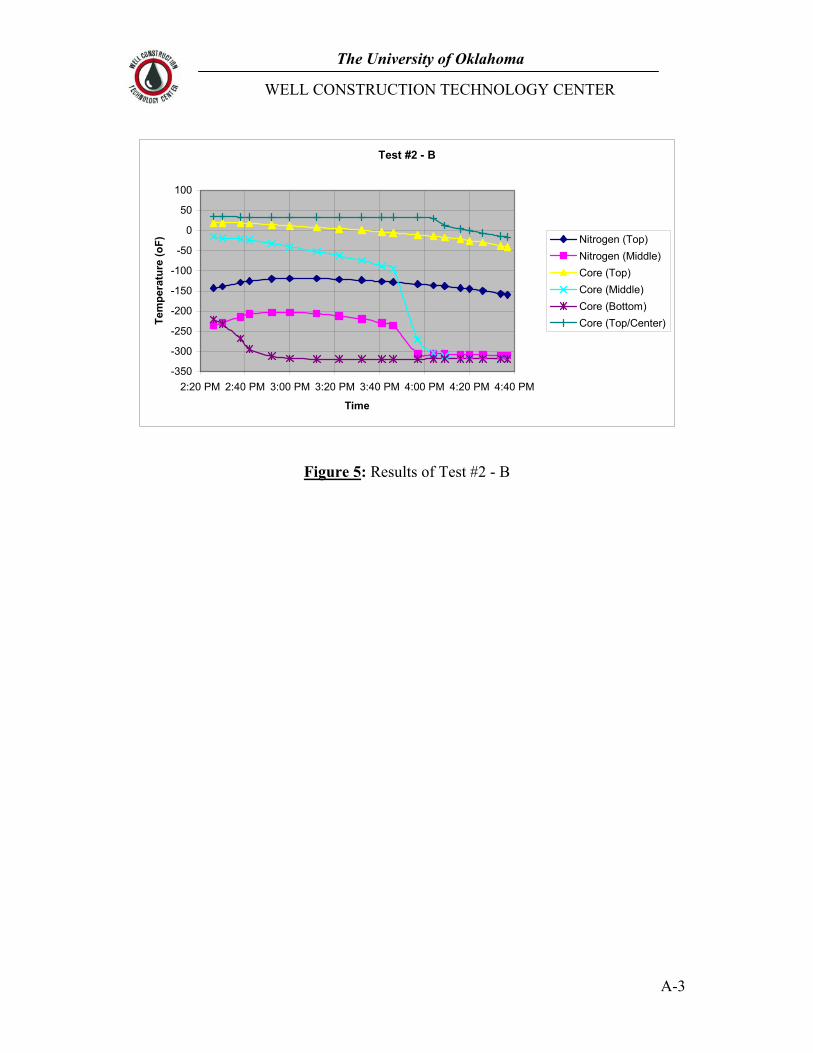
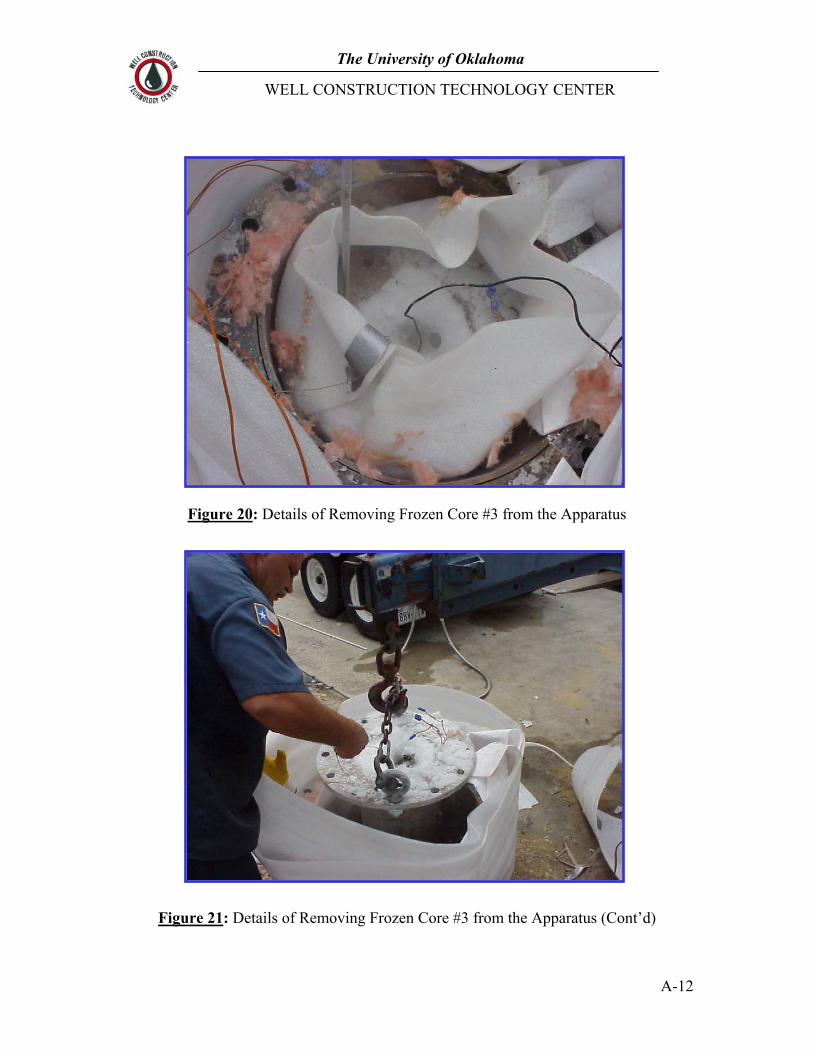
This test was performed on Wednesday, September 18, 2002, from 9:37 am to 1:33 pm. Ambient temperature was about 86 o F. Similarly to the previous tests, Nitrogen was injected in the annulus formed by the 14" casing and the core holder. However, Nitrogen was injected in the first 15 minutes at a low rate (valve ¼ open) and, thereafter, the injection valve was opened completely to allow the highest Nitrogen flow rate possible. This was done to ensure liquid Nitrogen level in the annulus well above the mid-height of the apparatus. Thus, reducing the time to freeze the core top, which was the most difficult part to freeze. The initial Nitrogen injection pressure was 38 psi. At 12:21 pm, the Nitrogen injection was stopped because the first Nitrogen tank was empty. At 12:45, the Nitrogen injection was resumed with Nitrogen from a reserve tank. In this test, an additional thermocouple was placed in the very center of the core, at about two feet from the top and was labeled core (top/center). Testing should be terminated and the core holder removed from the apparatus only after this temperature was well below 32 oF. A temperature target of about -10 o F was set for this temperature. To improve freezing efficiency, sand was stored in the freezing truck on the previous day. At the time the core apparatus was loaded with sand, the sand temperature was 44 o F. After the successful conclusion of this test, at 1:33 pm, the core holder was removed from the apparatus and stored in the freezing truck (Figures 20 to 24). Comments on the test results: Figure 4 shows the temperature results of this test. Very cold temperatures were obtained in the end of the test. Note the core (top/center) temperature at about –11 oF, which means a very successful test with a well-frozen core from bottom to top, except for the very top of the core where a few inches of water was still present due to the lack of insulation on the top of the apparatus. This insulation was not improved because adequate insulation material was unavailable on site. e) Test #2 - B (Core #2):
This test was performed on Wednesday, September 18, 2002, from 2:24 pm to 4:37 pm, and is a sequence of test #2 – A. Core #2 was taken from the freezing truck and pulled in the core apparatus for additional cooling. Nitrogen was injected as described in the previous test. The core (top), core (middle), and core (bottom) temperatures at 8:05 am, when the core was still in the freezing truck, were 32.8 oF, 18 oF, and 6 oF, respectively.
4
WELL CONSTRUCTION TECHNOLOGY CENTER
The University of Oklahoma
Comments on the test results: Figure 5 shows the temperature results of this test. Very cold temperatures were obtained in the end of the test. Note the core (top/center) temperature at about –16oF, which means a very successful test. A well-frozen core from bottom to top was obtained, except for the very top of the core where a few inches of water was still present for the same reason previously discussed.
3. CORING OPERATIONS
Successful coring operation was performed with the frozen rock #3 on Thursday, September 19, 2002. The frozen rock was carefully removed from the freezing truck and then insulated. As no adequate insulation material was available on site, the core holder was insulated with two layers of white wrapping foam material. After insulated, the core holder was placed in the coring well. This well was located a few feet away from the well used to make the frozen rock. This well was specially drilled and cased for this purpose.
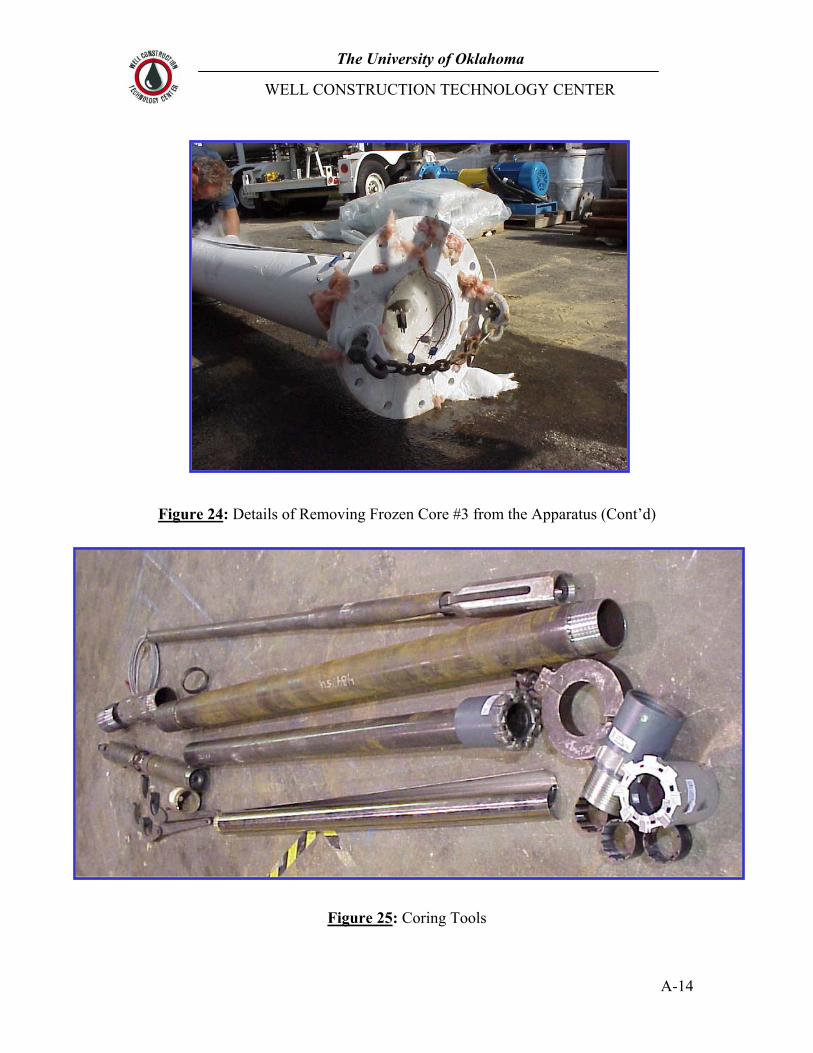
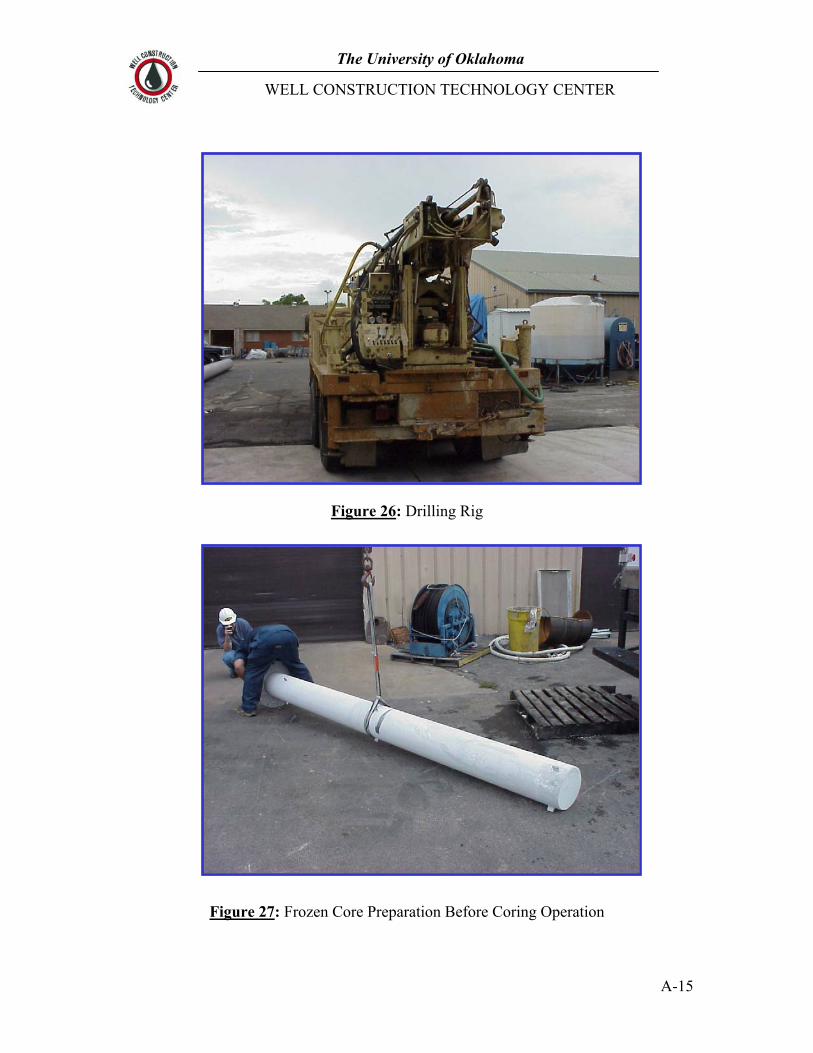
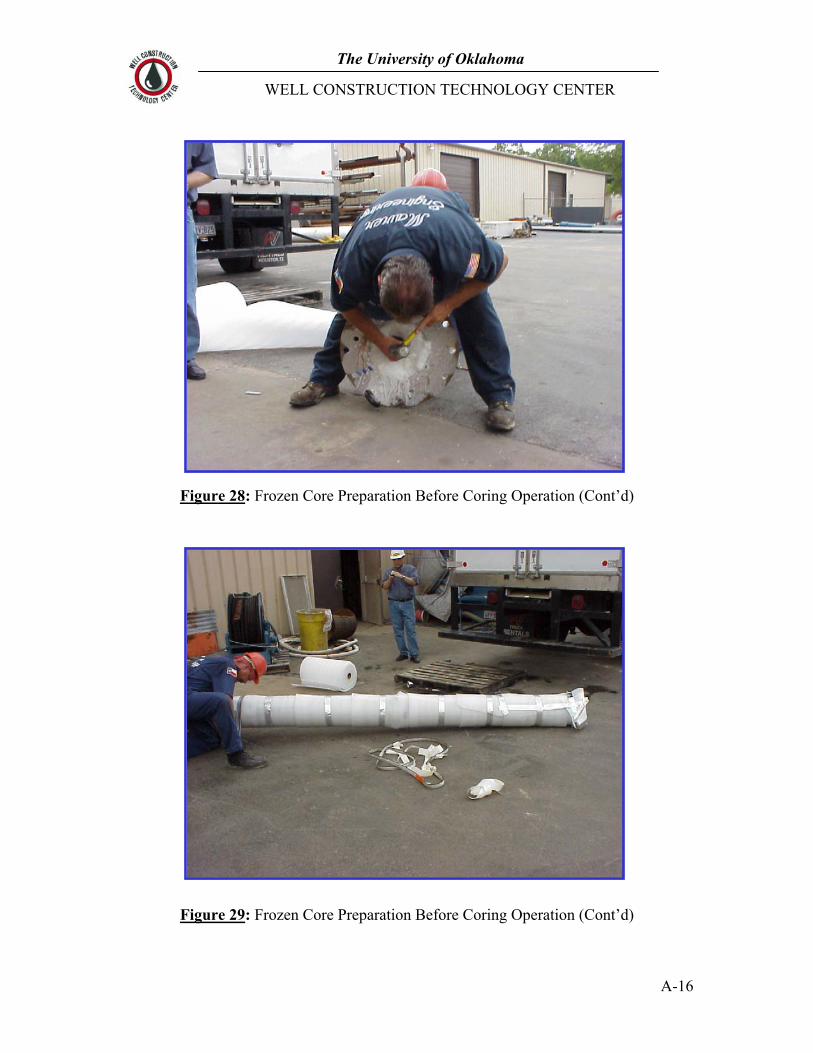
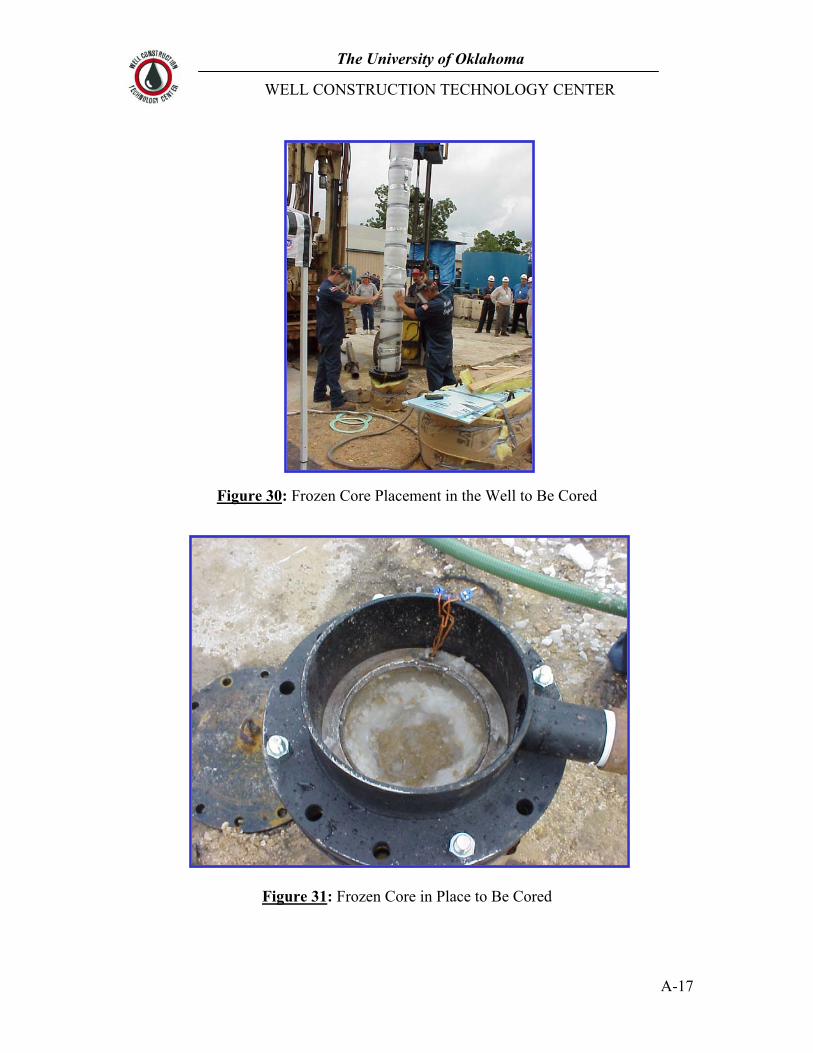
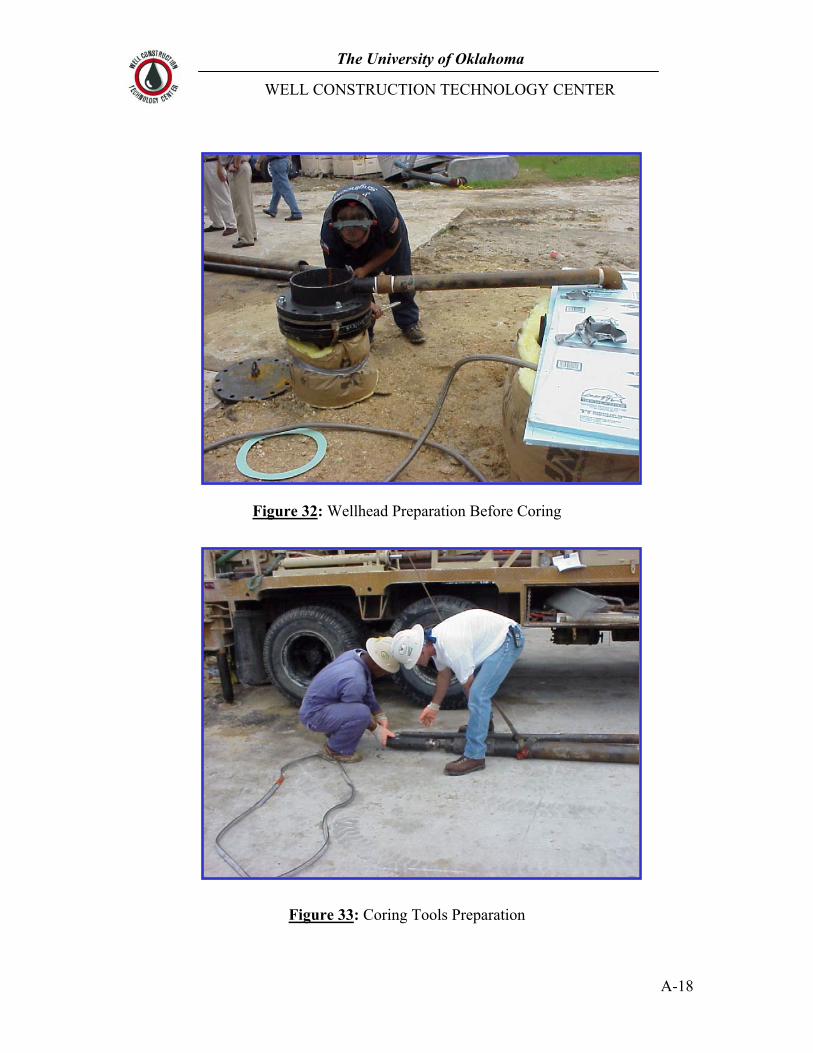
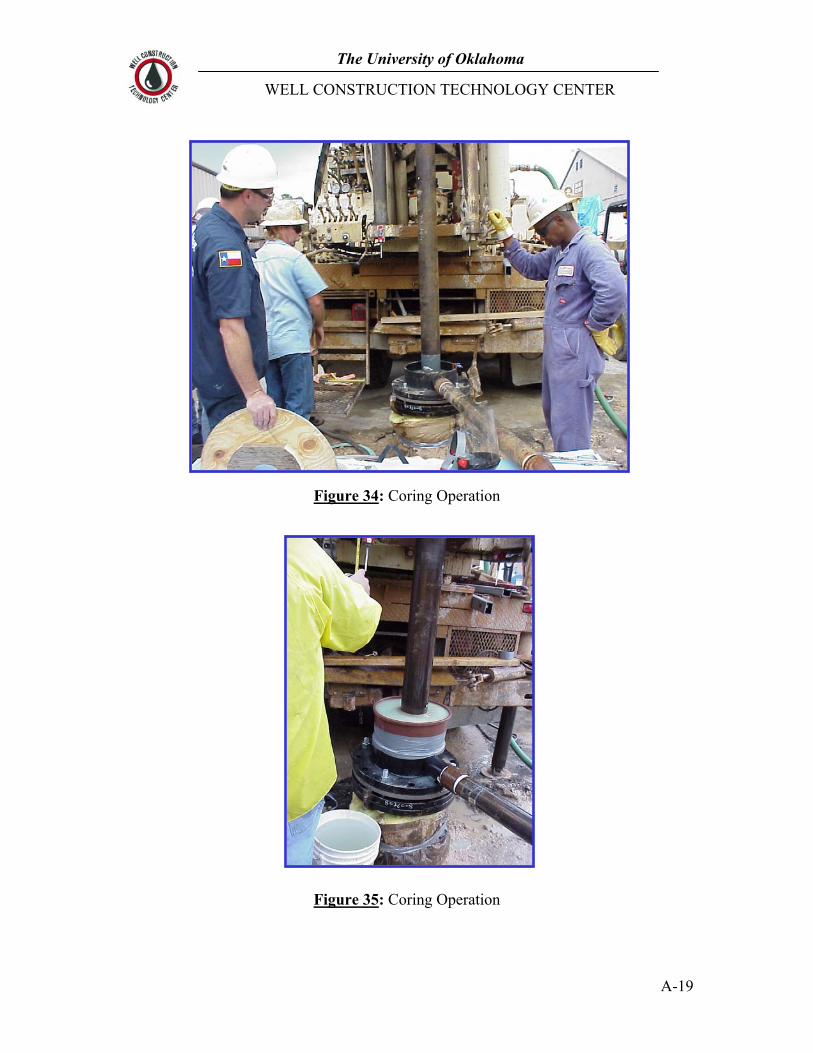
Figures 25 to 37 show details of the frozen rock preparation and the coring operation. Figure 25 shows the coring tools. Figure 26 depicts the drilling rig. Figures 27 to 29 show the core preparation. Figures 30 and 31 depict the frozen rock placement in the well to be cored. Figure 32 and 33 show the wellhead and the coring tools preparation, respectively. Figure 34 and 35 show the coring operation. Figure 36 and 37 show details of the recovered frozen core. Improvements in the core procedures will be required since the first recovered core had a diameter significantly smaller than the core barrel (Figure 37). These improvements include mud composition and coring tools. Mud with KCl was used. The presence of KCl in the mud might have accelerated the unfreezing rate of the frozen rock. The reduction in the recovered diameter might also be a result of the friction between the sand and the bit/core barrel.
4. GUIDELINES TO EFFICIENTLY PRODUCE FROZEN CORES USING
THE HYDRATE CORE APPARATUS
On Thursday, September 19, 2002, Maurer’s Drilling Research Center was provided with guidelines to effectively produce frozen rock cores using the Hydrate Test Coring Apparatus. These guidelines were based on both results from the experimental tests previously discussed and the lab tests performed at the Well Construction Technology Center, Norman- OK. These guidelines are described as follows:
5
WELL CONSTRUCTION TECHNOLOGY CENTER
The University of Oklahoma
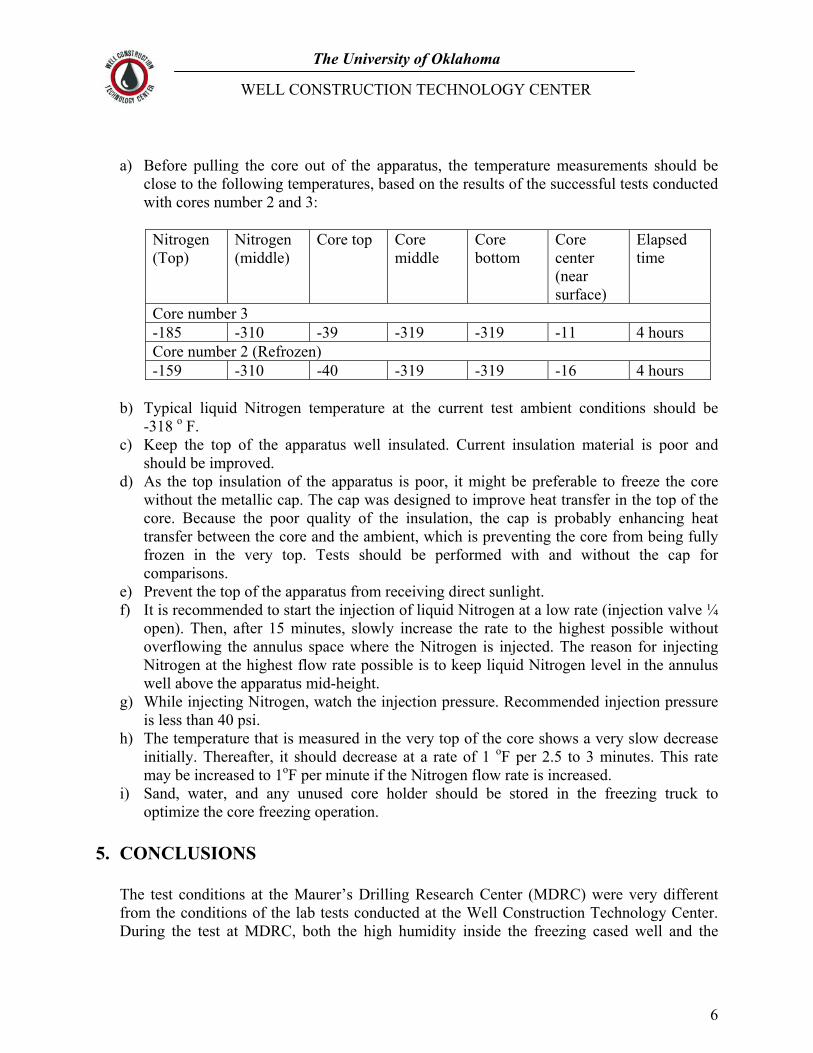
a) Before pulling the core out of the apparatus, the temperature measurements should be close to the following temperatures, based on the results of the successful tests conducted with cores number 2 and 3:
Nitrogen (Top)
Nitrogen (middle)
Core top Core middle
Core bottom
Core center (near surface)
Elapsed time
Core number 3 -185 -310 -39 -319 -319 -11 4 hours Core number 2 (Refrozen) -159 -310 -40 -319 -319 -16 4 hours
b) Typical liquid Nitrogen temperature at the current test ambient conditions should be
-318 o F. c) Keep the top of the apparatus well insulated. Current insulation material is poor and
should be improved. d) As the top insulation of the apparatus is poor, it might be preferable to freeze the core
without the metallic cap. The cap was designed to improve heat transfer in the top of the core. Because the poor quality of the insulation, the cap is probably enhancing heat transfer between the core and the ambient, which is preventing the core from being fully frozen in the very top. Tests should be performed with and without the cap for comparisons.
e) Prevent the top of the apparatus from receiving direct sunlight. f) It is recommended to start the injection of liquid Nitrogen at a low rate (injection valve ¼
open). Then, after 15 minutes, slowly increase the rate to the highest possible without overflowing the annulus space where the Nitrogen is injected. The reason for injecting Nitrogen at the highest flow rate possible is to keep liquid Nitrogen level in the annulus well above the apparatus mid-height.
g) While injecting Nitrogen, watch the injection pressure. Recommended injection pressure is less than 40 psi.
h) The temperature that is measured in the very top of the core shows a very slow decrease initially. Thereafter, it should decrease at a rate of 1 oF per 2.5 to 3 minutes. This rate may be increased to 1oF per minute if the Nitrogen flow rate is increased.
i) Sand, water, and any unused core holder should be stored in the freezing truck to optimize the core freezing operation.
5. CONCLUSIONS
The test conditions at the Maurer’s Drilling Research Center (MDRC) were very different from the conditions of the lab tests conducted at the Well Construction Technology Center. During the test at MDRC, both the high humidity inside the freezing cased well and the
6
WELL CONSTRUCTION TECHNOLOGY CENTER
The University of Oklahoma
reasonable high temperature of the surrounding formation were very detrimental to a fast freezing of the sand/water mixture. This scenario was further complicated by the unavailability of appropriate insulation material on site. Thus, the insulation of the core apparatus was improvised and performed with white wrapping foam material. However, even with such adversities, successful frozen rocks could be produced in about four hours, which shows the excellent efficiency of the hydrate test coring apparatus developed at the Well Construction Technology Center.
6. REFERENCES
1. Goel, Naval, De Sousa, J. T. V., Flenniken, J., and Bishop, M.: “Report on Testing for Laboratory Simulation of Alaska Frozen Rock Encountered During Hydrate Coring”, The University of Oklahoma, Well Construction Technology Center, October 2002.
.
7

WELL CONSTRUCTION TECHNOLOGY CENTER
The University of Oklahoma
APPENDIX A-1
Testing Results
8
WELL CONSTRUCTION TECHNOLOGY CENTER
The University of Oklahoma
Test #1 - A
-350-300-250-200-150-100
-500
50100150
1:30PM
2:00PM
2:30PM
3:00PM
3:30PM
4:00PM
4:30PM
5:00PM
5:30PMTime
Tem
pera
ture
(oF)
Nitrogen (Top)Nitrogen (Middle)Core (Top)Core (Middle)Core (Bottom)AmbientLinear (Ambient)
Figure 1: Results of Test #1 – A
Test #1 - B
-150
-100
-50
0
50
100
7:55 AM 8:15 AM 8:35 AM 8:55 AM 9:15 AM 9:35 AM 9:55 AM
Time
Tem
pera
ture
(oF)
Nitrogen (Top)Nitrogen (Middle)Core (Top)Core (Middle)Core (Bottom)AmbientLinear (Ambient)
Figure 2: Results of Test #1 – B
A-1
WELL CONSTRUCTION TECHNOLOGY CENTER
The University of Oklahoma
Test #2 - A
-350-300-250-200-150-100-50
050
100150
2:00PM
2:15PM
2:30PM
2:45PM
3:00PM
3:15PM
3:30PM
3:45PM
4:00PM
4:15PM
Time
Tem
pera
ture
(oF)
Nitrogen (Top)Nitrogen (Middle)Core (Top)Core (Middle)Core (Bottom)AmbientLinear (Ambient)
Figure 3: Results of Test #2 – A
Test #3
-350
-300
-250
-200
-150
-100
-50
0
50
100
150
9:45AM
10:15AM
10:45AM
11:15AM
11:45AM
12:15PM
12:45PM
1:15PM
1:45PM
Time
Temp
eratur
e (oF
)
Nitrogen (Top)Nitrogen (Middle)Core (Top)Core (Middle)Core (Bottom)AmbientCore (Top/Center)Linear (Ambient)
Figure 4: Results of Test #3
A-2
WELL CONSTRUCTION TECHNOLOGY CENTER
The University of Oklahoma
Test #2 - B
-350
-300
-250
-200
-150
-100
-50
0
50
100
2:20 PM 2:40 PM 3:00 PM 3:20 PM 3:40 PM 4:00 PM 4:20 PM 4:40 PM
Time
Tem
pera
ture
(oF) Nitrogen (Top)
Nitrogen (Middle)Core (Top)Core (Middle)Core (Bottom)Core (Top/Center)
Figure 5: Results of Test #2 - B
A-3
WELL CONSTRUCTION TECHNOLOGY CENTER
The University of Oklahoma
APPENDIX A-2
Pictures - Tests Details
A-4

WELL CONSTRUCTION TECHNOLOGY CENTER
The University of Oklahoma
Figure 6: Maurer’s Drilling Research Center
Figure 7: Core Placement in the Freezing Cased Well
A-5
WELL CONSTRUCTION TECHNOLOGY CENTER
The University of Oklahoma
Figure 8: Core Placement in the Freezing Cased Well (Cont’d)
Figure 9: Nitrogen Reservoirs
A-6

WELL CONSTRUCTION TECHNOLOGY CENTER
The University of Oklahoma
Figure 10: Core Preparation before Freezing
Figure 11: Core Preparation before Freezing (Cont’d)
A-7

WELL CONSTRUCTION TECHNOLOGY CENTER
The University of Oklahoma
Figure 12: Core Preparation before Freezing (Cont’d)
Figure 13: Thermocouple Readers
A-8
WELL CONSTRUCTION TECHNOLOGY CENTER
The University of Oklahoma
Figure 14: Details of the Insulation of the Top of the Apparatus
Figure 15: Direct Incidence of Sunlight Protection on the Top of the Apparatus
A-9

WELL CONSTRUCTION TECHNOLOGY CENTER
The University of Oklahoma
Figure 16: Bringing Core #1 from the Core Apparatus to the Freezing Truck
Figure 17: Bringing Core #1 from the Core Apparatus to the Freezing Truck
A-10
WELL CONSTRUCTION TECHNOLOGY CENTER
The University of Oklahoma
Figure 18: Bringing Core #1 from the Core Apparatus to the Freezing Truck (Cont’d)
Figure 19: Bringing core #1 from the Core Apparatus to the Freezing Truck (Cont’d)
A-11
WELL CONSTRUCTION TECHNOLOGY CENTER
The University of Oklahoma
Figure 20: Details of Removing Frozen Core #3 from the Apparatus
Figure 21: Details of Removing Frozen Core #3 from the Apparatus (Cont’d)
A-12

WELL CONSTRUCTION TECHNOLOGY CENTER
The University of Oklahoma
Figure 22: Details of Removing Frozen Core #3 from the Apparatus (Cont’d)
Figure 23: Details of Removing Frozen Core #3 from the Apparatus (Cont’d)
A-13
WELL CONSTRUCTION TECHNOLOGY CENTER
The University of Oklahoma
Figure 24: Details of Removing Frozen Core #3 from the Apparatus (Cont’d)
Figure 25: Coring Tools
A-14
WELL CONSTRUCTION TECHNOLOGY CENTER
The University of Oklahoma
Figure 26: Drilling Rig
Figure 27: Frozen Core Preparation Before Coring Operation
A-15
WELL CONSTRUCTION TECHNOLOGY CENTER
The University of Oklahoma
Figure 28: Frozen Core Preparation Before Coring Operation (Cont’d)
Figure 29: Frozen Core Preparation Before Coring Operation (Cont’d)
A-16
WELL CONSTRUCTION TECHNOLOGY CENTER
The University of Oklahoma
Figure 30: Frozen Core Placement in the Well to Be Cored
Figure 31: Frozen Core in Place to Be Cored
A-17
WELL CONSTRUCTION TECHNOLOGY CENTER
The University of Oklahoma
Figure 32: Wellhead Preparation Before Coring
Figure 33: Coring Tools Preparation
A-18
WELL CONSTRUCTION TECHNOLOGY CENTER
The University of Oklahoma
Figure 34: Coring Operation
Figure 35: Coring Operation
A-19

WELL CONSTRUCTION TECHNOLOGY CENTER
The University of Oklahoma
Figure 36: Details of the Recovered Frozen Core (Cont’d)
Figure 37: Details of the Recovered Frozen Core (Cont’d)
A-20
DE-FC26-01NT41331 - 50 - Maurer Technology Inc.
Appendix B
Hydrate Test Log
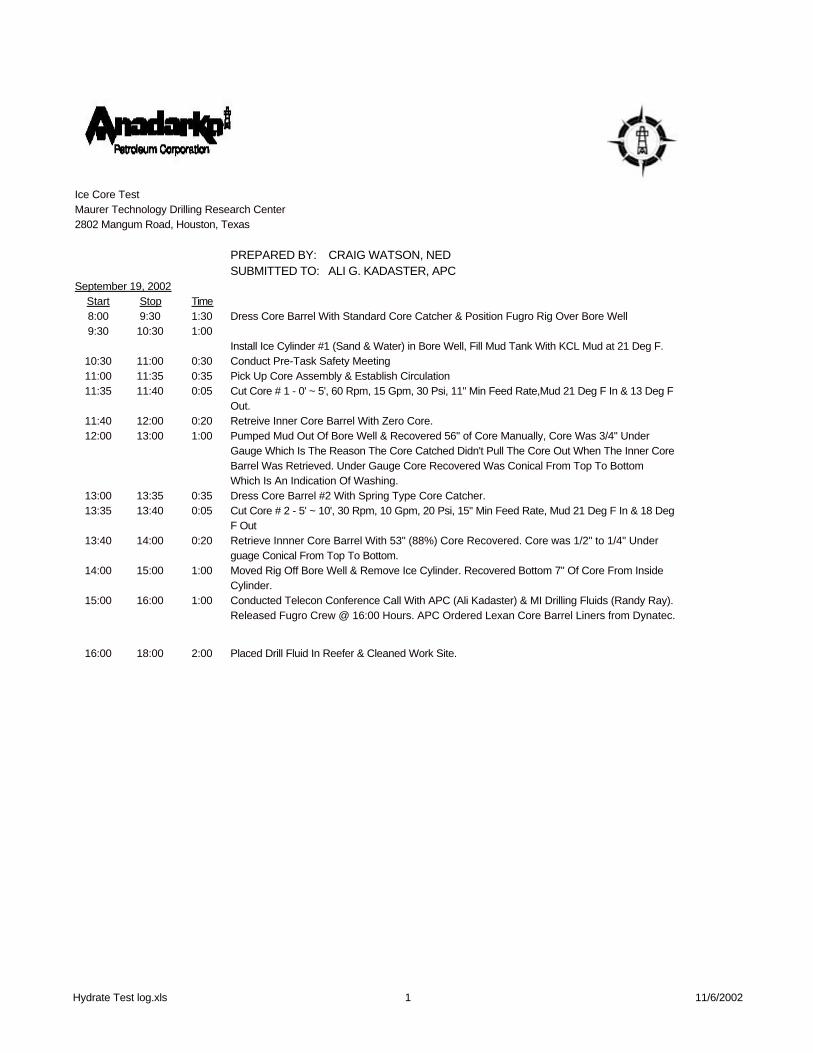
Ice Core TestMaurer Technology Drilling Research Center2802 Mangum Road, Houston, Texas
PREPARED BY: CRAIG WATSON, NEDSUBMITTED TO: ALI G. KADASTER, APC
Start Stop Time8:00 9:30 1:30 Dress Core Barrel With Standard Core Catcher & Position Fugro Rig Over Bore Well9:30 10:30 1:00
Install Ice Cylinder #1 (Sand & Water) in Bore Well, Fill Mud Tank With KCL Mud at 21 Deg F.10:30 11:00 0:30 Conduct Pre-Task Safety Meeting11:00 11:35 0:35 Pick Up Core Assembly & Establish Circulation11:35 11:40 0:05 Cut Core # 1 - 0' ~ 5', 60 Rpm, 15 Gpm, 30 Psi, 11" Min Feed Rate,Mud 21 Deg F In & 13 Deg F
Out.11:40 12:00 0:20 Retreive Inner Core Barrel With Zero Core.12:00 13:00 1:00 Pumped Mud Out Of Bore Well & Recovered 56" of Core Manually, Core Was 3/4" Under
Gauge Which Is The Reason The Core Catched Didn't Pull The Core Out When The Inner Core Barrel Was Retrieved. Under Gauge Core Recovered Was Conical From Top To Bottom Which Is An Indication Of Washing.
13:00 13:35 0:35 Dress Core Barrel #2 With Spring Type Core Catcher.13:35 13:40 0:05 Cut Core # 2 - 5' ~ 10', 30 Rpm, 10 Gpm, 20 Psi, 15" Min Feed Rate, Mud 21 Deg F In & 18 Deg
F Out13:40 14:00 0:20 Retrieve Innner Core Barrel With 53" (88%) Core Recovered. Core was 1/2" to 1/4" Under
guage Conical From Top To Bottom.14:00 15:00 1:00 Moved Rig Off Bore Well & Remove Ice Cylinder. Recovered Bottom 7" Of Core From Inside
Cylinder.15:00 16:00 1:00 Conducted Telecon Conference Call With APC (Ali Kadaster) & MI Drilling Fluids (Randy Ray).
Released Fugro Crew @ 16:00 Hours. APC Ordered Lexan Core Barrel Liners from Dynatec.
16:00 18:00 2:00 Placed Drill Fluid In Reefer & Cleaned Work Site.
September 19, 2002
Hydrate Test log.xls 1 11/6/2002
Ice Core TestMaurer Technology Drilling Research Center
PREPARED BY: CRAIG WATSON, NEDSUBMITTED TO: ALI G. KADASTER, APC
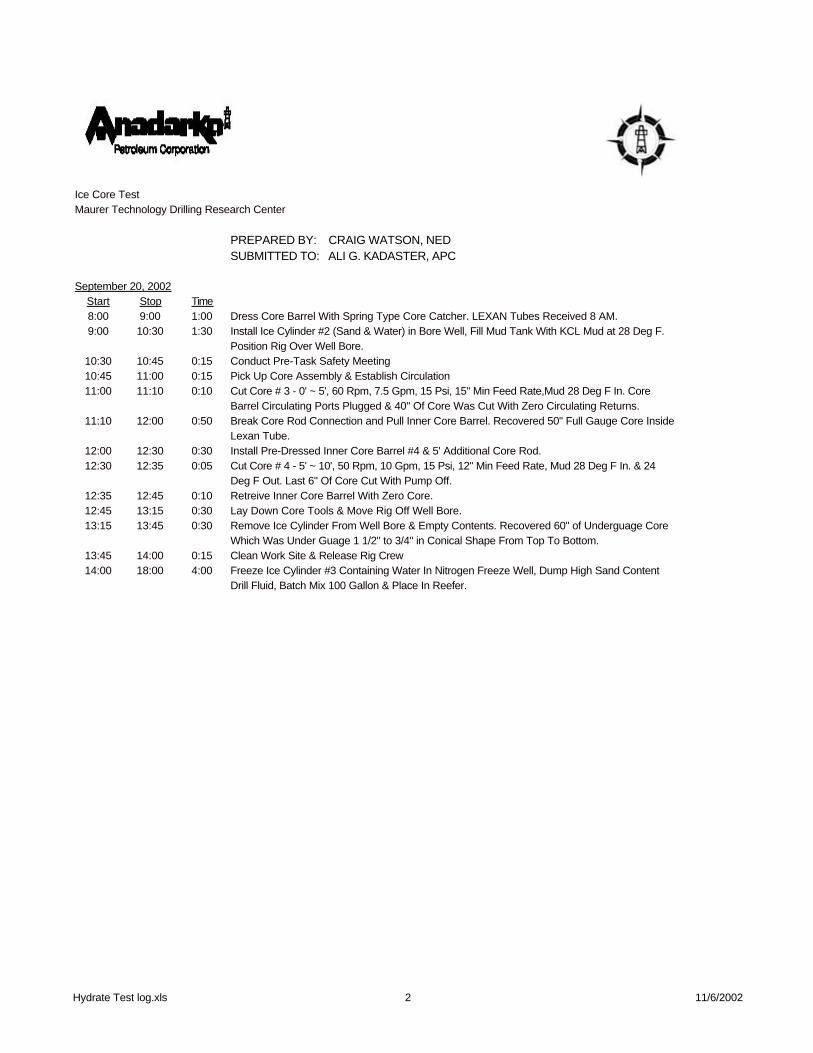
Start Stop Time8:00 9:00 1:00 Dress Core Barrel With Spring Type Core Catcher. LEXAN Tubes Received 8 AM.9:00 10:30 1:30 Install Ice Cylinder #2 (Sand & Water) in Bore Well, Fill Mud Tank With KCL Mud at 28 Deg F.
Position Rig Over Well Bore.10:30 10:45 0:15 Conduct Pre-Task Safety Meeting10:45 11:00 0:15 Pick Up Core Assembly & Establish Circulation11:00 11:10 0:10 Cut Core # 3 - 0' ~ 5', 60 Rpm, 7.5 Gpm, 15 Psi, 15" Min Feed Rate,Mud 28 Deg F In. Core
Barrel Circulating Ports Plugged & 40" Of Core Was Cut With Zero Circulating Returns. 11:10 12:00 0:50 Break Core Rod Connection and Pull Inner Core Barrel. Recovered 50" Full Gauge Core Inside
Lexan Tube.12:00 12:30 0:30 Install Pre-Dressed Inner Core Barrel #4 & 5' Additional Core Rod.12:30 12:35 0:05 Cut Core # 4 - 5' ~ 10', 50 Rpm, 10 Gpm, 15 Psi, 12" Min Feed Rate, Mud 28 Deg F In. & 24
Deg F Out. Last 6" Of Core Cut With Pump Off. 12:35 12:45 0:10 Retreive Inner Core Barrel With Zero Core.12:45 13:15 0:30 Lay Down Core Tools & Move Rig Off Well Bore.13:15 13:45 0:30 Remove Ice Cylinder From Well Bore & Empty Contents. Recovered 60" of Underguage Core
Which Was Under Guage 1 1/2" to 3/4" in Conical Shape From Top To Bottom.13:45 14:00 0:15 Clean Work Site & Release Rig Crew14:00 18:00 4:00 Freeze Ice Cylinder #3 Containing Water In Nitrogen Freeze Well, Dump High Sand Content
Drill Fluid, Batch Mix 100 Gallon & Place In Reefer.
September 20, 2002
Hydrate Test log.xls 2 11/6/2002
Ice Core TestMaurer Technology Drilling Research Center
PREPARED BY: CRAIG WATSON, NEDSUBMITTED TO: ALI G. KADASTER, APC
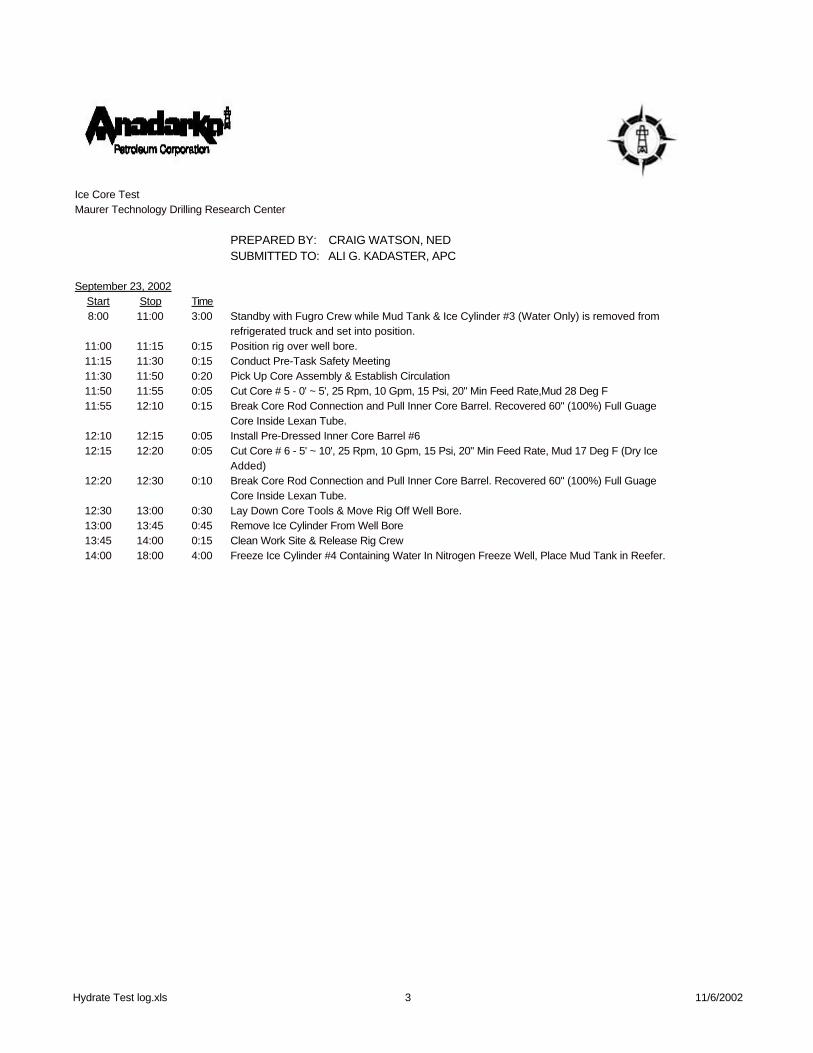
Start Stop Time8:00 11:00 3:00 Standby with Fugro Crew while Mud Tank & Ice Cylinder #3 (Water Only) is removed from
refrigerated truck and set into position.11:00 11:15 0:15 Position rig over well bore.11:15 11:30 0:15 Conduct Pre-Task Safety Meeting11:30 11:50 0:20 Pick Up Core Assembly & Establish Circulation11:50 11:55 0:05 Cut Core # 5 - 0' ~ 5', 25 Rpm, 10 Gpm, 15 Psi, 20" Min Feed Rate,Mud 28 Deg F 11:55 12:10 0:15 Break Core Rod Connection and Pull Inner Core Barrel. Recovered 60" (100%) Full Guage
Core Inside Lexan Tube.12:10 12:15 0:05 Install Pre-Dressed Inner Core Barrel #6 12:15 12:20 0:05 Cut Core # 6 - 5' ~ 10', 25 Rpm, 10 Gpm, 15 Psi, 20" Min Feed Rate, Mud 17 Deg F (Dry Ice
Added)12:20 12:30 0:10 Break Core Rod Connection and Pull Inner Core Barrel. Recovered 60" (100%) Full Guage
Core Inside Lexan Tube.12:30 13:00 0:30 Lay Down Core Tools & Move Rig Off Well Bore.13:00 13:45 0:45 Remove Ice Cylinder From Well Bore 13:45 14:00 0:15 Clean Work Site & Release Rig Crew14:00 18:00 4:00 Freeze Ice Cylinder #4 Containing Water In Nitrogen Freeze Well, Place Mud Tank in Reefer.
September 23, 2002
Hydrate Test log.xls 3 11/6/2002

Ice Core TestMaurer Technology Drilling Research Center
PREPARED BY: CRAIG WATSON, NEDSUBMITTED TO: ALI G. KADASTER, APC
Start Stop Time8:00 10:30 2:30 Standby with Fugro Crew while Mud Tank & Ice Cylinder #4 (Water Only) is removed from
refrigerated truck and set into position.10:30 10:45 0:15 Conduct Pre-Task Safety Meeting10:45 11:00 0:15 Position rig over well bore, Pick Up Core Assembly & Establish Circulation.11:00 11:05 0:05 Cut Core # 7 - 0' ~ 5', 70 Rpm, 25 Gpm, 40 Psi, 20" Min Feed Rate,Mud 25 Deg F 11:05 11:15 0:10 Break Core Rod Connection and Pull Inner Core Barrel. Recovered 60" (100%) Full Guage
Core Inside Lexan Tube.11:15 11:25 0:10 Install Pre-Dressed Inner Core Barrel #8 11:25 11:30 0:05 Cut Core # 8 - 5' ~ 10', 120 Rpm, 60 Gpm, 75 Psi, 20" Min Feed Rate, Mud 24 Deg F 11:30 11:45 0:15 Break Core Rod Connection and Pull Inner Core Barrel. Recovered 60" (100%) Full Guage
Core Inside Lexan Tube.11:45 12:00 0:15 Lay Down Core Tools & Move Rig Off Well Bore.12:00 12:30 0:30 Clean Work Site & Release Rig Crew12:30 14:00 1:30 Remove Ice Cylinder From Well Bore 14:00 18:00 4:00 Freeze Ice Cylinder #5 Containing Water & 20/40 Sand Under Vacum In Nitrogen Freeze Well,
Place Mud Tank in Reefer.
September 24, 2002
Hydrate Test log.xls 4 11/6/2002
Ice Core TestMaurer Technology Drilling Research Center
PREPARED BY: CRAIG WATSON, NEDSUBMITTED TO: ALI G. KADASTER, APC
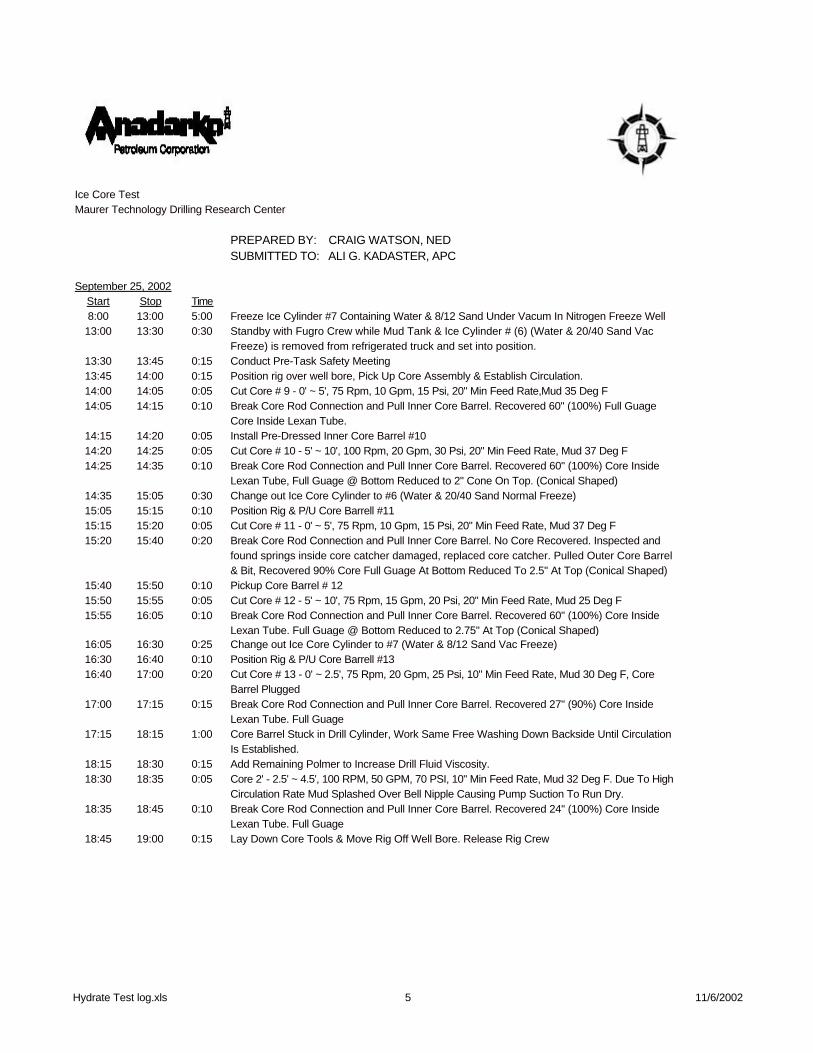
Start Stop Time8:00 13:00 5:00 Freeze Ice Cylinder #7 Containing Water & 8/12 Sand Under Vacum In Nitrogen Freeze Well13:00 13:30 0:30 Standby with Fugro Crew while Mud Tank & Ice Cylinder # (6) (Water & 20/40 Sand Vac
Freeze) is removed from refrigerated truck and set into position.13:30 13:45 0:15 Conduct Pre-Task Safety Meeting13:45 14:00 0:15 Position rig over well bore, Pick Up Core Assembly & Establish Circulation.14:00 14:05 0:05 Cut Core # 9 - 0' ~ 5', 75 Rpm, 10 Gpm, 15 Psi, 20" Min Feed Rate,Mud 35 Deg F 14:05 14:15 0:10 Break Core Rod Connection and Pull Inner Core Barrel. Recovered 60" (100%) Full Guage
Core Inside Lexan Tube.14:15 14:20 0:05 Install Pre-Dressed Inner Core Barrel #10 14:20 14:25 0:05 Cut Core # 10 - 5' ~ 10', 100 Rpm, 20 Gpm, 30 Psi, 20" Min Feed Rate, Mud 37 Deg F 14:25 14:35 0:10 Break Core Rod Connection and Pull Inner Core Barrel. Recovered 60" (100%) Core Inside
Lexan Tube, Full Guage @ Bottom Reduced to 2" Cone On Top. (Conical Shaped)14:35 15:05 0:30 Change out Ice Core Cylinder to #6 (Water & 20/40 Sand Normal Freeze)15:05 15:15 0:10 Position Rig & P/U Core Barrell #1115:15 15:20 0:05 Cut Core # 11 - 0' ~ 5', 75 Rpm, 10 Gpm, 15 Psi, 20" Min Feed Rate, Mud 37 Deg F 15:20 15:40 0:20 Break Core Rod Connection and Pull Inner Core Barrel. No Core Recovered. Inspected and
found springs inside core catcher damaged, replaced core catcher. Pulled Outer Core Barrel & Bit, Recovered 90% Core Full Guage At Bottom Reduced To 2.5" At Top (Conical Shaped)
15:40 15:50 0:10 Pickup Core Barrel # 1215:50 15:55 0:05 Cut Core # 12 - 5' ~ 10', 75 Rpm, 15 Gpm, 20 Psi, 20" Min Feed Rate, Mud 25 Deg F 15:55 16:05 0:10 Break Core Rod Connection and Pull Inner Core Barrel. Recovered 60" (100%) Core Inside
Lexan Tube. Full Guage @ Bottom Reduced to 2.75" At Top (Conical Shaped)16:05 16:30 0:25 Change out Ice Core Cylinder to #7 (Water & 8/12 Sand Vac Freeze)16:30 16:40 0:10 Position Rig & P/U Core Barrell #1316:40 17:00 0:20 Cut Core # 13 - 0' ~ 2.5', 75 Rpm, 20 Gpm, 25 Psi, 10" Min Feed Rate, Mud 30 Deg F, Core
Barrel Plugged17:00 17:15 0:15 Break Core Rod Connection and Pull Inner Core Barrel. Recovered 27" (90%) Core Inside
Lexan Tube. Full Guage17:15 18:15 1:00 Core Barrel Stuck in Drill Cylinder, Work Same Free Washing Down Backside Until Circulation
Is Established. 18:15 18:30 0:15 Add Remaining Polmer to Increase Drill Fluid Viscosity.18:30 18:35 0:05 Core 2' - 2.5' ~ 4.5', 100 RPM, 50 GPM, 70 PSI, 10" Min Feed Rate, Mud 32 Deg F. Due To High
Circulation Rate Mud Splashed Over Bell Nipple Causing Pump Suction To Run Dry.18:35 18:45 0:10 Break Core Rod Connection and Pull Inner Core Barrel. Recovered 24" (100%) Core Inside
Lexan Tube. Full Guage18:45 19:00 0:15 Lay Down Core Tools & Move Rig Off Well Bore. Release Rig Crew
September 25, 2002
Hydrate Test log.xls 5 11/6/2002


![GOM2: Prospecting, Drilling and Sampling Coarse-Grained ...1].pdfGOM2: Prospecting, Drilling and Sampling Coarse-Grained Hydrate Reservoirs in the Deepwater Gulf of Mexico Peter B.](https://static.fdocuments.in/doc/165x107/5ebf49db558d174493402009/gom2-prospecting-drilling-and-sampling-coarse-grained-1pdf-gom2-prospecting.jpg)