Hyderabad International Trade Exposition...
70
Hyderabad International Trade Exposition Centre Survey Nos. 5/6 (P), 5/7 (P), 5/8, 5/9, 5/10, 5/11, 5/12, 5/13, 5/14, 5/15, 5/16, 5/17, 5/18, 5/19, 5/19, 5/20, 5/21, 5/22, 5/23, IZZATHNAGAR, SERILINGAMPALLY, RANGA REDDY DISTRICT SUBMITTED TO STATE LEVEL ENVIRONMENT IMPACT ASSESSMENT AUTHORITY, TELANGANA STATE GOVERNMENT OF INDIA Submitted By Hyderabad International Trade Exposition Centre First Floor, Trade Fair Office Building HITEX Exhibition Center, Izzat Nagar Hyderabad - 500 084 , Phone: +91-40 2311 2121 / 22 / 23 Fax: +91-40 2311 2124 Studies & Documentation by M/s Team Labs and Consultants (An ISO Certified Organization) B-115 - 117 & 509, Annapurna Block, Aditya Enclave, Ameerpet, Hyderabad- 500 038 Phone: 91-040-23748555/616 Fax : 91-040-23748666 e-mail: [email protected] FORM I AND FORM IA
Transcript of Hyderabad International Trade Exposition...

Hyderabad International TradeExposition Centre
Survey Nos. 5/6 (P), 5/7 (P), 5/8, 5/9, 5/10, 5/11, 5/12,5/13, 5/14, 5/15, 5/16, 5/17, 5/18, 5/19, 5/19, 5/20,5/21, 5/22, 5/23, IZZATHNAGAR, SERILINGAMPALLY,
RANGA REDDY DISTRICT
SUBMITTED TOSTATE LEVEL ENVIRONMENT IMPACT ASSESSMENT AUTHORITY,
TELANGANA STATEGOVERNMENT OF INDIA
Submitted ByHyderabad International Trade Exposition CentreFirst Floor, Trade Fair Office BuildingHITEX Exhibition Center,Izzat Nagar Hyderabad - 500 084 ,Phone: +91-40 2311 2121 / 22 / 23Fax: +91-40 2311 2124
Studies & Documentation byM/s Team Labs and Consultants(An ISO Certified Organization)B-115 - 117 & 509,Annapurna Block, Aditya Enclave,Ameerpet, Hyderabad- 500 038Phone: 91-040-23748555/616Fax : 91-040-23748666e-mail: [email protected]
FORM I AND FORM IA

F - 1
APPENDIX I
(See paragraph 6) FORM 1S.No Item Details1
Name of the Project/sHYDERABAD INTERNATIONAL TRADEEXPOSTION CENTRE
2 S.No. in the Schedule B category3 Proposed capacity/area/length/
tonnage to be handled/commandarea/lease area/number of wells tobe drilled
Annexure I
Expected cost of the project: 61.0 crores
4 New/Expansion/Modernization New5 Existing Capacity/Area etc. NA6 Category of Project i.e 'A' or 'B' B category7 Does it attract the general condition?
If yes, please specify No8 Does it attract the Specific condition?
If yes, please specify. No9 Location
Plot/Survey/Khasra No. Survey Nos. 5/6 (Part), 5/7 (Part), 5/8, 5/9,5/10, 5/11, 5/12, 5/13, 5/14, 5/15, 5/16, 5/17,5/18, 5/19, 5/19, 5/20, 5/21, 5/22, 5/23,
Village IzzathnagarTehsil SerilingampallyDistrict Ranga Reddy DistrictState Telangana
10 Nearest railway station/airport alongwith distance in kms.
Hitech City railway station at a distance of 1.2km
11 Nearest Town, City, DistrictHeadquarters along with distance inkms.
Hyderabad
12 Village Panchayats, Zilla Parishad,Municipal Corporation, Local body(complete postal address withtelephone nos. to be given)
HMDA
13 Name of the Applicant Mr. K V Nagendra Prasad14
Registered Address
Hyderabad International Trade ExpositionCentreFirst Floor, Trade Fair Office BuildingHITEX Exhibition Center,Izzat Nagar Hyderabad - 500 084
15
Address for Correspondence:
Hyderabad International Trade ExpositionCentreFirst Floor, Trade Fair Office BuildingHITEX Exhibition Center,Izzat Nagar Hyderabad - 500 084 ,
Name Mr. K V Nagendra Prasad

F - 2
Designation(Owner/Partner/CEO) Authorised Signatory
Address
Hyderabad International Trade ExpositionCentreFirst Floor, Trade Fair Office BuildingHITEX Exhibition Center,Izzat Nagar Hyderabad - 500 084 ,
Pin Code 500 084
E-mail [email protected] Number Phone: +91-40 2311 2121 / 22 / 23Fax No. 91-40 2311 2124
16 Details of alternative Sites examined,if any. Location of these sites shouldbe shown on a topo sheet.
Village-District-StateNA
17 Interlinked Projects No18 Whether separate application of
interlinked project has beensubmitted?
19 If yes, date of submission20 If no, reason21 Whether the proposal involves
approval/clearance under: if yes,details of the same and their status tobe given.(a) The Forest (Conservation) Act,1980? (b) The Wildlife(Protection) Act, 1972 ? (c)The C.R.Z Notification, 1991 ?
No
22 Whether there is any GovernmentOrder/Policy relevant/relating to thesite?
No
23 Forest land involved (hectares) No24 Whether there is any location
pending against the project and /orland in which the project is proposeto be set up?(a) Name of the Court(b) Case No(c) Orders/directions of the Court, ifany and its relevance with theproposed project.
No

F - 3
(I) Activity
1. Construction, operation or decommissioning of the Project involving actions, which willcause physical changes in the locality (topography, land use, changes in water bodies, etc.)
S.No. Information/Checklistconfirmation Yes/No
Details thereof (with approximatequantities /rates, whereverpossible) with source of informationdata
1.1 Permanent or temporary changein land use, land cover ortopography including increase inintensity of land use (with respectto local land use plan)
Yes The site area is located in HyderabadMetropolitan Development Authorityarea under Izzathnagar,Serilingmaplally. The present landuse is Exhibition Hall 4 andinterconnection of Exhibition Hall 1and 3 in Hyderabad InternationalTrade Exposition Centre. Presentlythe land is barren and is not used forany productive purpose. Theproposed project shall enhance theland cover.
1.2 Clearance of existing land,vegetation and buildings?
No The land is barren containing mainlyshrubs and bushes. The same shallbe cleared.
1.3 Creation of new land uses? No The present land use is ExhibitionHall 4 and interconnection ofExhibition Hall 1 and 3 in HyderabadInternational Trade Exposition Centre.
1.4 Pre-construction investigationse.g. bore houses, soil testing?
Yes Soil test done and soil load bearingcapacity established.
1.5 Construction works? Yes The project is a construction projectof Exhibition Hall 4 andinterconnection of Exhibition Hall 1and 3 in Hyderabad InternationalTrade Exposition Centre.
1.6 Demolition works? No1.7 Temporary sites used for
construction works or housing ofconstruction workers?
Yes No labor camp will be provided atsite during construction activity.
1.8 Above ground buildings, structuresor earthworks including linearstructures, cut and fill orexcavations
Yes Built up Area: Annexure I Cut and Fillquantity: Annexure II
1.9 Underground works includingmining or tunneling?
No
1.10 Reclamation works? No1.11 Dredging? No1.12 Offshore structures? No
F - 4
S.No. Information/Checklistconfirmation Yes/No
Details thereof (with approximatequantities /rates, whereverpossible) with source of informationdata
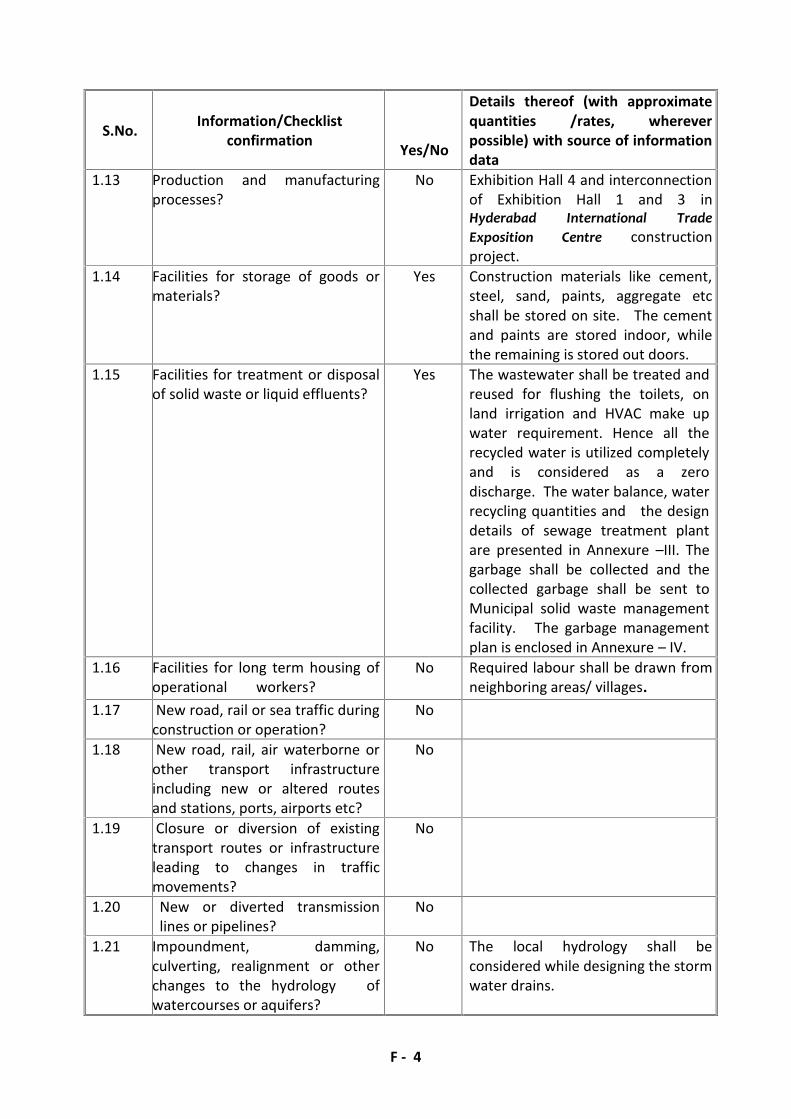
1.13 Production and manufacturingprocesses?
No Exhibition Hall 4 and interconnectionof Exhibition Hall 1 and 3 inHyderabad International TradeExposition Centre constructionproject.
1.14 Facilities for storage of goods ormaterials?
Yes Construction materials like cement,steel, sand, paints, aggregate etcshall be stored on site. The cementand paints are stored indoor, whilethe remaining is stored out doors.
1.15 Facilities for treatment or disposalof solid waste or liquid effluents?
Yes The wastewater shall be treated andreused for flushing the toilets, onland irrigation and HVAC make upwater requirement. Hence all therecycled water is utilized completelyand is considered as a zerodischarge. The water balance, waterrecycling quantities and the designdetails of sewage treatment plantare presented in Annexure –III. Thegarbage shall be collected and thecollected garbage shall be sent toMunicipal solid waste managementfacility. The garbage managementplan is enclosed in Annexure – IV.
1.16 Facilities for long term housing ofoperational workers?
No Required labour shall be drawn fromneighboring areas/ villages.
1.17 New road, rail or sea traffic duringconstruction or operation?
No
1.18 New road, rail, air waterborne orother transport infrastructureincluding new or altered routesand stations, ports, airports etc?
No
1.19 Closure or diversion of existingtransport routes or infrastructureleading to changes in trafficmovements?
No
1.20 New or diverted transmissionlines or pipelines?
No
1.21 Impoundment, damming,culverting, realignment or otherchanges to the hydrology ofwatercourses or aquifers?
No The local hydrology shall beconsidered while designing the stormwater drains.

F - 5
S.No. Information/Checklistconfirmation Yes/No
Details thereof (with approximatequantities /rates, whereverpossible) with source of informationdata
1.22 Stream crossings? No1.23 Abstraction or transfers of water
form ground or surface waters?Yes The domestic water requirement
during occupation shall be drawnfrom HMWSSB. Groundwater/treated wastewater ifavailable, shall be used duringconstruction.
1.24 Changes in water bodies or theland surface affecting drainage orrun-off?
No The proposed storm water drainsshall consider increased run off dueto the project and shall be providedwith sufficient number of collectionsumps.
1.25 Transport of personnel ormaterials for construction,operation or decommissioning?
Yes Trucks shall be used for transportingthe materials.
1.26 Long-term dismantling ordecommissioning or restorationworks?
No
1.27 Ongoing activity duringdecommissioning which couldhave an impact on theenvironment?
No
1.28 Influx of people to an area ineither temporarily orpermanently?
Yes The local area is developing at afaster pace due to industrializationand commercial/ Residentialdevelopment in the surroundingareas.
1.29 Introduction of alien species? No
1.30 Loss of native species or geneticdiversity?
No
1.31 Any other actions? No

F - 6
2. Use of Natural resources for construction or operation of the Project (such as land, water,materials or energy, especially any resources which are non-renewable or in short supply):
S.No. Information/checklist confirmation Yes/No
Details thereof (withapproximate quantities /rates,wherever possible) with sourceof information data
2.1 Land especially undeveloped oragricultural land (ha)
Yes Undeveloped land of 233871.9m2
2.2 Water (expected source & competingusers) unit: KLD
Yes HMWSSB. Water requirementduring occupation is 129.9 KLD.During construction the waterrequirement is 60 KLD. Theavailability of water forHyderabad city are presented inAnnexure – V.
2.3 Minerals (MT) No
2.4 Construction material – stone, aggregates,sand / soil (expected source – MT)
Yes Annexure – VI: Lead distances ofconstruction materials. Annexure– VII: Quantity of constructionmaterial requirement.
2.5 Forests and timber (source – MT) Yes Local authorized Suppliers
2.6 Energy including electricity and fuels(source, competing users) Unit: fuel (MT),energy (MW)
Yes DG sets and constructionequipment shall be used duringconstruction, which shall usemainly HSD as fuel. The energyrequirement during occupation ispresented in Annexure – VIII.DG sets (625 kVA X 3 nos. + 350kVA X 1 no.) shall be used duringoccupation in the event of powershut down by TSTRANSCO toprovide power for lifts, streetlighting, common lighting andSewage treatment plant.
2.7 Any other natural resources (useappropriate standard units)
No

F - 7
3. Use, storage, transport, handling or production of substances or materials, which could beharmful to human health or the environment or raise concerns about actual or perceived risksto human health.
S.No. Information/Checklist confirmation Yes/No
Details thereof (withapproximate quantities/rates,wherever possible) with sourceof information data
3.1 Use of substances or materials, which arehazardous (as per MSIHC rules) to humanhealth or the environment (flora, fauna,and water supplies)
No Hazardous materials used are;HSD, Paints etc.
3.2 Changes in occurrence of disease or affectdisease vectors (e.g. insect or waterborne diseases)
No
3.3 Affect the welfare of people e.g. bychanging living conditions?
Yes The project shall provideoccupation facility for3000 employees.
3.4 Vulnerable groups of people who couldbe affected by the project e.g. hospitalpatients, children, the elderly etc.,
No
3.5 Any other causes No

F - 8
4. Production of solid wastes during construction or operation or decommissioning(MT/month)
S.No. Information/Checklist confirmation Yes/No
Details thereof (with approximatequantities/rates, whereverpossible) with source ofinformation data
4.1 Spoil, overburden or mine wastes No
4.2 Municipal waste (domestic and orcommercial wastes)
Yes 842.0 kg/day
4.3 Hazardous wastes (as per HazardousWaste Management Rules)
Yes Used oil: 145 l/yearUsed Batteries: 14 nos. /year
4.4 Other industrial process wastes No
4.5 Surplus product No
4.6 Sewage sludge or other sludge fromeffluent treatment
Yes 9.0 kg/day sludge from STP shall bereused as manure.
4.7 Construction or demolition wastes Yes
4.8 Redundant machinery or equipment No
4.9 Contaminated soils or other materials No
4.10 Agricultural wastes No
4.11 Other solid wastes No

F - 9
5.0 Release of pollutants or any hazardous, toxic or noxious substances to air (Kg/hr)
S.No. Information/Checklist confirmation Yes/No
Details thereof (with approximatequantities/rates, whereverpossible) with source ofinformation data
5.1 Emissions from combustion of fossilfuels from stationary or mobile sources
Yes Emissions from DG sets, operatedonly during load shut down byTSTRANSCO. Emissions quantitiesare presented in Annexure – IX.
5.2 Emissions from production processes No Vehicular transport is the othersource of emission.
5.3 Emissions from materials handlingincluding storage or transport
No
5.4 Emissions from construction activitiesincluding plant and equipment
Yes Construction equipment and DGsets which mainly use HSD, as fuelshall generate emissions.
5.5 Dust or odours from handling ofmaterials including constructionmaterials, sewage and waste
No
5.6 Emissions from incineration of waste No
5.7 Emissions from burning of waste inopen air (e.g. slash materials,construction debris)
No
5.8 Emissions from any other sources No

F - 10
6.0 Generation of Noise and Vibration, and Emissions of Light and Heat:
S.No. Information/Checklist confirmation Yes/No
Details thereof (with approximatequantities/rates, whereverpossible) with source ofinformation data with source ofinformation data
6.1 From operation of equipment e.g.engines, ventilation plant, crushers
Yes Construction activity and theconstruction equipment are themain sources of noise andvibration during construction.While there are no major sourcesof noise during occupation phase.
6.2 From industrial or similar processes No
6.3 From construction or demolition Yes
6.4 From blasting or piling No No blasting activity envisaged.
6.5 From construction or operational traffic Yes There will be an increase in thetraffic density, which shall increasethe noise levels of the area bothduring construction andoccupation phases.
6.6 From lighting or cooling systems No
6.7 From any other sources No

F - 11
7. Risks of contamination of land or water from releases of pollutants into the ground orinto sewers, surface waters, groundwater, coastal waters or the sea:
S.No. Information/Checklist confirmation Yes/No
Details thereof (withapproximate quantities/rates,wherever possible) with sourceof information data
7.1 From handling, storage, use or spillageof hazardous materials
No Used batteries and waste oil shallbe stored separately and shall notlead to contamination of landduring normal operation.
7.2 From discharge of sewage or othereffluents to water or the land(expected mode and place ofdischarge)
No The sewage shall be treated toachieve the standards prescribedby MoEF during operation phase.While the discharges fromtemporary toilets duringconstruction shall be sent toseptic tank followed by sewerlines.
7.3 By deposition of pollutants emitted toair into the land or into water
No The project shall not emitsubstantial quantities ofpollutants to have an impact onthe air quality.
7.4 From any other sources No
7.5 Is there a risk of long term build up ofpollutants in the environment fromthese sources?
No

F - 12
8. Risk of accidents during construction or operation of the Project, which could affecthuman health or the environment
S.No.Information/Checklist confirmation Yes/No
Details thereof (withapproximate quantities/ rates,wherever possible) with sourceof information data
8.1 From explosions, spillages, fires etc fromstorage, handling, use or production ofhazardous substances
No Precautionary measures shall beadopted. Fire plan shall be putin place before occupation of theproperty.
8.2 From any other causes No
8.3 Could the project be affected by naturaldisasters causing environmental damage(e.g. floods, earthquakes, landslides,cloudburst etc)?
No The site is located at a higherelevation and the seismic zonefor the project area is Zone II,which is considered safe,

F - 13
9. Factors which should be considered (such as consequential development) which could lead toenvironmental effects or the potential for cumulative impacts with other existing or plannedactivities in the locality
S. No. Information/Checklist confirmation Yes/No
Details thereof (withapproximate quantities/rates,wherever possible) withsource of information data
9.1 Lead to development of supporting.
Lities, ancillary development ordevelopment
Stimulated by the project which couldhave impact on the environment e.g.:
• Supporting infrastructure (roads, powersupply, waste or waste water treatment,etc.)
• Housing development
• Extractive industries
• Supply industries
• Other
Yes
Yes
Yes
No
No
No
The area is presentlydeveloping into a primeresidential and commerciallocality in view of the thrustgiven by Government ofTelangana for the developmentof IT and ITES services.
9.2 Lead to after-use of the site, which couldhave an impact on the environment
No
9.3 Set a precedent for later developments Yes The surrounding areas shalldevelop as residential/commercial areas.
9.4 Have cumulative effects due to proximityto other existing or planned projects withsimilar effects
No

F - 14
(II) Environmental Sensitivity
S.No. Areas Name/Identity
Aerial distance (within 15km.)Proposed project locationboundary
1 Areas protected under internationalconventions, national or local legislationfor their ecological, landscape, cultural orother related value
Yes KVB botanical park is locateda distance of 2.2 km. KBRNational Park 6.7 km.Mrugavani National Park is ata distance of 12.3 Km.
2 Areas which are important or sensitive forecological reasons - Wetlands,watercourses or other water bodies,coastal zone, biospheres, mountains,forests
Yes KVB botanical park is locateda distance of 2.2 km. KBRNational Park 6.7 km.Mrugavani National Park is ata distance of 12.3 Km.
3 Areas used by protected, important orsensitive species of flora or fauna forbreeding, nesting, foraging, resting, overwintering, migration
Yes KVB botanical park is locateda distance of 2.2 km. KBRNational Park 6.7 km.Mrugavani National Park is ata distance of 12.3 Km.
4 Inland, coastal, marine or undergroundwaters
No
5 State, National boundaries No
6 Routes or facilities used by the public foraccess to recreation or other tourist,pilgrim areas
No
7 Defense installations No
8 Densely populated or built-up area Yes The area is developing into adensely populated area dueto industrialization in thesurrounding areas and othermajor commercialdevelopments in the vicinity.
9 Areas occupied by sensitive man-madeland uses (hospitals, schools, places ofworship, community facilities)
Yes Hospitals, Schools, Places ofworship and communityfacilities are located in theproject impact area.
10 Areas containing important, high quality orscarce resources(Ground water resources, surface
resources, forestry, agriculture, fisheries,tourism, minerals)
No
11 Areas already subjected to pollution or No

F - 15
S.No. Areas Name/Identity
Aerial distance (within 15km.)Proposed project locationboundary
environmental damage.(Those where existing legal environmental
standards are exceeded)12 Areas susceptible to natural hazard which
could cause the project to presentenvironmental problems(Earthquakes, subsidence, landslides,erosion, flooding or extreme or adverseclimatic conditions)
No

F - 16
(IV).Proposed Terms of Reference for EIS/EMP studies
Scope of Work of EIA
“...The EIS/EMP shall cover the following:
Description of the proposed projectThe first task:” Description of the proposed project” forms a vital component of theEnvironmental Impact Statement (EIS) as it provides the basis for evaluating the likelycauses of Environmental Impacts. Land use issues dictate the significance of landloss/change. It is essential that the key components of the project shall be clearlydetermined as far as possible at this stage.
Assessment of Environmental Impacts
Based upon the results from the review of existing information, field visits, site datacollection and consultation, for each component of environment (physical, biologicaland socio economic) the positive, negative, direct and indirect, temporary andpermanent impact s will be evaluated along with an indication of the degree of impact,i.e., whether the impact is significant, moderate, minor or negligible.
Environment Management Plan and Mitigation PlanFor each significant negative impact identified, specialist shall work closely with theengineering team/technical consultants to suggest practicable measures to avoid ormitigate the impact. Suggestions for compensation shall be given where there is noother alternative course of action.
The mitigation of environmental impacts will be by three mechanisms.=>Introduction of mitigation features through the engineering practices.=>Implementation of environmental controls during construction and operation.=>Legislative control involving compliance with Indian environmental laws.
The Environmental management plan shall include an estimate of capital and recurringcosts of mitigation measures and will identify the parties and institutional frameworkfor implementation.
Monitoring PlanHaving identified the significant environmental impact that are likely to arise as a resultof the construction of Exhibition Hall 4 and interconnection of Exhibition Hall 1 and 3 inHyderabad International Trade Exposition Centre project, the project team shall specifywhat monitoring is required during the various phases of the project cycle.
The monitoring plan will identify parameters and frequency of monitoring andresponsible organization

F - 17

A - 1
Annexure-IArea Statement for the proposed Building
Land Use No. of Floors Total Area (m2) Total Built up area (m2)ProposedExhibition Hall 4 G + Mazznine 10230.0 14141.0Exhibition Hall 1 &3 G + Mazznine 2050.0 2400.0Total 12280.0 16541.0ExistingExhibition Hall A1 Ground 3534.0 3636.4Exhibition Hall A2 Ground 3534.0 3636.4Exhibition Hall B1 Ground 3534.0 3636.4Service Block A1 Ground 234.9 234.9Service Block A2 Ground 320.2 320.2Service Block B1 Ground 302.0 302.0Security Office Ground 57.0 57.0Main Sub Station Ground 196.4 196.4Trade fair Office G + 3 1375.0 4652.0Ticket booths (5 nos) Ground 60.0 60.0Parking toilet blocs Ground 120.0 120.0Entrance Plaza Ground 2704.0 2704.0Total 15971.4 19555.8Parking area for Exhibition HallsSurface parking 12637.8Future Development 86229.6Lake 60654.3Open area 8660.9Green area 18187.9Road area 19250.0Grand Total 233871.9 36096.8

A - 2
Annexure-IICut & Fill Quantities
S No Area Qty. of fill(m3)
Qty of cut(m3)
Surplus fill(m3)
Surplus cut(m3)
1 Site 2400 4000 ---- 1600

A - 3
Annexure-III
Water Requirement of the Project
Description Total No. ofPersons
Waterrequirement lpd
Total WaterRequirement in KLD
Exhibition Hall 4 4400 15 66.0Exhibition Hall 1 and 3 900 15 13.5Exhibition Hall A1 1000 15 15.0Exhibition Hall A2 1000 15 15.0Exhibition Hall B1 1000 15 15.0Employees 120 45 5.4
Total 129.9
The water requirement shall be reduced by adopting Dual plumbing system: Separate tank isprovided to store the treated water; the tank shall be 1 foot below the overhead tank.Separate pipe system is provided to pump the treated water for flushing. All the treatedwater pipelines shall be colored blue. Separate line in the blocks to use treated wastewaterfor flushing purpose. The total saving is as follows;
Water Savings Proposed
Description No. ofPersons
WaterRequirement
in KLD
Treatedwater
reuse KLD
Effective WaterRequirement in
KLDExhibition Hall 4 4400 66.0 33.0 33.0Exhibition Hall 1 and 3 900 13.5 6.8 6.8Exhibition Hall A1 1000 15.0 7.5 7.5Exhibition Hall A2 1000 15.0 7.5 7.5Exhibition Hall B1 1000 15.0 7.5 7.5Employees 120 5.4 2.4 3.0Total 129.9 64.7 65.3
Note: Treated water reuse assumed @ 7.5 l/head. Approximately 64.7 KL/day water will besaved by adopting recycling of treated water in the toilet flush.
The effective water consumption is reduced by 64.7. kl/day and the requirement will be in theorder of 65.3 kl/day.
Water Balance during occupation stageInput KLD Output KLD
Domestic water from HMWSSB 65.3 Treated waste water for HVAC 18.8Recycled water (Flushing) 64.7 Recycled water (Flushing) 64.7
Water requirement for green beltduring non monsoon 20.5Losses(20%) 26.0
Total 129.9 Total 129.9

A - 4
The water used in the order of 129.9 KLD would generate 103.9 KLD of wastewater which hasto be treated for reused.
Sewage treatment plant based on Fluidized Aerobic Bio Reactor (FAB) technologyPROCESS DESCRIPTION:The raw sewage will be collected in a collection sump and pumped to mechanical bar screenchamber for removal of large floating matter followed by grit removal in Grit Chamber. Theraw sewage will then be collected in an equalization tank for homogenization of hydraulicload. The tank contents will be kept in suspension by means of course bubble serrationthrough pipe grid. The equalization tank, with air flow indicator for continuous monitoring ofair supply to the tank in order to avoid septic conditions, will be covered from top (RCC orFRP) to avoid nuisance. The equalized effluent will then be pumped to two Fluidized AerobicBio Reactors (FAB) in series where BOD/COD reduction can be achieved by virtue of aerobicmicrobial activities. The oxygen required will be supplied through coarse air bubble diffusers.The bio-solids formed in the biological process will be separated in the down stream TubeSettler. The clear supernatant will gravitate to the chlorine contact tank where sodiumhypochlorite will be dosed for disinfection of treated water prior to disposal.
The biological sludge generated in the FAB and settled in the tube settlers will be collected ina sludge sump and then pumped to sludge drying bed for de watering. The dried sludge willthen be disposed off suitably as manure. The schematics of the process are shown. The twomain components of the treatment system viz. The FAB reactor and tube settler aredescribed in the following sections.
Fluidized Aerobic Bio Reactor (FAB)Conventional effluent treatment plants are large sized, power intensive and require a lot ofmonitoring. Scarcity of open space and rising land a power costs have forced the industries tolook our for space saving, compact and efficient treatment options. This has led to thedevelopment attached growth processes where the bio mass is retained within the aerationtank obviating the need for recycle. These plants are not only compact but also user friendly.The endeavor to have a continuously operating, no-clogging biofilm reactor with no need forback washing, low head-loss and high specific biofilm surface area culminated in the mostadvanced technology of aerobic biological fluidized bed treatment where the biofilm(biomass) grows on small carrier elements that move along with the water in the reactor. Themovement is normally caused by aeration in the aerobic version of the reactor.
The reactor combines all the advantages and best features of Trickling filters, Rotatingbiological contractors, activated sludge process and submerged fixed film reactors whileeliminating the drawbacks of these systems. The plants are more compact and more energyefficient.
The Fluidized Aerobic Bio Reactor (FAB) consists of a tank in any shape filled up with smallcarrier elements. The elements are made up of special grade PVC or polypropylene ofcontrolled density (shown in plate). For media of specific gravity 0.92-0.96 the overall densitycould be expected to increase up to 9.5% when full of biomass such that they can fluidizeusing an aeration device. A biofilm develops on the elements, which move along the effluentin the reactor. The movement within the reactor is generated by providing aeration with thehelp of diffusers placed at the bottom of the reactor. Then thin biofilm on the elements

A - 5
enables the bacteria to act upon the biodegradable matter in the effluent and reduce theBOD/COD content in the presence of oxygen available from the air that is used forfluidization.
Characteristics of Waste waterParameter Quantity in mg/l
PH 6 – 7Total Suspended Solids 300BOD 150COD 350
Design of the unitBasic dataFlow : 103.9 KLDCapacity : 130 m3
Peak factor : 3.5Peak flow Q peak : 350 m3/dayInfluent BOD : 200 mg/litInfluent Suspended Solids : 200 mg/litInfluent COD : 350 mg/litEffluent BOD : 30 mg/litEffluent COD : 200 mg/litEffluent Suspended Solids : 100 mg/lit
1. Bar Screen ChamberAverage flow : 0.0015 m3/secPeak factor : 3.5Peak flow : 0.005 m3/secVelocity at peak flow : 0.75 m/SecEffective area of screen RequiredAt average flow : 0.005 m2
At Peak flow : 0.0075 m2
Provide Effective area of screen : 0.0075 m2
Considering the bar of dia. 10 mm(w) and clear spacing of 20 mm (b)Overall area required : 0.011 m2
Considering screen depth as : 0.022 m Consider 0.5 mNumber of clear spacing : 0.3Number of bars : 1 Consider 3 Nos.Hence Provide 5 barsProvide a screen of 0.5 m X 0.5 m at an inclination of sin 600. In a screen channel of onemeter (1 m) length.
2. Grit Chamber :The flow from the bar screen chamber is let into the Grit Chamber of minimum 2 hourscapacity. This tank is provided to even out the flow variation, and to provide a continuousfeed into the secondary biological treatment units.Peak flow Q : 0.005 m3/secProviding a flow through velocity of 0.30 m/sec

A - 6
Cross sectional area of Channel (0.004/0.3) : 0.016 m2
Surface area of channel (0.004/0.03) : 0.38 m2
Assuming depth d : 0.2 mWidth of channel (0.013/0.2) : 0.08 m (say 0.2m)Length of channel (0.30/0.06) : 4. 5 m (say 4.5 m)Provide two channels each of 0.2 m wide and 4.5 m long with depth of waste water 0.2 m.
3. Equalization tank:The flow from the bar screen chamber is let into the equalization tank of minimum 2hourscapacity. This tank is provided to even out the flow variation, and to provide a continuousfeed into the secondary biological treatment units.Average flow : 5.41 m3/hrPeak factor : 3.5Peak flow : 18.95 m3/hrHydraulic retention tank = 2 hrs at Peak flowHence required volume of the tank : 37.91 m3
Provide tank of : 37.91 m3 CapacityAssuming depth : 3 mArea : 12.6 m2
Assuming length to width ratio (1:1) ; l=blength of the tank : 3.5 mwidth of the tank : 3.5 mAir required for agitation : 0.01 m3/ m2 minTotal air required : 22.75 m3/hrAir blower required : 40 m3/hr @ 3.8 mwcEffluent transfer pump : 5.41 m3/hr @ 8 mwc
4. Fluidized Aerobic Bio Reactor (FAB):The polypropylene media have been provided with a specific surface area of 350 – 520 m2
/m3. This allows micro-organisms to get attached and biomass concentration can beincreased to four folds as compared to Activated Sludge Process. This enables to considerhigher Organic loading rates.The micro-organisms attached to media are kept in a fluid state thereby maintaining theCSTR (continuous Stirrer tank reactor) regime as well as two tanks are provided in seriesmaking the plug – flow system. This will enhance the efficiencies and have the merits ofboth CSTR and plug-flow regimes.Organic loading rate : 3.2 kg BOD/ m3 dOrganic load : 26 kg/dayVolume of the tank : 8.2 m3
Assume the depth : 3 mNo. of tanks in series : 1Size of the tank : 1.6 m dia. x 3.0 SWDSpecific gravity of media : 0.92 to 0.96Specific surface area of media : 350 – 520 m2 /m3
Media filling : 30 – 50 % of tank volumeOxygen required : 2 kg / kg BODOxygen in air : 23%Specific gravity of air @ 30 deg. : 1.65

A - 7
Aeration : Coarse bubbleOxygen transfer efficiency : 12%Air required : 51.82 m3/hrAir blower required : 80 m3/hr @ 6.5 m wc
5.Tube settlerSurface loading rate : 48 m2 /m3 dSurface area required : 2.7 m2
Tank size : 3.0 m x 6.0 m x 2.7 m SWD With 55deg. hopper bottom
Tube Modules : 3.0m x 6.0 m x 0.6 m ht.Tube inclination : 60 deg.Settling area for 60 deg slope : 11 m2 /m3
Cross sectional area of tubes : 120 mm x 44 mm HexagonalHydraulic radius : 1/61 cm (1.5 cm)Shape factor : 0.6 – 0.7 for media settleable solids
6. Pre Filtration tankThe flow from the each individual settling tank i.e., the supernatant liquid is let into therespective Pre-Filtration Tank, which has a minimum 1.5 hours holding capacity. This tankis provided to hold the treated effluent and give an even flow to the pressure sand filter.Average flow : 5.41 m3/hrPeak factor : 2 m3/hrPeak flow : 10.8 m3/hrProvide min 1.5 hours holding capacity.Hence required volume of the tank : 16.25 m3
7. Pressure Sand Filter:Vertical down flow type with graded/sand bed under drain plate with polysterene strains.Flow : 130 m3/dayRate of filtration assumed as : 10 m3/m2/hrRequirement of treated water for usage in 20 hrs : 6.5 m3/hrDia. of filter of 1 nos. : 950 mmProvide pressure sand filter of 950 mm dia. and 1100 mm HOS with sand as media layer,under drain pipe, laterals face piping etc for each stream.
8. Activated Carbon Filter:Vertical down flow type with graded/sand bed under drain plate with polysterene strains.Flow : 130 m3/dayRate of filtration assumed as : 10 m3/m2/hrRequirement of treated water for usage in 20 hrs : 6.5 m3/hrDia of filter of 1 nos. : 950 mmProvide pressure sand filter of 950 mm dia. and 1100 mm HOS with sand as media layer,under drain pipe, laterals face piping etc for each stream.
9.Final Treated Water Holding TankIt is always preferred to provide one final holding tank of minimum one day holdingcapacity, so that the treated effluents can be stored and used back for gardening or other

A - 8
tertiary purposes.Capacity: 130 m3
9.Ultraviolet Disinfection:UV applied to low turbidity water is a highly effective means of disinfection. UV is notharmful to aquatic organisms in the receiving water. UV light kills viruses, Vegetative- andspore-forming bacteria, algae and yeasts. No chemicals are added to the wastewater tochange the pH, conductivity, odor or taste to create possible toxic compounds. UVtreatment has a few moving parts to adjust or wear out.
10. Sludge Filter Press:The biomass in the aeration tank stabilizes BOD in wastewater by consuming the organicmatter in the wastewater. The metabolic activity results in growth of the biomasspopulation in the Fluidized Aerobic Bio Reactor (FAB). Sludge holding tank has beenprovided with filter press for dewatering sludge. The filtrate drains off through the media,which is again let into equalization tank.The dewatered sludge is collected in trays, which can be used as manure in the garden.No. of plates : 24Size of plates : 600 mm X 600 mmPlate moc (material of construction) : PP (poly propline)Type of operation : HydraulicPower pack capacity : 2 HP
The dewatered sludge is collected in trays, which can be used as manure in the garden.
Characteristics of Treated Waste waterParameter Quantity in mg/l
pH 7.3Total Suspended Solids 20BOD 10COD 50
Disposal of Treated Wastewater: The treated water shall be treated and reused for flushingthe toilets, HVAC make up water requirement and on land irrigation. Hence all the recycledwater is utilized completely and is considered as a zero discharge.

A - 9
SEW
AG
E TR
EATM
ENT
PLA
NT
FLU
IDIZ
ED A
ERO
BIC
BIO
REA
CTO
R TE
CHN
OLO
GY
(FA
B)
Slud
geD
ewat
erin
gSy
stem
EQT
TAN
K
PSF
ACF
BarS
cree
n/ G
rit
Cham
ber
Raw
Sew
age
Ove
rflo
w
Filte
r Fee
dPu
mp
(1W
+1S)
Slud
geD
ispo
sal
SLU
DG
EH
OLD
ING
TA
NK
CLA
RIFI
EDW
ATER
TAN
K
FAB
REA
CTO
R(P
acka
ge u
nit)
TREA
TED
WAT
ERTA
NK
To R
euse
TUBE
Sett
lers UV

A - 10
Annexure-IV
GARBAGE MANAGEMENT PLAN
MaintenanceDepartment
MaintenanceDepartment
Biodegradablewaste
Non-BiodegradableWaste
Authorized Agencyof Local Body
Authorized Agencyof Local Body
Main Collectionpoint/Segregation
Point
Main Collectionpoint/Segregation
PointLocal Body
Segregation at Source
MaintenanceDepartment
DomesticHazardous Wastes
Authorized Agencyof Local Body
Main Collectionpoint/Segregation
PointLocal Body Local Body
MaintenanceDepartment
e - Waste
Authorized Agency
Storage Area
Local Body
Segregation at source into bio-degradable, non bio- degradable and domestic hazardouswastes. Facilitation by owners co-operative to dispose recyclable waste to AuthorizedWaste Pickers / Authorized Recyclers. Balance segregated waste given to AuthorizedAgency of Local Body for disposal.

A - 11
Annexure-V
Present resources available with HMWSSB
Source Name River Year ImpoundmentName
Distance fromcity km
InstalledCapacity MGD
Osmansagar Musi 1920 Osmansagar 15 27Himayatsagar ESI 1927 Himayatsagar 9.6 18Manjira Phase I Manjira 1965 Manjira barrage 58 15Manjira Phase II Manjira 1981 Manjira barrage 59 30Manjira Phase III Manjira 1991 Singur Dam 80 37Manjira Phase IV Manjira 1993 Singur Dam 80 38Krishna Phase I Krishna 2005 NagarjunaSagar 116 90Krishna Phase II Krishna 2008 NagarjunaSagar 116 90Krishna Phase III Krishna 2015 NagarjunaSagar 116 90Godavari Phase I Godavari 2016 Yellampally 186 172
Source: Hyderabad Metropolitan Water Supply & Sewerage Board,www.hyderabadwater.gov.in(Source: HMWSSB Web Page)

A - 12
Annexure-VI
Lead Distance for Construction Materials
S.No Material Source Lead Distance(Km)
1
Sand ROBOSAND and or Krishnaor Godavari river bed areaspermitted by Govt. ofTelangana
160 – 250
2 Aggregate With in the site 0 – 53 Cement Manufacturing units 150 – 2004 Reinforcement Steel SAIL/TATA god owns 5-10
5 Bricks Local suppliers/Manufacturers 50
6 Plumbing Material Local suppliers 2 – 97 Electrical Material Local Suppliers 2 – 88 Sanitary Material Local suppliers 2 – 8
9 Flooring andPavement Tiles Manufacturers 50– 150
10 Paints Local Manufacturers 10 – 3011 Ready Mix Concrete Local Batch Plants 3 - 7

A - 13
Annexure-VII
Material Consumption For Project
Land Use BUA perunit in (m2)
ReadyMix
Concrete(m3)
Cement(bags)
Sand(m3)
Aggregate (m3)
Water(m3)
Brick(Nos) x1000
Reinforcement
steel (MT)
Total BUA 16541 71126 57894 5955 4962 4003 2266 579Total 16541 71126 57894 5955 4962 4003 2266 579
A - 14
Annexure-VIII
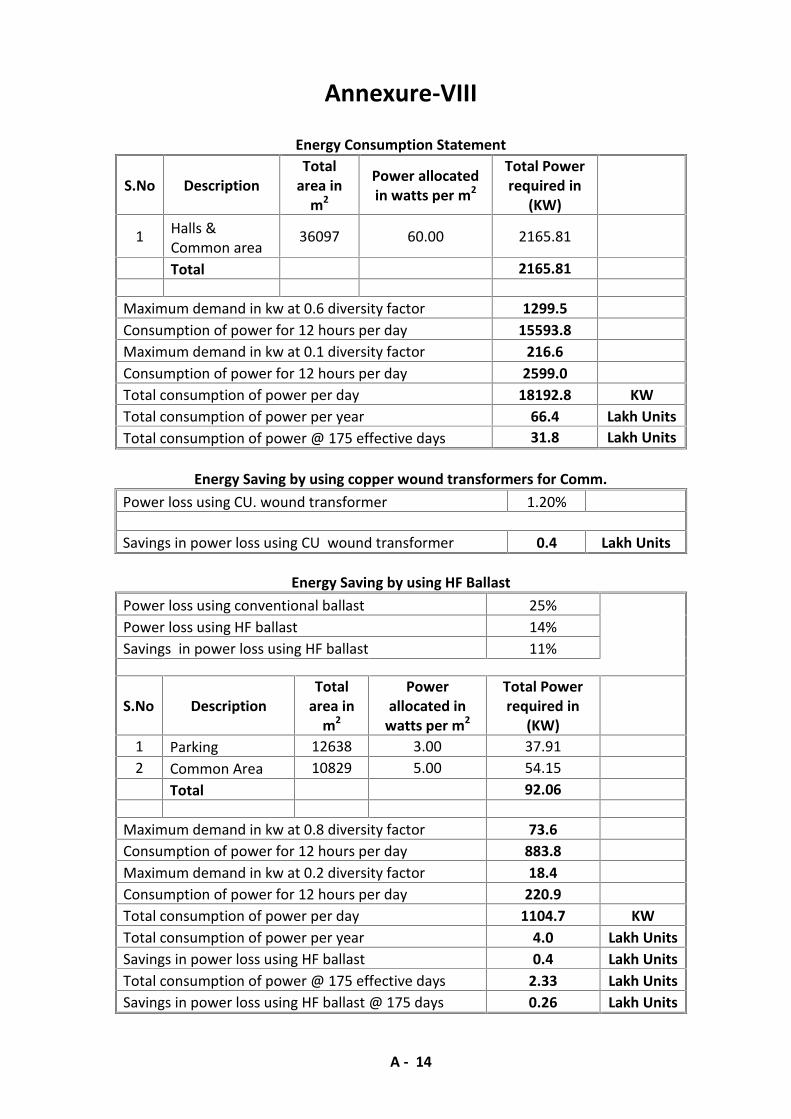
Energy Consumption Statement
S.No DescriptionTotal
area inm2
Power allocatedin watts per m2
Total Powerrequired in
(KW)
1 Halls &Common area
36097 60.00 2165.81
Total 2165.81
Maximum demand in kw at 0.6 diversity factor 1299.5Consumption of power for 12 hours per day 15593.8Maximum demand in kw at 0.1 diversity factor 216.6Consumption of power for 12 hours per day 2599.0Total consumption of power per day 18192.8 KWTotal consumption of power per year 66.4 Lakh UnitsTotal consumption of power @ 175 effective days 31.8 Lakh Units
Energy Saving by using copper wound transformers for Comm.Power loss using CU. wound transformer 1.20%
Savings in power loss using CU wound transformer 0.4 Lakh Units
Energy Saving by using HF BallastPower loss using conventional ballast 25%Power loss using HF ballast 14%Savings in power loss using HF ballast 11%
S.No DescriptionTotal
area inm2
Powerallocated in
watts per m2
Total Powerrequired in
(KW)1 Parking 12638 3.00 37.912 Common Area 10829 5.00 54.15
Total 92.06
Maximum demand in kw at 0.8 diversity factor 73.6Consumption of power for 12 hours per day 883.8Maximum demand in kw at 0.2 diversity factor 18.4Consumption of power for 12 hours per day 220.9Total consumption of power per day 1104.7 KWTotal consumption of power per year 4.0 Lakh UnitsSavings in power loss using HF ballast 0.4 Lakh UnitsTotal consumption of power @ 175 effective days 2.33 Lakh UnitsSavings in power loss using HF ballast @ 175 days 0.26 Lakh Units

A - 15
Electrical Power savings using LED for lightingSavings in power Using LED as against Fluorescent Lamps 30%
S.No Description Total areain m2
Powerallocated in
watts per m2
Total Powerrequired in
(KW)1 Parking 12638 3.00 37.912 Common Area 10829 5.00 54.15
Total 92.06
Maximum demand in kw at 0.8 diversity factor 73.6Consumption of power for 12 hours per day 883.8Maximum demand in kw at 0.2 diversity factor 18.4Consumption of power for 12 hours per day 220.9Total consumption of power per day 1104.7 KWTotal consumption of power per year 4.0 Lakh UnitsSavings in power using LED 1.2 Lakh UnitsTotal consumption of power @ 175 effective days 2.33 Lakh UnitsSavings in power loss using HF ballast @ 175 days 0.70 Lakh Units
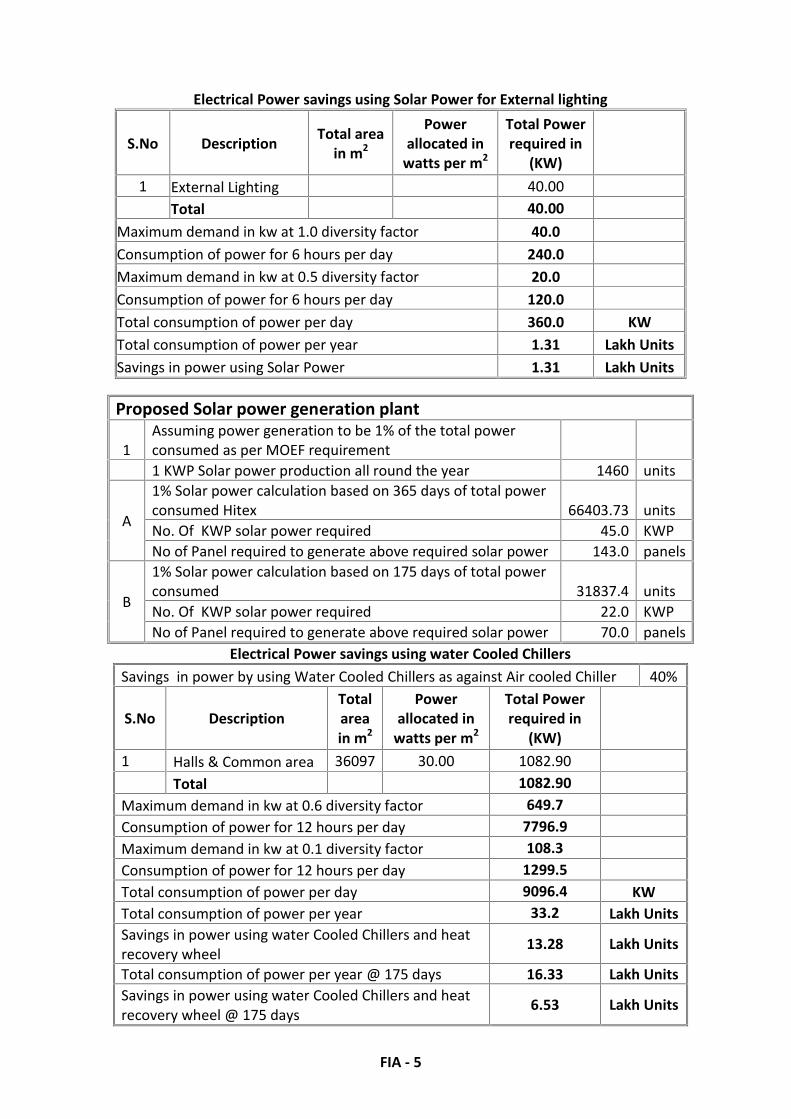
Electrical Power savings using Solar Power for External lighting
S.No. Description Total areain m2
Powerallocated in
watts per m2
Total Powerrequired in
(KW)1 External Lighting 40.00
Total 40.00Maximum demand in kw at 1.0 diversity factor 40.0Consumption of power for 6 hours per day 240.0Maximum demand in kw at 0.5 diversity factor 20.0Consumption of power for 6 hours per day 120.0Total consumption of power per day 360.0 KWTotal consumption of power per year 1.31 Lakh UnitsSavings in power using Solar Power 1.31 Lakh Units
Proposed Solar power generation plant
1Assuming power generation to be 1% of the total powerconsumed as per MOEF requirement1 KWP Solar power production all round the year 1460 units
A
1% Solar power calculation based on 365 days of total powerconsumed Hitex 66403.73 unitsNo. Of KWP solar power required 45.0 KWPNo of Panel required to generate above required solar power 143.0 panels
B
1% Solar power calculation based on 175 days of total powerconsumed 31837.4 unitsNo. Of KWP solar power required 22.0 KWPNo of Panel required to generate above required solar power 70.0 panels

A - 16
Electrical Power savings using water Cooled ChillersSavings in power by using Water Cooled Chillers as against Air cooled Chiller 40%
S.No DescriptionTotalareain m2
Powerallocated in
watts per m2
Total Powerrequired in
(KW)1 Halls & Common area 36097 30.00 1082.90
Total 1082.90Maximum demand in kw at 0.6 diversity factor 649.7Consumption of power for 12 hours per day 7796.9Maximum demand in kw at 0.1 diversity factor 108.3Consumption of power for 12 hours per day 1299.5Total consumption of power per day 9096.4 KWTotal consumption of power per year 33.2 Lakh UnitsSavings in power using water Cooled Chillers and heatrecovery wheel 13.28 Lakh Units
Total consumption of power per year @ 175 days 16.33 Lakh UnitsSavings in power using water Cooled Chillers and heatrecovery wheel @ 175 days
6.53 Lakh Units
Total Saving
S.No. Description Savings in lakhkwh units
Savings inpercentage
1 With Cu wound Transformer 0.8 1.22 with HF Ballast 0.4 0.0073 With CFL 1.2 1.84 With Water Cooled Chillers 13.3 20.05 With Solar Power for External lighting 1.3 2.0
Total Saving 17.0 25.7Total Consumption 66.4Percentage of saving achieved@365 days 25.7 %Percentage of saving achieved@175 days 30.0 %

A - 17
Annexure-IX
Details of DG Set emissions
StackNo. Name of Stack
StackHeight
(m)
Dia ofstackat top
(m)
Temp.ofexhaust
gases (0C)
ExitVelocit
y(m/sec)
PollutantEmission Rate (g/sec)
PM SO2 NOx
1625 KVA DG set
(3 Nos.) 5.0 0.24 270 10.0 0.002 0.048 0.06
2350 KVA DG set.
(1 Nos.) 3.8 0.14 158 8.2 0.001 0.028 0.04

FIA - 1
APPENDIX II(See paragraph 6)
FORM-1 A (only for construction projects listed under item 8 of the Schedule)
CHECK LIST OF ENVIRONMENTAL IMPACTS
(Project proponents are required to provide full information and wherever necessaryattach explanatory notes with the Form and submit along with proposedenvironmental management plan & monitoring programme)
1. LAND ENVIRONMENT(Attach panoramic view of the project site and the vicinity): Location Plan enclosed.
1.1. Will the existing land use gets significantly altered from the project that is notconsistent with the surroundings? (Proposed land use must conform to the approvedMaster Plan / Development Plan of the area. Change of land use if any and thestatutory approval from the competent authority are submitted). Attach Maps of (i)site location, (ii) surrounding features of the proposed site (within 500 meters).The site area is a classified Commercial zone of Hyderabad Metropolitan DevelopmentAuthority. The location plan is enclosed.
1.2. List out all the major project requirements in terms of the land area, built uparea, water consumption, power requirement, connectivity, community facilities,parking needs etc.
Connectivity: The project will be spread over an area of 23.38 ha to provide ExhibitionHall 4 and interconnection of Exhibition Hall 1 and 3 in Hyderabad International TradeExposition Centre in Survey Nos. 5/6 (Part), 5/7 (Part), 5/8, 5/9, 5/10, 5/11, 5/12, 5/13,5/14, 5/15, 5/16, 5/17, 5/18, 5/19, 5/19, 5/20, 5/21, 5/22, 5/23, Izzathnagar,Serilingampally Mandal, Ranga Reddy District.
Parking Space Provision of the ProjectFloor 4-Wheelers 2-WheelersSurface parking 157 100Total 157 100
Amenities ProposedAmenity Nos. or Description
Sewage Treatment Plant 1Garbage Collection Bin 1DG Sets 625 kVA X 3 nos. + 350 kVA X 1 no.Green area 1.81879 hectares

FIA - 2
Area Statement for the proposed BuildingLand Use No. of Floors Total Area (m2) Total Built up area (m2)
ProposedExhibition Hall 4 G + Mazznine 10230.0 14141.0Exhibition Hall 1 &3 G + Mazznine 2050.0 2400.0Total 12280.0 16541.0ExistingExhibition Hall A1 Ground 3534.0 3636.4Exhibition Hall A2 Ground 3534.0 3636.4Exhibition Hall B1 Ground 3534.0 3636.4Service Block A1 Ground 234.9 234.9Service Block A2 Ground 320.2 320.2Service Block B1 Ground 302.0 302.0Security Office Ground 57.0 57.0Main Sub Station Ground 196.4 196.4Trade fair Office G + 3 1375.0 4652.0Ticket booths (5 nos) Ground 60.0 60.0Parking toilet blocs Ground 120.0 120.0Entrance Plaza Ground 2704.0 2704.0Total 15971.4 19555.8Parking area for Exhibition HallsSurface parking 12637.8Future Development 86229.6Lake 60654.3Open area 8660.9Green area 18187.9Road area 19250.0Grand Total 233871.9 36096.8
Water Requirement of the Project
Description Total No. ofPersons
Waterrequirement lpd
Total WaterRequirement in KLD
Exhibition Hall 4 4400 15 66.0Exhibition Hall 1 and 3 900 15 13.5Exhibition Hall A1 1000 15 15.0Exhibition Hall A2 1000 15 15.0Exhibition Hall B1 1000 15 15.0Employees 120 45 5.4
Total 129.9
The water requirement shall be reduced by adopting Dual plumbing system: Separatetank is provided to store the treated water; the tank shall be 1 foot below the overheadtank. Separate pipe system is provided to pump the treated water for flushing. All the

FIA - 3
treated water pipelines shall be colored blue. Separate line in the blocks to use treatedwastewater for flushing purpose. The total saving is as follows;
Water Savings Proposed
Description No. ofPersons
WaterRequirement
in KLD
Treatedwater
reuse KLD
Effective WaterRequirement in
KLDExhibition Hall 4 4400 66.0 33.0 33.0Exhibition Hall 1 and 3 900 13.5 6.8 6.8Exhibition Hall A1 1000 15.0 7.5 7.5Exhibition Hall A2 1000 15.0 7.5 7.5Exhibition Hall B1 1000 15.0 7.5 7.5Employees 120 5.4 2.4 3.0Total 129.9 64.7 65.3
Note: Treated water reuse assumed @ 7.5 l/head. Approximately 64.7 KL/day waterwill be saved by adopting recycling of treated water in the toilet flush. The effectivewater consumption is reduced by 64.7. kl/day and the requirement will be in the orderof 65.3. kl/day.
Water Balance during occupation stageInput KLD Output KLD
Domestic water from HMWSSB 65.3 Treated waste water for HVAC 18.8Recycled water (Flushing) 64.7 Recycled water (Flushing) 64.7
Water requirement for green beltduring non monsoon 20.5Losses(20%) 26.0
Total 129.9 Total 129.9
The water used in the order of 129.9 KLD would generate 103.9 KLD of wastewaterwhich has to be treated for reused.
Energy Consumption Statement
S.No DescriptionTotalareain m2
Powerallocated in
watts per m2
Total Powerrequired in
(KW)1 Halls & Common area 36097 60.00 2165.81
Total 2165.81
Maximum demand in kw at 0.6 diversity factor 1299.5Consumption of power for 12 hours per day 15593.8Maximum demand in kw at 0.1 diversity factor 216.6Consumption of power for 12 hours per day 2599.0Total consumption of power per day 18192.8 KWTotal consumption of power per year 66.4 Lakh UnitsTotal consumption of power @ 175 effective days 31.8 Lakh Units

FIA - 4
Energy Saving by using copper wound transformers for Comm.Power loss using CU. wound transformer 1.20%
Savings in power loss using CU wound transformer 0.8 Lakh Units
Energy Saving by using HF BallastPower loss using conventional ballast 25%Power loss using HF ballast 14%Savings in power loss using HF ballast 11%
S.No DescriptionTotal
area inm2
Powerallocated in
watts per m2
Total Powerrequired in
(KW)1 Parking 12638 3.00 37.912 Common Area 10829 5.00 54.15
Total 92.06Maximum demand in kw at 0.8 diversity factor 73.6Consumption of power for 12 hours per day 883.8Maximum demand in kw at 0.2 diversity factor 18.4Consumption of power for 12 hours per day 220.9Total consumption of power per day 1104.7 KWTotal consumption of power per year 4.0 Lakh UnitsSavings in power loss using HF ballast 0.4 Lakh UnitsTotal consumption of power @ 175 effective days 2.33 Lakh UnitsSavings in power loss using HF ballast @ 175 days 0.26 Lakh Units
Electrical Power savings using LED for lightingSavings in power Using LED as against Fluorescent Lamps 30%
S.No Description Total areain m2
Powerallocated in
watts per m2
Total Powerrequired in
(KW)1 Parking 12638 3.00 37.912 Common Area 10829 5.00 54.15
Total 92.06Maximum demand in kw at 0.8 diversity factor 73.6Consumption of power for 12 hours per day 883.8Maximum demand in kw at 0.2 diversity factor 18.4Consumption of power for 12 hours per day 220.9Total consumption of power per day 1104.7 KWTotal consumption of power per year 4.0 Lakh UnitsSavings in power using LED 1.2 Lakh UnitsTotal consumption of power @ 175 effective days 2.33 Lakh UnitsSavings in power loss using HF ballast @ 175 days 0.70 Lakh Units
FIA - 5
Electrical Power savings using Solar Power for External lighting
S.No Description Total areain m2
Powerallocated in
watts per m2
Total Powerrequired in
(KW)1 External Lighting 40.00
Total 40.00Maximum demand in kw at 1.0 diversity factor 40.0Consumption of power for 6 hours per day 240.0Maximum demand in kw at 0.5 diversity factor 20.0Consumption of power for 6 hours per day 120.0Total consumption of power per day 360.0 KWTotal consumption of power per year 1.31 Lakh UnitsSavings in power using Solar Power 1.31 Lakh Units
Proposed Solar power generation plant
1Assuming power generation to be 1% of the total powerconsumed as per MOEF requirement1 KWP Solar power production all round the year 1460 units
A
1% Solar power calculation based on 365 days of total powerconsumed Hitex 66403.73 unitsNo. Of KWP solar power required 45.0 KWPNo of Panel required to generate above required solar power 143.0 panels
B
1% Solar power calculation based on 175 days of total powerconsumed 31837.4 unitsNo. Of KWP solar power required 22.0 KWPNo of Panel required to generate above required solar power 70.0 panels
Electrical Power savings using water Cooled ChillersSavings in power by using Water Cooled Chillers as against Air cooled Chiller 40%
S.No DescriptionTotalareain m2
Powerallocated in
watts per m2
Total Powerrequired in
(KW)1 Halls & Common area 36097 30.00 1082.90
Total 1082.90Maximum demand in kw at 0.6 diversity factor 649.7Consumption of power for 12 hours per day 7796.9Maximum demand in kw at 0.1 diversity factor 108.3Consumption of power for 12 hours per day 1299.5Total consumption of power per day 9096.4 KWTotal consumption of power per year 33.2 Lakh UnitsSavings in power using water Cooled Chillers and heatrecovery wheel
13.28 Lakh Units
Total consumption of power per year @ 175 days 16.33 Lakh UnitsSavings in power using water Cooled Chillers and heatrecovery wheel @ 175 days
6.53 Lakh Units

FIA - 6
Total Saving
S.No. Description Savings in lakhkwh units
Savings inpercentage
1 With Cu wound Transformer 0.8 1.22 with HF Ballast 0.4 0.0073 With CFL 1.2 1.84 With Water Cooled Chillers 13.3 20.05 With Solar Power for External lighting 1.3 2.0
Total Saving 17.0 25.7Total Consumption 66.4Percentage of saving achieved@365 days 25.7 %Percentage of saving achieved@175 days 30 %
1.3. What is the likely impacts of the proposed activity on the existing facilitiesadjacent to the proposed site? (Such as open spaces, community facilities, details ofthe existing land use, and disturbance to the local ecology).
The local area is developed as commercial and construction activities of a number ofhousing/commercial complexes are going on. No major impact on the local ecology isanticipated.
1.4. Will there are any significant land disturbance resulting in erosion, subsidence &instability? (Details of soil type, slope analysis, vulnerability to subsidence, Seismicityetc may be given).a. Soil type: clayey or clay loamb. Slope analysisc. Vulnerability to Subsidence: No subsidence is anticipated in Deccan trap areas.d. Seismicity: The site area is classified as Zone II as per the IMD.
1.5. Will the proposal involve alteration of natural drainage systems? (Give details ona contour map showing the natural drainage near the proposed project site)
No, The site area is 23.38 ha only, and does not form part of any major drainage.
1.6. What are the quantities of earthwork involved in the construction activitycutting, filling, reclamation etc. (Give details of the quantities of earthwork involved,transport of fill materials from outside the site etc.)
Cut and fill activity is involved. The site is uneven with rolling terrain.Earth Work Quantities
S No Area Qty. of fill(m3)
Qty of cut(m3)
Surplus fill(m3)
Surplus cut(m3)
1 Site 2400 4000 ---- 1600
The excess cut material in the order of 1600 m3 will be used for construction of roadswithin the site.

FIA - 7
1.7 Give details regarding water supply, waste handling etc during the constructionperiod.The water requirement during construction shall be drawn from either ground water ortreated sewage from treatment plants from other occupied areas, surrounding theproject. The maximum expected drawl of ground water would be in the order of 25 KLDduring construction.Construction debris like cement, sand, RCC, Aggregate, steel etc. are the wastegeneration during construction and these waste materials are used for roaddevelopment.
1.8. Will the low-lying areas & wetlands get altered? (Provide details of how low lyingand wetlands are getting modified from the proposed activity)-NO-
1.9. Whether construction debris & waste during construction cause health hazard?(Give quantities of various types of wastes generated during construction includingthe construction labour and the means of disposal).Construction DebrisThe construction debris consists of various types of materials. The construction debriswill be in both hazardous and non-hazardous categories. The hazardous debris consistsempty containers of adhesives, thinners, paints, and petroleum products. These emptycontainers will be sold to authorize recycling agencies. The non hazardous wastescontain recyclable debris like iron and other metal, glass, plastics, cartons of paper,wood etc. These wastes will be sent for reuse/recycle. The waste percentage will be inthe order of 2%. Construction debris containing bricks, demolished RCC will be used forland filling in the place of subgrade.
2. WATER ENVIRONMENT
2.1. Give the total quantity of water requirement for the proposed project with thebreakup of requirements for various uses. How will the water requirement met? Statethe sources & quantities and furnish a water balance statement.
Water Requirement of the Project
Description Total No. ofPersons
Waterrequirement lpd
Total WaterRequirement in KLD
Exhibition Hall 4 4400 15 66.0Exhibition Hall 1 and 3 900 15 13.5Exhibition Hall A1 1000 15 15.0Exhibition Hall A2 1000 15 15.0Exhibition Hall B1 1000 15 15.0Employees 120 45 5.4
Total 129.9
The water requirement shall be reduced by adopting Dual plumbing system: Separatetank is provided to store the treated water; the tank shall be 1 foot below the overheadtank. Separate pipe system is provided to pump the treated water for flushing. All the

FIA - 8
treated water pipelines shall be colored blue. Separate line in the blocks to use treatedwastewater for flushing purpose. The total saving is as follows;
Water Savings Proposed
Description No. ofPersons
WaterRequirement
in KLD
Treatedwater
reuse KLD
Effective WaterRequirement in
KLDExhibition Hall 4 4400 66.0 33.0 33.0Exhibition Hall 1 and 3 900 13.5 6.8 6.8Exhibition Hall A1 1000 15.0 7.5 7.5Exhibition Hall A2 1000 15.0 7.5 7.5Exhibition Hall B1 1000 15.0 7.5 7.5Employees 120 5.4 2.4 3.0Total 129.9 64.7 65.3
Note: Treated water reuse assumed @ 7.5 l/head. Approximately 64.7 KL/day water willbe saved by adopting recycling of treated water in the toilet flush.
The effective water consumption is reduced by 64.7 kl/day and the requirement will bein the order of 65.3 kl/day.
Water Balance during occupation stageInput KLD Output KLD
Domestic water from HMWSSB 65.3 Treated waste water for HVAC 18.8Recycled water (Flushing) 64.7 Recycled water (Flushing) 64.7
Water requirement for green beltduring non monsoon 20.5Losses(20%) 26.0
Total 129.9 Total 129.9
The water used in the order of 129.9 KLD would generate 103.9 KLD of wastewaterwhich has to be treated for reused.
It is proposed to draw domestic water from the Hyderabad Metropolitan water supplyand Sewerage Board (HMWSSB), which has been encouraging the bulk consumers. Thewater shortage if any during summer season will be drawn from ground water sources.The water requirement during construction will be from ground water sources and therequirement is in the order of 100 cum/day. The water requirement of the projectduring occupation stage is in the order of 129.9 KLD.
2.2 What is the quality of water required, in case, the supply is not from a municipalsource? (Provide physical, chemical, biological characteristics with class of waterquality)
Water shall be drawn from municipal supply only.

FIA - 9
2.3 How much of the water requirement can be met from the recycling of treatedwastewater? (Give the details of quantities, sources and usage)
Water Savings Proposed
Description No. ofPersons
WaterRequirement
in KLD
Treatedwater
reuse KLD
Effective WaterRequirement in
KLDExhibition Hall 4 4400 66.0 33.0 33.0Exhibition Hall 1 and 3 900 13.5 6.8 6.8Exhibition Hall A1 1000 15.0 7.5 7.5Exhibition Hall A2 1000 15.0 7.5 7.5Exhibition Hall B1 1000 15.0 7.5 7.5Employees 120 5.4 2.4 3.0Total 129.9 64.7 65.3
The effective water consumption is reduced by 64.7. KLD and the requirement will be inthe order of 65.3. KLD.2.4. Will there be diversion of water from other users? (Please assess the impacts ofthe project on other existing uses and quantities of consumption)NO, The required water shall be drawn from HMWSSB, during non-availability ofmunicipal water, water shall be drawn from ground sources.
2.5 What is the incremental pollution load from wastewater generated from theproposed activity? (Give details of the quantities and composition of wastewatergenerated from the proposed activity)
Characteristics of Waste waterParameter Quantity in mg/l
PH 6 – 7Total Suspended Solids 400 – 600BOD 200 – 300COD 450 – 500
The sewage shall be treated and reused for flushing, HVAC and on land irrigation. Thetreated sewage shall meet the standards for disposal into surface water bodies, andhence there shall not be any major additional load on the sewer lines, and may facilitatedilution of the sewage.
2.6. Give details of the water requirements met from water harvesting? Furnishdetails of the facilities created.
The storm water drain would also ensure that the sedimentation does not occur, asrainwater-harvesting structures will also help in controlling the sedimentation. Therainwater harvesting system proposed would enhance the water retention andincreases the water table. The drainage would in effect reduce the runoff and increasethe percolation. The gradient of the channel will be maintained throughout its lengthso that water does not pond within it. Flows will be maintained at velocities that will

FIA - 10
scour the channel of debris. For instance, runoff velocities should not be less than 1 m/snor should they exceed 3 m/s. Based on the catchment area, potential inflows andrainfall intensity, determine the drain size so as to minimize damage resulting from highintensity storms. Energy dissipaters such as drop structures will be provided along thechannel where runoff velocities may become excessive. The overflow from the stormwater drains at rainwater harvesting structures shall be provided with an overflowchannel to drain into the roadside plantation, which will act as a bios wale.
Rainwater Harvesting:The quantity of rainwater, which can be harvested, depends upon the annual rainfall,the area of the plot (catchment area) and soil characteristics. The amount of waterinfiltrated into soil varies with the condition of soil surface and the moisture content ofthe soil at the time of rainfall. The total amount of water infiltered depends on theinfiltration opportunity time, which depends mainly on the slope of the land and thefield structure like contour bunds, terraces and other structures, which tend to hold therunoff water over long periods on the land surface.
2.7. What would be the impact of the land use changes occurring due to the proposedproject on the runoff characteristics (quantitative as well as qualitative) of the area inthe post construction phase on a long-term basis? Would it aggravate the problems offlooding or water logging in any way?
The impact of project on physiography is a function of the rocky terrain of the area. Theproject area has a plain land and the design stage deliberations have ensured that themajor contours are not disturbed. However the physiography impact will be significantand non-reversible, as the contours of the area will be disturbed. The cut and filloperations may cause air pollution, clogging of drains and solid waste for disposal.The project will have a positive impact on the soils and soil quality as project will havelandscaping and the soils will be protected due to conservation. During the occupationstage, compaction will not occur, and the compaction if any will be restricted to roadROW. And the road ROW compaction cannot be said to be an impact of the operationstage as the pavement itself is a function of compacted base and sub base.
During the occupation stage, soil pollution due to garbage dumping at unauthorizedlocations may have temporary negative impact leading contamination of soil. Theaccidental spills or leaks are also a low probability incident.
The other major impact will be due to the increased run off and may have negativeimpact on the receiving body if the same is not properly managed. Impacts due tosurface runoff include increased soil erosion and local flooding or water logging. Hencethe project will be designed with adequate storm water drains and cross drainagestructures. The project activity will be provided with a Sewage treatment plant to treatthe domestic wastewater and necessary infrastructure will be provided for the safedisposal of domestic wastes to protect the water bodies.

FIA - 11
2.8. What are the impacts of the proposal on the ground water? (Will there betapping of ground water; give the details of ground water table, recharging capacity,and approvals obtained from competent authority, if any)
Ground water shall be used as a secondary source during non-availability of water fromHMWSSB. The ground water table is at a depth of 10m to 15m. State ground waterboard is approached for necessary permission.
2.9. What precautions/measures are taken to prevent the run-off from constructionactivities polluting land & aquifers? (Give details of quantities and the measures takento avoid the adverse impacts)
Construction activity is taken up only during non-monsoon season. There are no majordrains in the site. All material dumps shall be located away from the natural drains.Storm water drains shall be constructed before the construction of the buildings.
2.10. How is the storm water from within the site managed? (State the provisionsmade to avoid flooding of the area, details of the drainage facilities provided alongwith a site layout indication contour levels)Storm water drains: Storm water drains will be provided all over the site to meet theexpected increase in the runoff during rainy seasons due to the impervious nature ofthe roads and other paved areas. The site is uneven and it is proposed to maintain thelevels as much as possible.For each plot rainwater pipes shall be designed for rainfall intensity of 100mm/hour (for12 minutes storm) from terrace floor to be harvested by storm water sumps adjacent toeach building, excess disposed to external storm water lateral drain running adjacent tothe periphery of the campus. The storm water drain has been worked taking intoconsideration the site profile (contour).
CALCULATION FOR STORM WATER DRAIN:Quantity of storm water:(a) Without project:Area of Catchment, ‘A’ : 23.3872 HaRun off Coefficient, ‘C’ : 0.6Maximum intensity of rainfall, ‘I’ : 40 mm/hrTherefore Q : 1.559 m3/sec
(b) With project: :Area for catchment for roof and road : 4.750 Ha
Area of Catchment, ‘A’ : 4.750 HaRun off Coefficient, ‘C’ : 0.9Maximum intensity of rainfall, ‘I’ : 40 mm/hrTherefore Q = : 0.475 m3/sec
Area for catchment for open areas : 18.637 Ha

FIA - 12
Run off Coefficient, ‘C’ : 0.6Maximum intensity of rainfall, ‘I’ : 40 mm/hrTherefore Q = : 1.242 m3/secTotal Discharge : 1.717 m3/secBut, Discharge, Q = A/V
Where,A= Area of the Drain, :V= Max. Permissible Velocity : 6 m/sec for concrete drain
Area of drain, ‘A’ = Q/V : 0.286 m2
Taking depth of drain as 0.6 m at the starting point : 0.6Width of drain = Area/depth = 0.477 m 477 mm
Width of the drain is to taken 477 mm and depth varies according to the slope of ground.
Storm Water CalculationLandUse
Area inHectares
Vol./hrafter develo
pmentC=0.8
Vol./hrbeforeDevelo
pment C=0.6
Differencein
Discharges
Remarks
RoofArea 2.83 904.05 678.03 16.24
Stored in 120 m3
capacity sump& used for domestic
purposeRoadArea 1.93 616.00 462.00 16.40 10 nos. of bore hole
recharge pits areprovidedOpen
Area 18.64 2236.45 4472.89 -13.68
TOTAL 23.39 18.96*C=0.3 after development of greenery
2.11. Will the deployment of construction laborers particularly in the peak period leadto unsanitary conditions around the project site (Justify with proper explanation)No, Temporary toilet facilities shall be provided and the same shall be connected toseptic tank followed by soak pit.
2.12 What on-site facilities are provided for the collection, treatment & safe disposalof sewage? (Give details of the quantities of wastewater generation, treatmentcapacities with technology & facilities for recycling and disposal)
Sewage treatment plant based on Fluidized Aerobic Bio Reactor (FAB) technologyPROCESS DESCRIPTION:The raw sewage will be collected in a collection sump and pumped to mechanical barscreen chamber for removal of large floating matter followed by grit removal in GritChamber. The raw sewage will then be collected in an equalization tank forhomogenization of hydraulic load. The tank contents will be kept in suspension bymeans of course bubble serration through pipe grid. The equalization tank, with air

FIA - 13
flow indicator for continuous monitoring of air supply to the tank in order to avoidseptic conditions, will be covered from top (RCC or FRP) to avoid nuisance. Theequalized effluent will then be pumped to two Fluidized Aerobic Bio Reactors (FAB) inseries where BOD/COD reduction can be achieved by virtue of aerobic microbialactivities. The oxygen required will be supplied through coarse air bubble diffusers.The bio-solids formed in the biological process will be separated in the downstreamTube Settler. The clear supernatant will gravitate to the chlorine contact tank wheresodium hypochlorite will be dosed for disinfection of treated water prior to disposal.
The biological sludge generated in the FAB and settled in the tube settlers will becollected in a sludge sump and then pumped to sludge drying bed for de watering. Thedried sludge will then be disposed off suitably as manure. The schematics of theprocess are shown. The two main components of the treatment system viz. The FABreactor and tube settler are described in the following sections.
Fluidized Aerobic Bio Reactor (FAB)Conventional effluent treatment plants are large sized, power intensive and require alot of monitoring. Scarcity of open space and rising land a power costs have forced theindustries to look our for space saving, compact and efficient treatment options. Thishas led to the development attached growth processes where the bio mass is retainedwithin the aeration tank obviating the need for recycle. These plants are not onlycompact but also user friendly. The endeavor to have a continuously operating, no-clogging biofilm reactor with no need for back washing, low head-loss and high specificbiofilm surface area culminated in the most advanced technology of aerobic biologicalfluidized bed treatment where the biofilm (biomass) grows on small carrier elementsthat move along with the water in the reactor. The movement is normally caused byaeration in the aerobic version of the reactor.
The reactor combines all the advantages and best features of Trickling filters, Rotatingbiological contractors, activated sludge process and submerged fixed film reactors whileeliminating the drawbacks of these systems. The plants are more compact and moreenergy efficient.
The Fluidized Aerobic Bio Reactor (FAB) consists of a tank in any shape filled up withsmall carrier elements. The elements are made up of special grade PVC orpolypropylene of controlled density (shown in plate). For media of specific gravity 0.92-0.96 the overall density could be expected to increase up to 9.5% when full of biomasssuch that they can fluidize using an aeration device. A biofilm develops on theelements, which move along the effluent in the reactor. The movement within thereactor is generated by providing aeration with the help of diffusers placed at thebottom of the reactor. Then thin biofilm on the elements enables the bacteria to actupon the biodegradable matter in the effluent and reduce the BOD/COD content in thepresence of oxygen available from the air that is used for fluidization.

FIA - 14
Characteristics of Waste waterParameter Quantity in mg/l
PH 6 – 7Total Suspended Solids 300BOD 150COD 350
Design of the unitBasic dataFlow : 103.9 KLDCapacity : 130 m3
Peak factor : 3.5Peak flow Q peak : 350 m3/dayInfluent BOD : 200 mg/litInfluent Suspended Solids : 200 mg/litInfluent COD : 350 mg/litEffluent BOD : 30 mg/litEffluent COD : 200 mg/litEffluent Suspended Solids : 100 mg/lit
1. Bar Screen ChamberAverage flow : 0.0015 m3/secPeak factor : 3.5Peak flow : 0.005 m3/secVelocity at peak flow : 0.75 m/SecEffective area of screen RequiredAt average flow : 0.005 m2
At Peak flow : 0.0075 m2
Provide Effective area of screen : 0.0075 m2
Considering the bar of dia. 10 mm(w) and clear spacing of 20 mm (b)Overall area required : 0.011 m2
Considering screen depth as : 0.022 m Consider 0.5 mNumber of clear spacing : 0.3Number of bars : 1 Consider 3 Nos.Hence Provide 5 barsProvide a screen of 0.5 m X 0.5 m at an inclination of sin 600. In a screen channel of onemeter (1 m) length.
2. Grit Chamber :The flow from the bar screen chamber is let into the Grit Chamber of minimum 2 hourscapacity. This tank is provided to even out the flow variation, and to provide a continuousfeed into the secondary biological treatment units.

FIA - 15
Peak flow Q : 0.005 m3/secProviding a flow through velocity of 0.30 m/secCross sectional area of Channel (0.004/0.3) : 0.016 m2
Surface area of channel (0.004/0.03) : 0.38 m2
Assuming depth d : 0.2 mWidth of channel (0.013/0.2) : 0.08 m (say 0.2m)Length of channel (0.30/0.06) : 4. 5 m (say 4.5 m)Provide two channels each of 0.2 m wide and 4.5 m long with depth of waste water 0.2 m.
3. Equalization tank:The flow from the bar screen chamber is let into the equalization tank of minimum 2hourscapacity. This tank is provided to even out the flow variation, and to provide a continuousfeed into the secondary biological treatment units.Average flow : 5.41 m3/hrPeak factor : 3.5Peak flow : 18.95 m3/hrHydraulic retention tank = 2 hrs at Peak flowHence required volume of the tank : 37.91 m3
Provide tank of : 37.91 m3 CapacityAssuming depth : 3 mArea : 12.6 m2
Assuming length to width ratio (1:1) ; l=blength of the tank : 3.5 mwidth of the tank : 3.5 mAir required for agitation : 0.01 m3/ m2 minTotal air required : 22.75 m3/hrAir blower required : 40 m3/hr @ 3.8 mwcEffluent transfer pump : 5.41 m3/hr @ 8 mwc
4. Fluidized Aerobic Bio Reactor (FAB):The polypropylene media have been provided with a specific surface area of 350 – 520 m2
/m3. This allows micro-organisms to get attached and biomass concentration can beincreased to four folds as compared to Activated Sludge Process. This enables to considerhigher Organic loading rates.The micro-organisms attached to media are kept in a fluid state thereby maintaining theCSTR (continuous Stirrer tank reactor) regime as well as two tanks are provided in seriesmaking the plug – flow system. This will enhance the efficiencies and have the merits ofboth CSTR and plug-flow regimes.Organic loading rate : 3.2 kg BOD/ m3 dOrganic load : 26 kg/dayVolume of the tank : 8.2 m3
Assume the depth : 3 m

FIA - 16
No. of tanks in series : 1Size of the tank : 1.6 m dia. x 3.0 SWDSpecific gravity of media : 0.92 to 0.96Specific surface area of media : 350 – 520 m2 /m3
Media filling : 30 – 50 % of tank volumeOxygen required : 2 kg / kg BODOxygen in air : 23%Specific gravity of air @ 30 deg. : 1.65Aeration : Coarse bubbleOxygen transfer efficiency : 12%Air required : 51.82 m3/hrAir blower required : 80 m3/hr @ 6.5 m wc
5.Tube settlerSurface loading rate : 48 m2 /m3 dSurface area required : 2.7 m2
Tank size :3.0 m x 6.0 m x 2.7 m SWD With 55deg. hopper bottom
Tube Modules : 3.0m x 6.0 m x 0.6 m ht.Tube inclination : 60 deg.Settling area for 60 deg slope : 11 m2 /m3
Cross sectional area of tubes : 120 mm x 44 mm HexagonalHydraulic radius : 1/61 cm (1.5 cm)Shape factor : 0.6 – 0.7 for media settleable solids
6. Pre Filtration tankThe flow from the each individual settling tank i.e., the supernatant liquid is let into therespective Pre-Filtration Tank, which has a minimum 1.5 hours holding capacity. This tankis provided to hold the treated effluent and give an even flow to the pressure sand filter.Average flow : 5.41 m3/hrPeak factor : 2 m3/hrPeak flow : 10.8 m3/hrProvide min 1.5 hours holding capacity.Hence required volume of the tank : 16.25 m3
7. Pressure Sand Filter:Vertical down flow type with graded/sand bed under drain plate with polysterene strains.Flow : 130 m3/dayRate of filtration assumed as : 10 m3/m2/hrRequirement of treated water for usage in 20 hrs : 6.5 m3/hrDia. of filter of 1 nos. : 950 mmProvide pressure sand filter of 950 mm dia. and 1100 mm HOS with sand as media layer,

FIA - 17
under drain pipe, laterals face piping etc for each stream.
8. Activated Carbon Filter:Vertical down flow type with graded/sand bed under drain plate with polysterene strains.Flow : 130 m3/dayRate of filtration assumed as : 10 m3/m2/hrRequirement of treated water for usage in 20 hrs : 6.5 m3/hrDia of filter of 1 nos. : 950 mmProvide pressure sand filter of 950 mm dia. and 1100 mm HOS with sand as media layer,under drain pipe, laterals face piping etc for each stream.
9.Final Treated Water Holding TankIt is always preferred to provide one final holding tank of minimum one day holdingcapacity, so that the treated effluents can be stored and used back for gardening or othertertiary purposes.Capacity: 130 m3
9.Ultraviolet Disinfection:UV applied to low turbidity water is a highly effective means of disinfection. UV is notharmful to aquatic organisms in the receiving water. UV light kills viruses, Vegetative- andspore-forming bacteria, algae and yeasts. No chemicals are added to the wastewater tochange the pH, conductivity, odor or taste to create possible toxic compounds. UVtreatment has a few moving parts to adjust or wear out.
10. Sludge Filter Press:The biomass in the aeration tank stabilizes BOD in wastewater by consuming the organicmatter in the wastewater. The metabolic activity results in growth of the biomasspopulation in the Fluidized Aerobic Bio Reactor (FAB). Sludge holding tank has beenprovided with filter press for dewatering sludge. The filtrate drains off through the media,which is again let into equalization tank.The dewatered sludge is collected in trays, which can be used as manure in the garden.No. of plates : 24Size of plates : 600 mm X 600 mmPlate moc (material of construction) : PP (poly propline)Type of operation : HydraulicPower pack capacity : 2 HP
The dewatered sludge is collected in trays, which can be used as manure in the garden.

FIA - 18
Characteristics of Treated Waste waterParameter Quantity in mg/l
pH 7.3Total Suspended Solids 20BOD 10COD 50
Disposal of Treated Wastewater: The treated water shall be treated and reused forflushing the toilets, HVAC make up water requirement and on land irrigation. Hence allthe recycled water is utilized completely and is considered as a zero discharge.

FIA - 19
SEW
AG
E TR
EATM
ENT
PLA
NT
FLU
IDIZ
ED A
ERO
BIC
BIO
REA
CTO
R TE
CHN
OLO
GY
(FA
B)
Slud
geD
ewat
erin
gSy
stem
EQT
TAN
K
PSF
ACF
BarS
cree
n/ G
rit
Cham
ber
Raw
Sew
age
Ove
rflo
w
Filte
r Fee
dPu
mp
(1W
+1S)
Slud
geD
ispo
sal
SLU
DG
EH
OLD
ING
TA
NK
CLA
RIFI
EDW
ATER
TAN
K
FAB
REA
CTO
R(P
acka
ge u
nit)
TREA
TED
WAT
ERTA
NK
To R
euse
TUBE
Sett
lers UV

FIA - 20
3. VEGETATION3.1. Is there any threat of the project to the biodiversity? (Give a description of thelocal ecosystem with its unique features, if any)
The local area biodiversity is denudated due to increased urbanization. The Kothagudareserve forest located at a distance of 2.2 km has monoculture plantation of Eucalyptus.The KVBR botanical park adjacent to the Kothaguda reserve forests is developed by theforest department. The list of flora is presented in the following table;
Lupines JacasandaAstericus ButeaAcaiatha PulchriaAcalypha Thryalls Galas Malli GhiaceaeAlpiniasanderac Durvanth Repens VerbenaceaeHeliconia Rostrata AmaranthesHemnlia PennisetumAreca Asparagus Densiflorus LiliaceaeCalamuy Thuwatesii Rapis ExcelsaCalamuy freudotenius Hyphorbe LagenicahlisCalamuy hookerianus Beaucasnea RecusvataAgavaceaeCalamuy vattayila Phoenin RoebeliniCalamuy mepzianus Ophiopogon Jaburan LiliaceaeCalamuy delesserlinus Cardyline FruticosaCalamuy rocvalis Cycas RevdutaBambusa VerbenaDenora calamus stirictus Dwasf CannasBabusa uulgaris Allamanda CreepesSasa Tesse llata CodiumBabusa Entricssa AglouimaBabusa Parcooa CrotonsBabusa Rice SingoniumBabusa Balcoca CycadsBabusa Bacciffesaq StrelitzliaBamboo Grint Birds Vest PlantDedrocalumus Gigantus ZanaduStevensonta Grandi Florosa AgavesErantheuumCaryata Urens DressiraPhoenix Racbefri EsconiaBisbarkia Nofiles H.metalicaMastrinizi Cagyotat RoyalPalmPhonex Rupicoloca E. crystagalliNeodypisis Olecory Fishtail PalmRavenala Madgs Casiensis CH.metalicaPhoeix Rocbeleni H.palmGazanin Nivea Compositea FeruMini Errocta Cycad spp

FIA - 21
Thusibergia Creta ChemedogFenestiafireball CH.palmAsvacasia hetrophyilla Ficus SPPTccvomesia PodocarpusChitra mulamu ShefleraHibiseas SinggoviumJhosaChinsis Rubiaccae Singapore CherryTeloma PhoeuixVurantha gould Grapta phyllaruIuntana sellowina vesbenaeae JatrophaCephlocemies pelomeri Cactaceac NulivaAgaveanguffolia Agavaccae LillySansevicsfia trifaciata hliaccae CocciueaBeaucasenea recusutya Agavaccae DressinaEophorbia lencoccphale Eophorbiaccae Temple TreeEurerea giganlia Agavaccae DurauthaNisium oleandes Apocynacae VerbnaEranthemum LentanaHeliconia AlternethraMaranta RussaliaCanes Miuea ErectaPressina Silver OakPhylodendrum TabrelliaAlpinia KijiliaAglonema BauhiniaCodium BixaAcalypha RelePentas Rain TreeSnow Bush MilitiaFerms VelagaGladious TapsiAsalia C.NodosaColis PeltofounZetropha MinasopsSungheckia TecomaRibbon Grass MiscRoyal Palm ThespeciaSunsvcisia ParkiaLilly StassooSilver Clous IngadukiCalenchoe BixaOrahilds BaubooBegonia GoueliaSong of India HoleptelliaSpathsphyllum Rita

FIA - 22
Misccllaeom LagerstroemeaBambograss TaniAcalypha TeakSnotuff KaranjiLeavendes TecomaCulphia PeltoforumHamalia RelaBoganvillia BauhiuiaEnora KijiliaMandra P.SanlalinusPentas A.squamosaNightacen MimosopsNeesium JeediPlumbago NuxovuicaFinesettia MohocosAlmonda SaracaGultemia AdanautharaFire Ball AlastoriaGuiabi FeliciumGresontham C.FruticosaMarovam Mamaleria FlussfloriaGalladia Elinocacima RuparaFashion Flower Mila spFashion Fruit Ecinocirous ConpeliauaColour Cosmous Mamalinia ElbrigalaMarragold Perodia RepideaAspuragles Sulkuri Buttia AvinoshiaC.Fruticusa Acuoserose SpC.Granadias memiolouya UriteriaFicus SPP Jaumalious AeubicebyNictanthum Rubutra EseangiavaKawit Acilopsis HybridJamum Memuria Kaiuni HispetaC.Specltabills Cosphantha LacodecsCH.Bdam Meularia LoagiammaMilla Sulkoiyuthia aribeshiaLappupora Elausid Hybrid Labebia RubisrenaEamboceres Cledostove Hybrid Labebia LambiaspnaAecrroppis Bicolor Hybrid Eciuupis HybridGlobiba Hispada Labebia AlbutossMammilaria Poliakeneha Mammilaria Kujana
3.2. Will the construction involve extensive clearing or modification of vegetation?(Provide a detailed account of the trees & vegetation affected by the project)No, the site area has no major trees and is covered mainly with shrubs.

FIA - 23
3.3. What are the measures proposed to be taken to minimize the likely impacts onimportant site features (Give details of proposal for tree plantation, landscaping,creation of water bodies etc along with a layout plan to an appropriate scale).The landscape area is 18187.9 m2. The plantaion list is presented in the following table;
S. No Plant Name1 Anthocephalus Chinensis2 Roystonea Regia3 Tabebuia Rosea4 Bauhinea Blakeana5 Lagerstroemia Speciosa6 Delonix Regia7 Cassia Spectabilis8 Alstonia Scholaris9 Tabebuia Chrysantha
10 Kigelia Pinnata11 Fillicium Decipens12 Mimusops Elengi13 Ficus Benjamina14 Alstonia Scholaris15 Cassia Fictula
4. FAUNA4.1. Is there likely to be any displacement of fauna- both terrestrial and aquatic orcreation of barriers for their movement? Provide the details.-NO-
4.2. Any direct or indirect impacts on the avifauna of the area? Provide details.-No major impact envisaged. However the proposed plantaion shall help in providingnesting space for the avifauna.
4.3. Prescribe measures such as corridors, fish ladders etc to mitigate adverse impactson fauna.-NA-
5. AIR ENVIRONMENT
5.1. Will the project increase atmospheric concentration of gases & result in heatislands? (Give details of background air quality levels with predicted values based ondispersion models taking into account the increased traffic generation as a result ofthe proposed constructions)
Maximum Predicted Ground Level ConcentrationsS.No Pollutant Direction Distance
(m)Maximum Concentration
(g/m3)1 PM SW 295 0.582 SOx SW 295 2.813 NOx SW 295 3.65

FIA - 24
5.2. What are the impacts on generation of dust, smoke, odorous fumes or otherhazardous gases? Give details in relation to all the meteorological parameters.
Sources of dust during Construction ActivityVehicle and Equipment Use Exposed Areas Contractor Activities
Vehicle and equipment enteringand leaving the project site
Areas of exposed soil thathave been cleared and
grubbedLand clearing and grubbing
Vehicle and equipmentmovement and use within the
project site
Areas of exposed soil thathave been excavated,filled, compacted, or
graded
Earthwork including soilcompaction, rough grading
and final grading.
Temporary parking lots andstaging areas
Vehicle and equipmentstorage and service areas
Materials handling, includingmaterial stockpiling, transfer,
and processing
Onsite Construction traffic Material processing areasand transfer points Batch dropping, dumping
Construction roads Conveyor transfer and stackingBare ground areas of
construction site Material transferring
Spilled materials Milling and screeningoperations
Construction stockpiles Demolition and debris disposal
Soil and debris piles Tilling
OCCUPATION STAGENo dust generation is envisaged during the occupation stage as the residential area willhave greenery and all roads shall be paved and all slopes & embankments shall beturfed as per best engineering practices.
5.3. Will the proposal create shortage of parking space for vehicles? Furnish details ofthe present level of transport infrastructure and measures proposed for improvementincluding the traffic management at the entry & exit to the project site.
Parking Space Provision of the ProjectFloor 4-Wheelers 2-WheelersSurface parking 157 100Total 157 100
Volume/Capacity Ratio
Towards ExistingVolume, PCU/hr
MaximumCapacity, PCU/hr
Volume/Capacity
LOS,Performance
HITEX road 1689 3600 0.469 “A” Excellent

FIA - 25
Modified Los & Performance
RoadExistingvolume,PCU/hr
Existingvolume/Capacity
Additionalvolume
ModifiedVolume
ModifiedVolume/Capacity
ModifiedLos &
performance
HITEX road 1689 0.469 121 1810 0.503 "B" Verygood
5.4. Provide details of the movement patterns with internal roads, bicycle tracks,pedestrian pathways, footpaths etc., with areas under each category.
-NA-
5.5. Will there be significant increase in traffic noise & vibrations? Give details of thesources and the measures proposed for mitigation of the above.
There shall be an increase in the traffic density by 121 nos. of vehicles.
5.6. What will be the impact of DG sets & other equipment on noise levels & vibrationin & ambient air quality around the project site? Provide details.
DG sets shall be provided with acoustic enclosures. The emissions from the DG sets arereleased at 5.0 m, 3.8 m height above the roof level.
6. AESTHETICS
6.1. Will the proposed constructions in any way result in the obstruction of a view,scenic amenity or landscapes? Are these considerations taken into account by theproponents?
-NO-
6.2. Will there be any adverse impacts from new constructions on the existingstructures? What are the considerations taken into account?
-No adverse impacts are anticipated-
6.3. Whether there are any local considerations of urban form & urban designinfluencing the design criteria? They may be explicitly spelt out.
The layout plan is on the basis of Development rules prescribed by GHMC.
6.4. Are there any anthropological or archaeological sites or artefacts nearby? State ifany other significant features in the vicinity of the proposed site have beenconsidered.
-NO-

FIA - 26
7. SOCIO-ECONOMIC ASPECTS
7.1. Will the proposal result in any changes to the demographic structure of localpopulation? Provide the details.
-NO- The population distribution is presented in the following table.
Demography of Project Impact AreaParameter Number
No. of Households 146893Total Population 689125Males 332811Females 330313Scheduled Castes 51722Males 26329Females 25343Scheduled Tribes 9195Males 4825Females 4480Total Workers 224635Male 183450Female 41235Total Main Workers 205227Male 171099Female 34198Total Marginal Workers 19399Male 12342Female 7107Total Non Workers 464409Male 175371Female 289218
7.2 Give details of the existing social infrastructure around the proposed project.
It is a Commercial ComplexBus Stops: 2.0 km from siteRailway station: 16.0 Km from site
7.3. Will the project cause adverse effects on local communities, disturbance tosacred sites or other cultural values? What are the safeguards proposed?-NO-

FIA - 27
8. BUILDING MATERIALS
8.1. May involve the use of building materials with high-embodied energy. Are theconstruction materials produced with energy efficient processes? (Give details ofenergy conservation measures in the selection of building materials and their energyefficiency)
Material Consumption for Project
Land Use BUA perunit in (m2)
ReadyMix
Concrete(m3)
Cement(bags)
Sand(m3)
Aggregate (m3)
Water(m3)
Brick(Nos) x1000
Reinforcement
steel (MT)
Total BUA 16541 71126 57894 5955 4962 4003 2266 579Total 16541 71126 57894 5955 4962 4003 2266 579
8.2. Transport and handling of materials during construction may result in pollution,noise & public nuisance. What measures are taken to minimize the impacts?All materials shall be transported during non peak hours. Sand and aggregate arecovered during transportation. Noise generating construction activity shall not be takenup during night times, adjacent to the residential area.
8.3. Are recycled materials used in roads and structures? State the extent of savingsachieved?Construction waste is used for road construction.
8.4. Give details of the methods of collection, segregation & disposal of the garbagegenerated during the operation phases of the project.
GARBAGE MANAGEMENT PLAN
MaintenanceDepartment
MaintenanceDepartment
Biodegradablewaste
Non-BiodegradableWaste
Authorized Agencyof Local Body
Authorized Agencyof Local Body
Main Collectionpoint/Segregation
Point
Main Collectionpoint/Segregation
PointLocal Body
Segregation at Source
MaintenanceDepartment
DomesticHazardous Wastes
Authorized Agencyof Local Body
Main Collectionpoint/Segregation
PointLocal Body Local Body
MaintenanceDepartment
e - Waste
Authorized Agency
Storage Area
Local Body
Segregation at source into bio-degradable, non bio- degradable and domestichazardous wastes. Facilitation by owners co-operative to dispose recyclable waste toAuthorized Waste Pickers / Authorized Recyclers. Balance segregated waste given toAuthorized Agency of Local Body for disposal.

FIA - 28
9. ENERGY CONSERVATION9.1. Give details of the power requirements, source of supply, backup source etc.What is the energy consumption assumed per square foot of built-up area? How haveyou tried to minimize energy consumption?
ENERGY CONSUMPTION STATEMENT
S.No DescriptionTotal
area inm2
Power allocatedin watts per m2
Total Powerrequired in
(KW)
1 Halls &Common area
36097 60.00 2165.81
Total 2165.81Maximum demand in kw at 0.6 diversity factor 1299.5Consumption of power for 12 hours per day 15593.8Maximum demand in kw at 0.1 diversity factor 216.6Consumption of power for 12 hours per day 2599.0Total consumption of power per day 18192.8 KWTotal consumption of power per year 66.4 Lakh UnitsTotal consumption of power @ 175 effective days 31.8 Lakh Units
Energy Saving by using copper wound transformers for Comm.Power loss using CU. wound transformer 1.20%
Savings in power loss using CU wound transformer 0.8 Lakh Units
Energy Saving by using HF BallastPower loss using conventional ballast 25%Power loss using HF ballast 14%Savings in power loss using HF ballast 11%
S.No DescriptionTotal
area inm2
Powerallocated in
watts per m2
Total Powerrequired in
(KW)1 Parking 12638 3.00 37.912 Common Area 10829 5.00 54.15
Total 92.06Maximum demand in kw at 0.8 diversity factor 73.6Consumption of power for 12 hours per day 883.8Maximum demand in kw at 0.2 diversity factor 18.4Consumption of power for 12 hours per day 220.9Total consumption of power per day 1104.7 KWTotal consumption of power per year 4.0 Lakh UnitsSavings in power loss using HF ballast 0.4 Lakh UnitsTotal consumption of power @ 175 effective days 2.33 Lakh UnitsSavings in power loss using HF ballast @ 175 days 0.26 Lakh Units
LOC
ALBO
DIE
S

FIA - 29
Electrical Power savings using LED for lightingSavings in power Using LED as against Fluorescent Lamps 30%
S.No Description Total areain m2
Powerallocated in
watts per m2
Total Powerrequired in
(KW)1 Parking 12638 3.00 37.912 Common Area 10829 5.00 54.15
Total 92.06
Maximum demand in kw at 0.8 diversity factor 73.6Consumption of power for 12 hours per day 883.8Maximum demand in kw at 0.2 diversity factor 18.4Consumption of power for 12 hours per day 220.9Total consumption of power per day 1104.7 KWTotal consumption of power per year 4.0 Lakh UnitsSavings in power using LED 1.2 Lakh UnitsTotal consumption of power @ 175 effective days 2.33 Lakh UnitsSavings in power loss using HF ballast @ 175 days 0.70 Lakh Units
Electrical Power savings using Solar Power for External lighting
S.No Description Total areain m2
Powerallocated in
watts per m2
Total Powerrequired in
(KW)1 External Lighting 40.00
Total 40.00Maximum demand in kw at 1.0 diversity factor 40.0Consumption of power for 6 hours per day 240.0Maximum demand in kw at 0.5 diversity factor 20.0Consumption of power for 6 hours per day 120.0Total consumption of power per day 360.0 KWTotal consumption of power per year 1.31 Lakh UnitsSavings in power using Solar Power 1.31 Lakh Units

FIA - 30
Proposed Solar power generation plant
1Assuming power generation to be 1% of the total powerconsumed as per MOEF requirement1 KWP Solar power production all round the year 1460 units
A
1% Solar power calculation based on 365 days of total powerconsumed Hitex 66403.73 unitsNo. Of KWP solar power required 45.0 KWPNo of Panel required to generate above required solar power 143.0 panels
B
1% Solar power calculation based on 175 days of total powerconsumed 31837.4 unitsNo. Of KWP solar power required 22.0 KWPNo of Panel required to generate above required solar power 70.0 panels
Electrical Power savings using water Cooled ChillersSavings in power by using Water Cooled Chillers as against Air cooled Chiller 40%
S.No DescriptionTotalareain m2
Powerallocated in
watts per m2
Total Powerrequired in
(KW)1 Halls & Common area 36097 30.00 1082.90
Total 1082.90Maximum demand in kw at 0.6 diversity factor 649.7Consumption of power for 12 hours per day 7796.9Maximum demand in kw at 0.1 diversity factor 108.3Consumption of power for 12 hours per day 1299.5Total consumption of power per day 9096.4 KWTotal consumption of power per year 33.2 Lakh UnitsSavings in power using water Cooled Chillers and heatrecovery wheel
13.28 Lakh Units
Total consumption of power per year @ 175 days 16.33 Lakh UnitsSavings in power using water Cooled Chillers and heatrecovery wheel @ 175 days
6.53 Lakh Units
Total Saving
S.No. Description Savings in lakhkwh units
Savings inpercentage
1 With Cu wound Transformer 0.8 1.22 with HF Ballast 0.4 0.0073 With CFL 1.2 1.84 With Water Cooled Chillers 13.3 20.05 With Solar Power for External lighting 1.3 2.0
Total Saving 17.0 25.7Total Consumption 66.4Percentage of saving achieved@365 days 25.7 %Percentage of saving achieved@175 days 30 %

FIA - 31
Presently HITEX is having an event factor of 100 days a year and projected to haveevents with 175 days a year post completion of new halls”.
No of DG sets 625 kVA X 3 nos. + 350 kVA X 1 no capacity, DG sets shall be used for backup power for street lighting, lifts and sewage treatment plant. Each wing shall beprovided with DG based energy for a light and a fan during load shut down.
9.2. What type of, and capacity of, power back-up to you plan to provide?Details of DG Set emissions
StackNo. Name of Stack
StackHeight
(m)
Dia ofstackat top
(m)
Temp.ofexhaust
gases (0C)
ExitVelocit
y(m/sec)
PollutantEmission Rate (g/sec)
PM SO2 NOx
1 625 KVA DG set(3 Nos.) 5.0 0.24 270 10.0 0.002 0.048 0.06
2 350 KVA DG set.(1 Nos.) 3.8 0.14 158 8.2 0.001 0.028 0.04
9.3. What are the characteristics of the glass you plan to use? Provide specifications ofits characteristics related to both short wave and long wave radiation?The façade is made up of Double glass glazed unit as per the attached specification. Thiswill reduce solar radiation into the hall. The glass characteristics are presented asfollows;
Characteristics of Glass utilizedNomal Anti-firing type
See through (SE) Non-see through(NS) SE NS
Nominal thickness 6 8 10 6 10 9.8 9.8
StructureOut glass FL3 FL4 FL5 G3 G5 PWN 6.8 GWN 6.8vacuum 0.2 0.2 0.2 0.2 0.2 0.2 0.2In glass Low-E 3 Low-E 4 Low-E 5 Low-E 3 Low-E 3 Low-E 3 Low-E 3
VisibleTL(%) 75.5 74.6 73.8 75.5 73.8 72.4 72.4RL(%) 15.9 15.8 15.6 15.9 15.6 16.8 16.8
SolarTS(%) 62.6 60.1 57.8 62.6 57.8 56.9 56.9RS(%) 14.1 13.6 13.2 14.1 13.2 14.2 14.2AS(%) 23.3 26.3 29.0 23.3 29.0 28.9 28.9
Solar heat gain 0.76 0.74 0.72 0.69 0.66 0.69 0.63
Thermalinsulation
(W/m2K)(kcal/m2hr
C)
1.5 1.5 1.5 1.5 1.5 1.5 1.5
1.3 1.3 1.3 1.3 1.3 1.3 1.3
Sound reduction(JIS grade) 30 30 30 30 30 35 35
Maximum size(mm)Minimum size(mm)
2,400 x 1,350350 x 200
1,800 x1,200350 x 200
L M350 x 200

FIA - 32
Description VLT (%) Ext Ref(%)
Int Ref(%)
SolarFactor
U-value(W/sq.m
K6mm Lumina (SKN 165)
HS/Toughened+12mm Air-Gap+6mmSGGI Clear Glass (HS/Toughened)
59 16 17 0.32 1.5
Details of Glass Materials:The three sides of the exhibition halls is made of brick walls without any glass/windows.The fourth side is having glass façade 30% of the area. Also this south side façadeportion has roof projection of 6.0 meter as canopy thus providing sunshade.
9.4. What passive solar architectural features are being used in the building? Illustratethe applications made in the proposed project.
The width to height ratio between the apartment blocks is around 1:1.5 which isachieved as per the development control rules.
All window openings is provided with chajjas depth as specified by the designstandards (around 300mm)
The full height openings have been designed for better lighting in theapartments units. For climatic considerations, all these openings are placed nextto a balcony/sit out space, which acts as a buffer by eliminating the directlighting and thereby avoiding heat ingress.
Use of Large fenestrations in buildings reduces the use of mechanical lightenergy during daytime thereby reducing the energy consumption.
9.5. Does the layout of streets & buildings maximize the potential for solar energydevices? Have you considered the use of street lighting, emergency lighting and solarhot water systems for use in the building complex? Substantiate with details.Solar power shall be used for external lightning (street lightning, landscape, basement,etc.).
9.6. Is shading effectively used to reduce cooling/heating loads? What principles havebeen used to maximize the shading of Walls on the East and the West and the Roof?How much energy saving has been effected?Yes, The blocks are aligned north and south to maximize the shading.
9.7. Do the structures use energy-efficient space conditioning, lighting and mechanicalsystems? Provide technical details. Provide details of the transformers and motorefficiencies, lighting intensity and air-conditioning load assumptions? Are you usingCFC and HCFC free chillers? Provide specifications.Building MaterialsThe building materials chosen for the blocks are as per the recommendations of the
climatic standards. To achieve the maximum energy value, a balance between the availability of
building materials locally and skilled labourers is achieved.
FIA - 33
Burnt brickwork with fly ash for the walling and plastering reduces the thermalpenetration by 20-30%.
The RCC roof is covered with Brickbat concrete and terracotta weather tiles,which reduces the heat penetration by 18%.
Colour of Facades The colour choice for the buildings uses a maximum of white surface (nearly
84%). This increases the solar reflectivity factor. Emittance factor for white surfaces is around 90% compared to coloured
surface (20-60%) 16% of wall area uses earthen colours and this space has longer thermal storage
in the walls. This creates a comfortable temperature at nights due to the thickerwalls designed.
Heat Absorbance of the brick used for building is around 50%. The roof of the units (if not covered with terrace garden) is painted white to
have a maximum reflectivity. The R-factor (resistance factor) for the roof with brickbats and white painted is
nearly 40% more as compared to the recommended standards.
Energy Saving Measures In HVAC Design: The combination of high-energy efficient water-cooled centrifugal chillers &
vapor absorption machine will be used for air conditioning works. The proposed chillers are CFC and HCFC free. The efficiency (Coefficient of performance – COP) of chiller will be higher than
the Energy Conservation Building Code (ECBC) specification. The fresh air into the building will be as per ASHRAE 62.1-004 ventilation
requirement standard. The building will be designed for positive pressurizationto reduce the outdoor infiltration.
High-energy efficient air-cooled screw chillers which are CFC and HCFC freechillers are being used for the building. The COP of the chiller will be more thanthe ECBC requirement.
The proposed air-handling units will have compatibility for variable speedoperation & variable air volume system.
The secondary chilled water system will be with variable speed drive for energysaving.
9.8. What are the likely effects of the building activity in altering the microclimates?Provide a self-assessment on the likely impacts of the proposed construction oncreation of heat island & inversion effects?Green RoofsGreen roofs are an attractive roofing option that can reduce urban heat islands byproviding shade and through evapotranspiration, the release of water from plants to thesurrounding air. The benefits of green roofs include: Reduce sewage system loads by assimilating large amounts of rainwater. Absorb air pollution, collect airborne particulates, and store carbon. Protect underlying roof material by eliminating exposure to the sun's ultraviolet
(UV) radiation and extreme daily temperature fluctuations.

FIA - 34
Serve as living environments that provide habitats for birds and other smallanimals.
Offer an attractive alternative to traditional roofs, addressing growing concernsabout urban quality of life.
Reduce noise transfer from the outdoors. Insulate a building from extreme temperatures, mainly by keeping the building
interior cool in the summer.
9.9. What are the thermal characteristics of the building envelope? (a) Roof; (b)External walls; and (c) Fenestration? Give details of the material used and the U-values or the R-values of the individual components.
S.No. COMPONENTS U – VALUE (W/m2K)
1 Walls 2.44
2 Roofs 3.353 Floors 1.134 Windows 5.675 Glass < 3.0
9.10. What precautions & safety measures are proposed against fire hazards? Furnishdetails of emergency plans.-NA-
9.11.If you are using glass as wall material provides details and specificationsincluding emissivity and thermal characteristics.-No-
9.12. What is the rate of air infiltration into the building? Provide details of how youare mitigating the effects of infiltration.4 A changes = 4.
9.13. To what extent the non-conventional energy technologies are utilized in theoverall energy consumption? Provide details of the renewable energy technologiesused.-Nil-
10. ENVIRONMENT MANAGEMENT PLAN
The Environment Management Plan would consist of all mitigation measures for eachitem wise activity to be undertaken during the construction, operation and the entirelife cycle to minimize adverse environmental impacts as a result of the activities ofthe project. It would also delineate the environmental monitoring plan forcompliance of various environmental regulations. It will state the steps to be taken incase of emergency such as accidents at the site including fire.
Furnished in EIS/EMP report.

Hyderabad International TradeExposition Centre
Survey Nos. 5/6 (P), 5/7 (P), 5/8, 5/9, 5/10, 5/11, 5/12,5/13, 5/14, 5/15, 5/16, 5/17, 5/18, 5/19, 5/19, 5/20,5/21, 5/22, 5/23, IZZATHNAGAR, SERILINGAMPALLY,
RANGA REDDY DISTRICT
Studies & Documented ByM/sTeam Labs and Consultants(ISO 9001:2008 certified Organization)B-115, 116, 117 & 509,Annapurna Block,Aditya Enclave,Ameerpet,Hyderabad- 500 038Phone: 91-040-23748555 & 23748616Fax : 91-040-23748666e-mail: [email protected]


![AREA - environmentclearance.nic.inenvironmentclearance.nic.in/writereaddata/FormB/EC/FORM_1/30032016...PROPOSED PRODUCTION -5, ... 2011, 2012, 2013, 2014, 2015 and 2016] I. Basic Information](https://static.fdocuments.in/doc/165x107/5aa8fa097f8b9a81188c3111/area-production-5-2011-2012-2013-2014-2015-and-2016-i-basic-information.jpg)