Human Resource Trends in the Contact Centre Sector · the contact centre sector recruits a large...
67
Human Resource Trends in the Contact Centre Sector Copyright 2009, Contact Centre Canada (CCC) All rights reserved. This document is provided for the explicit use and guidance of parties as an information resource only. Any other use of this document or parts thereof, including reproduction, publication, distribution, transmission, re-transmission or public showing, or storage in a retrieval system in any form, electronic or otherwise, for purposes other than that expressly stated above without the expressed permission of Contact Centre Canada is strictly prohibited. December 2009
Transcript of Human Resource Trends in the Contact Centre Sector · the contact centre sector recruits a large...

Human Resource Trends in the Contact Centre Sector
Copyright 2009, Contact Centre Canada (CCC)
All rights reserved. This document is provided for the explicit use and guidance of parties as an information resource only. Any other use of this document or parts thereof, including reproduction, publication, distribution, transmission, re-transmission or public showing, or storage in a retrieval system in any form, electronic or otherwise, for purposes other than that expressly stated above without the expressed permission of Contact Centre Canada is strictly prohibited.
December 2009

Page No. 1
Preface
The success of Contact Centre Canada’s Labour Market Study report was possible thanks to the active participation and strong commitment of contact centre industry leaders. Industry validation, that includes methodologies, research findings and recommendations, is a critical component of every project that Contact Centre Canada undertakes on behalf of the members it represents. For this study, Contact Centre Canada also would like to expresses its appreciation to the many industry leaders who gave generously of their time by participating in the study’s Advisory Committee. Their practical insight has ensured that that this study is grounded in the day-to-day economic and competitive realities of the contact centre sector in Canada. Industry’s guidance has shaped both how the research results were interpreted and the important recommendations that are based on the study’s key findings. Contact Centre Canada also appreciates the numerous industry leaders who took time to participate in interviews, surveys and who made a contribution towards providing insight into key human resource trends which this report describes. This report is not just a study of trends, it is an industry ‘call to action’ in order to address critical human resources challenges that affect the industry’s ability to remain competitive in Canada as well as internationally. Contact Centre Canada intends to use this report as an instrument to mobilize the sector towards successful outcomes.
Acknowledgement
Prism Economics and Analysis was commissioned by Contact Centre Canada to lead its labour market survey project. Prism Economics and Analysis specializes in analyzing the interaction between labour markets and human resource management. Prism has become one of Canada’s leading sources of analytical expertise on the relationship between labour market trends and human resources management. Prism first undertook a study for Contact Centre Canada in 2006. That study examined offshoring, technology trends, and the impact of regulation. The study was accompanied by an extensive literature review which was published separately. In 2007, Prism completed a second study for Contact Centre Canada looking at human resources trends in the contact centre sector that focused on key changes in the economic and labour market environment for contact centres. We acknowledge the quality and partnership effort that Prism Economics and Analysis conducted on our behalf.
All of the studies sited are available on Contact Centre Canada’s web site www.contactcentrecanada.ca

Contact Centre Canada
Page No. 2
Current Human Resources Trends
in the Contact Centre Sector
Executive Summary 3
1. Introduction 11
2. The Contact Centre Sector from 1995 to 2009 12
3. Demographic and Employment Profile 22
4. Technology Trends 35
5. Post-Recession Outlook 41
6. Focus on the Financial Sector 46
7. Recruitment and Retention 57
8. Recommendations 64

Contact Centre Canada
Page No. 3
Executive Summary
This report was commissioned by Contact Centre Canada – Centre de contact clientèle du Canada,
with support from Human Resources and Skills Development Canada – Ressources humaines et
Développement des compétences Canada.
The report is based on a review of scholarly and trade literature, interviews with 36 industry
leaders and public officials, and a survey of contact centres in the financial sector.
Key Finding
The key finding of this report is that the human resource management strategies that
emerged in the period 1995 to 2005 need to be re-assessed in light of how labour market
conditions have changed.
It is conservatively estimated that contact centres account for around 3% of employment in
Canada. However, the industry and occupational classification codes that are used by Statistics
Canada make it difficult to develop a precise estimate of the number of persons who work in a
contact centre environment and are therefore affected by economic and technology trends in the
sector. A more precise measure of persons working in a contact centre environment would likely
be higher than 3%.
1995-2005: The Sector Takes Shape
From 1995 to 2005, the spread of contact centres sustained rapid employment growth. During this
period, three defining trends re-shaped the contact centre sector. The first of these was the rapid
emergence of outsourcers. By 2005, outsourcers had achieved a 20-25% market share and
accounted for more than 80% of the sector’s growth.
The second key trend was the emergence of the near-shoring market, i.e., providing customer
support to the U.S. market. This growth was propelled by the low Canadian dollar. Lastly, the third
important trend was the growth of off-shore contact centres which held out the prospect of 40-
60% reductions in operating costs.
Contact Centre Canada
Page No. 4
The period 1995-2005 also saw consolidation of the human resources management
strategies that predominate in the sector today. While there are variations and exceptions, the
most frequent features of these strategies are:
narrowly defined and standardized jobs that can be automated
wherever practical,
reliance on low cost pools of labour, often, though not always found in
smaller communities and in areas with high rates of unemployment,
high levels of monitoring – both electronic and supervisory – that are
tied to overall performance metrics, and
limited scope for advancement into career jobs.
2006-2008: Changes in Labour Market
Between 2006 and 2008, the economic landscape changed in two fundamental respects. In
the first place, the appreciation of the Canadian dollar removed a key condition that had supported
near-shoring. Second, compared to 1995-2000, unemployment rates in the period 2006-2008
were about one third lower. The impact was most evident in the youth labour force from which
the contact centre sector recruits a large proportion of its workers.
The new labour market conditions drove up turn-over rates, put pressure on wages, and
threatened the cost competitiveness of many contact centres. Human resources management
strategies that were predicated on a Canadian dollar under $0.80 and large pools of job-
seekers were no longer sustainable.
2009: Recession
The downturn that commenced in late 2008 reduced the labour market pressure that had
emerged in the previous period. It is estimated that employment in the contact centre sector
declined by around 5% in 2009. The exchange rate depreciated for a brief period but quickly
returned to levels that eliminate any Canadian cost advantage over U.S. contact centres. This
confirmed that the earlier realignment of the exchange rate was a long-term development.
Post-Recession Outlook
Taking account of growth factors as well as technology trends, employment in the contact centre
sector is likely to grow between 0% and 2.35% per year over the next five years. The labour
market is likely to return to pre-recession conditions in 2011 or early 2012. Consequently, by
2011 or – at the latest, 2012 – there will be a return of the labour market and exchange rate
pressures that were evident in the period 2006-2008. The challenges to human resources
management strategies that were evident in the period 2006 to 2008 will again be evident
in 2011 or 2012.

Contact Centre Canada
Page No. 5
Employment Profile
Census and other data show that:
the contact centre sector relies heavily on the youth labour force to meet its
requirements. In the Atlantic region, 29% of workers are age 25 or less.
the sector’s labour force is predominantly female,
the proportion of low educational attainers (i.e., persons with no post-
secondary qualifications) increased from around 32% in 2001 to
approximately 47% in 2006.
on a regional basis, employment is moderately, though not radically, skewed
to Atlantic Canada,
most employment growth has been in small communities,
comparisons between earnings in contact centres and the “all
occupations/all industries” average are strongly affected by industry and
region and also by whether the comparison is to the median or the mean.
Job Structures
Roughly 85% of employment in contact centres is related to customer support or marketing.
These jobs fall into three tiers.
Figure No. ES-1 Employment Tiers
Tier Description
Characteristics
Estimated Share of Employment
Tier I - Advanced complex, often technical inquiries high value customers and/or high
value transactions (e.g., investment and travel products)
b2b customers
low sensitivity to location costs quality of labour pool is key location determinant low vulnerability to outsourcing strong preference for full-time, permanent over
part-time, temporary workers Tier I wages are 60%-100% (or more) above Tier III
(entry level), depending on industry
20%
Tier II - Intermediate: provide more complex information moderate opportunities for up-selling
or cross-selling moderate value customers
moderate sensitivity to location costs moderate to low vulnerability to offshoring and self-
serve technologies wages tend to be 20-40% above Tier III
40-50%
Tier III – Entry Level: entry-level provide non-complex information script-based order-taking tele-marketing most market-research
high sensitivity to location costs vulnerable to offshoring and self-serve technologies low wages vulnerable to significant increase in turnover when
labour market tightens
30-40%
Contact Centre Canada
Page No. 6
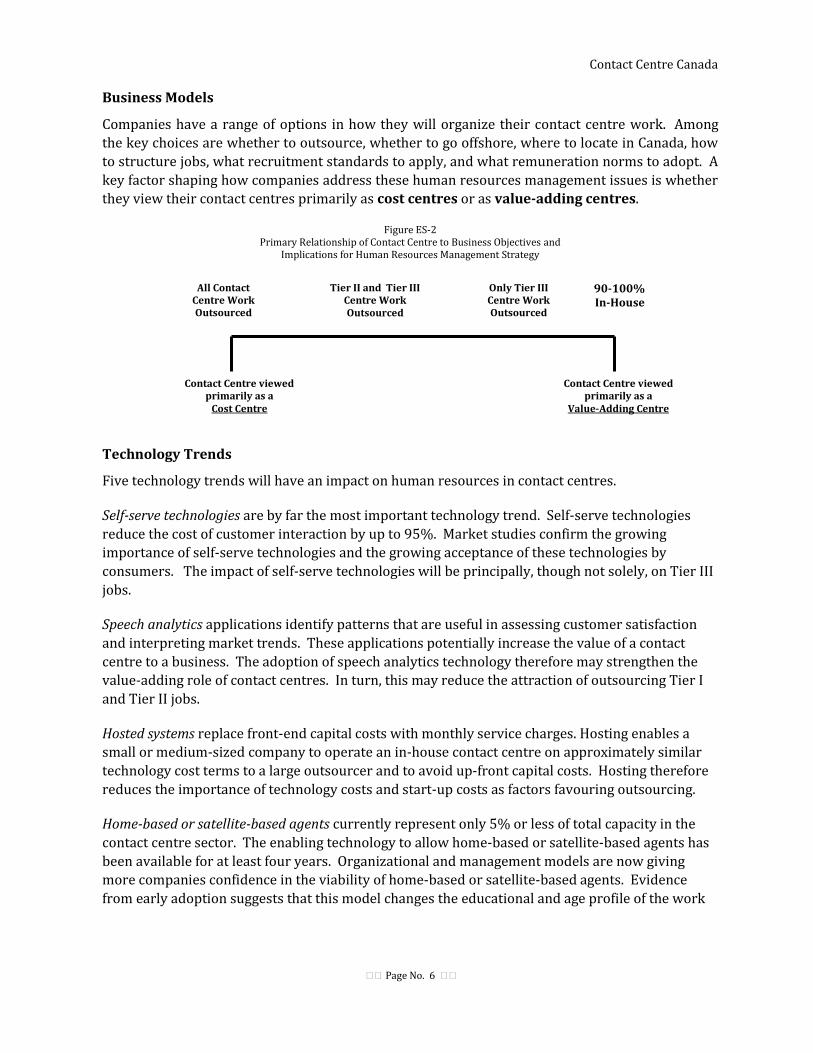
Business Models
Companies have a range of options in how they will organize their contact centre work. Among
the key choices are whether to outsource, whether to go offshore, where to locate in Canada, how
to structure jobs, what recruitment standards to apply, and what remuneration norms to adopt. A
key factor shaping how companies address these human resources management issues is whether
they view their contact centres primarily as cost centres or as value-adding centres.
Figure ES-2 Primary Relationship of Contact Centre to Business Objectives and
Implications for Human Resources Management Strategy
Technology Trends
Five technology trends will have an impact on human resources in contact centres.
Self-serve technologies are by far the most important technology trend. Self-serve technologies
reduce the cost of customer interaction by up to 95%. Market studies confirm the growing
importance of self-serve technologies and the growing acceptance of these technologies by
consumers. The impact of self-serve technologies will be principally, though not solely, on Tier III
jobs.
Speech analytics applications identify patterns that are useful in assessing customer satisfaction
and interpreting market trends. These applications potentially increase the value of a contact
centre to a business. The adoption of speech analytics technology therefore may strengthen the
value-adding role of contact centres. In turn, this may reduce the attraction of outsourcing Tier I
and Tier II jobs.
Hosted systems replace front-end capital costs with monthly service charges. Hosting enables a
small or medium-sized company to operate an in-house contact centre on approximately similar
technology cost terms to a large outsourcer and to avoid up-front capital costs. Hosting therefore
reduces the importance of technology costs and start-up costs as factors favouring outsourcing.
Home-based or satellite-based agents currently represent only 5% or less of total capacity in the
contact centre sector. The enabling technology to allow home-based or satellite-based agents has
been available for at least four years. Organizational and management models are now giving
more companies confidence in the viability of home-based or satellite-based agents. Evidence
from early adoption suggests that this model changes the educational and age profile of the work
All Contact Centre Work Outsourced
90-100% In-House
Only Tier III Centre Work Outsourced
Contact Centre viewed primarily as a
Cost Centre
Tier II and Tier III Centre Work Outsourced
Contact Centre viewed primarily as a
Value-Adding Centre

Contact Centre Canada
Page No. 7
force, reduces turnover, and improves productivity and performance. Whether these benefits will
endure if the model is expanded is uncertain. So also are how regulatory issues will be handled
related to employment status, employer liability, and security of data.
Text Messaging is currently employed by around one quarter of contact centres, though this
proportion is expected to increase significantly. Text messaging facilitates automation of certain
types of script-based inquiries, such as account balance information. As well, text messaging
services can more easily be off-shored. The growth of the text messaging channel will reduce the
growth trajectory for Tier III (Entry Level) customer service representatives.
Financial Sector
The financial services industry employs 15-17% of persons working in the contact centre sector,
and possibly more. An important trend has been the use of contact centres to market ever more
complex investment and insurance products. Most banks pursue a ‘relationship deepening’
strategy with their customers, that is to say, rather than focus on single transactions, banks
endeavour to expand the number of financial services a customer uses. This puts a premium on
customer satisfaction. The broader value to a bank of its contact centre, therefore, can exceed
significantly the profit that may be generated by any single contact centre-based transaction.
Outsourcing plays only a limited role in the financial services industry, accounting for 10% or less
of customer service and marketing functions. Offshoring is a negligible factor. Interviews and
Census data suggest the follow structure of customer service jobs:
Figure No. ES-3 Estimated Distribution of Customer Service Staff by Tiers
in the Financial Services Industry (Based on Interviews)
Tier Description Percent
III Entry Level 30-40%
II Intermediate Complexity in Transactions and Inquiries 30-50%
I More Complex Transactions and Inquiries 10-20%
In the Atlantic region, salaries in the financial services industry are generally about 8-10% above
the all industries average for contact centre workers. In the rest of the country, salaries in contact
centres in the financial services industry are somewhat below the all industries average.
The most important technology trend is the move to self-serve applications. There is widespread
interest in the viability of home-based or satellite-based customer service representatives. A
number of the major chartered banks are conducting pilot projects to ascertain whether the home-
based model is feasible. None of the major banks, however, has moved beyond the pilot project
stage. Among the insurance companies there is less expressed interest in the home-based model,
although if the viability of this model is demonstrated for the banking sector, emulation should be
expected.

Contact Centre Canada
Page No. 8
The most important human resource challenge is retaining qualified staff. Comparative evidence
suggests that the financial services industry is generally more successful in controlling turnover
than many other segments of the contact centre sector.
Recruitment and Retention
Recruitment and retention are almost invariably identified as the most significant human
resources management challenges facing the contact centre sector. In 2008, the National
Association of Call Centers in the United States estimated that the cost of replacing a contact centre
worker was $5,566.
High turnover rates are a message from the labour market. In essence that message is that
human resources management strategies that were developed for an earlier period are no
longer sufficient in the context of changed labour market conditions.
High dismissal rates and high quite rates are both attributable to human resource management
policies. High dismissal rates reflect a weakness in recruitment and screening procedures that
result in too many persons being hired who lack either the aptitudes or personality attributes that
are required by contact centres. Equally, high quit rates may mean that hiring is targeting
segments of the labour force that are noted for high turnover rates, e.g., students. Alternatively,
high quit rates may arise because organizations are not dealing with what workers perceive as the
negative aspects of employment in a contact centre environment. These may include the way that
jobs are defined, the way that performance is monitored, remuneration standards, and
opportunities for advancement (or the lack thereof).
Five strategies have emerged to address high turnover rates:
1. Selection based on ‘Job Congruence’ Principles
2. Strategic Re-Profiling of Demographics
3. Remuneration-based Strategies
4. Altering the Characteristics of the Work Environment
5. Altering the Characteristics of Jobs
How contact centres choose to tackle the turnover problem will largely determine the quality of
jobs in the sector.
Contact Centre Canada
Page No. 9
Recommendations
A chronic challenge in analyzing labour market trends in the contact centre sector is that
occupational codes are based on skill and functional attributes and do not take account of working
environments. Similarly, industry codes are based on the predominant characteristic of an
organization’s output. The coding principles makes it impossible to measure employment trends
in in-house contact centres which account for approximately 75-80% of jobs in the sector.
Recommendation No. 1:
Contact Centre Canada should work with HRSDC and Statistics Canada to develop
occupational codes that better identify persons employed in a contact centre
environment.
As noted earlier, 75-80% of contact centre employees work in in-house contact centres.
Documenting and analyzing trends in in-house contact centres should be a priority for Contact
Centre Canada. In light of the importance of contact centres as job generators, especially in
smaller communities, an analysis of trends in in-house contact centres also will be relevant to
provincial and local economic development offices. Analyses of vertical markets will also
strengthen the relevance and effectiveness of Contact Centre Canada. Experience with ad hoc
industry-based surveys suggests that the only reliable way to achieve the coverage needed is to
administer vertical market surveys through Statistics Canada.
Recommendation No. 2:
Contact Centre Canada should work with Statistics Canada to develop a customized
survey instrument that can be applied to vertical markets in which in-house contact
centres predominate. The priorities for applying this customized survey instrument
should be the financial services industry, the telecom industry, and the travel and
accommodation industry.
Recruitment and retention are the most significant long-run challenge facing the contact centre
sector. This report concludes that high turnover rates are directly related to human resources
management strategies. The current economic downturn has relieved the sector from the severe
pressures it was confronting prior to 2009. However, the employment outlook for the contact
centre sector suggests that pressure from the labour market will return in 2011 or, at the latest, in
2012. Turnover will again become a serious challenge for the sector if the human resources
management strategies that were developed in the period 1995 to 2005 are not altered.

Contact Centre Canada
Page No. 10
Recommendation No.3:
Contact Centre Canada should undertake a study of turnover trends in contact centres
and in the contact centre sector, as a whole to assist the sector in understanding the
relationship between human resources management strategies and turnover trends.
Contact Centre Canada should also engage the sector in discussions about turnover and
the need to re-think the human resources management polices that are at the root of high
turnover. This should be part of Contact Centre Canada’s broader mandate to develop
labour market information products that better enable organizations to plan and
implement their human resources investments.
How an organization understands its contact centre is a key determinant of its human resources
management strategies. Contact Centre Canada can strengthen the internal position of contact
centres in organizations by documenting how contact centres create value. This could include
publishing case studies, developing a web-based library of industry white papers and scholarly
research, and taking on an advocacy role within the sector for contact centres as value adders.
Recommendation No.4:
Contact Centre Canada should work with stakeholders to highlight the important role of
contact centres as value-adders.
December 2009

Contact Centre Canada
Page No. 11
1. Introduction
This report was commissioned by Contact Centre Canada – Centre de contact clientèle du Canada,
with support from Human Resources and Skills Development Canada – Ressources humaines et
Développement des compétences Canada
The purpose of the report is to review current labour market and human resources management
trends in the Canadian contact centre sector and to assess the implications of these trends for
sector-based initiatives. The report also examines contact centres in the financial sector in more
detail.
The study is based on a review of scholarly and trade literature, interviews with 36 industry
leaders and public officials, and a survey of contact centres in the financial sector. This study
benefited greatly from the advice provided by members of the Project Advisory Committee.
Chapter Two of the report reviews the history of the contact centre sector from its emergence as a
distinct sector (around 1995) through to the present. The chapter focuses on the evolving
interplay between the enabling technologies, labour market conditions, and exchange rate
conditions. A key finding of this chapter is that the human resource management strategies that
emerged in the period 1995 to 2005 need to be re-assessed in light of how labour market conditions
have changed.
Chapter Three presents a more detailed demographic and employment profile of the contact
centre sector. An important conclusion of this chapter is that the human resources profile of the
sector is complex, in particular in regard to the types and quality of jobs in the sector.
Chapter Four reviews important technology trends and how these will affect human resources
management over the next five years. Among the trends examined are: the growing importance of
home-based agents and satellite contact centres, the increased use of self-serve technologies,
notably the web and voice recognition applications, and increased sophistication of speech
analytic applications.
Chapter Five considers how the contact centre sector will be restructured in light of changes in
labour market and exchange rate conditions and in the technologies available. Chapter Five also
sets out a five-year employment projection.
Chapter Six provides a more detailed profile of human resources in contact centres in the financial
sector. The financial sector is important because it accounts for a large proportion of employment
in the sector and is predominantly organized around in-house contact centres, rather than
outsourcers.
Chapter Seven examines recruitment and retention challenges in the contact centre sector.
Chapter Eight presents conclusions and recommendations.
Contact Centre Canada
Page No. 12
2. The Contact Centre Sector from 1995 to 2009
This chapter reviews the emergence and evolution of the contact centre sector from approximately
1995 to 2009.
Prior to 1995, large organizations handled their customer service functions through a mix of
traditional correspondence centres, networks of service offices, and telephone-based call centres.
By the mid-1990s, dramatic reductions in the cost of telecommunications prompted a migration of
customer service functions to call centres. As access to the internet increased, these call centres
became multi-channel contact centres. They also took on a significantly increased role in selling
products and services, initially in the airline sector, IT and wireless telecoms, but subsequently in
financial products and a range of other goods and services.
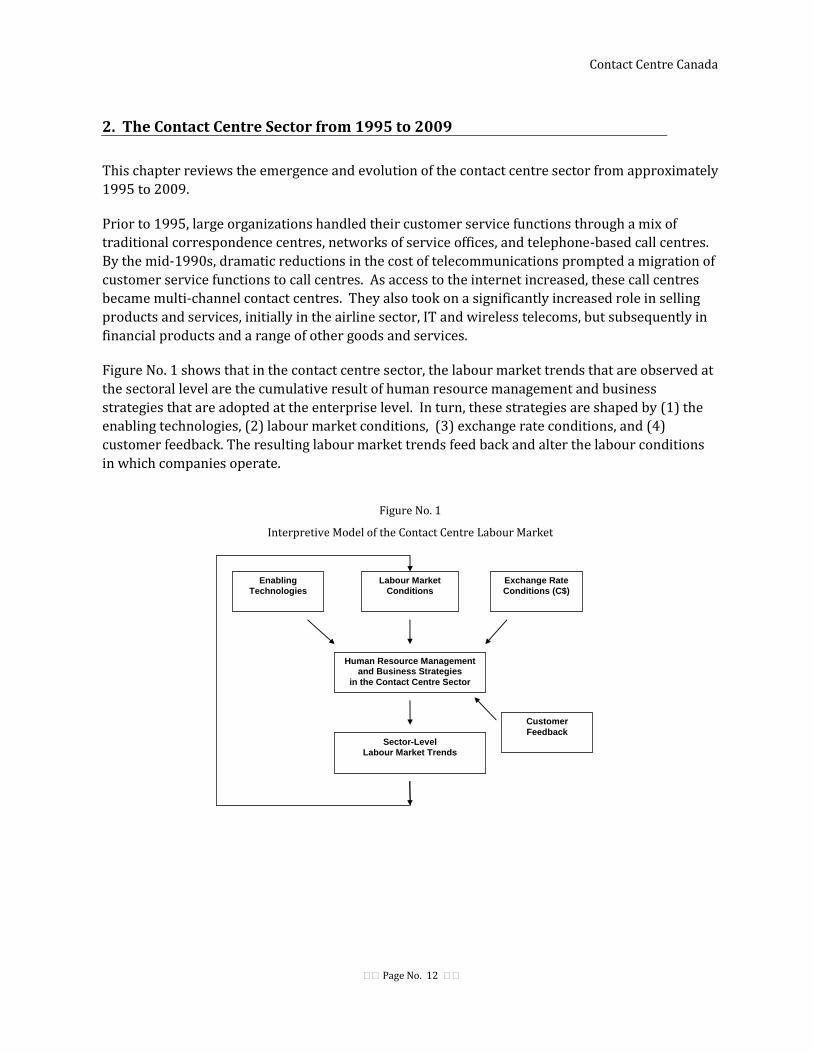
Figure No. 1 shows that in the contact centre sector, the labour market trends that are observed at
the sectoral level are the cumulative result of human resource management and business
strategies that are adopted at the enterprise level. In turn, these strategies are shaped by (1) the
enabling technologies, (2) labour market conditions, (3) exchange rate conditions, and (4)
customer feedback. The resulting labour market trends feed back and alter the labour conditions
in which companies operate.
Figure No. 1
Interpretive Model of the Contact Centre Labour Market
Human Resource Management and Business Strategies
in the Contact Centre Sector
Enabling
Technologies
Labour Market
Conditions
Exchange Rate
Conditions (C$)
Sector-Level
Labour Market Trends
Customer
Feedback

Contact Centre Canada
Page No. 13
A Capsule History
1980 to 1995
- Incremental decline in telecom costs.
- ‘Tipping point’ in cost structure triggers emergence of contact centre
sector
1995 to 2000
- Rapid adoption of the contact centre as a business model.
- Rapid migration of customer service functions to contact centres.
- Annual employment growth in contact centres: 20-30%.
2000 to 2005
- Continued migration of customer service functions to contact centres.
- Employment growth decelerates to approximately 3-5% per year.
- Significant increase in outsourcer share of contact centre market.
- Outsourcers experience annual growth rates >20%.
- Emergence of near-shoring market to serve U.S.
- Exported services account for approximately 15% of sector
employment.
- Emergence of offshore suppliers.
- Emergence of segmentation strategy for call routing.
2006 to 2008
- Contact centres become a mature sector.
- Appreciation of C$ slows the flow of foreign direct investment
- Export revenues level off.
- Self-serve technologies and offshoring reduce rate of employment
growth to around 2-3% per year.
- Buoyant labour market conditions ratchet up turnover rates, put
pressure
on wages, and reduce the quality of the labour pool available to the
sector.
2009
- Recession causes closure of some facilities and reduces hiring
rate in many others.
- Overall employment in contact centres declines by around 5%.
- Next restructuring wave commences.
In Canada, the history of the contact centre sector is the history of how companies formulated
their human resource management and business strategies in light of the technology options
available to them and the equally important labour market and exchange rate conditions. The
central point of this history is that the human resource management strategies that emerged under
the technology, labour market, and exchange rate conditions that prevailed in the period 1995 to
2005 need to be re-assessed in light of how
those conditions have changed.
1995 to 2000: Rapid Emergence
From approximately 1995 to 2000, the
diffusion of the contact centre as a business
model underpinned double-digit growth
rates in contact centre employment. There
are no reliable estimates of employment in
contact centres prior to 2000. However, the
rapid growth in the number of agent
positions is evidence of how quickly large
organizations embraced the contact centre
as a business model. In Canada, the number
of agent positions increased from just under
147,000 in 1995 to almost 513,000 positions
in 2000 - a growth rate of more than 28%
per year.1 This rapid growth in contact
centre employment was common to
virtually every economy in the OECD.2
2000 to 2005: The Sector Takes Shape
By 2000, most large organizations had
implemented contact centre strategies.
During the period 2000 to 2005, three
trends shaped the economic landscape for
the contact centre sector:
the rapid emergence of
outsourcers,
near-shoring, i.e., providing
provide contact centre services to the U.S. market, and
the emergence of off-shore centres.
1 NBI, Michael Sone & Associates, Canadian ACD Contact Centre Market Report
2 Batt et al. estimate that in the 1990s contact centre employment in advanced economies increased by an
average of 20% per year. Rosemary Batt, David Holman, and Ursula Holtgrewe, “The Globalization of Service Work: Comparative Institutional Perspective on Call Centers”, Industrial and Labour Relations Review, Vol. 62, No. 4 (July 2009) p 465

Contact Centre Canada
Page No. 14
Outsourcers:
Historically customer service functions were undertaken by direct employees of a company or by a
network of affiliates. The emergence of the contact centre as the most efficient channel for
undertaking many types of customer support provided an opportunity for outsourcers to enter
this market on a large scale. Between 1995 and 2000, employment in business support services
(NAICS 5614) increased by about 6,000 persons per year.3 Between 2000 and 2005, employment
increased at double that rate, i.e., by around 12,000 persons per year. A study by Statistics Canada
found that between 1998 and 2006, revenues in outsourced contact centres increased by almost
28% per year.4
There are no definitive estimates of the share of outsourcers in the Canadian contact centre sector.
A market study by ContactBabel estimated that, in 2006, outsourcers accounted for around 14% of
capacity in the contact centre sector. 5 Other surveys suggest a higher share. Estimates based on
the Labour Force Survey suggest that the outsourcer share of contact centre employment is likely
around 20%.
Between 2001 and 2006, Census data suggest that outsourcers accounted for almost 80% of
employment growth in the contact centre sector.
The emergence of outsourcers as significant actors in the contact centre sector altered the sector’s
economic landscape. The environment in which outsourcers operate is intensely competitive. The
imperative to control costs is evident in outsourcers’ human resource management practices. Data
analyzed by Batt et al. suggest that, compared to in-house contact centres, outsourcers are:
more likely to service international markets,
more likely to operate large facilities,
more likely to focus on lower value sales transactions and outbound calling,
likely to have higher levels of performance monitoring (often to meet client
requirements),
likely to have a greater proportion of part-time and temporary staff in their work force,
likely to have higher rates of turnover, and
likely to have lower overall salary structures.6
3 NAICS 5614 includes, but is not restricted to, telephone contact centres. The NAICS code for telephone
contact centres is 56142. Statistics Canada does not release Labour Force Survey data at the five-digit industry level.
4 Richard Vincent and Larry McKeown, Trends in the Telephone Call Centre Industry, (2008), Statistics
Canada 63F0002XUE – No. 053 5 ContactBabel, North American Contact Centres in 2006 6 Batt et al., op cit. p 470

Contact Centre Canada
Page No. 15
Census data confirm the lower overall salary structures. Figure No. 2 compares average annual
earnings for four occupations closely associated with contact centres. The comparison is between
the all industries average and ‘Administrative and Support Services to Business (NAICS 5614)’
which includes, but is not restricted to outsourced contact centres. The annual earnings estimates
are a blend of part-time and full-time earnings and should not be taken as equivalent to salary
rates.
Figure No. 2 Average Annual Earnings of Selected Occupations
Census, 2006 (Special Tabulation)
All Industries Average
Administrative and Support Services to
Business ( NAICS 5614)
B533 Customer service representatives - Financial services $25,631 $14,274
B553 Customer service, information and related clerks $27,954 $16,606
B554 Survey interviewers and statistical clerks $19,824 $10,237
C182 User support technicians $39,689 $20,568
Near-Shoring:
In the period 2000 to 2005, Canada emerged as a competitive location for providing contact centre
services to the United States. In some instances, U.S.-based companies established in-house
contact centres in Canada to service the North American customer base. In most cases, however,
the migration of U.S. contact centre work to Canada was the result of outsourcers in Canada
competing successfully in the U.S. outsourcing market by offering a lower cost location without the
risks associated with offshore locations. Some of these outsourcers were Canadian-based
companies that sought out opportunities in the U.S. market. In many cases, however, the near-
shoring phenomenon was driven by foreign direct investment that was attracted to the more
competitive cost environment in Canada.
During the period from approximately 1998 to 2005, there was a significant flow of foreign direct
investment into the Canadian contact centre sector. A study by the United Nations Commission on
Trade and Development (UNCTAD) reported that in 2002 and 2003, Canada was second only to
India as a destination for foreign direct investment in contact centres.7 For most of this period, the
KPMG Competitive Alternatives cost model showed that the cost of establishing and operating a
contact centre in Canada was 15-25% lower than in comparable population centres in the United
States.8
7 UNCTAD, World Investment Report, 2004: The Shift Towards Services, United Nations, p 162
8 KPMG Competitive Alternatives
Contact Centre Canada
Page No. 16
The near-shoring phenomenon significantly changed the character of the Canadian contact centre
sector. This was especially the case in Atlantic Canada and Quebec where near-shoring
operations appear to have accounted for 20-25% of overall employment in the contact centre
sector. On a national basis, export markets accounted for somewhere around 15% of contact
centre employment.9
Offshoring:
Off-shore centres initially arrived on the scene as a means of providing lower cost technical
support for IT products. Subsequently, Indian-based business process outsourcers moved
aggressively into the contact centre outsourcing market. U.S.-based outsourcers responded to this
competition by opening their own facilities, first in India and then in the Philippines. Other
offshore centres followed in rapid succession.
Off-shoring contact centre work held out the prospect of reducing operating costs for customer
service by 40% to 60%. Companies soon learned that these cost reductions often entailed a
reduction in customer satisfaction. Perhaps the most prominent instance of a company retreating
from its off-shoring strategy was Dell Computer’s decision in 2004 to repatriate customer support
for business accounts from India to North America. By 2005, the predominant strategy was
segmentation of in-bound customer calls. Higher value transactions and higher value customers
would be serviced by domestic contact centres, but lower value transactions and lower value
customers would be routed to off-shore contact centres. Advancements in call routing technology
and in voice-over-internet protocol (VoIP) facilitated this segmentation strategy. Most large
outsourcers are positioned to accommodate this segmentation strategy by offering their clients
the option to blend off-shore services with on-shore services. By 2005-2006, our industry
interviews suggest that most organizations had settled on the mix of off-shore and on-shore
services that was appropriate to their business strategy.
Overall, in the period 2000 to 2005, employment in contact centres appears to have increased by
around 3-5% per year.
9 The only survey-based estimate is the Canadian Call Centre Industry Study, 2006 which was undertaken by
Danielle van Jaarsveld and Ann Frost as the Canadian component of The Global Call Centre Report. This survey estimated that approximately 35% of Canadian contact centres were primarily focused on export markets. However, this survey appears to have over-weighted subcontractors. Subcontractors are significantly more oriented to export markets than in-house contact centres, which are almost entirely focused on serving the domestic market. Our 15% estimate is based on scaling back the weight of sub-contractors. A more conservative calculation can be derived from estimates developed by DataMonitor which suggest that in 2003 around 6% of agent capacity in Canada was focused on serving the U.S. market. DataMonitor, Profiting from Canadian Call Center Outsourcing, August 2003.
Contact Centre Canada
Page No. 17
2006 to 2008: The Economic Landscape Changes
Between 2006 and 2008, the economic landscape changed in two fundamental respects:
the appreciation of the Canadian dollar came to be seen as a permanent
change in economic conditions, and
higher overall levels of employment diminished the labour pool
available to contact centres while at the same time putting upward
pressure on labour costs and turnover rates.
Canadian Dollar:
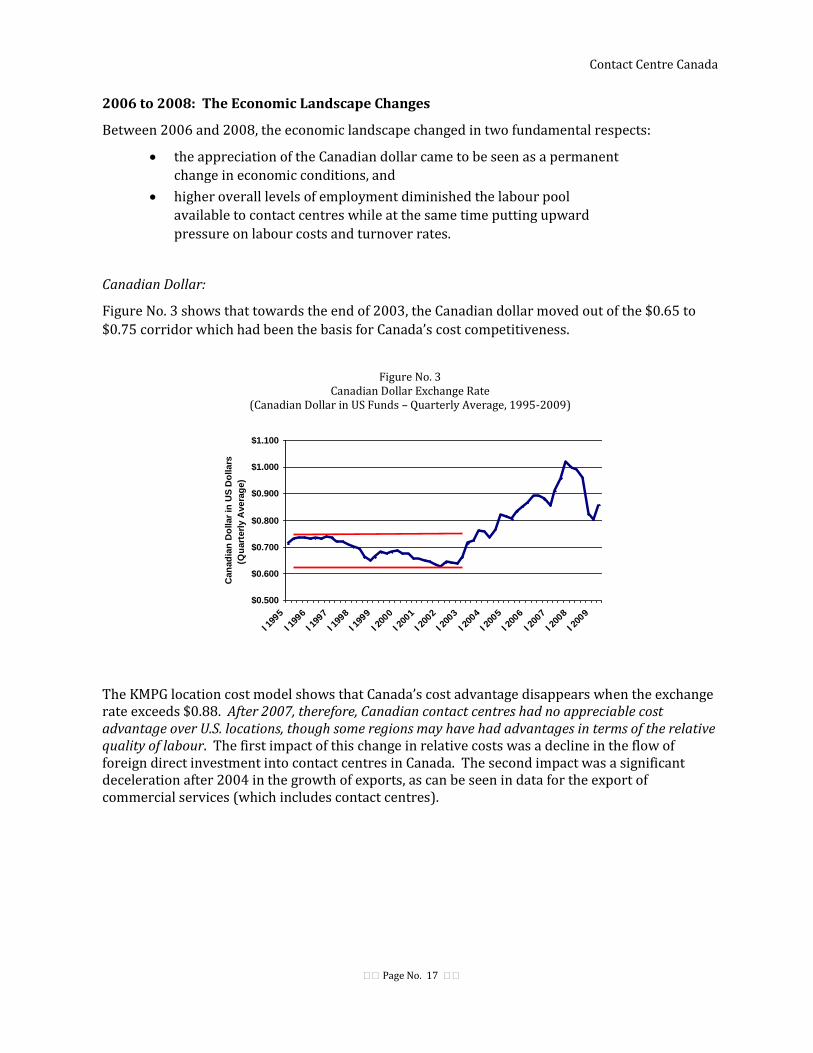
Figure No. 3 shows that towards the end of 2003, the Canadian dollar moved out of the $0.65 to
$0.75 corridor which had been the basis for Canada’s cost competitiveness.
Figure No. 3 Canadian Dollar Exchange Rate
(Canadian Dollar in US Funds – Quarterly Average, 1995-2009)
$0.500
$0.600
$0.700
$0.800
$0.900
$1.000
$1.100
I 199
5
I 199
6
I 199
7
I 199
8
I 199
9
I 200
0
I 200
1
I 200
2
I 200
3
I 200
4
I 200
5
I 200
6
I 200
7
I 200
8
I 200
9
Can
ad
ian
Do
llar
in U
S D
ollars
(Qu
art
erl
y A
vera
ge)
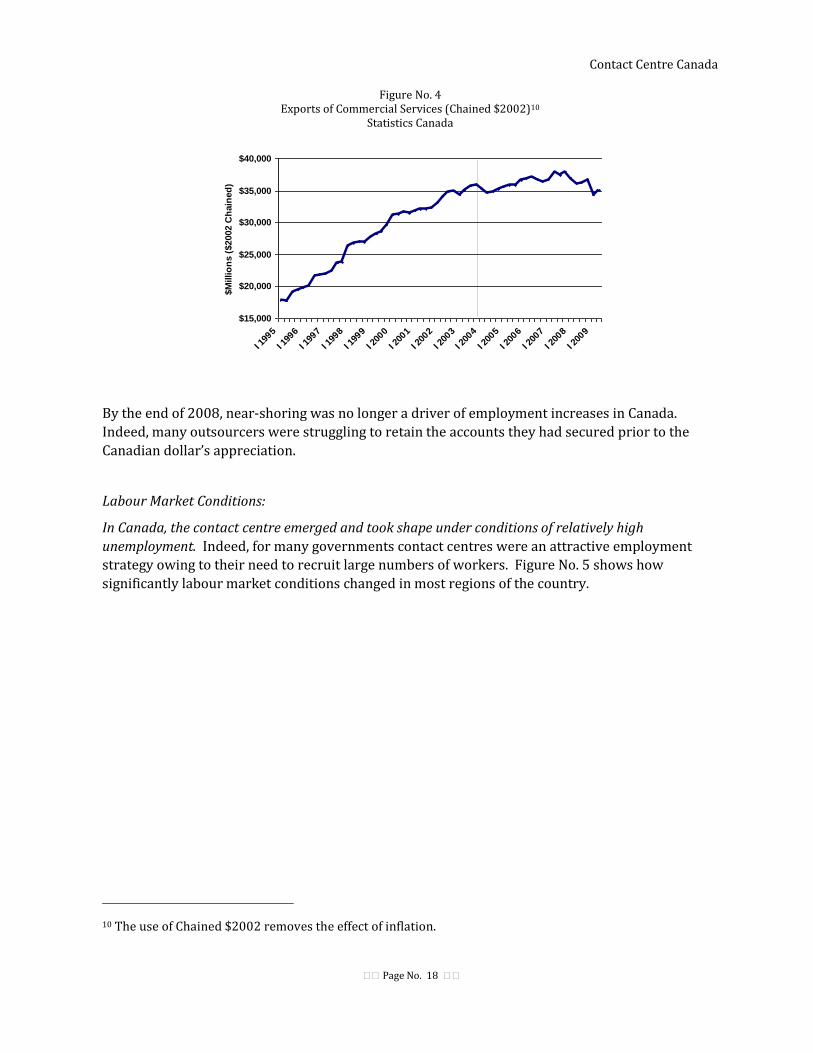
The KMPG location cost model shows that Canada’s cost advantage disappears when the exchange rate exceeds $0.88. After 2007, therefore, Canadian contact centres had no appreciable cost advantage over U.S. locations, though some regions may have had advantages in terms of the relative quality of labour. The first impact of this change in relative costs was a decline in the flow of foreign direct investment into contact centres in Canada. The second impact was a significant deceleration after 2004 in the growth of exports, as can be seen in data for the export of commercial services (which includes contact centres).
Contact Centre Canada
Page No. 18
Figure No. 4 Exports of Commercial Services (Chained $2002)10
Statistics Canada
$15,000
$20,000
$25,000
$30,000
$35,000
$40,000
I 199
5
I 199
6
I 199
7
I 199
8
I 199
9
I 200
0
I 200
1
I 200
2
I 200
3
I 200
4
I 200
5
I 200
6
I 200
7
I 200
8
I 200
9
$M
illio
ns (
$2002 C
hain
ed
)
By the end of 2008, near-shoring was no longer a driver of employment increases in Canada.
Indeed, many outsourcers were struggling to retain the accounts they had secured prior to the
Canadian dollar’s appreciation.
Labour Market Conditions:
In Canada, the contact centre emerged and took shape under conditions of relatively high
unemployment. Indeed, for many governments contact centres were an attractive employment
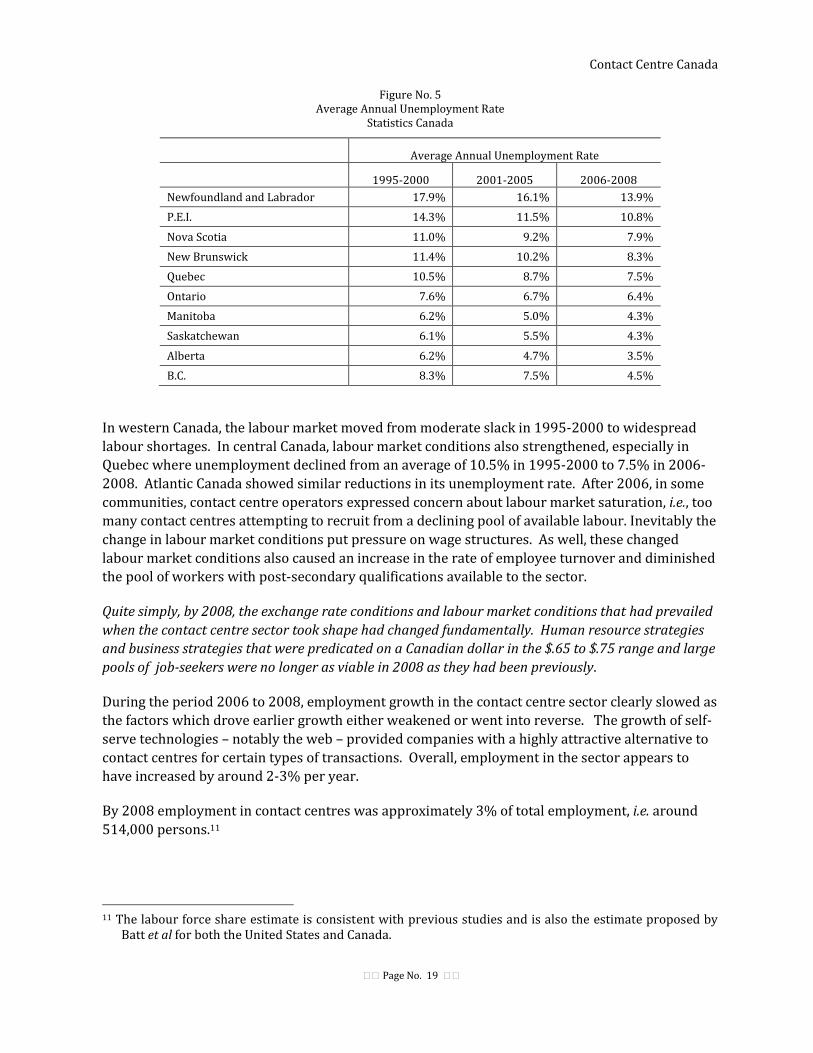
strategy owing to their need to recruit large numbers of workers. Figure No. 5 shows how
significantly labour market conditions changed in most regions of the country.
10 The use of Chained $2002 removes the effect of inflation.
Contact Centre Canada
Page No. 19
Figure No. 5 Average Annual Unemployment Rate
Statistics Canada
Average Annual Unemployment Rate
1995-2000 2001-2005 2006-2008
Newfoundland and Labrador 17.9% 16.1% 13.9%
P.E.I. 14.3% 11.5% 10.8%
Nova Scotia 11.0% 9.2% 7.9%
New Brunswick 11.4% 10.2% 8.3%
Quebec 10.5% 8.7% 7.5%
Ontario 7.6% 6.7% 6.4%
Manitoba 6.2% 5.0% 4.3%
Saskatchewan 6.1% 5.5% 4.3%
Alberta 6.2% 4.7% 3.5%
B.C. 8.3% 7.5% 4.5%
In western Canada, the labour market moved from moderate slack in 1995-2000 to widespread
labour shortages. In central Canada, labour market conditions also strengthened, especially in
Quebec where unemployment declined from an average of 10.5% in 1995-2000 to 7.5% in 2006-
2008. Atlantic Canada showed similar reductions in its unemployment rate. After 2006, in some
communities, contact centre operators expressed concern about labour market saturation, i.e., too
many contact centres attempting to recruit from a declining pool of available labour. Inevitably the
change in labour market conditions put pressure on wage structures. As well, these changed
labour market conditions also caused an increase in the rate of employee turnover and diminished
the pool of workers with post-secondary qualifications available to the sector.
Quite simply, by 2008, the exchange rate conditions and labour market conditions that had prevailed
when the contact centre sector took shape had changed fundamentally. Human resource strategies
and business strategies that were predicated on a Canadian dollar in the $.65 to $.75 range and large
pools of job-seekers were no longer as viable in 2008 as they had been previously.
During the period 2006 to 2008, employment growth in the contact centre sector clearly slowed as
the factors which drove earlier growth either weakened or went into reverse. The growth of self-
serve technologies – notably the web – provided companies with a highly attractive alternative to
contact centres for certain types of transactions. Overall, employment in the sector appears to
have increased by around 2-3% per year.
By 2008 employment in contact centres was approximately 3% of total employment, i.e. around
514,000 persons.11
11 The labour force share estimate is consistent with previous studies and is also the estimate proposed by
Batt et al for both the United States and Canada.
Contact Centre Canada
Page No. 20
2009: Recession
In September of 2008, Canada was drawn into the global economic downturn. Interviews with
industry leaders suggest that there were comparatively few lay-offs in contact centres. However,
overall employment did decline as a result of some contact centres being closed and a reduction in
hiring rates in many private sector contact centres. Data from Statistics Canada indicate that
employment in business support services (which includes outsourced contact centres) was
particularly affected by the economic downturn.12 Overall, it is estimated that employment in the
contact centre sector declined by around 5% in 2009 in comparison with 2008.
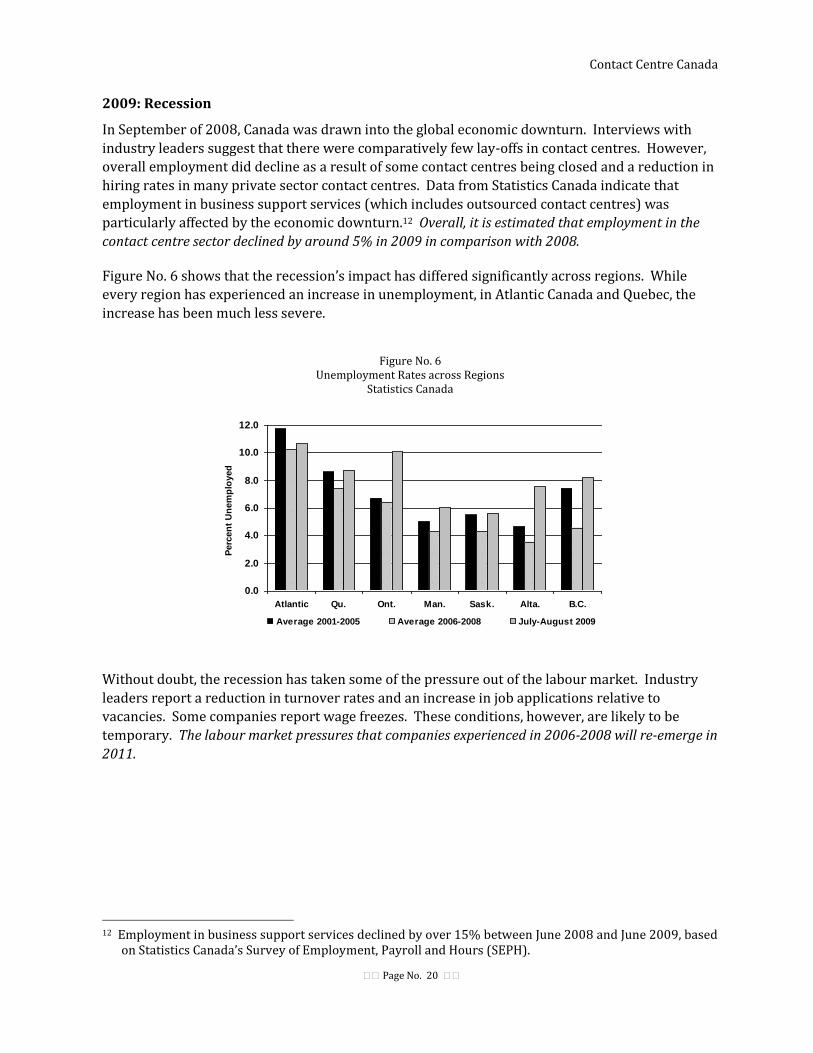
Figure No. 6 shows that the recession’s impact has differed significantly across regions. While
every region has experienced an increase in unemployment, in Atlantic Canada and Quebec, the
increase has been much less severe.
Figure No. 6 Unemployment Rates across Regions
Statistics Canada
0.0
2.0
4.0
6.0
8.0
10.0
12.0
Atlantic Qu. Ont. Man. Sask. Alta. B.C.
Perc
en
t U
nem
plo
yed
Average 2001-2005 Average 2006-2008 July-August 2009
Without doubt, the recession has taken some of the pressure out of the labour market. Industry
leaders report a reduction in turnover rates and an increase in job applications relative to
vacancies. Some companies report wage freezes. These conditions, however, are likely to be
temporary. The labour market pressures that companies experienced in 2006-2008 will re-emerge in
2011.
12 Employment in business support services declined by over 15% between June 2008 and June 2009, based
on Statistics Canada’s Survey of Employment, Payroll and Hours (SEPH).

Contact Centre Canada
Page No. 21
Canadian Dollar:
Figure No. 7 shows that in the immediate aftermath of the downturn, the Canadian dollar fell to
under US$0.80. This, however, was a temporary condition. By the spring of 2009, the Canadian
dollar had recovered most of the ground it had lost in the previous autumn. Since early summer
the Canadian dollar has generally been above the $0.88 which the KPMG location cost model
identifies as establishing approximate cost parity between Canadian and U.S. contact centres. The
recession has not, therefore, changed the cost picture vis à vis the United States that emerged after
2006.
Figure No. 7 Canadian Dollar in US Funds – Daily Rate, January 2, 2008 to September 19, 2009
Bank of Canada
$0.700
$0.750
$0.800
$0.850
$0.900
$0.950
$1.000
$1.050
$1.100
02-J
an-0
8
06-F
eb-0
8
12-M
ar-0
8
17-A
pr-08
23-M
ay-0
8
27-J
un-08
05-A
ug-08
10-S
ep-0
8
16-O
ct-0
8
21-N
ov-08
30-D
ec-0
8
04-F
eb-0
9
11-M
ar-0
9
16-A
pr-09
22-M
ay-0
9
26-J
un-09
04-A
ug-09
09-S
ep-0
9
Can
ad
ian
Do
llar
in U
S$
KPMG, Competitive Alternatives
Location Cost Model
Canadian and US Costs are
essentially equal at $0.88
It would be a serious error to anticipate that the post-recession environment will restore conditions
to where they were in 2008. In fact, the recession is likely to intensify some of the restructuring
pressures that were evident prior to the economic downturn.
The next chapter will present a more detailed demographic and employment profile of the contact
centre sector.
Contact Centre Canada
Page No. 22
3. Demographic and Employment Profile
Age and Gender Profile
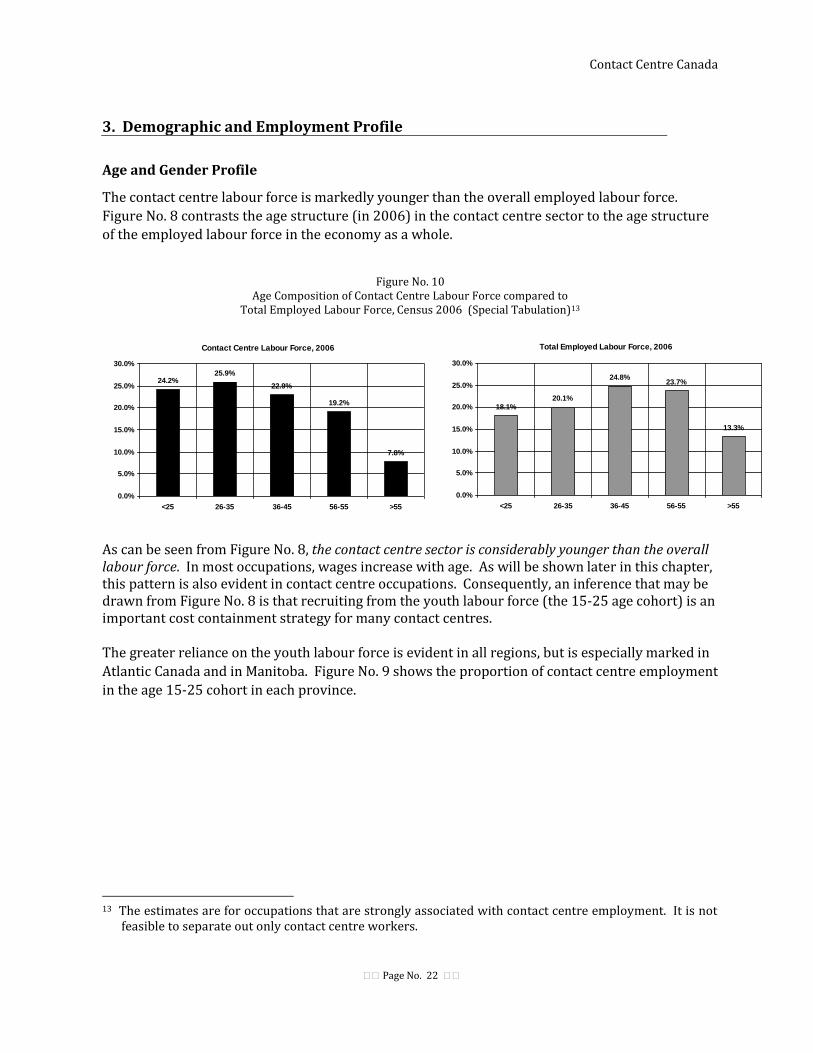
The contact centre labour force is markedly younger than the overall employed labour force.
Figure No. 8 contrasts the age structure (in 2006) in the contact centre sector to the age structure
of the employed labour force in the economy as a whole.
Figure No. 10 Age Composition of Contact Centre Labour Force compared to
Total Employed Labour Force, Census 2006 (Special Tabulation)13
As can be seen from Figure No. 8, the contact centre sector is considerably younger than the overall labour force. In most occupations, wages increase with age. As will be shown later in this chapter, this pattern is also evident in contact centre occupations. Consequently, an inference that may be drawn from Figure No. 8 is that recruiting from the youth labour force (the 15-25 age cohort) is an important cost containment strategy for many contact centres.
The greater reliance on the youth labour force is evident in all regions, but is especially marked in
Atlantic Canada and in Manitoba. Figure No. 9 shows the proportion of contact centre employment
in the age 15-25 cohort in each province.
13 The estimates are for occupations that are strongly associated with contact centre employment. It is not
feasible to separate out only contact centre workers.
Contact Centre Labour Force, 2006
24.2%25.9%
22.9%
19.2%
7.8%
0.0%
5.0%
10.0%
15.0%
20.0%
25.0%
30.0%
<25 26-35 36-45 56-55 >55
Total Employed Labour Force, 2006
18.1%
20.1%
24.8%23.7%
13.3%
0.0%
5.0%
10.0%
15.0%
20.0%
25.0%
30.0%
<25 26-35 36-45 56-55 >55

Contact Centre Canada
Page No. 23
Figure No. 9 Percent of Contact Center Employment in the Age Group 15-25
Statistics Canada, Census 2006 (Special Tabulation)
Percent of Contact Centre Employment Age 15-25
26.1%
34.9%
30.4%28.1% 29.1%
21.1%
24.8%
30.5%
25.9% 26.2%23.8%
0%
5%
10%
15%
20%
25%
30%
35%
40%
NF
PEI
NS
NB
Atla
ntic QB
ON
MB SK A
BBC
Preserving cost competitiveness by drawing heavily on the youth labour force will be an increasingly
difficult strategy to sustain. On a national basis, the size of the age 15-25 cohort peaks in 2010-
2011. In Atlantic Canada, the demographic peak has already been reached. Over the next ten
years, the impact of this demographic trend will accumulate. By 2019, the significance of
demographic pressures will be evident in all regions.
The contact centre sector is also predominantly female, except in user support occupations, which
are predominantly male. Figure No. 10 shows the female share in seven occupations that are
strongly associated with contact centre working environments. Although all but one of these
occupations are predominantly female, it is noteworthy, however, that the largest – ‘Customer
service, information and related clerks’– is one-third male.

Contact Centre Canada
Page No. 24
Figure No. 10 Female Share of Occupations strongly associated with Contact Center Employment
Statistics Canada, Census 2006 (Special Tabulation)
27%
48%
64%
66%
67%
76%
84%
0% 10% 20% 30% 40% 50% 60% 70% 80% 90%
C182 User support technicians
B575 Dispatchers and radio operators
B554 Survey interviewers and
statistical clerks
B553 Customer service, information
and related clerks
G713 Airline sales and service agents
B524 Telephone operators
B533 Customer service
representatives - Financial services
Educational Attainment
‘Customer service, information and related clerks’ account for just under half of estimated
employment in the contact centre sector. In 2006, Census data indicate that 8.5% of workers in
this occupation had not completed high school, while 38.8% had a high school completion
certificate (or equivalent), but no further educational certifications.
Between 2001 and 2006, the proportion of persons working as ‘Customer service, information and
related clerks’ with low educational attainment increased from 32.3% to 47,3%. Figure No. 11
shows this comparison.
Figure No. 11 Proportion of Persons employed as ‘Customer Service, Information and Related Clerks’ (B553)
whose Highest Educational Attainment was High School or Less Statistics Canada, Census 2001 and Census 2006
2001 2006
Less than high school graduation certificate 13.2% 8.5%
High school graduation certificate only 19.0% 38.8%
Total: Low Educational Attainment 32.3% 47.3%
The marked change in the pattern of educational attainment between 2001 and 2006 is the result
of two factors. On the one hand, labour market conditions improved in most regions. This
improvement was especially evident in Atlantic Canada. On the other hand, competitive
conditions also intensified as a result of the growth of off-shore alternatives, the expansion of the
outsourcing sector, and the appreciation of the Canadian dollar. The intensification of competitive
conditions limited the sector’s capacity to raise wages. As a result, many contact centre workers

Contact Centre Canada
Page No. 25
with post-secondary qualifications took advantage of the improved labour market conditions to
seek employment in other sectors. At the same time, the pool of workers with post-secondary
qualifications available to the contact centre sector declined.
The 2006 Census shows that there were regional differences in the educational profile of the
contact centre work force. Figure No. 12 illustrates these differences.
Figure No. 12 Proportion of Persons employed as ‘Customer Service, Information and Related Clerks’
(B553) with Low Educational Attainment Statistics Canada, Census 2006
0%
5%
10%
15%
20%
25%
30%
35%
40%
45%
50%
55%
60%
65%
NF PEI NS NB QB ON MB SK AB BC
High School Completion
only
Less than High School
Completion
Regional Distribution of Employment
Figure No 13 shows the estimated regional distribution of contact centre employment and
compares this distribution to total employment on an all-industries basis. In relation to overall
employment, contact centre employment is somewhat higher in Atlantic Canada and Ontario and
somewhat lower in B.C., Alberta and Quebec. In general, however, the regional distribution of
contact centre employment approximates the regional distribution of employment on an all-
industries basis.

Contact Centre Canada
Page No. 26
Figure No. 13 Regional Distribution of Contact Centre Employment
based on Occupations strongly associated with Contact Centre Employment compared to Regional Distribution of Total Employment on an All-Industries Basis
Statistics Canada, Census 2006
Total Employment
(All Industries)
Contact Centre Employment
Newfoundland and Labrador 1.3% 1.5%
P.E.I. 0.4% 0.5%
Nova Scotia 2.7% 3.9%
New Brunswick 2.2% 3.8%
Atlantic Region Sub-total 6.6% 9.7%
Quebec 23.4% 21.3%
Ontario 38.6% 41.6%
Manitoba 3.6% 3.9%
Saskatchewan 3.1% 2.7%
Alberta 11.6% 9.4%
B.C. 13.1% 11.4%
100.0% 100.0%
Figure No. 14 shows that between 2001 and 2006, Atlantic Canada’s share of contact centre
employment increased from 6.6% to 9.7%. This is consistent with the view that a number of
employers in the sector were attracted to Atlantic Canada by the lower wages that generally
prevailed in the region and by the payroll tax rebates that were a common development strategy.
On the other hand, it is also noteworthy that Ontario’s share of contact centre employment also
increased.
Figure No. 14 Regional Distribution of Contact Centre Employment based on Occupations strongly
associated with Contact Centre Employment 2001 and 2006 Statistics Canada, Census 2001 and Census 2006
2001
2006
Newfoundland 1.2% 1.5%
PEI 0.5% 0.5%
Nova Scotia 3.2% 3.9%
New Brunswick 3.5% 3.8%
Atlantic Region Sub-total 8.4% 9.7%
Quebec 23.6% 21.3%
Ontario 39.9% 41.6%
Manitoba 4.1% 3.9%
Saskatchewan 2.6% 2.7%
Alberta 9.2% 9.4%
BC 12.2% 11.4%
100.0% 100.0%

Contact Centre Canada
Page No. 27
The comparison of employment shares at the provincial level suggests that location advantages
may not reside in provinces per se, but in communities. The employment change in ‘Customer
service, information and related clerks’ in Nova Scotia illustrates this point. Between 2001 and
2006, the number of ‘Customer service, information and related clerks’ in Nova Scotia increased by
85%. However, 70% of this growth occurred outside Halifax, that is to say in smaller population
centres. In smaller population centres in Nova Scotia, employment in contact centres (using
‘Customer service, information and related clerks’ as a proxy) almost tripled. A similar, though
less marked, pattern was evident in British Columbia. Employment of ‘Customer service,
information and related clerks’ increased by 28% between 2001 and 2006 in British Columbia.
However, 61% of this increase occurred outside Vancouver, even though communities outside
Vancouver accounted for only 47% of the province’s overall employment in 2006.
The KPMG Competitive Alternatives cost model suggests that. in Nova Scotia, wage costs in contact
centres are 6-8% lower outside of Halifax. Similar wage savings can be realized in British
Columbia by locating outside of Vancouver. In addition to these lower wage costs, turnover rates
are also often lower in smaller communities, thereby affording an additional savings on overall
labour costs.
There are two strategic difficulties that arise from relying on smaller population centres. The first
is that these centres often have a higher proportion of workers who have low educational
attainment. And second, most smaller population centres have below average rates of population
growth. Indeed, some smaller population centres have stagnant or declining populations.
Consequently, there is a limit to the capacity of the contact centre sector to draw on labour pools
from small population centres. Previous studies have noted saturation problems in some
communities.
Industry Distribution of Employment
Figure No. 15 shows the changes in employment by industry. Three trends strand out. The first is
that the most important change in the industry shares of contact centre employment is the
significant increase in ‘Administrative and Support Services’ (NAICS 56). This industry code
includes outsourcers. The decline in the employment shares of most other industries is largely
explained by companies in those industries opting for an outsource solution or an off-shore
solution to meet their customer service requirements. Between 2001 and 2006, Census data
suggest that outsourcers accounted for almost 80% of employment growth in the contact centre
sector.

Contact Centre Canada
Page No. 28
Figure No. 15 Industry Distribution of Contact Centre Employment based on Occupations strongly
associated with Contact Centre Employment 2001 and 2006 Statistics Canada, Census 2001 and Census 2006
2001 2006
22 Utilities 1.8% 1.3%
31-33 Manufacturing 6.5% 5.3%
41 Wholesale Trade 6.5% 6.8%
44-46 Retail Trade 8.1% 5.9%
48-49 Transportation and Warehousing 7.7% 4.6%
51 Information and Cultural Industries 11.0% 9.2%
52 Finance and Insurance14 30.5% 26.8%
56 Administrative and Support Services 6.4% 16.1%
61 Educational Services 1.2% 1.4%
62 Health Care and Social Assistance 1.0% 1.4%
91 Public Administration 8.4% 8.0%
Other Industries 10.9% 13.2%
All Industries 100.0% 100.0%
The second important trend is that in-house contact centres appear to account for around four-fifths
of contact centre jobs. Although the outsourcing sector has expanded rapidly, and accounted for
the lion’s share of employment growth in the past several years, the overwhelming majority of
contact centre workers are still employed by in-house operations.
And finally, the third trend that is evident in Figure No. 15 is the that three industries – finance and
insurance (NAICS 52), the public sector (which is NAICS 61, 62 and 91), and information and
cultural industries (NAICS 51, which includes wireless telecom) account for almost half of
employment in the contact centre sector and more than half of in-house contact centre
employment.
14 These data over-estimate the share of the finance and insurance industry. Census data do not distinguish
between customer service representatives who work in bank branches from those who are employed in contact centres.

Contact Centre Canada
Page No. 29
Earnings
Earnings across Occupations:
Many observers associate contact centres with low wage employment. And indeed, it is the case
that the average full year / full-time earnings for all of the major occupations associated with
contact centres are below the national average. However, when median earnings are compared
the picture changes. The ‘median’ is the statistical observation that divides the top half of a data set
from the bottom half. Unlike the average (or ‘mean’), the median is not influenced by outliers.
Although the average is the more commonly cited statistic, the mean is often a better indication of
‘central tendency’. When median earnings are compared, some occupations exceed the ‘all
occupations’ benchmark. More importantly, the difference between the earnings of contact centre
occupations and the earnings of the ‘all occupations’ benchmark narrows considerably when the
medians are compared. The picture that emerges from a comparison of median earnings is that
contact centre jobs are more often paid below the ‘all occupations’ benchmark, but they are not paid
dramatically less than the ‘all occupations’ benchmark. Figure No. 16 shows the comparisons.
Figure No. 16 Average and Mean Earnings of Full-Year / Full-Time Employees, 2006
Statistics Canada, Census 2006
Full-Year / Full-time
Earnings Index
(All Occupations = 100)
Average Median Average Median
All Occupations $51,221 $41,401 100.0 100.0
B524 Telephone operators $28,937 $26,902 56.5 65.0
B533 Customer service representatives - Financial services $32,639 $30,518 63.7 73.7
B553 Customer service, information and related clerks $35,263 $33,336 68.8 80.5
B554 Survey interviewers and statistical clerks $41,841 $33,319 81.7 80.5
C182 User support technicians $46,697 $42,300 91.2 102.2
G713 Airline sales and service agents $40,563 $43,294 79.2 104.6
Figure No. 16 also shows that there are significant differences across occupations. ‘User support
technicians’ earn a quarter to a third more than ‘Customer service, information and related clerks’.
‘Survey interviewers and statistical clerks’ command a wage premium over ‘Customer service,
information and related clerks’ when averages are compared, though this premium vanishes when
medians are compared. ‘Airline sales and service agents’ earn a considerable wage premium.
Various factors may account for this wage premium, including, the influence of unions and
traditionally higher wages in this industry. In many cases, the value of transactions in the airline
industry or the value of particular customers will justify paying a wage premium to ensure a
higher calibre of customer service.

Contact Centre Canada
Page No. 30
Earnings across Industries:
Figure No. 17-A shows that there are significant differences in earnings across industries. The
comparison in Figure No. 17-A is based on a special tabulation from the 2006 Census. The
estimates reflect both full-time and part-time employment and cannot be compared with the data
in Figure No. 16 which apply only to full-time employees.
Figure No. 17-A Average Earnings of Contact Centre Employees by Industry, 2006
based on Occupations strongly associated with Contact Centre Employment Statistics Canada, Census 2006 (special tabulation)
$17,100
$25,425
$25,991
$29,645
$33,343
$34,382
$35,835
$36,636
$38,701
$47,076
$- $10,000 $20,000 $30,000 $40,000 $50,000
Business Services
Retail
Banking
All Industries
Telecom
Transportation
Insurance
Wholesale Trade
Manufacturing
Utilities
In addition to showing the dispersion of average earnings across industries, Figure No. 17-A also
shows the markedly lower earnings that prevail in outsourcing sector (which is included in
Business Services). This reflects a number of factors, including the greater reliance on part-time
employees, low rates of unionization, the greater likelihood of being located in a smaller
community, and the concentration of the outsourcing industry on low-to-middle value
transactions and customers.
Age Structure of Earnings:
It was noted earlier that the contact centre work force tends to be younger than the work force as
a whole. Within the contact centre sector there is a marked relationship between earnings and
age. Figure No. 17-B shows this relationship. As can be seen, workers in the age group 25-29 earn
approximately 18% less than workers who are ten years older. Moreover, it should be borne in
mind that this comparison is to workers whom the Census identified as being in the same
occupation, that is to say, supervisors are not included.

Contact Centre Canada
Page No. 31
Figure No. 17-B Average Earnings of ‘Customer Service Information and Related Clerks’ (B553), by Age Group, 2006
Statistics Canada, Census 2006
$29,262
$33,162$35,823
$37,989 $38,907 $39,633
$0
$5,000
$10,000
$15,000
$20,000
$25,000
$30,000
$35,000
$40,000
$45,000
25-29 30-34 35-39 40-44 45-49 50-54
Age Group
Job Structure
Based on industry interviews, a review of the scholarly and trade literature, and Census data, there
appear to be three tiers of contact centre jobs. These tiers are described in Figure No. 18.
Figure No. 18 Employment Tiers
Tier Description Characteristics Estimated Share of Employment15
Tier I – Advanced: complex, often technical inquiries high value customers and/or high
value transactions (e.g., investment and travel products)
b2b customers
low sensitivity to location costs quality of labour pool is key location determinant low vulnerability to outsourcing strong preference for full-time, permanent over
part-time, temporary worker Tier I wages are 60%-100% (or more) above
Tier III (entry level), depending on industry
20%
Tier II - Intermediate: provide more complex information moderate opportunities for up-selling
or cross-selling moderate value customers
moderate sensitivity to location costs moderate to low vulnerability to offshoring and
self-serve technologies wages tend to be 20-40% above Tier III
40-50%
Tier III – Entry Level: entry-level provide non-complex information script-based order-taking tele-marketing most market-research
high sensitivity to location costs vulnerable to offshoring and self-serve
technologies low wages vulnerable to significant increase in turnover
when labour market tightens
30-40%
15
Employment share estimates are based on Census estimates of employment by industry and average annual
earnings. Batt et al., op cit. estimate that about 80% of contact centre workers serve mass markets, while around
20% service premium markets or business-to-business markets.
Contact Centre Canada
Page No. 32
Employment conditions differ significantly across the three tiers. As well, vulnerability to
outsourcing, offshoring and displacement by self-serve technologies is also markedly different
across the three tiers. Chapter Five will incorporate this three-tier model into the employment
outlook for the sector.
Business Models
Companies have a range of options in how they will organize their contact centre work and whom
they will recruit to perform that work. Among the choices that are open to companies are:
whether to outsource their contact centre work, and if so, what types
of work to outsource,
whether to offshore their contact centre work (either directly or
through an outsourcers’ services) and, if so, what types of work to
send offshore,
recruitment standards, in particular, experience and educational
requirements,
where to locate the contact centre and, by implication, whether the
contact centre will be integrated into their other business operations,
such that there are career ladders from the contact centre into the
other business operations,
what remuneration standards to adopt,
the nature and types of training that should be provided to contact
centre employees, including training that enables contact centre
employees to move into other parts of a business’ operations,
the degree to which contact centre jobs should be segmented based
on skill requirements.
How companies address these issues largely determines the quality of the jobs associated with
contact centre work. A key factor in determining how companies will address their human
resources management options is their view of their contact centre’s primary relationship to their
business objectives. Figure No. 19 presents a simplified continuum which is defined by two
contrasting views of a contact centre’s primary relationship to the business. These are
respectively: the contact centre is primarily viewed as a cost centre or, alternatively, the contact
centre is primarily viewed as a value-adding centre.

Contact Centre Canada
Page No. 33
Figure No. 19 Primary Relationship of Contact Centre to Business Objectives and
Implications for Human Resources Management Strategy
Figure No. 19 links the three-tier model of employment in contact centres (Figure No. 18) to how a
company positions its contact centre in relation to its overall business objectives. Some companies
situate themselves at the end-points on the continuum. The majority of companies, however,
occupy an intermediate position. Where companies choose to position themselves on this
continuum is a key determinant of their human resource management strategies. Companies that
view their contact centres primarily as value-adding centres are reluctant to rely on outsourcers.
Typically they will restrict their use of outsourcers to dealing with ‘off-hours’ or ‘peak load’
periods. These companies are also likely to have higher experience and educational requirements
for contact centre employment. As well, these companies will have a greater propensity to invest
in employee training. As a consequence of these training investments, these companies will also
have more developed retention strategies, which include career ladders into other parts of the
business’ operations. These companies are also more likely to locate their contact centres in the
same facilities as other parts of their business operations.
By contrast, companies that put more emphasis on the cost centre view of their contact centre
operations will make quite different human resource management choices. Tier II jobs, and some
Tier III jobs are likely to be outsourced and possibly offshored. Contact centre operations will be
located in communities where labour costs are lower. From a human resources perspective, the
contact centre will not be integrated into the other parts of the business. There will be relatively
little employee movement from the contact centre into other parts of the business. Contact centre
jobs will be segmented to economize on requirements for better educated and more experienced
workers. Training will be restricted to job requirements and efforts will be made to reduce
training investments where this is feasible.
All Contact Centre Work Outsourced
90-100% In-House
Only Tier III Centre Work Outsourced
Contact Centre viewed primarily as a
Cost Centre
Tier II and Tier III Centre Work Outsourced
Contact Centre viewed primarily as a
Value-Adding Centre
Contact Centre Canada
Page No. 34
The business strategy view of contact centre operations has a number of implications:
First, some industries are likely to be more disposed to viewing contact centres
as a cost function or a value-added function. Thus, some industries will
tend to gravitate towards the cost centre end of the spectrum, while
others will gravitate towards the value-adding end,
Second, within any industry there will be some measure of diversity in how
contact centres are viewed. Thus, within the same industry, we will find
companies that view their contact centres primarily as cost centres, while
other companies hold a more nuanced view,
Third, the business strategy view of contact centres lead us to expect significant
dispersion in employment conditions, rather than gravitation to a
common mean,
Fourth business strategy with respect to contact centres is not fixed. Companies
can modify their business view of their contact centres in light of new
technology options, market research, changed cost conditions, or changes
in business ownership,
Fifth, public policy and sector initiatives need to take account of the diversity in
business strategies. Sectoral policies and initiatives will be perceived
quite differently, depending on where a company positions itself on the
business strategy continuum.
Conclusion
The demographic and employment profile of the contact centre sector is complex. Business
strategies are important determinants of the human resource management strategies that
companies adopt. The diversity in business strategies implies that there is considerable
‘granularity’ in the contact centre labour market. That is to say, a simplistic attachment to averages
is deceiving. There is considerable dispersion around the observed averages. Changes in economic
conditions can also prompt changes in human resource management strategies. Statistical profiles
provide us with a snapshot of the sector. However, this snapshot is just a moment-in-time
portrait. The evidence clearly shows that the sector has been changing rapidly in response to new
technology options, changes in business thinking about the role of contact centres, and changes in
underlying economic conditions.
The next chapter examines the key technology trends that are affecting the sector.
Contact Centre Canada
Page No. 35
4. Technology Trends
This chapter examines technology trends which are likely to have a significant impact on human
resources in the contact centre sector. Five trends are discussed:
1. Self-serve technologies,
2. Speech analytics,
3. Hosted systems,
4. Home-based or satellite-based agents, and
5. Text Messaging.
This list does not exhaust the technology trends in the contact centre sector. However, based
interviews with industry leaders, these trends are the most likely to have a broad impact human
resources.
Self-Serve Technologies
From a sectoral perspective, by far the most important technology trend in the contact centre is
the diffusion and increased sophistication of self-serve technologies. These technologies enable
organizations to migrate many low-level inquiries (Tier III jobs) to automated systems. Self-serve
technologies include principally web-based services and voice recognition applications. Voice
recognition applications include applications which require callers to select from options using
their dial-pad and more sophisticated applications which are based on speech recognition
software. Among the types of transactions which can be migrated to self-serve technologies are
balance inquiries, address changes and account activations. Web systems can also handle product
and service orders. Figure No. 20 summarizes cost estimates cited by an industry white paper for
the use of various channels to handle a customer inquiry.

Contact Centre Canada
Page No. 36
Figure No. 20 Estimate Cost of Using Various Channels for Customer Service
(Based on BiT Group, White Paper “Web Service Lowers Call Center Costs and Improves Customer Service”, June 2003)
Transaction Channel
Average Service Cost per Transaction
Range
Web Self-Service $0.24 $0.05 to $0.50 depending on complexity of transaction and volume over which fixed costs can be amortized
Interactive Voice Recognition (IVR)
$0.45 $.10 to $1.00 depending on complexity and volume
Email $3.00 $2.50 to >$4.00 depending on complexity and degree to which responses can be automated
Text Chat $7.00 Significantly lower if agents can handle multiple chats concurrently. Also depends on duration, complexity and labour costs.
Telephone-based Customer Service Agent
$5.50 $2.00 to $12.00 depending on duration, complexity and labour costs
A market study by Frost and Sullivan estimated that, in five industries, self-serve technologies
accounted for around 35% of total customer inquiries.16 In addition to cost-savings, participants
in the study also cited customer satisfaction with the greater availability of service. Many also
perceived self-service channels to require less time.
The cost-savings that arise from migrating transactions to self-serve technologies are so dramatic
that it should be expected that companies will aggressively expand the use of these technologies to
the point of customer resistance or a degradation of the market information that was otherwise
generated by telephone-based customer service agents. The impact of self-serve technologies will
be principally, though not solely, on Tier III jobs, that is to say on the types of jobs that are also
most vulnerable to outsourcing and offshoring.
16 Frost and Sullivan, Amdocs Customer Experience Research: What’s Really Happening with Self- Service
Contact Centre Canada
Page No. 37
Speech Analytics
Speech analytics applications are automated methods that analyze speech content with a view to
identifying patterns that are useful in assessing customer satisfaction and interpreting market
trends. Among the areas covered by speech analytics applications are:
analysis of topic(s) being discussed through key word identification,
identities of the speaker(s),
gender,
the emotional character of the speech,
occurrence of speech versus silence.
Speech analytics potentially provides contact centres with an additional means to monitor and
optimize agent performance and also to analyze data for marketing purposes.
Speech analytics applications were introduced in 2004. Speech analytics applications provide
timely and automated trend analysis by tracking the customers’ use of certain words and phrases.
This information makes it easy for supervisors and analysts to identify changes in consumer
behaviour and make appropriate marketing or work force management responses.
In 2007, DMG Consulting estimated that fewer than 2% of contact centres were using speech
analytics applications.17 Recent reports in the trade suggest that market penetration is still less
than 10%.18 In the next year or so, the high cost of speech analytics applications will limit their
adoption to large contact centres. Nevertheless, DMG Consulting predicts growth rates of 50-
100% per year for speech analytics applications between 2009 and 2012. If these projections
prove well founded, a significant proportion of contact centres – perhaps as many 20% – will be
using speech analytics applications by 2012.
Speech analytics applications potentially increase the value of a contact centre to those businesses
that already view their contact centres as value-adding operations. The adoption of speech
analytics technology, therefore, may reinforce a company’s commitment to viewing its contact
centres as a value-adding operation. Consequently, speech analytics technology may reduce the
attraction of outsourcing some types of Tier II jobs. Outsourcers, however, may offer a speech
analytics service that meets clients’ requirements, thereby offsetting the in-house advantage.
Hosted Systems
Until recently, direct owning or leasing of technology was the only business option available to an
organization that wished to operate an in-house contact centre. More recently ‘hosted services’
have been made available. A hosted solution entails accessing system management applications
over the internet. These include: automatic call distribution (ACD) applications, automated
dialling applications, interactive voice response (IVR) applications, workforce management
applications, and various service management, quality assurance, analytics, and reporting
17 DMG Consulting, 2008 Speech Analytics Market Report
18 CRM.com, Christopher Musico, “Envision takes a real look at speech’, June 13, 2009
Contact Centre Canada
Page No. 38
applications. With hosted applications callers reach a central contact point at the hosting
company. Their call is then routed to the appropriate contact centre operated by the client.
Hosted solutions replace front-end capital costs with monthly service charges. As well, hosted
solutions also allow clients to scale up or down, as their business conditions require, without
having to acquire additional fixed capacity or alternatively have redundant capacity. The hosting
company also upgrades applications as part of its service, thereby removing the need for
subsequent investments to maintain technical currency.
When capital costs for technology are amortized, technology costs account for approximately 10-
15% of a contact centre’s operating costs. Technology costs are somewhat invariant to the size of
a contact centre. Thus, large contact centres can amortize their technology costs over several
hundred agent positions and over a large volume of agent transactions while small contact centres
must amortize approximately similar costs over a much small agent and transaction base. Large
contact centres may also enjoy more favourable leasing costs. For many small and medium-sized
companies, these scale economies enjoyed by large contact centres added to the incentive to move
from in-house solutions to outsourced solutions. For companies which were contemplating how to
best provide contact centre services, the substantial capital costs of an in-house solution were
undoubtedly a consideration that weighed in favour of turning to an outsourcer. Hosted solutions,
however, alter the economies of scale picture in the contact centre sector. Hosting enables a small
or medium-sized company to operate an in-house contact centre on approximately similar
technology cost terms as are enjoyed by a large outsourcer and to avoid up-front capital costs.
While other factors may still make outsourcing attractive to small and medium-sized
organizations, hosting reduces the importance of technology costs and start-up costs as factors
favouring outsourced solutions.
Home-Based and Satellite-Based Agents
In March 2008, the Canadian Marketing Association noted that the trend toward home-based
agents is growing.19 Datamonitor has identified home-based agents as one of the leading trends to
watch in 2009 and specifically recommends that companies explore the relevance of this model to
their business needs.20 Industry surveys show that approximately half of respondents are
exploring the use of home-based agents. Our interviews with industry leaders found that many
companies are conducting pilot projects to ascertain the viability of this model. Industry white
papers suggest cost-savings of 10-15% from avoided facilities costs, reduced turnover rates, and
productivity improvements of up 10-20%. As noted in a previous Contact Centre Canada study,
the early evidence on home-based agents suggested that they tended to be somewhat older and
somewhat better educated than traditional on-site agents.21
19 Canadian Marketing Association, “Home Based Agents: The Growing Trend in Call Centres across Canada”
March 2008 20 Datamonitor, 2009 Trends to Watch: Contact Center Outsourcing and Services 21 Contact Centre Canada, Customer Contact Centres in Canada: The Impact of Offshoring, Technology and
Regulation on Human Resources (April 2006), and Contact Centres in Canada: The Impact of Current Trends on Human Resources (March 2007). Both studies were prepared by Prism Economics and Analysis.

Contact Centre Canada
Page No. 39
IDC has estimated that by 2010, home-based agents will account for around one quarter of
outsourced customer agents in the U.S. There are no published estimates for Canada, though the
evidence from industry interviews suggests that if recent pilot projects show satisfactory results, a
surge in home-based agents should be expected.
At present, home-based agents represent only a small proportion of total employment, probably
less than 5%. Until there is more evidence from pilot projects, it would be rash to predict the
potential share of contact centre employment that could be home-based. Several factors
contribute to uncertainty. First, there is little information on the actual size of the potential pool of
home-based agents. Second, the remuneration costs for home-based agents are likely to increase
if demand grows at the rate that some observers anticipate. This will alter the cost picture. Third,
low turnover rates, which are a major attraction of the home-based model, are also likely to
increase if home-based agents have more employment opportunities. Again, this would alter the
cost picture. And finally, employer liability for occupational injuries and data security could be a
more serious issue if the home-based model becomes more widespread. A major security breach
involving home-based agents would reduce the model’s traction with large organizations.
Satellite-based agents are a less discussed option in the trade press and industry white papers, but
may prove to be an attractive option. Satellite-based operations allow a small number of agents
(usually fewer than 10) to work from a single location that is linked to a central administration
hub. Satellite-based operations allow greater managerial control of the work process, thereby
reducing the risk of security breaches or occupational injuries in workplaces over which an
employer has no control. At the same time, satellite-based operations also reduce employees’
commuting requirements and provide the social interaction benefits of working in a small
workplace.
The technology to support both home-based agents and satellite-based agents has been available
for approximately three years. The delay in taking advantage of this technology is explained by the
need for organizations to develop and feel comfortable with new organizational and management
models. Early anecdotal evidence suggests that both the home-based agent model and the
satellite-based agent model are viable, if the organizational and managerial requirements are in
place. The next two to three years will determine the degree to which these models can be
sustained when they move beyond the pilot project stage.

Contact Centre Canada
Page No. 40
Text Messaging (SMS)
In some vertical markets, mobile devices have become an important channel for reaching a
contacting centre. This is especially the case in the wireless telecom market and increasingly a
trend of importance in the financial services industry. A mobile device enables a customer to
reach a contact centre by wireless telephone connection, email, text message, or through the web.
Text messaging, in particular, offers significant cost reductions in comparison with voice
interaction. In the U.S., First National Bank reports that text messaging now reaches 80% of its
customer base.22 Text messaging systems lend themselves to a significant degree of automation
for low-level inquiries such as account balances. Text message interaction can also be offshored
without the negative customer feedback that is often associated with offshoring voice-based
interaction.
Survey data suggest that approximately 25% of contact centres are using text messaging, though
this proportion is expected to rise significantly over the next few years. Text messaging capability
is now a standard option in most commercial application suites available to contact centres.
The principal human resources impact of text messaging is to reduce the demand trajectory for
Tier III (entry level) customer service representatives.
Conclusion
Among the many technology trends in the contact centre sector, five trends are most likely to
affect human resources. These are (1) the migration of non-complex, script based interactions to
self-serve technologies, (2) the rapid diffusion of speech analytics applications, (3) the emergence
of hosted applications options for companies considering whether to outsource small contact
centres or operate them on an in-house basis, (4) widespread business interest in the viability of
home-based or satellite-based agents, and the use of text messaging as an alternate channel for
customer interaction These trends are important because their widespread adoption will change
the structure of employment in the contact centre sector. Chapter Five considers the impact of
these technologies on the overall employment outlook for the contact centre sector.
22 “Call Centers say Yes to Clickatell SMS and save Millions”, ContactCenterWorld.com, August 21, 2008
Contact Centre Canada
Page No. 41
5. Post-Recession Outlook
Five drivers will shape the outlook for contact centre employment over the next five years:
1. Diffusion of the contact centre as a business model,
2. Demand for customer service,
3. Near-shoring, i.e., the export of contact centre services to the
United States,
4. Off-shoring of contact centre work, and
5. Technology trends.
Diffusion of the Contact Centre as a Business Model
There are few large organizations that have yet to embrace the contact centre as a business model
for handling customer service. Health and education are the only large sectors where the contact
centre is under-utilized as a business model.
In small and medium business enterprises, there appears to be more scope for diffusion of the
contact centre as a business model. These types of organizations, however, are more likely to be
attracted to outsourced or self-serve solutions.
In most respects the contact centre market is now a mature sector. Further diffusion of the contact
centre business model is unlikely to have a significant impact on employment trends.
Demand for Customer Service
Demand for customer service is met by domestically-based agents and by offshore agents. We do
not have data on the extent to which different industries meet their customer service
requirements by using offshore agents. Figure No. 21 shows the approximate distribution of
demand for domestically-based customer service representatives. These estimates are based on
2006 Census data and a 2006 market study by ContactBabel.23
23 ContactBabel, North American Contact Centres in 2006: The State of the Industry
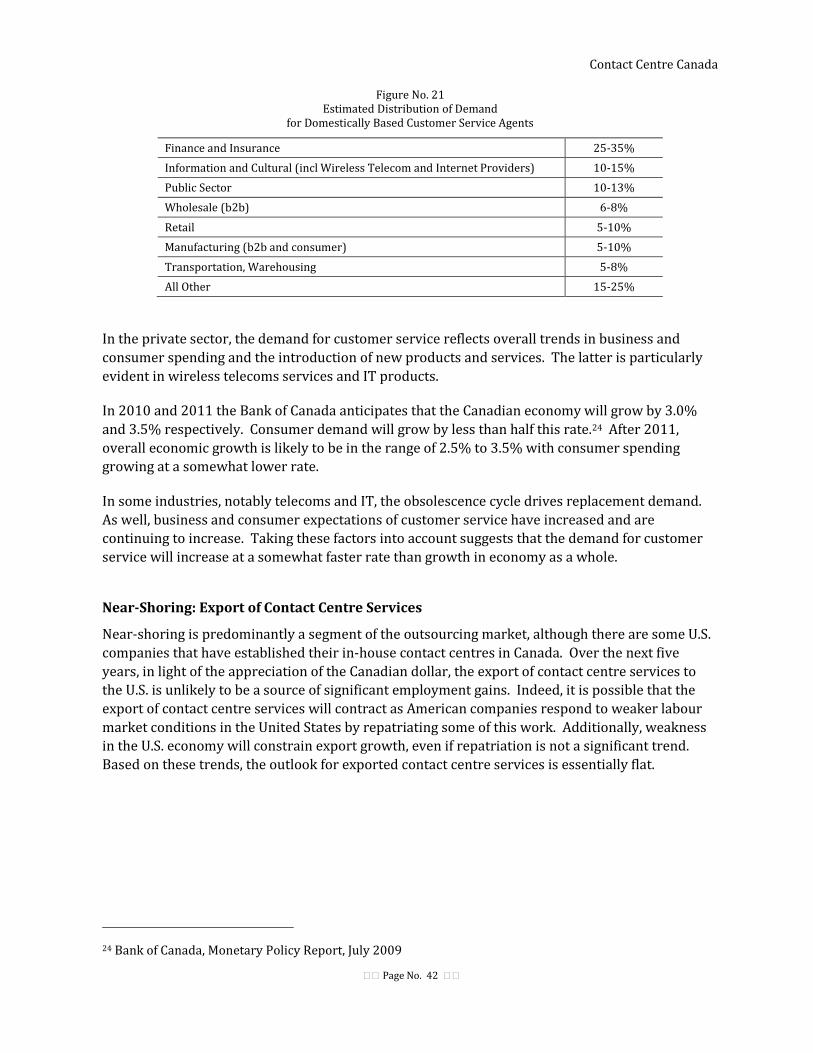
Contact Centre Canada
Page No. 42
Figure No. 21 Estimated Distribution of Demand
for Domestically Based Customer Service Agents
Finance and Insurance 25-35%
Information and Cultural (incl Wireless Telecom and Internet Providers) 10-15%
Public Sector 10-13%
Wholesale (b2b) 6-8%
Retail 5-10%
Manufacturing (b2b and consumer) 5-10%
Transportation, Warehousing 5-8%
All Other 15-25%
In the private sector, the demand for customer service reflects overall trends in business and
consumer spending and the introduction of new products and services. The latter is particularly
evident in wireless telecoms services and IT products.
In 2010 and 2011 the Bank of Canada anticipates that the Canadian economy will grow by 3.0%
and 3.5% respectively. Consumer demand will grow by less than half this rate.24 After 2011,
overall economic growth is likely to be in the range of 2.5% to 3.5% with consumer spending
growing at a somewhat lower rate.
In some industries, notably telecoms and IT, the obsolescence cycle drives replacement demand.
As well, business and consumer expectations of customer service have increased and are
continuing to increase. Taking these factors into account suggests that the demand for customer
service will increase at a somewhat faster rate than growth in economy as a whole.
Near-Shoring: Export of Contact Centre Services
Near-shoring is predominantly a segment of the outsourcing market, although there are some U.S.
companies that have established their in-house contact centres in Canada. Over the next five
years, in light of the appreciation of the Canadian dollar, the export of contact centre services to
the U.S. is unlikely to be a source of significant employment gains. Indeed, it is possible that the
export of contact centre services will contract as American companies respond to weaker labour
market conditions in the United States by repatriating some of this work. Additionally, weakness
in the U.S. economy will constrain export growth, even if repatriation is not a significant trend.
Based on these trends, the outlook for exported contact centre services is essentially flat.
24 Bank of Canada, Monetary Policy Report, July 2009
Contact Centre Canada
Page No. 43
Off-shoring
Most businesses have settled on the mix of off-shore and on-shore services that is appropriate to
their business strategy. It is unlikely that this balance will be significantly re-cast over the next
five years. Nevertheless, the recession will dictate further cost-cutting efforts which, in turn, will
increase the attraction of off-shore providers. A moderate increase in the amount of contact
centre work that is off-shored is plausible.
Technology
From a forecasting perspective, the most important technology trend is the substantial investment
that organizations are making in self-serve channels which reduce the customer’s need to interact
with a customer service representative. The principal self-serve channel is the web, though voice
recognition technologies also play an important role. As noted in the previous chapter,
successfully applied self-serve technologies can reduce the cost of customer interactions by up to
90%, in comparison with a customer service representative. Most industry leaders regard self-
serve technologies as significantly more important that off-shoring in terms of its impact on long-
run human resources requirements. Based on our interviews with industry leaders, it would
appear that most companies are targeting a migration of 10-20% of their contact centre
interactions to self-serve channels.
Other technology trends are also important. Call distribution technologies, knowledge
management systems, and integrated desktops reduce the amount of time that a customer service
representative must spend handling a call. Reduced cycle times translate into increased
productivity and lower overall labour requirements.

Contact Centre Canada
Page No. 44
Employment Outlook
Based on the foregoing discussion, Figure No. 22 sets out employment estimates for the next five
years.
Figure No. 22 Employment Growth Projections
Annual Trend Change in Employment in Contact Centres 2010 to 2014 (Prism Economics and Analysis)
% Change in Employment Requirements per Year
Low Employment Growth Scenario
High Employment Growth Scenario
Diffusion of Contact Centre Model Impact 0.00% 0.25%
General Customer Service Demand Impact 3.00% 4.25%
Export Markets Impact -0.25% 0.00%
Off-shoring Impact -0.25% -0.15%
Technology Impact -2.50% -2.00%
Overall Employment Growth Projection 0.00% 2.35%
Employment Estimate (2008) 514,000
Employment Estimate (2009) 478,000
Low Employment Growth Scenario
High Employment Growth Scenario
Average Annual Employment Growth 2010-2014 nil 11,200
Projected Employment 2014 478,000 534,000
As can be seen from Figure No. 22, over the next five years, employment is expected to be flat in
the low growth scenario, but to increase by 2.35% per year in the high growth scenario.
Differences in the pace of the recovery and the rate of investment in self-serve technologies are the
principal differences between the low growth and high growth scenarios.
The low growth scenario anticipates GDP growth in the range of 2.5% per year (and a consequent
growth in customer service demand of 3.0%) whereas the high growth scenario anticipates GDP
growth of 3.5% (and a growth in customer service demand of 4.25%). In terms of technology
impacts, the low growth scenario foresees fairly rapid investment in self-serve technologies
eliminating about 10-15% of demand for customer service representatives over five years. The
high growth scenario reduces this impact.
Contact centres will continue to account for around 3% of all jobs in the Canadian economy. In
some regions, contact centres will continue to account for a much higher proportion of local
employment. The pattern of change that has been evident for the past three to five years will
continue, namely low value transactions will be migrated to self-serve channels or off-shore
facilities while higher value transactions will continue to be handled through domestic contact
centres.

Contact Centre Canada
Page No. 45
Impact of Growth Outlook on the Structure of Employment in Contact Centres
The overall employment projections set out in Figure No. 22 tell only part of the story. In both the
low growth and high growth scenarios, new jobs will be created, while other jobs will be lost. In
the main, the job loss will be focused on Tier III and, to a lesser degree, on Tier II jobs. These are
the jobs that are most vulnerable to displacement by self-serve technologies, offshoring and the
loss of near-shoring work. Figure No. 23 sets out estimates for employment change in terms of the
three-tier structure described in Chapter Three.
Figure No. 23 Employment Growth Projections by Job Tier
Annual Trend Change in Employment in Contact Centres 2010 to 2014 (Prism Economics and Analysis)
Low High
Growth Rates:
Tier I 3.00% 3.87%
Tier II 0.50% 3.33%
Tier III -2.30% 0.15%
Total 0.00% 2.35%
Employment Change
Tier I 2,900 3,700
Tier II 1,100 7,200
Tier III - 4,000 300
Total nil 11,200
The projections in Figure No. 23 suggest that over the next five years, even in the low growth
scenario, there will be an increase in the number of Tier I and Tier II jobs. By contrast the
employment outlook for Tier III jobs is, at best neutral, with net job loss in this tier being more likely.
Conclusion
The contact centre sector is now a mature sector. The period of rapid employment growth is over.
The next five years will see employment growth somewhere between zero and 2.35% per year. In
the slow growth scenario, the sector will not recover the jobs that were lost in the recession. In
moderate to high growth scenarios, the sector recovers these jobs and also adds jobs. Perhaps of
greater significance than the overall changes in employment is expected change in the composition
of employment. There is likely to be a reduction in the number of Tier III jobs. By contrast, in both
the low growth and high growth scenarios, there will be an increase in Tier I and Tier II jobs.

Contact Centre Canada
Page No. 46
6. Focus on the Financial Services Industry
This study examined several segments of the financial services industry. Specifically, the study
focused on:
chartered banks,
credit unions with permanent offices and/or branch structures,
life and health assurance companies,
payment processors,
and credit card issuers.
Mutual fund companies, investment dealers, collection agencies, and property and casualty
insurers were not covered in the study.
The discussion in this chapter is based on Census data, interviews with 21 contact centre
managers in the financial services industry, and survey returns. A total of 12 companies
participated in the survey. The contact centres represented by these companies employed
approximately 3,600 persons. The surveys were completed in the spring and summer of 2009.
For reasons of confidentiality, only aggregated data are presented.
It should be noted that there are significant data limitations when studying in-house contact
centre operations. These limitations are especially evident in the financial services industry. In
the first place, Census data do not identify occupations based on their work environment. That is
to say, there are no clear-cut Census codes that identify which workers in an occupation are
employed in a contact centre environment and which are employed in branch offices or head
offices. Second, while there are some occupations that are strongly associated with contact centre
working environments, there are many occupations which are not strongly associated with contact
centres, but which are nevertheless represented in the contact centre work force. As a result of
these data limitations, the estimates offered in this chapter should be interpreted as
approximations, rather than precise measures.
Profile of the Financial Services Industry
The financial services industry is a national industry. There are contact centres in the financial
services industry in every region of the country. The segments of the financial services industry
addressed in this study account for approximately 3.3% of employment in Canada. In the contact
centre sector, however, the financial services industry looms much larger. Census and market
study data suggest that the financial services industry may employ as many as 15-17% of persons
working in the contact centre sector, and possibly more.25 As more financial products are migrated
to contact centres for customer service, the share of this industry in the contact centre sector will
increase.
25 Census data which overestimate the financial services industry share (owing to occupational coding
issues) suggest a share of around 20%. ContactBabel, op. cit., suggests a share of 14.7%

Contact Centre Canada
Page No. 47
As noted in the introduction to this chapter, a precise measure of contact centre employment is not
feasible, since Census data do not distinguish between customer service staff who are employed in
bank branches and those who are employed in contact centres.
Figure No. 24 provides a tabulation of the approximate number of companies in the segments of
the financial services industry examined in this study:
Figure No. 24 Approximate Number of Companies in Financial Services
Banks, Credit Unions, Life Assurance Companies, Credit Card Issuers, Payments Processors
Chartered Banks
Schedule I Banks 19
Schedule II Banks 25
Schedule III Banks 20
Life and Health Insurance Companies* 66
Credit Card Companies 12
Payment Processors 15
Credit Unions with permanent ,full-time offices/branches 64
* A number of Life and Health Insurance companies have more than one operating company
The financial services industry provides a range of financial products. In one way or another,
virtually every Canadian household is a customer of the financial services industry. Some financial
products are too complex to be handled through contact centres. However, an important trend has
been the use of contact centres to market ever more complex investment and insurance products.
These include mutual fund investments, GIC investments, mortgages, and various types of
insurance products – all of which can now be transacted through contact centres, and, in some
cases, through the web. As well, most banks offer a telephone banking option to their customers.
Regulatory restrictions limit the ability of some institutions to undertake business in certain types
of products and services. For the major chartered banks, however, the trend over the past two
decades or more has been to enter non-traditional fields. These include property insurance,
mutual funds, leasing, and payments processing. Six of the Schedule I chartered banks own
investment dealers, although regulation ensures that these operations are managed separately
from traditional banking activities. In addition, the major chartered banks also operate discount
brokerages which are premised on low cost service through the web and contact centres. The
Caisses Desjardins (which is regulated as a credit union) also operates an investment dealer
subsidiary and an insurance service, in addition to its retail banking operations.
There are no asset limits on Schedule I banks. Most provide regular, retail banking services
through branches, contact centres, and the web. Two banks (ING Direct and Citizens’ Bank)
provide services only through the web and contact centres.26
26 Citizens’ Bank is a Schedule I bank. ING Direct is a Schedule II bank, and is therefore subject to overall
limits on the scale of its operations in Canada.
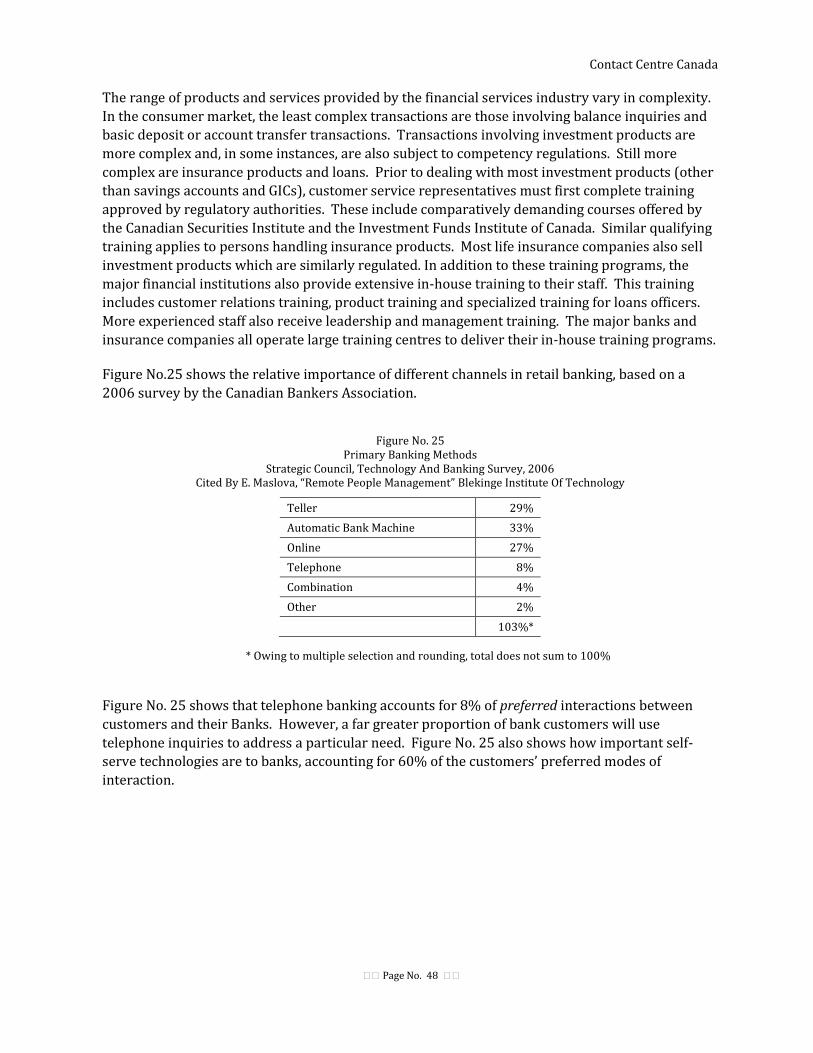
Contact Centre Canada
Page No. 48
The range of products and services provided by the financial services industry vary in complexity.
In the consumer market, the least complex transactions are those involving balance inquiries and
basic deposit or account transfer transactions. Transactions involving investment products are
more complex and, in some instances, are also subject to competency regulations. Still more
complex are insurance products and loans. Prior to dealing with most investment products (other
than savings accounts and GICs), customer service representatives must first complete training
approved by regulatory authorities. These include comparatively demanding courses offered by
the Canadian Securities Institute and the Investment Funds Institute of Canada. Similar qualifying
training applies to persons handling insurance products. Most life insurance companies also sell
investment products which are similarly regulated. In addition to these training programs, the
major financial institutions also provide extensive in-house training to their staff. This training
includes customer relations training, product training and specialized training for loans officers.
More experienced staff also receive leadership and management training. The major banks and
insurance companies all operate large training centres to deliver their in-house training programs.
Figure No.25 shows the relative importance of different channels in retail banking, based on a
2006 survey by the Canadian Bankers Association.
Figure No. 25 Primary Banking Methods
Strategic Council, Technology And Banking Survey, 2006 Cited By E. Maslova, “Remote People Management” Blekinge Institute Of Technology
Teller 29%
Automatic Bank Machine 33%
Online 27%
Telephone 8%
Combination 4%
Other 2%
103%*
* Owing to multiple selection and rounding, total does not sum to 100%
Figure No. 25 shows that telephone banking accounts for 8% of preferred interactions between
customers and their Banks. However, a far greater proportion of bank customers will use
telephone inquiries to address a particular need. Figure No. 25 also shows how important self-
serve technologies are to banks, accounting for 60% of the customers’ preferred modes of
interaction.
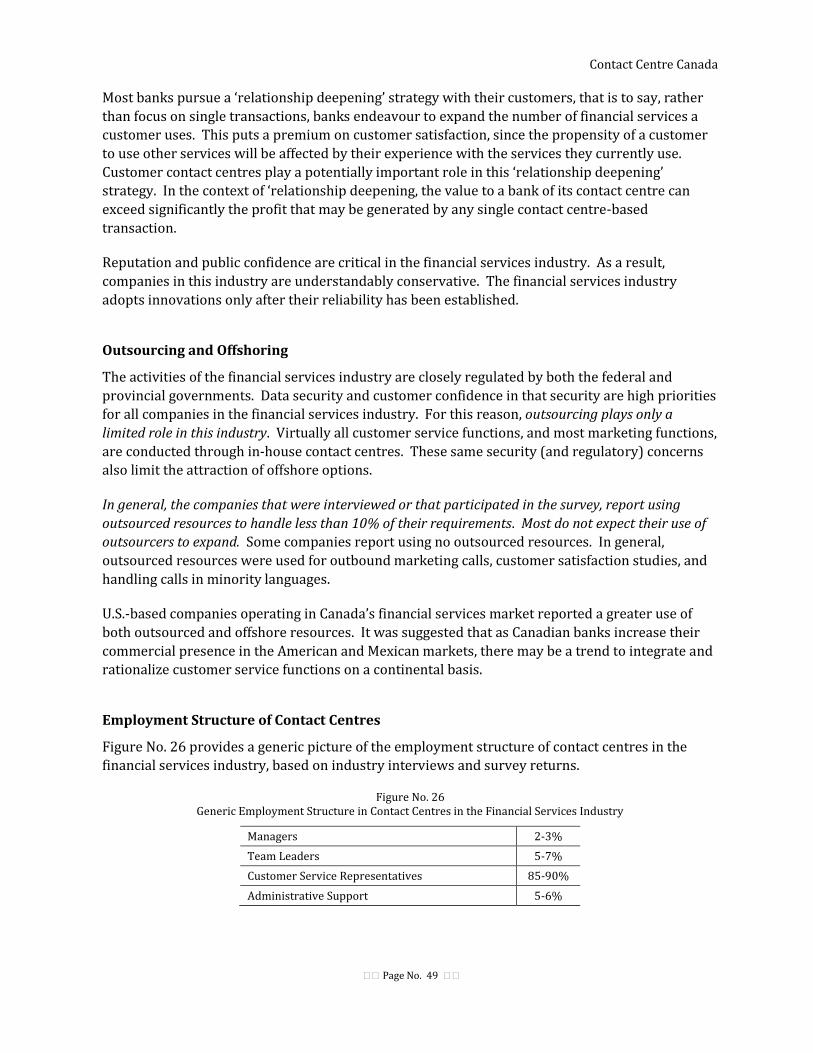
Contact Centre Canada
Page No. 49
Most banks pursue a ‘relationship deepening’ strategy with their customers, that is to say, rather
than focus on single transactions, banks endeavour to expand the number of financial services a
customer uses. This puts a premium on customer satisfaction, since the propensity of a customer
to use other services will be affected by their experience with the services they currently use.
Customer contact centres play a potentially important role in this ‘relationship deepening’
strategy. In the context of ‘relationship deepening, the value to a bank of its contact centre can
exceed significantly the profit that may be generated by any single contact centre-based
transaction.
Reputation and public confidence are critical in the financial services industry. As a result,
companies in this industry are understandably conservative. The financial services industry
adopts innovations only after their reliability has been established.
Outsourcing and Offshoring
The activities of the financial services industry are closely regulated by both the federal and
provincial governments. Data security and customer confidence in that security are high priorities
for all companies in the financial services industry. For this reason, outsourcing plays only a
limited role in this industry. Virtually all customer service functions, and most marketing functions,
are conducted through in-house contact centres. These same security (and regulatory) concerns
also limit the attraction of offshore options.
In general, the companies that were interviewed or that participated in the survey, report using
outsourced resources to handle less than 10% of their requirements. Most do not expect their use of
outsourcers to expand. Some companies report using no outsourced resources. In general,
outsourced resources were used for outbound marketing calls, customer satisfaction studies, and
handling calls in minority languages.
U.S.-based companies operating in Canada’s financial services market reported a greater use of
both outsourced and offshore resources. It was suggested that as Canadian banks increase their
commercial presence in the American and Mexican markets, there may be a trend to integrate and
rationalize customer service functions on a continental basis.
Employment Structure of Contact Centres
Figure No. 26 provides a generic picture of the employment structure of contact centres in the
financial services industry, based on industry interviews and survey returns.
Figure No. 26 Generic Employment Structure in Contact Centres in the Financial Services Industry
Managers 2-3%
Team Leaders 5-7%
Customer Service Representatives 85-90%
Administrative Support 5-6%

Contact Centre Canada
Page No. 50
As can be seen from Figure No. 26, 85-90% of contact centre employees are customer service
representatives. The ratio of team leaders to representatives is about 15:1, although this can
range from a low of 19:1 to a high of 11:1. ‘Administrative support’ encompasses various
specialized roles including: workforce management, quality assurance, facilities management, and
technical support. Many contact centres are also supported by specialized human resources
management staff.
Industry interviews confirm the validity of grouping customer service representatives into three
tiers (See Figure No. 18 in Chapter Three). The proportion of staff in these tiers varies, depending
on the focus of the contact centre. In some contact centres 85% of customer service staff were in
Tier II jobs, with only a 12% in Tier III entry jobs and 3% in the Tier I jobs which deal with
complex inquiries and transactions. In other contact centres the proportions were quite different
with 35% of customer service staff in Tier II and Tier III jobs, and 30% in Tier I jobs.
Survey data do not provide a sufficient sample to formulate overall industry estimates. Based on
industry interviews, however, the following estimates can be made:
Figure No. 27 Estimated Distribution of Customer Service Staff by Tiers
in the Financial Services Industry (Based on Interviews)
Tier Description Percent
III Entry Level 30-40%
II Intermediate Complexity in Transactions and Inquiries 30-50%
I More Complex Transactions and Inquiries 10-20%
Industry interviews suggest that agents handle approximately 90 calls per day, with average call
time ranging from 5 minutes to 15 minutes.
Demographics
Specific demographic data on the financial services industry were obtained from a special Census
tabulation. Based on interviews with senior managers of contact centres in the financial services
industry, the pattern of employing a younger work force generally applies. However, compared to
the contact centre sector as a whole, there are proportionately fewer employees in the financial
services industry age 25 and under and proportionately more in the age group 26-30. As will be
discussed later in this chapter, many companies in the financial services industry are exploring
strategies to change their age demographics in an effort to deal with turnover and retention
challenges.
Census data indicate that contact centre employees in the financial services industry are
predominantly female – approximately 80-85% in banking and 75-80% in insurance.

Contact Centre Canada
Page No. 51
Wage and Salary Trends27
Regional Patterns:
Figure No. 28 compares average annual earnings in contact centre occupations in the financial
services industry with the all industries average.
Figure No.28 Earnings of Contact Centre Employees – National and Provincial Annual Averages
Financial Services Industry compared to All Industry Average, 2006 (Statistics Canada. 2006 Census – Special Tabulation)
All
Industries Financial Services
Financial Services: Above or Below All Industries Average
Canada $29,646 $26,857 below
Newfoundland and Labrador $22,550 $24,386 above
Prince Edward Island $22,300 $25,553 above
Nova Scotia $22,126 $24,157 above
New Brunswick $23,624 $23,882 above
Quebec $29,214 $26,480 below
Ontario $31,275 $28,472 below
Manitoba $26,421 $23,930 below
Saskatchewan $28,276 $25,625 below
Alberta $32,085 $25,043 below
British Columbia $29,599 $26,061 below
As can be seen in Figure No. 28, in the Atlantic region, the financial services industry is generally
about 8-10% above the all industries average. In the rest of the country financial services is below
the national average.
The relationship between the all industries average and the financial services average at the local
level is shown in Figure No. 29 which compares average wages in selected census areas in
ascending order. A trend line has been added to show the relationship more clearly.
27 It should be noted that through the discussion in this section, the average annual earnings is a blend of
part-time and full-time employees.

Contact Centre Canada
Page No. 52
Figure No.29 Earnings of Contact Centre Employees – Census Area Annual Averages in Ascending Order
Financial Services Industry compared to All Industry Average, 2006 (Statistics Canada. 2006 Census – Special Tabulation)
$15,000
$20,000
$25,000
$30,000
$35,000
$40,000
Monct
on
Hal
ifax
Saint
John
Win
nipeg
Reg
ina
Montr
éal
Edmont
on
Vanco
uver
Otta
wa
- Gat
inea
u
Toront
o
Cal
gary
All Industries Average
Financial Services
Linear (Financial
Services)
Figure No. 29 confirms that in regions where the all industries average is below the national
average, the financial service sector tends to pay wages that exceed the all industries average.
Conversely, in regions where the all industries average is greater than the national average, the
opposite pattern holds: the financial services industry pays less than the all industries average.
Moreover, the difference increases as the all industries average rises.
Education Premium:
A well documented trend in the labour market is that annual salary income increases with
education. This is usually termed the ‘education premium’. There are notable differences in the
education premium in contact centres when the all industries average is compared to the financial
services industry. Figure No. 30 shows average annual wage and salary income as a ratio of the
lowest group, namely employees who did not complete high school.
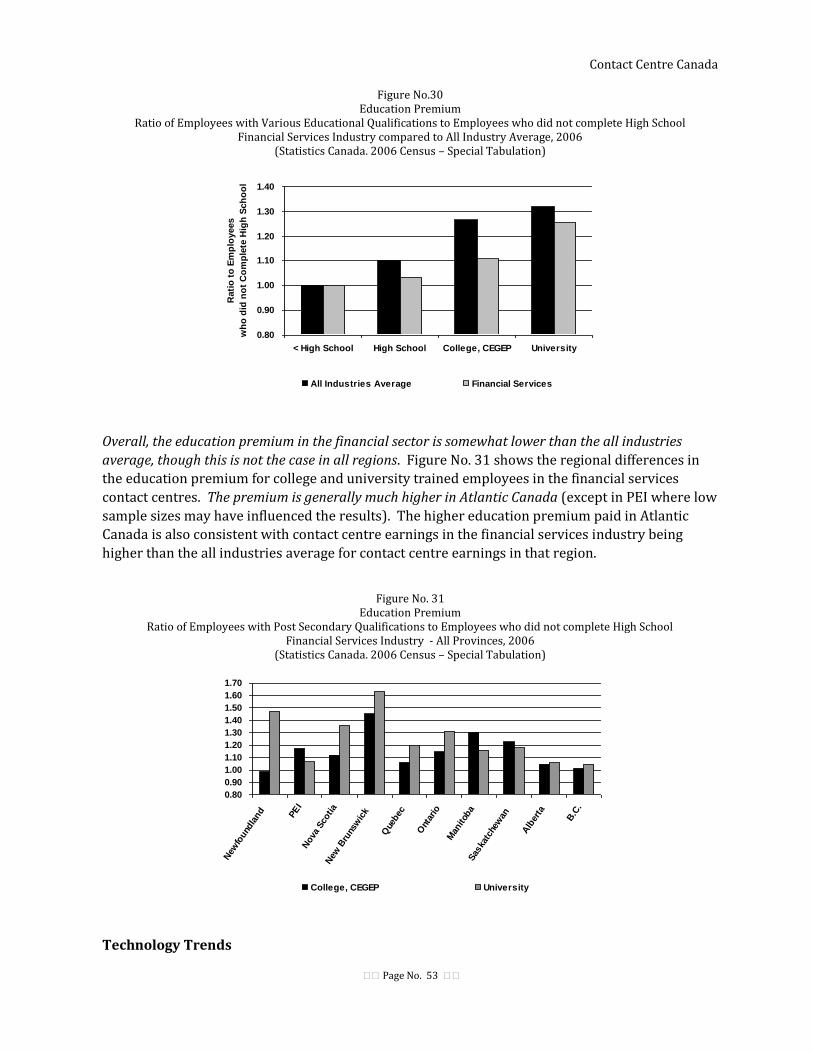
Contact Centre Canada
Page No. 53
Figure No.30 Education Premium
Ratio of Employees with Various Educational Qualifications to Employees who did not complete High School Financial Services Industry compared to All Industry Average, 2006
(Statistics Canada. 2006 Census – Special Tabulation)
0.80
0.90
1.00
1.10
1.20
1.30
1.40
< High School High School College, CEGEP University
Rati
o t
o E
mp
loyees
wh
o d
id n
ot
Co
mp
lete
Hig
h S
ch
oo
l
All Industries Average Financial Services
Overall, the education premium in the financial sector is somewhat lower than the all industries
average, though this is not the case in all regions. Figure No. 31 shows the regional differences in
the education premium for college and university trained employees in the financial services
contact centres. The premium is generally much higher in Atlantic Canada (except in PEI where low
sample sizes may have influenced the results). The higher education premium paid in Atlantic
Canada is also consistent with contact centre earnings in the financial services industry being
higher than the all industries average for contact centre earnings in that region.
Figure No. 31
Education Premium Ratio of Employees with Post Secondary Qualifications to Employees who did not complete High School
Financial Services Industry - All Provinces, 2006 (Statistics Canada. 2006 Census – Special Tabulation)
0.80
0.90
1.00
1.10
1.20
1.30
1.40
1.50
1.60
1.70
New
found
land PE
IN
ova
Sco
tia
New
Bru
nsw
ick
Que
bec
Ont
ario
Man
itob
aSas
katc
hew
an
Alb
erta
B.C
.
College, CEGEP University
Technology Trends
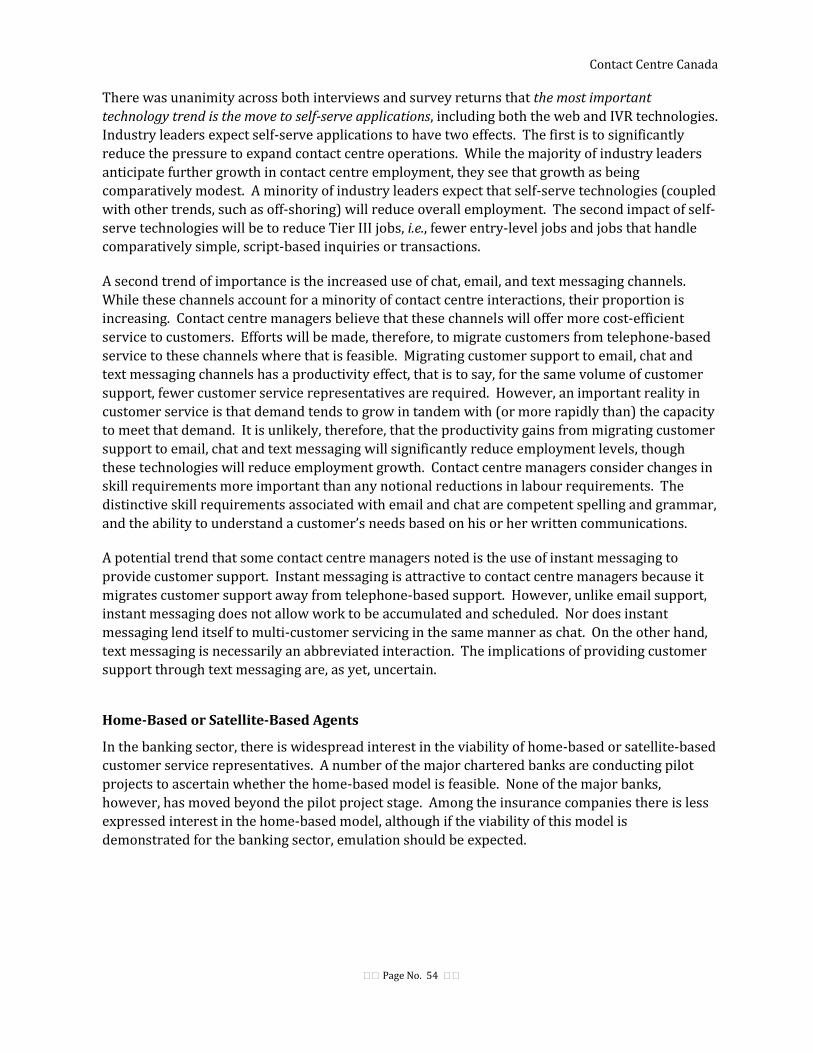
Contact Centre Canada
Page No. 54
There was unanimity across both interviews and survey returns that the most important
technology trend is the move to self-serve applications, including both the web and IVR technologies.
Industry leaders expect self-serve applications to have two effects. The first is to significantly
reduce the pressure to expand contact centre operations. While the majority of industry leaders
anticipate further growth in contact centre employment, they see that growth as being
comparatively modest. A minority of industry leaders expect that self-serve technologies (coupled
with other trends, such as off-shoring) will reduce overall employment. The second impact of self-
serve technologies will be to reduce Tier III jobs, i.e., fewer entry-level jobs and jobs that handle
comparatively simple, script-based inquiries or transactions.
A second trend of importance is the increased use of chat, email, and text messaging channels.
While these channels account for a minority of contact centre interactions, their proportion is
increasing. Contact centre managers believe that these channels will offer more cost-efficient
service to customers. Efforts will be made, therefore, to migrate customers from telephone-based
service to these channels where that is feasible. Migrating customer support to email, chat and
text messaging channels has a productivity effect, that is to say, for the same volume of customer
support, fewer customer service representatives are required. However, an important reality in
customer service is that demand tends to grow in tandem with (or more rapidly than) the capacity
to meet that demand. It is unlikely, therefore, that the productivity gains from migrating customer
support to email, chat and text messaging will significantly reduce employment levels, though
these technologies will reduce employment growth. Contact centre managers consider changes in
skill requirements more important than any notional reductions in labour requirements. The
distinctive skill requirements associated with email and chat are competent spelling and grammar,
and the ability to understand a customer’s needs based on his or her written communications.
A potential trend that some contact centre managers noted is the use of instant messaging to
provide customer support. Instant messaging is attractive to contact centre managers because it
migrates customer support away from telephone-based support. However, unlike email support,
instant messaging does not allow work to be accumulated and scheduled. Nor does instant
messaging lend itself to multi-customer servicing in the same manner as chat. On the other hand,
text messaging is necessarily an abbreviated interaction. The implications of providing customer
support through text messaging are, as yet, uncertain.
Home-Based or Satellite-Based Agents
In the banking sector, there is widespread interest in the viability of home-based or satellite-based
customer service representatives. A number of the major chartered banks are conducting pilot
projects to ascertain whether the home-based model is feasible. None of the major banks,
however, has moved beyond the pilot project stage. Among the insurance companies there is less
expressed interest in the home-based model, although if the viability of this model is
demonstrated for the banking sector, emulation should be expected.
Contact Centre Canada
Page No. 55
Human Resources Challenges
In every interview, the most important human resource challenge identified was the difficulty
retaining qualified staff. For the financial services industry, turnover rates pose two problems. In
the first place, turnover reduces productivity and increases overall human resources costs, in
particular the costs associated with recruitment and training. Since the financial sector, for both
business and regulatory reasons, must invest significant amounts in staff training, the loss of this
investment is particularly significant. And even more so, if the employee should subsequently take
similar work at a competitor.
Perhaps more important that the human resources management costs, turnover can impede the
‘relationship deepening’ strategy that underlies the financial industry’s central business strategy.
High turnover rates increase the risk of customer dissatisfaction from their dealings with a contact
centre. Bartel, for example, has noted how important it is for banks to retain knowledgeable and
experienced customer service staff.28
Comparative evidence suggests that the financial services industry is generally more successful in
controlling turnover than many other segments of the contact centre sector. For example, Batt
reports that U.S. data show that the financial services industry has turnover rates that are
approximately half that of the outsourcing industry and the retail sector. Similar results are
implicit for Canada in the survey findings of van Jaarsveld et al.29 Non-academic surveys, it should
be noted, often come to different conclusions. Benchmark Portal, for example, reports that
outsourcers generally have lower turnover rates than in-house contact centres, including those in
the financial services industry.30
In a case study of one major bank, Maslova shows that the bank employs sophisticated selection
and screening methods to ensure a better congruence between employee aptitudes and
expectations and the realities of contact centre employment.31 An inference to be drawn from
Maslova’s study is that there is comparatively little scope for reducing employee turnover from
further improvements to selection and screening procedures.
Changes to remuneration structures may provide some scope for addressing turnover challenges.
However, it should be borne in mind that, in the Atlantic region, the salaries of contact centres in
the financial industry already put them in a favourable position in comparison with opportunities
available elsewhere in the labour market. Outside the Atlantic region, however, this would not be
the case.
28
Bartel, A.P. (2004). “Human Resource Management and Organizational Performance: Evidence from Retail
Banking.” Industrial and Labor Relations Review, 57(2), 181 – 203.
29 Global Call Centre Project: http://www.ilr.cornell.edu/globalcallcenter/research/
30 www.benchmarkportal.com
31 E. Maslova, “Remote People Management” Blekinge Institute Of Technology
Contact Centre Canada
Page No. 56
Offering more full-time and permanent employment opportunities could enhance the comparative
advantages of employment in a financial industry contact centre in comparison with employment
in contact centres in other industries, notably outsourcers. Various studies have shown that
outsourcers, in particular, rely more heavily on part-time and temporary employees.32 However,
by far the preponderance of contact centre jobs in the financial services industry are already full-
time and permanent. The scope for reducing turnover through this type of restructuring of the
employment relationship is quite limited.
The importance of reducing turnover is prompting contact centre managers to look to two related
strategies. The first is to change significantly the demographic profile of their recruitment. In
particular, the objective is to move up the age ladder. This is sometimes characterized as hiring
more ‘Gen-Xers’ (i.e., age 30-40) and fewer ‘Gen-Yers’ (i.e., age 20-30). Some contact centres are
also exploring the scope for hiring more workers in the 50-60 age group.
For a significant number of executives in the financial services industry, potentially the greatest
opportunity to significantly reduce turnover rates is through adoption of home-based or remote-
based agents. Considerable stock is put in the current pilot projects. There is a widespread hope
that the home-based or satellite-based agents will address both the turnover problem and the
demographic profile without having any significant, adverse impact on operating costs.
Conclusion
The financial services industry is a key example of the importance of in-house contact centres in
the contact centre sector. Approximately 15-17% of persons working in the contact centre sector,
and possibly more, are employed by the financial services industry. For both business and
regulatory reasons, the financial services industry relies heavily on in-house contact centres, as
opposed to outsourced services. Offshoring is uncommon. Most employment (85%+) is full-time
and permanent, with the participation in benefits plans that this implies. The financial services
industry is also noted for its high levels of investment in employee training. In Atlantic Canada,
contact centre salaries exceed the all occupations average. Clearly the business strategies and
human resource management strategies pursued by the financial services industry will have a
significant impact on prevailing norms in the contact centre sector as a whole. Should the financial
services industry embrace home-based or satellite-based agents, the industry’s example will be
emulated by many other industries.
32 Danielle D. van Jaarsvel, et al., “The effects of institutional and organizational characteristics on work
force flexibility”, Industrial and Labor Relations Review, Vol. 62, No. 4 (July 2009)
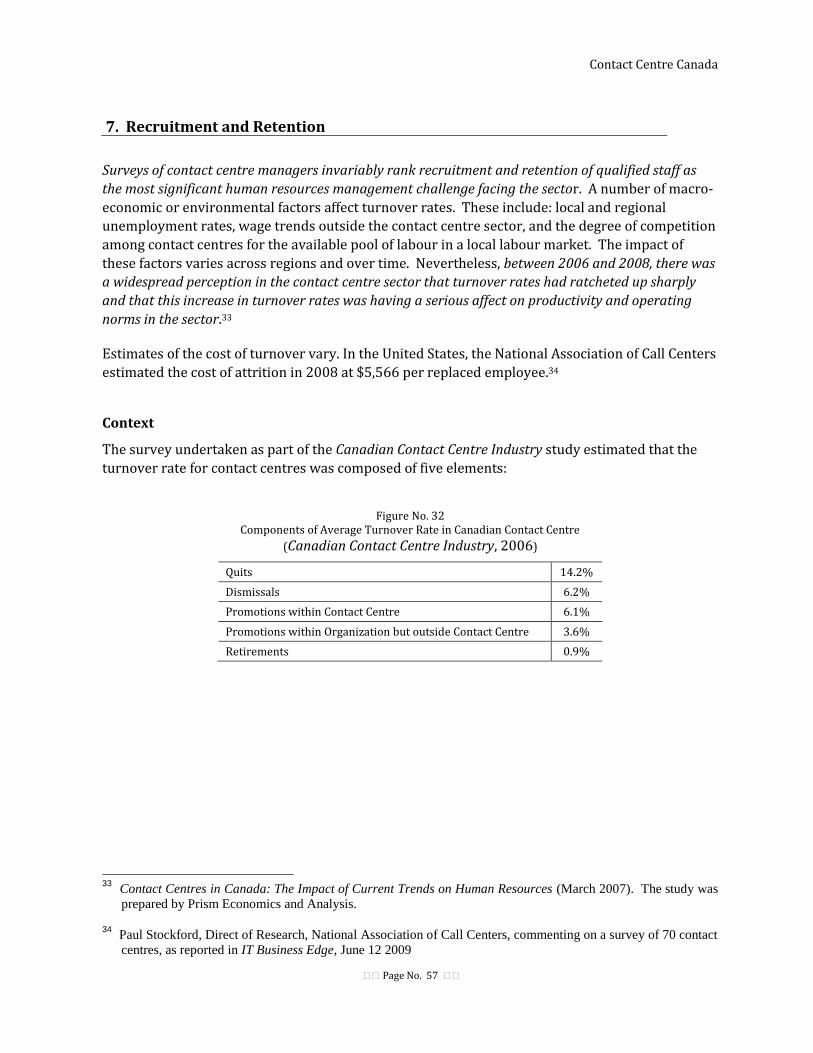
Contact Centre Canada
Page No. 57
7. Recruitment and Retention
Surveys of contact centre managers invariably rank recruitment and retention of qualified staff as
the most significant human resources management challenge facing the sector. A number of macro-
economic or environmental factors affect turnover rates. These include: local and regional
unemployment rates, wage trends outside the contact centre sector, and the degree of competition
among contact centres for the available pool of labour in a local labour market. The impact of
these factors varies across regions and over time. Nevertheless, between 2006 and 2008, there was
a widespread perception in the contact centre sector that turnover rates had ratcheted up sharply
and that this increase in turnover rates was having a serious affect on productivity and operating
norms in the sector.33
Estimates of the cost of turnover vary. In the United States, the National Association of Call Centers
estimated the cost of attrition in 2008 at $5,566 per replaced employee.34
Context
The survey undertaken as part of the Canadian Contact Centre Industry study estimated that the
turnover rate for contact centres was composed of five elements:
Figure No. 32 Components of Average Turnover Rate in Canadian Contact Centre
(Canadian Contact Centre Industry, 2006)
Quits 14.2%
Dismissals 6.2%
Promotions within Contact Centre 6.1%
Promotions within Organization but outside Contact Centre 3.6%
Retirements 0.9%
33
Contact Centres in Canada: The Impact of Current Trends on Human Resources (March 2007). The study was
prepared by Prism Economics and Analysis.
34
Paul Stockford, Direct of Research, National Association of Call Centers, commenting on a survey of 70 contact
centres, as reported in IT Business Edge, June 12 2009
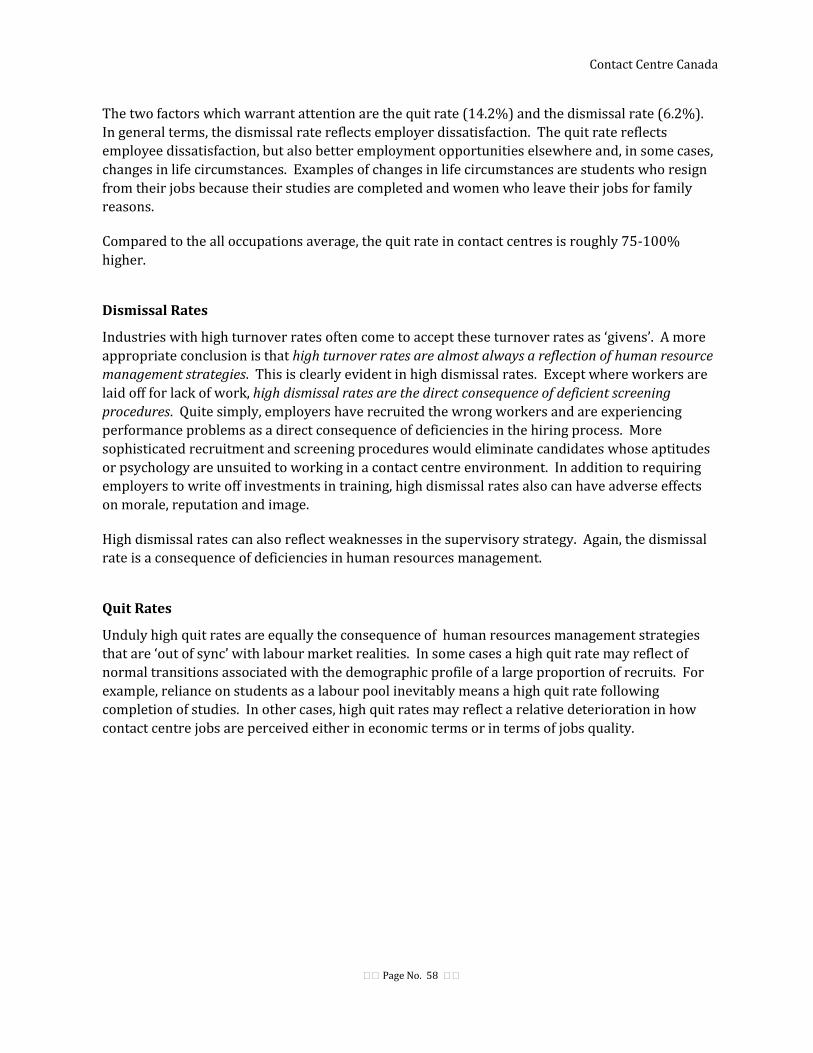
Contact Centre Canada
Page No. 58
The two factors which warrant attention are the quit rate (14.2%) and the dismissal rate (6.2%).
In general terms, the dismissal rate reflects employer dissatisfaction. The quit rate reflects
employee dissatisfaction, but also better employment opportunities elsewhere and, in some cases,
changes in life circumstances. Examples of changes in life circumstances are students who resign
from their jobs because their studies are completed and women who leave their jobs for family
reasons.
Compared to the all occupations average, the quit rate in contact centres is roughly 75-100%
higher.
Dismissal Rates
Industries with high turnover rates often come to accept these turnover rates as ‘givens’. A more
appropriate conclusion is that high turnover rates are almost always a reflection of human resource
management strategies. This is clearly evident in high dismissal rates. Except where workers are
laid off for lack of work, high dismissal rates are the direct consequence of deficient screening
procedures. Quite simply, employers have recruited the wrong workers and are experiencing
performance problems as a direct consequence of deficiencies in the hiring process. More
sophisticated recruitment and screening procedures would eliminate candidates whose aptitudes
or psychology are unsuited to working in a contact centre environment. In addition to requiring
employers to write off investments in training, high dismissal rates also can have adverse effects
on morale, reputation and image.
High dismissal rates can also reflect weaknesses in the supervisory strategy. Again, the dismissal
rate is a consequence of deficiencies in human resources management.
Quit Rates
Unduly high quit rates are equally the consequence of human resources management strategies
that are ‘out of sync’ with labour market realities. In some cases a high quit rate may reflect of
normal transitions associated with the demographic profile of a large proportion of recruits. For
example, reliance on students as a labour pool inevitably means a high quit rate following
completion of studies. In other cases, high quit rates may reflect a relative deterioration in how
contact centre jobs are perceived either in economic terms or in terms of jobs quality.
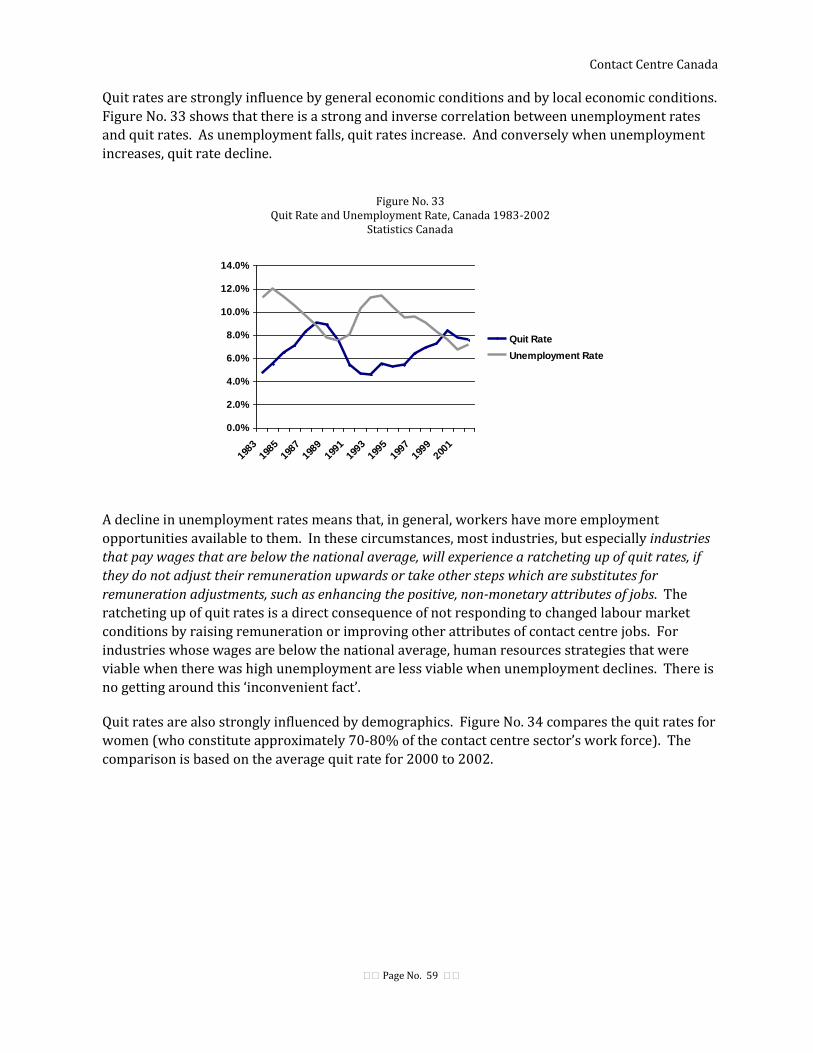
Contact Centre Canada
Page No. 59
Quit rates are strongly influence by general economic conditions and by local economic conditions.
Figure No. 33 shows that there is a strong and inverse correlation between unemployment rates
and quit rates. As unemployment falls, quit rates increase. And conversely when unemployment
increases, quit rate decline.
Figure No. 33 Quit Rate and Unemployment Rate, Canada 1983-2002
Statistics Canada
0.0%
2.0%
4.0%
6.0%
8.0%
10.0%
12.0%
14.0%
1983
1985
1987
1989
1991
1993
1995
1997
1999
2001
Quit Rate
Unemployment Rate
A decline in unemployment rates means that, in general, workers have more employment
opportunities available to them. In these circumstances, most industries, but especially industries
that pay wages that are below the national average, will experience a ratcheting up of quit rates, if
they do not adjust their remuneration upwards or take other steps which are substitutes for
remuneration adjustments, such as enhancing the positive, non-monetary attributes of jobs. The
ratcheting up of quit rates is a direct consequence of not responding to changed labour market
conditions by raising remuneration or improving other attributes of contact centre jobs. For
industries whose wages are below the national average, human resources strategies that were
viable when there was high unemployment are less viable when unemployment declines. There is
no getting around this ‘inconvenient fact’.
Quit rates are also strongly influenced by demographics. Figure No. 34 compares the quit rates for
women (who constitute approximately 70-80% of the contact centre sector’s work force). The
comparison is based on the average quit rate for 2000 to 2002.
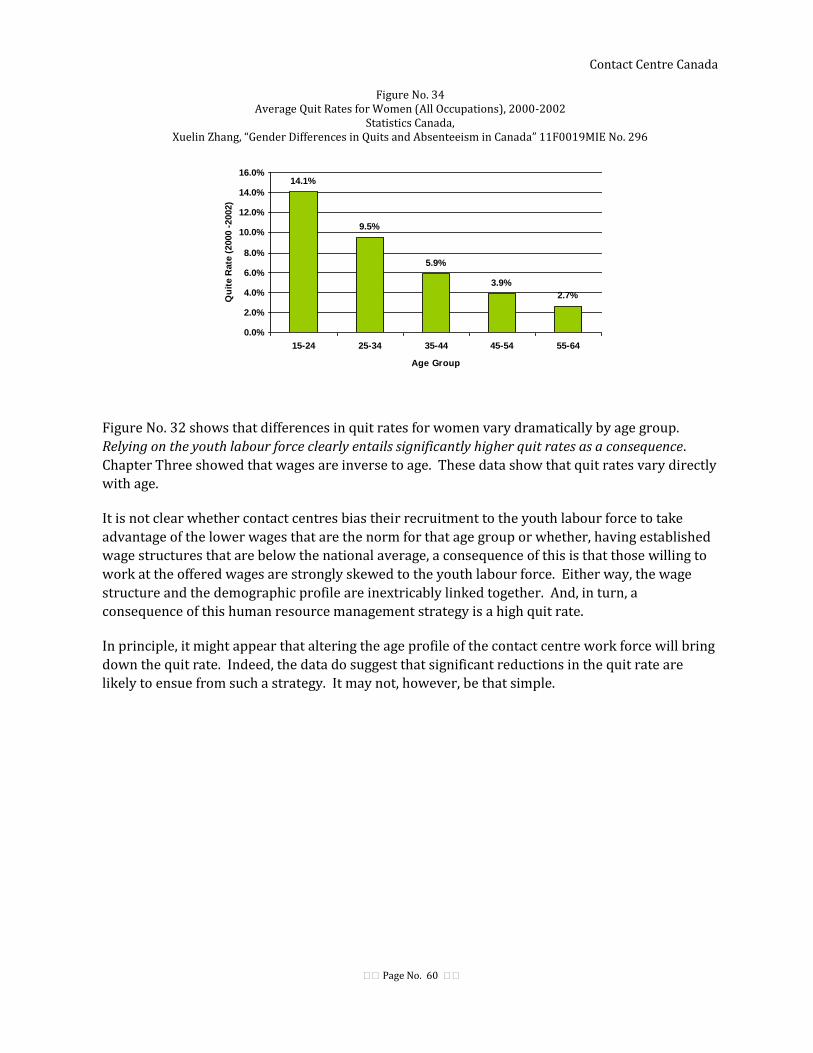
Contact Centre Canada
Page No. 60
Figure No. 34 Average Quit Rates for Women (All Occupations), 2000-2002
Statistics Canada, Xuelin Zhang, “Gender Differences in Quits and Absenteeism in Canada” 11F0019MIE No. 296
14.1%
9.5%
5.9%
3.9%
2.7%
0.0%
2.0%
4.0%
6.0%
8.0%
10.0%
12.0%
14.0%
16.0%
15-24 25-34 35-44 45-54 55-64
Age Group
Qu
ite R
ate
(2000 -
2002)
Figure No. 32 shows that differences in quit rates for women vary dramatically by age group.
Relying on the youth labour force clearly entails significantly higher quit rates as a consequence.
Chapter Three showed that wages are inverse to age. These data show that quit rates vary directly
with age.
It is not clear whether contact centres bias their recruitment to the youth labour force to take
advantage of the lower wages that are the norm for that age group or whether, having established
wage structures that are below the national average, a consequence of this is that those willing to
work at the offered wages are strongly skewed to the youth labour force. Either way, the wage
structure and the demographic profile are inextricably linked together. And, in turn, a
consequence of this human resource management strategy is a high quit rate.
In principle, it might appear that altering the age profile of the contact centre work force will bring
down the quit rate. Indeed, the data do suggest that significant reductions in the quit rate are
likely to ensue from such a strategy. It may not, however, be that simple.
Contact Centre Canada
Page No. 61
The nature of the work organization model in most contact centres is that in many cases:
jobs are narrowly defined,35
job cycles (i.e., call times) are relatively short36,
promotion opportunities are limited,
electronic and personal supervision levels are comparatively high,
a significant proportion of in-bound callers may be dissatisfied or calling to
resolve a complaint,
stress levels may be high,37 and
interaction with co-workers is often limited.
For the most part, these are negative job attributes. Holman et al. comment that: “Most call centres
were seen to combine low levels of discretion with high levels of intensive monitoring, resulting in
high levels of employee stress, turnover and sickness within the sector.”38 It cannot be assumed
that the organization of work that is functional with a younger work force will be equally
functional if the demographic profile of the work force is changed, especially if changing the age
profile also involves raising the average education profile. In other words, a strategy to alter the
age demographics of the contact centre work force may also require a “re-think” of how jobs are
defined, how advancement aspirations can be accommodated, and how performance is monitored
and supported.
35 The international study of contact centres measured ‘job discretion’ across a number of variables.
Canadian contact centres had the lowest ‘job discretion’ ranking of any country, except India. David Holman, et al., “Work Design Variation and Outcomes in Call Centres”, Industrial and Labor Relations Review, Vol. 62, No. 4 *July 2009)
36 Batt et al., op. cit., reports that call times average 195 seconds in the 15-country sample. In Canada, the
average call time was 240 seconds. The median call time was 185 seconds. 37 Sheppell –fgi, Employee Health and Well Being: Trends in the Call Centre Sector (2008). The Sheppell study
found moderately higher levels of stress problems and stress-related behaviour problems in contact centres when compared to national averages. It should be noted that it cannot be inferred from the Sheppell study that these problems originate entirely in the workplace. To some degree, they may reflect demographic patterns that are more pronounced in the contact centre sector work force.
38 Holman et al. op. cit., p 516
Contact Centre Canada
Page No. 62
Strategies to Address Turnover
There are five broad types of strategies to reduce turnover:
1. Selection based on ‘Job Congruence’ Principles
Selection processes based on ‘job congruence’ principles rigorously correlate personality
traits with the incidence of dismissals and quits. Many large employers have already
implemented job congruence selection processes and have benefits from reduced
dismissal rates and reduced quit rates. Less customized, but still functional ‘off-the-shelf’
assessment instruments are available to small and medium-size contact centres. National
service providers are also increasingly aware of cultural differences related to language.
2. Strategic Re-Profiling of Demographics
Strategic re-profiling of recruitment associates certain demographic characteristics –
notably age and education – with lower expected dismissal and quit rates. Recruitment
strategies are reoriented to attracting applicants with these demographic characteristics
and then biasing selection to those candidates.
3. Remuneration-based Strategies
There are various remuneration-based strategies. The simplest, but not necessarily the
most effective, is to upgrade wage rates across-the-board. Most remuneration strategies
are more nuanced. For example, wages could be increased at the entry level to improve
the quality of the pool from which candidates are selected. Alternatively, companies can
use service-based pay grades or ranks as a retention benefit. The human resources
literature usually characterizes benefit plans as being more valued by older employees
with families than by younger employees. Related to remuneration-based strategies are
opportunities for advancement which must be credible and widely believed.
4. Altering the Characteristics of the Work Environment
The work environment comprises more than how jobs are organized and supervised.
Relaxation facilities, opportunities for social interaction, commuting locations, and the
ergonomic and aesthetic design of facilities are important characteristics of the work
environment.

Contact Centre Canada
Page No. 63
5. Altering the Characteristics of Jobs
From an industrial psychology perspective, the most important characteristics of jobs are:
(a) the degree of individual discretion allowed to employees in how
they pace their work or meet their employer’s objectives,
(b) the extent of electronic supervision and surveillance,
(c) the extent of direct supervision and surveillance,
(d) the narrowness or breadth of job responsibilities, which is often
reflected in job cycle times and the skills and knowledge
required to perform the job, and
(d) the manner and degree to which employees can see the results of
their efforts and receive recognition for those results.
Altering jobs so as to reduce negative characteristics and accentuate positive
characteristics is generally shown to increase employee satisfaction and reduce both non-
productive behaviour and quits.
Conclusion:
Contact centres are replacing customer service provided through local representatives in branches
and offices. Whether the quality of jobs in contact centres will be commensurate with the quality
of the jobs that contact centres displace will depend, in large measure, on how contact centres
tackle the turnover problem. High turnover rates are a message from the labour market. In
essence that message is that human resources management strategies that were developed for an
earlier period are no longer sufficient in the context of changed labour market conditions. High
turnover rates have serious and adverse effects on productivity, operating costs, and
competitiveness. Their effect is to put significant pressure on human resources management
strategies and to drive changes in those strategies. Companies that address the turnover challenge
successfully will have a competitive advantage over companies that do not. From a sectoral
perspective, it matters considerably which types of strategies companies pursue, just as it matters
greatly where companies situate themselves on the cost-centre / value-adding centre continuum
discussed in Chapter Three.
Contact Centre Canada
Page No. 64
8. Recommendations
The key finding of this report is that the human resource management strategies that emerged in the
period 1995 to 2005 need to be re-assessed in light of how labour market conditions have changed. The
contact centre sector accounts for approximately 3% of employment in Canada. This, it should be
noted, is a conservative estimate. As discussed in earlier studies, the statistical systems for classifying
industries and occupations makes it difficult to estimate the actual number of persons working in a
contact centre environment and therefore the number of persons who will be affected by future trends
in this sector. A comprehensive census of persons working in a contact centre environment would
likely lead to an estimate higher than 3%.
How the contact centre sector responds to the need to re-assess its human resources management
strategies, in light of changed labour market conditions, therefore has significance for a large number
of Canadians. The recommendations proposed in this chapter are intended to better equip the sector
to monitor labour market trends and address the need to re-assess human resources management
strategies.
Labour Market Information
Recommendation No. 1: Contact Centre Canada should work with HRSDC and Statistics Canada to
develop occupational codes that better identify persons employed in a
contact centre environment.
A chronic challenge in analyzing labour market trends in the contact centre sector is that occupational
codes are based on skill and functional attributes and do not take account of working environments.
Thus occupations may be coded in the same way whether they work in contact centres or in branch
offices which deal with customers on a face-to-face basis. This coding problem bedevils measurement
of employment trends primarily in in-house contact centres which constitute 75-80% of employment in
the sector and which generally provide more favourable employment conditions.
The rationale for a system of occupational coding based on skill and functional attributes of jobs is not
disputed. However, the shift of a large number of occupations into a contact centre working
environment has significant implications for the quality of jobs, the location of jobs and the
vulnerability of jobs to displacement. As well, there are skill requirements that are intrinsic to a contact
centre environment. Given the magnitude of the contact centre sector, it is important that systems of
statistical coding facilitate, rather than impede, the monitoring of labour market trends in this sector.

Contact Centre Canada
Page No. 65
Recommendation No. 2: Contact Centre Canada should work with Statistics Canada to develop a
customized survey instrument that can be applied to vertical markets in
which in-house contact centres predominate. The priorities for applying
this customized survey instrument should be the financial services
industry, the telecom industry, and the travel and accommodation
industry.
As noted earlier, 75-80% of contact centre employees work in in-house contact centres. Industrial
codes and occupational codes do not identify these workers. As a result, analysis of contact centre
trends is strongly biased by developments in the outsourcing industry which lends itself more readily to
statistical identification. However, there is mounting evidence that the outsourcing industry is not
necessarily representative of broader trends in the contact centre sector. In particular, the Tier I jobs
which handle more complex customer interactions and higher value customers or transactions are the
least likely to be outsourced. Documenting and analyzing trends in in-house contact centres should be
a priority for Contact Centre Canada. In light of the importance of contact centres as job generators,
especially in smaller communities, an analysis of trends in in-house contact centres also will be relevant
to provincial and local economic development offices. Analyses of vertical markets will also strengthen
the relevance and effectiveness of Contact Centre Canada. Experience with ad hoc industry-based
surveys suggests that the only reliable way to achieve the coverage needed is to administer vertical
market surveys through Statistics Canada.
Human Resources Management
Recommendation No. 3: Contact Centre Canada should undertake a study of turnover trends in
contact centres and in the contact centre sector, as a whole, to assist the
sector in understanding the relationship between human resources
management strategies and turnover trends. Contact Centre Canada
should also engage the sector in discussions about turnover and the need
to re-think the human resources management polices that are at the root
of high turnover. This should be part of Contact Centre Canada’s broader
mandate to develop labour market information products that better
enable organizations to plan and implement their human resources
investments.
This report has argued that turnover is a message from the labour market that human resources
management strategies are ‘out of sync’ with labour market conditions. The current economic
downturn has relieved the sector from the severe pressures it was confronting prior to 2009. The
employment outlook for the contact centre sector and the outlook for the overall economy suggest
that pressure from the labour market will return in 2011 or, at the latest, in 2012. That is to say, the
sector is currently enjoying a respite from labour market pressures, not a dispensation. Turnover will
again become a serious challenge for the sector if the human resources management strategies that
were developed in the period 1995 to 2005 are not altered.

Contact Centre Canada
Page No. 66
Recommendation No. 4: Contact Centre Canada should work with stakeholders to highlight
the important role of contact centres as value-adders.
How an organization understands its contact centre is a key determinant of its human resources
management strategies. Organizations that see their contact centres primarily as cost centres are
attracted to outsourcing and offshoring strategies and to organizational models that maximize the
scope for task automation. By contrast, organizations that understand howcontact centres can
contribute value to their organization will be attracted to strategies that maximize the scope for
this value creation. Contact Centre Canada can strengthen the internal position of contact centres
within organizations by documenting how contact centres create value. There a various ways in
which the value-adding potential of contact centres can be documented and disseminated. These
include:
case studies,
a web-based resource centre for industry white papers and
scholarly studies,
web-based forums for the exchange of views among
industry professionals, and
an advocacy role within the sector for Contact Centre Canada
and its executive leadership.
December 2009