Taiwan Contact Lens Sector
31
DISCLOSURE APPENDIX CONTAINS ANALYST CERTIFICATIONS AND THE STATUS OF NON US ANALYSTS. US Disclosure: Credit Suisse does and seeks to do business with companies covered in its research reports. As a result, investors should be aware that the Firm may have a conflict of interest that could affect the objectivity of this report. Investors should consider this report as only a single factor in making their investment decision. 01 March 2013 Asia Pacific/Taiwan Equity Research Healthcare Taiwan Contact Lens Sector INITIATION Clear opportunity in sight Figure 1: BRICs to lead growth in global contact lens market 1.9% 5.0% 5.9% 6.2% 6.9% 15.1% 19.8% 0% 5% 10% 15% 20% 25% Japan Asia Pacific EMEA World Americas BRICs China CAGR (2011-2016) Source: Cooper, Credit Suisse estimates ■ Initiating on the Taiwan contact lens sector with an OVERWEIGHT call. In tandem, we initiate coverage on Ginko with an OUTPERFORM rating and St. Shine with a NEUTRAL rating. We expect the global contact lens market to see a 6.2% CAGR during 2012-16 with BRICs leading the market on a 15.1% CAGR during the same period. This is driven by increased penetration and consumer upgrading on the back of economic growth. ■ China market to take off. We found that within Asia, contact lens penetration picks up significantly once GDP per capita is close to US$10k. Contact lens penetration in China is now only 5% compared with 23-25% for developed Asian countries. We forecast China’s contact lens market will double from US$312 mn to US$642 mn by 2016, implying a 19.8% CAGR during 2012-16. ■ Multiple entry barriers to support high margins to continue. The Global contact lens market is oligopolistic: gross profit margins are >60%. We expect the high margins to continue behind multiple entry barriers, including: 1) increased difficulty getting product licenses; 2) rapidly rising advertising costs, and; 3) distribution channels already dominated by multinational brands. ■ We believe select Taiwan contact lens players, e.g., Ginko, have the best positioning to capture China’s strong growth. We initiate on Ginko with an OUTPERFORM rating and target price of NT$540 (29% implied upside), based on 0.9x 2013E PEG. Our forecast 2013/2014 EPS are 9%/17% higher than consensus due to higher sales growth assumptions. We also initiate on St. Shine with a NEUTRAL rating and target price of NT$504 (flat with the trading price), based on 18x 2013E EPS. This tepid view, is based on longer-term concerns that ~80% of its sales come from the saturated Japanese and Taiwanese markets. Risks to our forecasts include failure to ramp capacity, slower-than-expected penetration and migration to substitutes — LASIK surgery or silicone hydrogel lens. Research Analysts Jeremy Chen 886 2 2715 6368 [email protected]
Transcript of Taiwan Contact Lens Sector

DISCLOSURE APPENDIX CONTAINS ANALYST CERTIFICATIONS AND THE STATUS OF NON US ANALYSTS. US Disclosure: Credit Suisse does and seeks to do business with companies covered in its research reports. As a result, investors should be aware that the Firm may have a conflict of interest that could affect the objectivity of this report. Investors should consider this report as only a single factor in making their investment decision.
01 March 2013
Asia Pacific/Taiwan
Equity Research
Healthcare
Taiwan Contact Lens Sector INITIATION
Clear opportunity in sight
Figure 1: BRICs to lead growth in global contact lens market
1.9%
5.0%
5.9%
6.2%
6.9%
15.1%
19.8%
0% 5% 10% 15% 20% 25%
Japan
Asia Pacific
EMEA
World
Americas
BRICs
China
CAGR (2011-2016) Source: Cooper, Credit Suisse estimates
■ Initiating on the Taiwan contact lens sector with an OVERWEIGHT call.
In tandem, we initiate coverage on Ginko with an OUTPERFORM rating and
St. Shine with a NEUTRAL rating. We expect the global contact lens market
to see a 6.2% CAGR during 2012-16 with BRICs leading the market on a
15.1% CAGR during the same period. This is driven by increased
penetration and consumer upgrading on the back of economic growth.
■ China market to take off. We found that within Asia, contact lens
penetration picks up significantly once GDP per capita is close to US$10k.
Contact lens penetration in China is now only 5% compared with 23-25% for
developed Asian countries. We forecast China’s contact lens market will
double from US$312 mn to US$642 mn by 2016, implying a 19.8% CAGR
during 2012-16.
■ Multiple entry barriers to support high margins to continue. The Global
contact lens market is oligopolistic: gross profit margins are >60%. We
expect the high margins to continue behind multiple entry barriers, including:
1) increased difficulty getting product licenses; 2) rapidly rising advertising
costs, and; 3) distribution channels already dominated by multinational
brands.
■ We believe select Taiwan contact lens players, e.g., Ginko, have the
best positioning to capture China’s strong growth. We initiate on Ginko
with an OUTPERFORM rating and target price of NT$540 (29% implied
upside), based on 0.9x 2013E PEG. Our forecast 2013/2014 EPS are
9%/17% higher than consensus due to higher sales growth assumptions.
We also initiate on St. Shine with a NEUTRAL rating and target price of
NT$504 (flat with the trading price), based on 18x 2013E EPS. This tepid
view, is based on longer-term concerns that ~80% of its sales come from the
saturated Japanese and Taiwanese markets. Risks to our forecasts include
failure to ramp capacity, slower-than-expected penetration and migration to
substitutes — LASIK surgery or silicone hydrogel lens.
Research Analysts
Jeremy Chen
886 2 2715 6368

01 March 2013
Taiwan Contact Lens Sector 2
Focus charts Figure 2: Global contact lens market size Figure 3: Steeper penetration curve for Asian countries
0%
2%
4%
6%
8%
10%
12%
14%
16%
18%
20%
-
1,000
2,000
3,000
4,000
5,000
6,000
7,000
8,000
1996 2000 2004 2005 2006 2007 2008 2009 2010 2011
US$mn
Global market size yoy growth (RHS; %)
Source: Contact Lens Spectrum Source: Ginko, Credit Suisse estimates
Figure 4: Global contact lens market by brand - 2011 Figure 5: Global contact lens market by region - 2011
J&J42%
CIBA25%
Cooper17%
B&L11%
Other5%
America38%
Asia33%
Europe29%
Source: Ginko Source: Cooper
Figure 6: China contact lens market by brand - 2011 Figure 7: We expect China contact lens market to take off
on the back of rising affordability
Hydron28%
J&J27%
B&L21%
Weicon6%
CIBA3%
Other15%
- 2,000 4,000 6,000 8,000
10,000 12,000 14,000 16,000 18,000 20,000
Tia
njin
Shanghai
Beiji
ng
Jia
ngsu
Zhejia
ng
Inner
Mongolia
Lia
onin
gG
uangdong
Fujia
nS
handong
Chin
aJili
nC
hongqin
gH
ubei
Hebei
Shaanxi
Nin
gxia
Heilo
ngjia
ng
Shanxi
Xin
jiang
Hunan
Qin
ghai
Hain
an
Henan
Sic
huan
Jia
ngxi
Anhui
Guangxi
Tib
et
Gansu
Yunnan
Guiz
hou
GDP per capita (US$) - 2016
Source: Ginko Source: Credit Suisse estimates

01 March 2013
Taiwan Contact Lens Sector 3
Clear opportunity in sight We expect BRICs to lead market growth during 2012-
16
The global contact lens market has seen a steady 7.5% CAGR in the past 15 years and is
expected to see a 6.2% CAGR through 2012-16. While the US (38% of the global market)
and Japan (20%) may witness relatively stable 7% and 2% CAGRs, respectively, we
expect BRICs, especially China, to lead the market with a 15.1% CAGR during the same
period, despite relatively small global share of 10% by 2016E. This is largely driven by
increased penetration and consumer upgrading on economic growth.
China market to take off
We uncovered that for Asian countries, contact lens penetration picks up significantly once
GDP per capita is close to the US$10k level. Currently, contact lens penetration in China is
only 5% and this compares with 23-25% penetration in Taiwan, Japan, Korea, Singapore
and Hong Kong. We forecast China’s contact lens market to double from US$312 mn to
US$642 mn by 2016, implying a 19.8% CAGR during 2012-16, driven by a faster-than-
expected increase in contact lens penetration on rising affordability.
Multiple entry barriers to support high margins to
continue
The global contact lens market is oligopolistic, where brand vendors enjoy at least 60%
gross margin. This high margin is protected by multiple entry barriers, including: 1)
Increased difficulty to get product licenses—Contact lenses are considered a “medical
device”. As such, governments have established stringent licensing standards for contact
lens manufacturing and distribution. For each product, vendors/OEM are required to
submit clinical data and get approvals from local regulators such as CE Certification
(Europe), FDA inspection (US), GMP (Taiwan), and SFDA (China). The approval process
generally takes one to two years from filing to official product launch; 2) Skyrocketing
advertising costs—Any newcomer to the market has to be prepared to spend heavily on
advertising and promotion. There is deep brand loyalty in this market: customers are not
keen to put an unproven product in their eyes and stay with brands that have proven
themselves over decades. And the game is changing : advertising per second on Chinese
TV costs 5x more now than in 2005, according to Ginko; 3) Distribution channels are
dominated by multinational brands—From a retail channel perspective, they will not
replace bestselling brands with any new brand on their shelf, given the cash conversion
cycle for the latter might be longer.
Stock calls
We initiate coverage on Ginko with an OUTPERFORM rating. With a strong EPS CAGR of
36% over 2012-2014, we set our target price of NT$540 (upside potential of 29%) based
on 0.9x 2013E PEG, given: 1) biggest sales channel in China; 2) full product offering at
competitive price points; 3) strong brand recognition ; and 4) a dedicated and experienced
management team. Our forecast 2013/2014 EPS are 9%/17% higher than consensus’ due
to higher sales growth assumptions.
We also initiate coverage on St. Shine with a NEUTRAL rating. We forecast a 15% EPS
CAGR during 2012-14 for St. Shine, compared with its peer group average of 20% CAGR.
We set our target price of NT$504 (flat with trading price) based on 18x 2013E EPS due to
the longer-term concern that ~80% of its revenue comes from the relatively saturated
Japanese (2% CAGR during 2008-2012) and Taiwanese markets, evidenced by
decelerating sales from a 27% CAGR during 2005-2010 to 10% in 2011 and -6% in 2012.
While the US and Japan are
expected to see relatively
stable 7% and 2% CAGRs,
respectively, we expect
BRICs to lead the market
with a 15.1% CAGR during
2012-16
We expect the China market
to see a 19.8% CAGR
through 2012-16
Global contact lens market
is oligopolistic; branded
vendors enjoy not less than
60% gross profit margin
We assign Ginko an
OUTPERFORM rating and
St. Shine a NEUTRAL rating

01 March 2013
Taiwan Contact Lens Sector 4
Figure 8: Sector valuation comparison
Company Ticker CS Rating Market cap
(US$mn)PER (x) PEG (x)
EPS CAGR
(2012-2014)ROE (%)
St. Shine 1565.TWO NTRL 876 18.3 1.2 15% 15%
Ginko 8406.TWO OPFM 1,305 25.2 0.7 36% 24%
Optical frame
Essilor ESSI.PA NR 20,787 23.9 2.3 10% 16%
Carl Zeiss Meditec AFXG.DE NR 2,490 21.2 1.3 16% 13%
Greater China healthcare
Sinopharm Taiwan 1789.TW NR 1,620 35.3 1.4 24% 14%
Shandong Weigao 1066.HK UPFM 4,166 20.1 1.1 19% 14%
Sino Biopharmaceutical 1177.HK NTRL 2,732 22.1 1.3 17% 21%
Sinopharm group 1099.HK NTRL 7,572 20.7 0.9 24% 13%
Hengan 1044.HK OPFM 12,523 22.5 1.0 23% 30%
Greater China consumer
Wowprime 2727.TW NR 990 18.5 1.7 11% 37%
Gourmet master 2723.TW NR 952 18.4 0.7 25% 22%
Tingyi 0322.HK OPFM 14,815 23.4 0.7 32% 32%
Uni-President China 0220.HK NR 4,222 22.6 1.1 21% 13%
Average 6,624 22.6 1.2 20% 20%
Source: Company data, Bloomberg, Credit Suisse estimates
Figure 9: P/E band - Ginko Figure 10: P/E band – St. Shine
200
250
300
350
400
450
500
550
600
Apr-
12
May-
12
May
-12
Jun-1
2
Jun-1
2
Jul-1
2
Jul-1
2
Aug-1
2
Aug-1
2
Sep-1
2
Sep-1
2
Sep-1
2
Oct
-12
Oct
-12
Nov-
12
Nov-
12
Dec-
12
Dec-
12
Jan-1
3
Jan-1
3
Feb-1
3
Feb-1
3
NT$
16 20 24 28 32 Share Price
Current Valuation: 25.2xHistorical Average
-
100
200
300
400
500
600
Apr-
04
Apr-
05
Apr-
06
Apr-
07
Apr-
08
Apr-
09
Apr-
10
Apr-
11
Apr-
12
NT$
12 14 16 18 20 Share Price
Current Valuation: 18.3x
Historical Average
Source: Company data, Credit Suisse estimates Source: Company data, Credit Suisse estimates

01 March 2013
Taiwan Contact Lens Sector 5
We expect BRICs to lead market growth during 2012-16 The contact lens industry
The global contact lens market has seen a steady 7.5% CAGR in the past 15 years and is
expected to witness a 6.2% CAGR through 2012-16. While the US (38% of global market)
and Japan (20%) are expected to see relatively stable 7% and 2% CAGRs, respectively,
we expect BRICs, especially China, to lead the market with a 15.1% CAGR during the
same period, despite a relatively small global share of 10% by 2016E. This is largely
driven by increased penetration and consumer upgrading on the back of economic growth.
According to the Contact Lens Spectrum, global market size has reached US$6.8 bn in
2011, of which, the US represents the biggest market (38%), followed by Asia (33%) and
Europe (29%). Currently, the global contact lens market is dominated by the big four—
Johnson & Johnson (42%), CIBA Vision (25%), Cooper (17%), and Bausch & Lomb
(11%). The big four controlled 95% of the market, but of late, smaller players such as St.
Shine have been gaining share. St. Shine has quadrupled its global share from 0.4% in
2003 to 1.6% in 2011 through its OEM/ODM business, given its product quality,
competitive pricing and long-term client relationships.
Figure 11: BRICs to lead growth in global contact lens
market
Figure 12: Global contact lens market size
1.9%
5.0%
5.9%
6.2%
6.9%
15.1%
19.8%
0% 5% 10% 15% 20% 25%
Japan
Asia Pacific
EMEA
World
Americas
BRICs
China
CAGR (2011-2016)
0%
2%
4%
6%
8%
10%
12%
14%
16%
18%
20%
-
1,000
2,000
3,000
4,000
5,000
6,000
7,000
8,000
1996 2000 2004 2005 2006 2007 2008 2009 2010 2011
US$mn
Global market size yoy growth (RHS; %)
Source: Company data, Credit Suisse estimates Source: Contact Lens Spectrum
Figure 13: Global contact lens market by brand - 2011 Figure 14: Global contact lens market by region - 2011
J&J42%
CIBA25%
Cooper17%
B&L11%
Other5%
America38%
Asia33%
Europe29%
Source: Ginko Source: Cooper
China still a relatively small
market for contact lens
Currently, the global contact
lens market is dominated by
the big four—J&J (42%),
CIBA Vision (25%), Cooper
(17%) and B&L (11%)

01 March 2013
Taiwan Contact Lens Sector 6
Increased penetration
Contact lens penetration is highly correlated with GDP per capita. While a significant pick-
up in penetration was evident once GDP per capita exceeds US$20k level for the
American and European countries, Asian countries seem to scatter over a steeper curve
due to different user habits. We expect contact lens penetration in China to pick up from
5.0% in 2012 to 11.0% by 2016 on the back of rising affordability, implying a 22.4% CAGR
in contact lens users during 2012-16.
Figure 15: We forecast China’s contact lens user base to see 22.4% CAGR during 2012-16
2012F 2013F 2014F 2015F 2016F CAGR (2012-16)
Real GDP growth (%) 7.7 8.0 8.2 8.2 8.0
Inflation (%) 2.6 3.0 3.1 3.3 3.0
Nominal GDP (US$ bn) 8,081 9,272 10,537 11,664 12,975
Population (mn) 1,355 1,362 1,369 1,376 1,383
YoY % 0.5 0.5 0.5 0.5 0.5
GDP per capita ($) 5,964 6,808 7,697 8,476 9,381
YoY % 14 14 13 10 11
Corrective lens needed (mn ppl) 300 302 303 305 306
Contact lens penetration (%) 5.0 6.5 8.0 9.5 11.0
Users base (mn ppl) 15.0 19.6 24.2 28.9 33.7
Growth (%) 30.7 23.7 19.4 16.4 22.4
Source: Credit Suisse estimates
Consumer upgrades
With higher disposable income given economic growth, consumers tend to migrate to
daily/weekly disposable lens and specialty lens such as coloured lens, alongside rising
awareness of hygiene, or just for the “look” of the lens. For example, daily disposable lens
do not require repeated cleaning after day-to-day use which reduces risk of infection or
other complications. The migration from longer-cycle lens to daily/weekly products could
also fuel industry growth, for example, if a user switches from annual disposal lens to
monthly, it will increase sales volumes by 12x, and 365x if switching to daily products. In
the case of Hydron, China’s No.1 contact lens brand under Ginko, ASP for annual
replacement lens is Rmb$40/piece vs ASP of Rmb3/piece for daily replacement or
Rmb1,100 per annum. Currently, ~70% of Chinese use annual/semi-annual replacement
lens. This compares to only 10% in Taiwan, Japan and Korea.
Figure 16: Steeper penetration curve for Asian countries Figure 17: Market share by product life
42%
17%
57%
38%
10%53%
33%
34%
48%
30%
10%
28%
70%
30%
0%
10%
20%
30%
40%
50%
60%
70%
80%
90%
100%
Europe America Apac Global China
Daily Bi-weekly Monthly Semi-annual & annual Other
Source: Ginko, Credit Suisse Research Source: Company data, Credit Suisse estimates
We expect contact lens
penetration in China to pick
up from 5.0% in 2012 to
11.0% by 2016 on the back
of rising affordability
Currently, ~70% of Chinese
use annual/semi-annual
replacement lens. This
compares to only 10% in
Taiwan, Japan, and Korea
01 March 2013
Taiwan Contact Lens Sector 7
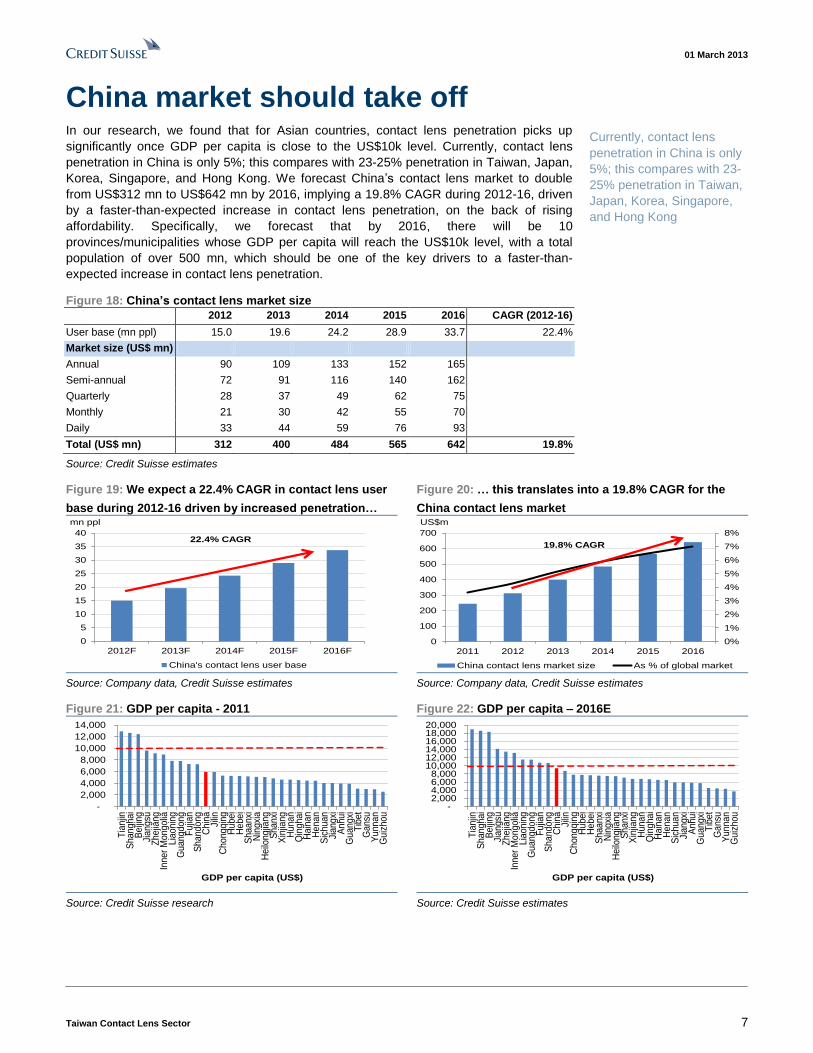
China market should take off In our research, we found that for Asian countries, contact lens penetration picks up
significantly once GDP per capita is close to the US$10k level. Currently, contact lens
penetration in China is only 5%; this compares with 23-25% penetration in Taiwan, Japan,
Korea, Singapore, and Hong Kong. We forecast China’s contact lens market to double
from US$312 mn to US$642 mn by 2016, implying a 19.8% CAGR during 2012-16, driven
by a faster-than-expected increase in contact lens penetration, on the back of rising
affordability. Specifically, we forecast that by 2016, there will be 10
provinces/municipalities whose GDP per capita will reach the US$10k level, with a total
population of over 500 mn, which should be one of the key drivers to a faster-than-
expected increase in contact lens penetration.
Figure 18: China’s contact lens market size
2012 2013 2014 2015 2016 CAGR (2012-16)
User base (mn ppl) 15.0 19.6 24.2 28.9 33.7 22.4%
Market size (US$ mn)
Annual 90 109 133 152 165
Semi-annual 72 91 116 140 162
Quarterly 28 37 49 62 75
Monthly 21 30 42 55 70
Daily 33 44 59 76 93
Total (US$ mn) 312 400 484 565 642 19.8%
Source: Credit Suisse estimates
Figure 19: We expect a 22.4% CAGR in contact lens user
base during 2012-16 driven by increased penetration…
Figure 20: … this translates into a 19.8% CAGR for the
China contact lens market
0
5
10
15
20
25
30
35
40
2012F 2013F 2014F 2015F 2016F
mn ppl
China's contact lens user base
22.4% CAGR
0%
1%
2%
3%
4%
5%
6%
7%
8%
0
100
200
300
400
500
600
700
2011 2012 2013 2014 2015 2016
US$m
China contact lens market size As % of global market
19.8% CAGR
Source: Company data, Credit Suisse estimates Source: Company data, Credit Suisse estimates
Figure 21: GDP per capita - 2011 Figure 22: GDP per capita – 2016E
-
2,000
4,000
6,000
8,000
10,000
12,000
14,000
Tia
njin
Sh
an
gh
ai
Be
ijin
gJi
ang
suZ
hejia
ng
Inne
r M
ong
olia
Lia
on
ing
Gu
an
gd
on
gF
ujia
nS
han
do
ng
Ch
ina
Jilin
Ch
on
gq
ing
Hu
be
iH
ebe
iS
haa
nxi
Nin
gxi
aH
eilo
ng
jiang
Sh
an
xiX
injia
ng
Hu
na
nQ
ingh
ai
Ha
ina
nH
ena
nS
ich
ua
nJi
ang
xiA
nhu
iG
uan
gxi
Tib
et
Ga
nsu
Yu
nn
an
Gu
izh
ou
GDP per capita (US$)
- 2,000 4,000 6,000 8,000
10,000 12,000 14,000 16,000 18,000 20,000
Tia
njin
Sh
an
gh
ai
Be
ijin
gJi
an
gsu
Zhe
jiang
Inne
r M
ong
olia
Lia
on
ing
Gu
an
gd
on
gF
ujia
nS
han
do
ng
Ch
ina
Jilin
Ch
on
gq
ing
Hu
be
iH
ebe
iS
haa
nxi
Nin
gxi
aH
eilo
ngjia
ng
Sh
an
xiX
injia
ng
Hu
na
nQ
ing
ha
iH
ain
an
He
na
nS
ich
ua
nJi
ang
xiA
nh
ui
Gu
an
gxi
Tib
et
Ga
nsu
Yu
nn
an
Gu
izh
ou
GDP per capita (US$)
Source: Credit Suisse research Source: Credit Suisse estimates
Currently, contact lens
penetration in China is only
5%; this compares with 23-
25% penetration in Taiwan,
Japan, Korea, Singapore,
and Hong Kong

01 March 2013
Taiwan Contact Lens Sector 8
Multiple entry barriers should continue to defend high margins The global contact lens market is oligopolistic where brand vendors enjoy at least 60%
gross margin; even ODM/OEM such as St. Shine earn >40% gross margin. These are the
sort of high margins that come from the defensive wall of multiple barriers to entry,
including:
(1) Increased difficulty in getting product licenses. Contact lens sit right on the
cornea, and, thus are classed as a “medical device”. As such, governments have
established stringent licensing standards for contact lens manufacturing and
distribution. For each product, vendors/OEM are required to submit clinical data and
get approvals from local regulators such as CE Certification (Europe), FDA inspection
(US), GMP (Taiwan), and SFDA (China). The approval process generally takes one to
two years from filing to the official product launch.
(2) Skyrocketing advertising costs create another entry barrier for new comers.
New comers to the market have to spend a lot more on advertising and promotions to
lure customers to switch from market leaders who have built strong brand loyalty with
proven product quality for decades. In particular, advertising per second on Chinese
TV costs 5x more now than in 2005, according to Ginko.
(3) Distribution channels dominated by multinational brands. From a retail channel
perspective, vendors will not replace bestselling brands with a new brand on their
shelves, given the cash conversion cycle for the latter will likely be longer.
Figure 23: Gross margin breakdown – own brand vs OEM
strategy
Figure 24: Cost structure comparison – Ginko adopts a
labour-light model
60%
20%
10%
40%
10%
10%
5%
3%
15%27%
0%
20%
40%
60%
80%
100%
Ginko St. Shine
Packaging materials Labor Depreciation Raw material Other
Source: Company data, Credit Suisse estimates Source: Company data, Credit Suisse estimates
Figure 25: Product mix comparison – Ginko still has more
exposure to long-cycled lens products
Figure 26: Capacity comparison – St. Shine is running at a
larger scale
-
50
100
150
200
250
300
350
400
450
2008 2009 2010 2011 2012 2013F 2014F
mn pieces/yr
Ginko St. Shine Source: Company data, Credit Suisse estimates Source: Company data, Credit Suisse estimates
We expect high margins to
continue behind the
protection of multiple
barriers to entry
Product approval generally
takes one to two years from
filing to official product
launch
Advertising per second on
Chinese TV costs 5x more
today than in 2005
01 March 2013
Taiwan Contact Lens Sector 9
Stock calls
We initiate coverage on Ginko with an OUTPERFORM rating. With strong EPS CAGR of
36% over 2012-2014, we set our target price of NT$540 (upside potential of 29%) based
on 0.9x 2013E PEG, given: 1) biggest sales channel in China; 2) full product offering at
competitive price points; 3) strong brand recognition ; and 4) a dedicated and experienced
management team. Our forecast 2013/2014 EPS are 9%/17% higher than consensus’ due
to higher sales growth assumptions.
We also initiate coverage on St. Shine with a NEUTRAL rating. We forecast a 15% EPS
CAGR during 2012-14 for St. Shine, compared with its peer group average of 20% CAGR.
We set our target price of NT$504 (flat with trading price) based on 18x 2013E EPS due to
the longer-term concern that ~80% of its revenue comes from the relatively saturated
Japanese (2% CAGR during 2008-2012) and Taiwanese markets, evidenced by
decelerating sales from a 27% CAGR during 2005-2010 to 10% in 2011 and -6% in 2012.
Risk
Risks to our forecasts include failure to ramp up capacity, slower-than-expected
penetration and user migration to substitutes of contact lens such as LASIK or silicone
hydrogel.
LASIK (Laser-Assisted in Situ Keratomileusis) is a type of refractive surgery for the
correction of myopia, providing a permanent alternative to eyeglasses or contact lenses.
Major side effects include halos, starbursts, night-driving problems, keratoconus (corneal
ectasia) and eye dryness. In addition, the patient’s eyesight could deteriorate and become
myopic again. Cost of LASIK surgery ranges from Rmb5-15,000 in China.
Silicone hydrogel contact lens is an advanced type of soft lens that allows 5x more
oxygen to pass through the lens to the cornea than the regular soft lenses, designed for
extended wear with improved comfort. According to Contact Lens Spectrum, silicone
hydrogel contact lens already took up 43% of the global market and 67% in the US given
user habit, insurance coverage and clinical recommendation, compared with less than
10% penetration in Asian countries. Price point for the silicone hydrogel lens is 2x the
ordinary hydrogel lens.
There are side effects
associated with LASIK
Price point for silicone
hydrogel lens is 2x the
ordinary hydrogel lens

01 March 2013
Taiwan Contact Lens Sector 10
Asia Pacific / Taiwan
Ginko
(8406.TWO / 8406 TT)
Established leadership in the fastest-growing market
■ We initiate on Ginko with an OUTPERFORM rating and target price of
NT$540 (potential upside of 29%). Ginko ranks No.1 with 28% market
share in China, the world’s fastest-growing contact lens market. We forecast
China’s contact lens market to double from US$312 mn to US$642 mn by
2016, implying a 19.8% CAGR during 2012-16, driven by a faster-than-
expected increase in contact lens penetration and consumer upgrades on
the back of rising affordability.
■ Strong earnings growth driven by aggressive expansion plans across
the Straits. We estimate 30%/36% CAGRs in topline/net profit through
2012-14, with ROE improving from 23% to 26%, underpinned by its high
gross margin of 64%. To cater to under-satisfied demand, the company
plans to add 95 mn pieces capacity by 2014, or 112% growth on top of
existing capacity which is running at 80-90% utilisation now. Longer term, we
expect Ginko to be the winner of user upgrades to short-cycle lens, given
brand stickiness and its dominant position in annual/semi-annual products.
■ Continuous share gain fuelled by unparalleled advantages, including:
1) biggest sales channel in China; 2) full product offering through dual
brands—Hydron and Horien—at competitive price points; 3) strong brand
recognition as it had the early-mover advantage; and 4) a dedicated and
experienced management team.
■ Valuation: We believe Ginko represents a unique investment opportunity for
investors with a combination of China’s underpenetrated story, continuous
share gain, and more importantly, high margins protected by multiple entry
barriers. Our forecast 2013/2014 EPS are 9%/17% higher than consensus
due to higher sales growth assumptions. We set our target price of NT$540
based on 0.9x 2013E PEG, implying 29% upside. Risks to our forecasts
include failure to ramp up new capacity, weaker-than-expected sales
momentum and user migration to substitutes of contact lens such as LASIK
and silicone hydrogel lens. Share price performance
100
150
200
200
300
400
500
600
Apr-12 Aug-12 Dec-12
Price (LHS) Rebased Rel (RHS)
The price relative chart measures performance against the
TAIWAN SE WEIGHTED INDEX which closed at 7897.98 on
27/02/13
On 27/02/13 the spot exchange rate was NT$29.64/US$1
Performance over 1M 3M 12M Absolute (%) 13.8 18.3 — Relative (%) 11.4 13.1 —
Financial and valuation metrics
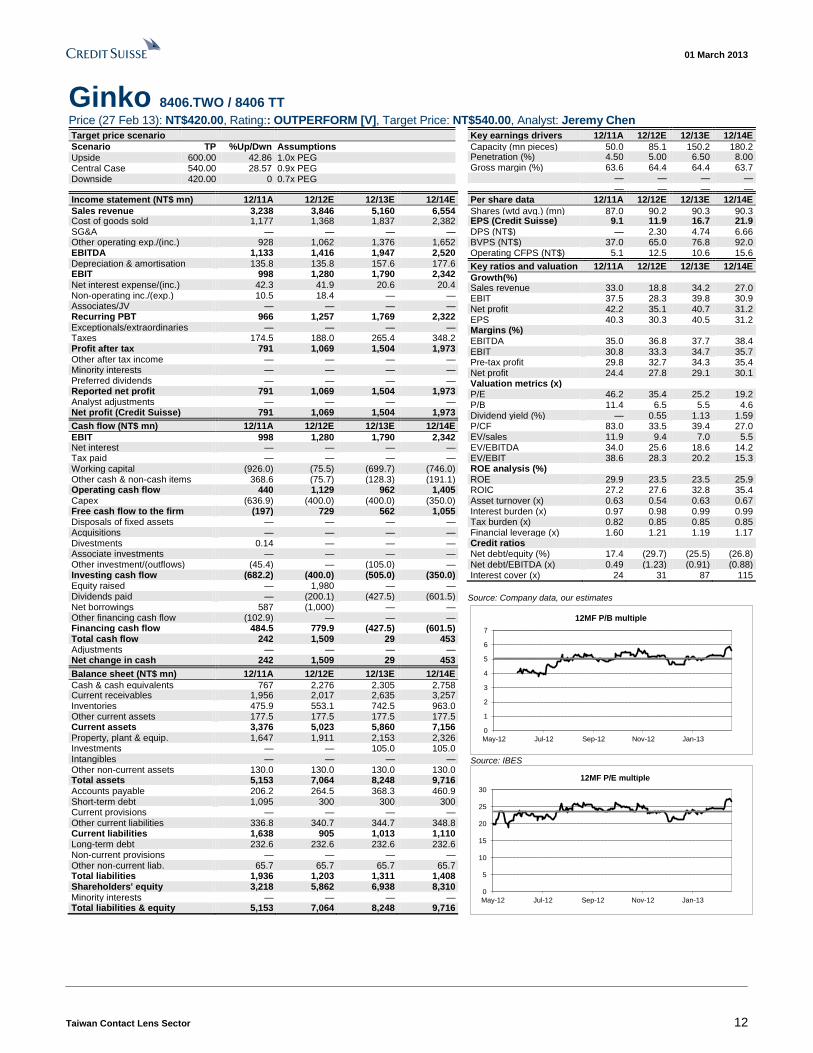
Year 12/11A 12/12E 12/13E 12/14E Revenue (NT$ mn) 3,238.4 3,846.2 5,160.1 6,554.3 EBITDA (NT$ mn) 1,133.5 1,416.1 1,947.3 2,519.6 EBIT (NT$ mn) 997.7 1,280.3 1,789.7 2,342.0 Net profit (NT$ mn) 791.4 1,068.8 1,503.7 1,973.3 EPS (CS adj.) (NT$) 9.10 11.86 16.65 21.85 Change from previous EPS (%) n.a. Consensus EPS (NT$) n.a. 12.1 15.3 18.8 EPS growth (%) 40.3 30.3 40.5 31.2 P/E (x) 46.2 35.4 25.2 19.2 Dividend yield (%) 0 0.5 1.1 1.6 EV/EBITDA (x) 34.0 25.6 18.6 14.2 P/B (x) 11.4 6.5 5.5 4.6 ROE (%) 29.9 23.5 23.5 25.9 Net debt/equity (%) 17.4 net cash net cash net cash
Source: Company data, our estimates.
Rating OUTPERFORM* [V] Price (27 Feb 13, NT$) 420.00 Target price (NT$) 540.00¹ Upside/downside (%) 28.6 Mkt cap (NT$ mn) 37,951 (US$ 1,280) Enterprise value (NT$ mn) 36,208 Number of shares (mn) 90.36 Free float (%) 13.8 52-week price range 434.0 - 223.5 ADTO - 6M (US$ mn) 4.2
*Stock ratings are relative to the coverage universe in each
analyst's or each team's respective sector.
¹Target price is for 12 months.
[V] = Stock considered volatile (see Disclosure Appendix).
Research Analysts
Jeremy Chen
886 2 2715 6368

01 March 2013
Taiwan Contact Lens Sector 11
Focus charts Figure 27: 3Q12 sales mix by product Figure 28: 3Q12 sales mix by channel
Annual 21%
Semi-annual
16%
Quarterly6%
Monthly5%
Daily8%
Solution44%
Retail30%
Wholesale68%
Export2%
Source: Ginko Source: Ginko
Figure 29: We forecast a 19.8% CAGR for China contact
lens market through 2012-16
Figure 30: Ginko will grow its contact lens capacity 112%
by 2014E to cater to under-satisfied market demand
0%
1%
2%
3%
4%
5%
6%
7%
8%
0
100
200
300
400
500
600
700
2011 2012 2013 2014 2015 2016
US$m
China contact lens market size As % of global market
19.8% CAGR
-40%
-20%
0%
20%
40%
60%
80%
100%
0
50
100
150
200
250
2009 2010 2011 2012E 2013E 2014E
mn units
Lens capacity Solution capacity
Lens capacity growth (%; RHS) Solution capacity growth (%; RHS)
Source: Company data, Credit Suisse estimates Source: Company data, Credit Suisse estimates
Figure 31: Ginko is No.1 in China’s contact lens market Figure 32: P/E band
Hydron28%
J&J27%
B&L21%
Weicon6%
CIBA3%
Other15%
200
250
300
350
400
450
500
550
600
Apr-
12
May-
12
May-
12
Jun-1
2
Jun-1
2
Jul-1
2
Jul-1
2
Aug-1
2
Aug-1
2
Sep-1
2
Sep-1
2
Sep-1
2
Oct
-12
Oct
-12
Nov-
12
Nov-
12
Dec-
12
Dec-
12
Jan-1
3
Jan-1
3
Feb-1
3
Feb-1
3
NT$
16 20 24 28 32 Share Price
Current Valuation: 25.2xHistorical Average
Source: Company data Source: Company data, Credit Suisse research
01 March 2013
Taiwan Contact Lens Sector 12
Ginko 8406.TWO / 8406 TT Price (27 Feb 13): NT$420.00, Rating:: OUTPERFORM [V], Target Price: NT$540.00, Analyst: Jeremy Chen
Target price scenario
Scenario TP %Up/Dwn Assumptions
Upside 600.00 42.86 1.0x PEG Central Case 540.00 28.57 0.9x PEG Downside 420.00 0 0.7x PEG
Key earnings drivers 12/11A 12/12E 12/13E 12/14E
Capacity (mn pieces) 50.0 85.1 150.2 180.2 Penetration (%) 4.50 5.00 6.50 8.00 Gross margin (%) 63.6 64.4 64.4 63.7 — — — — — — — —
Income statement (NT$ mn) 12/11A 12/12E 12/13E 12/14E
Sales revenue 3,238 3,846 5,160 6,554 Cost of goods sold 1,177 1,368 1,837 2,382 SG&A — — — — Other operating exp./(inc.) 928 1,062 1,376 1,652 EBITDA 1,133 1,416 1,947 2,520 Depreciation & amortisation 135.8 135.8 157.6 177.6 EBIT 998 1,280 1,790 2,342 Net interest expense/(inc.) 42.3 41.9 20.6 20.4 Non-operating inc./(exp.) 10.5 18.4 — — Associates/JV — — — — Recurring PBT 966 1,257 1,769 2,322 Exceptionals/extraordinaries — — — — Taxes 174.5 188.0 265.4 348.2 Profit after tax 791 1,069 1,504 1,973 Other after tax income — — — — Minority interests — — — — Preferred dividends — — — — Reported net profit 791 1,069 1,504 1,973 Analyst adjustments — — — — Net profit (Credit Suisse) 791 1,069 1,504 1,973
Cash flow (NT$ mn) 12/11A 12/12E 12/13E 12/14E
EBIT 998 1,280 1,790 2,342 Net interest — — — — Tax paid — — — — Working capital (926.0) (75.5) (699.7) (746.0) Other cash & non-cash items 368.6 (75.7) (128.3) (191.1) Operating cash flow 440 1,129 962 1,405 Capex (636.9) (400.0) (400.0) (350.0) Free cash flow to the firm (197) 729 562 1,055 Disposals of fixed assets — — — — Acquisitions — — — — Divestments 0.14 — — — Associate investments — — — — Other investment/(outflows) (45.4) — (105.0) — Investing cash flow (682.2) (400.0) (505.0) (350.0) Equity raised — 1,980 — — Dividends paid — (200.1) (427.5) (601.5) Net borrowings 587 (1,000) — — Other financing cash flow (102.9) — — — Financing cash flow 484.5 779.9 (427.5) (601.5) Total cash flow 242 1,509 29 453 Adjustments — — — — Net change in cash 242 1,509 29 453
Balance sheet (NT$ mn) 12/11A 12/12E 12/13E 12/14E
Cash & cash equivalents 767 2,276 2,305 2,758 Current receivables 1,956 2,017 2,635 3,257 Inventories 475.9 553.1 742.5 963.0 Other current assets 177.5 177.5 177.5 177.5 Current assets 3,376 5,023 5,860 7,156 Property, plant & equip. 1,647 1,911 2,153 2,326 Investments — — 105.0 105.0 Intangibles — — — — Other non-current assets 130.0 130.0 130.0 130.0 Total assets 5,153 7,064 8,248 9,716 Accounts payable 206.2 264.5 368.3 460.9 Short-term debt 1,095 300 300 300 Current provisions — — — — Other current liabilities 336.8 340.7 344.7 348.8 Current liabilities 1,638 905 1,013 1,110 Long-term debt 232.6 232.6 232.6 232.6 Non-current provisions — — — — Other non-current liab. 65.7 65.7 65.7 65.7 Total liabilities 1,936 1,203 1,311 1,408 Shareholders' equity 3,218 5,862 6,938 8,310 Minority interests — — — — Total liabilities & equity 5,153 7,064 8,248 9,716
Per share data 12/11A 12/12E 12/13E 12/14E
Shares (wtd avg.) (mn) 87.0 90.2 90.3 90.3 EPS (Credit Suisse) (NT$)
9.1 11.9 16.7 21.9 DPS (NT$) — 2.30 4.74 6.66 BVPS (NT$) 37.0 65.0 76.8 92.0 Operating CFPS (NT$) 5.1 12.5 10.6 15.6
Key ratios and valuation 12/11A 12/12E 12/13E 12/14E
Growth(%) Sales revenue 33.0 18.8 34.2 27.0 EBIT 37.5 28.3 39.8 30.9 Net profit 42.2 35.1 40.7 31.2 EPS 40.3 30.3 40.5 31.2 Margins (%) EBITDA 35.0 36.8 37.7 38.4 EBIT 30.8 33.3 34.7 35.7 Pre-tax profit 29.8 32.7 34.3 35.4 Net profit 24.4 27.8 29.1 30.1 Valuation metrics (x) P/E 46.2 35.4 25.2 19.2 P/B 11.4 6.5 5.5 4.6 Dividend yield (%) — 0.55 1.13 1.59 P/CF 83.0 33.5 39.4 27.0 EV/sales 11.9 9.4 7.0 5.5 EV/EBITDA 34.0 25.6 18.6 14.2 EV/EBIT 38.6 28.3 20.2 15.3 ROE analysis (%) ROE 29.9 23.5 23.5 25.9 ROIC 27.2 27.6 32.8 35.4 Asset turnover (x) 0.63 0.54 0.63 0.67 Interest burden (x) 0.97 0.98 0.99 0.99 Tax burden (x) 0.82 0.85 0.85 0.85 Financial leverage (x) 1.60 1.21 1.19 1.17 Credit ratios Net debt/equity (%) 17.4 (29.7) (25.5) (26.8) Net debt/EBITDA (x) 0.49 (1.23) (0.91) (0.88) Interest cover (x) 24 31 87 115
Source: Company data, our estimates
0
1
2
3
4
5
6
7
May-12 Jul-12 Sep-12 Nov-12 Jan-13
12MF P/B multiple
Source: IBES
0
5
10
15
20
25
30
May-12 Jul-12 Sep-12 Nov-12 Jan-13
12MF P/E multiple

01 March 2013
Taiwan Contact Lens Sector 13
Established leadership in the fastest-growing market Company description
Hydron was first introduced in China in 1985 by Allergan, an US-based multi-specialty
health care company. In 1995, the Tsai family acquired Hydron’s facilities, formed a
company and later renamed it as Haichang Contact Lens in 1997. The holding company,
Ginko International (the listed entity), was founded in 2007, owning 100% in Haichang
Contact Lens and Jiangsu Horien Contact Lens, which run major operations in China.
Ginko acquired Yung Sheng Optical in 2010 and relocated the plant to Central Taiwan
Science Park, paving way for launching high-end made-in-Taiwan contact lens.
The founder of Ginko, Mr Tsai Kuo Chou has been engaged with the optical industry
across the Straits for more than 30 years. Tsai was once the biggest supplier to Formosa
Optical (5312.TW) owned by the Wang family. In 2001, Mr. Tsai lent NT$200m to bridge
the Wang family’s fleeting cash crunch and took over ownership of the company. Notably,
the Wang family still owns China Bao Dao Optical (unlisted), the biggest contact lens retail
chain in China with over 1,200 point-of-sales (POS) in 80 cities across the country. Ginko’s
products could easily penetrate into each China Bao Dao store owing to Mr Tsai’s strong
relationship with the Wang family. Formosa Optical is also Taiwan’s No.1 optical frame
retailer with 20% market share through multiple brands. We believe Tsai’s expertise in the
industry and extensive channel coverage provides Ginko an essentially uncontested
advantages over peers.
Based in Jiangsu, Ginko manufactures and distributes its own brand Hydron (mid-to-high
end) and Horien (mid-to-low end) across China through its extensive distribution network.
With 62,000 POS in the country, the company holds No.1 market share in both contact
lens (28%) and lens solution (41%) markets, and is gaining share from multi-national
brands such as J&J and CIBA vision. In 3Q12, contact lens and solution accounted for
56% and 44% of total sales, respectively. In particular, longer-cycled products such as
annual/semi-annual disposable lens represented two-thirds of Ginko’s contact lens sales,
as China market is dominated by annual/semi-annual disposal lens with a 70% share,
according to management. The company runs two production lines in Taiwan and four in
China with total capacity of 85.1 mn pieces, as at end-2012. Most of Ginko’s capacity are
mold-casting, a manufacturing method injecting monomer plastic into a mold, which is
designed for short-cycled disposable products. Ginko also sells the cleaning solution for
the lenses with gross margins as high as 65%. However, solution sales are expected to
fall in weighting as management expects disposable contact lens sales to outgrow
annual/semi-annual lens in the coming years. The company’s capacity for solution is 56
mn bottles, as of end-2012.
Ginko holds No.1 market
share in both contact lens
(28%) and solution (41%)
markets
Tsai family acquired
Hydron’s China assets in
1995
Leveraging on China’s
biggest contact lens
channel, China Bao Dao
Optical with over 1,200
point-of-sales

01 March 2013
Taiwan Contact Lens Sector 14
Figure 33: Company structure Figure 34: Shareholding structure
New Path Int'l(Formosa Optics,
5312.TW)
Crimson Hydron International
(Tsai Family)Other
Ginko International(8406.TW)
18.9% 20.3% 42.0% 18.8%
Source: Company data Source: Company data
Figure 35: 3Q12 sales mix by product Figure 36: 3Q12 sales mix by channel
Annual 21%
Semi-annual
16%
Quarterly6%
Monthly5%
Daily8%
Solution44%
Retail30%
Wholesale68%
Export2%
Source: Company data Source: Company data
Figure 37: China market is still dominated by annual/semi-
annual disposal lens
Figure 38: Biggest sales channel in China
42%
17%
57%
38%
10%53%
33%
34%
48%
30%
10%
28%
70%
30%
0%
10%
20%
30%
40%
50%
60%
70%
80%
90%
100%
Europe America Apac Global China
Daily Bi-weekly Monthly Semi-annual & annual Other
-
10,000
20,000
30,000
40,000
50,000
60,000
70,000
Hydron/Horien B&L Weicon J&J
POS in China
Source: Company data, Credit Suisse estimates Source: Ginko, Credit Suisse research
We expect China contact lens market to see a 19.8%
CAGR during 2012-16
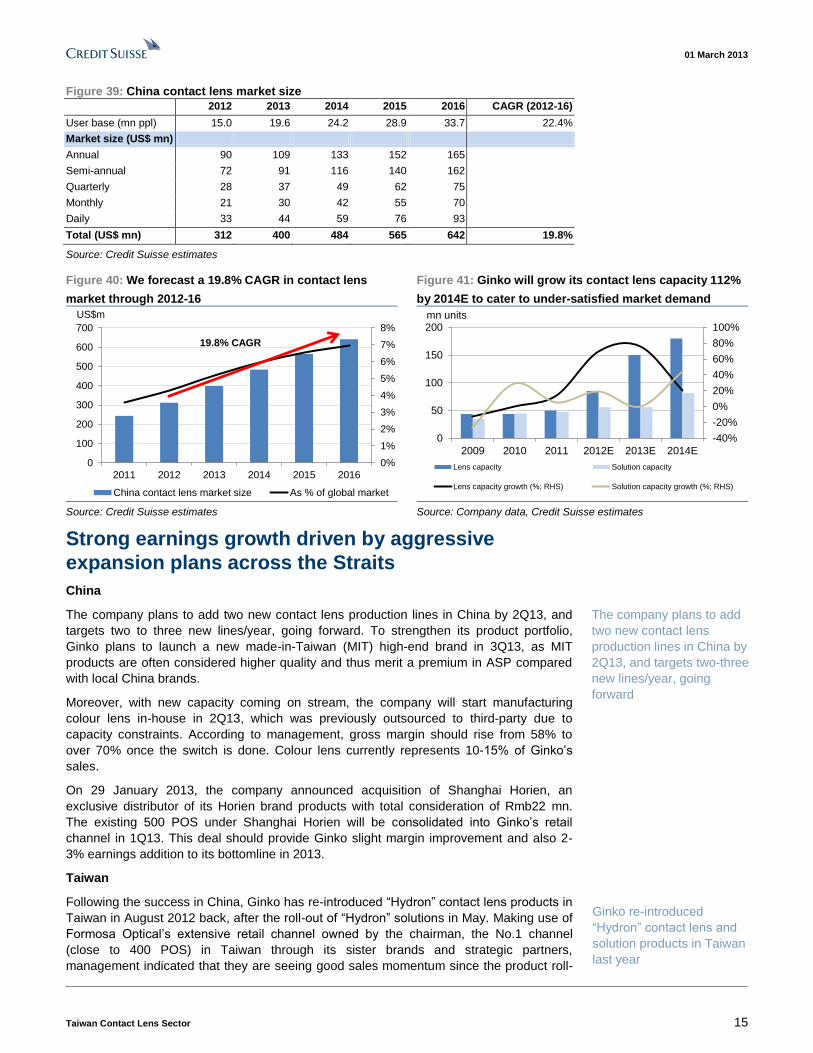
We forecast China’s contact lens market to double from US$312 mn to US$642 mn by
2016, implying a 19.8% CAGR during 2012-16. To cater to under-satisfied market
demand, the company plans to increase its capacity by 95 mn pieces by 2014, or 112%
growth on top of existing capacity which is running at 80-90% utilisation now. Specifically,
Ginko will add two lines in China and three lines in Taiwan by 2Q13E. For solutions, the
company will add one line (25 mn bottles) by 1H14E, representing 44% growth compared
with the current capacity of 56 mn bottles.
We expect China’s contact
lens market to grow to
US$642 mn by 2016
01 March 2013
Taiwan Contact Lens Sector 15
Figure 39: China contact lens market size
2012 2013 2014 2015 2016 CAGR (2012-16)
User base (mn ppl) 15.0 19.6 24.2 28.9 33.7 22.4%
Market size (US$ mn)
Annual 90 109 133 152 165
Semi-annual 72 91 116 140 162
Quarterly 28 37 49 62 75
Monthly 21 30 42 55 70
Daily 33 44 59 76 93
Total (US$ mn) 312 400 484 565 642 19.8%
Source: Credit Suisse estimates
Figure 40: We forecast a 19.8% CAGR in contact lens
market through 2012-16
Figure 41: Ginko will grow its contact lens capacity 112%
by 2014E to cater to under-satisfied market demand
0%
1%
2%
3%
4%
5%
6%
7%
8%
0
100
200
300
400
500
600
700
2011 2012 2013 2014 2015 2016
US$m
China contact lens market size As % of global market
19.8% CAGR
-40%
-20%
0%
20%
40%
60%
80%
100%
0
50
100
150
200
2009 2010 2011 2012E 2013E 2014E
mn units
Lens capacity Solution capacity
Lens capacity growth (%; RHS) Solution capacity growth (%; RHS)
Source: Credit Suisse estimates Source: Company data, Credit Suisse estimates
Strong earnings growth driven by aggressive
expansion plans across the Straits
China
The company plans to add two new contact lens production lines in China by 2Q13, and
targets two to three new lines/year, going forward. To strengthen its product portfolio,
Ginko plans to launch a new made-in-Taiwan (MIT) high-end brand in 3Q13, as MIT
products are often considered higher quality and thus merit a premium in ASP compared
with local China brands.
Moreover, with new capacity coming on stream, the company will start manufacturing
colour lens in-house in 2Q13, which was previously outsourced to third-party due to
capacity constraints. According to management, gross margin should rise from 58% to
over 70% once the switch is done. Colour lens currently represents 10-15% of Ginko’s
sales.
On 29 January 2013, the company announced acquisition of Shanghai Horien, an
exclusive distributor of its Horien brand products with total consideration of Rmb22 mn.
The existing 500 POS under Shanghai Horien will be consolidated into Ginko’s retail
channel in 1Q13. This deal should provide Ginko slight margin improvement and also 2-
3% earnings addition to its bottomline in 2013.
Taiwan
Following the success in China, Ginko has re-introduced “Hydron” contact lens products in
Taiwan in August 2012 back, after the roll-out of “Hydron” solutions in May. Making use of
Formosa Optical’s extensive retail channel owned by the chairman, the No.1 channel
(close to 400 POS) in Taiwan through its sister brands and strategic partners,
management indicated that they are seeing good sales momentum since the product roll-
The company plans to add
two new contact lens
production lines in China by
2Q13, and targets two-three
new lines/year, going
forward
Ginko re-introduced
“Hydron” contact lens and
solution products in Taiwan
last year
01 March 2013
Taiwan Contact Lens Sector 16
out and expect 5% sales contribution this year with bi-weekly and colour lens to be
launched in 1Q13. Management also expects the launch of Hydron products in Taiwan to
help build the brand image for its upcoming new MIT premium brand in China this year.
Improved profitability
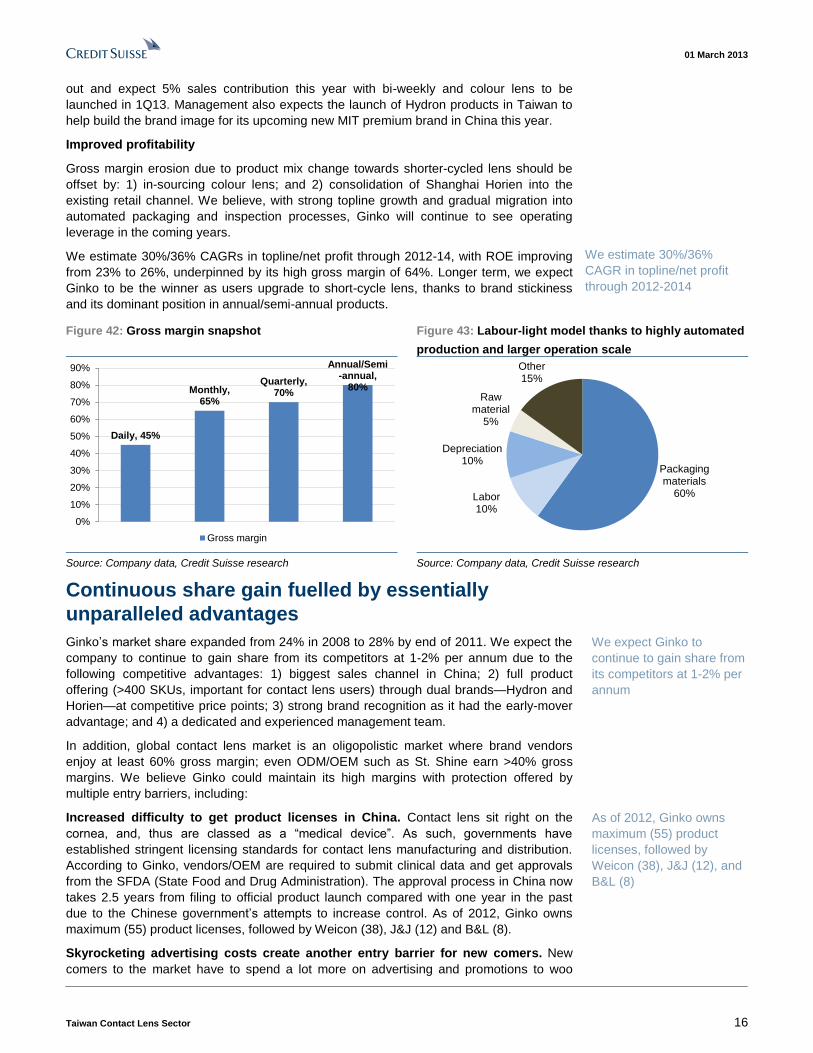
Gross margin erosion due to product mix change towards shorter-cycled lens should be
offset by: 1) in-sourcing colour lens; and 2) consolidation of Shanghai Horien into the
existing retail channel. We believe, with strong topline growth and gradual migration into
automated packaging and inspection processes, Ginko will continue to see operating
leverage in the coming years.
We estimate 30%/36% CAGRs in topline/net profit through 2012-14, with ROE improving
from 23% to 26%, underpinned by its high gross margin of 64%. Longer term, we expect
Ginko to be the winner as users upgrade to short-cycle lens, thanks to brand stickiness
and its dominant position in annual/semi-annual products.
Figure 42: Gross margin snapshot Figure 43: Labour-light model thanks to highly automated
production and larger operation scale
Daily, 45%
Monthly, 65%
Quarterly, 70%
Annual/Semi-annual,
80%
0%
10%
20%
30%
40%
50%
60%
70%
80%
90%
Gross margin
Packaging materials
60%Labor10%
Depreciation10%
Raw material
5%
Other15%
Source: Company data, Credit Suisse research Source: Company data, Credit Suisse research
Continuous share gain fuelled by essentially
unparalleled advantages
Ginko’s market share expanded from 24% in 2008 to 28% by end of 2011. We expect the
company to continue to gain share from its competitors at 1-2% per annum due to the
following competitive advantages: 1) biggest sales channel in China; 2) full product
offering (>400 SKUs, important for contact lens users) through dual brands—Hydron and
Horien—at competitive price points; 3) strong brand recognition as it had the early-mover
advantage; and 4) a dedicated and experienced management team.
In addition, global contact lens market is an oligopolistic market where brand vendors
enjoy at least 60% gross margin; even ODM/OEM such as St. Shine earn >40% gross
margins. We believe Ginko could maintain its high margins with protection offered by
multiple entry barriers, including:
Increased difficulty to get product licenses in China. Contact lens sit right on the
cornea, and, thus are classed as a “medical device”. As such, governments have
established stringent licensing standards for contact lens manufacturing and distribution.
According to Ginko, vendors/OEM are required to submit clinical data and get approvals
from the SFDA (State Food and Drug Administration). The approval process in China now
takes 2.5 years from filing to official product launch compared with one year in the past
due to the Chinese government’s attempts to increase control. As of 2012, Ginko owns
maximum (55) product licenses, followed by Weicon (38), J&J (12) and B&L (8).
Skyrocketing advertising costs create another entry barrier for new comers. New
comers to the market have to spend a lot more on advertising and promotions to woo
We estimate 30%/36%
CAGR in topline/net profit
through 2012-2014
We expect Ginko to
continue to gain share from
its competitors at 1-2% per
annum
As of 2012, Ginko owns
maximum (55) product
licenses, followed by
Weicon (38), J&J (12), and
B&L (8)
01 March 2013
Taiwan Contact Lens Sector 17
customers and make the switch from market leaders who have built up strong brand
loyalty with proven product quality for years. In particular, advertising per second on
Chinese TV costs 5x more now than in 2005, according to Ginko.
Distribution channels preoccupied by market leaders. From a retail channel
perspective, they will not replace bestselling brands with a new brand on their shelves,
given the cash conversion cycle for the latter might be longer — despite more favourable
AR or rebate terms.
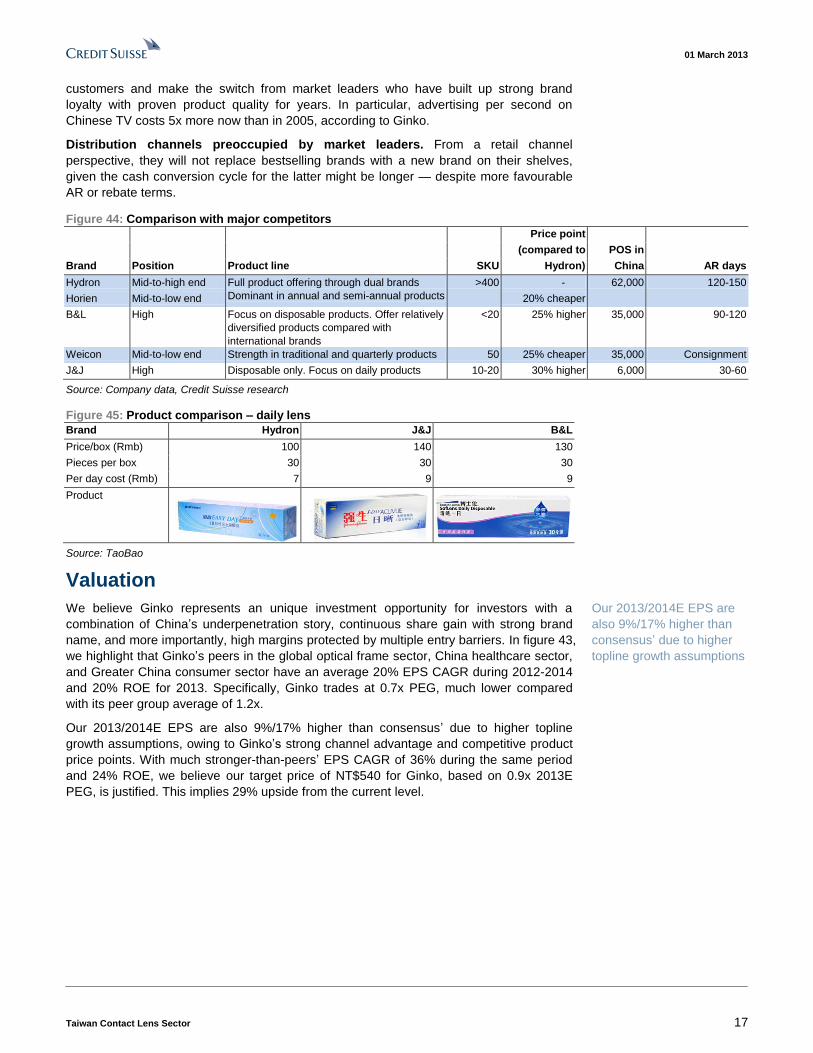
Figure 44: Comparison with major competitors
Price point
(compared to POS in
Brand Position Product line SKU Hydron) China AR days
Hydron Mid-to-high end Full product offering through dual brands
Dominant in annual and semi-annual products
>400 - 62,000 120-150
Horien Mid-to-low end 20% cheaper
B&L High Focus on disposable products. Offer relatively
diversified products compared with
international brands
<20 25% higher 35,000 90-120
Weicon Mid-to-low end Strength in traditional and quarterly products 50 25% cheaper 35,000 Consignment
J&J High Disposable only. Focus on daily products 10-20 30% higher 6,000 30-60
Source: Company data, Credit Suisse research
Figure 45: Product comparison – daily lens
Brand Hydron J&J B&L
Price/box (Rmb) 100 140 130
Pieces per box 30 30 30
Per day cost (Rmb) 7 9 9
Product
Source: TaoBao
Valuation
We believe Ginko represents an unique investment opportunity for investors with a
combination of China’s underpenetration story, continuous share gain with strong brand
name, and more importantly, high margins protected by multiple entry barriers. In figure 43,
we highlight that Ginko’s peers in the global optical frame sector, China healthcare sector,
and Greater China consumer sector have an average 20% EPS CAGR during 2012-2014
and 20% ROE for 2013. Specifically, Ginko trades at 0.7x PEG, much lower compared
with its peer group average of 1.2x.
Our 2013/2014E EPS are also 9%/17% higher than consensus’ due to higher topline
growth assumptions, owing to Ginko’s strong channel advantage and competitive product
price points. With much stronger-than-peers’ EPS CAGR of 36% during the same period
and 24% ROE, we believe our target price of NT$540 for Ginko, based on 0.9x 2013E
PEG, is justified. This implies 29% upside from the current level.
Our 2013/2014E EPS are
also 9%/17% higher than
consensus’ due to higher
topline growth assumptions

01 March 2013
Taiwan Contact Lens Sector 18
Figure 46: Peer valuation comparison
Company Ticker CS Rating Market cap
(US$mn)PER (x) PEG (x)
EPS CAGR
(2012-2014)ROE (%)
St. Shine 1565.TWO NTRL 876 18.3 1.2 15% 15%
Ginko 8406.TWO OPFM 1,305 25.2 0.7 36% 24%
Optical frame
Essilor ESSI.PA NR 20,787 23.9 2.3 10% 16%
Carl Zeiss Meditec AFXG.DE NR 2,490 21.2 1.3 16% 13%
Greater China healthcare
Sinopharm Taiwan 1789.TW NR 1,620 35.3 1.4 24% 14%
Shandong Weigao 1066.HK UPFM 4,166 20.1 1.1 19% 14%
Sino Biopharmaceutical 1177.HK NTRL 2,732 22.1 1.3 17% 21%
Sinopharm group 1099.HK NTRL 7,572 20.7 0.9 24% 13%
Hengan 1044.HK OPFM 12,523 22.5 1.0 23% 30%
Greater China consumer
Wowprime 2727.TW NR 990 18.5 1.7 11% 37%
Gourmet master 2723.TW NR 952 18.4 0.7 25% 22%
Tingyi 0322.HK OPFM 14,815 23.4 0.7 32% 32%
Uni-President China 0220.HK NR 4,222 22.6 1.1 21% 13%
Average 6,624 22.6 1.2 20% 20% Source: Company data, , Bloomberg, Credit Suisse estimates
Figure 47: CS estimates vs consensus—Ginko
FY12E FY13E FY14E
CS Consensus Diff (%) CS Consensus Diff (%) CS Consensus Diff (%)
Sales 3,846 3,861 -0.4% 5,160 4,756 8.5% 6,554 5,733 14.3%
Gross profit 2,478 2,485 -0.3% 3,323 3,038 9.4% 4,172 3,688 13.1%
Gross margin (%) 64.4% 64.4% 0.1% 64.4% 63.9% 0.5% 63.7% 64.3% -0.7%
Operating profit 1,280 1,278 0.2% 1,790 1,634 9.5% 2,342 2,026 15.6%
Operating margin (%) 33.3% 33.1% 0.2% 34.7% 34.4% 0.3% 35.7% 35.3% 0.4%
Net income 1,069 1,080 -1.0% 1,504 1,371 9.7% 1,973 1,690 16.7%
EPS 11.9 12.1 -2.0% 16.7 15.3 9.1% 21.9 18.8 16.5%
Source: Bloomberg, Credit Suisse estimates
Other financial details
Capex. With aggressive expansion plans across the Straits, we forecast NT$400
mn/NT$350 mn capex for 2013/2014, compared with NT$400 mn last year. According to
the company, capex needs can be met by internal cash flow.
Cash management. Management has attributed the relatively higher AR turnover days
(150-160 days if adjusted for VAT/rebate) largely to the business nature that vendors
generally give better settlement terms to distributors as incentives. The company expects
cash conversion cycle to remain stable in the years to come and believes working capital
needs to be fully covered by its strong operating cash flow.
Dividend policy. Payout ratio was low at 0-25% during 2009-2011. Going forward,
company has guided for at least 40% payout. This translates into a 1.1% yield in 2013.
Risks
Risks to our forecasts for Ginko include: 1) margin erosion caused by more aggressive
promotion/price-cut for market share; 2) failure to ramp up contact lens capacity as
scheduled; 3) worse-than-expected sales momentum; and 4) user migration to substitutes
of contact lens – LASIK and silicone hydrogel lens.
We forecast NT$400 mn
and NT$350 mn capex for
2013/2014
Company has guided for at
least 40% dividend payout
01 March 2013
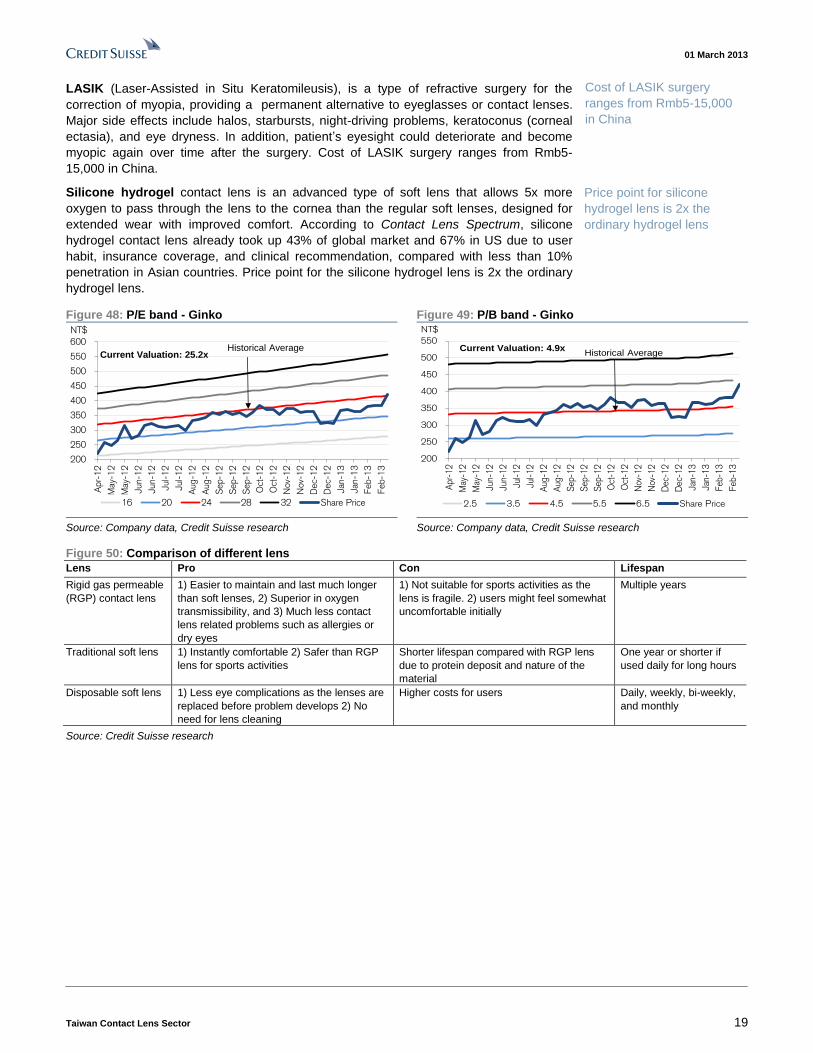
Taiwan Contact Lens Sector 19
LASIK (Laser-Assisted in Situ Keratomileusis), is a type of refractive surgery for the
correction of myopia, providing a permanent alternative to eyeglasses or contact lenses.
Major side effects include halos, starbursts, night-driving problems, keratoconus (corneal
ectasia), and eye dryness. In addition, patient’s eyesight could deteriorate and become
myopic again over time after the surgery. Cost of LASIK surgery ranges from Rmb5-
15,000 in China.
Silicone hydrogel contact lens is an advanced type of soft lens that allows 5x more
oxygen to pass through the lens to the cornea than the regular soft lenses, designed for
extended wear with improved comfort. According to Contact Lens Spectrum, silicone
hydrogel contact lens already took up 43% of global market and 67% in US due to user
habit, insurance coverage, and clinical recommendation, compared with less than 10%
penetration in Asian countries. Price point for the silicone hydrogel lens is 2x the ordinary
hydrogel lens.
Figure 48: P/E band - Ginko Figure 49: P/B band - Ginko
200
250
300
350
400
450
500
550
600
Apr-
12
May-
12
May-
12
Jun-1
2
Jun-1
2
Jul-1
2
Jul-1
2
Aug-1
2
Aug-1
2
Sep-1
2
Sep-1
2
Sep-1
2
Oct
-12
Oct
-12
Nov-
12
Nov-
12
Dec-
12
Dec-
12
Jan-1
3
Jan-1
3
Feb-1
3
Feb-1
3
NT$
16 20 24 28 32 Share Price
Current Valuation: 25.2xHistorical Average
200
250
300
350
400
450
500
550
Apr
-12
May
-12
May
-12
Jun-
12
Jun-
12
Jul-12
Jul-12
Aug
-12
Aug
-12
Sep
-12
Sep
-12
Sep
-12
Oct
-12
Oct
-12
Nov
-12
Nov
-12
Dec
-12
Dec
-12
Jan-
13
Jan-
13
Feb
-13
Feb
-13
NT$
2.5 3.5 4.5 5.5 6.5 Share Price
Current Valuation: 4.9xHistorical Average
Source: Company data, Credit Suisse research Source: Company data, Credit Suisse research
Figure 50: Comparison of different lens
Lens Pro Con Lifespan
Rigid gas permeable
(RGP) contact lens
1) Easier to maintain and last much longer
than soft lenses, 2) Superior in oxygen
transmissibility, and 3) Much less contact
lens related problems such as allergies or
dry eyes
1) Not suitable for sports activities as the
lens is fragile. 2) users might feel somewhat
uncomfortable initially
Multiple years
Traditional soft lens 1) Instantly comfortable 2) Safer than RGP
lens for sports activities
Shorter lifespan compared with RGP lens
due to protein deposit and nature of the
material
One year or shorter if
used daily for long hours
Disposable soft lens 1) Less eye complications as the lenses are
replaced before problem develops 2) No
need for lens cleaning
Higher costs for users Daily, weekly, bi-weekly,
and monthly
Source: Credit Suisse research
Cost of LASIK surgery
ranges from Rmb5-15,000
in China
Price point for silicone
hydrogel lens is 2x the
ordinary hydrogel lens

01 March 2013
Taiwan Contact Lens Sector 20
Asia Pacific / Taiwan
St. Shine
(1565.TWO / 1565 TT)
Near-term strengths already priced in
■ We initiate coverage on St. Shine with NEUTRAL rating and target price
of NT$504 (downside potential of 1%). St. Shine is the fifth-largest contact
lens maker in the world with its global market share quadrupling from 0.4%
in 2003 to 1.6% in 2011. We forecast St. Shine to continue to gain share
from the big four and reach 2.3% by 2014, given its proven product quality,
competitive pricing and long-term relationships with well-diversified client
portfolio.
■ An 18% capacity expansion in 2013 based on actual demand to drive
sales growth. St. Shine’s management has a very conservative approach to
capacity expansion and do not expand capacity unless they have secured
orders from clients. In Sept-12, management announced it would increase
capacity by 18% by 2Q13 as existing facilities are running at 130% utilisation
yet were unable to meet client demand. With new capacity coming on stream,
we estimate 17%/15% CAGRs in topline/net profit through 2012-14, with
GPM dropping from 44% in 2012 to 42.8% in 2013 and 41.8% in 2014 due
to adverse product mix change.
■ Concerns over longer-term growth in the absence of China story. With
36% revenue coming from a relatively saturated domestic market, St. Shine
has witnessed growth for Taiwan decelerating to 10% in 2011 and -6% in
2012 compared with a 27% CAGR during 2005-10. In addition, the company
entered China with its own brand Ticon in 2008, but failed to break into the
distribution channels dominated by Hydron and other international brands. St.
Shine has since scaled down its China operation which represents merely
2% of the company’s revenue.
■ Valuation: Despite strong near-term momentum, we are concerned over the
company’s longer-term growth drivers and margin erosion. We set our target
price of NT$504 (flat with trading price) based on 18x 2013E EPS, in line
with its mid-term historical average, implying the stock is fairly valued.
Share price performance
80
100
120
140
160
200
300
400
500
600
Mar-11 Jul-11 Nov-11 Mar-12 Jul-12 Nov-12
Price (LHS) Rebased Rel (RHS)
The price relative chart measures performance against the
TAIWAN SE WEIGHTED INDEX which closed at 7897.98 on
27/02/13
On 27/02/13 the spot exchange rate was NT$29.64/US$1
Performance Over 1M 3M 12M Absolute (%) 14.3 19.0 43.1 Relative (%) 11.9 13.7 43.9
Financial and valuation metrics
Year 12/11A 12/12E 12/13E 12/14E Revenue (NT$ mn) 3,396.6 4,081.0 4,823.8 5,564.1 EBITDA (NT$ mn) 1,378.8 1,609.3 1,853.1 2,057.2 EBIT (NT$ mn) 1,188.9 1,419.4 1,635.6 1,830.7 Net profit (NT$ mn) 1,066.8 1,201.4 1,410.7 1,579.4 EPS (CS adj.) (NT$) 21.16 23.83 27.98 31.33 Change from previous EPS (%) n.a. Consensus EPS (NT$) n.a. 23.4 26.6 30.7 EPS growth (%) 22.3 12.6 17.4 12.0 P/E (x) 24.2 21.4 18.3 16.3 Dividend yield (%) 2.8 3.0 3.5 4.1 EV/EBITDA (x) 18.2 15.5 13.4 11.8 P/B (x) 9.2 8.0 6.9 6.1 ROE (%) 40.5 39.9 40.6 39.6 Net debt/equity (%) net cash net cash net cash net cash
Source: Company data, our estimates.
Rating NEUTRAL* Price (27 Feb 13, NT$) 511.00 Target price (NT$) 504.00¹ Upside/downside (%) -1.4 Mkt cap (NT$ mn) 25,762.8 (US$ 869.2) Enterprise value (NT$ mn) 24,923 Number of shares (mn) 50.42 Free float (%) 79.7 52-week price range 528.0 - 288.5 ADTO - 6M (US$ mn) 3.7
*Stock ratings are relative to the coverage universe in each
analyst's or each team's respective sector.
¹Target price is for 12 months.
Research Analysts
Jeremy Chen
886 2 2715 6368

01 March 2013
Taiwan Contact Lens Sector 21
Focus charts Figure 51: 2011 sales mix by region Figure 52: 2011 sales mix by product
Asia, 47%
Domestic, 36%
Europe, 14%
America, 3%
Daily, 52%
Specialty, 31%
Non-daily , 17%
Source: Company data Source: Company data
Figure 53: We expect accelerated share gain in global
market through 2012-14…
Figure 54: … underpinned by continuous capacity
expansion
0.0%
0.5%
1.0%
1.5%
2.0%
2.5%
0
1,000
2,000
3,000
4,000
5,000
6,000
7,000
8,000
9,000
2003 2004 2005 2006 2007 2008 2009 2010 2011 2012F2013F2014F
US$m
Global contact lens market yoy growth (%; RHS)
-
50
100
150
200
250
300
350
400
450
2004 2005 2006 2007 2008 2009 2010 2011 2012F 2013F 2014F
mn pcs
St. Shine capacity
Source: Company data, Credit Suisse estimates Source: Company data, Credit Suisse estimates
Figure 55: Significant sales pick-up since Aug-12 thanks
to new colour lens orders from a major Japanese client
Figure 56: FINI holding vs share price
0%
5%
10%
15%
20%
25%
30%
35%
40%
45%
-
50
100
150
200
250
300
350
400
450
NT$mn
St. Shine monthly sales yoy growth (%; RHS)
10%15%20%25%
30%35%40%
45%50%55%
0
100
200
300
400
500
600
Ja
n-0
7
Ju
n-0
7
No
v-0
7
Apr-
08
Sep
-08
Fe
b-0
9
Ju
l-0
9
De
c-0
9
Ma
y-1
0
Oct-
10
Mar-
11
Aug-1
1
Jan-1
2
Jun-1
2
Nov-1
2NT$
Share price FINI holding (%; RHS) Source: TEJ Source: TEJ
01 March 2013
Taiwan Contact Lens Sector 22
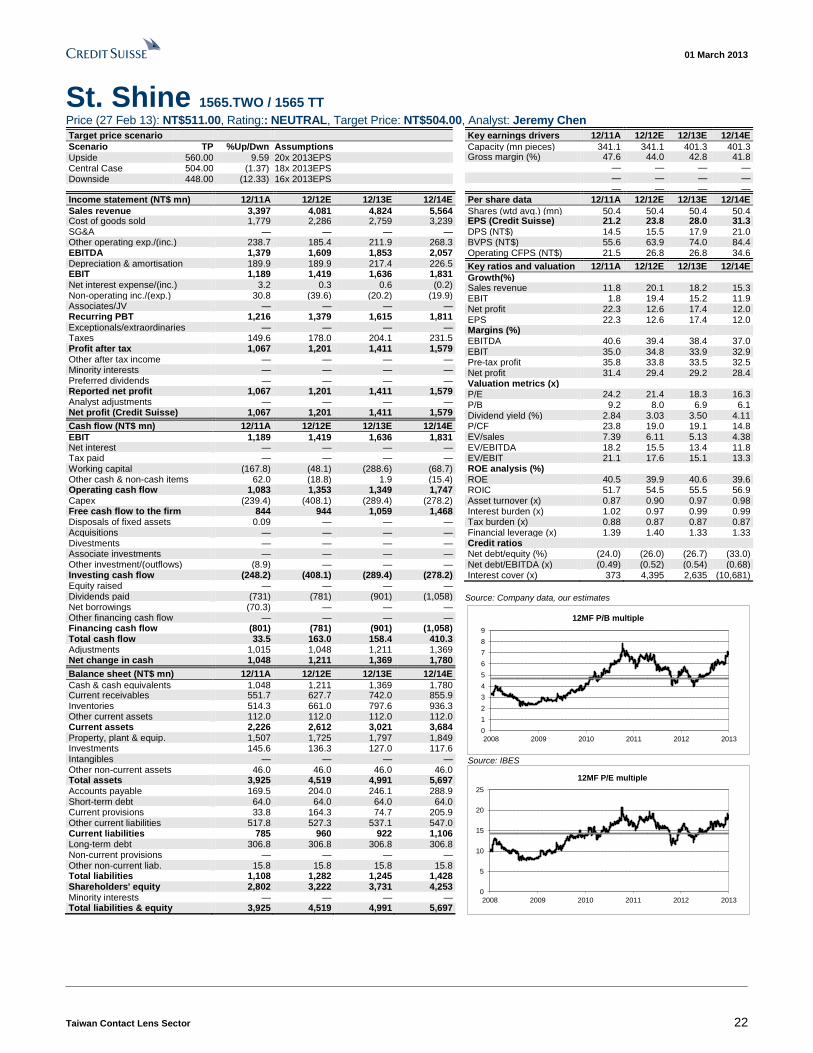
St. Shine 1565.TWO / 1565 TT Price (27 Feb 13): NT$511.00, Rating:: NEUTRAL, Target Price: NT$504.00, Analyst: Jeremy Chen
Target price scenario
Scenario TP %Up/Dwn Assumptions
Upside 560.00 9.59 20x 2013EPS Central Case 504.00 (1.37) 18x 2013EPS Downside 448.00 (12.33) 16x 2013EPS
Key earnings drivers 12/11A 12/12E 12/13E 12/14E
Capacity (mn pieces) 341.1 341.1 401.3 401.3 Gross margin (%) 47.6 44.0 42.8 41.8 — — — — — — — — — — — —
Income statement (NT$ mn) 12/11A 12/12E 12/13E 12/14E
Sales revenue 3,397 4,081 4,824 5,564 Cost of goods sold 1,779 2,286 2,759 3,239 SG&A — — — — Other operating exp./(inc.) 238.7 185.4 211.9 268.3 EBITDA 1,379 1,609 1,853 2,057 Depreciation & amortisation 189.9 189.9 217.4 226.5 EBIT 1,189 1,419 1,636 1,831 Net interest expense/(inc.) 3.2 0.3 0.6 (0.2) Non-operating inc./(exp.) 30.8 (39.6) (20.2) (19.9) Associates/JV — — — — Recurring PBT 1,216 1,379 1,615 1,811 Exceptionals/extraordinaries — — — — Taxes 149.6 178.0 204.1 231.5 Profit after tax 1,067 1,201 1,411 1,579 Other after tax income — — — — Minority interests — — — — Preferred dividends — — — — Reported net profit 1,067 1,201 1,411 1,579 Analyst adjustments — — — — Net profit (Credit Suisse) 1,067 1,201 1,411 1,579
Cash flow (NT$ mn) 12/11A 12/12E 12/13E 12/14E
EBIT 1,189 1,419 1,636 1,831 Net interest — — — — Tax paid — — — — Working capital (167.8) (48.1) (288.6) (68.7) Other cash & non-cash items 62.0 (18.8) 1.9 (15.4) Operating cash flow 1,083 1,353 1,349 1,747 Capex (239.4) (408.1) (289.4) (278.2) Free cash flow to the firm 844 944 1,059 1,468 Disposals of fixed assets 0.09 — — — Acquisitions — — — — Divestments — — — — Associate investments — — — — Other investment/(outflows) (8.9) — — — Investing cash flow (248.2) (408.1) (289.4) (278.2) Equity raised — — — — Dividends paid (731) (781) (901) (1,058) Net borrowings (70.3) — — — Other financing cash flow — — — — Financing cash flow (801) (781) (901) (1,058) Total cash flow 33.5 163.0 158.4 410.3 Adjustments 1,015 1,048 1,211 1,369 Net change in cash 1,048 1,211 1,369 1,780
Balance sheet (NT$ mn) 12/11A 12/12E 12/13E 12/14E
Cash & cash equivalents 1,048 1,211 1,369 1,780 Current receivables 551.7 627.7 742.0 855.9 Inventories 514.3 661.0 797.6 936.3 Other current assets 112.0 112.0 112.0 112.0 Current assets 2,226 2,612 3,021 3,684 Property, plant & equip. 1,507 1,725 1,797 1,849 Investments 145.6 136.3 127.0 117.6 Intangibles — — — — Other non-current assets 46.0 46.0 46.0 46.0 Total assets 3,925 4,519 4,991 5,697 Accounts payable 169.5 204.0 246.1 288.9 Short-term debt 64.0 64.0 64.0 64.0 Current provisions 33.8 164.3 74.7 205.9 Other current liabilities 517.8 527.3 537.1 547.0 Current liabilities 785 960 922 1,106 Long-term debt 306.8 306.8 306.8 306.8 Non-current provisions — — — — Other non-current liab. 15.8 15.8 15.8 15.8 Total liabilities 1,108 1,282 1,245 1,428 Shareholders' equity 2,802 3,222 3,731 4,253 Minority interests — — — — Total liabilities & equity 3,925 4,519 4,991 5,697
Per share data 12/11A 12/12E 12/13E 12/14E
Shares (wtd avg.) (mn) 50.4 50.4 50.4 50.4 EPS (Credit Suisse) (NT$)
21.2 23.8 28.0 31.3 DPS (NT$) 14.5 15.5 17.9 21.0 BVPS (NT$) 55.6 63.9 74.0 84.4 Operating CFPS (NT$) 21.5 26.8 26.8 34.6
Key ratios and valuation 12/11A 12/12E 12/13E 12/14E
Growth(%) Sales revenue 11.8 20.1 18.2 15.3 EBIT 1.8 19.4 15.2 11.9 Net profit 22.3 12.6 17.4 12.0 EPS 22.3 12.6 17.4 12.0 Margins (%) EBITDA 40.6 39.4 38.4 37.0 EBIT 35.0 34.8 33.9 32.9 Pre-tax profit 35.8 33.8 33.5 32.5 Net profit 31.4 29.4 29.2 28.4 Valuation metrics (x) P/E 24.2 21.4 18.3 16.3 P/B 9.2 8.0 6.9 6.1 Dividend yield (%) 2.84 3.03 3.50 4.11 P/CF 23.8 19.0 19.1 14.8 EV/sales 7.39 6.11 5.13 4.38 EV/EBITDA 18.2 15.5 13.4 11.8 EV/EBIT 21.1 17.6 15.1 13.3 ROE analysis (%) ROE 40.5 39.9 40.6 39.6 ROIC 51.7 54.5 55.5 56.9 Asset turnover (x) 0.87 0.90 0.97 0.98 Interest burden (x) 1.02 0.97 0.99 0.99 Tax burden (x) 0.88 0.87 0.87 0.87 Financial leverage (x) 1.39 1.40 1.33 1.33 Credit ratios Net debt/equity (%) (24.0) (26.0) (26.7) (33.0) Net debt/EBITDA (x) (0.49) (0.52) (0.54) (0.68) Interest cover (x) 373 4,395 2,635 (10,681)
Source: Company data, our estimates
0
1
2
3
4
5
6
7
8
9
2008 2009 2010 2011 2012 2013
12MF P/B multiple
Source: IBES
0
5
10
15
20
25
2008 2009 2010 2011 2012 2013
12MF P/E multiple

01 March 2013
Taiwan Contact Lens Sector 23
Near-term strengths already priced in Company description
The company was founded in 1981 by a consortium of experts in the contact lens industry
and was renamed as St. Shine Optical in 1986. Since its first cast-molding capacity set up
in 1992, St. Shine has successfully completed ISO system assessments, CE Certification
(Europe), FDA inspection (US) for production, and is GMP certified by the Taiwan health
authorities for both lathe-cut and cast-molding production lines over the years. For the past
25 years, St. Shine is providing a wide variety of products to more than 500 customers.
Most of its customers are distributors or medical suppliers who want to start their own
disposable contact lens brand. St. Shine’s products range from conventional lathe-cut to
cast-molding, from RGP (rigid gas permeable) lens to soft contact lens, and from longer-
cycled lens to disposable daily lens. The company also has its own brand named Ticon in
Taiwan, controlling 30% of the domestic market, following No.1 J&J (35%) closely.
In 2011, St. Shine derived 36% of total revenue from the domestic market with own brand
Ticon and the remaining 64% from OEM/ODM business, of which, 47% came from Asia,
14% from Europe, and 3% from America. By product mix, daily products contribute 52% to
overall sales, followed by specialty lens (traditional, toric and colour lens, 31%) and non-
daily disposable lens (17%). As of 2012, gross margin for Ticon could reach 55–60%
versus 35–50% for OEM/ODM products. By 2011, St. Shine ranked as the fifth-largest
contact lens maker in the world with 1.6% market share globally, following J&J (42%),
CIBA (25%), Cooper (17%) and B&L (11%).
As at end-2012, St. Shine ran 34 production lines (total capacity of 341 mn pieces) with all
its four factories located in New Taipei City. Most of St. Shine’s capacity are mold-casting,
similar to Ginko’s. To provide clients with various product specs, it requires intensive
labour participation in the manufacturing and packaging processes, and the company has
employed more than 2,000 staff by end-2012. Thus, labor cost accounts for 40% in COGS,
followed by packaging materials (20%), depreciation (10%) and raw material (3%).
Figure 57: Shareholding structure Figure 58: Cost structure comparison
FINI Management Other
St. Shine (1565.TW)
46.9% 10.1% 43.0%
60%
20%
10%
40%
10%
10%
5%
3%
15%27%
0%
20%
40%
60%
80%
100%
Ginko St. Shine
Packaging materials Labor Depreciation Raw material Other
Source: Company data Source: Company data, Credit Suisse research
An 18% capacity expansion in 2013 based on actual
demand to drive sales growth
St. Shine’s management have a very conservative approach to capacity expansion and
they do not expand capacity unless they have secured orders from clients. In September
2012, management announced their plan to add six product lines on top of the existing 34
which are running at 130% utilisation based on three shifts as they were still unable to
For the past 25 years, St.
Shine has provided a wide
variety of products for more
than 500 customers
(primarily distributors and
medial suppliers)
St. Shine is fifth-largest
contact lens maker in the
world and No.2 player in
Taiwan
Labour cost accounts for
40% in COGS, followed by
packaging materials (20%),
depreciation (10%) and raw
material (3%).

01 March 2013
Taiwan Contact Lens Sector 24
meet client demand. Total capex of NT$220 mn was invested starting 4Q12 and the
expansion will be completed by 2Q13. This will bring St. Shine’s total capacity from 341
mn pieces in 2012 to approximately 400 mn pieces, or 18% YoY growth.
Concerns over longer-term growth in the absence of
China story
Domestic market
St. Shine has been gaining shares in the domestic market since its listing in 2004, with
market share soaring from 14% in 2005 to 30% in 2012, thanks to its competitive price
points, strong brand image, and proven product quality.
With 36% revenue coming from a relatively saturated domestic market, St. Shine has
witnessed growth for Taiwan decelerating to 10% in 2011 and -6% in 2012 compared with
a 27% CAGR during 2005-10. We do not expect high growth in the Taiwan market to
continue in the coming years as: 1) the market has been saturated with contact lens
penetration reaching 25%, one of the highest in the world; 2) limited room for further share
gain due to intensifying competition—several tech companies have diversified into this
field lately, including Pegavision (Pegatron), Miacare (BenQ group), Largan Med (Largan),
etc. In addition, Hydron, the No.1 brand in China under Ginko International, was also
introduced in Taiwan last year. Looking ahead, management expects flat growth for
domestic market and target to maintain market share at 30%.
Japan
Japan is one of the largest contact lens markets in the world, representing approximately
20% of the global market (61% of Asia), thanks to high penetration (24%) and use of
contact lens for cosmetic purposes. Despite the overall contact lens market slowing to a
2% CAGR over the past five years, St. Shine has managed to maintain sales growth at
~20% per annum on the back of a diversified customer portfolio.
Sales momentum has picked up since August and the company posted 30-40% YoY
growth in six consecutive months. Management attributed the strong growth momentum to
new daily colour lens orders from a major Japanese client. We expect the strength to
continue into 1H13 as management should secure more orders from the client. This
compares to only 7% sales growth in 1H12.
China
The company has also entered China with its own brand Ticon in 2008, but failed to break
into the distribution channels dominated by Hydron and other international brands. St.
Shine has since scaled down its China operation, which currently represents only 2% of
the company’s revenue. In the near future, St. Shine will continue to focus on OEM/ODM
for the overseas markets, according to management.
Ongoing margin erosion due to adverse product mix change
We expect blended GPM to drop from 44% in 2012 to 42.8% in 2013 and 41.8% in 2014 due
to: 1) higher revenue contribution from low margin daily colour lens business (GPM: 40%)—
specifically, all six lines of St. Shine’s new capacity will be used for daily colour lens
production at the very beginning; 2) flattish growth from high-margin own-brand business
(GPM: 55-60%). On the other hand, management also expect some operating leverage on
advertising costs as the company has built a strong brand image in Taiwan over the years.
All in all, we estimate 17%/15% CAGRs in topline/net profit through 2012-14.
We expect 18% capacity
growth in 2013 based on
actual demand
Growth for Taiwan market
has decelerated sharply in
the past two years
Sales has picked up
significantly since Aug-12
due to new colour lens order
from a major Japanese
client
We expect blended GPM to
drop from 44% in 2012 to
42.8% in 2013 and 41.8% in
2014

01 March 2013
Taiwan Contact Lens Sector 25
Figure 59: While sales picked up significantly since Aug-
12 due to new colour lens orders from a Japanese client…
Figure 60: …domestic market saw growth decelerating
sharply
0%
5%
10%
15%
20%
25%
30%
35%
40%
45%
-
50
100
150
200
250
300
350
400
450
NT$mn
St. Shine monthly sales yoy growth (%; RHS)
-10%
0%
10%
20%
30%
40%
50%
-
200
400
600
800
1,000
1,200
1,400
2005 2006 2007 2008 2009 2010 2011 2012
NT$mn
Taiwan sales yoy growth (%; RHS)
Source: TEJ Source: Company data, Credit Suisse research
Figure 61: Product comparison – Taiwan market
Brand Ticon (St. Shine) J&J Hydron (Ginko) Miacare (BenQ) Pegavision (Pegatron)
Price/box (NT$) 450 550 370 450 250
Pieces per box 30 30 30 20 30
Per day cost (NT$) 30 37 25 45 17
Lens type Hydrogel Hydrogel Hydrogel Silicone hydrogel Hydrogel
Endorsement Mike Ho ZhenDong Ke Jolin Tsai Janine Chang None
Source: Company data, Credit Suisse estimates
Valuation
In the figure below, we highlight that St. Shine’s peers in the global optical frame sector,
China healthcare sector, and Greater China consumer sector have an average of 20%
EPS CAGR during 2012-14E and 20% ROE for 2013E. These companies are mostly
trading at 20-24x 2013E EPS. Despite higher ROE, we are more concerned over St.
Shine’s longer-term growth drivers and margin erosion due to adverse product mix
changes and nature of the ODM/OEM business.
As such, we forecast a 15% EPS CAGR during 2012-14 for St. Shine and initiate coverage
with a NEUTRAL rating and set our target price of NT$504 based on 18x FY13E EPS (flat
with trading price), in line with St. Shine’s mid-term historical average, but at a discount to
the peer group average due to lacklustre earnings growth. This implies the stock is fairly
valued at this point.

01 March 2013
Taiwan Contact Lens Sector 26
Figure 62: Peer valuation comparison
Company Ticker CS Rating Market cap
(US$mn)PER (x) PEG (x)
EPS CAGR
(2012-2014)ROE (%)
St. Shine 1565.TWO NTRL 876 18.3 1.2 15% 15%
Ginko 8406.TWO OPFM 1,305 25.2 0.7 36% 24%
Optical frame
Essilor ESSI.PA NR 20,787 23.9 2.3 10% 16%
Carl Zeiss Meditec AFXG.DE NR 2,490 21.2 1.3 16% 13%
Greater China healthcare
Sinopharm Taiwan 1789.TW NR 1,620 35.3 1.4 24% 14%
Shandong Weigao 1066.HK UPFM 4,166 20.1 1.1 19% 14%
Sino Biopharmaceutical 1177.HK NTRL 2,732 22.1 1.3 17% 21%
Sinopharm group 1099.HK NTRL 7,572 20.7 0.9 24% 13%
Hengan 1044.HK OPFM 12,523 22.5 1.0 23% 30%
Greater China consumer
Wowprime 2727.TW NR 990 18.5 1.7 11% 37%
Gourmet master 2723.TW NR 952 18.4 0.7 25% 22%
Tingyi 0322.HK OPFM 14,815 23.4 0.7 32% 32%
Uni-President China 0220.HK NR 4,222 22.6 1.1 21% 13%
Average 6,624 22.6 1.2 20% 20% Source: Company data, Bloomberg, Credit Suisse estimates
Figure 63: CS estimates vs consensus—St. Shine
FY12E FY13E FY14E
CS Consensus Diff (%) CS Consensus Diff (%) CS Consensus Diff (%)
Sales 4,081 4,045 1% 4,824 4,628 4% 5,564 5,329 4%
Gross profit 1,795 1,797 0% 2,065 2,020 2% 2,325 2,334 0%
Gross margin (%) 44.0% 44.4% -0.4% 42.8% 43.6% -0.8% 41.8% 43.8% -2.0%
Operating profit 1,419 1,382 3% 1,636 1,568 4% 1,831 1,812 1%
Operating margin (%) 34.8% 34.2% 0.6% 33.9% 33.9% 0.0% 32.9% 34.0% -1.1%
Net income 1,201 1,182 2% 1,411 1,353 4% 1,579 1,563 1%
EPS 23.8 23.4 2% 28.0 26.6 5% 31.3 30.7 2%
Source: Company data, Credit Suisse estimates
Other financial details
Capex. With most of the capex for the new six product lines spent in 2H12, we model
NT$290 mn/NT$280 mn capex for 2013E/2014E, compared with NT$410 mn last year.
Dividend policy. St. Shine has maintained its payout ratio at over 70% in the past five
years. Management expects the high payout to continue in the coming years. This
translates into a 3.5% yield in 2013.
Risks
Risks to our forecasts on St. Shine include: 1) further margin erosion due to intensifying
competition in the Taiwan market; 2) unfavourable FX movement; 3) potential share loss
to new players in the domestic market; and 4) LASIK.
Unfavourable FX movement. St. Shine’s account receivables (AR) are largely
denominated in USD with an average of 60-65 days. Potential TWD appreciation against
the greenback could expose the company to FX risks as costs are in TWD.
Potential share loss to new players in the domestic market. Given the high margin
nature of the contact lens industry, several tech companies have entered this field with
technological support, such as Pegavision (Pegatron), Miacare (BenQ group), Largan Med
(Largan). In addition, Hydron, the No.1 brand in China under Ginko International, was also
introduced in Taiwan last year.
We forecast NT$290 mn
and NT$280 mn capex for
2013/2014

01 March 2013
Taiwan Contact Lens Sector 27
Figure 64: P/E band – St. Shine Figure 65: FINI holding vs share price
-
100
200
300
400
500
600
Apr-
04
Apr-
05
Apr-
06
Apr-
07
Apr-
08
Apr-
09
Apr-
10
Apr-
11
Apr-
12
NT$
12 14 16 18 20 Share Price
Current Valuation: 18.3x
Historical Average
10%15%20%25%
30%35%40%
45%50%55%
0
100
200
300
400
500
600
Ja
n-0
7
Ju
n-0
7
No
v-0
7
Apr-
08
Sep
-08
Fe
b-0
9
Ju
l-0
9
De
c-0
9
Ma
y-1
0
Oct-
10
Mar-
11
Aug-1
1
Jan-1
2
Jun-1
2
Nov-1
2
NT$
Share price FINI holding (%; RHS)
Source: Company data, Credit Suisse estimates Source: TEJ
Figure 66: Comparison of different lens
Lens Pro Con Lifespan
Rigid gas permeable
(RGP) contact lens
1) Easier to maintain and last much longer
than soft lenses, 2) Superior in oxygen
transmissibility, and 3) Much less contact lens
related problems such as allergies or dry
eyes
1) Not suitable for sports activities as the lens
is fragile. 2) users might feel somewhat
uncomfortable initially
Multiple years
Traditional soft lens 1) Instantly comfortable 2) Safer than RGP
lens for sports activities
Shorter lifespan compared with RGP lens due
to protein deposit and nature of the material
One year or shorter if
used daily for long hours
Disposable soft lens 1) Less eye complications as the lenses are
replaced before problem develops 2) No
need for lens cleaning
Higher costs for users Daily, weekly, bi-weekly,
and monthly
Source: Credit Suisse Research

01 March 2013
Taiwan Contact Lens Sector 28
Companies Mentioned (Price as of 27-Feb-2013)
U-Presid China (0220.HK, HK$9.11) Tingyi (0322.HK, HK$20.45) Hengan International (1044.HK, HK$78.3) Shandong Weigao Group Medical (1066.HK, HK$7.18) Sinopharm Group Co (1099.HK, HK$24.5) Sino Biopharmaceutical Limited (1177.HK, HK$4.29) St. Shine (1565.TWO, NT$511.0, NEUTRAL, TP NT$504.0) SPT (1789.TW, NT$72.8) Gourmet Master (2723.TW, NT$200.0) Wowprime (2727.TW, NT$430.5) Largan Precision (3008.TW, NT$800.0) Pegatron (4938.TW, NT$40.0) B MATERIALS (8215.TW, NT$11.7) Ginko (8406.TWO, NT$420.0, OUTPERFORM[V], TP NT$540.0) Crl Zeis Meditec (AFXG.DE, €23.81) Essilor (ESSI.PA, €74.62) Johnson & Johnson (JNJ.N, $76.32)Cooper Companies Inc (COO.N, $105.50)
Disclosure Appendix
Important Global Disclosures
I, Jeremy Chen, certify that (1) the views expressed in this report accurately reflect my personal views about all of the subject companies and securities and (2) no part of my compensation was, is or will be directly or indirectly related to the specific recommendations or views expressed in this report.
The analyst(s) responsible for preparing this research report received Compensation that is based upon various factors including Credit Suisse's total revenues, a portion of which are generated by Credit Suisse's investment banking activities
As of December 10, 2012 Analysts’ stock rating are defined as follows:
Outperform (O) : The stock’s total return is expected to outperform the relevant benchmark*over the next 12 months.
Neutral (N) : The stock’s total return is expected to be in line with the relevant benchmark* over the next 12 months.
Underperform (U) : The stock’s total return is expected to underperform the relevant benchmark* over the next 12 months.
*Relevant benchmark by region: As of 10th December 2012, Japanese ratings are based on a stock’s total return relative to the analyst's coverage universe which consists of all companies covered by the analyst within the relevant sector, with Outperforms representing the most attractiv e, Neutrals the less attractive, and Underperforms the least attractive investment opportunities. As of 2nd October 2012, U.S. and Canadian as well as European ratings are based on a stock’s total return relative to the analyst's coverage universe which consists of all companies covered by the analyst within the relevant sector, with Outperforms representing the most attractive, Neutrals the less attractive, and Underperforms the least attractive investment opportunities. For Latin Ame rican and non-Japan Asia stocks, ratings are based on a stock’s total return relative to the average total return of the relevant country or regional benchmark; Australia, New Zealand are, and prior to 2nd October 2012 U.S. and Canadian ratings were based on (1) a stock’s absolute total return potential to its current share price and (2) the relative attractiveness of a stock’s total return potential within an analyst’s coverage universe. For Australian and New Zealand stocks, 12 -month rolling yield is incorporated in the absolute total return calculation and a 15% and a 7.5% threshold replace the 10-15% level in the Outperform and Underperform stock rating definitions, respectively. The 15% and 7.5% thresholds replace the +10-15% and -10-15% levels in the Neutral stock rating definition, respectively. Prior to 10th December 2012, Japanese ratings were based on a stock’s total return relative to the average total return of the relevant country or regional benchmark.
Restricted (R) : In certain circumstances, Credit Suisse policy and/or applicable law and regulations preclude certain types of communications, including an investment recommendation, during the course of Credit Suisse's engagement in an investment banking transaction and in certain other circumstances.
Volatility Indicator [V] : A stock is defined as volatile if the stock price has moved up or down by 20% or more in a month in at least 8 of the past 24 months or the analyst expects significant volatility going forward.
Analysts’ sector weightings are distinct from analysts’ stock ratings and are based on the analyst’s expectations for the fundamentals and/or valuation of the sector* relative to the group’s historic fundamentals and/or valuation:
Overweight : The analyst’s expectation for the sector’s fundamentals and/or valuation is favorable over the next 12 months.
Market Weight : The analyst’s expectation for the sector’s fundamentals and/or valuation is neutral over the next 12 months.
Underweight : The analyst’s expectation for the sector’s fundamentals and/or valuation is cautious over the next 12 months.
*An analyst’s coverage sector consists of all companies covered by the analyst within the relevant sector. An analyst may cover multiple sectors.

01 March 2013
Taiwan Contact Lens Sector 29
Credit Suisse's distribution of stock ratings (and banking clients) is:
Global Ratings Distribution
Rating Versus universe (%) Of which banking clients (%)
Outperform/Buy* 43% (54% banking clients)
Neutral/Hold* 38% (47% banking clients)
Underperform/Sell* 16% (39% banking clients)
Restricted 3%
*For purposes of the NYSE and NASD ratings distribution disclosure requirements, our stock ratings of Outperform, Neutral, and Underperform most closely correspond to Buy, Hold, and Sell, respectively; however, the meanings are not the same, as our stock ratings are determined on a relative basis. (Please refer to definitions above.) An investor's decision to buy or sell a security should be based on investment objectives, current holdings, and other individual factors.
Credit Suisse’s policy is to update research reports as it deems appropriate, based on developments with the subject company, the sector or the market that may have a material impact on the research views or opinions stated herein.
Credit Suisse's policy is only to publish investment research that is impartial, independent, clear, fair and not misleading. For more detail please refer to Credit Suisse's Policies for Managing Conflicts of Interest in connection with Investment Research: http://www.csfb.com/research and analytics/disclaimer/managing_conflicts_disclaimer.html
Credit Suisse does not provide any tax advice. Any statement herein regarding any US federal tax is not intended or written to be used, and cannot be used, by any taxpayer for the purposes of avoiding any penalties.
Price Target: (12 months) for St. Shine (1565.TWO)
Method: Our 12-month target price of NT$504 for St. Shine is based on 18x 2013E EPS, which is inline with mid-cycle average in the past three years.
Risk: Risks to our 12-month target price of NT$504 for St. Shine include 1) further margin erosion due to intensifying competition in Taiwan market, 2) unfavourable FX movement, 3) potential share loss to new players in domestic market and 4) LASIK.
Price Target: (12 months) for Ginko (8406.TWO)
Method: Our 12-month target price of NT$540 for Ginko International is based on 0.9x 2013E PEG due to: (1) it being a pure China play with 30%/36% CAGR in top line/net profit through 2012-2014, (2) high ROE, and (3) high margins protected by multiple entry barriers.
Risk: Risks to our 12-month target price of NT$540 for Ginko International include: (1) margin erosion caused by more aggressive promotion/price-cut for market share, (2) failure to ramp up contact lens capacity as scheduled, (3) worse-than-expected sales momentum, and (4) user migration to substitutes of contact lens – LASIK and silicone hydrogel lens.
Please refer to the firm's disclosure website at www.credit-suisse.com/researchdisclosures for the definitions of abbreviations typically used in the target price method and risk sections.
See the Companies Mentioned section for full company names
Credit Suisse expects to receive or intends to seek investment banking related compensation from the subject company (8406.TWO) within the next 3 months.
Important Regional Disclosures
Singapore recipients should contact Credit Suisse AG, Singapore Branch for any matters arising from this research report.
The analyst(s) involved in the preparation of this report have not visited the material operations of the subject company (1565.TWO, 8406.TWO) within the past 12 months
Restrictions on certain Canadian securities are indicated by the following abbreviations: NVS--Non-Voting shares; RVS--Restricted Voting Shares; SVS--Subordinate Voting Shares.
Individuals receiving this report from a Canadian investment dealer that is not affiliated with Credit Suisse should be advised that this report may not contain regulatory disclosures the non-affiliated Canadian investment dealer would be required to make if this were its own report.
For Credit Suisse Securities (Canada), Inc.'s policies and procedures regarding the dissemination of equity research, please visit http://www.csfb.com/legal_terms/canada_research_policy.shtml.
Credit Suisse has sent extracts of this research report to the subject company (1565.TWO, 8406.TWO) prior to publication for the purpose of verifying factual accuracy. Based on information provided by the subject company, factual changes have been made as a result.
As of the date of this report, Credit Suisse acts as a market maker or liquidity provider in the equities securities that are the subject of this report.
Principal is not guaranteed in the case of equities because equity prices are variable.

01 March 2013
Taiwan Contact Lens Sector 30
Commission is the commission rate or the amount agreed with a customer when setting up an account or at any time after that.
Taiwanese Disclosures: This research report is for reference only. Investors should carefully consider their own investment risk. Investment results are the responsibility of the individual investor. Reports may not be reprinted without permission of CS. Reports written by Taiwan based analysts on non-Taiwan listed companies are not considered recommendations to buy or sell securities under Taiwan Stock Exchange Operational Regulations Governing Securities Firms Recommending Trades in Securities to Customers.
To the extent this is a report authored in whole or in part by a non-U.S. analyst and is made available in the U.S., the following are important disclosures regarding any non-U.S. analyst contributors: The non-U.S. research analysts listed below (if any) are not registered/qualified as research analysts with FINRA. The non-U.S. research analysts listed below may not be associated persons of CSSU and therefore may not be subject to the NASD Rule 2711 and NYSE Rule 472 restrictions on communications with a subject company, public appearances and trading securities held by a research analyst account.
Credit Suisse (Hong Kong) Limited Shanghai Representative Office............................................................................................... Jeremy Chen
For Credit Suisse disclosure information on other companies mentioned in this report, please visit the website at www.credit-suisse.com/researchdisclosures or call +1 (877) 291-2683.

01 March 2013
Taiwan Contact Lens Sector 31
References in this report to Credit Suisse include all of the subsidiaries and affiliates of Credit Suisse operating under its investment banking division. For more information on our structure, please use the following link: https://www.credit-suisse.com/who_we_are/en/.This report may contain material that is not directed to, or intended for distribution to or use by, any person or entity who is a citizen or resident of or located in any locality, state, country or other jurisdiction where such distribution, publication, availability or use would be contrary to law or regulation or which would subject Credit Suisse AG or its affiliates ("CS") to any registration or licensing requirement within such jurisdiction. All material presented in this report, unless specifically indicated otherwise, is under copyright to CS. None of the material, nor its content, nor any copy of it, may be altered in any way, transmitted to, copied or distributed to any other party, without the prior express written permission of CS. All trademarks, service marks and logos used in this report are trademarks or service marks or registered trademarks or service marks of CS or its affiliates. The information, tools and material presented in this report are provided to you for information purposes only and are not to be used or considered as an offer or the solicitation of an offer to sell or to buy or subscribe for securities or other financial instruments. CS may not have taken any steps to ensure that the securities referred to in this report are suitable for any particular investor. CS will not treat recipients of this report as its customers by virtue of their receiving this report. The investments and services contained or referred to in this report may not be suitable for you and it is recommended that you consult an independent investment advisor if you are in doubt about such investments or investment services. Nothing in this report constitutes investment, legal, accounting or tax advice, or a representation that any investment or strategy is suitable or appropriate to your individual circumstances, or otherwise constitutes a personal recommendation to you. CS does not advise on the tax consequences of investments and you are advised to contact an independent tax adviser. Please note in particular that the bases and levels of taxation may change. Information and opinions presented in this report have been obtained or derived from sources believed by CS to be reliable, but CS makes no representation as to their accuracy or completeness. CS accepts no liability for loss arising from the use of the material presented in this report, except that this exclusion of liability does not apply to the extent that such liability arises under specific statutes or regulations applicable to CS. This report is not to be relied upon in substitution for the exercise of independent judgment. CS may have issued, and may in the future issue, other communications that are inconsistent with, and reach different conclusions from, the information presented in this report. Those communications reflect the different assumptions, views and analytical methods of the analysts who prepared them and CS is under no obligation to ensure that such other communications are brought to the attention of any recipient of this report. CS may, to the extent permitted by law, participate or invest in financing transactions with the issuer(s) of the securities referred to in this report, perform services for or solicit business from such issuers, and/or have a position or holding, or other material interest, or effect transactions, in such securities or options thereon, or other investments related thereto. In addition, it may make markets in the securities mentioned in the material presented in this report. CS may have, within the last three years, served as manager or co-manager of a public offering of securities for, or currently may make a primary market in issues of, any or all of the entities mentioned in this report or may be providing, or have provided within the previous 12 months, significant advice or investment services in relation to the investment concerned or a related investment. Additional information is, subject to duties of confidentiality, available on request. Some investments referred to in this report will be offered solely by a single entity and in the case of some investments solely by CS, or an associate of CS or CS may be the only market maker in such investments. Past performance should not be taken as an indication or guarantee of future performance, and no representation or warranty, express or implied, is made regarding future performance. Information, opinions and estimates contained in this report reflect a judgment at its original date of publication by CS and are subject to change without notice. The price, value of and income from any of the securities or financial instruments mentioned in this report can fall as well as rise. The value of securities and financial instruments is subject to exchange rate fluctuation that may have a positive or adverse effect on the price or income of such securities or financial instruments. Investors in securities such as ADR's, the values of which are influenced by currency volatility, effectively assume this risk. Structured securities are complex instruments, typically involve a high degree of risk and are intended for sale only to sophisticated investors who are capable of understanding and assuming the risks involved. The market value of any structured security may be affected by changes in economic, financial and political factors (including, but not limited to, spot and forward interest and exchange rates), time to maturity, market conditions and volatility, and the credit quality of any issuer or reference issuer. Any investor interested in purchasing a structured product should conduct their own investigation and analysis of the product and consult with their own professional advisers as to the risks involved in making such a purchase. Some investments discussed in this report may have a high level of volatility. High volatility investments may experience sudden and large falls in their value causing losses when that investment is realised. Those losses may equal your original investment. Indeed, in the case of some investments the potential losses may exceed the amount of initial investment and, in such circumstances, you may be required to pay more money to support those losses. Income yields from investments may fluctuate and, in consequence, initial capital paid to make the investment may be used as part of that income yield. Some investments may not be readily realisable and it may be difficult to sell or realise those investments, similarly it may prove difficult for you to obtain reliable information about the value, or risks, to which such an investment is exposed. This report may provide the addresses of, or contain hyperlinks to, websites. Except to the extent to which the report refers to website material of CS, CS has not reviewed any such site and takes no responsibility for the content contained therein. Such address or hyperlink (including addresses or hyperlinks to CS's own website material) is provided solely for your convenience and information and the content of any such website does not in any way form part of this document. Accessing such website or following such link through this report or CS's website shall be at your own risk. This report is issued and distributed in Europe (except Switzerland) by Credit Suisse Securities (Europe) Limited, One Cabot Square, London E14 4QJ, England, which is regulated in the United Kingdom by The Financial Services Authority ("FSA"). This report is being distributed in Germany by Credit Suisse Securities (Europe) This report is being distributed in the United States and Canada by Credit Suisse Securities (USA) LLC; in Switzerland by Credit Suisse AG; in Brazil by Banco de Investimentos Credit Suisse (Brasil) S.A or its affiliates; in Mexico by Banco Credit Suisse (México), S.A. (transactions related to the securities mentioned in this report will only be effected in compliance with applicable regulation); in Japan by Credit Suisse Securities (Japan) Limited, Financial Instruments Firm, Director-General of Kanto Local Finance Bureau (Kinsho) No. 66, a member of Japan Securities Dealers Association, The Financial Futures Association of Japan, Japan Investment Advisers Association, Type II Financial Instruments Firms Association; elsewhere in Asia/ Pacific by whichever of the following is the appropriately authorised entity in the relevant jurisdiction: Credit Suisse (Hong Kong) Limited, Credit Suisse Equities (Australia) Limited, Credit Suisse Securities (Thailand) Limited, Credit Suisse Securities (Malaysia) Sdn Bhd, Credit Suisse AG, Singapore Branch, Credit Suisse Securities (India) Private Limited regulated by the Securities and Exchange Board of India (registration Nos. INB230970637; INF230970637; INB010970631; INF010970631), having registered address at 9th Floor, Ceejay House, Dr.A.B. Road, Worli, Mumbai - 18, India, T- +91-22 6777 3777, Credit Suisse Securities (Europe) Limited, Seoul Branch, Credit Suisse AG, Taipei Securities Branch, PT Credit Suisse Securities Indonesia, Credit Suisse Securities (Philippines ) Inc., and elsewhere in the world by the relevant authorised affiliate of the above. Research on Taiwanese securities produced by Credit Suisse AG, Taipei Securities Branch has been prepared by a registered Senior Business Person. Research provided to residents of Malaysia is authorised by the Head of Research for Credit Suisse Securities (Malaysia) Sdn Bhd, to whom they should direct any queries on +603 2723 2020. This research may not conform to Canadian disclosure requirements. In jurisdictions where CS is not already registered or licensed to trade in securities, transactions will only be effected in accordance with applicable securities legislation, which will vary from jurisdiction to jurisdiction and may require that the trade be made in accordance with applicable exemptions from registration or licensing requirements. Non-U.S. customers wishing to effect a transaction should contact a CS entity in their local jurisdiction unless governing law permits otherwise. U.S. customers wishing to effect a transaction should do so only by contacting a representative at Credit Suisse Securities (USA) LLC in the U.S. Please note that this research was originally prepared and issued by CS for distribution to their market professional and institutional investor customers. Recipients who are not market professional or institutional investor customers of CS should seek the advice of their independent financial advisor prior to taking any investment decision based on this report or for any necessary explanation of its contents. This research may relate to investments or services of a person outside of the UK or to other matters which are not regulated by the FSA or in respect of which the protections of the FSA for private customers and/or the UK compensation scheme may not be available, and further details as to where this may be the case are available upon request in respect of this report. CS may provide various services to US municipal entities or obligated persons ("municipalities"), including suggesting individual transactions or trades and entering into such transactions. Any services CS provides to municipalities are not viewed as "advice" within the meaning of Section 975 of the Dodd-Frank Wall Street Reform and Consumer Protection Act. CS is providing any such services and related information solely on an arm's length basis and not as an advisor or fiduciary to the municipality. In connection with the provision of the any such services, there is no agreement, direct or indirect, between any municipality (including the officials, management, employees or agents thereof) and CS for CS to provide advice to the municipality. Municipalities should consult with their financial, accounting and legal advisors regarding any such services provided by CS. In addition, CS is not acting for direct or indirect compensation to solicit the municipality on behalf of an unaffiliated broker, dealer, municipal securities dealer, municipal advisor, or investment adviser for the purpose of obtaining or retaining an engagement by the municipality for or in connection with Municipal Financial Products, the issuance of municipal securities, or of an investment adviser to provide investment advisory services to or on behalf of the municipality. If this report is being distributed by a financial institution other than Credit Suisse AG, or its affiliates, that financial institution is solely responsible for distribution. Clients of that institution should contact that institution to effect a transaction in the securities mentioned in this report or require further information. This report does not constitute investment advice by Credit Suisse to the clients of the distributing financial institution, and neither Credit Suisse AG, its affiliates, and their respective officers, directors and employees accept any liability whatsoever for any direct or consequential loss arising from their use of this report or its content. Principal is not guaranteed. Commission is the commission rate or the amount agreed with a customer when setting up an account or at any time after that.
Copyright © 2013 CREDIT SUISSE AG and/or its affiliates. All rights reserved.
Investment principal on bonds can be eroded depending on sale price or market price. In addition, there are bonds on which investment principal can be eroded due to changes in redemption amounts. Care is required when investing in such instruments.
When you purchase non-listed Japanese fixed income securities (Japanese government bonds, Japanese municipal bonds, Japanese government guaranteed bonds, Japanese corporate bonds) from CS as a seller, you will be requested to pay the purchase price only.
HC0063.doc