Human Interventions and Climate Change Impacts on...
136
Human Interventions and Climate Change Impacts on the West African Coastal Sand River A Preliminary Quantitative Assessment Public Disclosure Authorized Public Disclosure Authorized Public Disclosure Authorized Public Disclosure Authorized
Transcript of Human Interventions and Climate Change Impacts on...

Human Interventions and Climate Change Impacts on the West African Coastal Sand River
A Preliminary Quantitative Assessment
Pub
lic D
iscl
osur
e A
utho
rized
Pub
lic D
iscl
osur
e A
utho
rized
Pub
lic D
iscl
osur
e A
utho
rized
Pub
lic D
iscl
osur
e A
utho
rized


Human Interventions and Climate
Change Impacts on the West
African Coastal Sand River
A Preliminary Quantitative Assessment
1210349-000
© Deltares, 2016, B
Alessio Giardino
Reinier Schrijvershof
Christophe Briere
Kees Nederhoff
Pieter Koen Tonnon
Sofia Nunes de Caires


© 2017 International Bank for Reconstruction and Development / The World Bank 1818 H Street NW, Washington, DC 20433 Telephone: 202-473-1000; Internet: www.worldbank.org Some rights reserved 1 2 3 4 19 18 18 17 This work is a product of the staff of The World Bank with external contributions. The findings, interpretations, and conclusions expressed in this work do not necessarily reflect the views of The World Bank, its Board of Executive Directors, or the governments they represent. The World Bank does not guarantee the accuracy of the data included in this work. The boundaries, colors, denominations, and other information shown on any map in this work do not imply any judgment on the part of The World Bank concerning the legal status of any territory or the endorsement or acceptance of such boundaries. Nothing herein shall constitute or be considered to be a limitation upon or waiver of the privileges and immunities of The World Bank, all of which are specifically reserved. Rights and Permissions
This work is available under the Creative Commons Attribution 3.0 IGO license (CC BY 3.0 IGO) http:// creativecommons.org/licenses/by/3.0/igo. Under the Creative Commons Attribution license, you are free to copy, distribute, transmit, and adapt this work, including for commercial purposes, under the following conditions: Attribution— Please cite the work as follows: “Giardino Alessio, Schrijvershof Reinier, Brière Christophe, Nederhoff Kees, Tonnon Pieter Koen, Caires Sofia, 2017. Human Interventions and Climate Change Impacts on the West African Coastal Sand River. World Bank, Washington, DC.” Translations—If you create a translation of this work, please add the following disclaimer along with the attribution: This translation was not created by The World Bank and should not be considered an official World Bank translation. The World Bank shall not be liable for any content or error in this translation. Adaptations—If you create an adaptation of this work, please add the following disclaimer along with the attribution: This is an adaptation of an original work by The World Bank. Views and opinions expressed in the adaptation are the sole responsibility of the author or authors of the adaptation and are not endorsed by The World Bank. Third-party content—The World Bank does not necessarily own each component of the content contained within the work. The World Bank therefore does not warrant that the use of any third-party-owned individual component or part contained in the work will not infringe on the rights of those third parties. The risk of claims resulting from such infringement rests solely with you. If you wish to re-use a component of the work, it is your responsibility to determine whether permission is needed for that re-use and to obtain permission from the copyright owner. Examples of components can include, but are not limited to, tables, figures, or images. All queries on rights and licenses should be addressed to World Bank Publications, The World Bank Group, 1818 H Street NW, Washington, DC 20433, USA; fax: 202-522-2625; e-mail: [email protected].


DeltoresTitleHuman Interventions and Climate Change Impacts on the West African Coastal Sand River
ClientThe World Bank
Project1210349-000
Reference Pages1210349-000-ZKS-0002 99
KeywordsLarge-scale sediment budget, coastal erosion, wave modelling, shoreline modelling, satelliteimages, anthropogenic interventions, climate change.
SummaryThe West African coastal barrier is maintained by a strong wave-driven longshore transport ofsand which can be compared to a "sand river". This sand originates from rivers and fromlarge coastal sand deposits. Today, however, much of the fluvial sand is retained behind riverdams and/or interrupted at several locations by port jetties. As a result the sandy coastalbarrier is eroding almost everywhere.
The aim of this study is to derive a large-scale sedimen-t budget analysis for the followingcountries: Ivory Coast, Ghana, Togo and Benin. This estimation is carried out using aconsistent approach based on numerical modelling. In particular, the model chain is basedon: Delft3D-WAVE models (one regional model + 15 nested models) and one UNIBEST-CL+sediment transport and shoreline evolution model, covering the entire study area. Modellingresults are validated by means of shoreline changes derived from historical satellite imagesand literature values. Scenario runs are carried out aiming at:
• Assessing the effects of the major anthropogenic interventions on the sedimentbudget and shoreline changes (i.e. port jetties and river dams) and with focus onpossible trans-boundary implications between different countries
• Assessing the possible effect of climate change• Creating awareness on the interdependency of any action taken along the coast and
major rivers on the sediment budget and shoreline changes.
Version Date Author Initials Review Initials A~~roval InitialsJul. 2016 Giardino et al. Hans de Vroe
2 Au .2016 Alessio Giardino Hans de Vroe Frank Hoozemans3 Dee.2016 Alessio Giardino Hans de Vroe Frank Hoozemans4 Jan.2017 Alessio Giardino Hans de J\ Frank Hoozemans
A~,'.v?'vL Vroeg
Statefinal
Human Interventions and Climate Change Impacts on the West African Coastal Sand River


1210349-000-ZKS-0002, 8 December 2016, final
Human Interventions and Climate Change Impacts on the West African Coastal Sand River
i
Contents
1 Introduction 1
2 Objectives of the study 3
3 Description of the physical system 5 3.1 Introduction 5 3.2 Geography 5 3.3 Geology 6 3.4 Climate and hydrology 7 3.5 Oceanography 8
3.5.1 Ocean currents 8 3.5.2 Tides 9 3.5.3 Wind and Waves 9
3.6 Morphology 10 3.6.1 Ivory Coast 10 3.6.2 Ghana 11 3.6.3 Bight of Benin, including Eastern Ghana, Togo and Benin 12
3.7 Rivers and streams 14 3.7.1 Introduction 14 3.7.2 Ivory Coast 15 3.7.3 Ghana 16 3.7.4 Togo 16 3.7.5 Benin 16
3.8 Sediment balance 16 3.8.1 Supply by rivers 17 3.8.2 Littoral transport 18
3.9 Anthropogenic interventions 23 3.9.1 River dams 23 3.9.2 Ports 27 3.9.3 Sand mining 29 3.9.4 Possible future human interventions 29
3.10 Shoreline development 30 3.10.1 Ivory Coast 30 3.10.2 Ghana 32 3.10.3 Bight of Benin, including Eastern Ghana, Togo and Benin 36
3.11 Conclusions 41
4 Data description 43 4.1 Introduction 43 4.2 Bathymetry 43 4.3 Wind and waves 43
4.3.1 ERA interim dataset 43 4.3.2 Altimeter data 44
4.4 Coastal types 46 4.5 Sediment inputs from rivers 46 4.6 Impact of climate change 46
4.6.1 Sea level rise 46

ii
1210349-000-ZKS-0002, 8 December 2016, final
Human Interventions and Climate Change Impacts on the West African Coastal Sand River
4.6.2 Waves 47 4.7 Summary 47
5 Numerical models 49 5.1 Introduction 49 5.2 Wave model 49
5.2.1 Model description 49 5.2.2 Model setup and bathymetry 49 5.2.3 Waves classification 50
5.3 Shoreline evolution model 52 5.3.1 Model description 52 5.3.2 Calculation of longshore transport 52 5.3.3 Coastline schematization 55
5.4 Sediment input from major rivers 56 5.4.1 Hydrological model 56 5.4.2 Estimation of the sediment yield from major rivers 57 5.4.3 Effects of dams and reservoirs on the sediment yield 58 5.4.4 Effects of climate change on the sediment yield 59
6 Results 61 6.1 Introduction 61 6.2 Wave modelling 62 6.3 Modelling of sediment input from rivers 67 6.4 Shoreline evolution modelling; reference model 68
6.4.1 Hindcast for the period 1985 - 2015 68 6.4.2 The large scale sediment budget along the West African coast 73
6.5 Shoreline evolution modelling: scenario modelling 76 6.5.1 Effects of anthropogenic interventions 76 6.5.2 Effects of climate change 82
7 Discussion 89 7.1 General discussion 89 7.2 Towards a regional sediment management plan 90
8 Conclusions and further work 93 8.1 Suggestion for further work 93
9 References – literature 95
10 References – website 101
Appendices
A Appendix A: Validation cases of net littoral drift based on historical coastline
development A-1 A.1 Validation case: Abidjan port A-2 A.2 Validation case: Keta Lagoon A-4 A.3 Validation case: port of Lomé A-5 A.4 Validation case: port of Cotonou A-6

1210349-000-ZKS-0002, 8 December 2016, final
Human Interventions and Climate Change Impacts on the West African Coastal Sand River
iii
B Input maps – hydrological model B-1
C Summary table of longshore transport (values in x103 m
3/year) C-1
D Glossary D-1
E Summary of the Launch Workshop E-1 E.1 Summary presentations of final results and stakeholder’s consultation E-1 E.2 Attendance list E-3


1210349-000-ZKS-0002, 8 December 2016, final
Human Interventions and Climate Change Impacts on the West African Coastal Sand River
1 of 99
1 Introduction
The West African coast mainly consists of a narrow low-lying coastal strip, over a distance of
several thousand kilometers. This coastal strip is protected from the sea by a sandy barrier.
Large cities have developed in the past decades in this low-lying back-barrier strip, such as
Abidjan, Accra, Lome and Cotonou.
The West African coastal barrier is maintained by a strong wave-driven longshore transport of
sand which can be compared to a “sand river”. This sand originates from rivers and from
large coastal sand deposits. Today however, much of the fluvial sand is retained behind river
dams and/or interrupted at several locations by port jetties. For these reasons the sandy
coastal barrier is eroding at several locations; the highest rates of retreat (in the order of 10
m/year or more) occur near river mouths and port jetties, i.e. in the most urbanized areas.
Sea-level rise enhances coastal retreat; it may be the major factor for coastal retreat by the
end of the century. This will lead to the disruption of the coastal barrier if no erosion control
measures are taken.
The problem of West African coastal erosion was investigated by UNDP in 1985. Since that
time numerous studies have been completed (Tilmans et al., 1991; Degbe, 2009). In
particular, UEMOA has undertaken a regional study for shoreline monitoring with the goal of
developing a management plan for the coastal area (UEMOA, 2011). Main outcomes of this
extensive study are qualitative maps identifying coastal stretches subjected to a different
degree of risk, which can serve as a basis for drawing a large scale management plan from
Mauritania to Benin. Egis International (2013) has recently carried out a similar study
specifically for the Senegalese stretch of coast, collecting a large amount of GIS data
provided by the Centre de Suivi Ecologique (CSE).
Although this information is extremely valuable as a first step assessment of the on-going
erosion problems, those studies remain mainly qualitative. Moreover, most of the data is still
not homogeneous and/or dispersed among various organizations in the different countries.
This makes it very difficult to draw a consistent regional sediment plan and assess the trans-
boundary effects of different anthropogenic actions.
For this reason, The World Bank has approached Deltares to derive a quantitative and
consistent large-scale sediment budget study for the following countries: Ivory Coast, Ghana,
Togo and Benin. A sediment budget consists of quantitative information on the volumes of
sand moving naturally along the coastline within the “sand river”, which are brought into the
coastal systems by rivers and/or are removed from the coastal system due to mining and/or
blocked by man-made structures (e.g. harbor jetties).


1210349-000-ZKS-0002, 8 December 2016, final
Human Interventions and Climate Change Impacts on the West African Coastal Sand River
3 of 99
2 Objectives of the study
The aim of this study is to develop a consistent large-scale sediment budget for the West
African Coast which would serve as a first step towards a sub-regional coastal zone
management plan for the four targeted countries, i.e. Ivory Coast, Ghana, Togo, and Benin.
This result is achieved based on:
Estimation, with a consistent approach and based on numerical modelling, of the
annual alongshore transport capacity along the West African coast, from Ivory Coast
to Benin. This allows a quantitative assessment of the effects of different human
interventions on the coastal evolution and possible trans-boundary implications. The
effect of climate change (i.e. increase in storm intensity, change in wave direction and
sea level rise) on the large-scale sediment transport capacity is also analysed as part
of this study.
Creating awareness of the interdependency of any action taken along the coast,
along the major rivers and on the watershed and its possible consequences. This
involves communication and exchange of information and results with local
organizations and relevant stakeholders. For this reason, two regional consultation
and validation workshops are organized as part of this project. Also, a digital coastal
viewer and a brochure are developed within the project, in order to facilitate the
communication with local stakeholders.


1210349-000-ZKS-0002, 8 December 2016, final
Human Interventions and Climate Change Impacts on the West African Coastal Sand River
5 of 99
3 Description of the physical system
3.1 Introduction
This chapter provides a comprehensive general picture of the natural conditions and
processes along the west coast of Africa, more precisely for the countries of Ivory Coast,
Ghana, Togo, and Benin. Physically, these coasts are all part of one natural system; the
natural processes go across the borders freely, and so do the effects of human intervention.
This interdependence requires an overall study of the system as a basis for local studies and
for the coordination of human actions in the area.
The four countries are located in the Gulf of Guinea, and especially parts of the following
geomorphological units: the concave coast between Cape Palmas and Cape Three Points in
Ivory Coast and Ghana; the coast from Cape Three Points to the western extremity of the
Niger Delta.
The processes and features which contribute to shape the coastline are very diverse:
sediment characteristics, waves, currents, wind, hydrology, geology, subsidence and tectonic
processes. On tops of them, anthropogenic interventions and climate change have a strong
influence on the littoral sediment budget and consequent shoreline changes.
This chapter provides a description of the physical system and the main processes affecting
the coastal sediment budget and morphodynamic processes.
3.2 Geography
The relevant part of the coast of the Gulf of Guinea stretches over 1300 km between 8°W and
3°E around the 5°N parallel (Figure 3.1). To the south, it faces the entire South Atlantic
Ocean; to the north, it is backed by the vast West African continent, from which rivers, large
and small, descend into the ocean.
Many distributaries carry their water across the coast. By far the largest river of the four
countries is the Volta in Ghana. Other smaller rivers, without discernible deltas, are the
Sassandra, the Bandama and the Comoé in Ivory Coast, and the Mono and the Ouémé in
Benin. Moreover, many other secondary rivers flow into the ocean between the mouths of the
larger ones. In many cases, they discharge only during the wet season.
Generally, the coastal area is low, with the 100-m contour at a distance of 25-100 km inland.
Steep coasts with small bays and narrow beaches exist between Cape Palmas and Fresco
and from Cape Three Points almost to the mouth of the Volta. The remaining coast consists
of low beach ridges, marshes and lagoons. The width of this zone is 5-10 km, except in the
Volta River delta, where it is 25-30 km. Inlets connect the rivers, lagoons and marshes to the
ocean.

Human Interventions and Climate Change Impacts on the West African Coastal Sand River
1210349-000-ZKS-0002, 8 December 2016, final
6 of 99
Figure 3.1 Political units of Ivory Coast, Ghana, Benin and Togo. The main rivers, ports, and river dams are also
indicated.
3.3 Geology
The coast of West Africa formed at the beginning of the Cretaceous period, about 135 million
years ago, when South America broke away from Africa. They gradually drifted apart to form
the Atlantic Ocean, which had about half of its present width at the beginning of the Tertiary
period at about 65 million years ago (Allersma and Tilmans, 1993).
Tertiary deposits occur behind and beneath the recent coastal plain. These sandy clays form
a plateau 20 - 70m high. It is narrow along the coast of the Ivory Coast and wider between the
Volta River and the Niger Delta. These formations form bare, soft sandstone cliffs on the
coast between Sassandra and Fresco in Ivory Coast and to the east of Accra in Ghana
(Figure 3.2).
The Pleistocene and recent deposits form the most seaward coastal zone, consisting of
beaches, barriers, lagoons and marshes up to a few metres above sea level. The width of this
strip varies between a few metres in small bays to a few kilometres along the sandy parts of
the coast of Ivory Coast and of the coasts of Togo and Benin.
The continental shelf is narrow, with widths of 20 - 25 km along Ivory Coast and the coasts of
Togo and Benin, and 20 - 80 km between Cape Three Points and the Volta Delta. A
submarine canyon exists off the Canal de Vridi in Ivory Coast, the so-called “Trou Sans
Fond”.

1210349-000-ZKS-0002, 8 December 2016, final
Human Interventions and Climate Change Impacts on the West African Coastal Sand River
7 of 99
Figure 3.2 Regional geology. From Allersma and Tilmans (1993)
3.4 Climate and hydrology
The climate along the coast of West Africa is of an equatorial type, with considerable
differences in the amount and seasonal distribution of the precipitation (Table 3.1, from
Allersma and Tilmans, 1993). Rains of more than 2000 mm per year feed tropical rain forests
along Ivory Coast and in West Ghana. There are two maxima (May-June and October-
November). The eastern part of the coastline (i.e. between Takoradi and Cotonou) is
considerably drier than the western part (Figure 3.3).
Table 3.1 Precipitation (in mm) along the West African Coast (from Allersma and Tilmans, 1993)
Abidjan Takoradi Accra Cotonou
January 31 31 16 22
February 56 38 37 37
March 114 80 73 94
April 167 102 82 129
May 312 250 145 214
June 683 288 193 418
July 274 87 49 161
August 38 35 16 47
September 55 48 40 85
October 194 131 80 169
November 174 77 38 54
December 113 38 18 21
Yearly total 2211 1205 787 1451

Human Interventions and Climate Change Impacts on the West African Coastal Sand River
1210349-000-ZKS-0002, 8 December 2016, final
8 of 99
Figure 3.3 Mean annual precipitation computed between 1979 and 2014 (source: http://www.earth2observe.eu/).
Variations in temperatures are small. The average daily maximum varies between 27 and 29°
in August-September and 31 and 33 ° in February-March. The average daily minima are from
21-22 ° in August to 23-24 ° in March.
3.5 Oceanography
3.5.1 Ocean currents
The West African coast faces the South Atlantic Ocean. The continental shelf is narrow, and
no offshore islands protect the coast against oceanic forces.
The Guinea current flows offshore from west to east as a continuation of the Equatorial
Counter Current in the middle part of the Atlantic Ocean (Figure 3.4). Its velocity varies
between 1 m/s (max. 1.5 m/s) in summer, and 0.5 m/s (max. 0.75 m/s) in winter (Allersma
and Tilmans, 1993). It becomes weaker in the east. The current is reinforced by the monsoon
and can be modified by the harmattan (northeasterly wind which blows from the Sahara
Desert over the West African subcontinent into the Gulf of Guinea between the end of
November and the middle of March). Generally, this ocean current is weak near the coast,
except near promontories. Upwelling of cold (22-25 °C) water occurs especially off Ghana in
summer and in the case of the harmattan. Otherwise, the sea temperatures vary between 27
and 29 °C.

1210349-000-ZKS-0002, 8 December 2016, final
Human Interventions and Climate Change Impacts on the West African Coastal Sand River
9 of 99
Figure 3.4 Surface currents in the Atlantic Ocean. From Wauthy, 1983
3.5.2 Tides
The semi-diurnal tide occurs almost simultaneously along the relevant part of the coast, with
an average range of about 1 m (Table 3.2). The coastal currents caused by these tides are
weak. The tide wave is modified (reduced height, deformation, retardation) when it enters
lagoons and estuaries. Stronger tidal streams occur only in inlets and estuaries (Allersma and
Tilmans, 1993)
Table 3.2 Tides along the West African Coast (Allersma and Tilmans, 1993)
Tidal range (m) Phase
Neap Mean Spring
Canal de Vridi 0.42 0.58 0.84 140˚
Takoradi 0.58 0.90 1.22 107˚
Accra 0.62 0.94 1.26 107˚
Tema 0.64 0.96 1.28 107˚
Lomé 0.68 1.00 1.32 108˚
Cotonou 0.68 0.98 1.28 133˚
3.5.3 Wind and Waves
The wind is a persistent south-westerly monsoon modified by land and sea breezes in the
coastal area. Wind speeds vary between 0-5 m/s (night) and 1.5-2 m/s (day) along the Ivory
Coast and increase to 0.5-2.5 m/s and 2-6 m/s towards Nigeria. Storms are very rare. Weaker
line squalls with heavy rain and strong winds of short duration occur occasionally. During
winter, there are some occurrences of the hot, dry, north-easterly harmattan, when the inter-
tropical convergence zone deviates from its normal southerly position at 5-7°N.
The waves reaching the coast are of two distinctly different origins: wind-waves generated by
the weak, local monsoon; and swell-waves generated by storms in the southern part of the
Atlantic Ocean. The locally generated waves rarely exceed 1.25 m in height; the maximum
period is 3-4 s. Generally, they are weaker and are generated from the south-west. Storms
occur around the 'roaring forties' throughout the year, but their violence peaks in the winter.
The periods of these swells vary between 8 and 20 s, with an average of 12-13 s. Their

Human Interventions and Climate Change Impacts on the West African Coastal Sand River
1210349-000-ZKS-0002, 8 December 2016, final
10 of 99
average height in deep water is 1-1.5 m, although heights of 2-3 m and more can occur. They
propagate from directions between south and south-west.
Almar et al (2015) focused on the characterization of the wave climate that governs longshore
sediment transport and the ensuing pattern of shoreline evolution of this coastal zone.
Similarly to our study, Almar et al. used the 1979–2012 ERA-Interim hindcast to understand
the temporal dynamics of longshore sediment transport. By using a simple empirical formula
they have separated the respective effect of swell waves and wind waves on the total
alongshore sediment transport. Given the predominance of swell waves in the region, they
have estimated that the swell waves contribution to the total alongshore transport is an order
of magnitude larger than that one of wind waves.
A more in-depth analysis of wind and wave data, used as basis for the numerical modelling
work is given in Section 4.3.
3.6 Morphology
The West African coast shows distinct features. First, the Ivory Coast displays a concave
shape between Cape Palmas and Cape Three Points. Its western part is rocky, and from
Fresco a sandy beach stretches almost to the eastern extremity. Secondly, the coast from
Ghana to Benin displays a similar concave shape between Cape Three Points and the
western extremity of the Niger Delta. The delta of the Volta River forms an interruption. Here,
also, the western part is rocky and beaches prevail from the Volta Delta eastward.
The beaches along this coast (Almar et al., 2014; Laibi et al., 2014) are mostly in the
‘reflective-to-intermediate’ state classes (Gourlay parameter, Ω = 1, following Short, 1984;
Relative Tide Range RTR ~ 1, Masselink and Short, 1993), and often exhibit an alongshore-
uniform low-tide terrace and a steep reflective upper beach face.
3.6.1 Ivory Coast
The Ivorian oceanic zone is bordered to the north by the Gulf of Guinea shoreline stretching
from the Cape of Palmes (7°30’ W) and the Cape of Three Points (2°W). The shoreline is 566
km long and it is characterized by a series of sandy beaches forming a wide arch opened to
the Atlantic Ocean. It can be subdivided into three sections based on the orientation with
respect to the north: 70° from Tabou to Sassandra, 85° from Sassandra to Abidjan and 100°
from Abidjan to the Cape of Three Points (Figure 3.5) (Le Loeuff and Marchal, 1993).

1210349-000-ZKS-0002, 8 December 2016, final
Human Interventions and Climate Change Impacts on the West African Coastal Sand River
11 of 99
Figure 3.5 The Coastal Zone of Ivory Coast. From Abe et al., 2002
To the West of Fresco, a rocky coast runs practically parallel WSW-ENE. This coast receives
a small supply of sediments, which is less than the littoral transport capacity. The Pleistocene
ridges, perpendicular to the coast, now appear as rocky promontories. The valleys in between
are closed by sandy bars, with lagoons forming in the lower parts of the valleys. Because of
the strong eastward sand transport, the short beaches fit against the eastern promontories
and form curved spiral beaches behind the western promontories. Essentially, this coast is
eroding.
To the East of Fresco, the shoreline is a flat coast, with sandy and monotonous structures of
sedimentary origin (Quaternary). Several lagoons (submersed fluvial basins) are separated
from the sea by a littoral bar, formed and maintained by waves and currents.
At the southern border of the oceanic area, a continental slope delimits a narrow continental
shelf with a width of 25-30 km and a surface area of about 16,000 km2. The continental slope
is generally smooth but it starts sharply increasing at -120 to -150 m depth (Martin, 1973). A
major morphological feature, the Trou Sans Fond canyon, cuts the continental shelf in front of
Abidjan. Depths over 1000 m are rapidly reached at few kilometres offshore.
3.6.2 Ghana
Off the eastern Ivory Coast, the continental margin is characterized by a narrow shelf, a broad
slope cut by numerous canyons and a wide continental rise characterized by typical deep-sea
fan structures (Mascle et al., 1988). Off Cape Three Points as far as Accra, and all along the
Ghanian Platform, a steep NE-SW trending slope extends on average less than 20 km wide.
Between these sectors there is an elongated rise (the Ivory Coast-Ghana Ridge, about 50 km
wide), exhibiting a NE-SW trend and bounded to the south by a steep narrow slope.
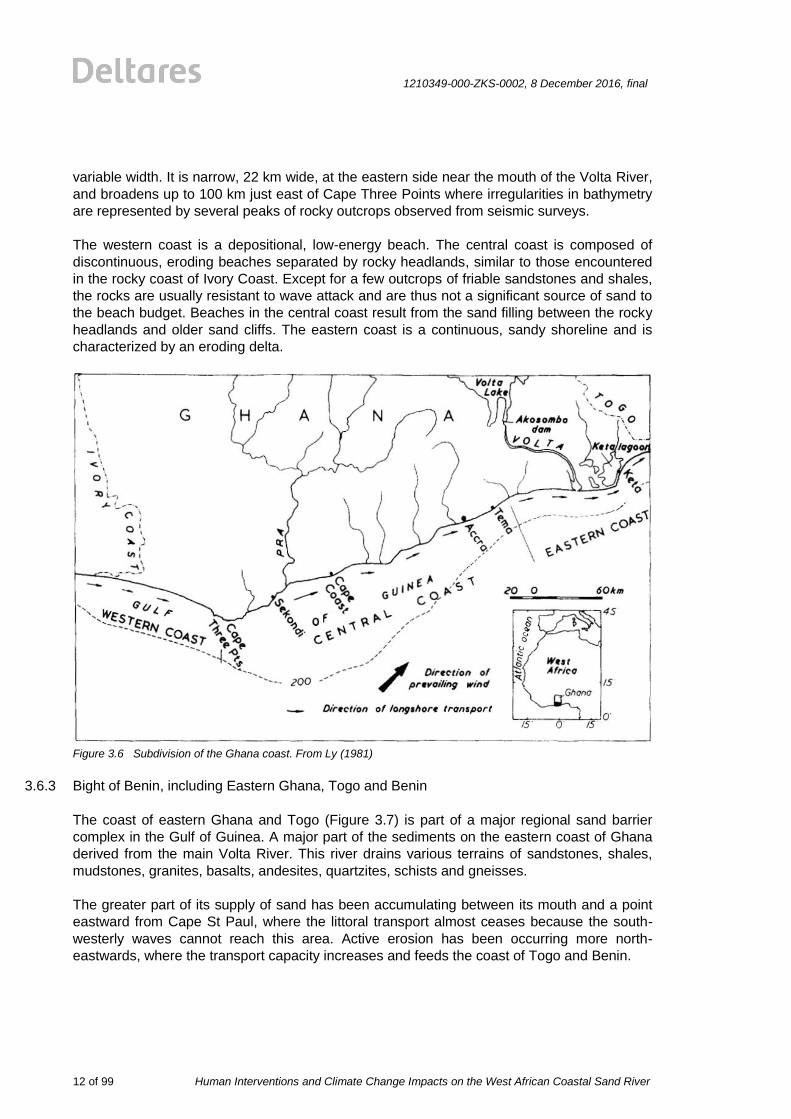
Ly (1981) subdivided the coast of Ghana into three parts: western, central, and eastern
coasts (Figure 3.6). The continental shelf west of Cape Three Points is a very flat and feature-
less surface, 40 km wide. In the central and eastern coasts this shelf represents a strip of
Human Interventions and Climate Change Impacts on the West African Coastal Sand River
1210349-000-ZKS-0002, 8 December 2016, final
12 of 99
variable width. It is narrow, 22 km wide, at the eastern side near the mouth of the Volta River,
and broadens up to 100 km just east of Cape Three Points where irregularities in bathymetry
are represented by several peaks of rocky outcrops observed from seismic surveys.
The western coast is a depositional, low-energy beach. The central coast is composed of
discontinuous, eroding beaches separated by rocky headlands, similar to those encountered
in the rocky coast of Ivory Coast. Except for a few outcrops of friable sandstones and shales,
the rocks are usually resistant to wave attack and are thus not a significant source of sand to
the beach budget. Beaches in the central coast result from the sand filling between the rocky
headlands and older sand cliffs. The eastern coast is a continuous, sandy shoreline and is
characterized by an eroding delta.
Figure 3.6 Subdivision of the Ghana coast. From Ly (1981)
3.6.3 Bight of Benin, including Eastern Ghana, Togo and Benin
The coast of eastern Ghana and Togo (Figure 3.7) is part of a major regional sand barrier
complex in the Gulf of Guinea. A major part of the sediments on the eastern coast of Ghana
derived from the main Volta River. This river drains various terrains of sandstones, shales,
mudstones, granites, basalts, andesites, quartzites, schists and gneisses.
The greater part of its supply of sand has been accumulating between its mouth and a point
eastward from Cape St Paul, where the littoral transport almost ceases because the south-
westerly waves cannot reach this area. Active erosion has been occurring more north-
eastwards, where the transport capacity increases and feeds the coast of Togo and Benin.

1210349-000-ZKS-0002, 8 December 2016, final
Human Interventions and Climate Change Impacts on the West African Coastal Sand River
13 of 99
Figure 3.7 The barrier–lagoon system of eastern Ghana and Togo. Insets show shoreface profiles of the western
Volta Delta and year-round wave approach window. From Anthony and Blivi (1999)

Human Interventions and Climate Change Impacts on the West African Coastal Sand River
1210349-000-ZKS-0002, 8 December 2016, final
14 of 99
Kaki et al. (2001) discuss the sedimentary dynamics and coastal environment of the Beninese
coast east of the embouchure of the river Mono, distinguishing the following geomorphologic
features: plateaux of laterite, yellow sand, swampy areas, grey and brown sand, and
urbanized areas (see Figure 3.8)
Figure 3.8 Geomorphologic map of the coastal area of Benin. From Kaki et al., 2001
The beaches in Togo and Benin present a longshore-uniform low tide terrace (LTT) and a
steep and rather alongshore-uniform lower beachface and persistent upper beachface
cuspate morphology cut into a well-developed berm. The grain size is medium to coarse (D50
= 0.6 mm). An eastward littoral drift of 0.8 to 1.5 million m3/yr has been reported in the
literature (Anthony and Blivi, 1999), driven by persistent oblique long swells year-round.
3.7 Rivers and streams
3.7.1 Introduction
The small coastal rivers carry little water during the long dry season (Table 3.3). The larger
ones show a peak around June-November and low discharges during the rest of the year.
Evaporation in the coastal lagoons and marshes takes its toll and reduces the outflow to the
sea even more.

1210349-000-ZKS-0002, 8 December 2016, final
Human Interventions and Climate Change Impacts on the West African Coastal Sand River
15 of 99
Table 3.3 Discharges (in m3 s-1) of the main rivers within the study area
(ftp://daac.ornl.gov/data/rivdis/STATIONS.HTM)
Sassandra Station: Semien Period: 1979 - 1983 Lat: 7.71N Lon: 7.06W
Bandama Station: Tiassale Period: 1979 - 1983 Lat: 5.88N Lon: 4.81W
Comoe Station: Aniassue Period: 1979 - 1983 Lat:6.65N Lon: 3.68W
Pra Station: Daboasi Period: 1979 - 1983 Lat:5.13N Lon: 1.65W
Volta Station: Senchi Period: 1936 - 1979 Lat: 6.20N Lon: 0.10E
Mono Station: Athieme Period: 1944 - 1984 Lat:6.92N Lon: 1.67E
Oueme Station: Bonou Period: 1948 - 1984 Lat:6.90N Lon: 2.45E
Mean Q (m3/s)
Mean Q (m3/s)
Mean Q (m3/s)
Mean Q (m3/s)
Mean Q (m3/s)
Mean Q (m3/s)
Mean Q (m3/s)
Jan 44.0 65.8 2.6 54.3 267.5 2.6 7.1
Feb 27.0 76.3 0.6 40.0 308.7 1.6 3.4
Mar 15.0 72.7 0.9 60.5 278.4 2.3 3.4
Apr 42.4 113.8 1.5 98.3 309.8 3.6 4.3
May 55.5 133.8 9.8 160.0 279.0 8.0 8.8
Jun 91.7 244.3 62.7 328.0 404.8 55.2 51.3
Jul 249.8 216.8 85.0 388.0 750.3 162.1 168.0
Aug 558.0 215.8 144.3 265.3 1508.9 283.5 395.3
Sep 675.3 316.7 380.7 292.9 3743.4 403.7 610.2
Oct 330.7 270.5 282.9 345.9 3832.7 255.6 591.4
Nov 149.3 124.5 60.6 228.1 1118.5 59.1 188.6
Dec 60.2 85.2 11.1 102.4 465.8 12.6 25.1
3.7.2 Ivory Coast
Three major river systems follow meandering courses from north to south of Ivory Coast,
draining into the Gulf of Guinea. From west to east these are the Sassandra, Bandama, and
Comoé, all relatively untamed rivers navigable only short distances inland from the coast. In
the north, many smaller tributaries are dry streambeds between rains.
The Sassandra River Basin has a length of 650 km and rises in the high ground of the north,
where the Tiemba River joins the Férédougouba River, which flows from the Guinea
highlands. It is joined by the Bagbé, Bafing, Nzo, Lobo, and Davo rivers and winds through
shifting sandbars to form a narrow estuary, which is navigable for about eighty kilometres
inland from the port of Sassandra.
The Bandama River, often referred to as the Bandama Blanc, is the longest in the country,
joining the Bandama Rouge (the Marahoué), Solomougou, Kan, and Nzi Rivers over its 800-
kilometre course. This large river system drains most of central Ivory Coast before it flows into
the Tagba Lagoon opposite Grand-Lahou. In the rainy season small craft navigate the
Bandama for fifty or sixty kilometres inland.
Easternmost of the main rivers, the Comoé, formed by the Leraba and Gomonaba, rises in
the Sikasso Plateau of Burkina Faso. It flows within a narrow 700-kilometre basin and
receives the Kongo, and Iringou tributaries before winding among the coastal sandbars and
emptying into the Ebrié Lagoon near Grand-Bassam. The Comoé is navigable for vessels of
light draft for about fifty kilometres to Alépé.

Human Interventions and Climate Change Impacts on the West African Coastal Sand River
1210349-000-ZKS-0002, 8 December 2016, final
16 of 99
3.7.3 Ghana
Ghana is drained by a large number of streams and rivers. In addition, there are a number of
coastal lagoons, the huge man-made Lake Volta, and Lake Bosumtwi, southeast of Kumasi
and which has no outlet to the sea. In the wetter south and southwest areas of Ghana, the
river and stream pattern is denser. Several streams and rivers also dry up or experience
reduced flow during the dry seasons of the year, while flooding during the rainy seasons is
common.
Extending about 1,600 kilometers in length and draining an area of about 388,000 square
kilometers, of which about 158,000 square kilometers lie within Ghana, the Volta and its
tributaries, such as the Afram River and the Oti River, drain more than two thirds of the
country. The Volta River maintains an estuary, being 15-50 km long, longitudinal, and funnel-
shaped almost perpendicular to the coast. The shape is in equilibrium with the tidal flows, the
river discharges and (near the coast) wave action.
On the other side of the Kwahu Plateau from Lake Volta we fiund the Pra River, a 240 km
long river which is the easternmost and largest of the three principal rivers that drain the area
south of the Volta divide. Rising south of the Kwahu Plateau and flowing southward, the Pra
enters the Gulf of Guinea east of Takoradi.
3.7.4 Togo
Approximately 400 km (250 mi) long, and draining a basin of about 20,000 km2, the Mono
River rises between the town of Sokodé and the border with Benin, and flows south. Along
the southern portion of the river towards its mouth, it forms the international boundary
between Togo and Benin. The river drains into the Bight of Benin through an extensive
system of brackish lagoons and lakes, including Lake Togo.
3.7.5 Benin
The Oueme River (510 km length) drains most of southern Benin. The Ouémé rises in the
Atakora Mountains and flows southward; near its mouth it divides into two branches, one
draining to the east into Porto-Novo Lagoon and the other to the west into Nokoué Lake.
3.8 Sediment balance
A sediment balance is basically a mass balance of inputs and outputs of sediment for a
predefined area, which gives insight into the relative importance of various sources and
losses/sinks. By determining the governing processes and quantifying sediment volumes in
the coastal zone, an appropriate long-term sediment management strategy can be
developed.
Main sources or sinks of sediment are: alongshore sediment transport (littoral transport),
cross-shore transport, sediment input from rivers, wind transport, offshore losses (e.g. due to
the presence of canyons), sediment nourishments, dredging, sediment input in tidal inlets and
relative sea level rise (Figure 3.9). In this section, the two main sources of sediment for the
West Africa coastline are described: rivers and littoral transport. These two sources are not
only the most important, but also are the ones that have been most largely modified by the
anthropogenic interventions which have taken place during the years (section 3.9).

1210349-000-ZKS-0002, 8 December 2016, final
Human Interventions and Climate Change Impacts on the West African Coastal Sand River
17 of 99
Figure 3.9 Coastal sediment budget (www.simplecoast.com).
3.8.1 Supply by rivers
Relatively little is known about the sediment discharges from rivers feeding the West African
Coast. Information about a few local rivers, and about other areas with similar conditions,
suggests sediment yields of 30-80 metric tons/km2 per year, depending on the area of the
catchment and the topographical, geological and climatological situation. Using this
knowledge, estimates have been made of the sediment loads of the main rivers and of the
small coastal catchments by Allersma and Tilmans (1993); see Table 3.4. Some erosion from
cliffs has been included, in the table identified as “Coastal”. The percentage of sand in the
total load has been estimated at 10-15%, depending on the conditions. Sand and gravels are
in general the main building material for beaches. Values in bold represent the total
contribution to the coastal sediment budget for each country.

Human Interventions and Climate Change Impacts on the West African Coastal Sand River
1210349-000-ZKS-0002, 8 December 2016, final
18 of 99
Table 3.4 Holocene sediment supply by rivers and fluvial erosion of hinterland. From Allersma and Tilmans (1993)
Catchments Catchment
(1000 km2)
Length of
coast (km)
Yield (t/km2
per year)
Load (1000 t
per year)
Cavally 34 - 70 2400
Coastal 10 170 50 500
Sassandra 66 - 70 4600
Coastal 13 120 50 700
Bandama 91 - 70 6400
Coastal 16 135 50 800
Comoé 78 - 60 4700
Coastal 22 120 60 1300
Coastal 10 75 70 700
Ivory Coast 340 620 65 22100
Coastal 2 60 70 200
Pra 19 - 70 1400
Coastal 17 255 40 800
Ghana Coast 38 315 63 2400
Volta 390 - 40 15000
Coastal 12 150 40 500
Mono 21 - 60 1300
Coastal 5 80 60 300
Ouémé 42 - 50 2100
Coastal 6 90 50 300
Bight of Benin 476 320 50 19500
3.8.2 Littoral transport
While rivers carry most of the sediment to the coast, littoral transport is the main mode of
displacement of sand along the coast. Fine sediments are carried in suspension. The coarse
material forms the beach and the adjacent bottom of the sea. The mud settles in less
turbulent waters, offshore and in lagoons and swamps.
The littoral transport of sand is mainly caused by the incessant action of the waves,
particularly Atlantic swell. Its persistence and power lead to high rates of transport.
Alongshore gradients in littoral transport lead to local accretion and erosion along the coast.
Allersma and Tilmans (1993) provided information on the potential littoral transport based on
information on the relative angle between coastal orientation and offshore wave direction and
wave height. The information is summarized in Table 3.5, showing very large alongshore
sediment transport rates up to more than a million m3/year and a general transport direction
from west to east.
Table 3.5 Observed Littoral Transports and Directions of Coasts and Waves, from Allersma and Tilmans (1993)
Location Transport
(million m3
per year)
Normal to
coast (°E )
Wave
direction
(°E)
Angle of wave
approach (°E)
Western Canal de Vridi 0.8 172 200 28
Eastern Canal de Vridi 0.4 188 200 12
Eastern Ivory Coast 0 192 200 8
Lomé Port 1.0 -1.2 160 210 50

1210349-000-ZKS-0002, 8 December 2016, final
Human Interventions and Climate Change Impacts on the West African Coastal Sand River
19 of 99
Estimates of alongshore littoral transport based on historical shoreline development at
different locations within the study area have been computed as part of this study and they
are presented in Appendix A. In particular, estimates have been derived for: Abidjan, Keta
Lagoon, Lomé port, Cotonou port.
A summary is shown in Table 3.6. These estimates of littoral transport have been used for the
model calibration and validation in Chapter 6.


1210349-000-ZKS-0002, 8 December 2016, final
Human Interventions and Climate Change Impacts on the West African Coastal Sand River
21 of 99
Table 3.6 Net alongshore transport and rates of shoreline development for the four case studies: Abidjan, Keta Lagoom, Lomé port and Cotonou port (Appendix A).
Case-study
Parameter
Abidjan /
Port Bouet
(West of port)
Keta Lagoon Lomé port Cotonou port
Year of construction before 1985 Groyne Field: 2003 Extension: 2013
Port: 1968
Extension west: 2006/2012
Port: 1960-1962
Length of structure (m) 350 - 200 300
Sediment transport (106 m
3/yr)*
- Shoreline analysis** - Literature
0.4 – 0.8
0.6 – 0.8
0.71
0.75
(Anthony and Blivi, 1999)
1
1 – 1.5
(Volta – Lomé;
Anthony and Blivi, 1999)
0.95 (west of port)
1.25 (east of port)
(Delft Hydraulics, 1992)
Shoreline change (m/yr) - Shoreline analysis - Literature
5 – 10
5
5 – 10
5.5 +/- 0.4
(Anthony and Blivi, 1999)
52
30-35
(Anthony and Blivi, 1999)
15 (west of port)
-15 (east of port)
(Delft Hydraulics, 1992)
Affected stretch (km) 10 - 15 ~13 km ~ 4 km 10 - 15
Sediment characteristics - D50 (mm) - D90 (mm)
0.4 mm
0.6
(Anthony and Blivi, 1999)
0.25
0.30
Mitigating measures
Keta sea defence
project (sea wall and
nourishments)
Groynes (since 2013)
* All net sediment transports eastward directed
** Based on active height of 10 m


1210349-000-ZKS-0002, 8 December 2016, final
Human Interventions and Climate Change Impacts on the West African Coastal Sand River
23 of 99
3.9 Anthropogenic interventions
Human interventions have taken places during the years leading to a modification of the
original coastal sediment budget. In this section, the most important interventions which have
impacted this sediment balance are described: river dams and ports.
In addition to those, other form of anthropogenic intervention may modify the coastal
sediment budget as for example: changes in land use in the river basins, local dredging and
dumping of sand, coastal defences (e.g. groynes, seawalls, nourishments), etc.
3.9.1 River dams
River dams affect the coastal sediment budget in different ways. Rivers tend to carry
sediment down the river beds, allowing for the formation of depositional features such as river
deltas, alluvial fans, braided rivers, and beaches. The construction of a river dam first of all
will tend to block the flow of sediment downstream, leading to downstream erosion which can
extend for tens of kilometres below a dam. River dams also modify the hydrograph of the
rivers, leading to a decrease of the peaks in river flows and an increase of the base flow.
Peaks in river flows are generally the ones bringing the largest contribution of sediment
downstream the rivers and, in particular, the coarsest fraction. This sediment fraction is often
the most important building component of many beaches (Giardino, et al., 2015). The impact
of dam development on the downstream river morphology is described, among others, in
Brandt et al. (2000), Beck and Basson (2003), Khan et al. (2014).
Large dams were built in the 1960s, 1970s and 1980s to control the major rivers of Ivory
Coast (Table 3.7). These reservoirs (now referred to as lakes) bear the names of the dams:
Buyo on the Sassandra, Kossou and Taabo on the Bandama, and Ayamé on the small Bia
River in the southeast. Lake Kossou is the largest of these, occupying more than 1600 square
kilometres.
In Ghana, the most important dams are Akosombo, Barekese, Bui and Kpong. The
Akosombo Dam (operational since 1961) on the Volta River have suffered a reduction in
direct fluvial supply, yielding in erosion of the downdrift delta-mouth barrier and shoreface
deposits to fulfil the strong drift requirements (Anthony and Blivi, 1999). The Barakese Dam
supplies about 80% of the potable water for the entire city of Kumasi and it is located on the
Ofin River. The Bui Dam is a 400-megawatt hydroelectric project. It is the newest dam in
Ghana and is the second largest hydroelectric plant after Akosombol. Kpong has a capacity
of 160 megawatts and is located on the lower Volta River.
The Mono River is dammed 160 km from its mouth by the Nangbeto Dam, a partnership
between Benin and Togo completed in 1987. Studies have reported economic benefits from
the dam, including tourism and fishing in the lake behind it. The dam's construction displaced
between 7,600 and 10,000 people, however, and studies indicate that it has substantially
modified the ecology of the lagoon system at the river's mouth by reducing the natural
seasonal fluctuations in river flow. A second dam project, Adjarala Dam, was proposed to be
built on the river between Nangbeto and the river's mouth during the 1990s, but has not been
constructed as of yet. In Benin, the largest water storage, Ilauko Dam, has a capacity of 23,500 m
3 and is used for
irrigation of a sugar cane plantation.

Human Interventions and Climate Change Impacts on the West African Coastal Sand River
1210349-000-ZKS-0002, 8 December 2016, final
24 of 99

1210349-000-ZKS-0002, 8 December 2016, final
Human Interventions and Climate Change Impacts on the West African Coastal Sand River
25 of 99
Table 3.7 Overview of the main river dams within the study area.
Name of dam Country River Sub-basin "Operational
since"
Reservoir
capacity
(million m3)
Reservoir area
(thousand m2) Latitude Longitude
Ayme II Ivory Coast Bia Comoe 1964 69 1,000 5.467 -3.161
Buyo Ivory Coast Sassandra Sassandra 1980 8,300 895,000 6.241 -7.346
Kossou Ivory Coast Bandama Bandama 1972 27,675 1,780,000 7.031 -5.474
Taabo Ivory Coast Bandama Bandama 1979 621 29,700 6.231 -5.084
Akosombo Ghana Volta Volta 1961 147,960 8,482,250 6.350 0.100
Barekese Ghana Ofin Pra 1969 34 6,400 6.836 -1.721
Bui Ghana Volta Mouhoun 2013 12,570 444,000 8.182 -2.166
Kpong Ghana Volta Volta 1981 200 25,200 6.119 0.125
Nangbeto Togo Mono Mono 1987 1,710 180,000 7.533 1.089
Ilauko Benin Ilauko Oueme 1979 24 8.082 2.371


1210349-000-ZKS-0002, 8 December 2016, final
Human Interventions and Climate Change Impacts on the West African Coastal Sand River
27 of 99
3.9.2 Ports
The general effect of port moles on the shoreline evolution is to block (part of) the alongshore
transport, inducing accretion at the upstream side of the structure and erosion on the leeside
(Figure 3.10).
Figure 3.10 Effects of a cross-shore structure (e.g. port jetties) on shoreline development (Van Rijn, 2005a).
In addition, more complex two-dimensional effects can be observed in proximity of the ports
(Figure 3.11). In general, large erosion is expected seaward of front of the port moles, due to
the increased velocity of the water movement. This increase in velocity is caused by the fact
that the current near shore is pushed out towards the sea by the extended port moles. Also,
additional turbulence is created at the head of the port mole, leading to additional sediment in
suspension.
On the upstream side of the structure the general sedimentation trend can be interrupted by
local erosion hotspots. The sedimentation directly at the leeside of the structure is caused by
a decrease in velocity and a reduced wave stirring effect. Further away, erosion occurs.
Figure 3.11 Erosion and sedimentation areas near port jetties (Van Rijn, 1995).

Human Interventions and Climate Change Impacts on the West African Coastal Sand River
1210349-000-ZKS-0002, 8 December 2016, final
28 of 99
Several ports have been built during the years along the coast of Ivory Coast, Ghana, Togo
and Benin. An overview of the main port is shown in Table 3.8.
Table 3.8 Overview of the main ports within the study area.
Anthropogenic interventions Country Date of construction
San-Pédro port Ivory Coast 1970
Abidjan Port Ivory Coast 1951
Takoradi Port Ghana 1928
Takoradi Port extension Ghana 1955
Tema Port Ghana 1961
Lomé Port Togo 1968
Cotonou Port Benin 1963
Ivory Coast greatly contributed to developing maritime transport by building two ports on its
seaside namely, autonomous port of Abidjan, sometimes referred to as "lung of Ivorian
economy", and the San-Pédro port.
San-Pédro is a port town located southwest of Ivory Coast. Until the mid-1960s, San-Pédro
was a tiny fishing village of fewer than 100 inhabitants, but, following the start of port
construction there in 1968, it rapidly grew into a major town. Upon completion of the port in
1970, San-Pédro became the nation’s second largest port (after the capital, Abidjan).
Port activity is concentrated at Abidjan (West Africa’s largest container port), which has
facilities that include a fishing port and equipment for handling containers. The autonomous
port of Abidjan was built in 1951. The autonomous port of Abidjan is ranked first in West
Africa and second in Africa right behind Burdan port in South Africa. The deepening of the
entrance channel implied a modification of the hydrodynamics in the Ebrié lagoon, resulting
into the closure of the Comoé inlet at Grand Bassam, 40 km east to Abidjan.
The Takoradi port and the Tema port are the only ports in Ghana. The Takoradi port is
located in the industrial district of Sekondi-Takoradi and is the oldest port in Ghana, with
construction of the port starting in 1921 and completed in 1928. The Tema port is located in
the southeastern part of Ghana. The construction of the port started in the 1950s.
In Togo, modernization of the port of Lomé started in the 1960s, and a deepwater port,
completed in 1968, maintains a 3,000,000-ton annual traffic. The construction of the
deepwater port has affected the barrier system of the Bight of Benin (Anthony and Blivi,
1999).
Mitigation of coastline retreat up to date has consisted solely of emergency protection of the
Lomé port Kpémé and Aného area. No structural mitigation (such as an artificial sediment
bypass of the Lomé port) has been considered. In the Kpémé area, the coast is protected
with groynes, whereas at Aného a combination of a seawall and groynes has been put in
place.
The construction of Cotonou port started in the early 1960s. The area east of the port, called
The Crique, has since then suffered from severe erosion, with maximum erosion rates of 10-
15 m/ye (Tilmans et al., 1995).

1210349-000-ZKS-0002, 8 December 2016, final
Human Interventions and Climate Change Impacts on the West African Coastal Sand River
29 of 99
3.9.3 Sand mining
Sand extraction is taking place at several locations in the region and for different purposes; in
particular the construction sector is the most demanding one in terms of sand requirement
and it has been increasing in recent years.
The practice of coastal sand mining is often very destructive and poorly managed (or
unmanaged). This loss of beach and dune sand is a direct cause of erosion along many
shorelines. In addition, it is very damaging to the beach fauna and flora, ruinous to beach
aesthetics, and frequently causes environmental damage to other coastal ecosystems
associated with the beach such as wetlands. A major impact of beach sand mining is the loss
of protection against storm surges and wave attack.
Sand extraction becomes however difficult to recognize as the beach readjusts to a new
profile after a few storms. But historic accounts of beaches often reveal that beaches have
been narrowed considerably after mining. Mining is particularly damaging in a time of rising
sea level when sand is sorely needed as a storm energy buffer.
Weighing the risks of mining coastal versus non-coastal sand, most of West African
governments have accelerated their hunt for alternative sand. For instance, since 2008, the
government of Benin has begun digging up sand at more than 30 places along rivers and
lakes in Cotonou and surrounding inland cities Abomey Calavi, So-Ava, Ouidah and Seme
Kpodji. Also this practice needs to be assessed with care as rivers are a very important
source of sediments for the coastal zone (Section 3.8.1). Offshore sediment mining is a
practice not yet widely applied by the local governments. Though banned for several years in
some West African countries, coastal sand mining is still very common, requiring law
enforcement to see this practice changing.
3.9.4 Possible future human interventions
A regional study for shoreline monitoring and drawing up a development scheme for the West
African coastal area was launched by UEMOA and was implemented by the International
Union for the Conservation of Nature (IUCN). The study provides a management scheme for
the entire coast comprising 44 littoral zones containing 176 sectors; each sector defining a
relatively uniform portion of the shoreline (UEMOA, 2011; UEMOA, 2015). For each sector,
the following items were presented: main set of issues, diagnostics, dynamics, stakes, actions
and priority. In addition, the study provides an indication of the possible future human
interventions along the coast. A summary is given in Table 3.9.
Table 3.9 Possible future human interventions along the West African coast as indicated by UEMOA (2011, 2015)
Location Possible human developments
Cavally estuary Port town at Harper (Liberia)
San Pedro Port extension, airport area, tourist development
Grand Lahou Programme for stabilization of urban and tourist installations
Port Bouet Widening of Vridi pass, protection plan with 8 breakwaters
Grand Bassam Reopening of Comoé River mouth, protection scheme (groins)
Takoradi-Sekondi Port extension
Tema Withdrawal (relocation) of habitants
Keta Follow-up Keta Sea Defence Project
Lomé Future new installations
Katanga to Gbojomé Protection groins and nourishments
Human Interventions and Climate Change Impacts on the West African Coastal Sand River
1210349-000-ZKS-0002, 8 December 2016, final
30 of 99
3.10 Shoreline development
In this section, information on coastal changes from different literature sources within the
study area is summarized. Given the large extension of the study area, literature values from
different authors are not always consistent as erosion/deposition rates may be computed
following different methodologies or for different periods, making the results often difficult to
compare. This asks for the need for a quantitative and homogeneous sediment budget study
for the entire region, which is the scope of this study.
3.10.1 Ivory Coast
The shoreline development close to the port of San-Pédro is documented by Abe (2005). At
the east side of the port, the coastal retreat between 1972 and 1993 reached 38,8 m. At
Grand-Lahou, values of coastal retreat within different periods have been reported by Wognin
(2004) and Abe (2005). The erosion rates are summarized in Table 3.10, reading a rate (in m)
between 2 years (i.e. the one in the first row versus the one in the first column). For instance,
a rate of 0.3 m/yr has been calculated for the period between 1971 and 1957.
Table 3.10 Erosion rates (m/yr) in different periods at Grand-Lahou (Wognin, 2004)
1971 1986 1988 1993 1995
1957 0.3 0.45 0.72 0.78 1.23
1971 1.23 1.06 1.08 1.77
1986 4.66 2.16 3.74
1988 1.16 3.48
1993 9.28
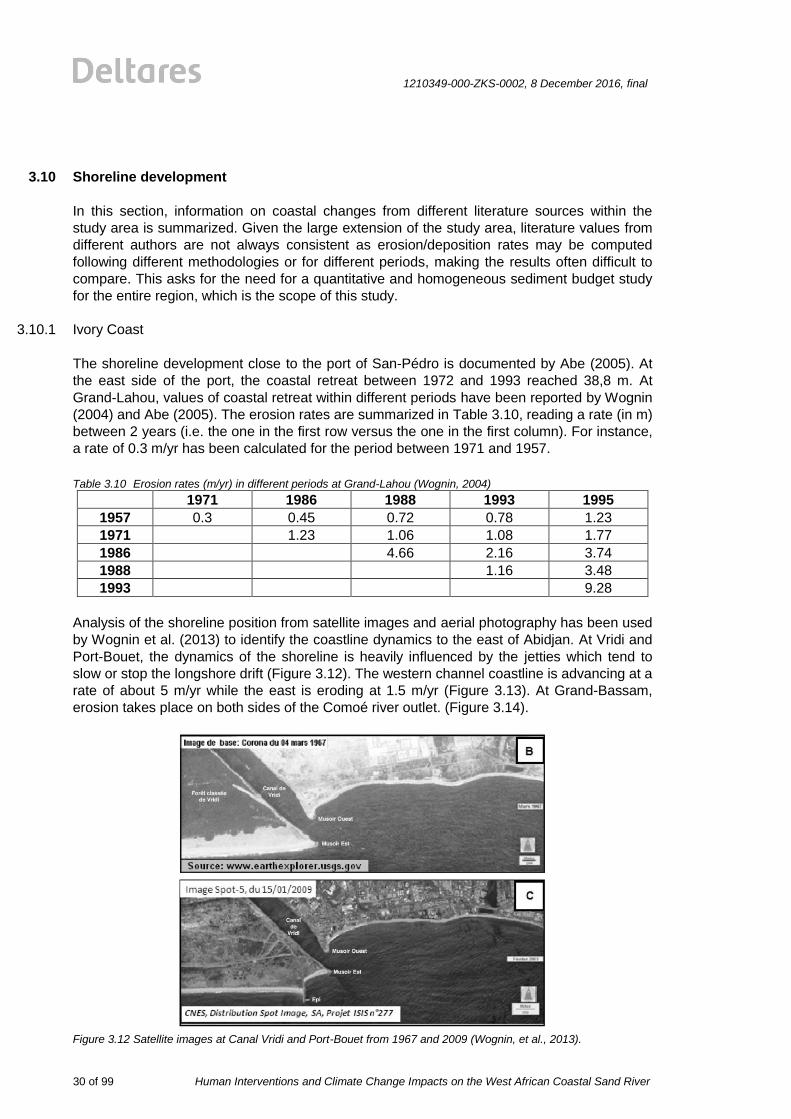
Analysis of the shoreline position from satellite images and aerial photography has been used
by Wognin et al. (2013) to identify the coastline dynamics to the east of Abidjan. At Vridi and
Port-Bouet, the dynamics of the shoreline is heavily influenced by the jetties which tend to
slow or stop the longshore drift (Figure 3.12). The western channel coastline is advancing at a
rate of about 5 m/yr while the east is eroding at 1.5 m/yr (Figure 3.13). At Grand-Bassam,
erosion takes place on both sides of the Comoé river outlet. (Figure 3.14).
Figure 3.12 Satellite images at Canal Vridi and Port-Bouet from 1967 and 2009 (Wognin, et al., 2013).

1210349-000-ZKS-0002, 8 December 2016, final
Human Interventions and Climate Change Impacts on the West African Coastal Sand River
31 of 99
Figure 3.13 Shoreline evolution at Canal Vridi West and Port-Bouet between 1975 and 2008 (Wognin et al., 2013).
At Port-Bouet, values of coastal retreat within different periods have been reported by Wognin
(2013). The erosion rates are summarized in Table 3.11.
Table 3.11 Erosion rates between different periods at Port-Bouet (Wognin, 2013)
1979 2008
1975 21 m
5.2 m/yr
160 m
4.8 m/yr
1979 139 m
+4.8 m/yr

Human Interventions and Climate Change Impacts on the West African Coastal Sand River
1210349-000-ZKS-0002, 8 December 2016, final
32 of 99
Figure 3.14 Shoreline evolution at Grand Bassam from 1989 to 2006 (Wognin et al., 2013).
3.10.2 Ghana
The general alongshore littoral transport pattern is from west to east (Ly, 1981). This transport
is significantly reduced on the immediate west of Cape Three Points where much of the
sediment is deposited. Deposition of sediment occurs not only on the beach causing a slight
progradation of the shoreline but also in estuaries as tidal deltas.
The central coast of Ghana represents a medium-energy environment with wave heights
usually not exceeding 1.5 m in the surf zone. The coast is characterized by a southwesterly
prevailing wind causing an oblique wave approach to the coastline.

1210349-000-ZKS-0002, 8 December 2016, final
Human Interventions and Climate Change Impacts on the West African Coastal Sand River
33 of 99
Evidence of coastal erosion occurs on many parts of the eastern coast of Ghana. The coast is
characterized by a medium- to high-energy beach with wave heights often exceeding 1 m in
the surf zone. With a smooth and sandy shoreline trending east to northeast and a
southwesterly prevailing wind, the coast is characterized by an active littoral transport,
generally from west to east (Ly, 1980).
Changes in coastline position in central and eastern Ghana were examined at several
locations by Ly (1980). Figure 3.15 illustrates the shoreline changes at Sekondi, Cape Coast,
Labadi, Ada, and Keta, especially shortly after the Takoradi Port extention and after
construction of the Akosombo dam in the Volta River.
The western portion of the central coast between Cape Three Points and Winneba is
characterized by a generally stable shoreline. Changes of coastline in the Sekondi area
between 1963 and 1973, and in the Cape Coast area between 1948 and 1973 were not
marked (Figure 3.15, A, B). Retreat of shoreline occurs in many areas of the eastern portion
of the central coast, and on the eastern coast. At Labadi, the retreat occurs with an average
of 3 m per year after dam construction (Figure 3.15, C). At Ada, the existence of 1939, 1961
and 1976 shorelines (Figure 3.15, D) allows a comparison of the average rates of shoreline
retreat for the periods before and after dam construction. These rates are almost the same for
the two periods. Retreat of shoreline averaged 2.2 m per year between 1939 and 1961, while
it increases to an average of 2.4 m per year after 1961. In the Keta area, the rate of shoreline
retreat between 1923 and 1949 determined from two town maps averaged 4 m per year
(Figure 3.15, E'). This rate increased to about 6 m per year during the 1959-1975 period.
Figure 3.15 (E) illustrates that the most rapid retreat of shoreline occurs after 1964 when
averages of 8 m to 10 m per year are observed in some portions of the Keta coast, and which
can probably be related to the construction of the Akosombo dam (Ly, 1980).
Figure 3.15 Shoreline changes in central and eastern Ghana established from aerial photographs and maps
produced between 1923 and 1976. From Ly (1980).

Human Interventions and Climate Change Impacts on the West African Coastal Sand River
1210349-000-ZKS-0002, 8 December 2016, final
34 of 99
More recently, research studies (Wiafe, 2011) employed satellite remote sensing coupled with
field surveys to investigate the processes governing shoreline change in Ghana, leading to a
different system of zoning the shoreline, based on the orientation of the shoreline, with four
sections namely western corner section (WCS), mid-section (MS), eastern section (ES) and
eastern corner section (ECS).
According to Wiafe (2011), between 1974 and 2005 shorelines in Western Ghana retreated at
an average rate of 1.58 m/year with considerable variation along the coast. In total, only 8%
of the shoreline experienced accretion at an average rate of 1.67 m/year. It was observed that
the various zones along the coast exhibited different rates of shoreline changes: ECS (1.79
m/year), MS (1.11 m/year), ES (2.50 m/year), and ECS (2.31 m/year) (Figure 3). The
maximum annualised uncertainty was estimated to be 0.29 m/year.
A longer term view on shore erosion is provided by Boateng (2012). Large scale assessment
of coastal recession in Ghana was carried out through field investigation, applied coastal
geomorphology and GIS techniques to selected case study areas. The assessment covered
203 km out of the 540 km coastline of Ghana. Results of the assessment indicate that coastal
erosion is very substantial and wide spread along the coast, but the rate of recession varies
across the entire coastline. Results are summarized in Figure 3.16 to Figure 3.19.
Figure 3.16 Coastline change near Axim over the period between 1895 and 2002 (Boateng, 2012).

1210349-000-ZKS-0002, 8 December 2016, final
Human Interventions and Climate Change Impacts on the West African Coastal Sand River
35 of 99
Figure 3.17 Coastline change near Takoradi over the period between 1895 and 2002 (Boateng, 2012).
Figure 3.18 Coastline change near Accra over the period between 1895 and 2002 (Boateng, 2012).

Human Interventions and Climate Change Impacts on the West African Coastal Sand River
1210349-000-ZKS-0002, 8 December 2016, final
36 of 99
Figure 3.19 Coastline change near Ada over the period between 1895 and 2002 (Boateng, 2012).
3.10.3 Bight of Benin, including Eastern Ghana, Togo and Benin
From an analysis of historical records, both Kumapley (1989) and Blivi (1993) suggested that
the area near Keta in the western Bight of Benin has been under fluctuating erosion and
accretion since at least 1860. Since the mid-1880s, a realistic estimate of net erosion of this
area is probably close to 1 km (Kumapley, 1989). Old maps show that this delta-mouth barrier
stretched continuously up to Aného.
According to Anthony and Blivi (1999), this long-term state of equilibrium has been modified
since modern dam and coastal infrastructures have been installed. Among others, the
construction of the Akosombo Dam on the Volta River in 1961 resulted in a drastic reduction
in sand supply to the Bight of Benin coast (Ly, 1980). In particular, the necessity to satisfy the
strong longshore drift budget towards Togo has resulted in considerable reworking of the
Volta delta-mouth barrier segment itself, including the nearshore zone, threatening coastal
settlements, notably Keta (Figure 3.20).
In addition, Anthony and Blivi (1999) suggested that this zone was in relative equilibrium has
evolved into a zone of cell segmentation (Figure 3.21).Cell segmentation has involved
substantial accumulation of sand on the Volta delta spit complex especially since the 1960s.
Anthony and Blivi (1999) have estimated the amount of sand locked up in this prograding spit
between 1968 and 1996 at 20 x 106 m
3.
The most severely threatened area between the prograding Volta barrier and the Togolese
coast is now characterised by a narrow (< 100 m wide) eroding transgressive barrier subject
to overwash during the summer months of strong swell. In places, muddy backbarrier
marshes are now exposed along the beach (Anthony and Blivi, 1999).

1210349-000-ZKS-0002, 8 December 2016, final
Human Interventions and Climate Change Impacts on the West African Coastal Sand River
37 of 99
Deltaic sand sequestering to the detriment of coasts downdrift is a frequent condition in river
deltas under stress from decreasing sediment supply. According to Anthony et al. (2016),
complex adjustments (sediment supply from the river, internal delta dynamics and the strong
longshore drift on this coast) have notably involved sequestering of sand by the Volta delta,
with consequent morphodynamic feedback reflected by erosion that affects the bight coast
downdrift of the delta.
Figure 3.20 Aerial photograph (1986) of the barrier in Keta, with levelling of the shoreline in 1992, showing the
recent massive sedimentation and downdrift erosion. From Anthony and Blivi (1999).
Figure 3.21 Summary of recent changes in longshore barrier front dynamics resulting from both modulation of
fluvial and deltaic sand supply by the Volta and construction of Lomé port. From Anthony and Blivi (1999).
West of Lomé port, built in 1967, the erosional sector up to Adina is followed by a sector of
overall net shoreline stability (Figure 3.21). Beyond this sector, progradation increases
steadily to attain a maximum of close to 1 km in the last 30 years just updrift of the main
western port breakwater (Figure 3.22).
Beyond the breakwater, the segmented drift cell once again comprises an erosional sector
that affects the Togolose coast up to the Benin border. Erosion has resulted in considerable
damage to the former main coastal international highway and in the landward relocation of
numerous former coastal villages and fishing communities. This erosion has necessitated the
emplacement of a groyne field in 1988 to protect Aného and a nearby phosphate export
facility. According to Anthony and Blivi (1999), the shoreline stability assured by this groyne
field has exacerbated barrier erosion downdrift in western Benin. It has also resulted in a

Human Interventions and Climate Change Impacts on the West African Coastal Sand River
1210349-000-ZKS-0002, 8 December 2016, final
38 of 99
longer period of opening of the Aného inlet (up to four months a year), inducing greater
saltwater intrusion into the essentially freshwater lagoonal system of Togo.
Figure 3.22 Shoreline changes on either side of Lomé port breakwater between 1967 and 1992. Erosion east of the
breakwater has been attenuated by longshore exposures of highly indurated beachrock that acts as natural
breakwaters. From Anthony and Blivi (1999).
On the Togo shoreline, an elongated occurrence of beachrock has been exposed since the
1980’s. Upon completion of the Akosombo dam in the Volta River (Ghana) in 1961, sediment
supply to the Gulf of Benin was cut, causing erosion and exposure of buried beachrock (Blivi,
1998). The construction of the deepwater port at Lomé (Togo) further aggravated this
process, whereas erosion continued along over 100 km of shoreline. The coast retreat rates
are in the order of 4 m/yr (Rossi, 1988). The beachrock present in the surf zone acts as a
barrier, thus slowing down the coastal erosion process. However, it is unknown at which rate
the beachrocks are eroded (Gischler, 2007), which zones are most vulnerable to erosion and
how the beachrock formation will continue to ‘protect’ the shoreline in the near future.
Further east along the Benin coastline, erosion to the east of Cotonou has been consistent
since port structures have been built in the early 1960s (Tilmans, et al., 1995). Especially, the
area called “La Crique” has suffered from severe erosion, with maximum erosion rates of 10-
15 m/yr (Figure 3.23).
Figure 3.23 Cotonou port with accretion and erosion zones. From Tilmans et al., 1995

1210349-000-ZKS-0002, 8 December 2016, final
Human Interventions and Climate Change Impacts on the West African Coastal Sand River
39 of 99
Kaki et al. (2011) discuss the evolution of Cotonou Coastline in Benin during the past fifty
years. The study is based on detailed analysis of remote sensing data and completed by
various ground missions.
According to Kaki et al. (2011), an area of continual accumulation was observed in the west
of sea port of Cotonou (Figure 3.24). The source area of this sediment cell is the Mono River
which drained about 100,000 m³ / year as according to Blivi (2000) before the dam Nagbeto
was constructed and which reduced to 44,000 m³/year at present. Between 1963 and 1981,
two different behaviours can be distinguished: (1) in a transition area, a soreline retreat of 75
meters was observed over 18 years, at an erosion rate of 4 m / year; (2) the area closer to the
port, on the other hand, was subject to accretion. A strip of sand with a maximum width of 460
meters was built over the 18 years, at a maximum rate of 25.5 m / year. Between 1981 and
1995, sand accumulation was observed in both areas, with an advancement of the beach of
100 meters observed in 14 years, at a rate of 7 m / year. From 1995 to 2005, the same
pattern as in the previous period is observed. A strip of sand of 115 meters width was built in
ten years, at an accretion rate of 12 m / year.
Figure 3.24 Evolution of area west of Cotonou port from 1963 to 2005. From Kaki et al. (2011).
According to Kaki et al. (2011), the area east of the sea port shows intense erosion (Figure
3.25). It is the source area for sedimentation further east. Sediments that are pulled out from
"Eldorado Creek” are redistributed after crossing a stability area that is only a few kilometers
away. The shaft area covers an important coastal zone from Seme beach to the west side of
the Niger Delta in Nigeria. Between 1963 and 1981, the coastline retreat was of 380 meters,
at an erosion rate of 21 m/year. In the accretive area, a strip of sand with a width of 80 meters
was built at a rate of 4.5 m/year. Between 1981 and 1995, the erosive part experienced a
coastline retreat of 135 meters, at a rate of 10 m/year, whereas the accretive part
experienced a coastline expansion of 165 meters, at a rate of 12 m/year. Finally, between
1995 and 2005, both areas experienced a coastline retreat, respectively of 55 meters and 100
meters, i.e. erosion rates of 6 m / year and 10 m / year.
In Kaki et al. (2011), the accretion at some distance east of the port in the period 1963-1995
is not explained, and neither the reversal of the trend in this area from accretion to erosion in

Human Interventions and Climate Change Impacts on the West African Coastal Sand River
1210349-000-ZKS-0002, 8 December 2016, final
40 of 99
the period 1995-2005. From the convex shoreline shape in this area, we consider erosion (or
stability) to occur more likely than accretion. Moreover, accretion in this area is not expected
on the basis of the study by Laibi et al. (2014)
Figure 3.25 Evolution of area east of Cotonou port from 1963 to 2005. From Kaki et al. (2011).
As indicated Laibi et al. (2014), the major port breakwaters have significantly impacted the
litoral drift, breaking down the equilibrium shoreline alignment that prevailed prior to port
construction, especially in the more updrift sectors of Togo and Benin. These structures have
also generated accretion sand updrift, and several hundreds of metres of beach progradation
over a shoreline distance of up to 5 km. The erosional sectors downdrift of the ports are
longer (up to 20 km), and their erosion ensures continuity of the strong drift potential (Figure
3.26). The erosional sector in Cotonou has been further complicated by a canal cut through
the beach-ridge barrier in 1888 to alleviate river flooding of Lake Nokoué, the wide, circular
lagoon in this sector. The erosion downdrift of these ports is a threat to large areas of the
cities of Cotonou, Lomé, and to numerous villages, as well as coastal infrastructure.

1210349-000-ZKS-0002, 8 December 2016, final
Human Interventions and Climate Change Impacts on the West African Coastal Sand River
41 of 99
Figure 3.26 Current longshore drift cells and erosion and accretion associated with port breakwaters in the Bight of
Benin. (a) Drift cell structure: a = accretion, e = erosion, s? = presumed stability; (b) the Volta delta; (c) port
of Lomé; (d) port of Cotonou; (e) port of Lagos. From Laibi et al. (2014)
3.11 Conclusions
In this chapter, the physical system of the study area (Ivory Coast, Ghana, Togo and Benin)
has been described by means of a wide literature review covering the main aspects which
can affect the coastal sediment dynamics. In particular, the major anthropogenic interventions
both on the major rivers and along the coastline have been summarized as well as their
effects on historical shoreline changes.
Although very useful for model validation, the information available from literature is very
scattered and not always consistent. This asks for the need for a quantitative and
homogeneous sediment budget study for the entire region, which will be the scope of the
following work (Chapter 5 and 6).


1210349-000-ZKS-0002, 8 December 2016, final
Human Interventions and Climate Change Impacts on the West African Coastal Sand River
43 of 99
4 Data description
4.1 Introduction
In order to carry out the large-scale numerical modelling study, a number of input data are
required. In particular, the following datasets were used as input for this study:
Bathymetric data
Wind and waves
Sediment characteristics
Sediment input from rivers
Sea level rise scenarios
Predicted changes in wave climate
The following sections provide information concerning these data, by detailing their source
and possible post-processing.
4.2 Bathymetry
The depth information is obtained primarily from the GEBCO’s global bathymetric data sets.
The GEBCO’s gridded bathymetric data sets are global terrain models for ocean and land
and include the GEBCO_2014 Grid which is a global 30 arc-second interval grid. GEBCO's
global elevation models are generated by the assimilation of heterogeneous data types
assuming all of them to be referred to mean sea level. The extent of the area of interest
ranges in spherical coordinates (WGS84) from approximately 2 to 6.5 degrees N and -4 to 8.5
degrees W.
The GEBCO’s gridded bathymetric data sets are known to have less accuracy in shallow
waters by depths up to the 100-200 m isolines. The depth information retrieved after
digitalization of the Admiralty Charts n˚ 1362 (Harper to Sassandra), 3100 (Sassandra to
Lagune Aby), 1383 (Lagune Aby to Cotonou), and 1384 (Tema to Cotonou) has been
therefore used in complement to the GEBCO bathymetric data.
4.3 Wind and waves
4.3.1 ERA interim dataset
ECMWF (European Centre for Medium-Range Weather Forecasts) wind and wave data were
used in this study. In particular, the most recent reanalysis of these data was used (Dee et al.,
2011). The data are 6 hourly, starting from 1979 and are available on a global grid with a
resolution of about 0.75° x 0.75°. The data contains information on wind speed (U10), wind
direction as well as on wave conditions (wave height, period and direction). Figure 4.1 shows
offshore wave and wind roses for the study area computed by performing a wave
schematization on wave and wind time series between 1979 up to 2014. The wave climate
suggests waves from SSW direction with an angle relative to the North which increases from
West to East and most of the waves between 1 and 1.6 m. Winds are also from the South-
West.

Human Interventions and Climate Change Impacts on the West African Coastal Sand River
1210349-000-ZKS-0002, 8 December 2016, final
44 of 99
Figure 4.1 Spatial distribution of the offshore wave (upper panel) and wind conditions (lower panel) in the area of
interest based on ERA-Interim data
4.3.2 Altimeter data
An altimeter is a pointing radar pulse from satellites designed to measure the echoes from
ocean and ice surfaces. Over the ocean, it is used to measure sea-surface elevation and
wave height. For this retrieval we use the ocean reflected signals and apply either a Ku or a C
frequency band. The Ku band is the 12–18 gigahertz (GHz) portion of the electromagnetic
spectrum. The C band ranges of frequencies from 4.0 to 8.0 GHz. In this altimeter data are
used to calibrate the ERA interim dataset.
When we take into account waves in the altimeter database with a 2 hour fly-over window and
a spatial-radius of 200 meter the waves in the ERA-interim data underestimates the
significant wave height with 5-13%, as can be seen in Figure 4.2. An underestimation in wave
height of about 10% for ERA-Interim data is common based on our experience and it is
related to model accuracy and approximations. In order to take this into account the
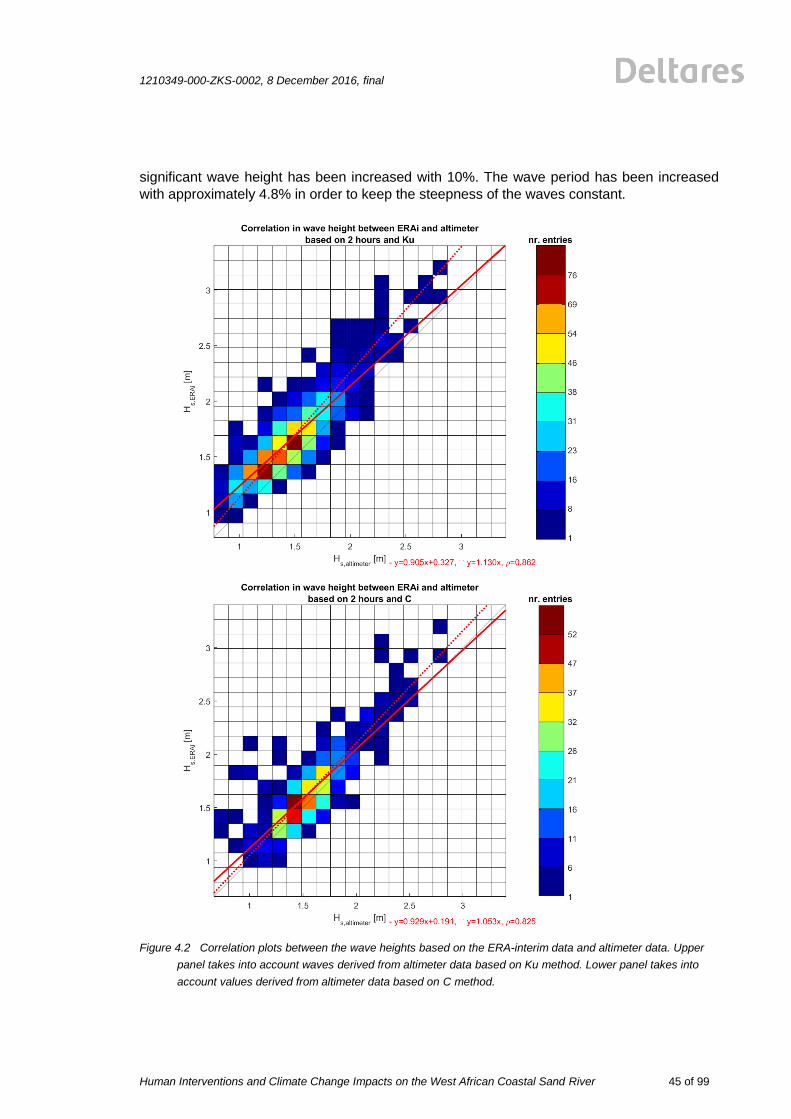
1210349-000-ZKS-0002, 8 December 2016, final
Human Interventions and Climate Change Impacts on the West African Coastal Sand River
45 of 99
significant wave height has been increased with 10%. The wave period has been increased
with approximately 4.8% in order to keep the steepness of the waves constant.
Figure 4.2 Correlation plots between the wave heights based on the ERA-interim data and altimeter data. Upper
panel takes into account waves derived from altimeter data based on Ku method. Lower panel takes into
account values derived from altimeter data based on C method.

Human Interventions and Climate Change Impacts on the West African Coastal Sand River
1210349-000-ZKS-0002, 8 December 2016, final
46 of 99
4.4 Coastal types
The Western part of Ivory Coast is mainly characterized by pocket beaches separated by
rocky outcrops, which continues approximately until 25km to the east of Sassandra. From this
point, moving towards the east, the coastline is characterized by a long sandy stretch until
Ghana.
Further to the east, a cliffs type of coast with pocket sandy beaches can be found around
Cape Three Point for a length of about 100 km. From this point, moving towards the east the
coast is still sandy but more irregular, with different orientation and occasionally interrupted by
rocky outcrops. The eastern part of Ghana till the boundary with Ivory Coast is characterized
by the large Volta delta which protrudes into the sea and with a total width of the delta
morphological feature of more than 100 km. Further to the east, the coastline of Togo and
Benin is mainly characterized by a straight and long sandy coast.
4.5 Sediment inputs from rivers
The sediment input from the main rivers into the coastal system was estimated following the
information provided in Section 3.8.1.
On-going work is being carried out to estimate the sediment yield from the different river
catchments by means of the hydrological W-FLOW model (Deltares, 2016) extended with a
sediment module.
4.6 Impact of climate change
4.6.1 Sea level rise
Sea level rise affects the coastal sediment budget in multiple ways: on one hand sea level
rise leads to a general coastal recession which can be roughly estimated based on the
general Bruun rule. According to the Bruun rule, the shoreface profile moves upward by the
same amount as the rise in sea level, through erosion of the upper shoreface and deposition
on the lower shoreface (www.simplecoast.com). Although, the validity of the Bruun rule has
been questioned in literature (e.g. Cooper et al., 2004; Ranasinghe et al., 2012), no practical
alternative exist to carry out the assessment within the scope of this study and at this scale.
On the other hand, sea level rise also contributes to an increase in wave height due to a
reduction in wave dissipation while propagating towards the shore. Those two effects will be
explored as part of the modelling work in Chapter 5 and 6.
In order to assess the effect of sea level rise scenario for a wide spectrum of projections, two
sea level rise rates (i.e. a lower-end and an upper-end scenario) were used as input to our
numerical modelling framework. In particular, a value of + 0.3 m, roughly corresponding to a
projection for the year 2070 and considering the sea level rise scenario RCP 4.5 at the 0.05
percentile at location (-1.5° E, +3.5° N) off the coast of Ghana, and a value of + 1.0 m,
roughly corresponding to a projection for the year 2100 and considering the sea level rise
scenario RCP 8.5 at the same location at the 95 percentile.

1210349-000-ZKS-0002, 8 December 2016, final
Human Interventions and Climate Change Impacts on the West African Coastal Sand River
47 of 99
4.6.2 Waves
The effect of predicted changes in wave conditions was estimated based on Hemer et al.
(2013). According to the study, an increase in wave height up to 3% and a clockwise rotation
up to 2° can be expected in the time slice 2070-2100 in the West Africa region, when
compared to the present climate (time slice 1979-2009). These values have been adopted in
the numerical models to estimate the impact of climate change on the coastal sediment
budget (Chapter 6).
4.7 Summary
Information, characteristics and sources, to be used during the modelling study, are
summarized in the Table 4.1.
Table 4.1 Matrix of data to be used for the modelling study
Data set Description Resolution Format
type
Time
interval
collected
Source
Bathymetric gridded
bathymetric data
sets
30 arc-
second
interval grid
(x, y, z) - GEBCO
Bathymetric sampled
bathymetric data
sets
- (x, y, z) - Admiralty
Charts
Wind wind speed,
direction
0.75° x
0.75°
U10, dirW 1979 - 2014 ECMWF
Waves wave height,
period and
direction
0.75° x
0.75°
Hs, Tp, Dir 1979 - 2014 ECMWF
Altimeter
data
ocean reflected
signals
- 1979 - 2014 various
satellites
Sediment
input from
rivers
sediment yield
from the different
river catchments
- m3 per year before and
after
damming
estimated
Sea Level
Rise
Local sea level
rise projection
- m - RCP 8.5


1210349-000-ZKS-0002, 8 December 2016, final
Human Interventions and Climate Change Impacts on the West African Coastal Sand River
49 of 99
5 Numerical models
5.1 Introduction
In this chapter, the different numerical models used to carry out the sediment budget study for
the entire area are described.
In particular, the modelling framework includes:
A wave model
A sediment transport and shoreline evolution model, including the sediment input from
major rivers
Modelling settings are described, alongside modelling assumptions which were necessary in
order to reach the objective of the study: a quantification of the large-scale sediment budget
for the West African coast.
The results from the large-scale numerical modelling study are described in Chapter 6.
5.2 Wave model
5.2.1 Model description
The wave modelling was based on the DELFT3D-WAVE (SWAN) model, developed in close
cooperation between TU Delft and Deltares (Booij et al., 1999). SWAN is a third-generation
shallow water wave model, which is based on the discrete spectral action balance equation.
The model is fully spectral and solves for the total range of wave frequencies and wave
directions, which implies that short-crested random wave fields propagating simultaneously
from widely different directions can be accommodated. The processes of wind generation,
dissipation and non-linear wave-wave interactions are represented explicitly. A more
complete description of the SWAN wave model can be found in Booij et al. (1999).
The directional grid covers the full circle (360°), allowing for waves to travel to and from all
directions. The number of directional bins is 72, which results in a directional resolution of 5°.
The spectral grid covers a frequency range from 0.03 Hz to 2.0 Hz, allowing for wave periods
from 0.5 to 33.3 s. The number of frequency bins is 40. The version of SWAN used in this
study is 40.72A.
5.2.2 Model setup and bathymetry
The SWAN model requires a spatial grid on which to calculate the wave propagation. Herein
an overall and fifteen nested wave grids are set up to obtain sufficient accuracy in the area of
interest for this study, see Figure 5.1. The overall grid is set up in spherical coordinates
(WGS84) and extends from approximately -10 to 6 degrees in longitude and 3 to 6 degrees in
latitude. It has a grid size of approximately 1000 m in both cross-shore and longshore
direction. The detailed grids have a finer resolution of 50 meter in cross-shore and 100 meter
in longshore direction.

Human Interventions and Climate Change Impacts on the West African Coastal Sand River
1210349-000-ZKS-0002, 8 December 2016, final
50 of 99
Figure 5.1 Outlines of computational grids used (blue: overall grid, red: detailed grids). Green dots represent the
ERA-interim points used to determine the wave forcing (Section 5.2.3).
The depth schematization for the overall and detailed model grids is initially interpolated
from the GEBCO08 global bathymetric data set. Grid cells with a water depth between 0
and 1000 meter are updated based on nautical charts and shoreline data from Google Earth
(Section 4.2). The bathymetry of the detailed coastal grid (in meter to MSL) is presented in
Figure 5.2. The overall model covers the entire area were waves relevant for the area of
interest can propagate from and start at a depth of approximately 5000 meter. The fifteen
detailed nested models start at a depth of approximately 500 meter.
Figure 5.2 Bathymetry of the overall grid (w.r.t. MSL)
5.2.3 Waves classification
To determine the nearshore local wave climate, the wind and wave data from ERA-interim
reanalysis is reduced to a series of combinations that represent the annual climate. This is
done in order to reduce the computational time. The ERA-interim data point at Lat. 3N Lon. -
2.25E is used as reference point for the determination of the wind and wave climate for the

1210349-000-ZKS-0002, 8 December 2016, final
Human Interventions and Climate Change Impacts on the West African Coastal Sand River
51 of 99
wave model. At this location, the wind and wave data are divided into 139 separate classes,
based on wave height (classes of 0.25 m), wave direction (classes of 10°), wind direction
(classes of 10°) (Figure 5.3). For each class, an average wave (height, period, direction) and
wind (speeds and direction) are determined. The wind and wave conditions derived at the
reference point cannot be applied across the entire model as in reality spatial gradients in
wind and wave conditions occur. Spatially varying wave conditions are found by interpolating
the ERA-interim data along the outer edge of the overall model grid and by interpolating
the wind conditions on a spatially varying grid covering the entire model domain. Each of the
139 combined wind and wave scenarios are computed in separate stationary SWAN
computations.
Figure 5.3 Joint occurrence table for significant wave height and mean wave direction for the ERA-interim
reference data point at Lat. 3N, Lon. -2.25E.

Human Interventions and Climate Change Impacts on the West African Coastal Sand River
1210349-000-ZKS-0002, 8 December 2016, final
52 of 99
5.3 Shoreline evolution model
5.3.1 Model description
The UNIBEST-CL+ modelling package is a shoreline evolution model developed by Deltares
(Deltares, 2011). The name UNIBEST is an acronym for Uniform Beach Sediment Transport.
The modelling package consists of two separate modules: the Longshore Transport (LT) and
the CoastLine (CL) module.
The LT-module calculates the magnitude of longshore sediment transport for specific
locations along the coast. An assumption made in these calculations is that the beach is
uniform in the alongshore direction. The longshore transport is forced by wave-induced
longshore drift and/or tidal flow. The surfzone dynamics are derived from a built-in random
wave propagation and decay model, taking wave breaking and bottom friction into account.
Furthermore, the calculations of longshore transport depend on the topography of the cross-
shore profile, the grain size of the sediment, the sediment transport formula and the
orientation of the coastline with respect to the incident wave energy. The model calculates
longshore transport for the actual coastline orientation and a variety of coastline orientations
that are smaller and larger than the actual coastline orientation. These computations result in
a set of longshore transport magnitudes (S) for several coastline orientations (Φ). A third-
order approximation of these values gives an S-Φ curve for a specific cross-shore coastal
profile and wave climate.
Consequently, the coastline evolution (CL) module calculates coastline changes at specific
locations on a predefined numerical one-dimensional grid. This grid is a schematization of the
coastline. The evolution of the coastline depends on the magnitude and direction of the
alongshore transport, which is prescribed for every location by the previously defined S-Φ
curves. A change in coastline orientation, as a result of coastline development, gives a
change in the magnitude of longshore transport. In this way the CL-module is able to simulate
coastline evolution very computationally efficient on the basis of the S-Φ curves.
5.3.2 Calculation of longshore transport
The longshore transport computations are executed for 72 selected locations along the West
African coast. The nearshore wave data that is used for these computations is extracted from
the 15 detailed SWAN models (see Section 5.2). Results from the wave modelling
calculations are shown in Section 6.2. The wave data at the 72 defined locations along the
West African coast is extracted from a depth of -15 m, normal to the coast orientation. An
example of the locations where the wave data is extracted with respect to the coastline is
shown in Figure 5.4, for a stretch of coast near Abidjan. One-dimensional wave propagation
and decay from the -15 m point towards the coastline is modelled by the built-in wave model.

1210349-000-ZKS-0002, 8 December 2016, final
Human Interventions and Climate Change Impacts on the West African Coastal Sand River
53 of 99
Figure 5.4 Locations where wave data is extracted from the wave modelling results (white dots). In the background
in colours, the bathymetry is shown.
The longshore transport computations are based on an equilibrium coastal profile which is
applied for the entire stretch of the West African coast. The equilibrium profile is determined
assuming a Dean profile (Dean, 1977):
(1)
Here, h is the water depth, y is the cross-shore distance from the coastline and A is a
parameter that determines the steepness of the profile:
(2)
Where ω is the sediment fall velocity for which the Soulsby (1997) formula is used. The
steepness of the equilibrium profile depends on the median grain diameter via the sediment
fall velocity, which is assumed as uniform grain size of 250 µm. The equilibrium profile is
shown in Figure 5.5. The profile is defined by equation (1) between 0 m and -15 m. Between
3 m and 0 m the profile is defined by a beach profile with a steepness of approximately 1:30.
Figure 5.5 Equilibrium profile defined by Dean et al.(2002) equations with a median diameter of 250 µm.
The direction, magnitude and distribution along the cross-shore profile of sediment-transport
are calculated for the 139 near-shore wave scenarios individually (see Section 5.2). These
computations are performed based on the Van Rijn (1993) sediment transport formula. The

Human Interventions and Climate Change Impacts on the West African Coastal Sand River
1210349-000-ZKS-0002, 8 December 2016, final
54 of 99
transport for each cross-shore profile is determined for each of the wave conditions and
added up to determine a total transport. A list of the main parameters used for the sediment
transport calculations is shown in Table 5.1.
Table 5.1 Main parameters used for the sediment transport calculation.
Quantitiy Parameter Unit Value
Active height - m 10
Dynamic boundary
Transport boundary
Grain diameter (50th percentile) D50 µm 250
Grain diameter (90th percentile) D90 µm 275
Sediment density ρs kg/m3 2650
Seawater density ρw kg/m3 1025
Current related bottom roughness fc m 0.05
Wave related bottom roughness fw m 0.05
Fall velocity suspension material ω m/s 0.02
Viscosity ν m2/s 1∙10
-6
Relative bottom transport layer thickness - 0.03
Porosity - 0.4
The results of the longshore sediment transport modelling are 72 S-Φ curves (one for each
location along the entire domain) that describe the longshore transport magnitude for different
coastline orientations. An example of an S-Φ curve at the Volta River outlet is shown in
Figure 5.6. The black dotted line shows the current coastline orientation at the location of the
S-Φ. The red dotted line shows the equilibrium orientation of the coast as calculated by the
model (i.e. zero transport).
Figure 5.6 S-Φ curve for a location at the Volta River outlet (see inset). The calculated transports are given by the
blue asterisks, the blue continuous line is the third order approximation of these values, which describes the
S-Φ curve.

1210349-000-ZKS-0002, 8 December 2016, final
Human Interventions and Climate Change Impacts on the West African Coastal Sand River
55 of 99
5.3.3 Coastline schematization
The coastline is schematized from the border of Liberia and Côte d’Ivoire up to the border of
Togo and Nigeria (Figure 5.7). The schematization is done based on historical coastlines
acquired by Landsat satellite Images (http://aqua-monitor.appspot.com/, see Appendix A) and
by Google Earth imagery. The coastline is schematized by grid nodes with an equidistant
spacing of approximately two kilometres. At locations of interest (i.e. the three major ports
and river outlets) the grid spacing is reduced locally to several hundred meters. The white
dots in the figure show the locations where the model is forced by the S-Φ curves. The
magnitude and direction of longshore transport of intermediate grid cells (that are not directly
forced by S-Φ curves) are solved by linear interpolation between two neighbouring S-Φ
curves.
The western part of Côte d’Ivoire and the coastal stretch at Cape Three Points in Ghana are
characterized by ‘small-scale’ features, showing an alternation of pocket beaches and rocky
capes. The coastline here would require very detailed modelling and downscaling at each
single beach, in order to capture the wave sheltering and wave diffraction-refraction
processes that occur at those rocky outcrops. As the purpose of the study is the quantification
of the large-scale sediment budget over the entire West-African coast, it was decided to
model those sections following a schematic approach (i.e. by smoothing the coastline at
those sections, resembling the large-scale features), and focusing on the overall longshore
transport and the total sediment budget over the entire coastal section. On the other hand,
absolute magnitudes of coastline changes are not reproduced accurately at these specific
sections because the position of the coastline does not perfectly resemble the actual position.
However relative changes in coastline with respect to a reference situation (scenario
simulations) can still be investigated with the present model setup.
Furthermore, the model is modified to resemble some important features along the coast. The
three ports of Abidjan, Lomé en Cotonou are schematically included in the model as long
straight jetties and adjustment of the coastline. In this way the disruption of the longshore
transport pattern is taken into account in the model. The sediment yield from seven major
rivers to the coastline is modelled as source point of sediment to the coastline model. These
locations coincide with the locations of the outlet (mouth) of the rivers. Section 5.4 describes
how the magnitude of sediment yield of each river is determined.
Figure 5.7 Schematization of the coastline in the UNIBEST-CL+ model (red line).The white dots indicate the
location at which the coastline model if forced by the S-Φ curve.

Human Interventions and Climate Change Impacts on the West African Coastal Sand River
1210349-000-ZKS-0002, 8 December 2016, final
56 of 99
5.4 Sediment input from major rivers
The sediment input from the major rivers towards the coastal system was estimated based on
empirical relations between the mean annual runoff, computed by a large-scale hydrological
model, and the sediment yield.
5.4.1 Hydrological model
A large-scale hydrological model was implemented based on the WFlow code (Schellekens,
2013). WFlow is a model that requires little calibration effort and maximises the use of
available spatial data.
The main input parameters are:
DEM (Digital Elevation Map). The data was obtained from HydroSHEDS with a
resolution of 90 m (http://hydrosheds.cr.usgs.gov/index.php). (Figure 5.8).
Land use and soil maps
Precipitation and temperature data. These data were derived from ECMWF Era-
Interim Reanalysis. The available range of the data is from 1979 until 2014 and the
resolution of the datasets is 0.25°.
Evapotranspiration data. These data are computed using the Penman-Monteith
method based on 1) incoming shortwave radiation, 2) incoming longwave radiation, 3)
daily mean temp, 4) wind speed 5) specific humidity and 6) surface air pressure,
variables obtained from ECMWF. Precipitation, temperature and evapotranspiration
input data was resampled to a resolution of 4 Km x 4 Km.
Yearly averaged maps for the different input variables are shown in Appendix B.
Figure 5.8 DEM of the study area.

1210349-000-ZKS-0002, 8 December 2016, final
Human Interventions and Climate Change Impacts on the West African Coastal Sand River
57 of 99
The total extension of the modelled area ranges from 10°W to 10°E, and from 3°N to 20°N
and was implemented with a resolution of 4 km x 4 km.
The hydrological model was calibrated and validated for all the major rivers in the area. The
validation was based on the Global River Discharge dataset (RivDIS:
https://daac.ornl.gov/RIVDIS/rivdis.shtml).
5.4.2 Estimation of the sediment yield from major rivers
The sediment yield from the major rivers to the beach was estimated based on Dendy and
Bolton (1976) for the reference period (1979-2014):
( ( )) (3)
( ( )) (4)
where :
Q mean annual runoff (in)
A catchment area (mi2)
S total sediment yield (tons/mi2/yr)
The computed values are compared to literature values from Allersma and Tilmans (1993) in
Table 5.2, for the situation without dams, showing values in the same order of magnitude.
However, it is important to realize that only the coarser fraction of the total sediment load
(sand and gravel) contribute to the sediment volume forming the beach. (see also Section
3.8.1). For this study, the sand fraction is assumed to be 10% of the total sediment yield
estimated based on Dendy and Bolton (1976). This assumption is supported by other similar
studies (e.g. Allersma and Tilmans, 1993).
It is important to realize that the quantification of the sediment yield from the different river
catchments is purely based on empirical formula’s, which contain several assumptions (e.g.
that the sand fraction is 10% of the total sediment load). Therefore, values in Table 5.2 are
only meant to provide a order of magnitude of the expected sediment yields.

Human Interventions and Climate Change Impacts on the West African Coastal Sand River
1210349-000-ZKS-0002, 8 December 2016, final
58 of 99
Table 5.2 Comparison between computed sediment yield and literature values.
River name Catchment (km2)
Runoff (mm/yr)
Sediment yield (m3/yr) computed
using Dendy-Bolton.
Sand fraction (m3/yr)
Sediment yield (m3/yr) from
Allersma and Tilmans (1993).
Sassandra 66,000 207.0 1,078,691 107,869 2,875,000
Bandama 91,000 82.4 3,524,114 352,411 4,000,000
Comoé 78,000 40.8 3,258,758 325,876 2,937,500
Pra 22,714 274.7 693,628 69,363 875,000
Volta 394,100 88.7 6,778,345 677,835 9,375,000
Mono 21,000 153.1 1,008,148 100,815 812,500
Ouémé 42,000 115.0 1,774,999 177,500 1,312,500
5.4.3 Effects of dams and reservoirs on the sediment yield
When the river flow enters a reservoir, its velocity and hence transport capacity are reduced
and the sediment load is deposited in the reservoir. Often, more than 90% of the incoming
sediment load is trapped and deposited in horizontal strata or thin bands across the bottom of
the reservoir (Van Rijn, 2005b). Different methods exist to operate and manage the
sedimentation in reservoirs.
The major rivers in the study area have been dammed. The trapping efficiency of the major
reservoirs was estimated by means of the Brune (1953) formula, based on the mean annual
runoff and the reservoir capacity. The values were compared with values obtained based on
the Brown (1943) formula. Estimated trapping efficiency values for all different dams are
shown in Table 5.3. When different dams exist on the same river, the overall trapping
efficiency is obtained by multiplying the trapping efficiency of each single dam.
Table 5.3 Estimated trap efficiency for the different dams.
Dam River Sub-basin Trap
efficiency
Brune (1953)
(%)
Trap
efficiency
Brown
(1943) (%)
Ayme II Bia Comoe 97 96
Buyo Sassandra Sassandra 95 98
Kossou Bandama Bandama 85 59
Taabo Bandama Bandama 62 16
Akosombo Volta Volta 96 87
Barekese Ofin Pra 22 24
Bui Volta Mouhoun 94 99
Kpong Volta Volta 24 10
Nangbeto Mono Mono 97 94
Ilauko Ilauko Oueme 18 11

1210349-000-ZKS-0002, 8 December 2016, final
Human Interventions and Climate Change Impacts on the West African Coastal Sand River
59 of 99
5.4.4 Effects of climate change on the sediment yield
Climate change may affect the future hydrology of the river catchments which, in turn, can
have an impact on the sediment input towards the coastal systems. For example, an increase
in temperature may lead to an increase in evapotranspiration and therefore lower river
discharges and a decrease of transported sediment input towards the coastal system. On the
other hand, an increase in precipitation, according to Dendy and Bolton (1976), could lead to
a more extensive ground cover by vegetation and therefore lower sediment yields.
In particular, the following processes related to climate change were investigated as part of
this study: changes in temperature, precipitation and evapotranspiration.
5.4.4.1 Temperature
According to Christensen et al. (2007), the temperature may increase from 2 to 6 by 2100.
In our scenario, we consider an increase in temperature of 6 by 2100 (worse-case scenario)
for the period 2070-2100.
5.4.4.2 Precipitation
Future trends in precipitation are under debate. Following Sultan et al. (2013) we consider
two different scenarios, respectively with an increase and a decrease in precipitation of 20%
for the period 2070-2100.
5.4.4.3 Potential evapotranspiration
The future potential evapotranspiration is computed for the year 2100 resulting from the
changes in temperature (Section 5.4.4.1), according to the method described in Lu et al.
(2005).


1210349-000-ZKS-0002, 8 December 2016, final
Human Interventions and Climate Change Impacts on the West African Coastal Sand River
61 of 99
6 Results
6.1 Introduction
In this chapter, the results from the numerical modelling framework described in Chapter 5
are presented. The full matrix with the different simulated scenario’s is shown in Table 6.1.
Table 6.1 Full matrix of simulated scenarios.
Modelling type Scenario and results Additional information
Wave modelling Reference scenario
(Section 6.2).
Forced by ERA-INTERIM data
(Section 5.2)
Change in wave climate
scenario (Section 6.5.2).
Forced by ERA-INTERIM data
(Section 5.2);
Hs +3%, Dir +2 (Hemer et al. (2013);
period 2070-2100 (Section 4.6.2)
See level rise scenario’s
(Section 6.5.2).
Forced by ERA-INTERIM data
(Section 5.2);
RSLR: 0.3 m and 1.0 m (Section
4.6.1); period 2070-2100.
Sediment input
from rivers
Reference scenario
(Section 6.3).
Based on large-scale hydrological
model (Section 5.4.1). Sediment yield
computed based on Dendy and Bolton
(1976). (Section 5.4.2)
Effect of dams and
reservoirs (Section 6.3)
Based on Brune (1953). (Section
5.4.3).
Climate change scenario’s
(Section 6.3).
Change in temperature (+6°)
and precipitation (+20% or -20%)
(Section 5.4.4).
Shoreline evo-
lution modelling
Hindcast model (Section
6.4.1).
Simulated period: 1985-2015.
Reference model (Section
6.4.2).
Simulated period: 2015-2045.
Effects of anthropogenic
interventions: main ports
(Section 6.5.1).
Removal of the main port. Simulated
period: 2015-2045.
Effects of anthropogenic
interventions: bypassing
sediment (Section 6.5.1).
Bypassing of 0%, 50%, and 100% of
sediment. Simulated period: 2015-
2045.
Effects of anthropogenic
interventions: river dams
(Section 6.5.1).
Removal of the main dams. Simulated
period: 2015-2045.
Climate change: offshore
wave climate and sea
level rise (Section 6.5.2).
Change in offshore wave climate. 30
years simulation assuming expected
changes for period 2070-2100.
Climate change:
temperature and
precipitation (Section
6.5.2).
Changes in sediment input due to
changes in temperature and
precipitation. 30 years simulation
assuming expected changes for period
2070-2100.

Human Interventions and Climate Change Impacts on the West African Coastal Sand River
1210349-000-ZKS-0002, 8 December 2016, final
62 of 99
6.2 Wave modelling
Each of the 139 combined wind and wave scenarios resulting from the wave and wind
classification (Section 5.2.3) were computed in separate stationary computations. An
example (scenario 24) of the computed significant wave height and wave direction
fields for the overall and detail model 3 are presented respectively in Figure 6.1 and Figure
6.2. Each scenario is used to determine the wave propagation for each class from offshore to
nearshore. After developing the transformation matrix from offshore to nearshore of the 139
scenario’s, it is then possible to transform the entire offshore ERA-Interim time series (Section
4.3.1), containing about 50.000 records for a period of 35 years, to the nearshore with limited
computational effort. Spectral information is automatically nested (i.e. transmitted) from the
overall to the detail model. Wave roses can be constructed based on the entire time series,
as can be seen in Figure 6.3 and Figure 6.4.
In general, the wave height decreases moving in eastward direction (i.e. from Benin to Ivory
Coast). The average wave height is 1.09 meter. Near the rocky part of Takoradi the waves
are the highest (about 1.4 meter) while they decrease moving eastwards with a minimum
near the Keta lagoon (around 0.5 meter), as can be seen in Figure 6.5. Moreover, the wave
direction turns in clockwise direction moving from west to east.
A quick, not calibrated, calculation of the potential alongshore sediment transport can be
obtained using the Van Rijn (2012) sediment transport formula and the modelled wave
information, as shown in Figure 6.6. The spatially-varying field of waves leads to a potential
alongshore sediment transport up to 1 million m3/year, mainly from west to east consistent
with literature values (Section 3.8.2), and with a reverse transport direction (from east-to
west) west of Cape Three Points.
Figure 6.1 Example of computed significant wave height (colour scale) and mean wave direction (black vectors) for
scenario 24 of the overall model. Wind speed and direction are shown as pink vectors.

1210349-000-ZKS-0002, 8 December 2016, final
Human Interventions and Climate Change Impacts on the West African Coastal Sand River
63 of 99
Figure 6.2 Example of computed significant wave height (colour scale) and mean wave direction (black vectors) and for scenario 24 of the detail model 3. Wind speed and direction
are shown as pink vectors.


1210349-000-ZKS-0002, 8 December 2016, final
Human Interventions and Climate Change Impacts on the West African Coastal Sand River
65 of 99
Figure 6.3 Offshore wave roses for the entire coastline of West Africa as calculated by the overall SWAN model
Figure 6.4 Nearshore wave roses as calculated by the 13th detailed SWAN model.

Human Interventions and Climate Change Impacts on the West African Coastal Sand River
1210349-000-ZKS-0002, 8 December 2016, final
66 of 99
Figure 6.5 Nearshore significant wave height as calculated by all the detailed models combined.
Figure 6.6 Alongshore sediment transport as calculated by all the detailed models combined with Van Rijn (2012).

1210349-000-ZKS-0002, 8 December 2016, final
Human Interventions and Climate Change Impacts on the West African Coastal Sand River
67 of 99
6.3 Modelling of sediment input from rivers
The computed sediment yield from the different rivers acts as a source for the shoreline
model. Following Section 5.4 and Table 6.1 the sediment yield was estimated based on
empirical relationships for:
Reference situation (actual situation, including dams and reservoirs)
Scenario when river dams are removed
Climate change scenario’s, including an increase in temperature of 6 °C temperature
and a +20% or -20% change in precipitation.
The estimated sediment input towards the coastline system for the different scenario’s is
summarized in Table 6.2. Although counter-intuitive, it is possible to see how an increase in
precipitation may lead to a decrease in sediment yield (due to more vegetation) and vice
versa (Section 5.4.4).
Table 6.2 Sediment yield estimated for the different scenario’s (sand only).
River Sediment yield
(reference
scenario)
(m3/yr)
No dams
(m3/yr)
Increase in
temperature of 6; +
20% in precipitation
(m3/yr)
Increase in
temperature of
6; - 20% in
precipitation
(m3/yr)
Sassandra 5,393 107,869 1,717 8,711
Bandama 52,862 352,411 17,027 67,597
Comoé 9,776 325,876 4,768 13,400
Pra 54,103 69,363 28,855 88,620
Volta 27,113 677,835 17,894 32,461
Mono 3,024 100,815 1,164 4,209
Ouémé 145,550 177,500 55,183 197,023
It is important to stress that the sediment contribution from rivers towards the coastal system
is a very difficult quantity to estimate and/or to measure (especially at the scale of the study).
Therefore, the values presented are the best estimates that we could derived based on
relations available from literature.
Also, the scenario’s used as input to the model are representative of the most extreme
conditions that we could derive (i.e. removal of all dams and most extreme climate change
scenario’s) in order to get a feeling of the maximal possible effect that these processes may
have on the predicted shoreline changes.
A final important point relate to the relative effect of having/removing the dams on the
sediment available at the coastal system. In the real situation, the general effect of a dam on
sediments, is indeed sediments settling in the reservoirs behind the dams. However, the
direct effect of these dams will be, in first place, erosion of the river bed downstream of the
dams (i.e. bed degradation), which in turn will result in no immediate changes in the sediment
input towards the coastal system (i.e. the same volume of sediment will reach the coastline
but eroded from the river bed). Therefore, an erosive wave will start from the dam and
propagate slowly downstream to the coast. Only when all the bed has been eroded and a
new equilibrium in the rivers has been reached, the effect on the sediment input towards the
coastline system will be visible. In order to describe this accurately, a detail morphodynamic
modelling study for each river would be required. Based on empirical relationships, we have

Human Interventions and Climate Change Impacts on the West African Coastal Sand River
1210349-000-ZKS-0002, 8 December 2016, final
68 of 99
estimated that the time lag before the erosion from the dam will reach the coastline ranges
between 0 up to 30-40 years, depending on the distance between the dam and the coastline.
6.4 Shoreline evolution modelling; reference model
The coastal evolution model will be used to determine the large scale sediment budget of the
West African coast and to evaluate the relative effects of anthropogenic interventions and
climate change on the sediment budget and shoreline changes, in line with the first objective
stated in Chapter 2. The large scale sediment transport pattern will be presented in this
section, while the effects of anthropogenic interventions and future climate change will be
presented in Section 6.5. A summary table with longshore transport values for the various
model simulations in included in Appendix C.
6.4.1 Hindcast for the period 1985 - 2015
The coastal evolution model described in Section 5.3 is calibrated to ensure that modelled
longshore transport values can describe accurately actual transport rates. The period from
1985 till 2015 (30 years) is used for this calibration, using as a basis data of longshore
transport as derived from literature and from the shoreline analysis (Table 3.6).
The calibration of the model included:
A sensitivity to different alongshore transport formulations
A sensitivity to the median sand diameter (D50)
A sensitivity to the nearshore wave climate
As a result of this calibration, the Van Rijn (1992) sediment transport formula was chosen with
an average D50 of 250 µm (Section 5.3.1). A rotation of +2° in clockwise direction to the
nearshore wave climate was applied in order to increase eastward directed transport and
improve model accuracy with respect to the measurements and literature values. This can be
justified based on expert judgment, as uncertainties in wave schematization and wave
propagation can result in differences up to about 3° in the nearshore wave climate. The
rotation was implemented in the model by adjusting the equilibrium angle in the S-Φ curve
(Figure 5.6) by 2°. Also, as the effect of wave diffraction was not properly accounted for by
the resolution of the wave model, the S-Φ curves down-drift of the main ports of Abidjan,
Lomé and Cotonou are adjusted by filtering the wave climate on wave directions that
influence the coast down-drift of the ports. For example, for the port of Lomé this implies that
all wave climate scenarios with a direction that is larger than 170° will not be used for the
calculation of the longshore transport. In this way, wave sheltering by the port is schematically
implemented in the model.
The simulated potential longshore transport pattern derived from the calibrated model is
shown in Figure 6.7. The computed alongshore transport (black line) indicates the magnitude,
versus the alongshore distance of the model, and assuming a 0 origin at the border between
Liberia and Côte d’Ivoire. Alongshore transport rates correspond to potential volume of sand
transported by nearshore currents (“sand river”). The red and blue bars in the figure indicate
longshore transport values obtained from literature and the shoreline analysis (Appendix A
and Section 3.8.2), respectively.
Model results indicate that the model is capable of capturing the large-scale transport rates
and directions, which are in the same range of the data obtained from literature and the

1210349-000-ZKS-0002, 8 December 2016, final
Human Interventions and Climate Change Impacts on the West African Coastal Sand River
69 of 99
shoreline analysis. Most of the transport is eastward oriented with most of the alongshore
transport ranging between 0 and 1.5 million m3/year, as according to literature. The transport
direction reverses west of Cape Three Points. When comparing with single validation points
on the figure, one can see that the modelled longshore transport are in good agreement with
literature values west and east of Abidjan. Also the 0 value in alongshore transport on the
eastern part of Ivory Coast is well represented. Near the outlet of the Volta River, the
complete range in transport is covered by the model as well. However, near the port of Lomé,
the calculated transport appears to be on the lower side. The range of transport given here is
1.0 – 1.5 million m3/yr, while the model predicts a transport west of the port of 0.5 million
m3/yr. At the port of Cotonou, the modelled alongshore transport agrees with the transport
values obtained by the shoreline analysis. However, east of the port, the model seems to
underestimate the values presented by Delft Hydraulics (1992). A possible reason for the
underestimation of modelled values east of the port, is that the values used for model
validation actually estimate alongshore transport rates as a result of shoreline changes
induced by the presence of jetties, groynes, etc., however excluding the presence of other
human activities (e.g. port dredging, leeside nourishments, sand mining from the beach, etc.)
(Appendix A).
Other discrepancies may be due to the assumptions made in the large-scale model
schematization, meant to capture the large scale sediment transport features along the entire
West African coast. The most important schematizations are: a uniformly applied sediment
size and equilibrium profile, and a smooth schematization of the coastline (Section 5.3.2).
Also, at locations where pocket beaches are present, differences can be found between
model results and actual transport rates. Small-scale pocket beaches are in fact not resolved
by the model, and are generally characterized by very small alongshore transport rates in
reality. For example, the potential large computed transport rates at Cape Three Points, is
related to the assumption of the small grain size (D50 = 250 µm) and the unlimited supply of
sand in the model. In reality the coast here consists of rocky capes with alternating pocket
beaches. The pocket beaches can be sheltered for wave impact due to the capes; moreover,
the capes consist of rocky material. Therefore, the actual transport rate here will be smaller.
Figure 6.7 Modelled longshore transport; the red bars indicate literature values of longshore transport and the blue
bars indicate values of longshore transport determined by the shoreline analysis (Appendix A).
Human Interventions and Climate Change Impacts on the West African Coastal Sand River
1210349-000-ZKS-0002, 8 December 2016, final
70 of 99
After model calibration on the basis of longshore transport values, the model is validated
based on absolute shoreline changes near the three ports Abidjan, Lomé and Cotonou. The
purpose of this validation is to verify if the rate of coastline changes at these locations is in the
approximate order of magnitude as experienced in reality. If magnitudes of coastline change
are in the same order of magnitude this will also give confidence that the overall longshore
transport pattern is correctely represented by the model. The coastline changes at the three ports are modelled assuming an active heigth of 10 m, to be consistent with the shoreline analysis presented in Appendix A. The shoreline analysis at the ports was focused on the accreting sections up-drift of the jetties because the erosional sections down-drift are largely influenced by human-induced mititgation measures. Therefore, the validation of the model on the basis of absolute coastline changes is focused on the accretion rate up-drift as well.
The coastline change near Abidjan is shown in Figure 6.8. The top figure shows a visual
overview of the coastline as schematized after the 1985 position of the coastline (blue line,
see Section 5.3.3) and the modelled coastline (other colored lines). The bar graph in the
bottom panel of the figure shows the magnitude of the predicted coastline changes per year.
The coastal evolution model shows there is accretion on the western side of the jetty, as
expected. The accretion rate here is in the order of 5 – 8 m/yr. The rate of coastline change
west of Canal de Vridi is in very good agreement with the rates from literature (5 m/yr) and
the shoreline analysis (5-10 m/yr) (see Table 3.6). On the eastern side of the jetty, however,
the model shows accretion as well. In reality, erosion is experienced here. There are two
reasons that the model shows a discrepancy with actual coastline changes here. The first is
because processes as wave sheltering, diffraction, and refraction are not accurately
accounted for and only implemented in a schematized way by filtering the wave climate. The
second one is because the coastline changes here are influenced by human interference
(Appendix A), which are not implemented in the coastline model.

1210349-000-ZKS-0002, 8 December 2016, final
Human Interventions and Climate Change Impacts on the West African Coastal Sand River
71 of 99
Figure 6.8 Modelled coastline change in the period 1985 – 2015 near the port of Abidjan
The absolute magnitude of coastline change at the port of Lomé is shown in Figure 6.9 for the
period 1985 – 2015. The figure shows that the accretion up-drift, and the erosion down-drift of
the jetty are both well reproduced by the model. The maximum rate of accretion just up-drift is
15 m/yr. In 1999, the maximum rate of accretion here was up to 1 kilometre over a period of
30 years (Anthony and Blivi, 1999). Considering this, the modelled accretion rate appear to
be underestimated. However, the modelled period here does not coincide with the period
considered in Anthony and Blivi (1999). Accretion tends to slow down when the shoreline
reaches the top of the breakwater because bypass will be more important. Therefore the
maximum value of 15 m/yr seems appropriate. Just down-drift of the port the coast is
protected by a revetment at the location of the port, therefore no erosion takes place here.
Further down-drift the rate of erosion is in the order of several meters per year. Because the
coastline down-drift of the port of Lomé shows classical leeside erosion, the model is able to
reproduce the erosion here.

Human Interventions and Climate Change Impacts on the West African Coastal Sand River
1210349-000-ZKS-0002, 8 December 2016, final
72 of 99
Figure 6.9 Modelled coastline change in the period 1985 - 2015 near the port of Lomé.
The modelled coastline change near the port of Cotonou is shown in Figure 6.10. Accretion at
the western part of the jetty, and erosion on the eastern part can be observed. The accretion
rate up-drift of the jetty is in the order of 4 – 7 m/yr. From the shoreline analysis it is known
that the accretion rate is in the order of 15 m/yr. However, this rate was established over a
period of 10 years right after the extension of the breakwater. Because the modelling covers a
longer period of coastline change it can be expected that the accretion rate over the entire
period will be smaller.

1210349-000-ZKS-0002, 8 December 2016, final
Human Interventions and Climate Change Impacts on the West African Coastal Sand River
73 of 99
Figure 6.10 Modelled coastline change in the period 1985 – 2015 near the port of Cotonou
The above shown validation at the three ports indicates that sedimentation rates up-drift of
the jetties can be reproduced quite well, which indicates that the magnitude of longshore
transport is modelled well.
However, local differences at other locations may be possible mainly related to the
schematization of the coastline (Section 5.3.3) and which can only been addressed by the
use of local models. Therefore, coastline changes will be evaluated by assessing relative
coastline variations with respect to a reference simulation (simulation period 2015-2045) for
the different scenario’s (Section 6.5).
6.4.2 The large scale sediment budget along the West African coast
Human Interventions and Climate Change Impacts on the West African Coastal Sand River
1210349-000-ZKS-0002, 8 December 2016, final
74 of 99
The model validated in the previous section is used to carry out a simulation, starting from a
schematized coastline using as a basis the position of the coastline at year 2015 (Section
5.3.3). The simulation is run for a period of 30 years, from 2015 until 2045. The results are
shown in Figure 6.11.
The figure indicates that the longshore transport is generally eastward. The stretch of coast
that is situated between the city of Axim and Cape Three Points is the only part showing a
westward directed transport, in line with what already observed for the hindcast simulations
(Section 6.4.1).
The magnitude of potential longshore transport decreases from Tahou to Abidjan from 1.5
million m3/yr to a transport rate of nearly 0 east of Canal de Vridi. Eastwards of Cape Three
Points the longshore transport rate increases and attains a rate of approximately 2 million
m3/yr near Takoradi. Between Cape Coast and the outlet of the Volta River the direction of
transport is eastward and the magnitude fluctuates between a minimum of 0.5 million m3/yr
and a maximum of 1.0 million m3/yr. East of the Volta River (at the Keta Lagoon) there is a
significant decrease in transport magnitude, which is due to the southwest-northeast
orientation of the coastline, almost parallel to the prevailing wave climate (see Section 6.2).
The stretch of coast between the Keta Lagoon and the border of Benin and Nigeria is
characterized by a transport that lies in the range of approximately 0.5-1.0 million m3/yr.
However, the presence of the ports of Lomé and Cotonou cause an interruption of the
longshore transport. The transport decreases to almost zero at the leeside of the ports. The
effect of these interruptions will be assessed in section 6.5.

1210349-000-ZKS-0002, 8 December 2016, final
Human Interventions and Climate Change Impacts on the West African Coastal Sand River
75 of 99
Figure 6.11 Large-scale potential transport pattern along the West African Coast for the period 2015 – 2045.

Human Interventions and Climate Change Impacts on the West African Coastal Sand River
1210349-000-ZKS-0002, 8 December 2016, final
76 of 99
6.5 Shoreline evolution modelling: scenario modelling
6.5.1 Effects of anthropogenic interventions
In order to study the effect of anthropogenic interventions on the large scale sediment budget
of the West African coast three types of scenario simulations have been carried out:
One scenario where the three major ports of Abidjan, Lomé, and Cotonou are
removed from the coastline.
One scenario where different rates of sediment bypassing around the jetties of the
ports are implemented.
One scenario where it is assumed that no dams are present along the rivers and
therefore all the sandy fraction of the sediment yield reaches the coast.
Hypothetical situation where ports are removed
Using the coastal evolution model, a hypothetical scenario is created where the three ports
are removed. This situation would be representative of the case where the three ports are
removed from the system or a sediment bypass system would be put in place bypassing all
sediments around the three ports. It is important to stress that this is a hypothetical scenario
designed in order to address the relative effect of the ports, which is one of the objective of
the present study (Chapter 2). However, it is likely that ports are going to be extended in the
future, in line with the economic development of these countries (see also next Section).
This scenario is schematized in the model by removing the groynes representing the jetties of
the ports. Also, the wave shielding effect by these jetties, included in the model as according
to Section 6.4, is no longer used for this scenario.
The simulation is carried out for a period of 30 years, from 2015 – 2045. The results of the
average longshore transport pattern for the West African coast over this period are shown in
the top panel of Figure 6.12. The bottom panel of the figure shows the difference between the
scenario and the reference case.

1210349-000-ZKS-0002, 8 December 2016, final
Human Interventions and Climate Change Impacts on the West African Coastal Sand River
77 of 99
Figure 6.12 Longshore transport pattern for the hypothetical situation where the ports are removed (top) and the
relative absolute difference in modelled transport with respect to the reference situation.
The simulation shows that the interruption of the transport pattern that is caused by the jetties
of the ports in the reference situation is considerably reduced by removing the jetties.
However, an interruption can still be noticed. This is due to the configuration of the coastline
that has adjusted to the presence of the ports in the past decennia. The simulation shows
clearly the effect of each port on the transport rates.
Although the port of Abidjan is quite large, the effect on the present transport pattern is
limited. Naturally, the gradient in transport is decreasing in this area due to the reorientation
of the coast. In combination with the southerly prevailing wave climate (Figure 6.3), this leads
to a relative minor effect of the port on the alongshore transport rates.
The port of Lomé has a substantial effect on the transport patterns. The rate of transport is large at this stretch of coast, therefore the disturbance induced by the port leads to a large variation in the alongshore transport patterns, both in magnitude and distance along the coast. The disturbance to the transport continues roughly for about 50 km. The port of Cotonou causes a substantial disturbance of the longshore transport pattern as well, however more limited in space, extending for about 30 km.

Human Interventions and Climate Change Impacts on the West African Coastal Sand River
1210349-000-ZKS-0002, 8 December 2016, final
78 of 99
The hypothetical situation where the ports are removed creates a new situation and the
coastline will show rapid adjustment to a new equilibrium situation. Generally the up-drift area
will start eroding and the increased sediment availability will cause accretion at the leeside of
the former ports. The coastline will continue to adjust to the new equilibrium situation until
there are (hardly) any gradients in the transport pattern. When the gradients are small, the in-
flux of transport is equal to the out-flux, reaching coastal stability. This situation will be closer
to the situation before construction of the ports.
The model setup can be used to assess the rate of changes induced by the new situation
without ports. Figure 6.13 shows the relative rates of coastline changes that are caused by
the new situation without ports. From the figure it can be seen that the coastline will start
eroding up-drift of the former ports and accreting down-drift. The adjustment will occur in a
fast rate of approximately 15 m/yr. This will continue until the shoreline reaches an equilibrium
configuration. Furthermore, the figure shows the spatial extent of the down-drift influence of
the ports on the coastline evolution. The adjustment of the coast down-drift of the port of
Lomé, for example, continues for nearly 50 kilometres, in accordance to the changes in
alongshore transport as shown in Figure 6.12. Implicitly, the spatial extent of coastline
adjustment in this hypothetical situation indicates the present effect of the ports on the
coastline evolution.
Figure 6.13 Relative coastline changes for the hypothetical situation where the ports are removed.

1210349-000-ZKS-0002, 8 December 2016, final
Human Interventions and Climate Change Impacts on the West African Coastal Sand River
79 of 99
Sensitivity analysis on the effects of different sediment bypassing rates
In the hypothetical scenario described above, the main ports are removed from the model
with the scope of understanding the relative effects of these interventions on the large-scale
sediment budget and shoreline evolution. In reality, it is likely that these ports in the future will
be extended rather than removed, in order to receive a larger number (and possibly bigger)
vessels. Therefore, in this section a sensitivity analysis is carried out in order to investigate
the effects of different bypassing rates around these ports, related to the possible future
extension of these ports or the adoption of sediment bypassing systems.
In particular, the following scenarios are compared:
Sediment bypassing rate equal to 0%. This scenario aims at simulating the effects of
extreme port extensions and/or dredging and removal of the sediments deposited
from the navigation channels, therefore reducing to 0 the alongshore drift around the
ports. This scenario is implemented in the model by implementing at each port, jetties
with infinite length in order to avoid any sediment bypassing.
Sediment bypassing rate equal to 50%. This scenario aims at simulating an
intermediate situation with a sediment bypassing rate which is only half than in the
reference situation. This scenario is implemented in the model by applying jetties with
infinite length, therefore blocking the total alongshore drift. In addition, bypassing is
applied in the model by including the implementation of sink and source terms up-drift
and down-drift of the jetties, respectively. The sediment bypassed annually is 50% of
the updrift transport in the reference situation, and respectively equal to about 0.35,
0.5, and 0.4 million m3 for the ports of Abidjan, Lomé, and Cotonou (Appendix C).
Sediment bypassing rate equal to 100%. This scenario is the same as described
above (i.e. hypothetical scenario where ports are removed or complete sediment
bypassing); however, it is provided here again to facilitate the comparison with the
other two scenarios.
The different scenarios are compared relatively to the reference scenario (Section 6.4.2). The
reference scenario already includes partial sediment bypassing, as part of the alongshore drift
can already move around the port jetties.
It is important to stress that, in reality, the effects of possible port extension will depend on the
size of the planned port extensions. Also, in general, the sediment bypassing rate may
change in time due to morphological shoreline changes and/or changes to maintenance
dredging in the navigation channels to the ports (i.e. increase of depth/width of the navigation
channel, in order to allow bigger ships to reach the port).
The results of the simulated scenarios are shown in Figure 6.14 as relative coastline changes
with respect to the reference model. The figure shows that for all three ports the erosion rate
down-drift of the jetties will increase if there is absolutely no bypassing of sediment (top
panel). The increase in erosion rate varies from 0.5 – 2 m/yr. The figure indicates that by
including a bypassing of sediments, this will mitigates the effects of erosion. Bypassing half of
the annual up-drift transport (middle panel) mitigates the erosion rate down-drift by
approximately 4 m/yr. If all sediment is bypassed (bottom panel) the decrease in erosion rate
can be up to 10 – 15 m/yr. If this rate exceeds the present erosion rate down-drift, the
coastline will start prograding here in absolute terms.The bypassing of the sediments will not
only affect the absolute values in shoreline changes but also the spatial extension of the
relative impact of the erosion rates downdrift of the ports.

Human Interventions and Climate Change Impacts on the West African Coastal Sand River
1210349-000-ZKS-0002, 8 December 2016, final
80 of 99
Figure 6.14 Relative coastline changes with respect to the reference model, for the case of 0% sediment bypassing
(top panel), 50% sediment bypassing (middle panel) and 100% sediment bypassing (bottom panel) of
sediment.
Although these scenarios provide general information on the effects of different sediment bypassing rates, they are not meant to be used for the detailed design of a sediment bypass-system. In order to do this, a detailed model of the different ports would be required, properly describing wave sheltering effects at each ports as well as other anthropogenic interventions (e.g. maintenance dredging in the navigation channels, etc.).

1210349-000-ZKS-0002, 8 December 2016, final
Human Interventions and Climate Change Impacts on the West African Coastal Sand River
81 of 99
Hypothetical situation where the dams in the rivers are removed
The construction of dams in the rivers along the West African coast has an effect on the
sediment yield of those rivers towards the coast (Section 5.4 and 6.3). Therefore, the
evolution of the coast near the river outlets is influenced as well by the construction of the
dams. To study the effect of the construction of the dams on the coastal budget and coastline
evolution, the coastal evolution model is forced by a sediment yield from the rivers where
dams are included (reference situation) and compared to a hypothetical situation where dams
are removed from the rivers. This situation is representative of a situation where all dams are
removed from the catchments or there is no sediment settling in the reservoirs.
The resulting longshore transport pattern is shown in Figure 6.15 (top panel). The bottom
panel shows the difference in transport between the scenario and the reference model. It can
be seen that the increased sediment availability causes a local increase in the magnitude of
longshore transport. Moreover, there is a relative decrease in the magnitude of transport
updrift of the river outlets, due to the tendency of delta formation.
The difference between the two curves shows that changes are largest at the Volta River.
The sediment yield at the Volta catchment is in fact the largest. Moreover, the presence of
several dams in the present situations blocks a large amount of the total sediment yield.
Figure 6.15 Longshore transport pattern for the hypothetical situation where the dams from the rivers are
removed (top) and the relative absolute difference in modelled transport with respect to the reference
situation.

Human Interventions and Climate Change Impacts on the West African Coastal Sand River
1210349-000-ZKS-0002, 8 December 2016, final
82 of 99
The relative coastline changes that are induced by removing the dams from the rivers will
reflect to a coastline progradation near the river outlets (Figure 6.16). The accretion rate
varies between 1 m/yr (Sassandra and Mono river) up to 6 m/yr (Volta river). The build-up of
small deltas explains the reorientation of the coast and consequently the decrease in
transport updrift of the deltas (Figure 6.15). However, in reality, the processes of delta
formation will also be influenced by cross-shore transport processes, not included in the
present coastal evolution model set-up.
Figure 6.16 Relative coastline changes for the hypothetical situation where the dams are removed from the
rivers.
6.5.2 Effects of climate change
The effects of climate change on the coastal sediment budget are compared with the
reference coastal evolution model. In particular the following scenarios are simulated:
Effects of sea level rise and changes in offshore wave climate on alongshore
transport patterns and resulting shoreline variations
Effects of changes in the hydrology at the river catchments (temperature and
precipitation) and resulting shoreline variations
Effect of area loss due to sea level rise
Climate change scenario’s from the end of the century (2070-2100) are used in this section to
force shoreline model runs for thirty years, to be compared with the thirty years reference
model simulations.
In particular, the effects of a change in relative sea level and in the offshore wave climate are
assessed based on new wave model runs, where respectively the water depth and the
offshore wave climate are adapted based on predicted sea level and wave climate scenario’s.
On the other hand, the effects of changes in the hydrology of the river catchments will result
in changes in the sediment input towards the coastal system (Table 6.1).
Changes in Relative Sea Level Rise and Offshore wave climate
In this scenario the effects of sea level rise and changes in offshore wave climate on the
alongshore sediment patterns and coastline changes are assessed. The schematization of
the coastline and the forcing locations in the shoreline model are the same as for the 2015
reference model. However, new wave model runs have been carried out to account for the
simulated climate change conditions which will result to new wave forcing conditions for the

1210349-000-ZKS-0002, 8 December 2016, final
Human Interventions and Climate Change Impacts on the West African Coastal Sand River
83 of 99
shoreline model. Changes in offshore wave climate are included following Hemer et al.,
(2013) (Section 4.6.2), which result in an increase in wave height of 3% and a clockwise
rotation of 2°. Sea level rise is included following RCP scenario’s 4.5 and 8.5, leading to an
increase in sea level of +0.3 m and +1.0 m respectively.
The changes in longshore transport pattern resulting from the two sea level rise scenario’s
0.3 m and 1.0 m RSLR and including a change in the offshore wave condition is shown in
Figure 6.17. It can be clearly seen that the magnitude of the overall potential transport pattern
becomes larger for both the scenarios with respect to the reference case. This effect is mainly
caused by the rotation of the wave climate that is induced by climate change and the increase
in wave height of 3%. The relative effect of sea level rise on alongshore transport patterns
from 0.3 m to 1.0 m RSLR is minor and not larger than 20 – 30 m3/yr.
Figure 6.17 Longshore transport pattern for the future scenarios with an increase of 3% in significant wave
height (Hs), an increase in 2° in wave direction (Φw) and a 0.3 m and 1.0 m RSLR (top). Relative difference
of the two scenarios with respect to the reference situation (bottom).
The increase in transport rates is different at different locations along the entire West African
coast (bottom panel of Figure 6.17). Therefore, gradients in transport will change, causing a
change in coastal evolution.
The predicted relative coastline changes after a 30 year simulation period are shown in
Figure 6.18. As expected, the rotation of the wave climate will induce an alternation of erosive
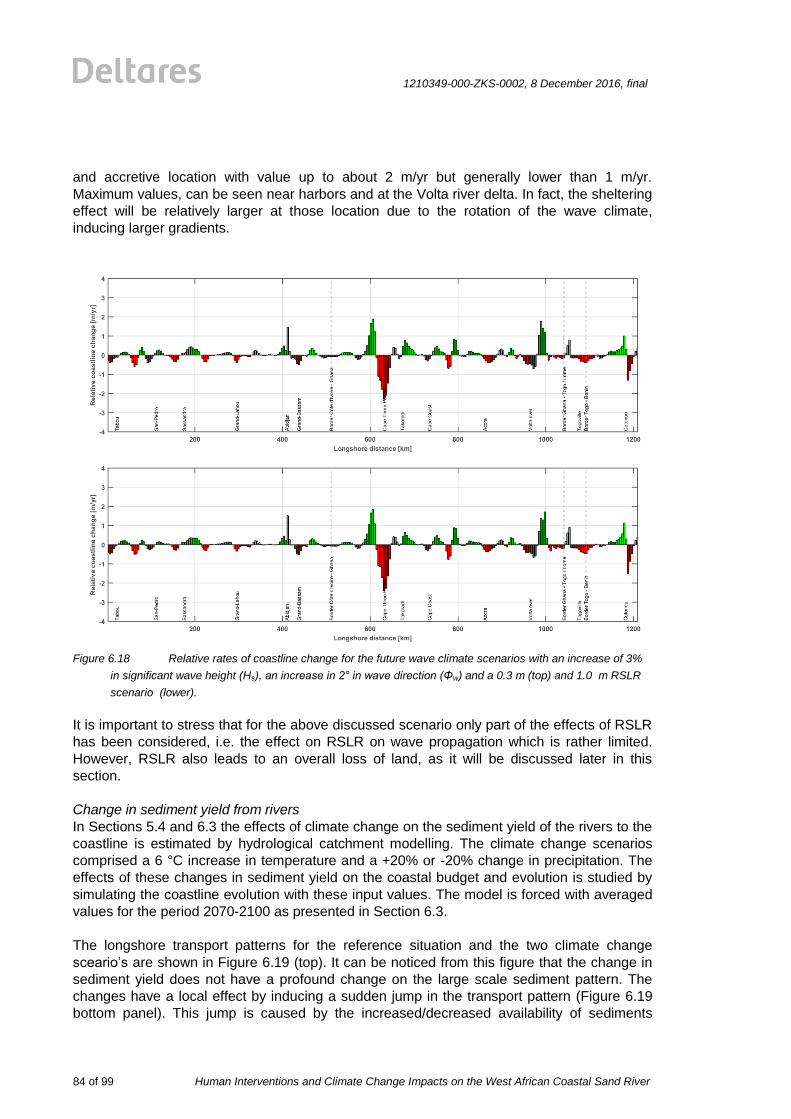
Human Interventions and Climate Change Impacts on the West African Coastal Sand River
1210349-000-ZKS-0002, 8 December 2016, final
84 of 99
and accretive location with value up to about 2 m/yr but generally lower than 1 m/yr.
Maximum values, can be seen near harbors and at the Volta river delta. In fact, the sheltering
effect will be relatively larger at those location due to the rotation of the wave climate,
inducing larger gradients.
Figure 6.18 Relative rates of coastline change for the future wave climate scenarios with an increase of 3%
in significant wave height (Hs), an increase in 2° in wave direction (Φw) and a 0.3 m (top) and 1.0 m RSLR
scenario (lower).
It is important to stress that for the above discussed scenario only part of the effects of RSLR
has been considered, i.e. the effect on RSLR on wave propagation which is rather limited.
However, RSLR also leads to an overall loss of land, as it will be discussed later in this
section.
Change in sediment yield from rivers
In Sections 5.4 and 6.3 the effects of climate change on the sediment yield of the rivers to the
coastline is estimated by hydrological catchment modelling. The climate change scenarios
comprised a 6 °C increase in temperature and a +20% or -20% change in precipitation. The
effects of these changes in sediment yield on the coastal budget and evolution is studied by
simulating the coastline evolution with these input values. The model is forced with averaged
values for the period 2070-2100 as presented in Section 6.3.
The longshore transport patterns for the reference situation and the two climate change
sceario’s are shown in Figure 6.19 (top). It can be noticed from this figure that the change in
sediment yield does not have a profound change on the large scale sediment pattern. The
changes have a local effect by inducing a sudden jump in the transport pattern (Figure 6.19
bottom panel). This jump is caused by the increased/decreased availability of sediments

1210349-000-ZKS-0002, 8 December 2016, final
Human Interventions and Climate Change Impacts on the West African Coastal Sand River
85 of 99
which can be transported along the coast, respectively for a case with a -20% and +20% of
precipitation.
Figure 6.19 Longshore transport pattern for the future scenarios with a change in sediment yield from the
rivers due to +20% increase (blue) and -20% decrease (red) in precipitation.
The local effects of a change in sediment yield on relative coastline changes (i.e. with respect
to the reference situation) can be seen in Figure 6.20. An increase in precipitation will
decrease the sediment yield towards the coast (due to more vegetation) and will cause a
general local regression of the coastline of maximum 30 cm/yr. The mechanism is vice versa
for the situation with a -20% decrease in precipitation (where sediment yield will increase due
to a decrease in vegetation).
The effect of the change in sediment yield is a maximum increased or decreased coastline
change of approximately 30 cm per year. In the 30 year simulated period this will contribute
up to a maximum of 9 meters of coastline retreat or advance. The effect of a change in
sediment yield is almost a factor 10 smaller than the coastline changes induced by a change
in sea level and wave direction. However, in reality both processes will affect the coastline at
the same time and their effects will be combined.

Human Interventions and Climate Change Impacts on the West African Coastal Sand River
1210349-000-ZKS-0002, 8 December 2016, final
86 of 99
Figure 6.20 Relative rates of coastline change for the future climate change scenarios with a sediment yield
from the rivers due to a +20% increase in precipitation (top) and a -20% decrease in precipitation (bottom).

1210349-000-ZKS-0002, 8 December 2016, final
Human Interventions and Climate Change Impacts on the West African Coastal Sand River
87 of 99
Areal loss due to sea level rise
In this section, the effect of coastal retreat and area loss induced by sea level rise is
assessed by means of the very simplistic Bruun rule (Section 4.6.1). For this calculation, a
homogeneous sandy profile along the entire coast is used. A mean grain size diameter of
250 µm and a depth of closure of 10 m are used for this analysis. The predicted coastline
retreat is then integrated along the length of the entire coastline. Also, the increase in sea
level rise is assumed to be linear over time until 2100. In reality, sea level rise rates are
generally lower at present and they are assumed to increase at a faster rate towards the end
of the century.
This may result in an overall area loss with a rate of about 0.25 m/year, assuming a relative
sea level rise of 0.3 m by 2100, up to a rate of about 0.8 m/year assuming a relative sea level
rise of 1.0 m by 2100. The area losses induced by the different contributions analysed as part
of this study are also summarized in Table 7.1.


1210349-000-ZKS-0002, 8 December 2016, final
Human Interventions and Climate Change Impacts on the West African Coastal Sand River
89 of 99
7 Discussion
7.1 General discussion
The results presented as part of the modelling study have helped quantifying the sediment
budget along the West Africa coast and how the “sand river” has been affected by major
anthropogenic interventions or may get affected in the future by climate change.
The different mechanisms have been assessed separately as part of different scenario runs.
A table summarizing the computed alongshore transport rates at different locations along the
coast has been included in Appendix C. In reality, the different processes all contribute, at the
same time, to the total alongshore transport and shoreline changes. In Table 7.1, the net area
loss per year that may be expected over the entire region, due to each different contribution,
has been quantified. It is important to mention that, with the exception of the case of coastline
retreat due to relative sea level rise (RSLR), for all the other cases, coastline erosion at some
locations is generally compensated by accretion at other locations. However, in this table, we
only focus on the area loss due to erosion. Also, the coastline retreat due to relative sea level
rise (RSLR) is computed as an averaged yearly coastline retreat, assuming that the increase
in sea level is a linear process over the century. In reality, this process is expected not to be
linear, with a faster increase towards the end of the century and a smaller rate at present.
Table 7.1 Areal land loss due to erosion and coastal retreat as a result of each different process and referred to
the reference model.
Simulation
Areal loss by
coastal erosion
(ha /year)
Removal of ports 32
Removal of dams -
0.3 m RSLR + change in offshore wave climate 18
1.0 m RSLR + change in offshore wave climate 17
+20% precipitation 9
-20% precipitation -
Coastline retreat 0.3 m RSLR (Bruun rule) 30
Coastline retreat 1.0 m RSLR (Bruun rule) 100
The table shows that the effect of area loss due to the major ports is approximately in the
same order of magnitude than the effect of coastal retreat due to RSLR, when considering a
RSLR scenario of 0.3 m by 2100 ( 30 ha/year). However, if we consider a RSLR of 1.0 m the
contribution of coastline retreat due to sea level rise, will be the largest of all the others ( 100
ha/year). The contributions due to changes in wave climate resulting from a lower wave
dissipation (due to RSLR), increase in offshore wave height and change in incoming wave
direction will lead to an additional area loss of 15-20 ha/year. The removal of dams or a
decrease in precipitation will not result in any coastline losses (only accretion), while an
increase in precipitation may result in an area loss of 10 ha/year as a result of more dense
vegetation at the river catchments.
However, it is important to stress that these values are very indicative and are only meant to
provide an order of magnitude of the contribution to coastal erosion induced by the different
processes and not to be read as exact values. The overall coastline erosion will be in practice
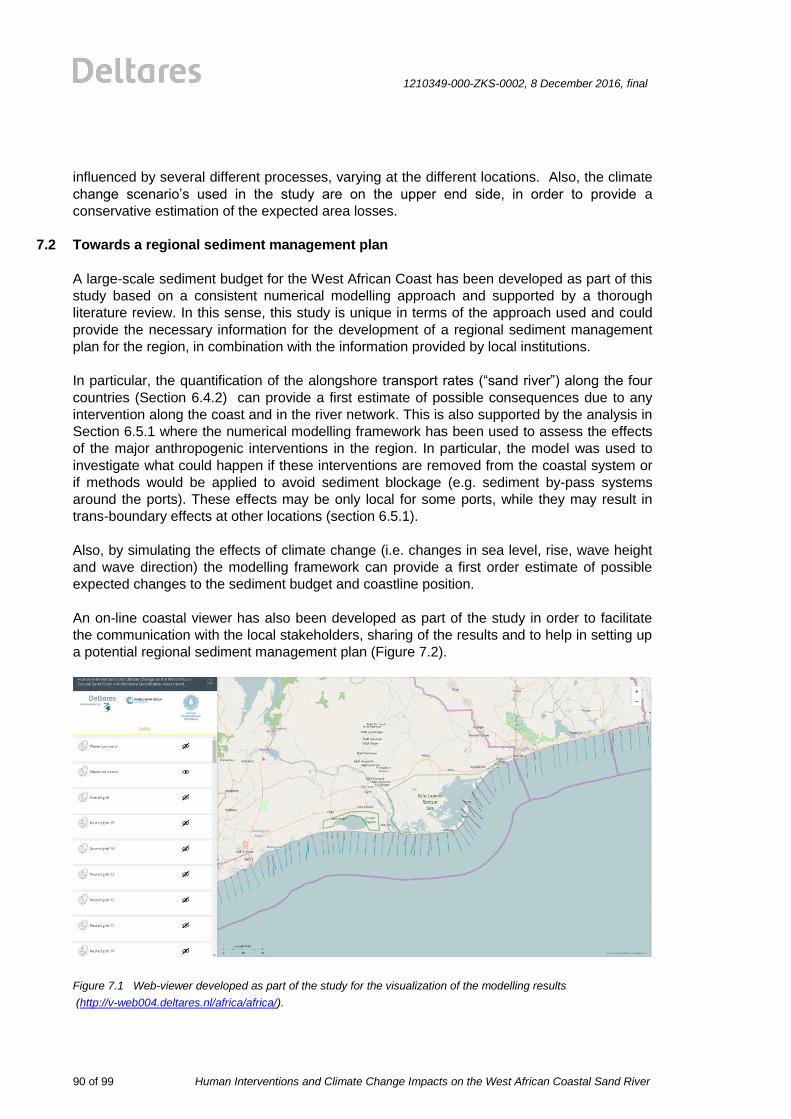
Human Interventions and Climate Change Impacts on the West African Coastal Sand River
1210349-000-ZKS-0002, 8 December 2016, final
90 of 99
influenced by several different processes, varying at the different locations. Also, the climate
change scenario’s used in the study are on the upper end side, in order to provide a
conservative estimation of the expected area losses.
7.2 Towards a regional sediment management plan
A large-scale sediment budget for the West African Coast has been developed as part of this
study based on a consistent numerical modelling approach and supported by a thorough
literature review. In this sense, this study is unique in terms of the approach used and could
provide the necessary information for the development of a regional sediment management
plan for the region, in combination with the information provided by local institutions.
In particular, the quantification of the alongshore transport rates (“sand river”) along the four
countries (Section 6.4.2) can provide a first estimate of possible consequences due to any
intervention along the coast and in the river network. This is also supported by the analysis in
Section 6.5.1 where the numerical modelling framework has been used to assess the effects
of the major anthropogenic interventions in the region. In particular, the model was used to
investigate what could happen if these interventions are removed from the coastal system or
if methods would be applied to avoid sediment blockage (e.g. sediment by-pass systems
around the ports). These effects may be only local for some ports, while they may result in
trans-boundary effects at other locations (section 6.5.1).
Also, by simulating the effects of climate change (i.e. changes in sea level, rise, wave height
and wave direction) the modelling framework can provide a first order estimate of possible
expected changes to the sediment budget and coastline position.
An on-line coastal viewer has also been developed as part of the study in order to facilitate
the communication with the local stakeholders, sharing of the results and to help in setting up
a potential regional sediment management plan (Figure 7.2).
Figure 7.1 Web-viewer developed as part of the study for the visualization of the modelling results
(http://v-web004.deltares.nl/africa/africa/).
1210349-000-ZKS-0002, 8 December 2016, final
Human Interventions and Climate Change Impacts on the West African Coastal Sand River
91 of 99
Finally, although the regional modelling framework is not meant for detailed design of
solutions, this framework could provide the boundary conditions for the setting up of more
detailed models at specific hot-spot locations (i.e. at which solutions are planned).


1210349-000-ZKS-0002, 8 December 2016, final
Human Interventions and Climate Change Impacts on the West African Coastal Sand River
93 of 99
8 Conclusions and further work
In this study, a consistent large-scale sediment budget for the coastline of Ivory Coast,
Ghana, Togo and Benin has been derived. This has allowed the quantification of the effects
of different human interventions (i.e. major ports and river dams) on the coastal system and
possible trans-boundary implications. The effect of climate change (i.e. increase in storm
intensity, change in wave direction and sea level rise) on the large scale sediment transport
capacity and shoreline changes has also been analyzed. This is line with the first objective of
the study (Chapter 2). Also, two regional consultation and validation workshops are organized
as part of this project (see also Appendix E). Together with the development of a digital
coastal viewer and a brochure also to be used during the workshops, this material will help
facilitating the communication with local stakeholders and creating awareness of the
interdependency of any action along the coast and major rivers (second objective of the
study, Chapter 2).
The study has shown that the effect of the major ports on coastal erosion will be on the same
order of magnitude than the effect of sea level rise when considering the lower sea level rise
scenario’s (RCP 4.5). However, sea level rise may overrule the effect of the other
anthropogenic interventions by the end of the century if considering the largest predicted sea
level rise scenario’s (RCP 8.5).
The study has also shown that, although some of the anthropogenic interventions have only a
local effect, others have a much larger spatial effect (e.g. the effect of the port of Lomé after
30 years extends up to nearly 50 kilometres).
8.1 Suggestion for further work
A number of suggestions for further work have been given as part of this section, which also
follow the discussions during the stakeholder consultation meeting (Appendix E). Among
them:
1) Use of the results from the present numerical modelling study in combination with the
coastal viewer as support tool for the setting up of a regional sediment management
plan for West Africa, together with local stakeholders. The sediment management
plan should include not only the coastal area but also the river network upstream as
those are interconnected.
2) Setting-up of high resolution local models, at specific hot-spot location, for the design
of solutions to address the coastline erosion issues. The regional numerical modelling
framework derived as part of this study could be used to derive the accurate boundary
conditions for these models.
3) Setting-up of high resolution local models in order to plan future expansions of
existing infrastructures and to assess their possible effects. The regional numerical
modelling framework derived as part of this study could be used to derive the
accurate boundary conditions for these models.
4) Detailed investigations (i.e. by means of data analysis and numerical modelling) for
each of the major rivers, in order to assess the detailed effect of dams on the river
morphology.

Human Interventions and Climate Change Impacts on the West African Coastal Sand River
1210349-000-ZKS-0002, 8 December 2016, final
94 of 99
5) Improvement of the present modelling framework, by considering processes that have
not been included in the present model. Among them: variations in sediment size
alongshore, sediment loss due to anthropogenic intervention (e.g. sediment mining
from the beaches, dredging of navigation channels, etc.), sediment loss due to natural
processes (e.g. due to overwash), better coastline schematization. However, as those
processes are often local, it will not be possible to implement them on a regional
large-scale model. So, local models will be required. Also, more detailed data will be
necessary to be used as input to these more detailed models.
6) Extension of the current modelling platform to neighbouring countries.
7) Create a data sharing platform (possibly as an extension of the current viewer) in
order to share data between different organizations in the region.
8) Capacity building actions, in order to involve local organizations and universities in the
further development of the modelling system.

1210349-000-ZKS-0002, 8 December 2016, final
Human Interventions and Climate Change Impacts on the West African Coastal Sand River
95 of 99
9 References – literature
Abe, J., 2005. Contribution a la Connaissance de la Morphologie et de la Dynamique
Sedimentaire du Littoral Ivoirien (Cas du Littoral d’Abidjan) essais de modelisation en vue
d’une gestion rationnelle. These de doctorat d’etat es-sciences naturelles. Thesis, Université
de Cocody, Abidjan.
Abe J., Kouassi A.M., Ibo G.J., N’guessan N., Kouadio A., N’goran Y.N., Nassere, K. 2002.
Cote d’Ivoire: coastal zone. Phase 1: Integrated Environmental Problem Analysis, GEF MSP
Sub-Saharan Africa Project (GF/6010-0016): “Development and Protection of the Coastal and
Marine Environment in Sub-Saharan Africa”.
Allersma E. and Tilmans W.M.K., 1993. Coastal Conditions in West Africa – A Review. Ocean
& Coastal Management, vol. 19 : 199-240.
Almar, R., Du Penhoat, Y., Hounkonnou, N., Castelle, B., Laibi, R., Anthony, E., Senechal, N.,
Degbe, G., Chuchla, R., Sohou, Z., Dorel, M., 2014. The Grand Popo experiment, Benin. J.
Coast. Res. 70, 651–656.
Almar, R., Kestenare, E., Reyns, J., Jouanno, J., Anthony, E.J., Laibi, R., Hemer, M., Du
Penhoat, Y., Ranasinghe, R., 2015. Response of the Bight of Benin (Gulf of Guinea, West
Africa) coastline to anthropogenic and natural forcing. Part 1: Wave Climate variability and
impacts on the longshore sediment transport, Journal of Continental Shelf Research, 110, 48-
59.
Anthony, E.J., Blivi, A.B., 1999. Morphosedimentary evolution of a delta-sourced, drift-aligned
sand barrier-lagoon complex, western Bight of Benin. Mar. Geol. 158, 161–176.
Anthony, E.J., Almar, R., and Aagaard, T. 2016. Recent shoreline changes in the Volta River
delta, West Africa: the roles of natural processes and human impacts. African Journal of
Aquatic Science. Volume 41, Issue 1, p. 81-87.
Beck, JS and Basson JR, 2003. The hydraulics of the impacts of dam development on the
river morphology. Report to the Water Research Commission. Stellenbosh, South Africa.
Blivi, A.B., 1993. Géomorphologie et dynamique actuelle du littoral du Golfe du Bénin (Afrique
de l’Ouest). Ph.D. Thesis, Université Michel de Montaigne, Bordeaux, 458 pp.
Boateng, I. 2012. An application of GIS and coastal geomorphology for large scale
assessment of coastal erosion and management: a case study of Ghana. Journal of Coast
Conservation (2012) 16:383–397.
Booij, N., Ris, R.C., Holthuijsen, L.H., 1999. A third-generation wave model for coastal
regions: 1. Model description and validation. Journal of Geophysical Research. Vol. 104,
7649-7666 pp.
Brandt, S. A., 2000. Classification of geomorphological effects downstream of dams. Journal
Catena, 40, 375-401.

Human Interventions and Climate Change Impacts on the West African Coastal Sand River
1210349-000-ZKS-0002, 8 December 2016, final
96 of 99
Brière C., Chatelain M., Hoekstra R., Nederhoff K., Swinkels C., van der Zwaag J., 2015.
Etude de faisabilité de l'ouverture de l'embouchure du fleuve Comoé à Grand Bassam (Côte
d'Ivoire). Deltares report 1209601-000-HYE-0005. 127 p.
Brown C. B. (1944), Discussion of sedimentation in reservoirs. Ed. J. Witzig. Proc. of the
American Society of Civil Engineers, Vol. 69, pp. 1493-1500.
Brune G. M. 1953, Trap efficiency of reservoirs. Trans. Am. Geophysical Union, Vol. 34, No.
3, pp. 407-418.
Christensen, J. H., & Christensen, O. B. (2007). A summary of the PRUDENCE model
projections of changes in European climate by the end of this century. Climatic change, 81(1),
7-30.
Cooper, J. A. G., & Pilkey, O. H. (2004). Sea-level rise and shoreline retreat : time to abandon
the Bruun Rule. Global and Planetary Change, 43, 157–171.
http://doi.org/10.1016/j.gloplacha.2004.07.001
Dee, D. P. and co-authors, 2011. The ERA-Interim reanalysis: configuration and performance
of the data assimilation system, Q. J. R. Meteorol. Soc., 137 (656), 553-597,
doi:10.1002/gj.828.
Dean, R.G., 1977. Equilibrium beach profiles: U.S. Atlantic and Gulf coasts. Department of
Civil Engineering, Ocean Engineering Report N° 12, University of Delaware, Newark,
Delaware.
Dendy, F. E., & Bolton, G. C. (1976). Sediment yield-runoff-drainage area relationships in the
United States. Journal of Soil and Water Conservation.
Degbe, C.G.E. 2009. Géomorphologie et érosion côtière dans le Golfe de Guinée. Thèse,
Université d’Abomey-Calavi (UAC), Cotonou.
Delft Hydraulics, 1992. Travaux de Protection et d’ Aménagement de la Côte à l'Est de
Cotonou (Zone de la Crique). Study report.
Deltares, 2011. UNIBEST-CL+ manual. Manual for version 7.1 of the shoreline model
UNIBEST-CL+. Delft, The Netherlands.
Deltares, 2016. Use of Global Datasets for Hydro-Metereological Analysis in Areas with
Sparse Data. Report (preliminary).
Dendy, F. E., & Bolton, G. C. (1976). Sediment yield-runoff-drainage area relationships in the
United States. Journal of Soil and Water Conservation.
Egis International, 2013. Economic and Spatial Study of the Vulnerability and Adaptation to
Climate Change of Coastal Areas in Senegal.
Giardino, A.,di Leo, M., Bragantini, G., de Vroeg, H., Tonnon, P.K., Huisman, B., de Bel, M.,
2015. An Integrated Sediment Management Scheme for the Coastal Area of Batumi
(Georgia). Proceedings of the Medcoast Conference, Varna, Bulgaria.

1210349-000-ZKS-0002, 8 December 2016, final
Human Interventions and Climate Change Impacts on the West African Coastal Sand River
97 of 99
Gischler, E. 2007. Beachrock and intertidal precipitates. Geochemical sediments &
Landscapes. In Blackwell Publishing, 365–390.
Hemer, M.A., Fan, Y., Mori, N., Semedo, A., Wang, X.L., 2013. Projected changes in wave
climate from a multi-model ensemble. Journal of Nature of Climate Change, DOI:10.1038.
IPCC, 2013. Contribution of Working Group I to the Fifth Assessment Report of the
Intergovernmental Panel on Climate Change. Technical Summary.
http://www.climatechange2013.org/images/report/WG1AR5_TS_FINAL.pdf
Kaki, C., Oyede, L.M., Yessoufou, S. 2001. Sedimentary dynamics and coastal environment
of the Beninese coast east of the embouchure of the river Mono. J. Rech. Sci. Univ. Benin
(Togo). 5(2), 247-261.
Kaki C., Laïbi R.A., and Oyédé L. M. 2011. Evolution of Beninese Coastline from 1963 to
2005: Causes and Consequences. British Journal of Environment & Climate Change, 1(4):
216-231.
Khan, O., Mwelwa-Mutekenya, E., Crosato, A., Zhou, Y., 2014. Effects of dam operation on
downstream river morphology, the case of the Middle Zambezi River. Journal of Water
Management, vol 167, no. 10, 585-600.
Kumapley, N.K., 1989. The geology and geotechnology of the Keta basin with particular
reference to coastal protection. Proc., KNGMG Symp. Coastal Lowlands, Geology and
Geotechnology, pp. 311–320.
Laibi, R., Anthony, E., Almar, R., Castelle, B., Senechal, N., and Kestenare, E. 2014.
Longshore drift cell development on the human-impacted Bight of Benin sand barrier coast,
West Africa. In Proceedings of the 13th International Coastal Symposium. Durban, South
Africa. J. Coast. Res. 70, 78–83.
Le Loeuff, P. and E. Marchal. Géographie Littorale. In: Environnement et ressources
aquatiques de Côte d'Ivoire. Tome 1. Le milieu marin. Le Lœuff, P., Marchal, E. and J.B.
Amon Kothias (eds.), editions de l'ORSTOM, Paris, 1993, pp.15-22.
Lu, J., Sun, G., McNulty, S. G., & Amatya, D. M., 2005. A comparison of six potential
evapotranspiration methods for regional use in the southeastern United States1.
Ly, C.K., 1980. The role of the Akosombo Dam on the Volta river in causing erosion in central
and eastern Ghana (West Africa). Mar. Geol. 35, 323–332.
Ly, C.K., 1981. Sources of beach sand from the central and eastern coasts of Ghana, West
Africa. Marine Geology, 44. 229-240.
Mascle, J., Blarez, E., Marinho M., The shallow structures of the Guinea and Ivory Coast-
Ghana transform margins: Their bearing on the Equatorial Atlantic Mesozoic evolution.
TecfonopIics, 155 (1988) 193-209.
Martin, L. Carte sédimentologique du plateau continental de Côte d'Ivoire. ORTSOM – CRO
Abidjan, Notice explicative, 1973, n°. 48, 19 pp and 3 maps.
Human Interventions and Climate Change Impacts on the West African Coastal Sand River
1210349-000-ZKS-0002, 8 December 2016, final
98 of 99
Masselink, G., Short, A.D., 1993. The effect of tide range on beach morphodynamics and
morphology: a conceptual model. J. Coast. Res. 9, 785–800.
Ranasinghe, R., Callaghan, D., & Stive, M. J. F. (2012). Estimating coastal recession due to
sea level rise : beyond the Bruun rule. Climatic Change, 561–574.
doi.org/10.1007/s10584-011-0107-8
Rijn, L.C. van, 1993. Principles of Sediment Transport in Rivers, Estuaries and Coastal Seas.
Aqua Publications, The Netherlands.
Rossi, G. 1988. Un example d'utilisation d'une defense naturelle contre l'erosion littorale: le
gres de plage. Revue de géomorphologie dynamique.
Schellekens, J., 2013. OpenStreams : wflow documentation (release 0.91).
Soulsby, R., 1997. Dynamics of marine sand. A manual for practical applications. Thomas
Telford, London. ISBN 978-0-7277-2584-X.
Sultan, B., Roudier, P., Quirion, P., Alhassane, A., Muller, B., Dingkuhn, M., Ciais, P.,
Guimbertau, M., Traore’ S.B., Baron, C., 2013. Assessing climate change impacts on
sorghum and millet yields in the Sudanian and Sahelian savannas of West Africa.
Environmental Research Letters, 8(1), 014040.
Tilmans, W.M.K., Jakobsen, P.R., LeClerc, J.P., 1991. Coastal erosion in the Bight of Benin.
A critical review. Delft Hydraulics (Deltares), The Netherlands.
Tilmans W.M.K., de Vroeg J.H., Leclerc J-P., 1995 Coastal protection at Cotonou, Benin.
Proceedings of the Fourth International Conference on Coastal and Port Engineering in
Developing Countries. Rio de Janeiro, Brazil.
UEMOA, 2011. Regional study for shoreline monitoring and drawing up a management
scheme for the West African coastal Area.
UEMOA, 2015. Update of the regional study for shoreline monitoring and drawing up a
management scheme for the West African coastal Area.
Van Rijn, L.C., 1993. Principles of Sediment Transport in Rivers, Estuaries and Coastal Seas.
Aqua Publications, The Netherlands.
Van Rijn, L.C. 1995. Sand budget and coastline changes of the central coast of Holland
between Den Helder and Hoek van Holland 1964-2040. Coastal Genesis Program report H
2129.
Van Rijn, L.C. 2005a. Estuarine and coastal sedimentation problems. International Journal of
Sediment Research, 20, Vol. 1, 39-51.
Van Rijn, L.C. 2005b. Principles of Sedimentation and erosion engineering in rivers, estuaries
and coastal seas, 580 pp.
Wauthy B., 1983. Introduction à la climatologie du golfe de Guinée. Oceanogr. Trop., vol. 18,
no 2 : 103-138.
1210349-000-ZKS-0002, 8 December 2016, final
Human Interventions and Climate Change Impacts on the West African Coastal Sand River
99 of 99
Wiafe G., 2011. Coastal and Continental Shelf Processes in Ghana. Department of
Oceanography and Fisheries, University of Ghana.
Wognin, V., 2004. Caractérisation sédimentologique et hydrologique à l’embouchure du
fleuve Bandama. Thèse doc. Unique Univ. Cocody : 195p.
Wognin A.I.V., Coulibaly A.S., Akobe A.C., Monde S., Aka K., 2013. Morphologie du littoral et
cinématique du trait de côte de Vridi à Grand Bassam (Cote d’Ivoire). Journal of
Environmental Hydrology. Volume 21. Paper 1.
Wright, L.D., Short, A.D., 1984. Morphodynamic variability of surf zones and beaches: a
synthesis. Mar. Geol. 56, 93–118.

1210349-000-ZKS-0002, 8 December 2016, final
Human Interventions and Climate Change Impacts on the West African Coastal Sand River
101 of 99
10 References – website
http://aqua-monitor.appspot.com/
ftp://daac.ornl.gov/data/rivdis/STATIONS.HTM
http://www.earth2observe.eu/
www.simplecoast.com
http://v-web004.deltares.nl/africa/africa/


1210349-000-ZKS-0002, 8 December 2016, final
Human Interventions and Climate Change Impacts on the West African Coastal Sand River
A-1
A Appendix A: Validation cases of net littoral drift based on historical coastline development
The morphological coastline development model that is set-up for the present study is
validated on the basis of the net longshore transport rate and the magnitude of coastline
regression (advance) en transgression (retreat). These quantities are best defined at
coastline sections where a (human-induced) perturbation has led to a change in the sediment
supply or demand. Therefore, four cases are identified where a human-built construction has
significantly altered the coastal sediment regulation. These are (from west to east, see also
Table 3.6):
- The port of Abidjan; The construction of the 350 m long breakwater (1967-1985) has
led to an increased accretion rate west of the breakwater.
- The Keta Lagoon; The construction of the Akosombo Dam (1961) has led to a
considerable reduction of sediment supply towards the Keta Lagoon area, leading to
severe erosion down-drift of the river mouth. A groyne field constructed near Keta has
stabilized the coast at Keta but erosion shifted down-drift.
- The port of Lomé; Construction of the port was completed in 1968, interrupting
longshore transport rates and causing coastline regression east of the breakwater.
- The port of Cotonou; The 300 m long breakwater has caused coastline progradation
at the western side.
The position of the coastline was available for these four different locations for the period
1988 – 2016. The positions of these coastlines were acquired by an automated procedure
that detects the presence of water or land by the calculation of the Normalized Difference
Vegetation Index (NDVI) of multiple Landsat images (Aqua Monitor Tool, Deltares). The
position of the coastline can be extracted by this procedure by detecting the boundary
between water and land. From this analysis, the magnitudes of coastline development can be
calculated. By defining an active height1 of the profile, the accretion and erosion rates per
year can be calculated between coastlines of different periods. The calculated rates for the
four different cases are summarized in Table 3.6.
However, it is important to mention that the shoreline changes at these validation locations
are assumed to be only the result of the presence of the jetties and groynes. Other human
induced changes (e.g. port dredging, leeside nourishments, sand mining from the beach, etc.)
are not accounted for in this analysis. This assumption could lead to an overestimation of the
actual transport rates as we assume that all coastal changes are in fact due to a disruption of
the natural alongshore transport rates.
1 Active height = height of the profile where morphological changes occur, as a result of changes in source/sink of
sediments. The active height depends on the wave climate, local bathymetry and the timeframe considered.

Human Interventions and Climate Change Impacts on the West African Coastal Sand River
1210349-000-ZKS-0002, 8 December 2016, final
A-2
A.1 Validation case: Abidjan port
In order to estimate the net longshore transport in the area of Abidjan a shoreline analysis
has been carried out for the coast west of the port. West of the port entrance a 350 m long
breakwater has been constructed, see Figure A.1. West of this breakwater the coast has
accreted. On the basis of the accreted area the net longshore transport has been estimated.
The time of construction of this breakwater is not exactly known. On an image of 1967 it is not
present yet, whereas on an image of 1985 it is present. So the structure was built between
1967 and 1985 but the exact year is not known.
Figure A.1 Aerial image of the breakwater considered for the analysis.
It is noted that the shoreline located east of the port has not been taken into consideration in
this assessment, since the shoreline in this area is not showing the classis leeside erosion
behaviour. An overall trend of erosion is observed east of the port, but the shoreline retreat in
that area is very irregular and it is not clear to which extent human interference has played a
role in this area.
Therefore the shoreline analysis and transport estimate are based on the accreting coastal
stretch located west of the port. This coast shows the classic response of an updrift located
coast on the construction of a breakwater, viz. a gradual accretion, see Figure A.2.
Shorelines were available for the period 1988 to 2016, but only the data between 1988 and
2003 were used for the assessment. After 2003 the accretion rate reduces relative to the
preceding years. We have therefore interpreted the year 2003 as the moment that the sand
bypass along the breakwater becomes significant.
In the period 1988-2003 the shoreline just west of the breakwater has moved seaward over a
distance of about 100 m. This distance gradually decreases going westward along the coast
and at a distance of about 10 to 15 km the effect of the breakwater is estimated to be nihil. If
we assume an active profile height of about 10 m, then the above shoreline changes imply a
sand accumulation west of the breakwater in the order of 400,000 to 500,000 m3/yr.
Though the sand bypass along the structure in the considered period is expected to be small,
it cannot be fully excluded that some bypass has occurred, so the actual transport may be
somewhat larger than the above assessed value.

1210349-000-ZKS-0002, 8 December 2016, final
Human Interventions and Climate Change Impacts on the West African Coastal Sand River
A-3
Figure A.2 Shoreline analysis of the coastline west of Port Bouet breakwater.
It is noted that in Delft Hydraulics (1992) along the West African coast (at Cotonu) under
similar wave conditions the active profile height was estimated at 16 m (based on observed
behaviour of deeper depth contours in the area of erosion at the downdrift side of the port).
This is not necessarily a discrepancy, since in accreting areas the active profile height may be
different (smaller) than in eroding areas.
If we consider as an upper limit for the active height a value of 16 m instead of 10 m, the
upper estimate of the transport is in the order of 800,000 m3/yr. This is in agreement with
Brière et al. (2015).
Taking all above considerations and uncertainties into account, the order of magnitude of the
net longshore transport west of Abidjan is estimated at 400,000 to 800,000 m3/yr. For the
coast east of Abidjan the net longshore transport is expected to be smaller, since in this area
the overall shoreline orientation is more normal to the waves.

Human Interventions and Climate Change Impacts on the West African Coastal Sand River
1210349-000-ZKS-0002, 8 December 2016, final
A-4
A.2 Validation case: Keta Lagoon
The shoreline analysis for the case study of the Keta Lagoon is focused on the stretch of
coast located northeast from the groyne field at Keta. The groyne field and the sea wall at
Keta were constructed around 2003 during the Keta Coastal Defence project (Figure A.3).
The groyne field has stabilized the coastline at Keta and the coastline has even prograded at
some locations. However, as part of the coastal defence project, sand nourishments were
executed. The sand nourishments make it more difficult to estimate the rate of coastline
accretion that is caused by littoral drift. Therefore, the shoreline analysis has focused on the
erosional area north-east of the groyne field. Here, the construction of the groyne field has
caused the coastline down-drift of the groynes to retreat since 2003, this can very well be
seen by the historic coastlines that change from an accretional state at the groyne field to an
erosional state down-drift of the most north-easterly groyne of the groyne field in the period
2003-2016 (Figure A.4).
Figure A.3 Aerial image of the groyne field at Keta.
The cross-shore retreat of the coastline in the period 2003-2016 is approximately 130 m. The
coastline retreat in this period can be identified up to Adina, decreasing in magnitude. The
affected stretch of the coastline is estimated at approximately 13 km. Assuming an active
profile height of 10 m the longshore transport rate at this part of the Ghana coast is estimated
to be approximately 750,000 m3/yr.
Figure A.4 Shoreline analysis of the coastline north-east of the Keta groyne field.

1210349-000-ZKS-0002, 8 December 2016, final
Human Interventions and Climate Change Impacts on the West African Coastal Sand River
A-5
A.3 Validation case: port of Lomé
The shoreline analysis is executed on the stretch of coast just west of the breakwater of the
port. In 2013 the port attained its present state configuration and a breakwater was built at the
southern side of the port. Because it is difficult to separate the human-induced coastline
changes from ‘natural sedimentation’ before this period, the coastline analysis is performed
for a period since completion of the port. The breakwater induced coastline progradation on
its western side. Based on expert judgment based on the relative position between the
coastline and the tip of the breakwater, we can assume that sandbypassing rates have been
small. Therefore , the period and location are suited for the present analysis.
Between 2013 and 2016 the coastline prograded over a distance of approximately 130 m just
west of the breakwater. The affected area of accretion is approximately 4 kilometer to the
west (Figure A.5). When an active height of 10 m is assumed as for the other validation
cases, the seaward progradation of the shoreline in the period 2013-2016 (2.5 years) implies
a net longshore transport rate of ~ 1,000,000 m3/yr and a coastline progradation of 52 m/yr
just west of the breakwater.
Figure A.5 Shoreline analysis of the area west of the Lomé port for the period 2013 – 2016.

Human Interventions and Climate Change Impacts on the West African Coastal Sand River
1210349-000-ZKS-0002, 8 December 2016, final
A-6
A.4 Validation case: port of Cotonou
In order to estimate the net longshore transport in the area of Cotonou a shoreline analysis
has been carried out for the coast west of the port. West of the breakwater indicated in Figure
A.6 the coast has accreted. The analysis has focussed on the period 2006-2016, since after
2006 the breakwater has been extended over a distance of about 300 m (Figure A.6).
Figure A.6 Breakwater extension between 2006 and 2012 (upper figure: breakwater in 2006, lower figure:
breakwater in 2012).
In the period after this extension the sand bypass along the breakwater can be assumed to
be nihil or very small, so this period is suitable for an assessment of the net longshore
transport. Before the breakwater extension the sand bypass is estimated to be considerable,
so this period has not been included in the assessment.
On the basis of the available data it is not possible to derive the exact year of the breakwater
extension, but based on the shoreline positions for all available years it is estimated that this
was not long after 2006.

1210349-000-ZKS-0002, 8 December 2016, final
Human Interventions and Climate Change Impacts on the West African Coastal Sand River
A-7
Since then the shoreline just west of the breakwater has moved seaward over a distance of
about 180 m, see Figure A.7.
This distance gradually decreases going westward along the coast and at a distance of about
10 to 15 km the effect of the breakwater is estimated to be nihil. If we assume an active
profile height of about 10 m, then the above shoreline changes imply a sand accumulation
west of the breakwater in the order of 900,000 to 1,000,000 m3/yr.
Figure A.7 Shoreline analysis west of port of Cotonou.
The order of magnitude of the estimated transport is in fair agreement with the rate of
1,250,000 m3/yr presented in Delft Hydraulics (1992), which was based on the erosion
observed east of the port. It is noted that in Delft Hydraulics (1992) the active profile height
was estimated at 16 m (based on observed behaviour of deeper depth contours in the
eroding area), which is larger than the roughly estimated 10 m in our assessment. This is not
necessarily a discrepancy, since in accreting areas the active profile height may be different
(smaller) than in eroding areas.
Based on the above considerations the order of magnitude of the net longshore transport
near Cotonou is estimated at 900,000 to 1,300,000 m3/yr.


1210349-000-ZKS-0002, 8 December 2016, final
Human Interventions and Climate Change Impacts on the West African Coastal Sand River
B-1
B Input maps – hydrological model
In this annex, yearly averaged maps of different input values for the hydrological model are
shown. In particular: land use map, mean annual precipitation map (1979 - 2014), mean
annual potential evapotranspiration (1979 - 2014), and mean temperature (1979 – 2014).
More information, related to the hydrological modelling, can be found in Section 5.4.1.

Human Interventions and Climate Change Impacts on the West African Coastal Sand River
1210349-000-ZKS-0002, 8 December 2016, final
B-2

1210349-000-ZKS-0002, 8 December 2016, final
Human Interventions and Climate Change Impacts on the West African Coastal Sand River
B-3


1210349-000-ZKS-0002, 8 December 2016, final
Human Interventions and Climate Change Impacts on the West African Coastal Sand River
C-1
C Summary table of longshore transport (values in x103 m3/year)
Section Hindcastmodel (Section 6.4.1)
Reference model (Section 6.4.2)
Effects of anthropogenic interventions (Section 6.5.1)
Effects of climate change (Section 6.5.2)
Simulation Removal
of ports 0%
bypass 50%
bypass Removal of dams
0.3 m RSLR
1.0 m RSLR
+ 20% prec.
20% prec.
Period 1985-2015 2015-2045 2015-2045 2070-2100
Border Liberia –
Côte d'Ivoire -31 -31 -32 -32 -29 -32 -148 -151 -31 -33
Tabou -1184 -1184 -1185 -1184 -1182 -1185 -1352 -1367 -1184 -1186
San-Pedro -1361 -1361 -1361 -1361 -1358 -1361 -1590 -1593 -1360 -1362
Sassandra -1475 -1475 -1475 -1475 -1472 -1451 -1718 -1715 -1475 -1475
Grand-Lahou -622 -622 -623 -622 -620 -547 -789 -774 -624 -621
Abidjan -123 -248 -559 -9 -352 -247 -406 -403 -247 -248
Grand-Bassam 117 116 116 116 118 168 29 46 116 116
Border Côte d'Ivoire - Ghana 27 26 26 26 28 28 -76 -61 27 25
Cape Three Points -146 -147 -148 -147 -146 -146 -226 -210 -147 -149
Takoradi -2280 -2281 -2281 -2280 -2279 -2279 -2577 -2573 -2280 -2282
Cape Coast -1092 -1093 -1093 -1093 -1092 -1092 -1285 -1306 -1092 -1093
Accra -556 -557 -558 -557 -556 -556 -637 -655 -557 -558
Volta river -737 -738 -738 -738 -737 -664 -913 -905 -738 -738
Border Ghana - Togo / Lome -470 -454 -464 -454 -456 -453 -507 -519 -454 -454
Togoville -202 -178 -518 -178 -177 -177 -204 -210 -177 -178
Border Togo - Benin -464 -463 -562 -463 -462 -489 -541 -559 -462 -463
Cotonou -22 -14 -730 -14 -383 -13 -22 -23 -13 -14


1210349-000-ZKS-0002, 8 December 2016, final
Human Interventions and Climate Change Impacts on the West African Coastal Sand River
D-1
D Glossary
This glossary provides definitions of terms that are in common use when describing coastal
processes and coastal management. It is not a comprehensive dictionary of coastal
terminology. The definitions used in the glossary are sourced from the US Army Corps of
Engineers and from glossaries provided in relevant Standards, as well as from other coastal
management guidelines in current use (e.g. www.simplecoast.com).
Term Definition
Alongshore or Longshore
Parallel to and near the shoreline. (USACE)
Beach
The zone of unconsolidated material that extends landward from the low water line to the place where there is marked change in material or physiographic form, or to the line of permanent vegetation (usually the effective limit of storm waves). The seaward limit of a beach is the mean low water line. A beach includes foreshore and backshore. (USACE)
Beach erosion
The carrying away of beach materials by wave action, tidal currents, littoral currents, or wind.
Breaker zone The zone within which waves approaching the coastline commence breaking.
Breakwater
A man-made structure protecting a shore area, port, anchorage, or basin from waves.
Bruun Rule
A commonly used method for estimating the response of a sandy shoreline to rising sea levels
Closure depth
The depth below which vertical sea bed changes are not detected. It is generally considered as the seaward limit of littoral transport (collected over several years). The depth can be determined from repeated cross–shore profile surveys or estimated using formulas based on wave statistics. Note that this does not imply the lack of sediment motion beyond this depth
Coastal morphology Coastal morphology is the study of the origin and evolution of coastal features
Downdrift A position on the shoreline which is ‘downstream’ of sediment transport caused by longshore drift
Erosion The permanent loss of sand from the system
Hard defences (protection)
General term applied to impermeable coastal defence (protection) structures of concrete, timber, steel, masonry, etc., which reflect a high proportion of incident wave energy
Littoral transport Littoral transport is the term used for the transport of non-cohesive sediments, i.e. mainly sand, along the foreshore and the shoreface due to the action of the breaking waves and the longshore current. The littoral transport is also called the longshore transport or the littoral drift.
Longshore current The longshore current is the dominating current in the nearshore zone; it is running parallel to the shore.
Revetment or sea wall
A type of coastal protection work which protects assets from coastal erosion by armouring the shore with erosion-resistant material. Large rocks/boulders, concrete or other hard materials are used, depending on the specific design requirements.

Human Interventions and Climate Change Impacts on the West African Coastal Sand River
1210349-000-ZKS-0002, 8 December 2016, final
D-2
Sand drift
The movement of sand by wind. On the coast, this generally describes sand movement resulting from natural or human induced degradation of dune vegetation, resulting in either nuisance or major sand drift (dune transgression).
Sea level rise
An increase in the mean level of the oceans. Relative sea level occurs where there is a local increase in the level of the ocean relative to the land, which might be caused by ocean rising , the land subsiding, or both. In areas with rapid land level uplift (e.g. seismically active areas), relative sea level can fall.
Sediment budget An accounting of gains and losses of sediment within defined boundaries over a period of time
Sediment transport
The process whereby sediment is moved offshore, onshore or along shore by wave, current or wind action
Shoreface or Littoral zone
This zone extends seaward from the foreshore to some distance beyond the breaker zone. The littoral zone is the zone in which the littoral processes take place; these are mainly the long-shore transport, also referred to as the littoral drift, and the cross-shore transport.
Significant wave height (Hs)
The average wave height of the highest one third of the waves
Surf zone
The zone of wave action extending from the water line (which varies with wave conditions, tide, surf, set-up etc.) out to the most seaward point of the breaker zone.
Tide The astronomical tide is generated by the rotation of the earth in combination with the varying gravitational impact on the water body of the sun, the moon and the planets. These phenomena cause predictable and regular oscillations in the water level, which is referred to as the tide.
Updrift A position on the shoreline which is ‘upstream’ of sediment transport caused by longshore drift
Wave climate The seasonal and annual distribution of wave height, period and direction
Wave energy
The capacity of waves to do work. The energy of a wave system is theoretically proportional to the square of the wave height; a high-energy coast is characterised by breaker heights greater than 50 centimetres and a low–energy coast is characterised by breaker heights less than 10 centimetres. Most of the wave energy along equilibrium beaches is used in shoaling and in sand movement.

1210349-000-ZKS-0002, 8 December 2016, final
Human Interventions and Climate Change Impacts on the West African Coastal Sand River
E-1
E Summary of the Launch Workshop
West Africa Coastal Areas Technical Assistance Program « WACA » West Africa Coastal Area Erosion and Adaptation Project
Lomé,19-21 October 2016
Text by Miguel Toquika (The World Bank)
E.1 Summary presentations of final results and stakeholder’s consultation
The Deltares study, “Human Interventions and Climate Change Impacts on the West African
Coastal Sand River: A Preliminary Quantitative Assessment” was presented during the first
technical session in the WACA launch workshop in Lomé. The work was presented by Dr.
Alessio Giardino, coastal morphologist and climate change expert (project leader). The
presentation was followed by questions and answers from the workshop attendees.
Moreover, a separate session with experts and scientists from the region was held in order to
discuss next steps, future work, and to create channels of future collaboration between
researchers at Deltares and regional Universities in Cote d’Ivore, Ghana, Togo and Benin.
The presentation was divided in four sections describing: a) project’s objectives, b) scope and
approach of the study (literature and data review), c) modelling study and results, and d)
conclusions and future plans in order to move towards a regional sediment management
plan.
The stakeholder’s consultation gave the opportunity to local scientists to further clarify the
project’s context and results. Some of the major points raised during the consultation are
summarized below:
Professor Adote Blim Blivi. Director of the GCILE in Lome, Togo (Centre de Gestion Intégrée
du Littoral et de l'Environnement)
The conceptual framework of sand river (including rivers and coast) was explained to
the audience. Professor Blivi would like submarine sediments to be considered as
part of the analysis.
Need of implementing high resolution local models including ground validation and
field data.
For specific coastal protection works, need to use up-to-date bathymetric data.
Professor Blivi suggests to have two representatives from each country visiting
Deltares in order to get acquainted with the use of methodologies and models
implemented in the study.
Mr. Moussa Bio Djara. Project coordinator: Coastal protection Hillacondji-Grand Popo (CGP-HGP/MUHA). Benin Ministry of planning and development
Big concern as Benin is located last in line in relation to alongshore sediment
transport drift with respect to the other countries. Sediment transport patterns in West
Africa moves west-to-east. How can the study results be used to convince the
decision makers about the proper adaptation measures?

Human Interventions and Climate Change Impacts on the West African Coastal Sand River
1210349-000-ZKS-0002, 8 December 2016, final
E-2
If there is a deficit of sediments how do we cope with it, how to use the model to
answer these interrogatives?
How long will the sand be there in case of nourishments? Do we need long-term
monitoring? Some countries replenish their beaches every year, but it a very costly
process.
There is a need of detailed bathymetry for high-resolution, local models.
Professor Kwasi Appeaning ADDO. University of Ghana, Department of Marine and Fisheries Sciences.
There is a need of capacity building activities, transferring the knowledge related to
the models to local scientists so that they can start using those models at local level.
The World Bank, WACA program to investigate possibilities and methods to transfer
the models to the countries and facilitate mechanism for Deltares training workshops.
The model is clearly a representation of the reality. However, if the bathymetry does
not represent the real actual values, we will have uncertain results.
Professor Prof. Eric M'moi Valère DJAGOUA, Coordinator of the Cote d’Ivore national program for management of the costal environnements. (PNGEC). Professor Celestin Hauhouot. University Felix Ouphouet Boigny and MOLOA national Antenna.
The University is currently having students working on similar models for
sedimentation. This is an opportunity to transfer knowledge and create capacity to
local scientist and students.
There is a need to encourage students to use models with actual data from the field.
Need to apply models with combination of field data; however, the technical capacity,
instruments, and methods to collect field data need to be revisited.
There is a need of accurate bathymetry datasets.
Need of monitoring over a long periods and time. Observations for only one year are
useful but not sufficient to assess long-term trend and effectiveness of different
coastal protection measures.
Deltares follow-up and suggestions for future work.
Setting up a regional sediment management plan together with local organizations.
The numerical framework which we have set-up, should be just one of the building
blocks in support for the setting up of this plan. A regional sediment management plan
should include aspects on sediment resources availability (based on data and
complemented with model information), policy related aspects, aspects related to
costing of different solutions, trends in economic development, climate change, etc.
So, contribution, from different organization would be highly desired.
Use the modelling framework set-up so far to derive boundary conditions for detailed
models to be implemented for example where future solutions/new expansions are
being planned. For example: the construction of a sand nourishment, a groyne
system, a bypass system, a port expansion, etc.
Combination with a capacity building component (e.g. training in the country or skilled
students spending sometime at Deltares) and contributing to the model development.

1210349-000-ZKS-0002, 8 December 2016, final
Human Interventions and Climate Change Impacts on the West African Coastal Sand River
E-3
The request done by several professors during consultation was to have two
representatives from each country spending two weeks at Deltares, receiving training.
Data harmonization: as part of this study a viewer has been set-up and which could
be used to visualize and share the results of our work to a wider public. Similar
system could be used to harmonize and share all type of data collected from other
regional studies i.e. SDLAO. This would allow local organizations to have easy
access to data from other organization in their own country and from the entire region.
The current coastal viewer does not require any GIS software license.
Extend the modelling study to neighbouring countries, in collaboration with local and
regional organizations.
Figure E.1 Picture from the workshop in Lomé.
E.2 Attendance list
Name Function Organization E-mail address
Prof. Eric M'moi
Valère
DJAGOUA
Coordonnateur
du Programme
National de
Gestion de
l'Environnement
Côtière (PNGEC)
Ministère de
l’Environnement, de
la Salubrité Urbaine
et du
Développement
Durable
Prof. Célestin HAUHOUOT
MOLOA coordinator for C.I
Université Félix Ouphouet Boigny

Human Interventions and Climate Change Impacts on the West African Coastal Sand River
1210349-000-ZKS-0002, 8 December 2016, final
E-4
Moussa BIO DJARA
Coordonnateur du Projet de Protection de la Côte entre Hillacondji et Grand-Popo (CGP-HGP/MUHA)
Ministère du Cadre de Vie et du Développement Durable
Ben ASOMANI Director of Research, Statistics and Information Mangement (RSIM
Ghana minister of Environment, Science,Technology and Innovation
Hubert OSEI-WUSUANSA
Chef des Travaux côtiers, Direction de l’hydrologie
Ministry of Water Resources, Works and Haising
Kwasi Appeaning ADDO
Department of Marine and Fishries Sciences Lecturer,
University of Ghana [email protected]
Tchannibi Bakatimbe
Ingénieur des Eaux et Forêts
Ministère de l’Environnement et des Ressources Forestières
Adoté Blim BLIVI Directeur Centre de Gestion Intégrée du Littoral et de l'Environnement (CGILE)
Moussa SALL Coordonnateur régional
Mission d'Observation du Littoral Ouest africain
Fatou BINTOU Project officer Mission d'Observation du Littoral Ouest africain
Amevi Edoé APEZOUMON-AGBETIAFA
Chargé de programme
UEMOA [email protected]
Miguel TOQUICA
Disaster risk management specialist
Banque mondiale [email protected]
Nicolas
Desramaut
Disaster risk management specialist
Banque mondiale [email protected]
Melissa Environment Banque mondiale [email protected]

1210349-000-ZKS-0002, 8 December 2016, final
Human Interventions and Climate Change Impacts on the West African Coastal Sand River
E-5
Landesz
specialist
Ruth Jane
Kennedy-
Walker
Environment Engineer
Banque mondiale [email protected]
Idriss DEFFRY Coordonnateur MACO
UICN [email protected]
Kofi AGBOGAH Director, Hen Mpoano Program Manager,
Sustainable Fisheries Management Project
Alessio Giardino Coastal Engineer Deltares [email protected]
Gijsbert van Holland
Coastal and estuary dynamics expert
IMDC [email protected]
Zebedee NJISUH Coastal Resilience and Adaptation Specialist
WABiCC