
Human Detection by Boosting-Based Co-occurrence of HOG and Color
5
Human Detection by Boosting-Based Co-occurrence of HOG and Color Feature 47 Human Detection by Boosting-Based Co-occurrence of HOG and Color Feature Ryo Matsumura 1 and Akitoshi Hanazawa 2 , Non-members ABSTRACT In this paper, we propose a method for human de- tection using co-occurrence of Histograms of Oriented Gradients (HOG) features and color features. This method expresses the co-occurrence between HOG and color features by Adaboost and generates the combination of the features effective for the identifi- cation automatically. Color features were calculated by making histograms that quantized hue and satu- ration in local areas. We show the effectiveness of the proposed method by identification experiments for human and non-human images. Keywords: Human detection, Histograms of Ori- ented Gradients, Color feature, Adaboost 1. INTRODUCTION Technologies to detect humans in images are very important image technologies because they can be ap- plied on various fields such as robot vision, surveil- lance system and Intelligent Transport System, etc. In recent methods for human detection, many meth- ods combine local features that represent human appearances like Histograms of Oriented Gradients (HOG) [1] with Adaboost [2], a statistical learning method. Methods combining appearance and other features to improve accuracy has also been proposed, and effectiveness has been reported [3,4,5]. However, these methods [3,4] require consecutive images or a background image. Color features are effective for object detection and can be extracted from a single image. Takayanagi et al. [5] showed that color features, e.g. skin color of face, are automatically selected and effective for human identification by Adaboost. However, co- occurrence between the features was not considered in this method. In this paper, we propose a method for human detection using co-occurrence of HOG fea- tures and color features by Adaboost. Because this study is the first step to examine the efficacy of the co- occurrence of HOG and color features, we employed Adaboost due to its simpleness. This method can generate the combination of the features effective for Manuscript received on February 28, 2011 1,2 The authors are with the Department of Brain Sci- ence and Engineering, Graduate School of Life Science and Systems Engineering, Kyushu Institute of Technology 2- 4 Hibikino, Wakamatsu, Kitakyushu, Fukuoka, 808-0916, Japan, E-mail: [email protected] and [email protected] identification automatically, and highly accurate de- tection can be expected. We show the effectiveness of our method by identification experiments for human and non-human images. 2. FEATURES 2.1 Histograms of Oriented Gradients Histograms of Oriented Gradients (HOG) [1] is a feature vector made by histograms of gradient direc- tion of brightness in local areas called cell (Fig.1). HOG has a characteristic robust for local geometry change and illumination change. The calculation pro- cedure of HOG is shown as follows. Fig.1: Cell and block. First, calculates gradient intensity m and gradient direction θ by Eq. (1) and (2) from the brightness value L of each pixel. m(x, y)= √ f x (x, y) 2 + f y (x, y) 2 (1) θ(x, y) = tan −1 f y (x, y) f x (x, y) (2) { f x (x, y)= L(x +1,y) - L(x - 1,y) f y (x, y)= L(x, y + 1) - L(x, y - 1) (3) Next, the gradient direction histograms of bright- ness are made by using calculated gradient intensity m and gradient direction θ in the cell. The calcu- lated gradient direction θ is converted from 0 to 180 degrees. The obtained gradient direction θ divides into 20 degrees and makes histograms in 9 directions. Finally, the feature value is normalized by Eq. (4) at each block (Fig.1)
Transcript of Human Detection by Boosting-Based Co-occurrence of HOG and Color

Human Detection by Boosting-Based Co-occurrence of HOG and Color Feature 47
Human Detection by Boosting-BasedCo-occurrence of HOG and Color Feature
Ryo Matsumura1 and Akitoshi Hanazawa2 , Non-members
ABSTRACT
In this paper, we propose a method for human de-tection using co-occurrence of Histograms of OrientedGradients (HOG) features and color features. Thismethod expresses the co-occurrence between HOGand color features by Adaboost and generates thecombination of the features effective for the identifi-cation automatically. Color features were calculatedby making histograms that quantized hue and satu-ration in local areas. We show the effectiveness ofthe proposed method by identification experimentsfor human and non-human images.
Keywords: Human detection, Histograms of Ori-ented Gradients, Color feature, Adaboost
1. INTRODUCTION
Technologies to detect humans in images are veryimportant image technologies because they can be ap-plied on various fields such as robot vision, surveil-lance system and Intelligent Transport System, etc.In recent methods for human detection, many meth-ods combine local features that represent humanappearances like Histograms of Oriented Gradients(HOG) [1] with Adaboost [2], a statistical learningmethod. Methods combining appearance and otherfeatures to improve accuracy has also been proposed,and effectiveness has been reported [3,4,5]. However,these methods [3,4] require consecutive images or abackground image.
Color features are effective for object detection andcan be extracted from a single image. Takayanagi etal. [5] showed that color features, e.g. skin colorof face, are automatically selected and effective forhuman identification by Adaboost. However, co-occurrence between the features was not consideredin this method. In this paper, we propose a methodfor human detection using co-occurrence of HOG fea-tures and color features by Adaboost. Because thisstudy is the first step to examine the efficacy of the co-occurrence of HOG and color features, we employedAdaboost due to its simpleness. This method cangenerate the combination of the features effective for
Manuscript received on February 28, 20111,2 The authors are with the Department of Brain Sci-
ence and Engineering, Graduate School of Life Science andSystems Engineering, Kyushu Institute of Technology 2-4 Hibikino, Wakamatsu, Kitakyushu, Fukuoka, 808-0916,Japan, E-mail: [email protected] [email protected]
identification automatically, and highly accurate de-tection can be expected. We show the effectiveness ofour method by identification experiments for humanand non-human images.
2. FEATURES
2.1 Histograms of Oriented Gradients
Histograms of Oriented Gradients (HOG) [1] is afeature vector made by histograms of gradient direc-tion of brightness in local areas called cell (Fig.1).HOG has a characteristic robust for local geometrychange and illumination change. The calculation pro-cedure of HOG is shown as follows.
Fig.1: Cell and block.
First, calculates gradient intensity m and gradientdirection θ by Eq. (1) and (2) from the brightnessvalue L of each pixel.
m(x, y) =√fx(x, y)2 + fy(x, y)2 (1)
θ(x, y) = tan−1 fy(x, y)
fx(x, y)(2)
{fx(x, y) = L(x+ 1, y)− L(x− 1, y)fy(x, y) = L(x, y + 1)− L(x, y − 1)
(3)
Next, the gradient direction histograms of bright-ness are made by using calculated gradient intensitym and gradient direction θ in the cell. The calcu-lated gradient direction θ is converted from 0 to 180degrees. The obtained gradient direction θ dividesinto 20 degrees and makes histograms in 9 directions.Finally, the feature value is normalized by Eq. (4) ateach block (Fig.1)
48 ECTI TRANSACTIONS ON COMPUTER AND INFORMATION TECHNOLOGY VOL.5, NO.2 NOVEMBER 2011
v′ =v√(∑k
i=0 v(i)2)+ ε
(4)
Here, v and v are the values of HOG and normal-ized HOG feature, k is the number of HOG features ina block, ε is the coefficient that a denominator pre-vents from being impossible of a calculation in thecase of 0.
2.2 Color Feature
The color feature is calculated in each cell as wellas HOG. The calculation procedure of the color fea-ture is shown as follows. First, hue and saturation arecalculated in a cell. Next, histograms of 9 bins aremade by using calculated hue and saturation (Fig.2).Finally, the feature value is normalized at each blockas well as HOG. HOG and color feature are inde-pendently calculated. Fig.2 shows an example of thefeature extraction of HOG and color feature.
Fig.2: Example of the feature extraction.
2.3 Joint Feature
In this method, the co-occurrence of the featureswere expressed in each weak classifier of Adaboost byobserving multiple features at a time [6]. To expressthe co-occurrence of the features, the sign of binarys that represent a human or non-human is calculatedby Eq. (5).
s(x) =
{1 if p · z(x) > p · θ0 otherwise
(5)
Here, x is a sample, and z is value of feature tobe obtained from the sample. θ is the threshold. pis a sign deciding the direction of inequality sign andtakes +1 or -1. As a result, joint features [6] thatexpresses the co-occurrence of features are obtainedby combining observed multiple sign of binary s.
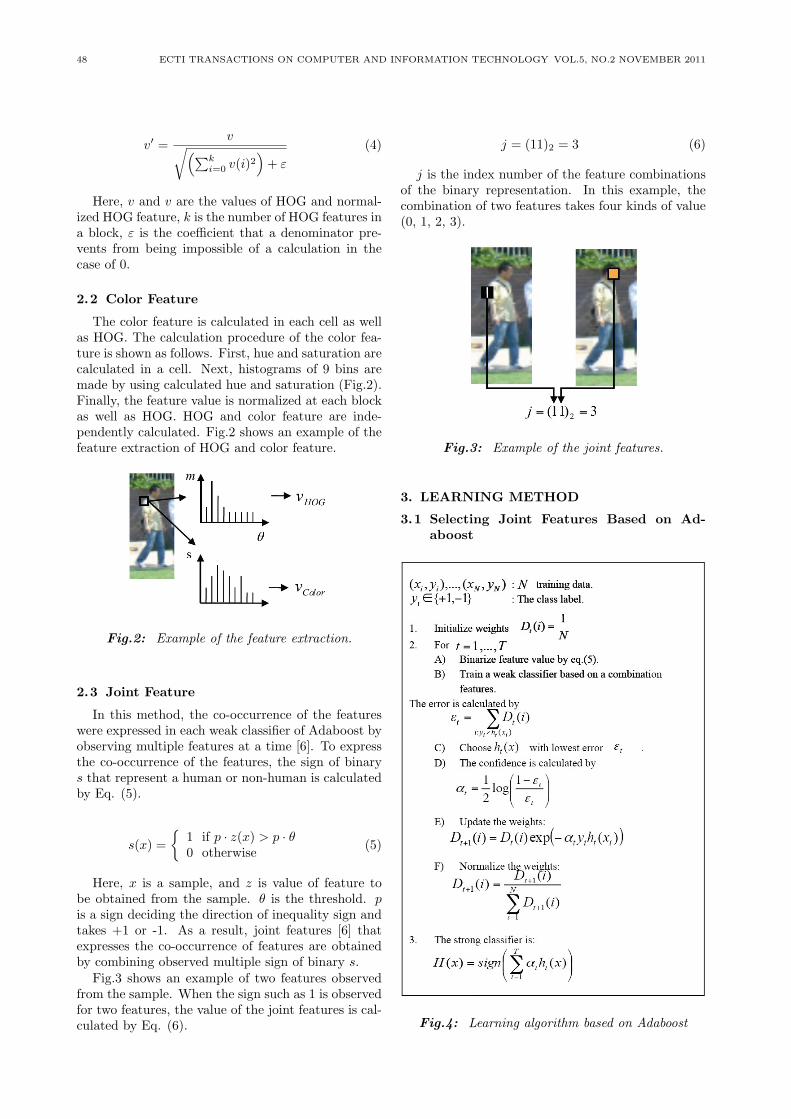
Fig.3 shows an example of two features observedfrom the sample. When the sign such as 1 is observedfor two features, the value of the joint features is cal-culated by Eq. (6).
j = (11)2 = 3 (6)
j is the index number of the feature combinationsof the binary representation. In this example, thecombination of two features takes four kinds of value(0, 1, 2, 3).
Fig.3: Example of the joint features.
3. LEARNING METHOD
3.1 Selecting Joint Features Based on Ad-aboost
Fig.4: Learning algorithm based on Adaboost

Human Detection by Boosting-Based Co-occurrence of HOG and Color Feature 49
Fig.4 shows the learning algorithm that selects ef-fective joint features for identification by Adaboost.is a number of training data, is training sample, isthe class label, and is a weight of training sample. In each boosting process, best suited joint featuresare selected by repeating steps from A) to F) in Fig.4.
The function that observes joint features fromsample is shown with . When feature value is ob-served from , weak classifier of Adaboost is shown byEq. (7).
ht(x) =
{+1 if Pt(y = +1|j) > Pt(y = −1|j)−1 otherwise
(7)
Pt(y = +1|j) and Pt(y = −1|j) are conditionalprobability which is human or non-human. Becausej is a value to express the co-occurrence of multiplefeatures, Pt(y = +1|j) and Pt(y = −1|j) are jointprobabilities of the combined features.
These are calculated based on the weight Dt(i) ofthe training sample by Eq. (8) and (9).
Pt(y = +1|j) =∑
p:Jt(xp)=j∧yi=+1
Dt(i) (8)
Pt(y = −1|j) =∑
p:Jt(xp)=j∧yi=−1
Dt(i) (9)
Fig.5 shows an example of the joint probabilitiesPt(y = +1|j) and Pt(y = −1|j) observed from twofeatures.
Fig.5: Example of the joint probabilities.
3.2 Searching for Combination of Feature
In this paper, we use Sequential Forward Selection(SFS) for the combination search of the feature. SFScan perform an effective search. The combinationsearch of the feature by SFS is shown as follows.
First, feature with the lowest identification error tothe training sample is selected. Next, adding anotherfeature to become the lowest identification error. Theabove is repeated in times of F . As a result, F fea-tures are efficiently combinable.
4. EXPERIMENTS
4.1 Experimental Summary
This chapter verifies the property and the effec-tiveness of proposed method by the following threeexperiments.
(1) Evaluate the differences in identification accu-racy by the number of combined features F .
(2) Evaluate the differences in identification accu-racy by the cell size of color feature.
(3) Comparison in performance of our method andHOG.
In all experiments, the total of the feature selectedby Adaboost is fixed at 300. Our method uses mul-tiple features in each weak classifier. Therefore thetotal of the features becomes T × F .
We use the Detection Error Tradeoff (DET) curve[7] for evaluation of identification performance. TheDET curve is plotted of false positive rate and missrate in double logarithmic graphs. That graph showsfalse positive rate in a horizontal axis and shows missrate in a vertical axis. The DET curve shows thatcloser to origin is good performance.
4.2 Training and Test Data
In this paper, we use NICTA Pedestrian Dataset[8] for both the training and test data. The trainingdata consist of 2,500 images of the positive class and6,500 images of the negative class. The test dataconsists of 1,000 images of the positive class and 1,000images of the negative class. Fig.6 shows the exampleof NICTA Pedestrian Dataset.
Fig.6: Example of NICTA Pedestrian Dataset
4.3 Experiment (1) : Effect of Number ofCombined Features
First, the difference in the identification perfor-mance by the number of features used for each weakclassifier is verified. This experiment compared theperformance of the two types of classifier shown inTab.1.
Fig.7 shows the identification result. Tab.2 showsthe performance at false positive 1%. Because DETcurve of Classifier B becomes closer to the origin, theidentification accuracy of Classifier B is higher. Thatis, the identification accuracy improves by increasing

50 ECTI TRANSACTIONS ON COMPUTER AND INFORMATION TECHNOLOGY VOL.5, NO.2 NOVEMBER 2011
number of combined features F . However, there is apossibility of over fitting the training data when F isincreased.
Table 1: Experiment (1) parameter.
Classifier A Classifier BHOG cell size (pixels) 6× 6 6× 6
Color feature cell size (pixels) 6× 6 6× 6Block size (cells) 3× 3 3× 3
# of combined features F 2 3# of weak classifier T 150 100
# of features 300 300
Fig.7: DET curve of experiment (1).
Table 2: Performance at false positive 1% for ex-periment (1).
Classifier A Classifier BMiss rate [%] 17.9 15.9
Identification rate [%] 90.5 91.5
4.4 Experiment (2) : Effect of Cell Size ofColor Feature
Next, the difference in the identification perfor-mance by the cell size of color feature is verified. Thisexperiment compared the performance of Classifier Bshown in Tab.1 and three types of classifier shown inTab.3.
Fig.8 shows the identification result. Tab.4 showsthe performance at false positive 1%. We expectedcolor feature effective for human identification can beextracted by changing the cell size of the color featureand subdividing the cell area.
However, from the result, we can see that doesn’tcontribute to improvement of identification accuracyeven if the cell size of color feature is changed. Thereason for this result is that Classifier C, D and E areover fitting the training data. Classifier B is the bestperformance in this experiment.
Table 3: Experiment (2) parameter.
Classifier Classifier ClassifierC D E
HOG cell size (pixels) 6× 6 6× 6 6× 6Color feature cell size
3× 3 4× 4 5× 5(pixels)
Block size (cells) 3× 3 3× 3 3× 3# of combined features F 3 3 3# of weak classifier T 100 100 100
# of features 300 300 300
Fig.8: DET curve of experiment (2).
Table 4: Performance at false positive 1% for ex-periment (2).
Classifier Classifier ClassifierC D E
Miss rate [%] 19.6 17.4 26.8Identification rate
89.7 90.8 86.1[%]
4.5 Experiment (3) : Comparison with HOG
Finally, the identification performances of ourmethod and HOG are compared. Classifier B shownin Tab.1 is used for the comparison in this experi-ment. The parameter of the classifier using HOG isshown in Tab.5.
Table 5: Experiment (3) parameter.
cell size (pixels) 6× 6Block size (cells) 3× 3
# of weak classifier T 300# of features 300
Table 6: Performance at false positive 1% for ex-periment (3).
HOG Our methodMiss rate [%] 23.4 15.9
Identification rate [%] 87.7 91.5
Fig.9 shows the identification result. Tab.6 shows

Human Detection by Boosting-Based Co-occurrence of HOG and Color Feature 51
Fig.9: DET curve of experiment (3).
the performance at false positive 1%. Because theDET curve of Classifier B is closer to the origin, theidentification accuracy of our method is higher thanHOG. When false positive is 1%, miss rate of ourmethod is 15.9% where as miss rate of HOG is 23.4%.Our method is improved the identification accuracyby 3.8%. When false positive is 4.8%, our methodrecorded the best identification rate, that is, 95.9%.Because effective feature for identification can be ex-tracted by combine HOG with the color features, ourmethod can identify difficult patterns for the identi-fication by HOG only.
5. CONCLUSION
In this paper, we proposed a method for human de-tection using co-occurrence of Histograms of OrientedGradients (HOG) features and color features. The ac-curacy of human detection was improved by express-ing the co-occurrence of these features. We have notanalyzed what features are selected and combined byAdaboost. We are going to analyze it to improve theperformance of our algorithm. Further, by extendingthe learning algorithm to Real Adaboost may improvethe identification accuracy.
References
[1] N. Dalal and B. Triggs, “Histograms of orientedgradients for human detection, IEEE ComputerVision and Pattern Recognition, vol.1, pp.886-893, 2005.
[2] Y. Freund and R.E. Schapire, “A decision-theoretic generalization of on-line learning andan application to boosting, Journal of Computerand System Sciences, vol.55, pp.119-139, 1997.
[3] P. Viola, M. Jones and D. Snow, “Detectingpedestrians using patterns of motion and appear-ance, IEEE International Conference on Com-puter Vision, pp.734-741, 2003.
[4] Y. Yamauchi, H. Fujiyoshi, H. Hwang, B.-W.and T. Kanade, “People detection based on co-occurrence of appearance and spatiotemporal
features, IEEE International Conference on Pat-tern Recognition, 2008.
[5] Y. Takayanagi and J. Katto, “Human body de-tection using HOG with additional color fea-tures, International Workshop on Advanced Im-age Technology, 2010.
[6] T. Mita, T. Kaneko, and O. Hori, “Joint haar-like features for face detection, IEEE Interna-tional Conference on Computer Vision, 2005.
[7] A. Martin, G. Doddington, T. Kamm, M. Or-dowski and M. Przydocki, “The DET curve inassessment of detection task performance, Euro-pean Conference on Speech Communication andTechnology, pp.1895-1898, 1997.
[8] NICTA Pedestrian Dataset, URL: http://nicta.com.au/research/project list/completed projects/smart cars/computer vision datasets/
Ryo Matsumura received M.S. degreefrom Kyushu Institute of Technology,Japan, in 2011.
Akitoshi Hanazwa received B.S., M.S.and Ph.D digree from Kyoto University,Japan, in 1990, 1992 and 1995, respec-tively. From 1995 to 2002, he was anAssistant Professor of National Instituteof Physiological Sciences. Since 2002,he has been an Associate Professor ofKyushu Institute Technology. His re-search interests includes Visual Neuro-science, Psychophysics and Image Pro-cessing.