Human COA3 Is an Oligomeric Highly Flexible Protein in...
12
Human COA3 Is an Oligomeric Highly Flexible Protein in Solution Jose ́ L. Neira,* ,†,‡ Sergio Martínez-Rodríguez, †,∇ Jose ́ G. Herna ́ ndez-Cifre, § Ana Ca ́ mara-Artigas, ∥ Paula Clemente, ⊥,#,○ Susana Peralta, ⊥,#,● Miguel A ́ ngel Ferna ́ ndez-Moreno, ⊥,# Rafael Garesse, ⊥,# Jose ́ García de la Torre, § and Bruno Rizzuti* ,@ † Instituto de Biología Molecular y Celular, Universidad Miguel Herna ́ ndez, Elche, Alicante, Spain ‡ Biocomputation and Complex Systems Physics Institute, Zaragoza, Spain § Department of Physical Chemistry, University of Murcia, Murcia, Spain ∥ Department of Chemistry and Physics, University of Almería, Agrifood Campus of International Excellence (ceiA3), Almería, Spain ⊥ Departamento de Bioquímica-Instituto de Investigaciones Biome ́ dicas “Alberto Sols”, Universidad Autó noma de Madrid-Consejo Superior de Investigaciones Científicas and Centro de Investigació n Biome ́ dica en Red de Enfermedades Raras (CIBERER), Madrid, Spain # Instituto de Investigació n Sanitaria, Hospital 12 de Octubre (i+12), Madrid, Spain @ CNR-NANOTEC, Licryl-UOS Cosenza and CEMIF.Cal, Department of Physics, University of Calabria, 87036 Rende, Italy * S Supporting Information ABSTRACT: The assembly of the protein complex of cytochrome c oxidase (COX), which participates in the mitochondrial respiratory chain, requires a large number of accessory proteins (the so-called assembly factors). Human COX assembly factor 3 (hCOA3), also known as MITRAC12 or coiled-coil domain-containing protein 56 (CCDC56), interacts with the first subunit protein of COX to form its catalytic core and promotes its assemblage with the other units. Therefore, hCOA3 is involved in COX biogenesis in humans and can be exploited as a drug target in patients with mitochondrial dysfunctions. However, to be considered a molecular target, its structure and conformational stability must first be elucidated. We have embarked on the description of such features by using spectroscopic and hydrodynamic techniques, in aqueous solution and in the presence of detergents, together with computational methods. Our results show that hCOA3 is an oligomeric protein, forming aggregates of different molecular masses in aqueous solution. Moreover, on the basis of fluorescence and circular dichroism results, the protein has (i) its unique tryptophan partially shielded from solvent and (ii) a relatively high percentage of secondary structure. However, this structure is highly flexible and does not involve hydrogen bonding. Experiments in the presence of detergents suggest a slightly higher content of nonrigid helical structure. Theoretical results, based on studies of the primary structure of the protein, further support the idea that hCOA3 is a disordered protein. We suggest that the flexibility of hCOA3 is crucial for its interaction with other proteins to favor mitochondrial protein translocation and assembly of proteins involved in the respiratory chain. M itochondria are the “powerhouses” of cells, generating the bulk of cellular ATP. Cellular respiration occurs within them, involving oxygen consumption and ATP release. This process is known as the “electron transport chain” and involves five protein complexes: four enzymatic respiratory ones and the ATP synthase. Electrons delivered from NADH and succinate go through the electron transport chain to O 2 , which is finally reduced to H 2 O. The cytochrome c oxidase (COX) or complex IV, the fourth enzyme of the electron transport chain, catalyzes the oxidation of cytochrome c, transferring its electrons to O 2 . The mammalian complex IV is formed by 13 protein subunits: three of them (COX1 to Received: June 24, 2016 Revised: October 26, 2016 Published: October 28, 2016 Article pubs.acs.org/biochemistry © 2016 American Chemical Society 6209 DOI: 10.1021/acs.biochem.6b00644 Biochemistry 2016, 55, 6209−6220
Transcript of Human COA3 Is an Oligomeric Highly Flexible Protein in...

Human COA3 Is an Oligomeric Highly Flexible Protein in SolutionJose L. Neira,*,†,‡ Sergio Martínez-Rodríguez,†,∇ Jose G. Hernandez-Cifre,§ Ana Camara-Artigas,∥Paula Clemente,⊥,#,○ Susana Peralta,⊥,#,● Miguel Angel Fernandez-Moreno,⊥,# Rafael Garesse,⊥,#
Jose García de la Torre,§ and Bruno Rizzuti*,@
†Instituto de Biología Molecular y Celular, Universidad Miguel Hernandez, Elche, Alicante, Spain‡Biocomputation and Complex Systems Physics Institute, Zaragoza, Spain§Department of Physical Chemistry, University of Murcia, Murcia, Spain∥Department of Chemistry and Physics, University of Almería, Agrifood Campus of International Excellence (ceiA3), Almería, Spain⊥Departamento de Bioquímica-Instituto de Investigaciones Biomedicas “Alberto Sols”, Universidad Autonoma de Madrid-ConsejoSuperior de Investigaciones Científicas and Centro de Investigacion Biomedica en Red de Enfermedades Raras (CIBERER), Madrid,Spain#Instituto de Investigacion Sanitaria, Hospital 12 de Octubre (i+12), Madrid, Spain@CNR-NANOTEC, Licryl-UOS Cosenza and CEMIF.Cal, Department of Physics, University of Calabria, 87036 Rende, Italy
*S Supporting Information
ABSTRACT: The assembly of the protein complex of cytochrome c oxidase (COX), which participates in the mitochondrialrespiratory chain, requires a large number of accessory proteins (the so-called assembly factors). Human COX assembly factor 3(hCOA3), also known as MITRAC12 or coiled-coil domain-containing protein 56 (CCDC56), interacts with the first subunitprotein of COX to form its catalytic core and promotes its assemblage with the other units. Therefore, hCOA3 is involved inCOX biogenesis in humans and can be exploited as a drug target in patients with mitochondrial dysfunctions. However, to beconsidered a molecular target, its structure and conformational stability must first be elucidated. We have embarked on thedescription of such features by using spectroscopic and hydrodynamic techniques, in aqueous solution and in the presence ofdetergents, together with computational methods. Our results show that hCOA3 is an oligomeric protein, forming aggregates ofdifferent molecular masses in aqueous solution. Moreover, on the basis of fluorescence and circular dichroism results, the proteinhas (i) its unique tryptophan partially shielded from solvent and (ii) a relatively high percentage of secondary structure. However,this structure is highly flexible and does not involve hydrogen bonding. Experiments in the presence of detergents suggest aslightly higher content of nonrigid helical structure. Theoretical results, based on studies of the primary structure of the protein,further support the idea that hCOA3 is a disordered protein. We suggest that the flexibility of hCOA3 is crucial for its interactionwith other proteins to favor mitochondrial protein translocation and assembly of proteins involved in the respiratory chain.
Mitochondria are the “powerhouses” of cells, generatingthe bulk of cellular ATP. Cellular respiration occurs
within them, involving oxygen consumption and ATP release.This process is known as the “electron transport chain” andinvolves five protein complexes: four enzymatic respiratoryones and the ATP synthase. Electrons delivered from NADHand succinate go through the electron transport chain to O2,which is finally reduced to H2O. The cytochrome c oxidase
(COX) or complex IV, the fourth enzyme of the electrontransport chain, catalyzes the oxidation of cytochrome c,transferring its electrons to O2. The mammalian complex IV isformed by 13 protein subunits: three of them (COX1 to
Received: June 24, 2016Revised: October 26, 2016Published: October 28, 2016
Article
pubs.acs.org/biochemistry
© 2016 American Chemical Society 6209 DOI: 10.1021/acs.biochem.6b00644Biochemistry 2016, 55, 6209−6220

COX3) are encoded by the mitochondrial DNA and form thecore of the protein complex, whereas the remaining 10 areencoded in the nuclear genome.1,2
COX assembly occurs in a complex linear fashion,3−5 withseveral cofactors necessary in some proteins (required forelectron transport) and different subunits being incorporated inorder by the help of the so-called assembly factors. Theseproteins are required at every step of complex formation, fromtranslation of the individual subunits of COX to assembly of theholoenzyme to addition of the prosthetic groups present in afew of the protein subunits.4,5 The biogenesis of COX must betightly modulated to prevent the accumulation of pro-oxidantassembly intermediates; for instance, there is a negativefeedback regulatory system in Saccharomyces cerevisae, whichregulates the translation of COX1 in membrane-boundribosomes and the accumulation of complex IV assemblyintermediates.5,6 COX biogenesis is important because defectsin enzyme assembly are a cause of mitochondrial disorders inhumans.7−9 In fact, mitochondrial disorders are thought to bethe result of dysfunction of the respiratory chain:10 most of theCOX deficiencies in patients affected by mitochondrialdisorders are caused by mutations in COX assembly factors.11
Human COX assembly factor 3 (hCOA3), also known asMITRAC12 or coiled-coil domain-containing protein 56(CCDC56), is a 106-residue (11.7 kDa) polypeptide that isessential for the formation of the catalytic core of COX. Weand other laboratories have recently shown that hCOA3 and its87-residue variant in Drosophila melanogaster are mitochondrialtransmembrane proteins essential for COX biogenesis in eitherspecies;12−14 in fact, hCOA3 is an inner mitochondrialmembrane protein.14 The sequence of the human proteinalso is highly similar with that of yeast COX assembly factor3.11,12,15 From a functional point of view, hCOA3 interacts withboth proteins involved in the early steps of the biogenesis ofcomplex IV and the translocation machinery located at theinner membrane of the mitochondria;14 in fact, the lack ofhCOA3 leads to defective complex IV.12 Therefore, hCOA3could be considered a new pharmaceutical target, and itsstructure and conformational stability first must be known indepth to design appropriate and specific drugs.The primary structure of hCOA3 does not include any
disulfide bridge or free cysteine residues and encompasses aunique tryptophan and three tyrosines as intrinsicallyfluorescent residues.12 The high abundance of charged aminoacids in the sequence of hCOA3 (27%, including 13 Asp/Gluacidic residues and 16 Lys/Arg basic ones) suggests that it maypossess large unstructured regions. In this respect, we suspectedthat hCOA3 may behave as an intrinsically disordered protein(IDP); that is, it might belong to a class of proteins lackingstable secondary or tertiary structures.16,17 IDPs exist as anensemble of rapidly interconverting structures, which fold intoa well-defined three-dimensional structure only in the presenceof their binding partners or their specific ligands,17 in somecases. Because of their high flexibility, IDPs may act as hubs ininteraction networks performing several functions in thecell,16,17 and they have been recognized as potential drugtargets.18
In this work, we have used several biophysical methods,namely, fluorescence and circular dichroism (CD) spectros-copies, together with analytical ultracentrifugation (AUC) anddynamic light scattering (DLS) as hydrodynamic techniques, todescribe the stability and structure of hCOA3 in aqueoussolution. We have also performed experiments in the presence
of several types of detergents. We found that the protein isoligomeric in aqueous solution, as shown by both hydro-dynamic techniques. Far-UV CD spectroscopy also suggestsoligomeric species in the presence of detergents. Thermal andchemical denaturations suggest that the presence of secondarystructure in aqueous solution, as monitored by far-UV CD andfluorescence quenching, is labile and nonrigid. In the presenceof detergents, there is a slight increase in helical content, butthis structure is not rigid. Combined with an in silico analysis,our experimental results suggest that hCOA3 is a disorderedprotein, with some regions populating different types ofsecondary structure or, alternatively, forming hydrophobicclusters.
■ EXPERIMENTAL PROCEDURESMaterials. Ultrapure urea was from ICN Biomedicals Inc.
Concentrations of urea were calculated from the refractiveindex of the corresponding solution.19 Trizma acid and base,DNase I from bovine pancreas, chloramphenicol, tetracycline,NaCl, nickel resin, polyethylenimine (PEI), 3-[(3-cholamidopropyl)dimethylammonio]-1-propanesulfonate(CHAPS), sodium dodecyl sulfate (SDS), Nonidet P-40 (NP-40), and 8-anilinonaphthalene-1-sulfonic acid (ANS) were fromSigma-Aldrich. Isopropyl β-D-thiogalactopyranoside (IPTG)and ampicillin were from Apollo. The β-ME was from Bio-Rad. Triton X-100 was from Calbiochem. Standard supplierswere used for all other chemicals. Water was deionized andpurified on a Millipore system.
Cloning of hCOA3. Primers Ccdc56_5 (CATATGGCG-TCTTCGGGAGCTGGTGAC) and Ccdc56_3 (CTCGAGG-GACCCTGACGCCCTTGCCAGAGC), including NdeI andXhoI restriction sites, were used for polymerase chain reaction(PCR) amplification using a pRSET-B vector containinghCOA3.12 The PCR fragment obtained was purified from anagarose gel using QIAquick (Qiagen) and subcloned using aStrataClone PCR cloning kit (Stratagene). The isolatedsubcloning plasmid was purified using the QIAprep Spinminiprep kit (Qiagen) and then digested using NdeI and XhoI(Fermentas). The digested fragment was purified from anagarose gel using QIAquick (Qiagen) and then ligated into thepET22b+ plasmid (Novagen) cut with the same enzymes tocreate plasmid pET22b_CCDC56. Once the fragment hadbeen cloned, it was sequenced using the dye dideoxynucleotidesequencing method in an ABI 377 DNA sequencer (AppliedBiosystems). This construction allows the expression ofhCOA3 fused to a C-terminal His6 tag in BL21 (DE3) RILC+ cells (Agilent). We also tried Escherichia coli strains BL21(DE3) and BL21 (DE3) pLys (Novagen), C41 (DE3) and C43(DE3) (Lucigen), and BL21 (DE3) Star (Invitrogen, LifeTechnologies); however, none of them yielded a visibleexpression of hCOA3 in denaturing SDS gels, after staining.hCOA3 was obtained by growing chemically transformed
BL21 (DE3) RIL C+ cells in 250 mL flasks containingampicillin (100 μg/mL), chloramphenicol (50 μg/mL), andtetracycline (100 μg/mL). The flasks were left overnight at 37°C. The next morning 1 L flasks, with the correspondingamounts of antibiotics, were inoculated with the culture thathad been grown overnight. The cells cultured in the 1 L flaskswere grown at 37 °C. When the absorbance at 600 nm reached0.6−0.8 units, protein expression was induced by addition ofIPTG at a final concentration of 700 μM, and the temperaturewas decreased to 15 °C. The cells in the 1 L flasks were grownovernight.
Biochemistry Article
DOI: 10.1021/acs.biochem.6b00644Biochemistry 2016, 55, 6209−6220
6210

Cell pellets were resuspended in 50 mL of buffer A [20 mMTris (pH 8.0), 0.5 M NaCl, 1 mM β-ME, 0.1% Triton X-100, 5mM imidazole, 10 μg/mL DNase I, and 20 mM MgSO4]supplemented with a tablet of Sigma Protease Cocktail EDTA-free. After being incubated with gentle agitation at 4 °C for 10min, cells were disrupted by sonication (Branson, 750 W), with10 cycles of 45 s at 55% of maximal power output and aninterval of 15 s between the cycles. All the sonication steps andthe interval waits were carried out in ice. The lysates wereclarified by centrifugation at 24000 rpm for 40 min at 4 °C in aBeckman JSI30 centrifuge.The clarified lysate from this first centrifugation did not
contain hCOA3, which was present in the precipitate. Thus, theprecipitate was treated with buffer A supplemented with 8 Murea. The resuspended sample was treated with another 10cycles of sonication in ice, and the sample was clarified bycentrifugation at 20000 rpm for 30 min at 4 °C. The hCOA3was in the supernatant and was purified by immobilized affinitychromatography (IMAC). The supernatant was added to 5 mLof His-Select HF nickel affinity gel (Sigma-Aldrich) previouslyequilibrated in buffer A supplemented with 8 M urea. Themixture was incubated for 20 min at 4 °C, and after that time,the lysate was separated from the resin by gravity. On-columnrefolding was carried out during column wash with 20 mL ofbuffer B [20 mM Tris (pH 8.0), 0.5 M NaCl, 1 mM β-ME, and20 mM imidazole]; the protein was then eluted by gravity fromthe column with buffer C [20 mM Tris (pH 8.0), 0.5 M NaCl,1 mM β-ME, and 500 mM imidazole]. The eluted hCOA3 wasextensively dialyzed against buffer C, in the absence ofimidazole and β-ME. The final yield of protein was 1.5−2.5mg/L of culture, and the protein was 85−90% pure as judgedby SDS gels.We attempted to repurify the protein recovered from IMAC
by using gel filtration chromatography in a Superdex 16/600,75 pg column performed in an AKTA Basic system (GEHealthcare) by monitoring the absorbance at 280 nm;nevertheless, the protein was bound to the column, eluting atvolumes larger than the bed volume (∼125 mL). Furtherattempts with a Heparin column [5 mL HiTrap Heparincolumn (GE Healthcare)] were also unsuccessful, leading toprotein precipitation during dialysis. The eluted protein fromIMAC showed absorbance at 260 nm, suggesting that hCOA3was probably contaminated with traces of DNA, even thoughDNase was used during purification. We believe that thiscontamination was due to electrostatic interactions between thehighly charged hCOA3 (theoretical pI of 9.22) and the nucleicacid. The total protein concentration, Pc (in milligrams permilliliter) was determined by using the expression20 Pc =1.55A280 − 0.76A260, where A280 and A260 are the absorbances ofthe dialyzed protein solution at 280 and 260 nm, respectively.However, it is important to note that the presence of DNAtraces did not affect the spectroscopic signals in the far-UVregion or fluorescence, because DNA is spectroscopically silentin these techniques.21,22 We also tried to eliminate the DNAtraces by using different concentrations of PEI [ranging from0.2 to 1% (v/v)],23 but most of the hCOA3 coprecipitated withDNA. After PEI precipitation, the supernatant was concen-trated by using Amicon centrifugal devices (molecular weightcutoff of 3500 Da, Millipore), and fluorescence and far-UV CDspectra were acquired with the concentrated protein stocksolution. Both types of spectra were similar to those acquired inthe absence of PEI (i.e., in the presence of small amounts ofDNA); therefore, these findings indicate that such DNA traces
did not affect the spectroscopic properties of the protein, asexpected.21,22
Fluorescence. Spectra were recorded at 25 °C on a CaryVarian spectrofluorimeter (Agilent), by using a Peltier temper-ature controller. A 1 cm path length quartz cell (Hellma) wasused. The final buffer concentrations were 10 mM in all cases.Excitation was carried out at 280 and 295 nm. Excitation andemission slits were 5 nm. Emission was measured from 300 to400 nm, unless stated otherwise. The experiments wereprepared the day before and left overnight at 5 °C for sampleequilibration.Experiments at concentrations ranging from 2.6 to 13.2 μM
(in protomer units) showed no changes in the maximalwavelength, but there were small changes in the normalizedintensity. These results suggest the presence of concentration-dependent equilibria.
Intrinsic Fluorescence. Urea denaturations at pH 7.0(phosphate buffer), followed by either fluorescence or CD,were carried out by dilution of the proper amount of an 8 Murea stock solution. Urea denaturations were reversible.Appropriate blank corrections were made in all spectra. Proteinconcentrations used were 2 and 3 μM (in protomer units);both urea denaturations did show the same pattern (seeResults).The pH of the samples was measured after completion of
experiments with an ultrathin Aldrich electrode in a Radiometer(Copenhagen, Denmark) pH-meter. Salts and acids used (frompH 2.0 to 12.0) have been described previously.24 For the pHexperiments, the protein concentration was 10 μM (inprotomer units).Experiments in the presence of detergents (CHAPS, NP-40,
SDS, and Triton X-100) were carried out with the sameexperimental set described above, except that the proteinconcentration was 2.6 μM (in protomer units) and thedetergent concentrations used were either below or abovetheir respective critical micelle concentrations (CMCs). ForSDS, we assumed that the CMC was 8 mM;25,26 for CHAPS,the CMC was assumed to be 6 mM.27,28 Triton X-100 and NP-40 were not used in the fluorescence experiments because ofthe strong fluorescence emission shown. Experiments werecarried out at pH 8.0 (20 mM Tris) with 500 mM NaCl at 25°C.Control experiments with 2.6 and 13.2 μM protein (in
protomer units) in CHAPS (at 8 mM) and SDS (at 10 mM)were also carried out to determine whether different proteinconcentrations affected the shape and the intensity of thespectra (after normalization). The spectra had the samemaximal wavelengths at the two concentrations, but thenormalized intensity slightly changed. Furthermore, as theshape of both spectra and the maximal wavelengths were thesame as those of the experiments performed in aqueoussolution, we suggest that the presence of the detergent did notalter the oligomerization state of the protein (see Results).
Thermal Denaturations. Experiments were performed atheating rates of 60 °C/h, from 25 to 90 °C, with an averagetime (sampling time) of 1 s. Thermal scans were collected at315, 330, and 350 nm after excitation at 280 and 295 nm.Thermal denaturations were reversible.Thermal experiments in the presence of both concentrations
of detergents (either above or below their CMCs) wereperformed with the same experimental set and at the sameprotein concentration (2.6 μM in protomer units). Thermaldenaturations were reversible.
Biochemistry Article
DOI: 10.1021/acs.biochem.6b00644Biochemistry 2016, 55, 6209−6220
6211

Fluorescence Quenching. Quenching of tryptophan andtyrosines with either iodide or acrylamide was examined underdifferent solution conditions. The ionic strength was keptconstant during KI quenching by addition of KCl; also,Na2S2O3 was added (concentration of 0.1 M) to prevent theformation of I3
−. The presence of KCl did not alter the hCOA3structure as suggested by the absence of changes in the shapeand ellipticity of the CD spectra in the presence of 0 and 1 MKCl (data not shown). For quenching with KI, the data werefitted to the equation29 F0/F = 1 + Ksv[X], where Ksv is theStern−Volmer constant for collisional quenching, F0 is thefluorescence when KI is not present, and F is that at any KIconcentration. The range of KI concentrations explored was 0−0.7 M. We measured the quenching of fluorescent residues atpH 4.0, 7.0, and 10.0. Experiments were also carried out in thepresence of 5 M urea at pH 7.0.For acrylamide, the experimental spectroscopic parameters
were the same as in KI. However, the Stern−Volmer equationwas modified to include an exponential term to account fordynamic quenching:29 F0/F = (1 + Ksv[X])e
ν[X], where ν is thedynamic quenching constant (component). This equation isidentical to the one given above, when ν = 0.ANS Binding. The excitation wavelength was 380 nm, and
emission fluorescence was measured from 400 to 600 nmduring the pH denaturation. ANS stock solutions wereprepared in water and diluted to yield a final concentrationof 100 μM. Signals from blank solutions were subtracted fromthe corresponding spectra.Circular Dichroism. CD spectra were recorded on a Jasco
J815 (Japan) or Jasco J810 spectropolarimeter fitted with athermostated cell holder and interfaced with a Peltier unit. Theinstrument was periodically calibrated with (+)-10-camphor-sulfonic acid. The molar ellipticity was calculated as describedpreviously.24 Protein concentrations were 10 μM (in protomerunits) in a 0.1 cm path length cell for pH experiments and 8μM (in protomer units) for chemical denaturations.Far-UV Spectra. Isothermal wavelength spectra of hCOA3 at
different pH values or urea concentrations were acquired at ascan speed of 50 nm/min with a response time of 4 s andaveraged over six scans at 25 °C, with 10 mM buffer. Spectrawere corrected by subtracting the baseline in all cases. Thechemical and pH denaturations were repeated at least twicewith different samples. The samples were prepared the daybefore and left overnight at 5 °C to allow for equilibration.For steady-state experiments in the presence of detergents,
two protein concentrations were explored: 9.9 and 20 μM (inprotomer units). Experiments were carried out at pH 8.0 (20mM Tris) with 500 mM NaCl at 25 °C. The concentrationsused for the detergents were 4 and 10 mM for SDS, 2 and 8mM for CHAPS, 0.1 and 0.5 mM for NP-40, and 0.1 and 1 mMfor Triton X-100.Control experiments with 10 and 16.2 μM protein (in
protomer units) in CHAPS (at 8 mM) and SDS (at 10 mM)were also carried out to determine whether different proteinconcentrations affected the shape and/or intensity of thespectra after normalization. The spectra had the same shape,but the normalized intensity slightly changed, suggesting thepresence of self-association equilibria even in the presence ofdetergents.Thermal Denaturations. The experiments were performed
at heating rates of 60 °C/h and a response time of 8 s. Thermalscans were collected following the ellipticity at 222 nm from 25to 80 °C. Solution conditions were the same as those in the
steady-state experiments. No drifting of the spectropolarimeterwas observed. Thermal denaturations were reversible.For experiments in the presence of detergents, 9.9 μM
protein (in protomer units) was used. The employed detergentconcentrations were the lowest among those indicated above.Thermal denaturations were always reversible.
Analytical Ultracentrifugation. Experiments were con-ducted as described previously.30,31 Briefly, they wereperformed in a Beckman Coulter Optima XL-I analyticalultracentrifuge (Beckman-Coulter, Palo Alto, CA) equippedwith UV−visible absorbance as well as interference opticsdetection systems, using an An50Ti eight-hole rotor and 12mm path length charcoal-filled Epon double-sector center-pieces. The experiments were performed at 20 °C in 50 mMTris (pH 7.9), with 20 μM protein (in protomer units). Thelaser delay was adjusted prior to the runs to obtain high-qualityinterference fringes. Light at 675 nm was used in theinterference optics mode. Sedimentation velocity runs werecarried out at a rotor speed of 40000 rpm using 400 μLsamples. A series of 900 scans, without time intervals, wereacquired for each sample. A least-squares boundary modeling ofthe sedimentation velocity data was used to calculatesedimentation coefficient distributions with the size distributionc(s) method,32 implemented in SEDFIT version 13.0b. Thesedimentation coefficient in water, s20,w, solvent density (ρ =1.0089 g/mL), and viscosity (η0 = 1.002 cP) at 20 °C wereestimated using SEDNTERP.33 The partial specific volume ofthe protein, V, was 0.7298 mL/g.
Dynamic Light Scattering. Experiments were performedwith a Zetasizer Nano ZS instrument (Malvern InstrumentsLtd., Worcestershire, U.K., 4 mV He−Ne laser, λ0 = 633 nm,and Θ = 173°) using a thermostated 12 μL quartz samplecuvette at 20 °C, as described previously.30 Briefly, proteinsamples were prepared in 50 mM Hepes buffer (pH 7.0). Thesample concentration was 20 μM (in protomer units). All thesolutions were filtered immediately before measurement, andprotein samples were centrifuged for 30 min at 14000 rpm toremove any aggregates and dust. Data were analyzed using themanufacturer’s software: the hydrodynamic radius, Rs, andmolecular mass, M, were determined from the Stokes−Einsteinequation, assuming a spherical shape for the protein.
Analysis of the pH Denaturation Curves. The pHdenaturation curves were analyzed assuming that bothprotonated and deprotonated species contributed to themonitored spectral feature. The physical property, X, beingobserved, either ellipticity or fluorescence intensity, dependsupon pH according to
=++
−
−XX X 10
1 10
n K
n Ka b
(pH p )
(pH p )
a
a (1)
where Xa is the value observed for the acidic species, Xb is thatat high pH, pKa is the apparent midpoint of the titrating group,and n is the Hill coefficient,34 which was in the range of 0.9−1.1in all the curves. The apparent pKa reported from intrinsic orANS fluorescence and CD was obtained from three differentmeasurements for each technique, performed on differentsamples.Fitting by nonlinear least-squares analysis to eq 1 was
performed by using Kaleidagraph (Abelbeck software) workingon a personal computer.
Biochemistry Article
DOI: 10.1021/acs.biochem.6b00644Biochemistry 2016, 55, 6209−6220
6212

■ RESULTSSequence Analysis Indicates That hCOA3 Contains
Intrinsically Disordered Regions. Our initial studies of theprimary structure of hCOA3 suggest that the protein has asingle transmembrane domain (from residue 58 to 78) and acoiled-coil domain (from residue 79 to 104).12 The overallamino acid composition identifies hCOA3 as a folded proteinin a charge−hydropathy plot.35,36 On the other hand, as shownin Figure 1A, both charged and hydrophobic residues are
unevenly distributed along the protein sequence, with thetransmembrane domain lacking the former. In fact, bothregions preceding and following the transmembrane domainare separately classified as natively unfolded in the samecharge−hydropathy plot.36 In addition, hCOA3 contains a largeamount of Ala residues (14.2%, approximately twice thefrequency found for proteins37), which typically tend toincrease the RS and to modulate the backbone sensitivity tolocal structural perturbations in proteins.38 These resultssuggest that hCOA3 could behave as an IDP under a rangeof conditions, showing a high flexibility with a low degree oforder in large regions of its structure.To test this hypothesis, we submitted the protein sequence
to different disorder prediction servers. As shown in Figure 1B,all of them (RONN, DISOclust, IUPred, and PrDOS)suggest39−42 that only the region from residue 50 to 80
(including the transmembrane domain) is ordered, whereas theN-terminal and C-terminal regions are predicted to bedisordered. The use of Fold-Index43 suggests that only thefirst 40 residues were disordered, while the rest of the protein(the transmembrane domain and the coiled-coil regions) isordered. Furthermore, s2D44 yielded high percentages of helicalstructure for the regions of residues 30−50 and 80−95 (whichis the predicted coiled-coil region12), and the rest of thesequence appeared to be disordered.
hCOA3 Is an Oligomeric Protein in Aqueous Solution.We tried to characterize the self-association state of hCOA3with four hydrodynamic techniques. Nuclear magneticresonance diffusion ordered spectroscopy did not yield reliableresults, because the observed peaks were very broad (data notshown). Likewise, we could not carry out size exclusionchromatography experiments because, as discovered during thepurification protocol (see Experimental Procedures), hCOA3was bound to the gel filtration column. Therefore, we carriedout hydrodynamic experiments with only AUC and DLStechniques.In the AUC measurements in the interference mode, we
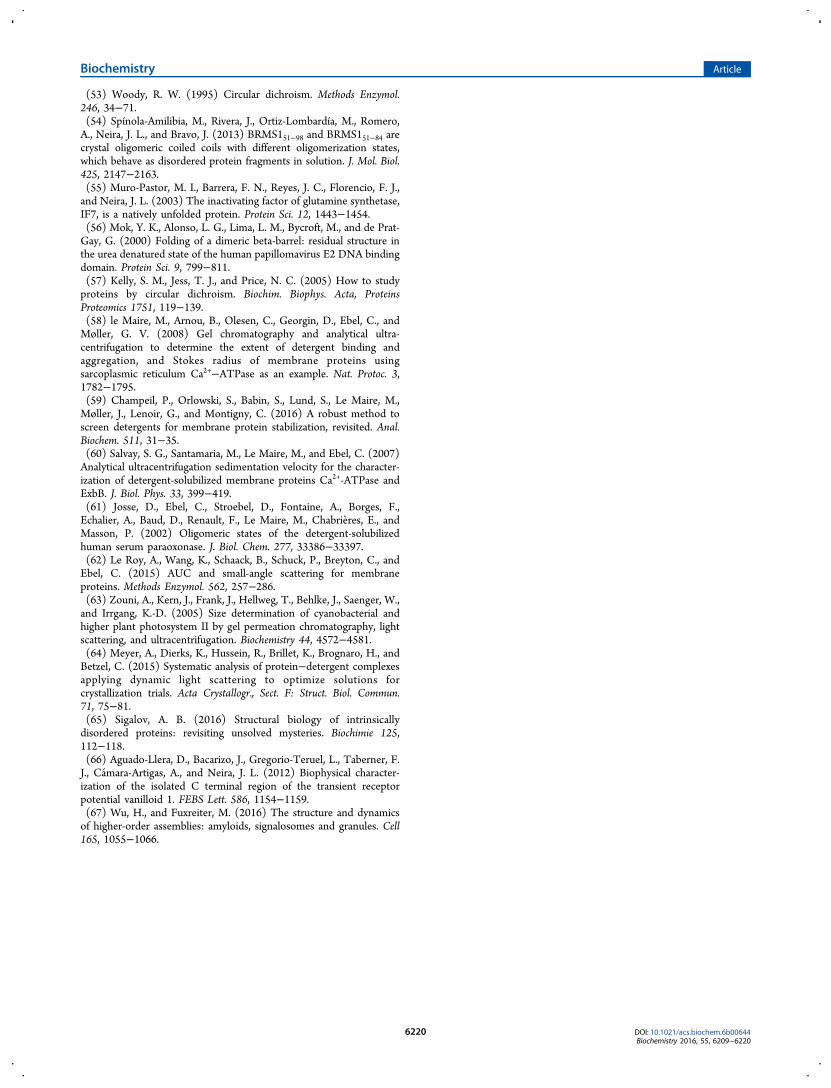
could detect one main peak with an s20,w of 1.8 S. However,there were also a secondary peak around an s20,w of 3 S and verybroad peaks with an average of s20,w of 8 S (Figure 2A). Fitting
of the first peak with a fixed value of the rate of the frictionalcoefficient of the protein with that of a sphere to 1.5 yields amolecular mass of 15.6 kDa (which is close to that theoreticallycalculated from the sequence, 12.8 kDa). However, thepresence of self-associated species, with estimated M values of40 and 200 kDa, is clear (Figure 2A). These results suggest thathCOA3 does not form a single self-associated species; instead,
Figure 1. Sequence-based disorder predictors of hCOA3. (A) Proteinsequence and distribution of charged residues. Acidic and basic aminoacids are indicated with red triangles and blue circles, respectively. (B)Probability of disorder propensity as a function of residue index, aspredicted by RONN,39 IUpred,40 DISOclust,41 and PrDOS.42 Thecutoff between ordered and disordered conformations is 0.5 in allcases.
Figure 2. Hydrodynamic measurements in hCOA3. (A) Interferencemode of the AUC experiment. The rate of the frictional factor of theprotein, f, to that of a spherical protein with the same number ofresidues, f/f 0, was fixed to 1.5, and the root-mean-square deviationobtained was 0.0075. (B) DLS experiments shown as a percentage ofvolume peak.
Biochemistry Article
DOI: 10.1021/acs.biochem.6b00644Biochemistry 2016, 55, 6209−6220
6213

there are several oligomerization equilibria with differentreaction orders.The DLS experiments (in volume) also showed several peaks
corresponding to a hydrodynamic radius of 44 ± 6 Å (yieldingan M of 114 ± 65 kDa, assuming a spherical shape for hCOA3)(Figure 2B), 325 ± 250 Å, and 2600 ± 700 Å. The overallpolydispersity index is 0.47 (68.5% of polydispersity), whichindicates that the sample is, in fact, polydisperse. However, the94.6% of the sample in the volume distribution graphcorresponds to the first peak with an only 13.9% polydispersity;this result suggests that this first peak is monodisperse, but witha very specific self-association. In summary, all the peaksobserved in DLS suggest the presence of self-associated proteinspecies. These results further support the presence of severaloligomerization equilibria with different reaction orders.Although we cannot obtain any measurement of the order of
the oligomerization or the molecular weight of the speciesinvolved, we also recorded far-UV CD spectra at two differentprotein concentrations: 10 and 16.2 μM (in protomer units).The results (Figure 1 of the Supporting Information) suggestthat, although both spectra were similarly shaped, there werechanges in intensity, and therefore, the protein had a tendencyto aggregate.We can further elaborate on the expected theoretical value of
the RS for a protein of the size of hCOA3. The RS value for anideal spherical molecule can be theoretically calculated byconsidering that the unsolvated molecular volume, MV/NA, isthat of a sphere:45 RS = (3MV/4NAπ)
1/3, where NA isAvogadro’s number. The calculated RS for a spherical,monomeric protein with M and V corresponding to those of
hCOA3 is 15.6 Å. In addition, the RS of a folded sphericalprotein can also be approximated by the equation46 RS = (4.75± 1.11)N0.29, where N is the number of residues; for a spherical,monomeric hCOA3, this expression yields a value of 19 ± 4 Å.A more accurate formula, specifically designed for IDPs,47 thattakes into account the fraction of Pro residues and the absolutenet charge of the protein sequence, yields an RS of 25 Å forhCOA3, which is larger than the values given above. Thestatistical and maximal uncertainties on this latter estimate are∼2 and ∼4 Å,47 respectively, and therefore, even this value isnot compatible with the experimental ones we obtained. Then,these theoretical results clearly suggest that the shape ofhCOA3 was not spherical, nor was it a monomer in solution.
hCOCA3 Acquires a Nonrigid Structure in a NarrowpH Range in Aqueous Solution. To elucidate which kind ofstructure (if any) is present in hCOA3, and whether it is stableover a wide pH range, we could use several biophysicaltechniques: ANS fluorescence, intrinsic fluorescence, and far-UV CD. All those techniques provide complementaryinformation about different structural features of hCOA3. Weused ANS fluorescence to monitor the burial of solvent-exposed hydrophobic patches.48 Intrinsic fluorescence was usedto monitor changes in the tertiary structure of the proteinaround its sole tryptophan (Trp46) and tyrosines (Tyr72,Tyr74, and Tyr77). Finally, we carried out far-UV CDexperiments to monitor changes in the secondary structure.
Steady-State Fluorescence and Thermal Denaturation.The fluorescence spectrum of hCOA3 at pH 7.0 and 20 °C hada maximum at 341 nm, suggesting that (i) protein fluorescencewas dominated by the unique tryptophan, Trp46, and (ii) this
Figure 3. Spectroscopic characterization of hCOA3 in aqueous solution. (A) Fluorescence intensity at 330 nm after excitation at 280 nm (●, leftaxis) and mean molar ellipticity at 222 nm (○, right axis) as the pH was modified. In fluorescence, similar curves were obtained after excitation at295 nm at any other emission wavelengths. Experiments were performed at 25 °C. (B) Thermal denaturations followed by fluorescence at 330 nm(excitation at 280 nm), at several pH values (the units on the y-axis are arbitrary). (C) ANS fluorescence at 480 nm as the pH was modified. Theinset shows the far-UV CD of hCOA3 at pH 7.0. Experiments were conducted at 25 °C. (D) Thermal denaturations followed by changes inellipticity at 222 nm (the units on the y-axis are arbitrary).
Biochemistry Article
DOI: 10.1021/acs.biochem.6b00644Biochemistry 2016, 55, 6209−6220
6214

residue was slightly buried (for a fully solvent-exposed Trpresidue, the maximum should be 350 nm19,29). The intensity at330 nm (as at any of the other explored wavelengths) showed abell shape as the pH varied, with two transitions [Figure 3A(●)]. The first occurred with a pKa of 5.4 ± 0.1, whereas thesecond happened at basic pH and was probably due to thetitration of the phenol group of some of the three tyrosines;this transition was not yet complete at pH 12.0, and therefore,we could not obtain its midpoint.Thermal denaturations at several pH values (3.1, 5.4, 7.4, and
12.1) were performed (Figure 3B). We did not observe anysigmoidal behavior at any pH; only at pH 7.4 could a very flattransition be guessed. Trying to fit this curve led to unreliableresults, with apparent thermal denaturation midpoints below 0°C. All transitions were reversible, except that at pH 3.1, wherescattering at high temperatures was observed (Figure 3B).Quenching Experiments. From the results given above, it
seems that there are several pH intervals where the structure ofhCOA3 could be different: the one at pH <4.0, between pH 6.0and 8.0, and above pH 8.0. Furthermore, because atphysiological pH the sole tryptophan was partially buried (asjudged from the fluorescence maximum), we wonderedwhether in those pH intervals the protein solvent accessibilitychanged. Therefore, we carried out quenching experiments withKI and acrylamide (Table 1) to monitor Trp and Tyr solventaccessibility.
In general terms, the Ksv values were larger at 280 nm than at295 nm for both quenching agents, due to the fact that at 280nm we are exciting both types of fluorescent residues (Tyr andTrp) whereas at 295 nm we are only exciting the Trp. In thepresence of 5 M urea, the Ksv values were also much larger thanin its absence, suggesting that the solvent accessibility of thesole Trp and of the Tyr residues was partially restricted,therefore indicating cluster formation around them in aqueoussolution. The Ksv values were also larger for acrylamide than forKI due to the presence of its dynamic component (ν). Finally,in the presence of KI, it can clearly be seen how at the twoextremes of pH (4.0 and 10.0) the values of Ksv were larger (butnot as much as in the presence of urea) than those atphysiological pH. These results indicate that at physiological
pH, the fluorescent residues are more solvent-shielded thanthey are under the other conditions tested. This tendency is notas clearly seen in the presence of acrylamide, because at pH10.0, the Ksv was smaller than at physiological pH; we explainthis effect as being due to the contribution of ν.In conclusion, although no sigmoidal thermal transition was
observed at any pH, it seems clear that at physiological pH thefluorescence residues had a more restricted solvent accessibility.
ANS Binding. At low pH, the ANS fluorescence intensity at480 nm was very large and decreased as the pH was increased(Figure 3C), indicating that hCOA3 had solvent-exposedhydrophobic regions at low pH. The intensity at 480 nmshowed a sigmoidal behavior, with a pKa of 4.4 ± 0.2. Thisvalue was smaller than that obtained from intrinsicfluorescence, suggesting that the solvent-exposed hydrophobicpatches are buried before acquisition of tertiary structurearound the fluorescent residues occurs.
Circular Dichroism. We recorded the far-UV spectrum ofthe protein at pH 7.0 and 20 °C. The far-UV CD spectrum hada shape resembling that of α-helices (Figure 3C, inset), but themaxima at 208 and 222 nm were not very intense.Deconvolution of the spectrum by using the online Dichrowebserver49,50 yields percentages of 8% for α-helix, 44% for β-sheet,and 48% for random coil, but the root-mean-square deviationof the experimental and fitted spectra was very poor. Theseresults suggest that the main secondary structure componentobserved is indicative of the presence of a β-sheet, indisagreement with the values of some of the theoreticalpredictions (see above), based on the primary structure.Furthermore, the deconvoluted values do not agree with theshape of the far-UV CD spectrum (Figure 3C, inset), where thepresence of an α-helix structure could be guessed. The reasonsof such a discrepancy are not clear, but a possible explanation isthat the minimum at 222 nm (and, thus, the expected highcontent of helical structure) could be due to the presence ofaromatic residues, which also absorb at this wavelength.51−53
We also carried out pH denaturation experiments. As the pHwas increased, the ellipticity at 222 nm increased (in absolutevalue) in a sigmoidal-like fashion, with a pKa of 6.0 ± 0.1[Figure 3A (○, right axis)], and thus, at low pH values, theellipticity at this wavelength was smaller than at thephysiological wavelength. The pKa value is different from thatobserved by intrinsic and ANS fluorescence, suggesting that theacquisition of secondary structure (monitored by far-UV CD)occurred at a later stage than both (i) the formation of tertiarystructure around fluorescent residues and (ii) the burial ofsolvent-exposed hydrophobic amino acids.Thermal denaturations followed by CD, at the same pH
values as in the fluorescence experiments, did not show a clearsigmoidal behavior (Figure 3D). Attempts to fit these curves tothe Gibbs−Helmholtz equation30 led to unrealistic values forthe thermal denaturation midpoints.
Chemical Denaturations of hCOA3 in Aqueous Solution.Because thermal denaturations did not lead to a propermeasurement of hCOA3 stability, we carried out ureadenaturations followed by CD (at 10 μM in protomer units)and fluorescence (at 2 and 3 μM in protomer units).Denaturations were conducted at pH 7.0 (Tris buffer), wherethe spectroscopic properties of the protein seemed to reach aplateau (Figure 3A).In the CD curves, as the concentration of urea was increased,
the minimum at 222 nm disappeared, indicating the disruptionof the protein secondary structure. The denaturation curves
Table 1. Quenching Parameters of hCOA3 in KI andAcrylamidea
KI acrylamideb
conditionKsv (M
−1)(280)
Ksv (M−1)
(295) Ksv (M−1) (280)
Ksv (M−1)
(295)
pH 4.0 0.8 ± 0.1 0.2 ± 0.1 6.0 ± 0.7(1.5 ± 0.3)
1.51 ± 0.02(0)
pH 7.0 0.5 ± 0.1 0.34 ± 0.05 4.0 ± 0.4(2.3 ± 0.1)
1.42 ± 0.05(0)
pH 10.0 2.4 ± 0.5 0.9 ± 0.3 2.4 ± 0.9(2.7 ± 0.4)
1.03 ± 0.05(0)
5 M urea 2.2 ± 0.1 1.6 ± 0.2 8.8 ± 0.6(2.2 ± 0.2)
3.6 ± 0.1 (0)c
aErrors are from fitting to the quenching equations (see ExperimentalProcedures). The Ksv values were obtained by fitting of thefluorescence intensity at 330 nm vs the concentration of thequenching agent. Experiments were conducted at 25 °C. bThe valuewithin the parentheses is ν, the dynamic quenching constant.cAcrylamide quenching at 295 nm resulted in straight lines underany condition. The quenching experiments in the presence of ureawere conducted at pH 7.0, 10 mM Tris buffer.
Biochemistry Article
DOI: 10.1021/acs.biochem.6b00644Biochemistry 2016, 55, 6209−6220
6215

were flat, with the absence of defined native and unfoldedbaselines, especially in the fluorescence experiments (Figure 4).
We tried to fit the data to the two-state equilibrium equation,30
but as it happened with the thermal denaturations, both themidpoint and slope of the curve obtained were unrealistic.Similar apparent sigmoidal-like curves (in the absence of eitherthe native or unfolded baselines, but with a likely sigmoidalbehavior in a narrow range of temperatures or denaturantconcentrations) have been observed during thermal or chemicaldenaturations of other highly flexible proteins.54,55 Thesefindings suggest the absence of a well-fixed conformation andexclude the possibility of determining the thermodynamicparameters of protein unfolding from the curves. Thus, theresults found by using a denaturant are similar to thoseobtained for thermal denaturations, further suggesting thathCOA3 lacks a rigid conformation.The fact that both fluorescence and CD yield the same result
(i.e., the lack of a sigmoidal transition) at two differentconcentrations (10 μM from CD, vs 2 and 3 μM fromfluorescence) suggests that the dissociation constant of the self-association reaction is small, which has been found for otheroligomeric proteins.56
Spectroscopic Characterization of hCOA3 in the Presenceof Detergents. Because hCOA3 has a transmembrane region,we decided to study its conformational preferences in thepresence of several detergents with different features.At a first step, we used far-UV CD at two different protein
concentrations in the presence of SDS and CHAPS. Results atboth protein concentrations (10 and 16.2 μM) with detergentconcentrations above their CMCs (Figure 2 of the SupportingInformation) suggest that there were small changes in theintensity of the normalized spectra [smaller than thoseobserved in aqueous solution (Figure 1 of the SupportingInformation)] at the two protein concentrations. These resultsindicate that the protein in the presence of the detergents alsohas a tendency to oligomerize. We used SDS, an ionic detergentwith a high CMC; NP-40 and Triton X-100, two nonionicdetergents with low CMCs (0.3 mM for NP-40 and 0.7 mM forTriton X-100); and CHAPS, a zwitterionic detergent,26−28 alsowith a high CMC (6 mM). The CD results (Figure 5A,B)suggest that only Triton X-100 did not induce a large increasein the level of hCOA3 structure (i.e., an increase of the
ellipticity at 222 nm). On the other hand, the presence of NP-40 and CHAPS shifted the ellipticity at 208 and 222 nm towardmore negative values, indicating an increase in the amount ofhelical structure. Finally, the largest variations in the intensity,as well as in the shape of the spectra, are seen after the additionof SDS. However, it is important to keep in mind that SDS mayalso denature proteins,25,26 which could be suspected from theincrease in the minimum of the far-UV CD spectrum ofhCOA3 at ∼205 nm (where random coil absorbs51−53). Thus,we conclude from the far-UV CD results that the addition of
Figure 4. Chemical denaturation of hCOA3 in aqueous solution. Ureadenaturation curves monitored by intrinsic fluorescence at 330 nm (●,left axis) (after excitation at 280 nm) and mean residual ellipticity at222 nm (■, right axis). Experiments were performed at 25 °C and pH7.0, in 10 mM Tris buffer.
Figure 5. Spectroscopic characterization of hCOA3 in the presence ofdetergents. (A) Far-UV CD of hCOA3 in the presence of the indicatedconcentrations of SDS (ionic) and CHAPS (zwitterionic). (B) Far-UVCD of hCOA3 in the presence of the indicated concentrations ofnonionic detergents (NP-40 and Triton X-100). (C) Fluorescenceexperiments of hCOA3 in the presence of the indicated concentrationsof SDS and CHAPS. The excitation wavelength was 280 nm, butsimilar results were obtained by excitation at 295 nm. All experimentswere conducted at 25 °C, in the presence of 20 mM Tris (pH 8.0) and500 mM NaCl. Units on the y-axis of the CD spectra are raw data fromspectropolarimeter to allow comparison among the detergents.
Biochemistry Article
DOI: 10.1021/acs.biochem.6b00644Biochemistry 2016, 55, 6209−6220
6216

any type of detergent (ionic, nonionic, or zwitterionic) didinduce an increase in the helical content of hCOA3, withslightly larger effects observed for CHAPS and SDS. Never-theless, this increase in helical content did not yield a morerigid structure, as suggested by the lack of sigmoidal behaviorduring the thermal denaturations performed in the presence ofa detergent (that is, the thermograms were similar to thoseshown in Figure 3D in aqueous solution).As a second step, we used fluorescence at a single protein
concentration [2.6 μM (in protomer units)]. The fluorescenceexperiments could be acquired for only SDS and CHAPS,because of the strong fluorescence emission of both nonionicdetergents used. In CHAPS, there was an increase in thefluorescence intensity of hCOA3, but in SDS, the intensity ofthe spectrum remained unaltered; at concentrations of SDSabove the CMC, the intensity of the spectrum decreased andthe spectrum was blue-shifted, suggesting changes in theenvironments of the sole tryptophan (data not shown). In bothdetergents, the maximal wavelength remained at 341 nm(Figure 5C). Because this Trp residue is outside of thetransmembrane region (Figure 1A), our results in the presenceof detergents indicate that the increase in the level of helix-likestructure (observed by CD) did not involve regions close to theindole. We suggest that the variation observed in fluorescenceintensity could be due to modifications in the environmentaround the two tyrosines belonging to the transmembraneregion (Figure 1A). The thermal denaturations followed byfluorescence also indicate that the newly formed structurearound those residues is not rigid [i.e., we observed a lack ofsigmoidal behavior, and the curves were similar to those inaqueous solution (Figure 3B)].In summary, under conditions that mimic better a membrane
environment (i.e., in the presence of detergents), the proteinacquired a larger population of flexible helical conformation,keeping its oligomeric structure, without conformationalchanges around the indole group.
■ DISCUSSIONBoth the biophysical studies and the theoretical predictions inthis work show that isolated hCOA3 lacks a well-definedstructure and is mainly a flexible protein, with neither a stablehydrogen bond network nor a well-formed organized core inaqueous solution. Moreover, the absence of cooperativityduring the thermal and chemical denaturation experiments(followed by CD and fluorescence) also suggests that thetertiary structure of hCOA3, if any, is very weak; suchnoncooperative transitions are typically observed in chemicaldenaturations of partially folded states devoid of persistentlong-range tertiary contacts.24 However, there is evidence of (i)hydrophobic clustering, at least around Trp46 (as concludedfrom quenching experiments), and (ii) secondary helical-likestructures (Figure 3C, inset). The band at 222 nm in the far-UV CD spectrum, which disappears at high urea concentrations(Figure 4), could be due to the presence of (i) residual helix- orturn-like structure or (ii) aromatic residues, absorbing at thiswavelength.51−53,57 If that shape of the far-UV spectrum is dueto helical structure, we suggest that the polypeptide patchesinvolved could be the transmembrane region, the coiled-coilregion, or both. However, it is important to note that ourfindings on the structure of isolated hCOA3 in aqueoussolution do not imply that the protein could not adopt a well-folded conformation in a more hydrophobic, or rigid,environment (such as that provided by the inner mitochondrial
membrane); for instance, it has been shown that other well-folded oligomeric coiled coils in crystals may behave asdisordered and highly flexible oligomeric proteins in solution.54
The two hydrodynamic techniques indicate that hCOA3 self-associates in aqueous solution. We could not carry out DLS andAUC experiments in the presence of any of the detergents usedbecause of (i) the restrictions that the presence of suchdetergents impose on the measured frictional coefficient (thesedimentation) in AUC (as discussed above, we had difficultiesin fitting the experiments in aqueous solution)58−62 and (ii) thebelt of different shaped micelles (and, therefore, the apparenthydrodynamic radii of the protein−micelle complexes) in theDLS measurements.63,64 Our results in the presence ofdetergents suggest that, even under a more realisticmembrane-mimicking environment, the oligomerization stateof the protein observed in water is maintained [as judged by theconcentration dependence in the far-UV CD spectra in therange of 10−20 μM (Figures 1 and 2 of the SupportingInformation)]. What we cannot conclude from the far-UV CDis whether the self-association order is the same in aqueoussolution and in the presence of detergents, or the molecularweight of the species involved. Therefore, we think that hCOA3populates similar, if not identical, self-associated states inaqueous and detergent environments and that these species arebiologically important.At the moment, we do not know which is the polypeptide
patch involved in the self-association, but we suspect it is thecoiled-coil region, because of its usual implication in this kindof intramolecular association (see a recent discussion65 andreferences therein). The self-association constant seems to bevery strong, because aggregated species are observed atconcentrations as low as 2 μM, as concluded from the absenceof protein concentration dependence in fluorescence experi-ments (see Experimental Procedures). In addition, thisassociation seems to be highly specific, as suggested by thesmall polydispersity in the resulting associated species (Figure2B), and therefore, it cannot be considered a nonorganizedaggregation of the hCOA3 molecules. We can also concludefrom AUC and DLS experiments in aqueous solution that thisself-association involves several equilibria with different reactionorders. In addition, this specific self-assembly does not hamperANS binding at very acidic pH values. We do not know,however, whether at those low pH values, the molecularity ofprotein self-association was modified or, alternatively, if ANSbinding was possible because of spatial rearrangements in a fewpolypeptide patches, as suggested by the different Ksv valuesfound (Table 1). These pH-dependent spatial rearrangementswould explain why the acquisition of structure aroundfluorescent residues, the formation of secondary structure,and the burial of hydrophobic regions occurred at differentstages (i.e., with different pKa values for the differentspectroscopic probes). It is important to indicate that theformation of such self-associated species at any pH did notinvolve formation of a stable hydrogen-bonded scaffold inhCOA3, as suggested by the absence of cooperativity in thethermal and chemical denaturation curves.hCOA3 is one of the few characterized, unstructured, flexible
proteins that self-associates in solution,24,54,65,66 showingseveral oligomeric species [as judged from the hydrodynamicexperiments (Figure 2)]. We hypothesize that this self-association could have several functions. First, it might hideotherwise solvent-accessible protein regions from the cellularmilieu, avoiding degradation. Second, intramolecular interac-
Biochemistry Article
DOI: 10.1021/acs.biochem.6b00644Biochemistry 2016, 55, 6209−6220
6217

tions in hCOA3 could protect regions involved in proteininteractions with other assembly factors during biogenesis ofCOX. These hindered regions could be exposed upon bindingto other assembly factors,65,67 facilitating modulation ofhCOA3 at different stages of COX biogenesis. Furthermore,the flexible nature of hCOA3 and the ability to sample different,nonrigid helical regions, together with its self-associationfeatures, could modulate the interactions with the differentassembly factors, controlling the order of assembly ofsubunits.12,13 In addition, the existence of some flexible (notfully formed) helical structures (chosen by means of theconformational selection mechanism by other proteins duringassembly) would ensure that hCOA3 would not incur asignificant entropic loss associated with adopting a folded stateupon binding to the other assembly factors. Therefore, theflexible structure of hCOA3 would facilitate and, possibly,accelerate the interactions with other assembly factors duringthe assemblage of the respiratory chain and their translationalregulation.
■ ASSOCIATED CONTENT
*S Supporting InformationThe Supporting Information is available free of charge on theACS Publications website at DOI: 10.1021/acs.bio-chem.6b00644.
Far-UV CD spectra of hCOA3 at two differentconcentrations in aqueous solution (Figure 1) and inthe presence of either 10 mM SDS (Figure 2A) or 8 mMCHAPS (Figure 2B) (PDF)
■ AUTHOR INFORMATION
Corresponding Authors*Instituto de Biologıa Molecular y Celular, Edificio Torregai-tan, Universidad Miguel Hernandez, Avda. del Ferrocarril s/n,03202 Elche, Alicante, Spain. Telephone: +34 966658459. Fax:+34 966658758. E-mail: [email protected].*CNR-NANOTEC, Licryl-UOS Cosenza and CEMIF.Cal,Department of Physics, University of Calabria, 87036 Rende,Italy. Telephone: +39 0984 496078. Fax: +39 0984 494401. E-mail: [email protected].
Present Addresses∇S.M.-R.: Department of Physical Chemistry, University ofGranada, Granada, Spain.○P.C.: Department of Laboratory Medicine, KarolinskaInstitutet, Stockholm, Sweden.●S.P.: University of Miami, Miller School of Medicine, Miami,FL 33136.
FundingThis work was supported by Spanish regional grants ofGeneralitat Valenciana (to J.L.N., Prometeo 018/2013),Comunidad de Madrid (to R.G., P2010/BMD-2402), andFundacion Seneca de la Region de Murcia (19353/PI/14 toJ.G.H.-C. and J.G.d.l.T.). Further support was provided by theNational Spanish Ministry of Economy and Competitivenessand FEDER (EU): BIO2012-39922-C02-01/02 (A.C.-A.) andCTQ2015-64445-R (J.L.N.).
NotesThe authors declare no competing financial interest.
■ ACKNOWLEDGMENTSWe are grateful to three anonymous reviewers for suggestingthe experiments in the presence of detergents. We thank Dr.Francisco N. Barrera (University of Tennessee, Knoxville, TN)for helpful advice on the use of the detergents and CarlosAlfonso Botello (CIB, CSIC, Madrid, Spain) on the limitationsof AUC use. We deeply thank May Garcıa, Marıa del CarmenFuster, and Javier Casanova for excellent technical assistance.
■ ABBREVIATIONSANS, 8-anilinonaphthalene-1-sulfonic acid; AUC, analyticalultracentrifugation; β-ME, β-mercaptoethanol; CCDC56,coiled-coil domain-containing protein 56; CD, circulard i c h r o i sm ; CHAPS , 3 - [ ( 3 - c h o l am i d o p r o p y l ) -dimethylammonio]-1-propanesulfonate; CMC, critical micelleconcentration; COX, cytochrome c oxidase; DLS, dynamic lightscattering; hCOA3, human COX assembly factor 3; IDP,intrinsically disordered protein; IMAC, immobilized affinitychromatography; IPTG, isopropyl β-D-thiogalactopyranoside;MITRAC, mitochondrial translation regulation assemblyintermediate of cytochrome c oxidase; NP-40, Nonidet P-40(octyl phenoxypolyethoxylethanol); PEI, polyethylenimine; RS,hydrodynamic radius; SDS, sodium dodecyl sulfate; UV,ultraviolet.
■ REFERENCES(1) Anderson, S., Bankier, A. T., Barrell, B. G., de Bruijn, M. H. L.,Coulson, A. R., Drouin, J., Eperon, I. C., Nierlich, D. P., Roe, B. A.,Sanger, F., Schreier, P. H., Smith, A. J., Staden, R., and Young, I. G.(1981) Sequence and organization of the human mitochondrialgenome. Nature 290, 457−465.(2) Tsukihara, T., Aoyama, H., Yamashita, E., Tomizaki, T.,Yamaguchi, H., Shinzawa-Itoh, K., Nakashima, R., Yaono, R., andYoshikawa, S. (1996) The whole structure of the 13-subunit oxidizedcytochrome c oxidase at 2.8 Å. Science 272, 1136−1144.(3) Nijtmans, L. G., Taanman, J. W., Muijsers, A. O., Speijer, D., andVan den Bogert, C. (1998) Assembly of cytochrome c oxidase incultured human cells. Eur. J. Biochem. 254, 389−394.(4) Carr, H. S., and Winge, D. R. (2003) Assembly of cytochrome coxidase within the mitochondrion. Acc. Chem. Res. 36, 309−316.(5) Soto, I. C., Fontanesi, F., Liu, J., and Barrientos, A. (2012)Biogenesis and assembly of eukaryotic cytochrome c oxidase catalyticcore. Biochim. Biophys. Acta, Bioenerg. 1817, 883−897.(6) Mick, D. U., Fox, T. D., and Rehling, P. (2011) Inventorycontrol: cytochrome c oxidase assembly regulates mitochondrialtranslation. Nat. Rev. Mol. Cell Biol. 12, 14−20.(7) Shoubridge, E. A. (2001) Cytochrome c oxidase deficiency. Am. J.Med. Genet. 106, 46−52.(8) Zee, J. M., and Glerum, D. M. (2006) Defects in cytochrome coxidase assembly in humans: lessons from yeast. Biochem. Cell Biol. 84,859−869.(9) Díaz, F. (2010) Cytochrome c oxidase deficiency: patients andanimal models. Biochim. Biophys. Acta, Mol. Basis Dis. 1802, 100−110.(10) Wallace, D. C. (1999) Mitochondrial diseases in man andmouse. Science 283, 1482−1488.(11) Smeitink, J. A., Zeviani, M., Turnbull, D. M., and Jacobs, H. T.(2006) Mitochondrial medicine: a metabolic perspective on thepathology of oxidative phophorylation disorders. Cell Metab. 3, 9−13.(12) Peralta, S., Clemente, P., Sanchez-Martínez, A., Calleja, M.,Hernandez-Sierra, R., Matsushima, Y., Adan, C., Ugalde, C.,Fernandez-Moreno, M. A., Kaguni, L. S., and Garesse, R. (2012)Coiled coil domain-containing protein 56 (CCD56) is a novelmitochondrial protein essential for cytochrome c oxidase function. J.Biol. Chem. 287, 24174−24185.(13) Clemente, P., Peralta, S., Cruz-Bermudez, A., Echevarría, L.,Fontanesi, F., Barrientos, A., Fernandez-Moreno, M. A., and Garesse,
Biochemistry Article
DOI: 10.1021/acs.biochem.6b00644Biochemistry 2016, 55, 6209−6220
6218

R. (2013) hCOA3 stabilizes cytochrome c oxidase 1 (COX1) andpromotes cytochrome c oxidase assembly in human mitochondria. J.Biol. Chem. 288, 8321−8331.(14) Mick, D. U., Dennerlein, S., Wiese, H., Reinhold, R., Pacheu-Grau, D., Lorenzi, I., Sasarman, F., Weraarpachai, W., Shoubridge, E.A., Warscheid, B., and Rehling, P. (2012) MITRAC linksmitochondrial protein translocation to respiratory chain assemblyand translational regulation. Cell 151, 1528−1541.(15) Szklarczyk, R., Wanschers, B. F., Cuypers, T. D., Esseling, J. J.,Riemersma, M., van den Brand, M. A., Gloerich, J., Lasonder, E., vanden Heuvel, L. P., Nijtmans, L. G., and Huynen, M. A. (2012) Iterativeorthology prediction uncovers new mitochondrial proteins andidentifies C12orf62 as the human ortholog of COX14, a proteininvolved in the assembly of cytochrome c oxidase. Genome Biol. 13,R12.(16) Wright, P. E., and Dyson, H. J. (2014) Intrinsically disorderedproteins in cellular signalling and regulation. Nat. Rev. Mol. Cell Biol.16, 18−29.(17) Liu, Z., and Huang, Y. (2014) Advantages of proteins beingdisordered. Protein Sci. 23, 539−550.(18) Joshi, P., and Vendruscolo, M. (2015) Druggability ofintrinsically disordered proteins. Adv. Exp. Med. Biol. 870, 383−400.(19) Pace, C. N., and Scholtz, J. M. (1997) Measuring theconformational stability of a protein. In Protein Structure (Creighton,T. E., Ed.) 2nd ed., pp 253−259, Oxford University Press, Oxford,U.K.(20) Dunn, M. J. (1995) Initial planning: determination of totalprotein concentration. In Protein purification methods (Harris, E. L. V.,and Angal, S., Eds.) pp 10−20, Oxford University Press, Oxford, U.K.(21) Neira, J. L. (2013) Fluorescence, circular dichroism and massspectrometry as tools to study virus structure. Subcell. Biochem. 68,177−202.(22) Chemes, L. B., Alonso, L. G., Noval, M. G., and Prat-Gay, G.(2014) Circular dichroism techniques for the analysis of intrinsicallydisordered proteins and domains. In Intrinsically disordered proteinanalysis: Vol. 1. Methods and experimental tools (Uversky, V. N., andDunker, A. K., Eds.) Methods in Molecular Biology, Vol. 895, pp 387−404, Springer Protocols, Humana Press, Totowa, NJ.(23) Burgess, R. R. (2009) Protein precipitation techniques. MethodsEnzymol. 463, 331−342.(24) Neira, J. L., Roman-Trufero, M., Contreras, L. M., Prieto, J.,Singh, G., Barrera, F. N., Renart, M. L., and Vidal, M. (2009) Thetranscriptional repressor RYBP is a natively unfolded protein whichfolds upon binding to DNA. Biochemistry 48, 1348−1360.(25) Suzuki, H., and Terada, H. (1988) Removal of dodecyl sulphatefrom protein solution. Anal. Biochem. 172, 259−263.(26) Mogensen, J. E., Sehgal, P., and Otzen, D. E. (2005) Activation,inhibition and destabilization of Thermomyces lanuginosus lipase bydetergents. Biochemistry 44, 1719−1730.(27) Seddon, A. M., Curnow, P., and Booth, P. J. (2004) Membraneproteins, lipids and detergents: not just a soap opera. Biochim. Biophys.Acta, Biomembr. 1666, 105−117.(28) Johnson, M. (2013) Detergents: Triton X-100, Tween-20 andmore. Mater. Methods 3, 163.(29) Lakowicz, J. R. (1999) Principles of fluorescence spectroscopy, 2nded., Plenum Press, New York.(30) Domenech, R., Hernandez-Cifre, J. G., Bacarizo, J., Díez-Pena,A. I., Martínez-Rodríguez, S., Cavasotto, C. N., García de la Torre, J.,Camara-Artigas, A., Velazquez-Campoy, A., and Neira, J. L. (2013)The histidine-phosphocarrier protein of the phosphoenolpyruvate:sugar phosphotransferase system of Bacillus sphaericus self-associates.PLoS One 8, e69307.(31) Perez-Sanchez, H., Tatarenko, K., Nigen, M., Pavlov, G.,Imberty, A., Lortat-Jacob, H., García de la Torre, J., and Ebel, C.(2006) Organization of human interferon g-heparin complexes fromsolution properties and hydrodynamics. Biochemistry 45, 13227−13238.
(32) Schuck, P. (2000) Size-distribution analysis of macromoleculesby sedimentation velocity ultracentrifugation and Lamm equationmodeling. Biophys. J. 78, 1606−1619.(33) Laue, T. M., Shah, B. D., Ridgeway, T. M., and Pelletier, S. L.(1992) Computer-aided interpretation of analytical sedimentation datafor proteins. In Analytical Ultracentrifugation in Biochemistry andPolymer Science (Harding, S. E., Rowe, A. J., and Horton, J. C., Eds.) pp90−124, Royal Society of Chemistry, Cambridge, U.K.(34) Markley, J. L. (1975) Observation of histidine residues inproteins by nuclear magnetic resonance spectroscopy. Acc. Chem. Res.8, 70−80.(35) Uversky, V. N., Gillespie, J. R., and Fink, A. L. (2000) Why are“natively unfolded” proteins unstructured under physiologic con-ditions? Proteins: Struct., Funct., Genet. 41, 415−427.(36) Romero, P., Obradovic, Z., Li, X., Garner, E. C., Brown, C. J.,and Dunker, A. K. (2001) Sequence complexity of disordered protein.Proteins: Struct., Funct., Genet. 42, 38−48.(37) Simpson, R. J. (2003) Proteins and proteomics: A laboratorymanual, Cold Spring Harbor Laboratory Press, Plainview, NY.(38) Perez, R. B., Tischer, A., Auton, M., and Whitten, S. T. (2014)Alanine and proline content modulate global sensitivity to discreteperturbations in disordered proteins. Proteins: Struct., Funct., Genet. 82,3373−3384.(39) Yang, Z. R., Thomson, R., McNeil, P., and Esnouf, R. M. (2005)RONN: the bio-basis function neural network technique applied to thedetection of natively unfolded proteins. Bioinformatics 21, 3369−3376.(40) Dosztanyi, Z., Csizmok, V., Tompa, P., and Simon, I. (2005)IUPred: web server for the prediction of intrinsically unstructuredregions of proteins based on estimated energy content. Bioinformatics21, 3433−3444.(41) McGuffin, L. J. (2008) Intrinsic disorder prediction from theanalysis of multiple protein fold recognition models. Bioinformatics 24,1798−1804.(42) Ishida, T., and Kinoshita, K. (2007) PrDOS: prediction ofdisordered protein regions from amino acid sequence. Nucleic AcidsRes. 35, W460−W464.(43) Prilusky, J., Felder, C. E., Zeev-Ben-Mordehai, T., Rydberg, E.H., Man, O., Beckmann, J. S., Silman, I., and Sussman, J. L. (2005)FoldIndex: a simple tool to predict whether a given protein sequenceis intrinsically unfolded. Bioinformatics 21, 3435−3438.(44) Sormanni, P., Camilloni, C., Fariselli, P., and Vendruscolo, M.(2015) The s2D method: Simultaneous sequence-based prediction ofthe statistical populations of ordered and disordered regions inproteins. J. Mol. Biol. 427, 982−996.(45) Cantor, C. R., and Schimmel, P. R. (1980) Biophysical Chemistry,W. H. Freeman, New York.(46) Wilkins, D. K., Grimshaw, S. B., Receveur, V., Dobson, C. M.,Jones, J. A., and Smith, L. J. (1999) Hydrodynamic radii of native anddenatured proteins measured by pulse field gradient NMR techniques.Biochemistry 38, 16424−16431.(47) Marsh, J. A., and Forman-Kay, J. D. (2010) Sequencedeterminants of compaction in intrinsically disordered proteins.Biophys. J. 98, 2383−2390.(48) Ptitsyn, O. B. (1995) Molten globule and protein folding. Adv.Protein Chem. 47, 83−229.(49) Whitmore, L. B., and Wallace, B. A. (2008) Protein secondarystructure analysis from circular dichroism spectroscopy: methods andreference databases. Biopolymers 89, 392−400.(50) Whitmore, L. B., and Wallace, B. A. (2004) Dichroweb: anonline server for protein secondary structure analyses from circulardichroism spectroscopy data. Nucleic Acids Res. 32, W668−W673.(51) Vuilleumier, S., Sancho, J., Loewenthal, R., and Fersht, A. R.(1993) Circular dichroism studies of barnase and its mutants:characterization of the contribution of aromatic side chains.Biochemistry 32, 10303−10313.(52) Woody, A. Y., and Woody, R. W. (2003) Individual tyrosineside-chain contributions to circular dichroism of ribonuclease.Biopolymers 72, 500−513.
Biochemistry Article
DOI: 10.1021/acs.biochem.6b00644Biochemistry 2016, 55, 6209−6220
6219
(53) Woody, R. W. (1995) Circular dichroism. Methods Enzymol.246, 34−71.(54) Spínola-Amilibia, M., Rivera, J., Ortiz-Lombardía, M., Romero,A., Neira, J. L., and Bravo, J. (2013) BRMS151−98 and BRMS151−84 arecrystal oligomeric coiled coils with different oligomerization states,which behave as disordered protein fragments in solution. J. Mol. Biol.425, 2147−2163.(55) Muro-Pastor, M. I., Barrera, F. N., Reyes, J. C., Florencio, F. J.,and Neira, J. L. (2003) The inactivating factor of glutamine synthetase,IF7, is a natively unfolded protein. Protein Sci. 12, 1443−1454.(56) Mok, Y. K., Alonso, L. G., Lima, L. M., Bycroft, M., and de Prat-Gay, G. (2000) Folding of a dimeric beta-barrel: residual structure inthe urea denatured state of the human papillomavirus E2 DNA bindingdomain. Protein Sci. 9, 799−811.(57) Kelly, S. M., Jess, T. J., and Price, N. C. (2005) How to studyproteins by circular dichroism. Biochim. Biophys. Acta, ProteinsProteomics 1751, 119−139.(58) le Maire, M., Arnou, B., Olesen, C., Georgin, D., Ebel, C., andMøller, G. V. (2008) Gel chromatography and analytical ultra-centrifugation to determine the extent of detergent binding andaggregation, and Stokes radius of membrane proteins usingsarcoplasmic reticulum Ca2+−ATPase as an example. Nat. Protoc. 3,1782−1795.(59) Champeil, P., Orlowski, S., Babin, S., Lund, S., Le Maire, M.,Møller, J., Lenoir, G., and Montigny, C. (2016) A robust method toscreen detergents for membrane protein stabilization, revisited. Anal.Biochem. 511, 31−35.(60) Salvay, S. G., Santamaria, M., Le Maire, M., and Ebel, C. (2007)Analytical ultracentrifugation sedimentation velocity for the character-ization of detergent-solubilized membrane proteins Ca2+-ATPase andExbB. J. Biol. Phys. 33, 399−419.(61) Josse, D., Ebel, C., Stroebel, D., Fontaine, A., Borges, F.,Echalier, A., Baud, D., Renault, F., Le Maire, M., Chabrieres, E., andMasson, P. (2002) Oligomeric states of the detergent-solubilizedhuman serum paraoxonase. J. Biol. Chem. 277, 33386−33397.(62) Le Roy, A., Wang, K., Schaack, B., Schuck, P., Breyton, C., andEbel, C. (2015) AUC and small-angle scattering for membraneproteins. Methods Enzymol. 562, 257−286.(63) Zouni, A., Kern, J., Frank, J., Hellweg, T., Behlke, J., Saenger, W.,and Irrgang, K.-D. (2005) Size determination of cyanobacterial andhigher plant photosystem II by gel permeation chromatography, lightscattering, and ultracentrifugation. Biochemistry 44, 4572−4581.(64) Meyer, A., Dierks, K., Hussein, R., Brillet, K., Brognaro, H., andBetzel, C. (2015) Systematic analysis of protein−detergent complexesapplying dynamic light scattering to optimize solutions forcrystallization trials. Acta Crystallogr., Sect. F: Struct. Biol. Commun.71, 75−81.(65) Sigalov, A. B. (2016) Structural biology of intrinsicallydisordered proteins: revisiting unsolved mysteries. Biochimie 125,112−118.(66) Aguado-Llera, D., Bacarizo, J., Gregorio-Teruel, L., Taberner, F.J., Camara-Artigas, A., and Neira, J. L. (2012) Biophysical character-ization of the isolated C terminal region of the transient receptorpotential vanilloid 1. FEBS Lett. 586, 1154−1159.(67) Wu, H., and Fuxreiter, M. (2016) The structure and dynamicsof higher-order assemblies: amyloids, signalosomes and granules. Cell165, 1055−1066.
Biochemistry Article
DOI: 10.1021/acs.biochem.6b00644Biochemistry 2016, 55, 6209−6220
6220