HuAngang - Brookings lasting from 1980 to 2020, is what ... China, An Emerging Superpower ... of...
40
Hu Angang Tsinghua University June 15, 2011 Washington DC
Transcript of HuAngang - Brookings lasting from 1980 to 2020, is what ... China, An Emerging Superpower ... of...

Hu AngangTsinghua University
June 15, 2011 Washington DC
Questions to be addressed
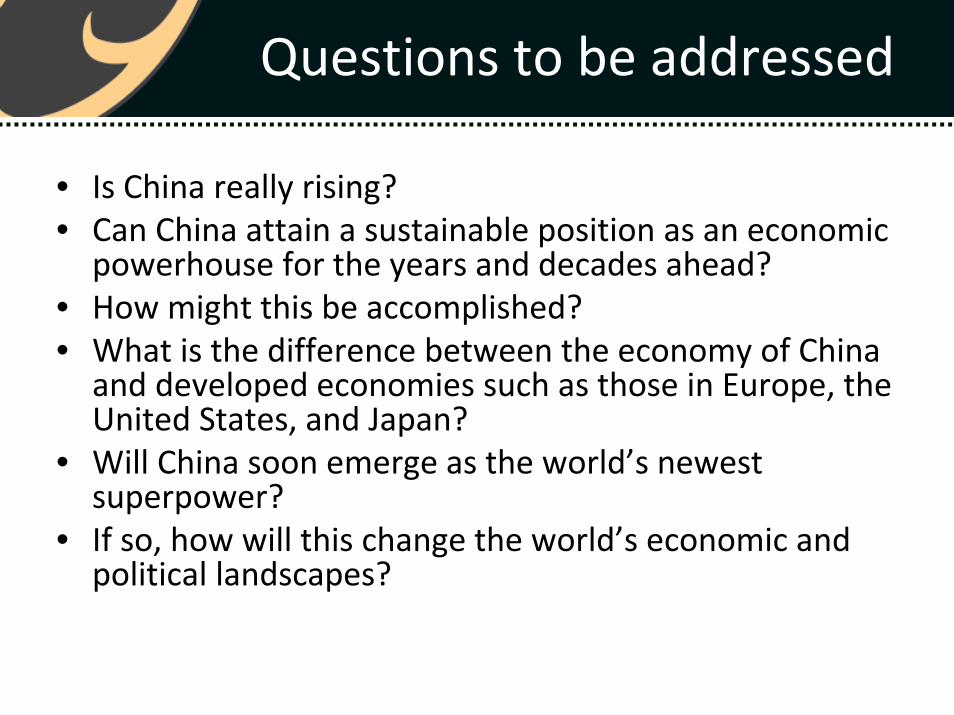
• Is China really rising? • Can China attain a sustainable position as an economic powerhouse for the years and decades ahead?
• How might this be accomplished?• What is the difference between the economy of China and developed economies such as those in Europe, the United States, and Japan?
• Will China soon emerge as the world’s newest superpower?
• If so, how will this change the world’s economic and political landscapes?
Agenda
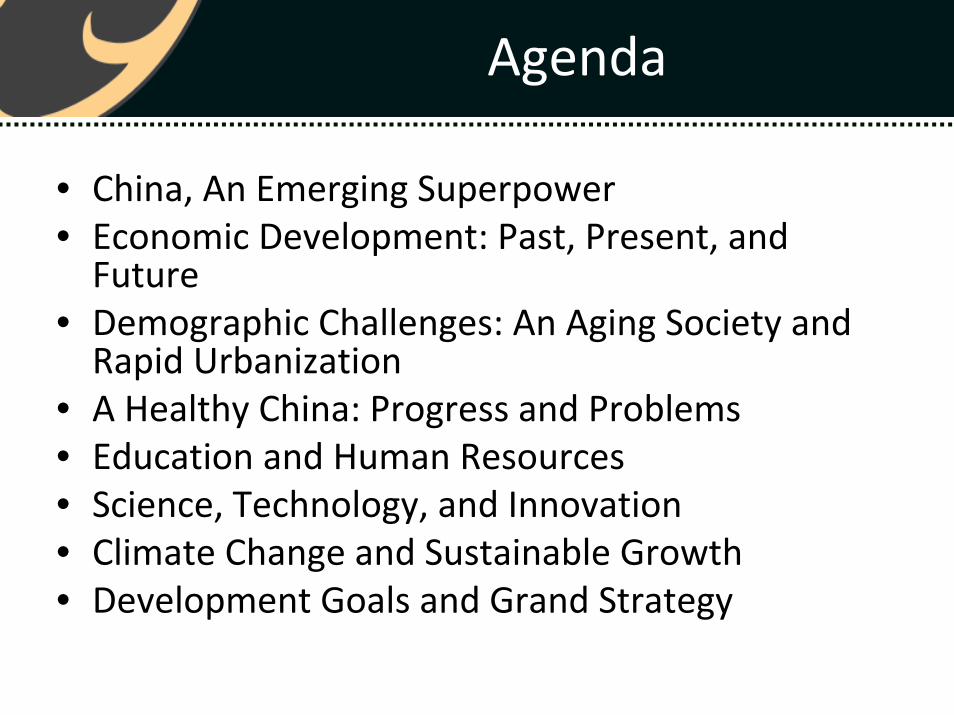
• China, An Emerging Superpower• Economic Development: Past, Present, and Future
• Demographic Challenges: An Aging Society and Rapid Urbanization
• A Healthy China: Progress and Problems• Education and Human Resources• Science, Technology, and Innovation• Climate Change and Sustainable Growth• Development Goals and Grand Strategy

China, An Emerging Superpower
• One of the great events of the past three decades has been the rapid rise of China
• China’s quick ascent into the ranks of great powers not only outstripped the expectations of the international community but has also far surpassed the Chinese government’s own expectations
China, An Emerging Superpower
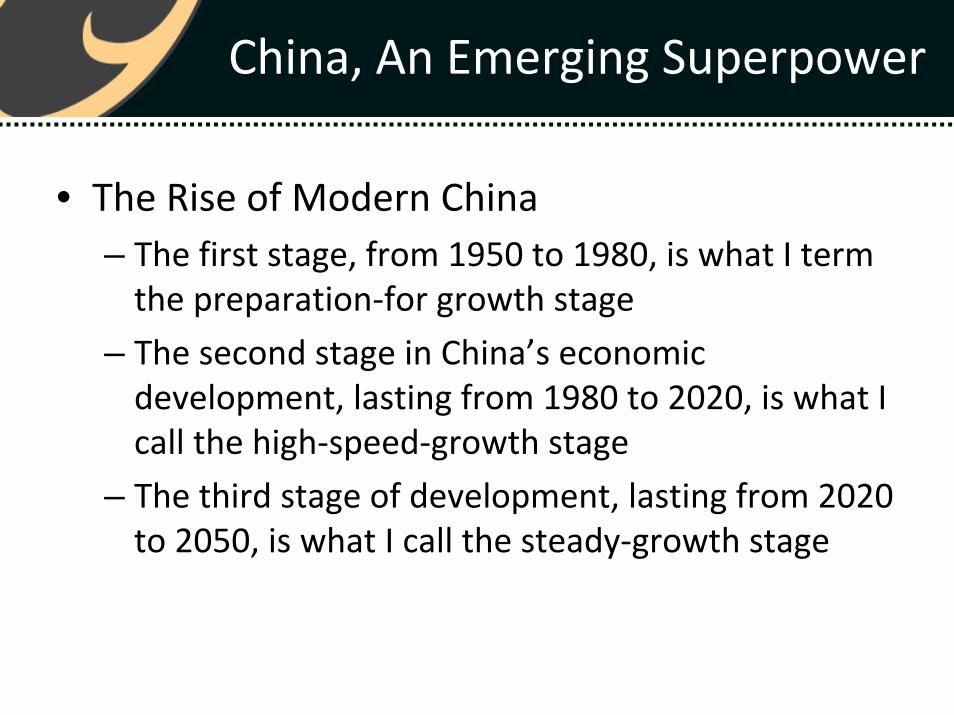
• The Rise of Modern China– The first stage, from 1950 to 1980, is what I term the preparation‐for growth stage
– The second stage in China’s economic development, lasting from 1980 to 2020, is what I call the high‐speed‐growth stage
– The third stage of development, lasting from 2020 to 2050, is what I call the steady‐growth stage

China, An Emerging Superpower
Gross Domestic Product Shares World Total, Four Major Powers, 1–2030
Source: Angus Maddison, “Statistics on World Population, GDP, and per Capita GDP, 1–2003 AD” (www.ggdc.net/maddison/); Angus Maddison, Chinese Economic Performance in the Long Run, 960–2030 AD (Paris: OECD, 2007).
China is experiencing a U curve (1820‐2030)

Economic Development: Past, Present, and Future
• Sources of Economic Growth in the PRC
Source 1952‐77 Contribution 1978‐2005 Contribution
GDP 6.1 100 9.6 100
Capital stock, 1987 11.5 75 9.5 39
Employment 2.6 13 2.4 8
Human capital 4.1 20 2.1 7
Total factor productivity ‐0.5 ‐8 4.4 46
Source: Hu Angang and Taoxiong Liu, “Comparison of Defense Capital Power among China, U.S., Japan, and India,” Strategy and Management 6 (2003); Chang Li, “Study of Regional Gaps in Human Capital and Economic Development” (master’s thesis, Tsinghua University); Chinese Labor Statistical Yearbook 2000; China Statistical Abstract 2004, pp. 38–42.

Economic Development: Past, Present, and Future
• China’s Potential for Further Economic Growth– International and domestic catch‐up effect
– High domestic savings and high investment rates
– Expected increase in human capital
– Growth of the nonagricultural sector
– Steady increases in total factor productivity

Economic Development: Past, Present, and Future
• How will China catch up with the United States in total GDP (2010 estimation)– Physical quantity: China has also overtaken the United States in terms of output of major manufactured goods
– Market exchange: by 2020 America’s GDP will be between 2.35 and 2.70 times that of China and by 2035, 1.06–1.32 times that of China
– The PPP method• China overtaking the United States in terms of GDP, regardless of how it is calculated, is inevitable

Economic Development: Past, Present, and Future
1980 1990 2000 2005 2007
China GDP (percent of world total) 1.04 1.85 3.77 5.20 5.87U.S. GDP (percent of world total) 29.06 29.40 30.75 30.39 25.19U.S./China ratio 28.03/1.00 15.87/1.00 8.15/1.00 5.85/1.00 4.29/1.00
China agricultural output (percent of world total) 9.45 12.97 15.54 16.97 21.53U.S. agricultural output (percent of world total) 6.93 7.58 9.80 8.70 8.40U.S./China ratio 0.73/1.00 0.58/1.00 0.63/1.00 0.51/1.00 0.39/1.00
China industrial output (percent of world total) 1.16 2.22 6.30 9.00 10.28U.S. industrial output (percent of world total) 24.24 23.21 25.16 23.88 19.79U.S./China ratio 10.33/1.00 5.41/1.00 1.91/1.00 1.33/1.00 1.93/1.00
China service industry output (percent of world total) 0.53 1.23 2.39 3.02 3.40U.S. service industry output (percent of world total) 34.89 34.06 34.50 33.91 28.11U.S./China ratio 65.29/1.00 27.65/1.00 14.43/1.00 11.22/1.00 8.27/1.00
GDP and the Added Values of Three Economic Sectors, China and the United States
Source: World Bank, World Development Indicators 2010; World Bank, World Development Report 2009.

Economic development
• China creates 50 years economic growth gold age (1978‐2030 , 2011 estimation)
1978 2010 2020 20301978‐2010
Annual growth(%)
2010‐2030Annual growth
(%)
1978‐2030Annual growth
(%)
GDP 1.00 20.57 44.4 87.4 9.9 7.5 9.0
GDP per capita
1.00 14.71 30.3 62.5 8.8 7.0 8.3
Growth index in China (1978=1.00)

Economic development
• Catch‐up index of GDP (US=100 , 2011 estimation)
Note: Growth rate for China is 7% during 2010 to 2020, and 5% for 2020 to 2030, for US is 2% and for India is 7%.Data source: Maddison, 2010.

Economic development
• Catch‐up index of GDP per capita (US=100 , 2011 estimation)
Note: Growth rate for China is 7% during 2010 to 2020, and 5% for 2020 to 2030, for US is 2% and for India is 7%.Data source: Maddison, 2010.

Economic development
• GDP gap among China, US and Japan (exchange rate, trillion USD, 2011 estimation)
Note: GDP growth rate for China is 8.5 from 2010 to 2020 and 7.5 from 2020 to 2030, GDP growth rate for US is 3.5% and for Japan is 1.5% with considerations of GDP deflator. GDP deflator for China is 4% and annual RMB appreciation rate is 4%.Data source: World Development Indicator 2010, CIA World Factbook.
2000 2005 2010 2015 2020
China 1.198 2.257 5.879 13.085 27.807
US 9.849 12.580 14.660 17.411 20.679
Japan 4.667 4.552 5.474 5.897 6.353
US/China 8.22 5.57 2.49 1.33 0.74
Japan/China 3.90 2.02 0.93 0.45 0.23
Demographic Challenges
• The PRC’s rapid demographic transition– Modern demographic transition, 1949–78
– An aging society: fewer children and more seniors, 1978‐present
• Therefore, we need to adjust population control policies

Demographic Challenges
• Urbanization: the main driving force of future development
Period China World United States
1950‐1980 3.85 2.91 1.75
1980‐2000 4.47 2.50 1.41
2000‐2030 2.19 1.86 1.16
1960‐1970 0.99 2.94 1.73
1950‐2030 3.38 1.44 1.44
Urban Population Growth, China, the World, and the United States, 1950–2030
Source: UN Department of Economic and Social Affairs, World Urbanization Prospects: The 2008 Revision.

Demographic Challenges
Urban population (million) Urbanization rate (percent)Share of world urban population (percent)
Year
ChinaUnited States
Ratio ChinaUnited States
Gap ChinaUnited States
1950 61.7 101.2 0.61 11.2 64.2 53.0 8.37 13.74
1960 130.7 130.3 1.00 19.7 70.0 50.3 13.12 13.08
1970 144.2 154.6 0.93 17.4 73.6 56.2 10.83 11.61
1980 191.4 170.3 1.12 19.4 73.7 54.3 11.00 9.78
1990 302.0 192.8 1.57 26.4 75.3 48.9 13.28 8.48
2000 459.1 225.3 2.04 36.2 79.1 42.9 16.09 7.90
2010 607.2 259.0 2.34 47.0 82.3 35.3 17.38 7.41
2020 756.3 290.7 2.60 54.0 84.9 30.9 17.97 6.91
2030 879.9 318.5 2.76 60.0 87.0 27.0 17.72 6.41
Urbanization, China and the United States, 1950–2030 (2010 estimation)
Source: National Bureau of Statistics of China, Statistical Data of the 55 Years of New China (2004); UN Department of Economic and Social Affairs, World Urbanization Prospects: The 2008 Revision; author’s calculations.
Urbanization
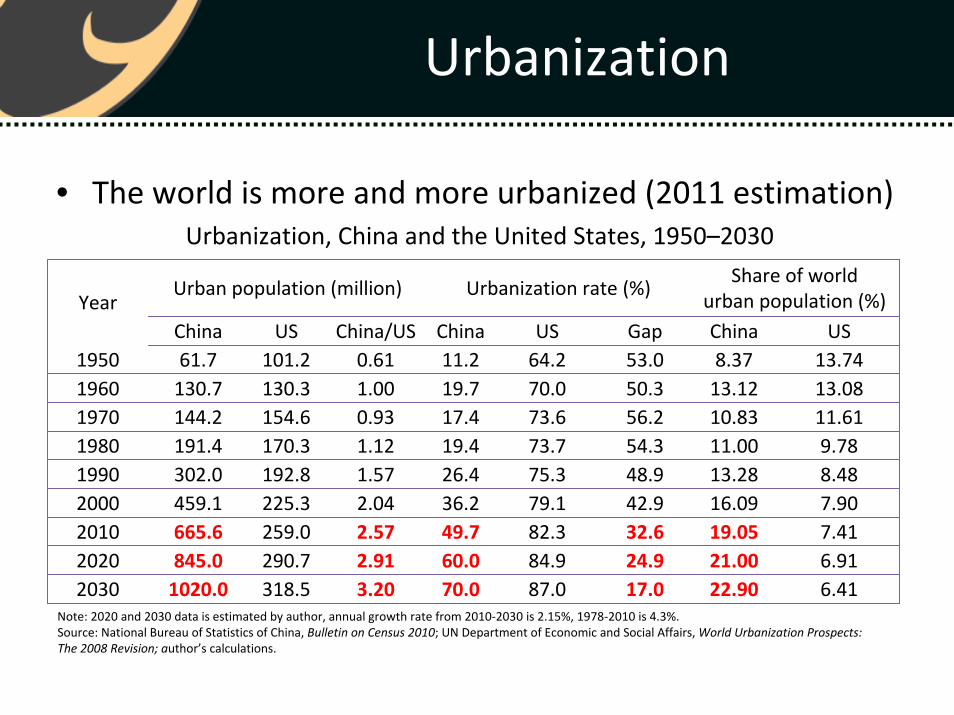
• The world is more and more urbanized (2011 estimation)
Urban population (million) Urbanization rate (%)Share of world
urban population (%)YearChina US China/US China US Gap China US
1950 61.7 101.2 0.61 11.2 64.2 53.0 8.37 13.741960 130.7 130.3 1.00 19.7 70.0 50.3 13.12 13.081970 144.2 154.6 0.93 17.4 73.6 56.2 10.83 11.611980 191.4 170.3 1.12 19.4 73.7 54.3 11.00 9.781990 302.0 192.8 1.57 26.4 75.3 48.9 13.28 8.482000 459.1 225.3 2.04 36.2 79.1 42.9 16.09 7.902010 665.6 259.0 2.57 49.7 82.3 32.6 19.05 7.412020 845.0 290.7 2.91 60.0 84.9 24.9 21.00 6.912030 1020.0 318.5 3.20 70.0 87.0 17.0 22.90 6.41
Urbanization, China and the United States, 1950–2030
Note: 2020 and 2030 data is estimated by author, annual growth rate from 2010‐2030 is 2.15%, 1978‐2010 is 4.3%.Source: National Bureau of Statistics of China, Bulletin on Census 2010; UN Department of Economic and Social Affairs, World Urbanization Prospects: The 2008 Revision; author’s calculations.

A Healthy China
• Building a healthy China by 2020– Reducing by half, between 1990 and 2015, the proportion of people whose income is less than a dollar a day.
– Reducing by half, between 1990 and 2015, the proportion of the population without access to safe drinking water and basic sanitation
– Reducing by three‐quarters, between 2000 and 2020, the mortality rate of pregnant women.
– Reducing by two‐thirds, between 1990 and 2015, the mortality rate of children under five
– Reducing by half, between 2000 and 2020, the infant mortality rate

A Healthy China
GoalHigh‐income countries
Upper‐middleincome countries
China China’s
2020 goal
Health resources per thousand persons
Number of doctors 2.7 2.2 1.4 2.0
Hospital beds 5.9 4.2 2.2 4.0
Public health and basic medical services (percent)
Children immunized against measles 93 94 94 98
Prenatal medical checkup coverage n.a. 93 90 95
Rural population’s access to safe drinking water 98 84 81 90
Use of sanitary latrines in rural areas 99 61 59 80
Funds raised for equalizing health services (percent)
Urban medical insurance coverage n.a. n.a. 50 100
Rural medical insurance coverage n.a. n.a. 99 100
Government spending on health as share of total spending 17 10 4 8
Millennium Development Goals, China and Other Countries, 2007
Source: UN in China, China’s Progress toward the Millennium Development Goals, 2008 Report; Hu Angang, China in 2020: Building up a Well‐Off Society (Tsinghua University Press, 2007).

A Healthy China
• Human Development Index and China’s goal of building a well‐Off society
Year Human development
index
Life expectancy
index
Education index
GDPindex
1950 0.225 n.a. n.a. n.a.1975 0.523 n.a. n.a. n.a.1980 0.559 0.674 0.641 0.3611985 0.595 0.686 0.663 0.4351990 0.634 0.712 0.711 0.4811995 0.691 0.742 0.758 0.5712000 0.732 0.771 0.791 0.6332005 0.777 0.792 0.837 0.7032008 0.793 0.799 0.851 0.6652010 0.800 n.a. n.a. n.a.2020 0.870 n.a. n.a. n.a.
Indexes of Human Development, Life Expectancy, Education, and GDP, China, 1950–2020
Source: Nicholas Crafts, “The Human Development Index, 1870–1999,” European Review of Economic History 6, no. 3 (2002): 395–405; UN Development Program, Human Development Report 2002, p. 246; China Human Development Report 2007/08; China Human Development Report 2009/10; author’s estimates.
Education and Human Resources
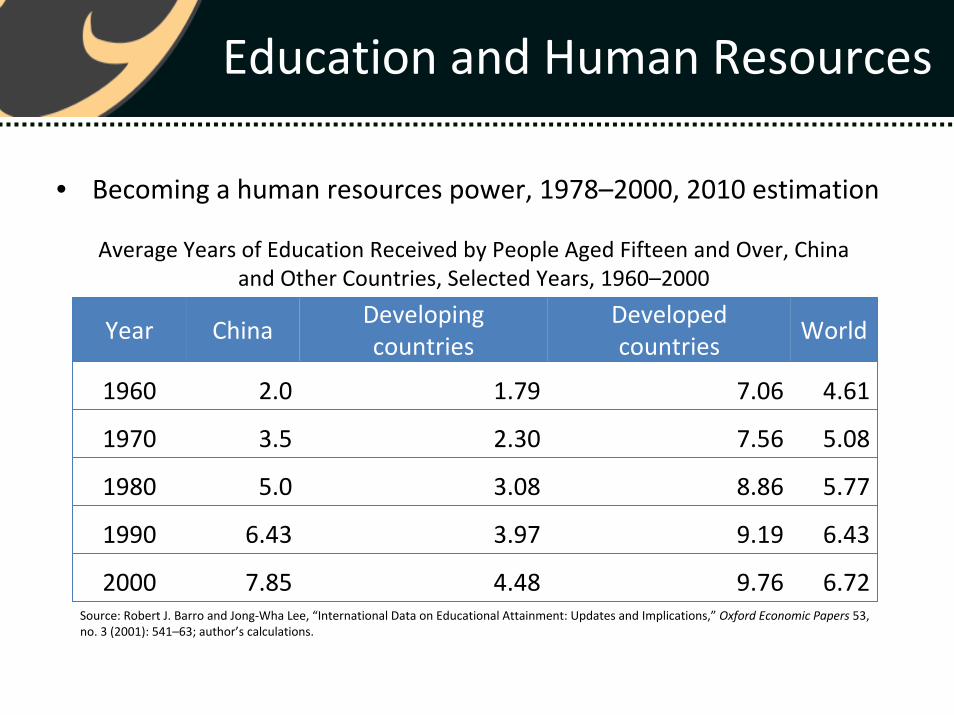
• Becoming a human resources power, 1978–2000, 2010 estimation
Year ChinaDeveloping countries
Developed countries
World
1960 2.0 1.79 7.06 4.61
1970 3.5 2.30 7.56 5.08
1980 5.0 3.08 8.86 5.77
1990 6.43 3.97 9.19 6.43
2000 7.85 4.48 9.76 6.72
Average Years of Education Received by People Aged Fifteen and Over, China and Other Countries, Selected Years, 1960–2000
Source: Robert J. Barro and Jong‐Wha Lee, “International Data on Educational Attainment: Updates and Implications,” Oxford Economic Papers 53, no. 3 (2001): 541–63; author’s calculations.

Human capital
• Average education years for 15‐64 population in selected countries (2011 estimation)
Year China USDeveloped countries
WorldChina/US
(%)1950 1.00 8.38 6.22 3.17 11.9 1960 2.00 9.15 6.81 3.65 21.9 1970 3.20 10.77 7.74 4.45 29.7 1980 5.33 12.03 8.82 5.29 44.3 1990 6.43 12.14 9.56 6.09 53.0 2000 7.85 12.71 10.65 6.98 61.8 2010 9.00 12.20 11.03 7.76 73.8 2020 10.002030 11.00 13.00 85.0
Note: 2020 and 2030 data is estimated by author.Source: Robert J. Barro and Jong‐Wha Lee, “International Data on Educational Attainment: Updates and Implications,” Oxford Economic Papers 53, no. 3 (2001): 541–63; author’s calculations.

Education and Human Resources
• Becoming a global human resources power, 2001–20
Item 1950 1960 1982 1990 2005 2020
Population aged 15‐64 (million) 337.8 363.0 625.2 762.6 888.0 996.0
Share of total (percent) 62.0 56.3 61.5 66.7 70.2 69.6
Average years of education 1.0 2.0 5.3 6.4 8.5 10.0
Human capitalPeople (billion∙year) 0.3 0.7 3.3 4.9 7.5 10.0
Share of world total (percent) 5.5 9.0 21.1 23.6 25.8 25.2
Total Human Capital, China, Selected Years, 1950–2020
Source: UN Department of Economic and Social Affairs, World Population Prospects: The 2008 Revision; National Bureau of Statistics of China, “Statistical Data of the 55 Years of New China,” China Statistical Yearbook 2006; author’s calculations.

Education and Human Resources
• How should China become the world’s leading human resources power?– It is imperative that the state accelerate the popularization of
preschool education, aiming to raise enrollment in kindergartens to over 75 percent by 2020
– It is essential to improve the quality of teachers– Equality in education should be made the most important policy goal– The educational system must be reformed, and a premium must be
placed on institutional innovation– Both international and domestic education resources should be fully
employed– An investment system should be established in which the government
is the main investor and social organizations provide supplementary support
Science, Technology, and Innovation
• Measurement of science & technology power– The first capacity is the country’s innovative capacity in science
– The second capacity is innovative capacity as regards technology
– The third capacity is the country’s capacity to use new technologies
– The fourth capacity is the capacity of a country to use global information
– The fifth capacity is the capacity of a country to invest in R&D, measured by the country’s R&D expenditures (purchasing power parity, or PPP)

Science, Technology, and Innovation
Country 1980 1985 1990 1995 2000 2004 2007
China 0.81 1.16 0.82 1.33 3.97 7.21 9.70
Japan 16.54 20.76 15.24 15.85 16.31 14.50 14.57
Germany 6.88 5.71 5.41 5.39 6.10 5.26 5.22
United Kingdom 5.95 5.38 4.27 4.29 4.35 4.04 4.06
United States 25.93 25.32 39.13 34.92 28.59 24.50 23.24
Total 56.11 58.33 64.87 61.78 59.32 55.51 56.79
USA/China gap 32.01 21.83 47.72 26.22 7.20 3.40 2.40
Japan/China gap 20.42 17.90 18.59 11.90 4.11 2.01 1.50
Science and Technology Power Shares World Total, 1980–20072010 estimation

Science, technology and innovation
• Five major indicators are used to measure science, technology and innovation power, and China will be of course a superpower by 2030 (2011 estimation)
Dimension Indicator Period Weight Data source
Human resourceScientists & engineers engaged in R&D
95‐07 1/5 UNESCOInput
Investment capacity
R&D expenditure 80‐09 1/5 OECD
Science innovation capacity
International paper 80‐09 1/5 Web of Science
Technology innovation capacity
Patent applicant filed by resident
80‐08 1/5 WIPOOutput
Market capacity High tech product export 80‐08 1/5 World Bank
Measurements of science and technology power

Science, technology and innovation
• Science and Technology power share world total (%, 1980–2009, 2011 estimation)
1980 1985 1990 1995 2000 2005 2009*
China 3.8 4.3 4.9 6.6 7.9 12.3 17.4US 24.4 23.4 24.1 22.5 21.3 19.7 20.4EU 24.2 21.7 22.1 21.1 19.6 18.3 19.7Japan 14.3 17.8 18.7 18.7 16.4 13.7 12.4USSR or Russia 11.4 9.8 6.9 3.8 3.2 2.7 3.0US/China (times) 6.4 5.4 4.9 3.4 2.7 1.6 1.2
Note: USSR, 1980‐1985; Russia, 1990‐2009.

Science, Technology, and Innovation
• Driving forces of China’s rise in science and technology– Economic and S&T globalization
– The business sector
– Government guidance and promotion
– Sustained high‐speed economic growth
– China 2020: an innovative country

Climate Change and Sustainable Growth
• China: worst victim of climate change– Natural disasters since ancient times
– Meteorological disasters
– Natural disasters and agricultural losses
– Natural disasters and economic loss
YearEconomic loss(billion yuan)
Proportion in GDP of the year (%)
Proportion in added GDP
of the year (%)
1990 66.6 3.6 40.6
1991 (flood)
121.5 5.6 39.6
1992 85.4 3.2 17.0
1993 99.3 2.9 12.4
1994 187.6 4.0 15.5
1998 (flood)
300.7 3.8 62.9
2003 (SARS)
148.2 1.1 10.9
2005 204.2 1.11 10.9
2006 252.8 1.21 10.9
2007 236.2 0.96 8.1
2008 1175.2 3.91 47.3
Direct Economic Losses Caused by Natural Disasters and their Proportion of GDP, 1990–2008
Source: National Bureau of Statistics of China, Ministry of Civil Affairs, Report of the Damage Caused by Disaster in China: 1949–1995 (1995), pp. 403–07; National Bureau of Statistics of China, Statistical Bulletin on Economic and Social Development; author’s calculations.

Climate Change and Sustainable Growth
• China: A Superpower in Greenhouse Gas Emissions
Unit: % 1960 1970 1980 1990 2005 2015 2030China 8.98 5.65 8.08 11.29 19.16 25.34 27.32EU 15.87 15.09 13.59 10.96 14.82 11.77 9.97USA 33.68 31.18 25.32 22.67 21.75 19.76 16.44Japan 2.47 4.96 4.71 4.76 4.55 3.79 2.82Russia 9.26 5.74 5.28 4.71India 1.28 1.30 1.79 3.01 4.14 5.28 7.88Total 70.16 71.23 69.14EU/China (Times) 1.77 2.67 1.68 0.97 0.77 0.46 0.36USA/China (Times) 3.75 5.52 3.13 2.01 1.14 0.78 0.60
CO2 Emissions Share World Total, Six Major Economies, Selected Years, 1960–2030
Source: World Bank, World Development Indicators 2006; International Energy Agency, World Energy Outlook 2007.

Climate Change and Sustainable Growth
• China’s roadmap for tackling climate change– Breaking the stalemate and working together to reduce emissions– Climate change policy objectives for 2020
• Energy conservation: reduce per capita GDP energy consumption by 20 percent every five years, with the 2006–20 cumulative reduction equaling 50–80 percent
• Emissions reduction: reduce discharges of major pollutants by 10 percent every five years, with the 2006–20 cumulative reduction of SO2 equaling 30–40 percent and of CO2 equaling 50 percent
• Innovative green technologies: become a collaborator, a leader, and a user• Green energy market: become the world’s largest wind power and solar
power market, become a producer and exporter of new energy technologies and equipment, and increase the use of clean energy to 20 percent of all energy consumed
• Green ecology: build the world’s biggest artificial forest carbon sink and the world’s largest green screens (shelter belts in the northeast, the north, the northwest, and the southeast coast)
– Other Policies Associated with Climate Change

Development Goals and Grand Strategy
• Basic principles and methods for goal design– People‐centered scientific development
– Modern socialist development
– Millennium development goals
– Long‐term development goals
Development Goals and Grand Strategy
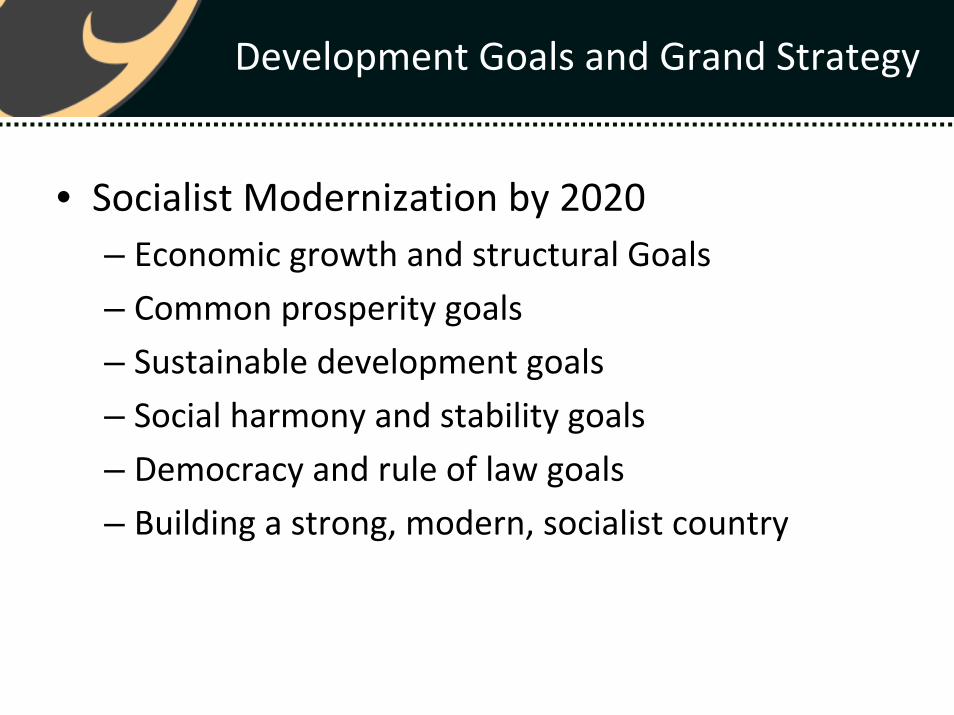
• Socialist Modernization by 2020– Economic growth and structural Goals
– Common prosperity goals
– Sustainable development goals
– Social harmony and stability goals
– Democracy and rule of law goals
– Building a strong, modern, socialist country

Development Goals and Grand Strategy
Indicator Unit Nature 2000 2005 2010 2020Economic Growth and Economic Structure (4)
GDP Growth % Expectant 8.6 9.5 11.1 7.5Urban New Employment Million Mandatory 41.1 41.8 45 100Transferred Rural Labor Million Mandatory 40 45 120Urbanization % Expectant 36.2 43 47 >55
Resources and Environment (7)Reduction of Unit GDP Energy Consumption % Mandatory 20 20Ratio of Renewable % Mandatory 5 10 17Energy Consumption %Reduction of Unit GDP CO2 Emission % Mandatory ‐20Cultivated Land Million Mandatory 1.32 1.22 1.2 1. 18Unit GDP Water Consumption M3/10,000 yuan Mandatory 515 407 255 117Forest Cover % Mandatory 16.55 18.2 >20 23.4Major Pollutants % Mandatory ‐10 (15‐20)
Science, Technology and Education (4)Patent Grants 10,000 Expectant 9.52 17. 16 30 80Average Year of education Year expectant 8.5 9 >10Gross Enrolment of Junior Secondary % Mandatory 88.6 95 97 99Rural Compulsory Education % Mandatory 100 100
Major Indicators of Top Priority for 2020

Development Goals and Grand Strategy
Indicator Unit Nature 2000 2005 2010 2020
Poverty Reduction and Public Service (3)
Rural Poverty and Low Income People Million Mandatory 14900 6000 >500
Rural People Drinking Unsafe Water Million Mandatory 300 60 >0. 2
Children Planned Immunization % Mandatory 85.3 87 >95 100
People’s Life (4)
Mean Life Expectancy Year Expectant 71.4 72 74.5 77
Urban Disposable Income Growth % Expectant 5.7 9.7 9.3 5
Rural Disposable Income Growth % Expectant 4.7 5.3 9.7 5
HDI % Expectant 0.73 0.76 0.80 0.88
Harmonious Society (4)
Public Order Case 1/100,000 Mandatory 469 750 700 600
Urban Medical Insurance Coverage % Mandatory 31 50 >60 100
Urban Old‐Age Insurance Coverage % Mandatory 45 48 >55 >85
Rural Medical Insurance Coverage % Mandatory 3.1 23.5 100 100
Major Indicators of Top Priority for 2020

China as a New Type of Superpower
• China as a new type of superpower– China should not be a superpower that seeks hegemony and world domination
– China’s rise has been defined by peaceful development– China should be a resource‐efficient, environmentally friendly superpower focused on green development
– China should be a superpower with a high human development level and a small gap between rich and poor
– China should also be a superpower with significant soft power resources
– China must be a mature and responsible superpower
Rethinking the China Dream
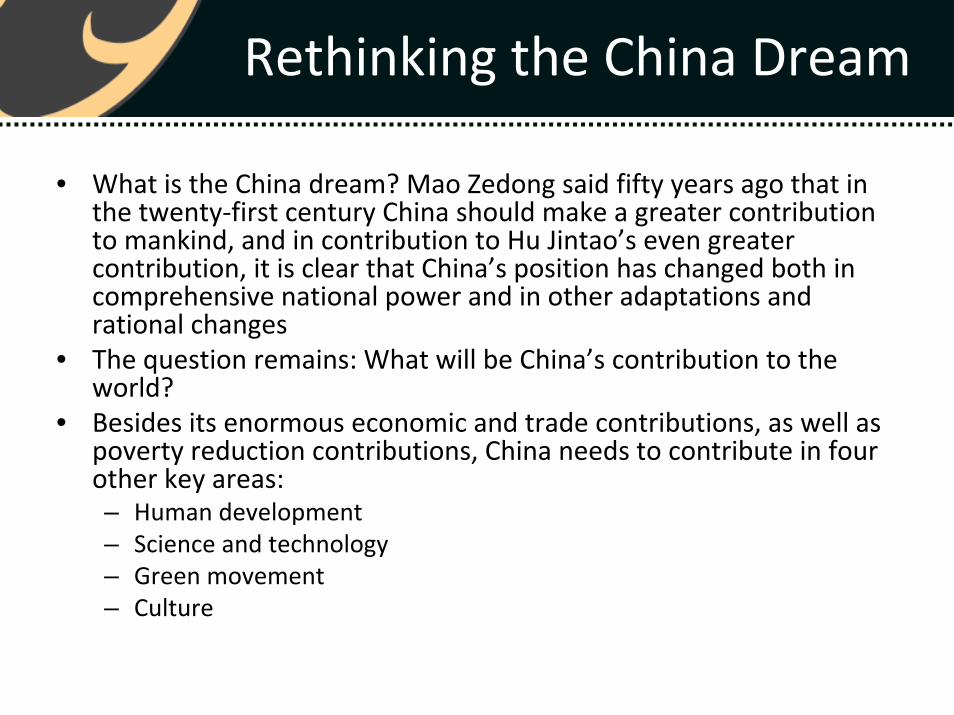
• What is the China dream? Mao Zedong said fifty years ago that inthe twenty‐first century China should make a greater contribution to mankind, and in contribution to Hu Jintao’s even greater contribution, it is clear that China’s position has changed both in comprehensive national power and in other adaptations and rational changes
• The question remains: What will be China’s contribution to the world?
• Besides its enormous economic and trade contributions, as well as poverty reduction contributions, China needs to contribute in four other key areas: – Human development– Science and technology– Green movement– Culture

Rethinking the China Dream
• These four contributions would represent China’s modern renaissance, with domestic and international significance
• Given that China has become one of the largest stakeholders in world affairs today, it is incumbent upon it not only to follow its own interests and the interests of developing countries but also to develop in a fashion consistent with the interests of developed countries