E-mail: tambov rpn@68. http//: ...skolkovo1.68edu.ru/documents/goskontrol/prikaz_931.pdfآ (ذ¸ذ»ذ¸)
Upload
united-nations-office-for-the-coordination-of-humanitarian-affairsCategory
view
213download
1description

occupied Palestinian terr itor yThe Humanitarian Monitor
December 2007
CAP
Number 20
Table of ContentsKey Issues
Regional Focus
Protection of Civilians
Child Protection
Violence & Private Property
Access
Socio-economic Conditions
Health
Food Security & Agriculture
Water & Sanitation
Education
The Response
Sources & End Notes
1 - 2
3
4-5
6-7
8
9 - 10
11 - 12
13 - 14
15 - 17
18
19
20 - 21
22 - 25
Number 20 • December 2007 • �
Overview- Key IssuesUpdate on Closure of Gaza Crossings There was a slight increase in the number of goods allowed to enter Gaza in December compared to November. A total of 1,932 truckloads of goods, including 258 from humanitarian agencies entered Gaza compared to 1,813 in November. On 23 December, Sufa crossing, which was closed on 28 October, was re-opened for food and other commodities, though some exports had been allowed entry through Sufa prior to this on an ad hoc basis. Following an agreement between Egypt, Saudi Arabia and Hamas, Rafah crossing was re-opened briefly for the exit and return of 2,335 pilgrims en route to Mecca for pilgrimage (hajj). Another 920 were able to leave through Erez and Kerem Shalom, while a further 960 were allowed to leave via Erez and Allenby Bridge.1 Also, on 31 December and I January, 202 Palestinians stuck in Egypt were allowed to cross into Gaza via Nitzana and Erez. According to Gisha, an Israeli human rights group, 1,109 students and family members wanted to leave Gaza in December for study abroad, but only 484 were granted permission, leaving 625 behind. Of the 484 granted permission to leave, 19 were turned back by Israel and 82 by Egypt. (For more details on Gaza crossing points, see Access section herein).
Update on Fuel Shortages due to Israel’s Sanctions on the Gaza StripThere was an increase in fuel imports in December but not enough to prevent the depletion of the emergency reserves of the Gaza Power Generating Company (GPGC), Gaza’s only power station, caused by sanctions imposed by Israel on the Gaza Strip. Supplies of petrol increased from 45,000 liters per day in November to 51,000 in December, and diesel went from 190,000 liters per day to 250,000. Following Israel’s decision to reduce supplies of industrial gasoline on 28 October, deliveries fell from 300,000 to 241,500 liters per day. Consumption remained at 275-295,000 liters per day. The shortfall was made up from the emergency reserve of 3,000,000 liters.2 As temperatures fell in mid-December 2007, the GPGC was unable to meet the increased demand. Most Gazan families received no power from eight to 12 hours per week.
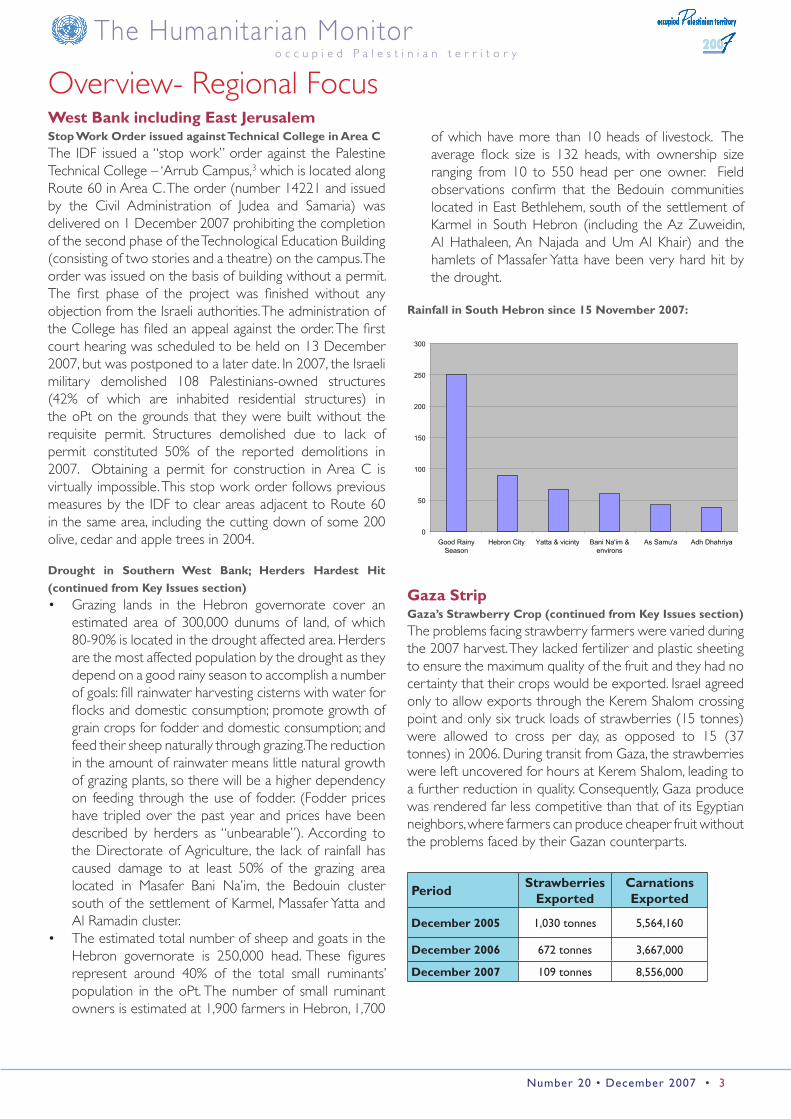
Drought in the Southern West Bank: Herders Hardest HitThe southern and eastern parts of the Hebron governorate and the eastern Bethlehem governorate are suffering from another year of drought. According to information from the Directorate of Agriculture in Hebron, the amount of rainfall in Hebron city since the beginning of the rainy season (mid-November 2007) has reached only 90 millimetres (mlm). The
normal amount for a good season would be 250 mlm. The southwestern Hebron governorate has received the least rainfall, with As Samu’ reportedly receiving 42.5 mlm and Adh Dhahiriya receiving only 39 mlm. (See graph, Rainfall in South Hebron since 15 November 2007, on p. 3 herein). The combination of drought and high fodder prices is making the livelihood of herders unsustainable. Some herders are selling all their sheep; once the breeding stock are sold, it is impossible for them to return to the herding lifestyle. Given their lack of other resources and alternative livelihood options, they are very likely to become dependent on aid. (For more details on the drought, see Regional Focus section herein.)
Gaza’s Strawberry and Carnation Crop Strawberries and carnations are among the biggest cash crops produced in Gaza. Around 300 Gazan farmers currently grow strawberries and 72 grow carnations. These farmers rely on these cash crops as their main source of income and several thousand Gazans are employed at harvest time. As a result of Israel’s economic sanctions imposed on Gaza following the June 2007 Hamas take-over, Israel barred the export of peppers and cherry tomatoes. However, in November, Israel agreed to allow the export of a limited proportion of Gaza’s output of carnations and strawberries. According to FAO, the total strawberry harvest was 1,600 tonnes, of which 109 was exported. This represents an 83.8% decrease compared to the 2006 strawberry crop and a 89.4% decrease compared
The Humanitar ian Monitoro c c u p i e d P a l e s t i n i a n t e r r i t o r y
Number 20 • December 2007 • 2
The following UN Agencies, local and international NGOs and organisations participate in sector working groups/provide information to the Humanitarian Monitor : United Nations Children’s Fund (UNICEF), United Nations Development Programme (UNDP), United Nations Development Fund for Women (UNIFEM), United Nations Educational Scientific and Cultural Organization (UNESCO), United Nations Food and Agricultural Organization (FAO), United Nations Office for the Coordination of Humanitarian Affairs (OCHA), United Nations Office for the High Commissioner of Human Rights (OHCHR), United Nations Population Fund (UNFPA), United Nations Relief and Works Agency for Palestine Refugees in the Near East (UNRWA), United Nations Special Coordinator for the Middle East Peace Process (UNSCO), World Food Programme (WFP), World Health Organization (WHO), Al Haq, Badil, Save the Children (UK), Defence for Children International – Palestine Section (DCI-PS), Oxfam GB, Palestine Hydrology Group (PHG) and members of the Temporary International Mechanism (TIM).
to 2005. Of the total 2007 crop, 150 tonnes were made into juice and 1,340 were sold on the domestic market at a reduced price. The Israeli army estimated that 123 tonnes of strawberries were exported. (For more details, see Regional Overview section herein.)
Decrease in Purchasing Power (WFP)There has been a major decrease in consumers’ purchasing power in the West Bank and Gaza Strip in 2007. The situation is worse than 2006 in both the West Bank and the Gaza Strip. According to PCBS, the unemployment rate in the Gaza Strip increased from 30.4% in the first quarter of 2007 to 32.9% in the third quarter 2007 and in the West Bank increased from 17.3 % to 18.6 %. This is combined with the steep increase in the price of all basic food commodities which force people to overuse negative copying strategies and lead to increased food insecurity levels, particularly in the Gaza Strip as confirmed by a recent WFP rapid survey.
Access of Palestinian Patients’ through Erez checkpoint during December (WHO)While Erez checkpoint was open in December for humanitarian cases, access of patients to secondary and tertiary health care services in Israel, East Jerusalem, the West Bank and Jordan was denied for some patients. According to the DCO health coordinator, permits were granted to 669 (64.3%) patients, out of the 1,041 that applied in December; 156 (15%) were denied permits for security reasons and 216 (20.7%) applications were being processed. According to the Palestinian liaison officer posted at Erez checkpoint, of those patients who received permits, 602 actually attempted to cross Erez checkpoint during the period 1- 13 and 17 - 31 December (the Muslim Eid al Adha feast took place from 14 – 16 December). Out of these, at least six patients were denied access after being questioned by the Israeli authorities at Erez checkpoint.
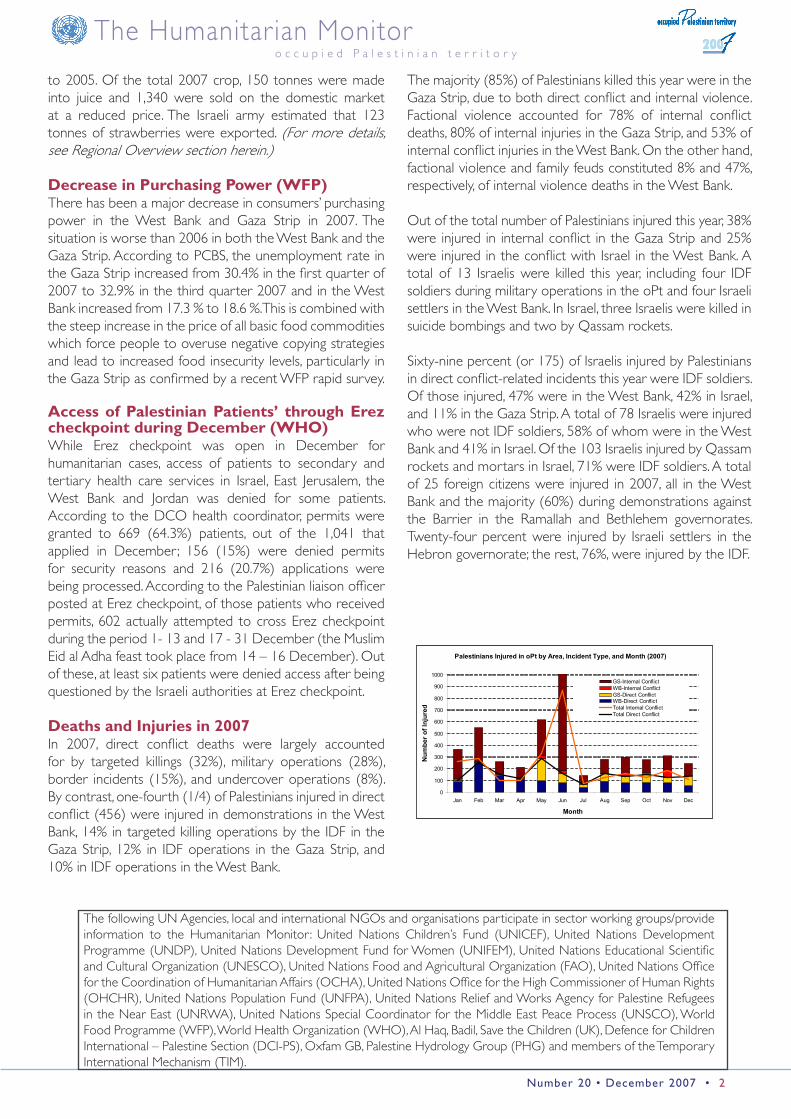
Deaths and Injuries in 2007In 2007, direct conflict deaths were largely accounted for by targeted killings (32%), military operations (28%), border incidents (15%), and undercover operations (8%). By contrast, one-fourth (1/4) of Palestinians injured in direct conflict (456) were injured in demonstrations in the West Bank, 14% in targeted killing operations by the IDF in the Gaza Strip, 12% in IDF operations in the Gaza Strip, and 10% in IDF operations in the West Bank.
The majority (85%) of Palestinians killed this year were in the Gaza Strip, due to both direct conflict and internal violence. Factional violence accounted for 78% of internal conflict deaths, 80% of internal injuries in the Gaza Strip, and 53% of internal conflict injuries in the West Bank. On the other hand, factional violence and family feuds constituted 8% and 47%, respectively, of internal violence deaths in the West Bank.
Out of the total number of Palestinians injured this year, 38% were injured in internal conflict in the Gaza Strip and 25% were injured in the conflict with Israel in the West Bank. A total of 13 Israelis were killed this year, including four IDF soldiers during military operations in the oPt and four Israeli settlers in the West Bank. In Israel, three Israelis were killed in suicide bombings and two by Qassam rockets.
Sixty-nine percent (or 175) of Israelis injured by Palestinians in direct conflict-related incidents this year were IDF soldiers. Of those injured, 47% were in the West Bank, 42% in Israel, and 11% in the Gaza Strip. A total of 78 Israelis were injured who were not IDF soldiers, 58% of whom were in the West Bank and 41% in Israel. Of the 103 Israelis injured by Qassam rockets and mortars in Israel, 71% were IDF soldiers. A total of 25 foreign citizens were injured in 2007, all in the West Bank and the majority (60%) during demonstrations against the Barrier in the Ramallah and Bethlehem governorates. Twenty-four percent were injured by Israeli settlers in the Hebron governorate; the rest, 76%, were injured by the IDF.
Palestinians Injured in oPt by Area, Incident Type, and Month (2007)
0
100
200
300
400
500
600
700
800
900
1000
Jan Feb Mar Apr May Jun Jul Aug Sep Oct Nov Dec
Month
Num
ber o
f Inj
ured
GS-Internal ConflictWB-Internal ConflictGS-Direct ConflictWB-Direct ConflictTotal Internal ConflictTotal Direct Conflict
The Humanitar ian Monitoro c c u p i e d P a l e s t i n i a n t e r r i t o r y
Number 20 • December 2007 • �
Overview- Regional FocusWest Bank including East JerusalemStop Work Order issued against Technical College in Area C The IDF issued a “stop work” order against the Palestine Technical College – ‘Arrub Campus,3 which is located along Route 60 in Area C. The order (number 14221 and issued by the Civil Administration of Judea and Samaria) was delivered on 1 December 2007 prohibiting the completion of the second phase of the Technological Education Building (consisting of two stories and a theatre) on the campus. The order was issued on the basis of building without a permit. The first phase of the project was finished without any objection from the Israeli authorities. The administration of the College has filed an appeal against the order. The first court hearing was scheduled to be held on 13 December 2007, but was postponed to a later date. In 2007, the Israeli military demolished 108 Palestinians-owned structures (42% of which are inhabited residential structures) in the oPt on the grounds that they were built without the requisite permit. Structures demolished due to lack of permit constituted 50% of the reported demolitions in 2007. Obtaining a permit for construction in Area C is virtually impossible. This stop work order follows previous measures by the IDF to clear areas adjacent to Route 60 in the same area, including the cutting down of some 200 olive, cedar and apple trees in 2004.
Drought in Southern West Bank; Herders Hardest Hit (continued from Key Issues section)
Grazing lands in the Hebron governorate cover an estimated area of 300,000 dunums of land, of which 80-90% is located in the drought affected area. Herders are the most affected population by the drought as they depend on a good rainy season to accomplish a number of goals: fill rainwater harvesting cisterns with water for flocks and domestic consumption; promote growth of grain crops for fodder and domestic consumption; and feed their sheep naturally through grazing. The reduction in the amount of rainwater means little natural growth of grazing plants, so there will be a higher dependency on feeding through the use of fodder. (Fodder prices have tripled over the past year and prices have been described by herders as “unbearable”). According to the Directorate of Agriculture, the lack of rainfall has caused damage to at least 50% of the grazing area located in Masafer Bani Na’im, the Bedouin cluster south of the settlement of Karmel, Massafer Yatta and Al Ramadin cluster. The estimated total number of sheep and goats in the Hebron governorate is 250,000 head. These figures represent around 40% of the total small ruminants’ population in the oPt. The number of small ruminant owners is estimated at 1,900 farmers in Hebron, 1,700
•
•
of which have more than 10 heads of livestock. The average flock size is 132 heads, with ownership size ranging from 10 to 550 head per one owner. Field observations confirm that the Bedouin communities located in East Bethlehem, south of the settlement of Karmel in South Hebron (including the Az Zuweidin, Al Hathaleen, An Najada and Um Al Khair) and the hamlets of Massafer Yatta have been very hard hit by the drought.
Rainfall in South Hebron since 15 November 2007:
0
50
100
150
200
250
300
Good RainySeason
Hebron City Yatta & vicinty Bani Na'im &environs
As Samu'a Adh Dhahriya
Gaza StripGaza’s Strawberry Crop (continued from Key Issues section) The problems facing strawberry farmers were varied during the 2007 harvest. They lacked fertilizer and plastic sheeting to ensure the maximum quality of the fruit and they had no certainty that their crops would be exported. Israel agreed only to allow exports through the Kerem Shalom crossing point and only six truck loads of strawberries (15 tonnes) were allowed to cross per day, as opposed to 15 (37 tonnes) in 2006. During transit from Gaza, the strawberries were left uncovered for hours at Kerem Shalom, leading to a further reduction in quality. Consequently, Gaza produce was rendered far less competitive than that of its Egyptian neighbors, where farmers can produce cheaper fruit without the problems faced by their Gazan counterparts.
PeriodStrawberries
ExportedCarnations Exported
December 2005 �,0�0 tonnes 5,564,�60
December 2006 672 tonnes �,667,000
December 2007 �09 tonnes 8,556,000

The Humanitar ian Monitoro c c u p i e d P a l e s t i n i a n t e r r i t o r y
Number 20 • December 2007 • 4
Protection of civilians analysis
The number of Palestinian killed due to the Palestinian-Israeli conflict in December was more than twice as high as those killed during the preceding month (62 vs. 28) and included a woman who was killed when the IDF opened fire at a group of pilgrims who had just entered Gaza via Erez crossing. The increase was more pronounced in the Gaza Strip (58 vs. 25), making December the month with the highest Gaza Strip death toll due to the conflict with Israel this year. For the first time since January 2005, there were no direct conflict-related deaths in the northern West Bank this month. Two Israelis from the settlement of Kiryat Araba’ were killed in Hebron in December, bringing the number of Israeli deaths this year to 13.
Direct conflict injuries decreased by 31% in the West Bank in December. About 45% of these injuries and all the injuries among foreign citizens (4) took place during demonstrations against the Barrier in the Ramallah governorate. By contrast, there was a 64% increase in direct conflict injuries in the Gaza Strip in December; while the number of Palestinians injured in targeted killing operations remained relatively stable (34 vs. 33), there was a rise in the number of those injured during IDF ground operations (27 vs. 5) that can account for the overall increase in injuries.
A total of 20 Israelis were injured this month, a three-fold increase compared to November. This can be largely attributed to a sharp increase in the number of IDF soldiers injured during IDF military operations in the Gaza Strip (8 vs. 1) as well as an increase in the number of Israelis injured by Qassam rockets (2 Israeli citizens vs. 0 in November) and mortar shells (4 IDF soldiers vs. 0 in November) fired towards Israel.
Compared to November, there was a slight increase in internal conflict deaths in both the West Bank (3 vs. 1) and the Gaza Strip (12 vs. 11). Factional violence in the Gaza Strip accounted for 40% of these deaths (6 out of 15).
Internal conflict injuries fell by 39% this month, which can be partly explained by a significant drop in injuries due to factional violence in both the West Bank (0 vs. 62) and the Gaza Strip (58 vs. 94).
Protection of Civilians
Palestinians Killed in the West Bank by Conflict Type and Month, 2007
11
3
10
2
4
6
8
10
12
Jan Feb Mar Apr May Jun Jul Aug Sep Oct Nov Dec
Month (2007)
Num
ber K
illed
WB-direct
WB-internal
Communities in the ‘buffer zone’ at risk of displacement - Gaza Strip Communities living in the Israeli-imposed ‘buffer zone’ (no-go area) along the boundary with Israel in the occupied Gaza Strip are at risk of displacement. Hundreds of families have already been forcibly displaced as a result of home and property demolitions, incursions and fear of attacks, such as in al-Shoka, while those remaining live in fear. Men and boys often sleep in mosques and other buildings outside their homes for fear of detention and interrogation during night incursions by the IDF, leaving women and girls alone in the house. This situation severely affects the right to family life and the well-being of children. There is no clear delimitation of the ‘buffer zone’; this is left to the discretion of soldiers, but it varies between 150 and 1,000 meters. This situation also prevents farmers from accessing their land and has seriously aggravated the economic situation of these communities. The Israeli army imposed this ‘buffer zone’ through home and property demolitions, land leveling, and exposure to direct fire, all of which are factors contributing to the forcible displacement of Palestinian communities.
Palestinians Killed in the Gaza Strip by Conflict Type and Month, 2007
12
188
58
0
50
100
150
200
Jan Feb Mar Apr May Jun Jul Aug Sep Oct Nov Dec
Month (2007)
Num
ber K
illed
GS-internal
GS-direct

The Humanitar ian Monitoro c c u p i e d P a l e s t i n i a n t e r r i t o r y
Number 20 • December 2007 • 5
Total 2005
(monthly average)
Total 2006
(monthly average)
Total 2007
(monthly average)
Jan- 07
Feb - 07
Mar-07
A p r-07
May-07
J u n -07
Ju ly -07
Aug-07
S e p -07
Oct -07
Nov-07
Dec-07
Number of Palestinian deaths - direct conflict�
West Bank
2�6(�8)
678(57)
�96(��)
8 �� 7 9 8 �0 6 �0 7 �0 � 4
Gaza Strip � 2 2 �0 54 �0 2� �7 �0 27 25 58
Israel � 0 0 0 � 0 0 0 0 0 2 0
Number of Palestinian injuries - direct conflict
West Bank �260(�05)
��94(266)
�84�(�5�)
89 25� �4� �09 94 76 �8 92 79 8� 77 5�
Gaza Strip �5 5 �2 6 �87 86 29 62 56 7� 50 84
Number of Israeli deaths - direct conflict
oPt 48(4)
25(2)
��(�)
0 � 0 0 0 0 � 0 � 2 � 2
Israel � 0 0 0 2 0 0 0 0 0 0 0
Number of Israeli injuries - direct conflict
oPt484(40)
�77(��)
�22(27)
�0 �5 �4 22 �0 �8 � 54 �8 �� 6 �4
Israel 2 0 � 0 20 � 4 2 69 0 0 6
Number of Palestinian deaths - internal violence2
West Bank �2(>�)
�46(�2)
490(4�)
2 0 0 � 7 5 4 � 4 8 � �
Gaza Strip 54 48 �6 �6 6� �88 �� �� 8 �6 �� �2
Number of Palestinian injuries - internal violence
West Bank ��0(��)
87�(76)
2726(227)
�2 5 2 �0 25 25 �8 7 24 �� 64 2
Gaza Strip 249 285 �02 88 �08 84� 56 ��9 ��9 �09 ��6 �07
Average weekly IDF searches, arrests and detentions in the West Bank3
Search CampaignsAve
Weekly (6�)
Ave Weekly (�09)
Ave Weekly (�0�)
�08 ��5 �27 �26 �24 �0� 86 98 9� 78 89 7�
Arrests and Detentions
Ave Weekly
(74)
Ave Weekly (�0�)
Ave Weekly
(96)�2� �55 �2� 88 �05 78 65 9� 84 7� 88 8�
For more information please contact OHCHR, (02) 29655�4 or OCHA, (02) 582 9962 (Catherine Cook or Mai Yassin)
Protection of Civilians “All activities aimed at ensuring full respect for the rights of the individuals in accordance with international human rights law, international humanitarian law and refugee law.”a

The Humanitar ian Monitoro c c u p i e d P a l e s t i n i a n t e r r i t o r y
Number 20 • December 2007 • 6
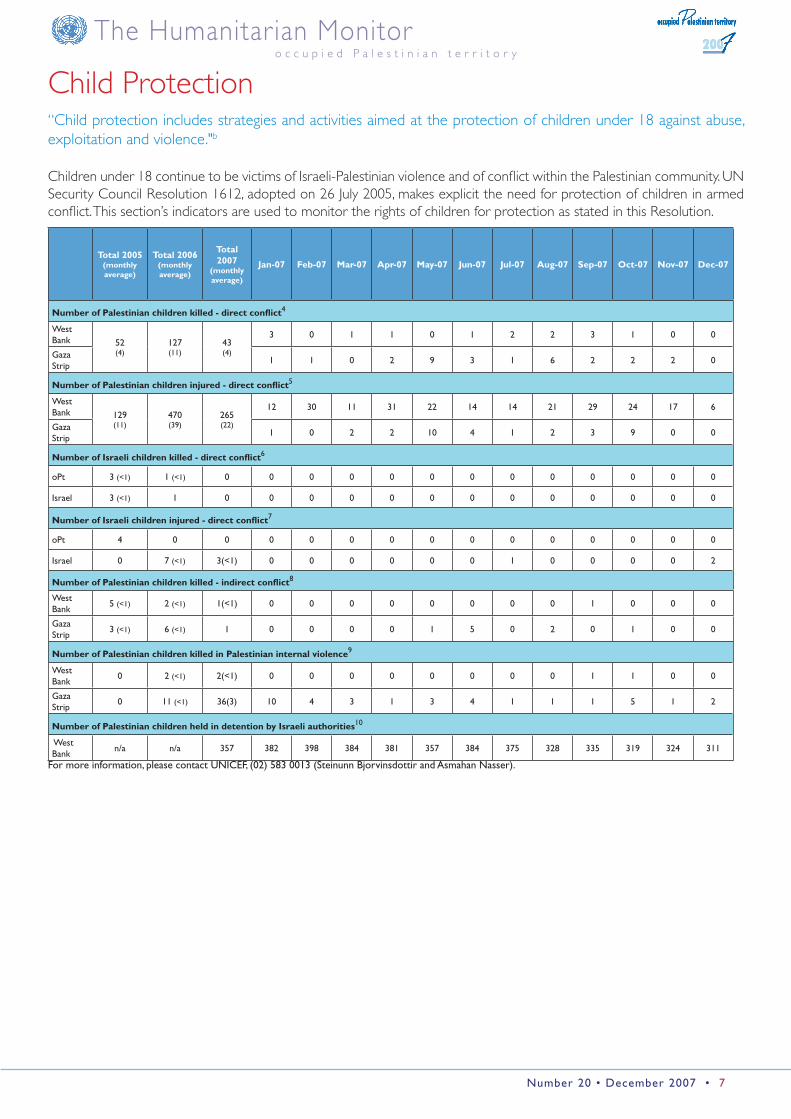
Two Palestinian children were killed in December due to internal conflict in the Gaza Strip. One 15-year-old boy was found dead on 6 December after being kidnapped by a rival family in Rafah three days earlier. The other child (aged 12 years) was killed on 31 December when armed Fatah men opened fire towards the Gaza police affiliated with the dismissed Hamas government west of Khan Younis. December 2007 was first month since March 05 that no Palestinian child was killed by either the IDF or Israeli settlers. December fatalities bring the total number of Palestinian children killed in 2007 to 93 and the total number of Palestinian children killed since the beginning of the second Intifada to 944.4 Some 31% of Palestinian child deaths in 2007 were carried out by the IDF in the Gaza Strip, 23% by Palestinians in factional violence incidents in the Gaza Strip, 15% by the IDF in the West Bank, and 7% by unexploded ordnance (UXO) left by the IDF in the Gaza Strip. Over the past three years, the percentage of children killed by the IDF has decreased and that killed by Palestinians has increased. No Israeli child was killed in 2007.
A total of seven Palestinian children were injured in December 2007, the lowest monthly figure since January 2006. Six were injured in the conflict with Israel in the West Bank and one was injured as a result of tampering with a homemade bomb in Khan Younis. This brings the total number of Palestinian children injured in 2007 to 345, which is 33% less than the 2006 total, but twice as high as the 2005 figure.
During 2007, 70% of injured Palestinian children were injured by the IDF, 14% by Palestinians in internal violence, 8% by Israeli settlers in the West Bank and 7% by UXO. Three Israeli children were injured in 2007 (1 in July and 2 in December), all by Qassam rockets fired from the Gaza Strip towards Israel.
A total of 97 inhabited residential structures were reportedly demolished in 2007, leading to the displacement of more than 720 people, including at least 240 children.
Palestinian Children in Israeli Detention in 2007During 2007, the Israeli army arrested around 700 Palestinian children. Of these, some 30 children were held on administrative detention orders (detention without charge or trial). The number of children arrested in 2007 brings the total number of Palestinian children arrested by Israel since the beginning of the second Intifada in September 2000 to approximately 5,900. At any given time during the year 2007, there were between 310 and 430 Palestinian children held in Israeli prisons and detention centres, with 311 held at the end of the year. Of these, 192 were being held pending trial, 101 were serving sentences and 18 were serving administrative detention terms.
Israeli authorities continued to violate human rights norms in their treatment of Palestinian child political prisoners in 2007. Violations were perpetrated during the arrest and interrogation period, during military court proceedings as well as during incarceration, and included: arbitrary detention, exposure to physical abuse and humiliating treatment during arrest and exposure to physical and psychological abuse during interrogation. Additionally, children are often deprived from communicating with the outside world for prolonged periods of time (in cases, weeks or months at a time) through the denial of family visits. This is particularly the case during interrogation and while incarcerated in pre-trial detention and interrogation centres. Also, Palestinian child political prisoners are usually deprived of their right to a fair trial. Of particular concern, confessions are often extracted from children through coercion. According to attorneys representing these children in Israeli military courts, military court judges generally do not question the means by which confessions are extracted and, thus, whether they can be entered as proof for indictment and be used as a basis for conviction.
Child Protection
Palestinian Children Killed by Party Responsible,2005-2007
49
130
43
14
425
020406080
100120140160180
2005 2006 2007Year
Num
ber
Kill
ed
0102030405060708090
Per
cent
age
kille
d
Other
Pal
Isr-Settler
IDF
% by IDF
% by Pal
The Humanitar ian Monitoro c c u p i e d P a l e s t i n i a n t e r r i t o r y
Number 20 • December 2007 • 7
Child Protection “Child protection includes strategies and activities aimed at the protection of children under 18 against abuse, exploitation and violence."b
Children under 18 continue to be victims of Israeli-Palestinian violence and of conflict within the Palestinian community. UN Security Council Resolution 1612, adopted on 26 July 2005, makes explicit the need for protection of children in armed conflict. This section’s indicators are used to monitor the rights of children for protection as stated in this Resolution.
Total 2005
(monthly average)
Total 2006(monthly average)
Total 2007
(monthly average)
Jan-07 Feb-07 Mar-07 Apr-07 May-07 Jun-07 Jul-07 Aug-07 Sep-07 Oct-07 Nov-07 Dec-07
Number of Palestinian children killed - direct conflict4
West Bank 52
(4)�27(��)
4�(4)
� 0 � � 0 � 2 2 � � 0 0
Gaza Strip
� � 0 2 9 � � 6 2 2 2 0
Number of Palestinian children injured - direct conflict5
West Bank �29
(��)470(�9)
265(22)
�2 �0 �� �� 22 �4 �4 2� 29 24 �7 6
Gaza Strip
� 0 2 2 �0 4 � 2 � 9 0 0
Number of Israeli children killed - direct conflict6
oPt � (<�) � (<�) 0 0 0 0 0 0 0 0 0 0 0 0 0
Israel � (<�) � 0 0 0 0 0 0 0 0 0 0 0 0 0
Number of Israeli children injured - direct conflict7
oPt 4 0 0 0 0 0 0 0 0 0 0 0 0 0 0
Israel 0 7 (<�) �(<�) 0 0 0 0 0 0 � 0 0 0 0 2
Number of Palestinian children killed - indirect conflict8
West Bank
5 (<�) 2 (<�) �(<�) 0 0 0 0 0 0 0 0 � 0 0 0
Gaza Strip
� (<�) 6 (<�) � 0 0 0 0 � 5 0 2 0 � 0 0
Number of Palestinian children killed in Palestinian internal violence9
West Bank
0 2 (<�) 2(<�) 0 0 0 0 0 0 0 0 � � 0 0
Gaza Strip
0 �� (<�) �6(�) �0 4 � � � 4 � � � 5 � 2
Number of Palestinian children held in detention by Israeli authorities�0
West Bank
n/a n/a �57 �82 �98 �84 �8� �57 �84 �75 �28 ��5 ��9 �24 ���
For more information, please contact UNICEF, (02) 58� 00�� (Steinunn Bjorvinsdottir and Asmahan Nasser).
The Humanitar ian Monitoro c c u p i e d P a l e s t i n i a n t e r r i t o r y
Number 20 • December 2007 • 8
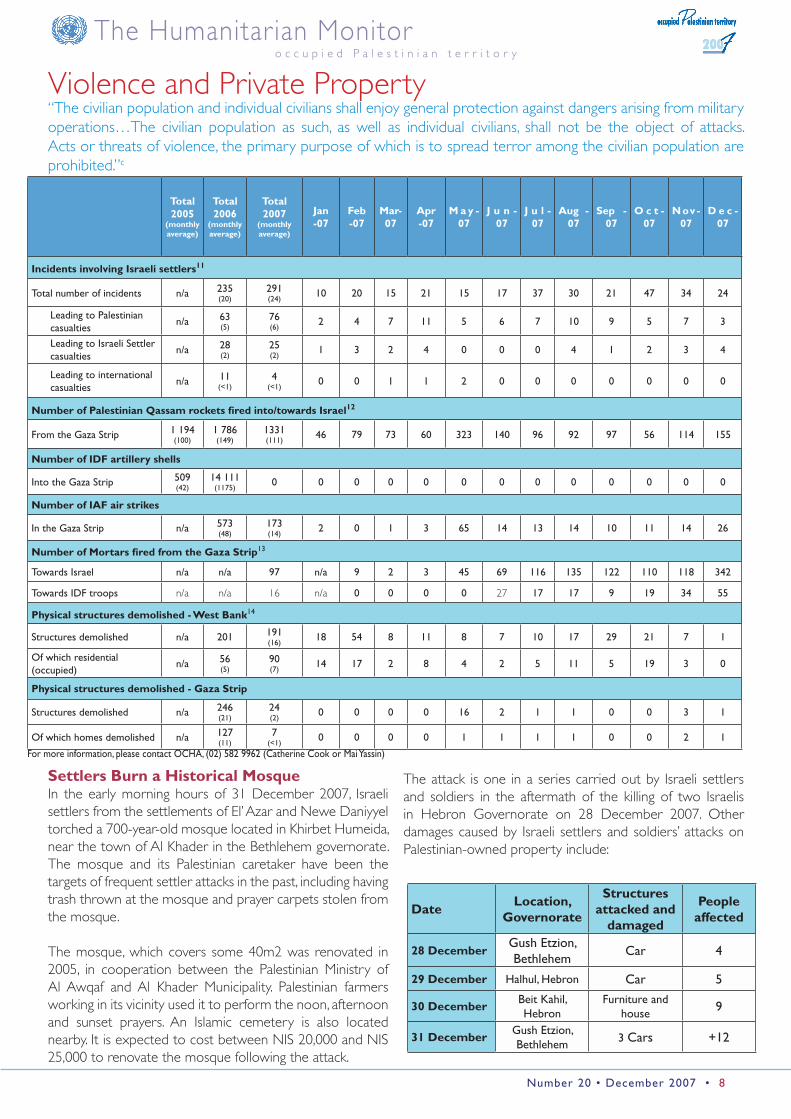
Violence and Private Property“The civilian population and individual civilians shall enjoy general protection against dangers arising from military operations…The civilian population as such, as well as individual civilians, shall not be the object of attacks. Acts or threats of violence, the primary purpose of which is to spread terror among the civilian population are prohibited.”c
Total 2005
(monthly average)
Total2006
(monthly average)
Total2007
(monthly average)
Jan -07
Feb -07
Mar-07
Apr -07
M a y -07
J u n -07
J u l - 07
Aug - 07
Sep -07
O c t -07
Nov -07
D e c -07
Incidents involving Israeli settlers11
Total number of incidents n/a 2�5(20)
29�(24)
�0 20 �5 2� �5 �7 �7 �0 2� 47 �4 24
Leading to Palestinian casualties
n/a 6�(5)
76(6)
2 4 7 �� 5 6 7 �0 9 5 7 �
Leading to Israeli Settler casualties
n/a 28(2)
25(2)
� � 2 4 0 0 0 4 � 2 � 4
Leading to international casualties
n/a ��(<�)
4(<�)
0 0 � � 2 0 0 0 0 0 0 0
Number of Palestinian Qassam rockets fired into/towards Israel12
From the Gaza Strip � �94(�00)
� 786(�49)
����(���)
46 79 7� 60 �2� �40 96 92 97 56 ��4 �55
Number of IDF artillery shells
Into the Gaza Strip 509(42)
�4 ���(��75)
0 0 0 0 0 0 0 0 0 0 0 0 0
Number of IAF air strikes
In the Gaza Strip n/a 57�(48)
�7�(�4)
2 0 � � 65 �4 �� �4 �0 �� �4 26
Number of Mortars fired from the Gaza Strip��
Towards Israel n/a n/a 97 n/a 9 2 � 45 69 ��6 ��5 �22 ��0 ��8 �42
Towards IDF troops n/a n/a 16 n/a 0 0 0 0 27 �7 �7 9 �9 �4 55
Physical structures demolished - West Bank�4
Structures demolished n/a 20� �9�(�6)
�8 54 8 �� 8 7 �0 �7 29 2� 7 �
Of which residential (occupied)
n/a 56(5)
90(7)
�4 �7 2 8 4 2 5 �� 5 �9 � 0
Physical structures demolished - Gaza Strip
Structures demolished n/a 246(2�)
24(2)
0 0 0 0 �6 2 � � 0 0 � �
Of which homes demolished n/a �27(��)
7(<�)
0 0 0 0 � � � � 0 0 2 �
For more information, please contact OCHA, (02) 582 9962 (Catherine Cook or Mai Yassin)
Settlers Burn a Historical MosqueIn the early morning hours of 31 December 2007, Israeli settlers from the settlements of El’ Azar and Newe Daniyyel torched a 700-year-old mosque located in Khirbet Humeida, near the town of Al Khader in the Bethlehem governorate. The mosque and its Palestinian caretaker have been the targets of frequent settler attacks in the past, including having trash thrown at the mosque and prayer carpets stolen from the mosque.
The mosque, which covers some 40m2 was renovated in 2005, in cooperation between the Palestinian Ministry of Al Awqaf and Al Khader Municipality. Palestinian farmers working in its vicinity used it to perform the noon, afternoon and sunset prayers. An Islamic cemetery is also located nearby. It is expected to cost between NIS 20,000 and NIS 25,000 to renovate the mosque following the attack.
The attack is one in a series carried out by Israeli settlers and soldiers in the aftermath of the killing of two Israelis in Hebron Governorate on 28 December 2007. Other damages caused by Israeli settlers and soldiers’ attacks on Palestinian-owned property include:
DateLocation,
Governorate
Structures attacked and
damaged
People affected
28 DecemberGush Etzion, Bethlehem
Car 4
29 December Halhul, Hebron Car 5
30 DecemberBeit Kahil, Hebron
Furniture and house 9
31 DecemberGush Etzion, Bethlehem � Cars +�2

The Humanitar ian Monitoro c c u p i e d P a l e s t i n i a n t e r r i t o r y
Number 20 • December 2007 • 9
Access “Everyone has the right of freedom of movement and residence within the borders of each State. Everyone has the right to leave any country, including his own, and to return to his country.”d
The West Bank Barrier
57% Completed
0 km 72�kmsource: OCHA, January 2008
Monthlyaverage
2005
Monthlyaverage
2006
Monthlyaverage
2007
Jan-07
Feb - 07
Mar-07
Apr-07
May-07
J u n -07
J u l -07
Aug-07
Sep-07
Oct-07 Nov-07D e c -
07
IDF Physical obstacles in the West Bank�5
Manned 62 74 86 82 84 84 86 86 85 86 86 88 87 87 87
Unmanned 4�0 445 467 446 466 465 45� 467 47� 455 477 475 474 476 476
Total 472 5�8 552 528 550 549 5�9 55� 556 54� 56� 56� 56� 56� 56�
Average weekly Random or ‘Flying’ checkpoints
7� ��6 ��� ��4 �56 �6� �75 �4� �05 �07 �00 �04 70 74 50
Curfews imposed by IDF16
No. Incidents - West Bank 9 4 5 2 � 4 4 5 8 0 � 2 5 �7 ��
Total hours under curfew - West Bank
�26 40 7� 28 9� 2� 20 48 79 0 27 77 27 �62 9�
No. Incidents - Gaza Strip 0 0 0 0 0 0 0 0 0 0 0 0 0 0 0
Total hours under curfew - Gaza Strip
0 �8 0 0 0 0 0 0 0 0 0 0 0 0 0
Access incidents reported by humanitarian organisations17
Access incidents reported in the West Bank n/a 79 40 �8 46 28 42 �4 �8 47 46 4� �6 4� 47
Average reported time to exit the Gaza Strip via Erez, in minutes.
n/a n/a n/a 47 8� 44 n/a n/a n/a n/a n/a n/a n/a n/a n/a
Ambulances incidents in the West Bank and access for medical referrals from the Gaza Strip to West Bank and Israel18
Ambulance access delays reported at West Bank checkpoints
n/a �0 28 �5 26 �� 25 �6 �9 44 �7 27 22 28 n/a
Ambulance access denial reported at West Bank checkpoints
n/a 9 2� �6 25 9 �4 24 �2 40 27 20 �9 25 n/a
MoH medical referral requests (via Erez ) n/a 459 7�5 506 595 68� 5�5 7�7 4�� 872 985 715 1103 n/a 1041
Actual no. of medical referrals recieving permits to cross (via Erez)
n/a 4�6 598 452 540 596 460 664 �69 777 787 591 850 n/a 669
Actual no. of medical referrals who approached Palesinian side to cross via Erez (number reported being denied passage on Israeli side)
n/a n/a n/a n/a n/a n/a n/a n/a n/a n/a n/a n/a789(27)
656(16)
602(6)
Access for Palestinians to East Jerusalem and Israel from oPt19
West Bank (total closure days) n/a n/a n/a 0 0 5 �� � 0 0 0 �0 0 n/a n/a
Gaza Strip (total closure days) n/a �7 n/a 0 0 4 4 � �7 �� �� �0 �� �0 ��
Movement of people from/to Gaza Strip - daily average20
Workers to Israel - Erez �029 �78 n/a 0 0 0 0 0 0 0 0 0 0 0 n/a
Traders to Israel - Erez �07 42 n/a 24� 290 �52 �57 ��8 262 0 n/a 0 5 n/a n/a
Rafah - daily crossing out n/a 42� n/a ��8 240 4�0 �8� �04 200 0 0 0 0 0 n/a
Rafah daily crossing in n/a 424 n/a 270 ��9 �09 �45 294 �25 0 0 0 0 0 n/aFor more information, please contact OCHA, (02) 582 9962 (Ray Dolphin)

The Humanitar ian Monitoro c c u p i e d P a l e s t i n i a n t e r r i t o r y
Number 20 • December 2007 • �0
Access “Everyone lawfully within the territory of a State shall, within that territory, have the right to liberty of movement and freedom to choose his residence.”e
Monthly average
2005
Monthly average
2006
Monthly average
2007
Feb- 07
Mar-07
Apr-07
May-07
Jun-07
Jul-07
Aug-07
Sep-07
Oct-07
Nov-07
Dec-07
Functioning of the Gaza Strips crossing points - percentage of days open/sheduled days open2�
Rafah crossing n/a 57% n/a 25% 48% �7% 26% �8% 0% 0% 0% 0% 0% n/a
Karni crossing n/a 71% n/a 92% 92% 96% 85% 46% 26% 0% 0% 0% 0% n/a
Sufa crossing n/a 60% n/a 96% 29% �6% 4�% �5% �00% 95% 68% �2% n/a n/a
Nahal Oz energy pipelines n/a n/a n/a �00% 96% �00% 96% 92% �00% 96% �00% 96% n/a n/a
Movement of goods trough Karni crossing - daily average22
Karni import - commercial truckloads incl. humanitarian supplies n/a 156 n/a 2�2 2�8 25� 2�0 84 �� �0 �9 24 25 n/a
Karni export - commercial truckloads incl. humanitarian supplies n/a 17 n/a 52 44 5� 25 �2 0 0 0 0 0 n/a
Other imports into the Gaza Strip - total2�
Sufa import - aggregates (construction materials) truckloads 3 527 1 598 n/a �257 �0�4 n/a n/a n/a n/a 0 0 0 0 n/a
Nahal Oz import - Fuel truckloads n/a 583 n/a 7�4 60� n/a n/a n/a 52� 474 �96 472 40� n/a
Economic/access data for the West Bank are being investigated by OCHAFor more information, please contact OCHA, (02) 582 9962 (Ray Dolphin).
2007 TrendsThe number of reported cases of ambulance access delays almost tripled between 2006 and 2007 (10 vs. 28) and the number of reported cases of ambulance access denials more than doubled (9 vs. 23) at West Bank checkpoints. While there was an increase in the average monthly number of MoH medical referral permits granted to cross Erez Crossing between 2006 and 2007 (416 vs. 598), the proportion of patients that were granted permits, out of those who applied, has decreased from some 90% of applicants in 2006 to 81% of applicants in 2007(see Access table on preceding page for detailed figures).
Gaza CrossingsKarni crossing, which before June 2007 was the main entry point for goods to and from Gaza, remained closed apart from the operation of a single conveyor belt outside the crossing for wheat grain and animal feed, which operates on average two days a week.From 23-31 December, 175 truckloads of imports, including 87 from humanitarian agencies passed through Sufa crossing. Prior to this, from 1-23 December, 389 truckloads of imports had been allowed to enter Gaza
•
•
•
•
through Sufa on an ad hoc basis. These included 5,400 tonnes of aggregate for the Beit Lahia waste-water treatment plant and 85 truckloads of livestock.Kerem Shalom was open for 744 truckloads of imports, including 156 from humanitarian agencies (figures until December 25).Erez remained closed to Palestinians except those with special coordination from the IDF, such as medical cases, traders and students and a number of pilgrims en route to Mecca.
•
•

The Humanitar ian Monitoro c c u p i e d P a l e s t i n i a n t e r r i t o r y
Number 20 • December 2007 • ��
Socio-economic Conditions
Anecdotal evidence of unemployment, poverty and socio-cultural changes reported by UNRWA
As a result of deteriorating socio-economic conditions, since July 2007 the Ministry of Social Affairs (MoSA) has noticed a major increase in the number of requests for assistance in the Ramallah area, which the Ministry is unable to absorb. MoSA social workers reported deteriorating living conditions in Ramallah and surrounding villages. An increasing number of people live in sub-standard housing, without proper windows, bathroom doors, and with little or broken furniture. Hygienic standards within homes are also reportedly poor. Many people rely only on charitable assistance and are unable to pay utility bills. Reliance on MoSA assistance increased following the closure in December of numerous Palestinian charities in the West Bank by the Palestinian Authority. MoSA staff reported that people often show up at central administrative offices in Ramallah as a last resort to receive assistance.Newly poor households seem to be on the rise, particularly in the rural villages west of Ramallah, as more people remain unemployed following construction of the Barrier. Access to the Israeli labour market gradually decreased as construction of the Barrier progressed through the area. Many Palestinians, including individual contractors who used to earn NIS 6,000-10,000 a month, have lost their source of income as opportunities to work in Israel diminished.According to MoSA social workers, anecdotal evidence suggests that the number of Palestinians who are migrating from northern governorates of the West Bank is on the rise. While some are reportedly moving to the Gulf region or to North America, internal migration seems to be the first option for many. In recent months, Ramallah city witnessed the increased influx of residents from the northern West Bank, and occasionally from the south. Bedouin from Al-Ka’abne tribe moved from Ad-Dhahiriya in the Hebron governorate and Hebron western slopes to Ein Arik, Ein Qinya, Deir Ibzi, Ein Sinya in Ramallah looking for land for grazing and water, and they are currently living in tents. Often in destitute conditions, newcomers frequently accept to work for very low salaries, thus causing tension with Ramallah residents. Others have opened new businesses in the city and are employing family members and close relatives. While unemployment is the main reason behind recent migration patterns, family and factional fighting is also leading people to move away from their homes.
•
•
•
In Jenin city, vendors reported a sharp drop in sales during the Muslim Feast of the Sacrifice, Eid El Adha, compared to previous years. A boutique owner stated that over the course of three days his sales never exceeded NIS 300; a roadside peddler maintained that his sales amounted to NIS 200, compared to about NIS 5,000 during similar periods in the past.5 The Israeli access regime has forced many Jerusalem ID holders who used to live in neighbourhoods outside the Barrier to move inside the Israeli-defined municipal boundaries in order to preserve their Jerusalem residency status and related social security benefits. As a result, UNRWA staff as well as refugees living in the area reported a further increase in population density in Old City houses and a concurrent hike in renting costs, making housing more severe and expensive for lower income families.
•
•
Qabatiya town, Jenin GovernorateThe town of Qabatiya used to be known for its quarries, from which building stones were exported to Israel and Arab countries, and for its agricultural products, particularly grapes, cherries and olives. In the past, the town provided employment to people from surrounding villages and experienced reasonably good economic conditions. Following the beginning of the second Intifada and Israel’s construction of the Barrier, Qabatiya experienced severe unemployment, due primarily to the restrictions imposed on the movement of laborers and Palestinian exports. These factors, coupled with the more recent lack of security and public order, have led many inhabitants to migrate to Ramallah and abroad.
The current situation is forcing some existing businesses to close; some employers are laying off their staff and are themselves only working half-time. Families are increasingly relying on public allowances, assistance from charities and relief agencies, and remittances. Among the coping strategies in place, MoSA social workers reported the appearance of so-called “flying cafes.” These street cafes require limited investment – a few plastic chairs and a stall – sell cheap drinks and water pipes, argilleh, providing a competitive alternative to the more expensive, regular coffee shops.
The Humanitar ian Monitoro c c u p i e d P a l e s t i n i a n t e r r i t o r y
Number 20 • December 2007 • �2
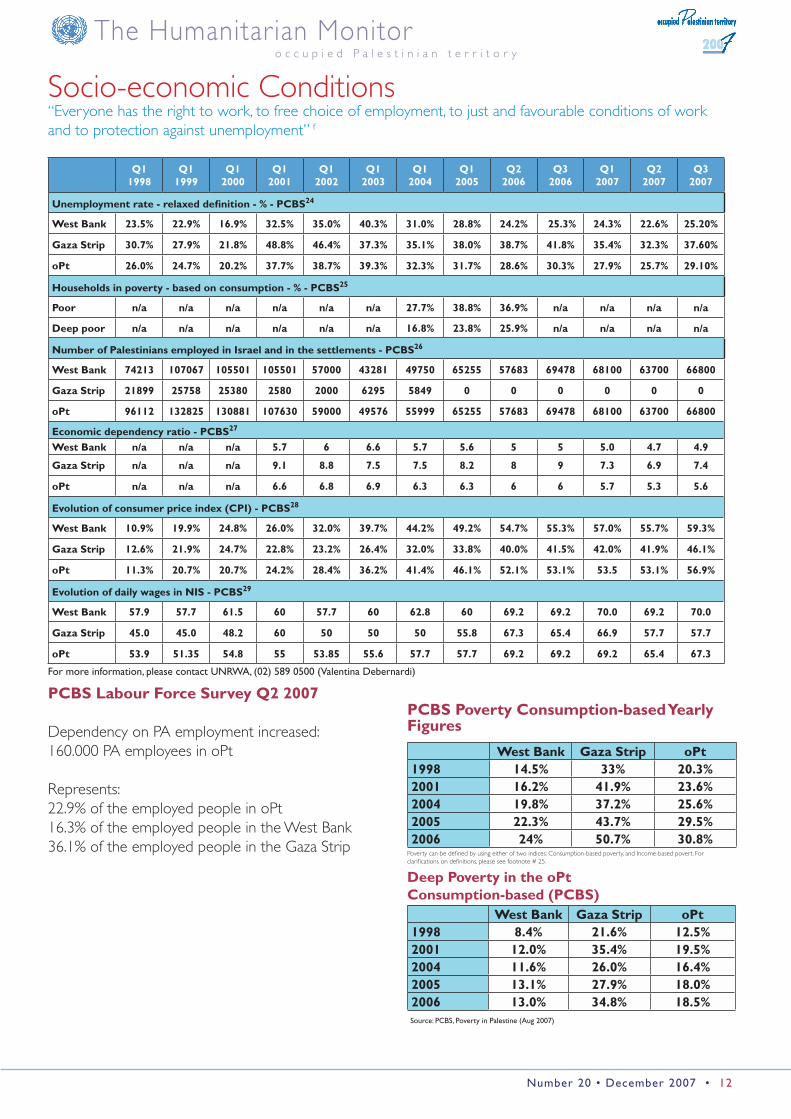
PCBS Labour Force Survey Q2 2007
Dependency on PA employment increased: 160.000 PA employees in oPt
Represents:22.9% of the employed people in oPt16.3% of the employed people in the West Bank36.1% of the employed people in the Gaza Strip
PCBS Poverty Consumption-based Yearly Figures
West Bank Gaza Strip oPt1998 14.5% 33% 20.3%2001 16.2% 41.9% 23.6%2004 19.8% 37.2% 25.6%2005 22.3% 43.7% 29.5%2006 24% 50.7% 30.8%
Socio-economic Conditions“Everyone has the right to work, to free choice of employment, to just and favourable conditions of work and to protection against unemployment” f
Poverty can be defined by using either of two indices: Consumption-based poverty, and Income-based povert. For clarifications on definitions, please see footnote # 25.
Deep Poverty in the oPt Consumption-based (PCBS)
West Bank Gaza Strip oPt1998 8.4% 21.6% 12.5%2001 12.0% 35.4% 19.5%2004 11.6% 26.0% 16.4%2005 13.1% 27.9% 18.0%2006 13.0% 34.8% 18.5%Source: PCBS, Poverty in Palestine (Aug 2007)
Q1
1998Q1
1999Q1
2000Q1
2001 Q1
2002Q1
2003Q1
2004Q1
2005Q2
2006Q3
2006Q1
2007Q2
2007Q3
2007
Unemployment rate - relaxed definition - % - PCBS24
West Bank 23.5% 22.9% 16.9% 32.5% 35.0% 40.3% 31.0% 28.8% 24.2% 25.3% 24.3% 22.6% 25.20%
Gaza Strip 30.7% 27.9% 21.8% 48.8% 46.4% 37.3% 35.1% 38.0% 38.7% 41.8% 35.4% 32.3% 37.60%
oPt 26.0% 24.7% 20.2% 37.7% 38.7% 39.3% 32.3% 31.7% 28.6% 30.3% 27.9% 25.7% 29.10%
Households in poverty - based on consumption - % - PCBS25
Poor n/a n/a n/a n/a n/a n/a 27.7% 38.8% 36.9% n/a n/a n/a n/a
Deep poor n/a n/a n/a n/a n/a n/a 16.8% 23.8% 25.9% n/a n/a n/a n/a
Number of Palestinians employed in Israel and in the settlements - PCBS26
West Bank 74213 107067 105501 105501 57000 43281 49750 65255 57683 69478 68100 63700 66800
Gaza Strip 21899 25758 25380 2580 2000 6295 5849 0 0 0 0 0 0
oPt 96112 132825 130881 107630 59000 49576 55999 65255 57683 69478 68100 63700 66800
Economic dependency ratio - PCBS27
West Bank n/a n/a n/a 5.7 6 6.6 5.7 5.6 5 5 5.0 4.7 4.9
Gaza Strip n/a n/a n/a 9.1 8.8 7.5 7.5 8.2 8 9 7.3 6.9 7.4
oPt n/a n/a n/a 6.6 6.8 6.9 6.3 6.3 6 6 5.7 5.3 5.6
Evolution of consumer price index (CPI) - PCBS28
West Bank 10.9% 19.9% 24.8% 26.0% 32.0% 39.7% 44.2% 49.2% 54.7% 55.3% 57.0% 55.7% 59.3%
Gaza Strip 12.6% 21.9% 24.7% 22.8% 23.2% 26.4% 32.0% 33.8% 40.0% 41.5% 42.0% 41.9% 46.1%
oPt 11.3% 20.7% 20.7% 24.2% 28.4% 36.2% 41.4% 46.1% 52.1% 53.1% 53.5 53.1% 56.9%
Evolution of daily wages in NIS - PCBS29
West Bank 57.9 57.7 61.5 60 57.7 60 62.8 60 69.2 69.2 70.0 69.2 70.0
Gaza Strip 45.0 45.0 48.2 60 50 50 50 55.8 67.3 65.4 66.9 57.7 57.7
oPt 53.9 51.35 54.8 55 53.85 55.6 57.7 57.7 69.2 69.2 69.2 65.4 67.3
For more information, please contact UNRWA, (02) 589 0500 (Valentina Debernardi)

The Humanitar ian Monitoro c c u p i e d P a l e s t i n i a n t e r r i t o r y
Number 20 • December 2007 • ��
Health “Health is a state of complete physical, mental and social well-being and not merely the absence of disease or infirmity.”g
adverse effects of vaccines, injection safety, cold chain assessment and Hemophilus Influenza (HI) vaccines.
Distribution of family planning tools and anesthesia equipment (UNFPA)Under the objective of strengthening family planning (FP) among women of reproductive age in the oPt, UNFPA has secured the MoH’s needs for 2008 for FP activities, includ-ing commodities, injectables and condoms during December 2007. The FP tools are funded by Norway through CAP 2007. In addition, UNFPA has provided the MoH with two anesthesia monitors and one complete set of adult anesthesia machines, funded from the thematic fund of UNFPA headquarters.
Distribution of “Food and Health” booklet (WHO) Micronutrients deficiency, mainly iron deficiency, is a severe public health problem in the oPt. Raising community aware-ness about micronutrients is one crucial factor that can at-tribute to the reduction of the phenomenon. Accordingly, the MoH Nutrition Department with WHO technical support have produced a booklet that includes the definition of vita-min A and D, iron and iodine deficiency, risk factors associated with deficiency, signs and symptoms, treatment and the main food sources rich in the defined micronutrients. 10,000 book-lets and 7,000 booklets were distributed in the West Bank and Gaza Strip, respectively, among Mother and Child Health (MCH) clinics, health promotion and education departments, community health departments, Integrated Management of Childhood Illnesses (IMCI) departments, and school health de-partments. The plan is to distribute the booklet to other health providers, mainly NGOs in the West Bank and Gaza Strip.
Availability of drugs in the Gaza Strip (WHO)Coordination problems and lack of budget support have negatively impacted the availability of drugs in the Gaza Strip. The availability of drugs has decreased at central drug stores in the Gaza Strip. The number of drug items at zero6 level has increased in December, reaching 100 drug items out of 416 items on the Essential Drug List (EDL), compared to 85 items in November 2007. Additionally, the availability of medi-cal supplies in the Gaza Strip has deteriorated as well. The number of medical supply items at zero stock at central drug stores reached 203 items in December, compared to 157 in November. The number of medical supply items at a stock of 1-3 months has increased, reaching 162 items in December compared to 151 items in November 2007. At the peripheral level, the lack of some drug items was detected, including the first-line pediatric antibiotics7, psychotropic drugs and treat-ments for chronic diseases, such as cardio-vascular diseases at the PHC clinics’ level and cytotoxic/chemotherapy drugs,8 anesthesia, labor-induction and human albumin drugs at the hospital level. For the third month in a row, the lack of the Measles, Mumps, and Rubella (MMR)9 vaccine continued to be a problem at MoH and UNRWA PHC facilities during Decem-ber. A shortage of vitamin K in all the MoH general and pedi-atrics’ hospitals was also detected during December.10 WHO delivered four shipments of 90 pallets of drugs and disposables during December to be distributed among the MoH hospitals and PHC facilities.
Building the capacity of health workers in various health care providers (UNICEF)Building the capacity of health care providers dealing with women of child-bearing age, newborns and children-under-five is crucial to improving maternal care and reducing infant mortality rates. Accordingly, UNICEF had conducted a two-month capacity-building training program for three different groups of health care providers from the MoH, UNRWA and various NGOs during the period 5 November 2007-5 January 2008. The training has been carried out for the three groups in three different areas, as follows:
A group of 50 doctors and 150 nurses and midwives in neonatal care, including neonatal assessment, first-hour exclusive breastfeeding and Cardio-Pulmonary Resuscitation (CPR);A group of 105 doctors and 250 nurses in the different components of Integrated Management of Childhood Illnesses (IMCI), including malnutrition, diarrhea, anemia, breastfeeding counseling, mother counseling, diet, upper-respiratory tract infection and community practices; andA group of 58 doctors, 150 nurses and 12 pharmacists in the Expanded Program of Immunization (EPI), including
1.
2.
3.

The Humanitar ian Monitoro c c u p i e d P a l e s t i n i a n t e r r i t o r y
Number 20 • December 2007 • �4
Jan -07
Feb-07
Mar -07
Apr -07
May-07 Jun-07 Jul- 07 Aug- 07 Sep-07 Oct-07 Nov-07 Dec-07
Number of primary health care consultations by service provider30
MoH - West Bank �7� 742 �0��97 5�090 49270 5�8�� �5�.29� ��7.597 �44.668 �57267 �582�2 n/a n/a
UNRWA - West Bank �55 727 �50 728 �68 �55 �56246 �75466 �58420 �5�4�� �62,627 �58.625 n/a n/a n/a
NGOs-West Bank n/a n/a n/a n/a n/a n/a n/a n/a n/a n/a n/a n/a
MoH - Gaza Strip 207 95� 2072�5 2�2 90� 2�5922 228046 2�6294 22502� 204728 �86780 n/a n/a n/a
UNRWA - Gaza Strip �26 2�4 �04 8�6 �28282 ��64�� �50�74 �24�9� �86560 �70,756 �52782 �4488� n/a n/a
NGOs - Gaza Strip �7 552 �8 592 �9 627 n/a n/a n/a n/a n/a n/a n/a n/a n/a
Proportion of deliveries by service provider31
MoH - West Bank 5�.4% 45.�0% �6.40% �4.60% �8.20% �9.0% 48.70% 47.60% �9.40% 45.�0% n/a n/a
MoH - Gaza Strip 69.0% 7�.6% 69.�0% n/a n/a n/a n/a n/a n/a n/a n/a n/a
NGOs - West Bank �2.�% �4.9% 40.9% 48% 5�.6% 4�.9% �4.0% 27.70% 29.40% �6.8% n/a n/a
NGOs - Gaza Strip �2.8% �2.20% �7.70% n/a n/a n/a n/a n/a n/a n/a n/a n/a
Private hospitals and clinics- West Bank
�2.40% �6.70% �8.60% ��.40% 2�.0% �4.70% �5.20% 20.�0% 22.�0% 27.40% n/a n/a
Private hospitals and clinics- Gaza Strip
�7.7% �5.7% �5.8% n/a n/a n/a n/a n/a n/a n/a n/a n/a
Home - West Bank 4.04% �.2�% 4.06% 5.95% 5.2�% �.��% 2.�9% 4.5�% 8.92% �0.22% n/a n/a
Home - Gaza Strip 0.4% 0.�0% 0.�0% n/a n/a n/a n/a n/a n/a n/a n/a n/a
UNRWA - Gaza Strip 0.�% 0.20% 0.�0% 0.0% 0.0% 0.0% 0.0% 0.0% n/a n/a n/a n/a
Pharmaceutical items out of stock (416 drugs and 596 consumables)32
Drugs - West Bank n/a �9.7% n/a 26.7% 25.7% 44.7% n/a n/a n/a �8.8% n/a n/a
Consumables - West Bank
n/a n/a n/a n/a n/a n/a n/a n/a n/a n/a n/an/a
Drugs - Gaza Strip �4.7% �7.8% 24.0% 24.0% 28.6% �9.5% �5.60% �5.6�% �4.7% 2�.9% n/a n/a
Consumables - Gaza Strip (at zero level)
9.7% 25.5% ��.2% �6.2% 22.8% 22.5% n/a 26.68% �0.0�% ��.50% 26.�0% n/a
Consumable - Gaza Strip (at less than three months) ��.4% 2�.�% 40.2% 49.8% ��.6% �2.0% n/a 5�.�7% 49.��% 50.67% 5�.70% n/a
Malnutrition among children 9 - 12 months33
Underweight - West Bank 5.5% 6.2% 4.7% 2.59% 2.84% 4.0% �.�7% �.29% �.��% n/a n/a n/a
Anemia - West Bank 50.5% 5�.�% 44.6% 45.69% 45.0% 50.0% 50.08% 47.20% 5�.96% n/a n/a n/a
Underweight - Gaza Strip 2.9% 2.�% 2.6% �.2% �.85% 4% 4.�0% 4.60% n/a n/a n/a n/a
Anemia - Gaza Strip 67.8% 67.5% 7�.9% 7.2�% 72.2% n/a 72.�0% 69.2% n/a n/a n/a n/a
Number of consultation for diarrhoea in refugee children 0-3 years at UNRWA clinics34
West Bank 786 79� 888 6�7 �068 92� �0�2 ���2 �007 n/a n/a n/a
Gaza Strip � 025 942 99� �224 �765 �574 �69� �,596 ��25 �2�2 n/a n/a
Number of new cases attending community and hospital mental health services35
UNRWA- West Bank ��2 �4 n/a �9� �5� �7� �7� �55 n/a �6� n/a n/a
UNRWA- Gaza Strip 27 58 n/a 47 25 20 � n/a n/a n/a n/a n/a
MoH- West Bank n/a n/a n/a n/a
MoH- Gaza Strip ��6 ��6 �82 �87 �9� �47 �56 �29 �06 �29 n/a n/a
NGO- West Bank n/a n/a n/a n/a
NGO-Gaza Strip 42 67 7� 58 46 �5 50 �5 40 �0 n/a n/a
For more information please contact WHO, (02) 582 �5�7 (Dr. Rajesh Sreedharan)
Health “A positive mental health is a state of emotional and social well-being in which the individual realises his or her own abilities, can cope with the normal stresses of life, can work productively or fruitfully, and is able to make a contribution to his or her community.”h
The Humanitar ian Monitoro c c u p i e d P a l e s t i n i a n t e r r i t o r y
Number 20 • December 2007 • �5
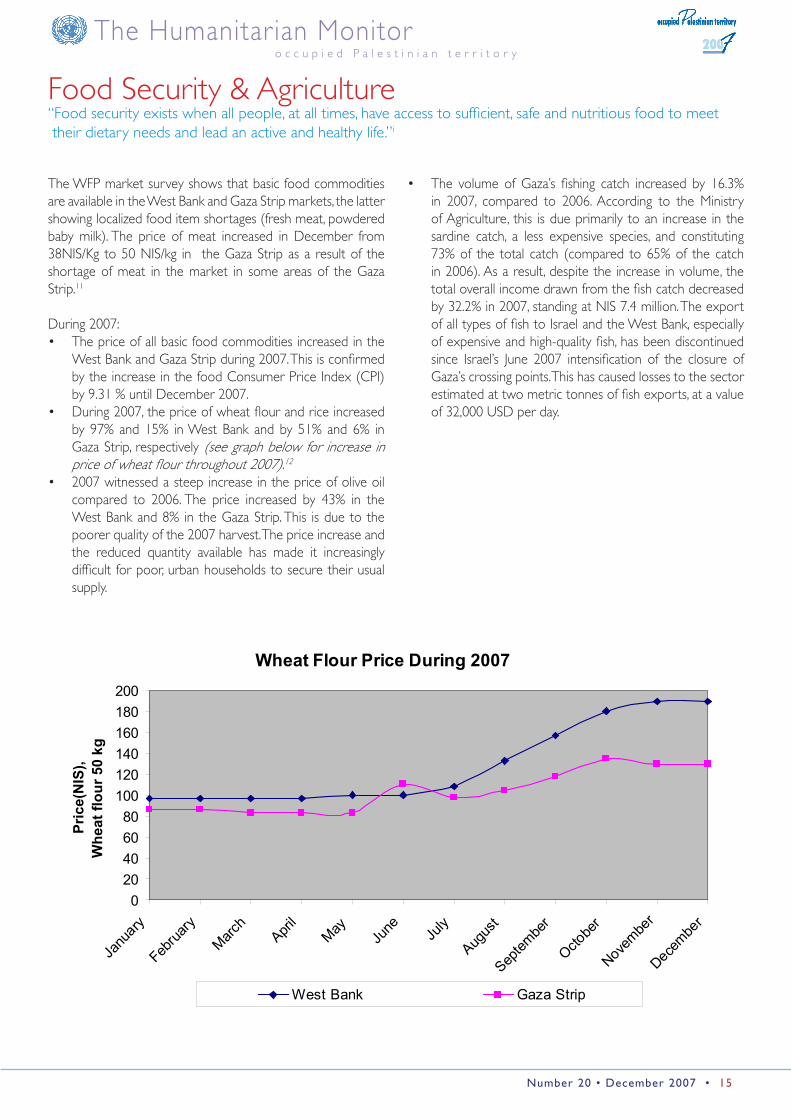
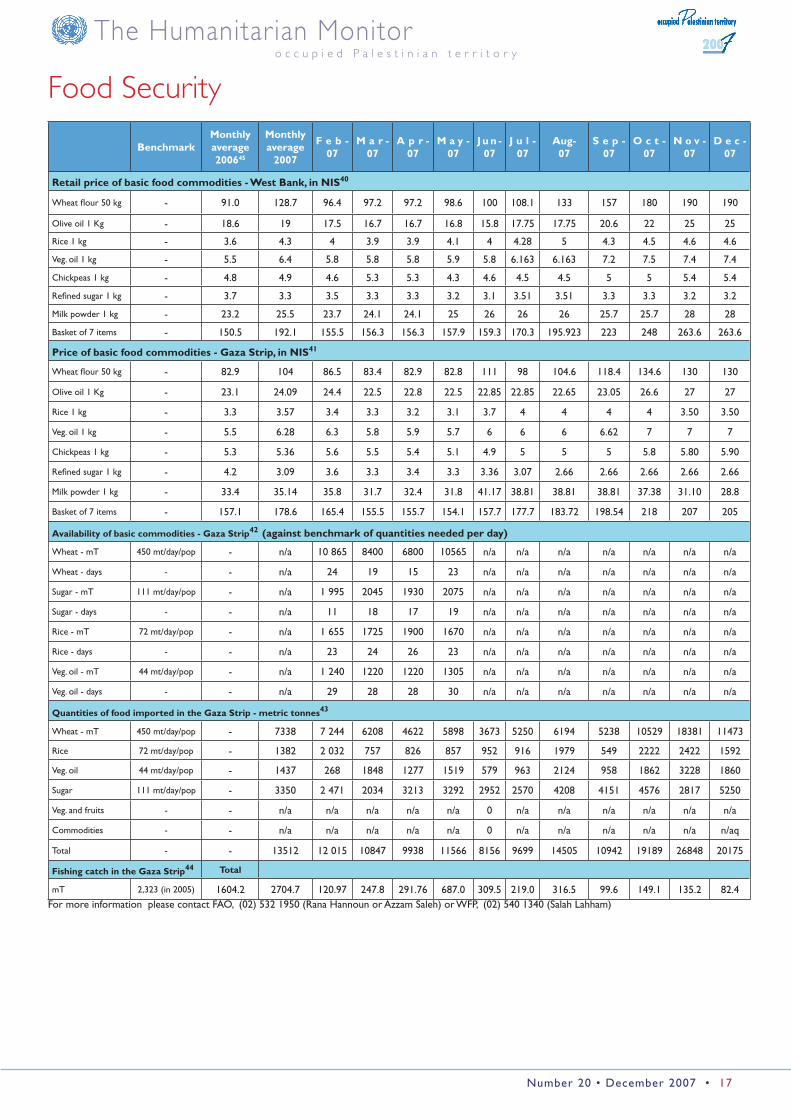
Food Security & Agriculture “Food security exists when all people, at all times, have access to sufficient, safe and nutritious food to meet their dietary needs and lead an active and healthy life.”i
The WFP market survey shows that basic food commodities are available in the West Bank and Gaza Strip markets, the latter showing localized food item shortages (fresh meat, powdered baby milk). The price of meat increased in December from 38NIS/Kg to 50 NIS/kg in the Gaza Strip as a result of the shortage of meat in the market in some areas of the Gaza Strip.11
During 2007: The price of all basic food commodities increased in the West Bank and Gaza Strip during 2007. This is confirmed by the increase in the food Consumer Price Index (CPI) by 9.31 % until December 2007.During 2007, the price of wheat flour and rice increased by 97% and 15% in West Bank and by 51% and 6% in Gaza Strip, respectively (see graph below for increase in price of wheat flour throughout 2007).12 2007 witnessed a steep increase in the price of olive oil compared to 2006. The price increased by 43% in the West Bank and 8% in the Gaza Strip. This is due to the poorer quality of the 2007 harvest. The price increase and the reduced quantity available has made it increasingly difficult for poor, urban households to secure their usual supply.
•
•
•
The volume of Gaza’s fishing catch increased by 16.3% in 2007, compared to 2006. According to the Ministry of Agriculture, this is due primarily to an increase in the sardine catch, a less expensive species, and constituting 73% of the total catch (compared to 65% of the catch in 2006). As a result, despite the increase in volume, the total overall income drawn from the fish catch decreased by 32.2% in 2007, standing at NIS 7.4 million. The export of all types of fish to Israel and the West Bank, especially of expensive and high-quality fish, has been discontinued since Israel’s June 2007 intensification of the closure of Gaza’s crossing points. This has caused losses to the sector estimated at two metric tonnes of fish exports, at a value of 32,000 USD per day.
•
Wheat Flour Price During 2007
020406080
100120140160180200
Janu
ary
Februa
ryMarc
hApri
lMay
June Ju
ly
Augus
t
Septem
ber
Octobe
r
Novembe
r
Decembe
r
Pric
e(N
IS),
Whe
at fl
our 5
0 kg
West Bank Gaza Strip

The Humanitar ian Monitoro c c u p i e d P a l e s t i n i a n t e r r i t o r y
Number 20 • December 2007 • �6
Agriculture
Monthly Average
2006
Monthly Average
2007Jan-07 Feb-07 Mar-07 Apr-07 May-07 Jun-07 Jul-07 Aug-07 Sep-07 Oct-07 Nov-07 Dec-07
Arable land requisitoned, levelled and reclaimed in dunums - West Bank�6
Requistioned 484 ��� 20 22� �52 40 260 60 �55 �0 50 500 20 60
Levelled n/a �26 ��0 2�6 �05 �0 60 ��0 720 25 75 �� 2 6
People affected n/a 265 �90 497 2�0 20� 650 �70 �70 �25 �82 470 �2 77
Reclaimed n/a 8� 50 50 200 60 50 55 �0 90 42 �56 �50 70
Arable land requisitioned levelled or reclaimed in dunums - Gaza Strip
Requistioned n/a 0 0 0 0 0 0 0 0 0 0 0 0 0
Levelled n/a �62� 0 0 0 0 2000 ���0 9�00 �600 �400 2750 0 ��00
People affected n/a 657 0 0 0 0 490 �00 400 �400 2520 �020 0 �750
Reclaimed n/a �5 �05 �26 0 20 0 0 0 0 0 0 0 �70
Greenhouses land destroyed and rehabilitated in dunums - West Bank�7
Destroyed n/a �0 0 0 �0 ��0 60 26 �00 0 0 20 7 2
People affected n/a ��� n/a 0 56 �50 420 90 �40 0 0 ��7 �5 �4
Rehabilitated n/a 76 �� 0 0 7 50 57 �0 ��4 �76 �48 285 �0
Greenhouses land destroyed and rehabilitated in dunums - Gaza Strip
Destroyed n/a � 0 0 0 2 0 �5 0 �2 4 0 0 0
People affected n/a �� 0 0 0 �4 0 80 0 42 �4 0 0 0
Rehabilitated n/a 6 0 0 0 8 0 0 �0 0 0 0 50 0
Number of trees destroyed�8
Treesdestroyed in the West Bank
n/a ��8 �40 600 �50 �00 200 �00 80 �75 �0 �500 �40 0
People affected n/a 62 70 �40 �5 70 50 94 20 90 2� ��0 28 0
Trees destroyed in the Gaza Strip
n/a 288� 0 0 0 0 0 0 0 �600 5000 �6000 0 �0000
People affected n/a 292 0 0 0 0 0 0 0 ��00 420 2�0 0 �750
Agricultural produce trading in/out the Gaza Strip - metric tonnes�9
Import �290� ��98� 4�276 �5 7�8 �550� �68�4 �7�0� ��270 �640� 9526 29�� 580 475� ��902
Export ��70 269� �4�92 5 096 5�88 550� �495 422 0 �25 0 0 �7 2�8For more information please contact FAO, (02) 5�2 �950 (Rana Hannoun or Azzam Saleh)
The Humanitar ian Monitoro c c u p i e d P a l e s t i n i a n t e r r i t o r y
Number 20 • December 2007 • �7
Food Security
BenchmarkMonthly average200645
Monthly average
2007
F e b -07
M a r -07
A p r -07
M a y -07
J u n -07
J u l -07
Aug-07
S e p -07
O c t -07
N o v -07
D e c -07
Retail price of basic food commodities - West Bank, in NIS40
Wheat flour 50 kg - 9�.0 �28.7 96.4 97.2 97.2 98.6 �00 �08.� ��� �57 �80 �90 �90
Olive oil � Kg - �8.6 �9 �7.5 �6.7 �6.7 �6.8 �5.8 �7.75 �7.75 20.6 22 25 25
Rice � kg - �.6 4.� 4 �.9 �.9 4.� 4 4.28 5 4.� 4.5 4.6 4.6
Veg. oil � kg - 5.5 6.4 5.8 5.8 5.8 5.9 5.8 6.�6� 6.�6� 7.2 7.5 7.4 7.4
Chickpeas � kg - 4.8 4.9 4.6 5.� 5.� 4.� 4.6 4.5 4.5 5 5 5.4 5.4
Refined sugar � kg - �.7 �.� �.5 �.� �.� �.2 �.� �.5� �.5� �.� �.� �.2 �.2
Milk powder � kg - 2�.2 25.5 2�.7 24.� 24.� 25 26 26 26 25.7 25.7 28 28
Basket of 7 items - �50.5 �92.� �55.5 �56.� �56.� �57.9 �59.� �70.� �95.92� 22� 248 26�.6 26�.6
Price of basic food commodities - Gaza Strip, in NIS41
Wheat flour 50 kg - 82.9 �04 86.5 8�.4 82.9 82.8 ��� 98 �04.6 ��8.4 ��4.6 ��0 ��0
Olive oil � Kg - 2�.� 24.09 24.4 22.5 22.8 22.5 22.85 22.85 22.65 2�.05 26.6 27 27
Rice � kg - �.� �.57 �.4 �.� �.2 �.� �.7 4 4 4 4 �.50 �.50
Veg. oil � kg - 5.5 6.28 6.� 5.8 5.9 5.7 6 6 6 6.62 7 7 7
Chickpeas � kg - 5.� 5.�6 5.6 5.5 5.4 5.� 4.9 5 5 5 5.8 5.80 5.90
Refined sugar � kg - 4.2 �.09 �.6 �.� �.4 �.� �.�6 �.07 2.66 2.66 2.66 2.66 2.66
Milk powder � kg - ��.4 �5.�4 �5.8 ��.7 �2.4 ��.8 4�.�7 �8.8� �8.8� �8.8� �7.�8 ��.�0 28.8
Basket of 7 items - �57.� �78.6 �65.4 �55.5 �55.7 �54.� �57.7 �77.7 �8�.72 �98.54 2�8 207 205
Availability of basic commodities - Gaza Strip42 (against benchmark of quantities needed per day)
Wheat - mT 450 mt/day/pop - n/a �0 865 8400 6800 �0565 n/a n/a n/a n/a n/a n/a n/a
Wheat - days - - n/a 24 �9 �5 2� n/a n/a n/a n/a n/a n/a n/a
Sugar - mT ��� mt/day/pop - n/a � 995 2045 �9�0 2075 n/a n/a n/a n/a n/a n/a n/a
Sugar - days - - n/a �� �8 �7 �9 n/a n/a n/a n/a n/a n/a n/a
Rice - mT 72 mt/day/pop - n/a � 655 �725 �900 �670 n/a n/a n/a n/a n/a n/a n/a
Rice - days - - n/a 2� 24 26 2� n/a n/a n/a n/a n/a n/a n/a
Veg. oil - mT 44 mt/day/pop - n/a � 240 �220 �220 ��05 n/a n/a n/a n/a n/a n/a n/a
Veg. oil - days - - n/a 29 28 28 �0 n/a n/a n/a n/a n/a n/a n/a
Quantities of food imported in the Gaza Strip - metric tonnes43
Wheat - mT 450 mt/day/pop - 7��8 7 244 6208 4622 5898 �67� 5250 6�94 52�8 �0529 �8�8� ��47�
Rice 72 mt/day/pop - ��82 2 0�2 757 826 857 952 9�6 �979 549 2222 2422 �592
Veg. oil 44 mt/day/pop - �4�7 268 �848 �277 �5�9 579 96� 2�24 958 �862 �228 �860
Sugar ��� mt/day/pop - ��50 2 47� 20�4 �2�� �292 2952 2570 4208 4�5� 4576 28�7 5250
Veg. and fruits - - n/a n/a n/a n/a n/a 0 n/a n/a n/a n/a n/a n/a
Commodities - - n/a n/a n/a n/a n/a 0 n/a n/a n/a n/a n/a n/aq
Total - - ��5�2 �2 0�5 �0847 99�8 ��566 8�56 9699 �4505 �0942 �9�89 26848 20�75
Fishing catch in the Gaza Strip44 Total
mT 2,�2� (in 2005) �604.2 2704.7 �20.97 247.8 29�.76 687.0 �09.5 2�9.0 ��6.5 99.6 �49.� ��5.2 82.4For more information please contact FAO, (02) 5�2 �950 (Rana Hannoun or Azzam Saleh) or WFP, (02) 540 ��40 (Salah Lahham)

The Humanitar ian Monitoro c c u p i e d P a l e s t i n i a n t e r r i t o r y
Number 20 • December 2007 • �8
Water & Sanitation “The Human Right to Water entitles everyone to sufficient, safe, acceptable, physically accessible and affordable water for personal and domestic uses.”j
Baseline Pre-Intifada
Average 200652
Average 2007
Mar-07 Apr-07 May- 07 Jun-07 Jul-07 Aug-07 Sep-07 Oct-07 Nov-07 Dec-07
West Bank per capita use of water per day - in litres46
Minimum - 20.� �8.8 20 24 2� 20 20 �6 �9 �9 20 ��
Maximum - 207.2 �78.� �47 �52 �52 ��8 �47 220 �92 �92 �97 2�5
Average 90 65.� 60 52 56 59 58 6� 67 66 64 6� 65
Gaza Strip - Per capita use of water per day - in litres47
Minumum - �7.0 24.� �8 22 24 29 �� 26 24 22 �7 25
Maximum - ��6.5 90.5 7� 76 76 79 84 75 8� �0� �06 �59
Average 95 80.5 57.8 49 5� 55 57 6� 55 57 60 5� 66
Price of tankered water in the West Bank in NIS48
Minimum - 7.� 8.5 5 8 8 8 �0 �0 �0 �0 �0 �0
Maximum - 22.5 22.8 2� �7 20 2� 2� �0 27 27 27 25
Average ��.4 �4.0 �4.0 �� �4 �4 �4 �5 �6 �5 �5 �5 �5
Price of tankered water in the Gaza Strip in NIS49
Minimum - �5 �5 �5 �5 �5 �5 �5 �5 �5 �5 �5 �5
Maximum - �5 �5 �5 �5 �5 �5 �5 �5 �5 �5 �5 �5
Average - �5 �5 �5 �5 �5 �5 �5 �5 �5 �5 �5 �5
Percentage of HH connected to water network paying the bills50
West Bank - �5.5% �5.2% �7.7 �6 �8% �5% ��.0% �6.0% �5.0% ��.0% �4.0% �4.0%
Gaza Strip - 4.2% �6.�% �.5 2 2% 2% 2.0% 2.0% �.8% 5.0% 6.0% 5.0
Percentage of HH monthly income spent on sanitation services5�
West Bank - 2.2% 2.9% �.0% � �.0% �.0% �.0% �.0% �.0% �.0% �.0% �.0%
Gaza Strip - 4% 4.0% 4.2% 4 4.0% 4.0% 4.0% 4.0% 4.0% 4.0% 4.0% 4.0%
Cost recovery of water bills by village councils and Municipalities in the West Bank5�
Minimum - 0% n/a n/a n/a n/a n/a n/a n/a n/a n/a n/a n/a
Maximum - �6.7% n/a n/a n/a n/a n/a n/a n/a n/a n/a n/a n/a
Average 75.0% ��.5% n/a n/a n/a n/a n/a n/a n/a n/a n/a n/a n/a
Cost recovery of water bills by village councils and Municipalities in the Gaza Strip54
Minimum - n/a n/a n/a n/a n/a n/a n/a n/a n/a n/a n/a n/a
Maximum - n/a n/a n/a n/a n/a n/a n/a n/a n/a n/a n/a n/a
Average 75.0% n/a n/a n/a n/a n/a n/a n/a n/a n/a n/a n/a n/aFor more information please contact UNICEF, 02) 58� 00 ��/�4 (Dr. Samson Agbo) or PHG, (02) 296 6� �5/6 (Eng. Basema Bashir)
The Coastal Municipal Water Utility (CMWU) notified its partners in late December that the Gaza Power Plant (GPP) and Gaza Electricity Distribution Company (GEDCO) fuel tanks levels had reached dangerously low levels. Insufficient fuel would make it necessary to shut down one of the two operated gas turbines, cutting the capacity of the GPP by more than half and increasing cuts in Gaza’s electricity supply. The water and sewage system in the Gaza Strip are in a very vulnerable situation:
For the past 18 months (when the transformers of the GPP were destroyed by the Israeli military), along with the severe restrictions on the entry of goods into the Gaza Strip since June 2007, the proper functioning of the water and sewage system in Gaza has been disrupted. Periodic interruptions in the electricity supply create further stress on standby generators, with no spare parts available and insufficient fuel to operate them. In this winter season, sewage pumps need to operate 24-hours per day. Any interruptions in electricity can be particularly
•
•
detrimental and may lead to flooding from sewage pump stations and water shortages. The collapse of the sewage system will create a humanitarian and ecological crisis, with sewage spills or overflows of the wastewater pumping stations and treatment plants. If sewage cannot be treated, it will be discharged raw to the sea. This has the potential of damaging the aquifer and marine life, and can also spread to the Egyptian and Israeli coastlines.CMWU’s efforts to provide basic water and sewage services to the densely populated Gaza Strip, using extremely limited supplies and an infrastructure badly in need of improvement is being greatly challenged by Israel’s sanctions on the Gaza Strip. Additional cuts to Gaza’s fuel supply and subsequent cuts in electricity will seriously compromise CMWU’s ability to provide clean water to Gaza residents and collect, treat and discharge wastewater.
•
•

The Humanitar ian Monitoro c c u p i e d P a l e s t i n i a n t e r r i t o r y
Number 20 • December 2007 • �9
Education “All children deserve a quality eduction founded on a rights-based approach and rooted in the concept of gender equality.”k
# of Schools
Jan 07 Feb 07 Mar 07 Apr 07 May 07 Jun-07 Jul-07 Aug-07 Sep-07 Oct-07 Nov-07 Dec-07
Number of schools with at least one day of disruption - West Bank55
Bethlehem �00 0 0 0 85 �06 � n/a n/a 0 0 0 0
Hebron 207 0 72 0 �50 2�4 0 n/a n/a �5 4 0 0
South Hebron �59 0 0 0 ��2 �60 0 n/a n/a 0 0 0 0
Jenin ��� 0 0 0 92 ��6 � n/a n/a 0 0 0 0
Jericho 202
(curfew)� 0 �2 �7 0 n/a n/a 0 0 0 0
Jerusalem �7 0 0 0 All n/a 0 n/a n/a 0 0 0 0
Jerusalem suburb 55 0 0 0 �6 56 0 n/a n/a 0 0 0 0
Nablus �96 0 0 2 �49 �87 0 n/a n/a �� 5 0 0
Qabatya �0� 0 0 0 6� 77 0 n/a n/a 0 0 0 0
Qalqilia 67 0 0 0 �0 69 0 n/a n/a 0 0 �4 0
Ramallah �59 0 0 2 ��� �6� 0 n/a n/a 0 0 0 �
Salfit 57 0 � 0 �9 58 0 n/a n/a 0 0 0 �
Tubas - 0 0 n/a n/a �9 0 n/a n/a n/a 0 n/a n/a
Tulkarm �07 0 n/a 0 66 ��0 0 n/a n/a 0 n/a 0 0
Total West Bank 1,380 0.14% 5.4% n/a n/a n/a n/a n/a n/a n/a n/a 0 n/a
Number of schools with at least one day of disruption - Gaza Strip56
Gaza �5� 0 n/a 0 80 �52 0 n/a n/a n/a n/a n/a n/a
Gaza North 60 0 n/a 0 �9 66 0 n/a n/a n/a n/a n/a n/a
Khan Younis 64 0 n/a 0 �9 �5 � n/a n/a n/a n/a n/a n/a
Middle Area �7 0 n/a 0 44 6� � n/a n/a n/a n/a n/a n/a
Rafah �4 0 n/a 0 29 �7 0 n/a n/a n/a n/a n/a n/a
Total Gaza Strip 346 0.0% n/a 0.0% n/a n/a n/a n/a n/a n/a n/a n/a n/aFor more information please contact UNICEF, (02) 58� 00�� (Shao Potung) and UNESCO, (02) 295 9740 (Megumi Watanabe).
According to the MoEHE, three schools in Salfit and three in Ramallah experienced complete disruption due to curfews imposed by the IDF. On 5 December, Itihad Safa Secondary school in the Ramallah governorate was partially disrupted as students and teachers from the neighboring village of Beit Sira were unable to reach their school in Safa due to a curfew imposed on the village.According to the MoEHE, on 4 and 5 December students at Jit Secondary school in Qalqiliya governorate, students
•
•
were the attacked by Israeli settlers. The attacks included students being assaulted by settlers; an attempt to run-over one student while crossing the main road; and students being shot at by settlers while inside the school. Three students were wounded and 19 were arrested by the IDF in December 2007.
•
The Humanitar ian Monitoro c c u p i e d P a l e s t i n i a n t e r r i t o r y
Number 20 • December 2007 • 20
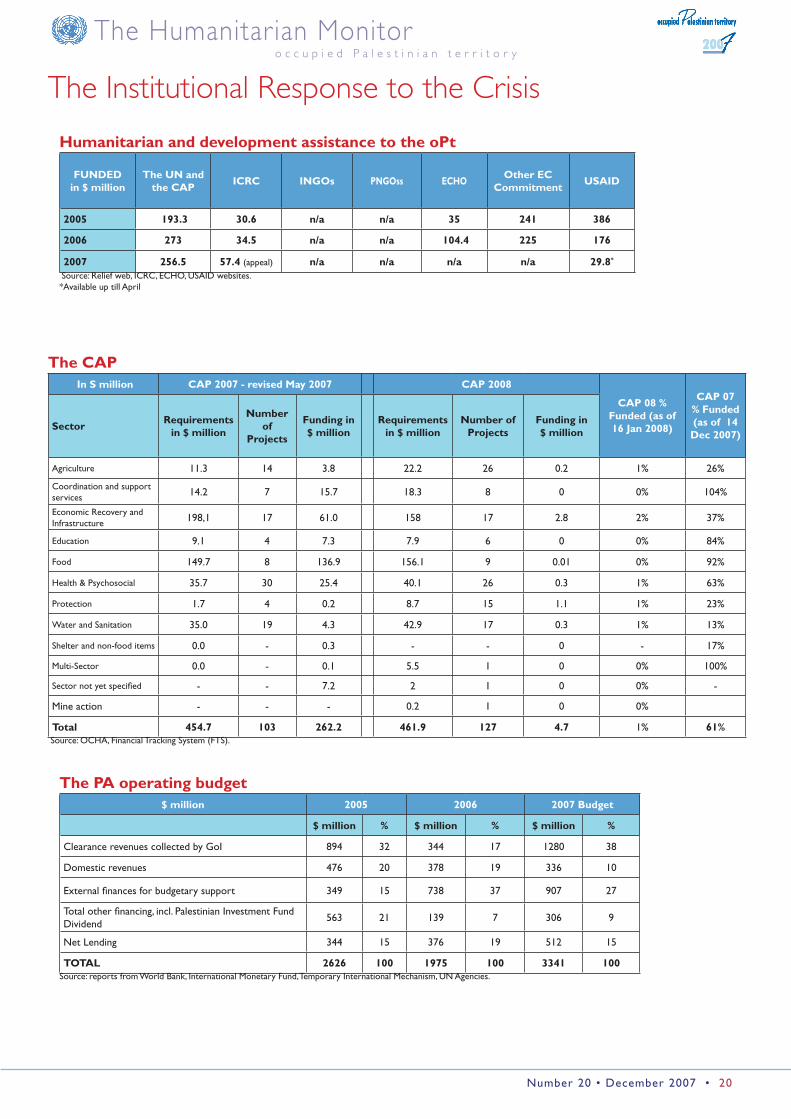
The Institutional Response to the Crisis
Humanitarian and development assistance to the oPt
FUNDEDin $ million
The UN and the CAP
ICRC INGOs PNGOss ECHOOther EC
CommitmentUSAID
2005 193.3 30.6 n/a n/a 35 241 386
2006 273 34.5 n/a n/a 104.4 225 176
2007 256.5 57.4 (appeal) n/a n/a n/a n/a 29.8*
Source: Relief web, ICRC, ECHO, USAID websites.*Available up till April
The CAP In S million CAP 2007 - revised May 2007 CAP 2008
CAP 08 % Funded (as of 16 Jan 2008)
CAP 07 % Funded (as of 14 Dec 2007)
SectorRequirements
in $ million
Number of
Projects
Funding in $ million
Requirements
in $ millionNumber of
ProjectsFunding in $ million
Agriculture ��.� �4 �.8 22.2 26 0.2 �% 26%
Coordination and support services �4.2 7 �5.7 �8.� 8 0 0% �04%
Economic Recovery and Infrastructure �98,� �7 6�.0 �58 �7 2.8 2% �7%
Education 9.� 4 7.� 7.9 6 0 0% 84%
Food �49.7 8 ��6.9 �56.� 9 0.0� 0% 92%
Health & Psychosocial �5.7 �0 25.4 40.� 26 0.� �% 6�%
Protection �.7 4 0.2 8.7 �5 �.� �% 2�%
Water and Sanitation �5.0 �9 4.� 42.9 �7 0.� �% ��%
Shelter and non-food items 0.0 - 0.� - - 0 - �7%
Multi-Sector 0.0 - 0.� 5.5 � 0 0% �00%
Sector not yet specified - - 7.2 2 � 0 0% -
Mine action - - - 0.2 � 0 0%
Total 454.7 103 262.2 461.9 127 4.7 �% 61% Source: OCHA, Financial Tracking System (FTS).
The PA operating budget$ million 2005 2006 2007 Budget
$ million % $ million % $ million %
Clearance revenues collected by GoI 894 �2 �44 �7 �280 �8
Domestic revenues 476 20 �78 �9 ��6 �0
External finances for budgetary support �49 �5 7�8 �7 907 27
Total other financing, incl. Palestinian Investment Fund Dividend
56� 2� ��9 7 �06 9
Net Lending �44 �5 �76 �9 5�2 �5
TOTAL 2626 100 1975 100 3341 100Source: reports from World Bank, International Monetary Fund, Temporary International Mechanism, UN Agencies.
The Humanitar ian Monitoro c c u p i e d P a l e s t i n i a n t e r r i t o r y
Number 20 • December 2007 • 2�
Sector Number of facilitiesNote: The TIM gradually phased out its
Emergency fuel distribution programme, which ended on 22 May 2007
Hospitals and Health Centers 45 �.4
Water System �0� 2.�
Waste Water System 75 0.8
General Power Generators 6 0.8
Um Nasir Disaster Relief 29 0.0�
Total 258 5.1
Total Cost in US$ million as of 11 Oct 2007 5.3
Cost in US$ million (one-time payment in 2006)
East Jerusalem hospitals referral costs in US $million
4.3
Cost in US$ million as of �� Jan 2008
Fuel received in million litres as of 11 Jan 2008
Gaza Power Plant �28.9 ��6
Electricity Production Gaza 8.2
Electricity Distribution Gaza 5.�
Electricity Distribution West Bank �2.5
Total Cost in US$ million as of 11 Oct 2007 154.8
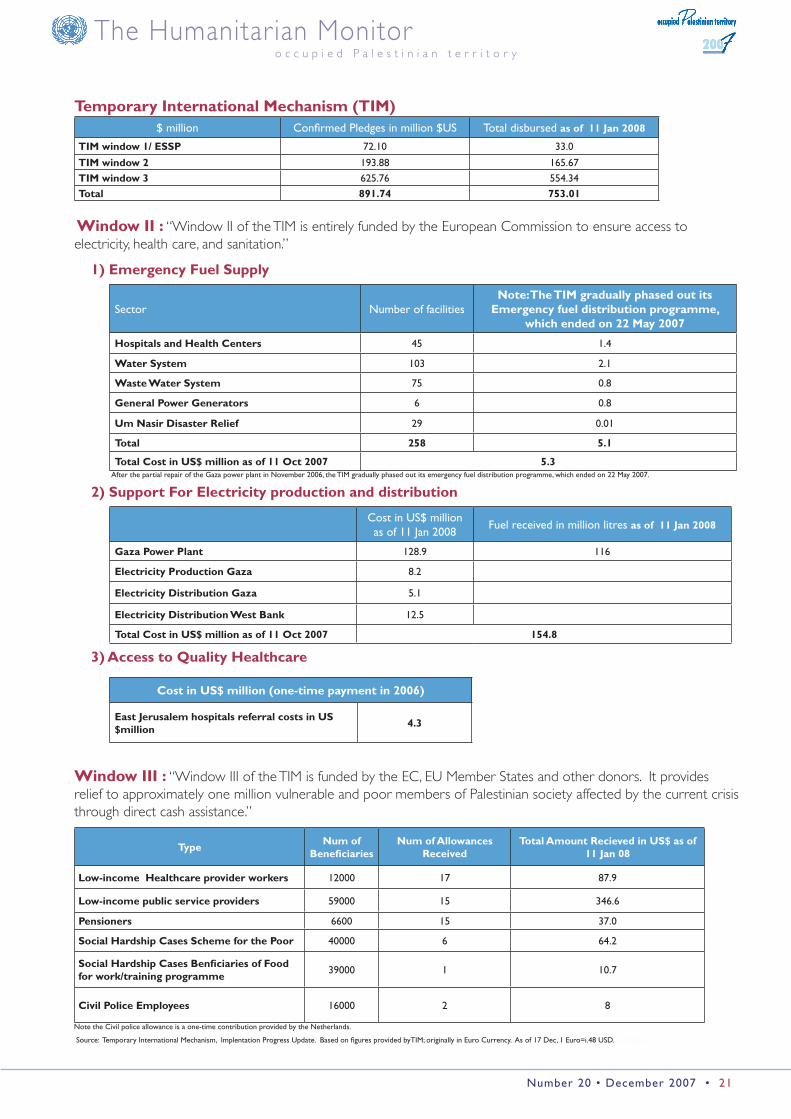
1) Emergency Fuel Supply
2) Support For Electricity production and distribution
Temporary International Mechanism (TIM)$ million Confirmed Pledges in million $US Total disbursed as of 11 Jan 2008
TIM window 1/ ESSP 72.�0 ��.0
TIM window 2 �9�.88 �65.67
TIM window 3 625.76 554.�4
Total 891.74 753.01
Window II : “Window II of the TIM is entirely funded by the European Commission to ensure access to electricity, health care, and sanitation.”
3) Access to Quality Healthcare
Type Num of
BeneficiariesNum of Allowances
ReceivedTotal Amount Recieved in US$ as of
11 Jan 08
Low-income Healthcare provider workers �2000 �7 87.9
Low-income public service providers 59000 �5 �46.6
Pensioners 6600 �5 �7.0
Social Hardship Cases Scheme for the Poor 40000 6 64.2
Social Hardship Cases Benficiaries of Food for work/training programme
�9000 � �0.7
Civil Police Employees �6000 2 8
Window III : “Window III of the TIM is funded by the EC, EU Member States and other donors. It provides relief to approximately one million vulnerable and poor members of Palestinian society affected by the current crisis through direct cash assistance.”
Note the Civil police allowance is a one-time contribution provided by the Netherlands.
Source: Temporary International Mechanism, Implentation Progress Update. Based on figures provided byTIM; originally in Euro Currency. As of �7 Dec, � Euro=i.48 USD. .Adfasdas
After the partial repair of the Gaza power plant in November 2006, the TIM gradually phased out its emergency fuel distribution programme, which ended on 22 May 2007.

The Humanitar ian Monitoro c c u p i e d P a l e s t i n i a n t e r r i t o r y
Number 20 • December 2007 • 22
Sources and Rationale
The following working sector groups and organisations contribute to the Humanitarian Monitor:Sector Sector Lead Participants
Protection OHCHR/OCHA OCHA, WHO, UNRWA, UNIFEM, Badil, Save the Children-UK, Al Haq
Socio-Economic UNRWA UNFPA, UN-HABITAT, WFP, CHFI, Mercy Corps
Health WHO UNICEF, UNFPA, UNRWA
Psychosocial & Protection Against Violence
United Nations Children’s Fund (UNICEF)
UNICEF, UNIFEM, UNFPA, WHO, UNRWA, DCI, Save the Children-UK, Save the Children (Sweden), MAP UK
Food WFP FAO, UNRWA, ACF-E, CARE, CHFI, CISP, CRS, GVC, ICRC, MC, OXFAM-GB
Agriculture FAO ACF-E, PHG, ACPP, ACAD, Allod Charitable Society
Education UNICEF UNESCO, OCHA, UNRWA, UNIFEM, OHCHR
Water and Sanitation UNICEF UNDP, UNRWA, WHO, UN-HABITAT, ICRC, PWA, PHG, OXFAM-GB, ACF-E, CARE, ACPP, CMWU, WBWD.
Coordination and Security United Nations Office for the Coordination of Humanitarian Affairs (OCHA)
OCHA, United Nations Special Coordinator for the Middle East Peace Process (UNSCO), UNDSS
Other sources and contributors TIM, EUBAM, World Bank, IMF, AIDA, LACS, PNGO
The following four factors have been identified by the United Nations Country Team as having the greatest impact on the current humanitarian situation: (1) Lack of protection for civilians and increasing violence; (2) Political, geographic, institutional and social fragmentation of the oPt; (3) Closure, lack of access, separation, restrictions and their effects on livelihoods; and (4) the impact of Israeli settlements and settlement expansion on Palestinian livelihoods, the availability of resources and a reduction in space for development.
OCHA has been monitoring and reporting monthly on protection and access concerns in the oPt since 2002. However, following a sharp deterioration in the humanitarian situation in 2006, UN agencies and NGOs participating in the 2006 Consolidated Appeal Process (CAP) have produced this monthly report monitoring developments and key humanitarian indicators in the following sectors: protection, child protection, socio-economic conditions, health including psychosocial support, food security, agriculture, education and water and sanitation. This report also includes information related to movement restrictions and humanitarian access including monitoring the 2002 Bertini Commitments. The present Humanitarian Monitor uses UN Security Council resolutions, the Universal Declaration of Human Rights and international humanitarian law (IHL), the Agreement on Movement and Access (AMA) as the standard for monitoring protection and access indicators. Sectors have also set out guiding humanitarian principles as the baseline for monitoring and developed indicators that can capture the humanitarian situation in a protracted crisis like the oPt.
The Humanitarian Monitor uses a combination of measurable humanitarian indicators, verified field observations and reports on the socio-economic and humanitarian situation in the oPt to analyse the humanitarian situation. These methods can provide different accounts of the situation. The humanitarian indicators reveal longer-term changes and trends from one month to another. Field observations illustrate signs of strain that may indicate future changes in the situation more generally. Reports provide information on specific topics or give larger overviews on the situation in the oPt.

The Humanitar ian Monitoro c c u p i e d P a l e s t i n i a n t e r r i t o r y
Number 20 • December 2007 • 2�
Protection of Civilians
Child Protection
Number of Palestinian and Israeli casualties (fatalities and injuries) - direct conflict. Source: OCHA. Casualities included within this figure relate directly to the conflict with Israel and the occupation of the oPt including in IDF military operations, artillery shelling, search and arrest campaigns, Barrier demonstrations, targeting killings, settler violence etc. The figures do not include events indirectly related to the conflict such as casualties from unexploded ordnance, etc. or events when the circumstances remain unclear or are in dispute. The figures include all reported casualties of all ages and both genders. Number of Palestinian casualties - internal violence. Source: OCHA. Casualties included within this figure are caused by factional violence, family feuding, during internal demonstrations (that are linked to the conflict/occupation) and shooting of alleged collaborators with Israel. These incidents began to be comprehensively reported from May 2006 and earlier figures will be under-reported. Number of search and arrest campaigns and arrests and detentions. Source: OCHA. These indicators refer to operations by the Israeli security forces to search houses or other properties throughout the oPt. Since Israel’s unilateral disengagement from the Gaza Strip the vast majority of these operations occur in West Bank towns and villages. During these operations individuals are often detained or arrested. Detentions (without arrest) typically last for a few days but can last be extended up to a period of three months or longer.
�.
2.
�.
Table Definitions
Number of Palestinian children killed - direct conflict. Source: OCHA. This indicator is used to monitor UN Security Council Resolution �6�2, adopted on 26 July 2005 and relative to the protection of children in armed conflict. Children are killed in incidents related directly to the conflict and occupation of the oPt. These include casualties caused in IDF military operations, artillery shelling, search and arrest campaigns, demonstrations, targeted killing and Israeli settler violence. Number of Palestinian children injured - direct conflict. This indicator is used to monitor UN Security Council Resolution �6�2. Children are injured in incidents directly related to the conflict and occupation of the oPt. These include injuries caused in IDF military operations, artillery shelling, search and arrest campaigns, demonstrations, targeted killing and Israeli settler violence. Number of Israeli children killed - direct conflict. Source: OCHA. This indicator is used to monitor UN Security Council Resolution �6�2. Number of Israeli children injured - direct conflict. Source: OCHA. This indicator is used to monitor UN Security Council Resolution �6�2. Number of Palestinian children killed – indirect conflict. These are children killed in incidents indirectly related to the conflcit and occupation of the oPt such as in incidents involving unexploded ordnance (UXO), traffic incidents in the oPt with Israeli vehicles, Palestinian homemade rockets (qassams) missing their target, deaths in prison, deaths from probable underlying medical conditions that occurred during military operations or where access to medical care was denied. Number of Palestinian children killed in Palestinian internal violence. Source OCHA. This indicator is used to monitor UN Security Council Resolution �6�2. Children are killed in incidents by factional violence or family feuding, internal demonstrations (that are linked to the conflict/occupation) and shooting of alleged collaborators with Israel. These incidents began to be comprehensively reported from May 2006: earlier figures will be underreported Number of Palestinian children held in detention by Israeli authorities. Source: Defence for Children International (DCI) from � January 2007. This indicator reflects the general level of tension in the West Bank. The UN Convention on the Rights of the Child states that deprivation of liberty of children should always be a last resort and for the shortest appropriate period.
4.
5.
6.
7.
8.
9.
�0.
Access
Violence & Private PropertyIncidents involving Israeli settlers. Source: OCHA. This indicator shows the level of tension between Palestinians and Israeli settlers in the West Bank. An incident is any event involving an aggressive action perpetrated by either Israeli settlers or Palestinians towards each other or others in the community (such as international observers) and that may – but not necessarily – lead to a death or an injury. The aggressive action can be an incident involving a car, such as the stoning of a car or driving it in a dangerous manner; any type of harassment such as intimidation and physical threats, stoning people, chasing people etc. that do not cause any casualty; an incident related to property damage to a private house, land, livestock, etc; and any incident involving the entry into a private or prohibited property. This figure also included incidents when the IDF restrict Palestinian access due to Israeli settler presence or activity. Number of Palestinian homemade (qassam) rockets, IDF artillery shells and IAF airstrikes in and from the Gaza Strip. Source: OCHA Gaza Field Office relying on secondary sources from UNRWA reporting and the Palestinian DCL. These indicators show trends and the level of conflict existing in the Gaza Strip. This number includes Qassam rockets that detonated in the Gaza Strip.
Prior to July 07, the figure for mortars fired “in the Gaza Strip” included mortars known to be fired towards IDF troops in the Gaza Strip. In July 07, these figures were broken down. Number of physical structures demolished in the West Bank and Gaza Strip. Source: OCHA. A structure is demolished when it is completely destroyed, damaged to such an extent that it will have to be demolished before rebuilding can commence, damaged beyond use and includes structures where the owner chose to demolish his structure which was under a demolition order issued by Israeli authorities. The majority of demolitions in the West Bank occur when the Israeli authorities demolish a structure for reportedly being built without a permit although some demolitions occur in other contexts such as during military incursions or due to the construction of the Barrier. In the Gaza Strip, demolitions usually occur during IAF air strikes or ground incursions. A residential (occupied) structure is any form of inhabited shelter/residence including seasonal shelters, during the time of the olive harvest for example.
��.
�2.
��.
�4.
IDF physical obstacles in the West Bank. Source: OCHA field monitoring. The movement of the Palestinians in the West Bank is restricted by a series of physical obstacles such as checkpoints, roadblocks, trenches, earthmounds, etc. that severely restrict Palestinians’ freedom of movement. ‘Flying’ or random checkpoints further disrupt Palestinian movement as they are often deployed on key transit roads during morning and evening peak travelling times. Delays of more than one hour are regularly reported at flying checkpoints and their unpredictable nature means that Palestinians are unable to make travel plans. The annual total of curfew incidents is less than the aggregate of monthly incidents for that year because some curfew incidents began at the end of one month and continued into the next month and were, thus, counted as one incident in each of the two months. In 2007, there are three such incidents. Curfews imposed by IDF. Source: OCHA field monitoring. The duration of a curfew is counted once for each curfew incident. A single curfew affecting multiple neighbouring locations is counted as one incident. A curfew that is lifted and re-imposed in the same place on a single day is counted as two incidents. A single curfew incident may last for several days. Access incidents reported by humanitarian organisations. Source: ACIS forms collected by OCHA and UNRWA Operations in the West Bank and Gaza Strip. The UN Security Council Resolution �405 adopted in 2002 “emphasizes the urgency of access of medical and humanitarian organisations to the Palestinian civilian population.” In addition, the Governement of Israel committed to “fully facilitate the assistance activities of international organisations…” (Bertini Commitments, 2002). In discussions between UNSCO and the IDF it was agreed that internationals should not wait any longer than 20 minutes at Erez crossing. Incidents of ambulances delays and denials in the West Bank and medical movement from the Gaza Strip. Source: Palestinian Red Crescent Society and WHO. Incidents reported by PRCS ambulance crews at IDF checkpoints throughout the West Bank. Only delays in excess of �0 minutes are reported. For medical movement, Palestinians from the Gaza Strip referred for medical treatment by the MoH in the West Bank, including East Jerusalem, and Israel must travel through Erez crossing while those seeking medical treatment abroad must cross through Rafah. Referral patients crossing Erez require a permit from the Israeli authorities. Figures for November inclusive only of the ��-�0 November period. External acces to/from the oPt – closure days. Source: Ministry of Labour, closure reports, AMA bi-weekly reports and OCHA. These are the days when Palestinians from the West Bank cannot access East Jerusalem or Israel regardless of a valid permit. Normally (�) staff of international organisations, (2) medical staff, (�) humanitarian cases and (4) Palestinians with legal issues (needing to attend a court in Israel etc) are excluded from this comprehensive closure. In the Gaza Strip, these are days when Erez crossing is closed for all Palestinian access as reported in the bi-weekly AMA report. Movement of people from/to the Gaza Strip – daily average. Source: OCHA Gaza Field Office; Palestinian Passport and Border Police; EU Border Assistance Mission (BAM). Erez is the only crossing point for Palestinian workers and traders to enter Israel from the Gaza Strip. The Rafah crossing is the Gaza Strip’s only international crossing point with Egypt. It is operated by the PA under the supervision of the EU BAM. The GoI is remotely monitoring Rafah operations and can refuse people’s passage. Rafah cannot operate if the EU BAM team are not present and EU BAM staff are dependent on GoI-operated Kerem Shalom crossing opening to access Rafah. Functioning of the Gaza Strips crossing points - percentage of days open/scheduled days open. Source: AMA bi-weekly report. In terms of scheduled days open: (�) Karni is scheduled to be open six days per week; (2) Sufa is scheduled to open five days per week though at times opens on an additional day to allow the import of non-aggregates; and (�) Nahal Oz energy pipelines are scheduled to operate six days per week. Movement of goods through Karni crossing - daily average. Source: AMA bi-weekly report. The daily average number of trucks is calculated on the basis of scheduled days open at Karni crossing point. Karni crossing is the main transit point for imports/exports into/from the Gaza Strip as well as humanitarian supplies. According to the �5 November 2005 Agreement on Access and Movement (AMA) signed between the GoI and PA, a minimum of �50 truckloads should be exported every day throughout 2006, to reach 400 per day by �� December 2006. Other imports into the Gaza Strip - total. Source: UNSCO. This indicators reflects the total number of truckloads of aggregates (through Sufa) and fuel (through Nahal Oz energy pipelines) into the Gaza Strip each month.
�5.
�6.
�7.
�8.
�9.
20.
2�.
22.
2�.
The Humanitar ian Monitoro c c u p i e d P a l e s t i n i a n t e r r i t o r y
Number 20 • December 2007 • 24
Unemployment rate – relaxed definition. Source: PCBS labour force surveys. In context of a protracted crisis, the standard unemployment definition might be somehow deficient, as a considerable number of people are simply no longer seeking employment. A “relaxed definition” of unemployment is applied here, by adding to the total number of unemployed people according to International Labour Organization (ILO) standards the number of people currently not engaged in active job search (commonly defined as “inactive”). Households living on poverty – consumption based. Source: PCBS. The poverty line is the level of income below which one cannot afford to purchase all the resources one requires to live. The official Palestinian (relative) poverty line is based on the average consumption of essential goods (food, clothing, housing, housekeeping supplies, utensils and bedding, personel and health care, transportation and education) by a six-member family. For Q2 2006, PCBS estimates it at NIS 2,�4� ($477). The subsistence (absolute or deep) poverty line is calculated to reflect a budget for food, clothing and housing for a six-member family and stands at NIS �,7�2 ($�85) in 2005 (PCBS). PCBS sample size does not allow disaggregating data for the Gaza Strip and West Bank. The number of Palestinians employed in Israel and in the settlements. Source: PCBS labour force surveys. In 2000, around �46,000 Palestinians from the oPt were employed in Israel and Israeli settlements. This figure represents roughly �% of the Palestinian labour force and demonstrates how vital for Palestinians’ livelihoods is the ability to have acces to Israel for working opportunities. Economic dependency ratio. Source PCBS labour force surveys. No. of population divided by No. of employed. The higher the ration, the more the inactive population is dependent on the active one. Evolution of Consumer Price Index (CPI). Source: PCBS. Measures changes in prices of purchased goods and services at given time intervals, providing a measure of inflation. Source: PCBS, CPI press releases, quarterly and annually, available from �996. Evolution of daily wages. Source: PCBS labour force survey. Total net wages paid to all employees divided by total workdays in a given period (median value would be considered). To be look at in conjuction with changes in CPI to determine purchasing power.
24.
25.
26.
27.
28.
29.
Socio-economic Conditions
Health Number of primary health care consultations by service provider. Source: Primary Health Care (PHC) Directorates; Mother and Child Health Department, UNRWA Epidemiology Department. Compiled by WHO. The number of consultations by service provider indicates the availability of the Ministry of Health (MoH) and UNRWA (free) services, the availability of and recourse to alternative private paying services. It also shows how ecomomical constraints may affect people’s choice to health services providers. Each monthly figure should be compared to the previous month and to that of the same month in the previous year(s). NGOs in the Gaza Strip include Palestinian Red Crescent Society (PRCS), Palestinian Medical Relief Society (PMRS) and Union of Health Workers Committees (UHWC), which are the main non-governmental providers of health services. Proportion of deliveries by service provider. Source: Birth certificates showed at PHC during BCG immunization, compiled by WHO. This indicator shows the public services’ capacity to provide obstetric services, as well as the burden on these services. It also indicates the availability of and recourse to alternative private paying services. It shows how financial barriers may affect people’s access choice to health services. Each monthly figure should be compared to that of the same month in the previous year(s). Number of pharmaceutical items out of stock. Source: MoH Central Drugstore, compiled by WHO. Out of stock means ‘less than one month’s stock’. There are 4�6 drug items and 596 consumables that should always be available at central level in stock for more than three months to ensure an adequate response to pharmaceutical needs. This indicator shows the quality of care as well as the donors’ response. Malnutrition among children 9-�2 months in the Gaza Strip and 0-24 months in the West Bank. Source: On underweight in the Gaza Strip, data source is MoH newly developed national Nutrition Surveillance system in June 2006, where indicator is - 2SD. On Anemia in the Gaza Strip, the same source has been used since June 2006, whilst MoH PHC directorate has been used as a source for the data on Anemia between January and May 2006. Although data on both sources is for children 9-�2 months and collected during measles immunization, trend cannot be defined when using the data from the two systems, as the methodology of data collection substantially differs. However, this new data should be more reliable than the previous ones, showing a more accurate prevalence. In the West Bank, data from the new surveillance system is not available yet, and the 5th percentile has been used as cut off point instead of -2SD for the Underweight. Also, the limit of West Bank data is that they are clinic based and it may not give a representative picture for all the children 0-2 years. Underweight is the weight for age ratio which indicates acute malnutrition. Anemia is defeciency in Iron mirconutrient, where the level of hemoglobin is less than ��mg/l. Indicators of malnutrition are used as early warning for a humanitarian crisis generally linked to food intake, poor living conditions, poor water and sanitation conditions. These indicators allow monitoring the impact of the ongoing economic crisis.
Number of consultation for diarrhoea in refugee children between tha ages of 0-� years at UNRWA clinics. Source: UNRWA, Epidemiology Department, West Bank and Gaza Strip Field Offices. This indicator allows to follow up the environmental health status, the quality and effectiveness of environmental programmes. Monthly figures are compared to the corresponding month in the previous year in order to check for seasonal patterns of disease. Number of new cases attending UNRWA community mental health services, MoH community and hospital mental health services and Gaza community Mental Health Program (GCMHP) in Gaza Strip and in the West Bank . Source: UNRWA, Epidemiology Department, West Bank and Gaza Strip Field Offices, MoH, Palestinian Health Information centre and PHC directorate in the West Bank and Gaza Strip compiled by WHO. This indicator shows how the crisis affects the psychological status of the Palestinians. It also indicates the quality of the Palestinians’ access to psychosocial care.
Arable land requisitioned, levelled or reclaimed in dunums - West Bank and Gaza Strip. Sources: Ministry of Agriculture, Palestinian Agriculture Relief Committees, compiled by FAO. Requisitioned land is public or private arable land either confiscated or made unavailable to Palestinian farmers by IDF for any reason (Barrier construction, settlements, roads, military areas, etc.). Levelled land is public or private land that have been deforested or devoid of inhabitation by the IDF (most often on the ground of security reasons). It however remains accessible to the farmers and be re-used as a field once the levelling is completed.
�0.
��.
�2.
��.
�4.
�5.
�6.
Food Security
People affected are those owners whose land has been requisitioned or levelled and therefore loss all or part of their livelihoods. People affected refers strictly to owners in this document although a wider range of people are actually affected such as workers employed and traders. ffected: workers, traders, retailers, etc. Reclaimed land is that land which is originally non-productive and is transformed in farming land under a private or NGO/UN-led initiative. This land is most of the time privately owned. Greenhouses land destroyed and rehabilitated in dunums - West Bank and Gaza Strip. Sources: Ministry of Agriculture, Palestinian Agriculture Relief Committees, compiled by FAO. Destroyed refers to the total destruction of a greenhouse, i.e. the greenhouse itself and the land it is installed on. Rehabilitated refers to the reconstruction of greenhouses done by their owners or under NGO/UN financed projects. People affected are those owners whose greenhouse(s) has been destroyed and who therefore see their livelihoods affected. Number of trees destroyed. Source: FAO; Ministry of Agriculture Directorates. Destroyed trees are those trees belonging to Palestinians that are being uprooted, burnt, or cut by Israeli authorities or settlers. Trees are mainly olive trees but can include any type of fruit-trees (orange, almond, advocado, etc), and represent an important source of revenue for their owner. People affected are those directly affected by the loss of land or trees, i.e. the owner and its family although the number of people affected is actually far greater included extended family members and labourers. Agricultural produce trading in/out Gaza Strip - the quantities of plant or animal produce, that are imported to or exported from Gaza (metric tonnes). Source: Ministry of Agriculture, Gaza Strip,Directorates of Agricultural Marketing
�7.
�8.
�9.
Retailed price of basic food commodities – West Bank, in NIS. Source: WFP, Market Monitoring System. The VAM Market Price Survey is the primary means by which WFP collects commodity prices in the local markets. The prices are collected during the first week of each month from retail shops in all governorates of the oPt. Retailed price of basic food commodities – Gaza Strip, in NIS. Source: WFP, Market Monitoring System. The VAM Market Price Survey is the primary means by which WFP collects commodity prices in the local markets. The prices are collected during the first week of each month from retail shops in all governorates of the oPt. Availability of basic commodities - Gaza Strip.Source : Ministry of National Economy, collected by WFP. Basic commodities refers to commercial food only (humanitarian stocks excluded). The availability of each item is comparable to the estimated daily quantity of each item needed to cover the needs of the total population of the Gaza Strip. Quantities of food imported in the Gaza Strip. Source : Paltrade, collected by WFP. Basic commodities refers to commercial and humanitarian food being imported every month into the Gaza Strip. Each commodity is compared to the estimated need in that specific commodity.
Fishing catch in the Gaza Strip. Source: Ministry of Agriculture, collected by WFP. Fish is the cheapest available animal protein source in the Gaza Strip. In addition, it contributes to the livelihoods of fishermen and their families. According to the Oslo Accords, the Palestinians are granted a fish catch area within 20 nautical miles off the Gazan coastline. The GoI agreed under the 2002 Bertini Commitments to a fishing zone of �2 nautical miles. Fisherman are presently able to fish up to 6 nautical miles off the Gaza Strip coastline except at a �.5 and � nautical mile exclusion zone to the north and south respectively.
2006 averages cover only data from � April - �� December 2006.
40.
4�.
42.
4�.
44.
45.
Agriculture
The Humanitar ian Monitoro c c u p i e d P a l e s t i n i a n t e r r i t o r y
Number 20 • December 2007 • 25
Water & Sanitation Per capita use of water per day – in litres - West Bank. This is the average volume of water used per day per person (including domestic agriculture, domestic livestock and all loss). Per capita use of water per day – in litres – Gaza Strip. This is the average volume of water used per day per person (including domestic agriculture, domestic livestock and all loss). Price of tankered watered in the West Bank- in NIS (� USD equals approximately 4.2 NIS). Prices are indicated in NIS to limit distortion due to frequent fluctuations of the exchange rate between the shekel and the dollar. Price of tankered watered in the Gaza Strip - in NIS. (� USD equals approximately 4.2 NIS). Prices are indicated in NIS to limit distortion due to frequent fluctuations of the exchange rate between the shekel and the dollar. Percentage of HH connected to water network paying their bills. These figures reflect the percentage of HH from which the municipality, due to capacity limitations, is able to collect payment. Percentage of HH monthly income spent on sanitation services
2006 averages cover only data from � June - �� December 2006. Cost recovery of water bills by village councils and Municipalities in the West Bank
46.
47.
48.
49.
50.
5�.
52.
5�.
Education Cost recovery of water bills by village councils and Municipalities in the Gaza Strip. Number of schools with at least one day of disruption – West Bank. Source: MoEHE, collected by UNICEF. The indicator “Complete disruption” indicates that all students and teachers were unable to reach their schools and, therefore, the school was closed on that day. “Partial disruption” indicates that some students and/or teachers were unable to reach their schools and, therefore, some classes were not in session.
Number of schools with at least one day of disruption – Gaza Strip. Source: MoEHE. This indicator shows access to schools for students.
54.
55.
56.
Sources of Sector Quotationsa. Protection of Civilians: Inter Agency Standing Committee (IASC)
b. Child Protection: UNICEF
c. Violence: Protocol � Additional to the Geneva Conventions, Article 5�
d. Access: Universal Declaration of Human Rights, Article ��
e. Access: International Covenant on Civil and Political Rights, Article �2 (�)
f. Socio Economic: Universal Declaration of Human Rights, Article 2�
g. Health: WHO
h. Health: WHO Constitution, �948
i. Food Security: FAO/WHO/WFP
j. Water and Sanitation: United Nations Committee on Economic, Social and Cultural Rights, General Comment No. �5 (November 2002)
k. Education: UNICEF
End NotesOf those who went to Mecca via Erez, only ��9 had returned by 8 January.
This reserve ran out on January 5.
There are 500 students enrolled in the college, studying in six technical, social, scientific, agricultural and administrative fields. The college awards both diplomas and BA certificates.
Figure is derived from combined B’tselem data regarding Palestinian children killed between the beginning of the second Intifada in September 2000 and �� December 2004 (6�8 Palestinian children) with OCHA data for Palestinian children killed in 2005, 2006, and 2007 (�07 Palestinian children).
Al Quds newspaper, �8 December 2007.
Items at zero level mean a stock of 0-� month, which is below the security level.
The common pediatric antibiotics in the oPt are: Cloxacillin, Rifampicin, Sulphamethoxazole and Trimethoprim, Erythromycin, Cephalexcin, and Amoxicillin.
The cytotoxic drugs are included in the EDL. The provision of these items is crucial in chemotherapy protocols and any interruption in the treatment cycle could be life-threatening. Currently, there are ��5 patients in need of the following items: Cisplatin; Etoposide �00mg; Methotrexate 50mg; Bleomycin �5; Calcium Folinate; Mitomycin, Chlorambucil, Hydroxy Urea, Mesna, Vincristin �mg, NaPamedronate, Taxotere 20mg and 80mg; Mabthera; Oxaliplatin; and Imitinab.
MMR vaccine should be taken at the age of �5 months.
Vitamin K is considered a life-saving drug for preventing internal bleeding among newborns, and is used as prophylactic drug in a 2ml dose and for curative purposes in a �0 ml dose.
WFP market visit surveys.
WFP market visit surveys.
�.
2.
�.
4.
5.
6.
7.
8.
9.
�0.
��.
�2.