HSBC Interim Report 2008
260
2008 Interim Report HSBC Holdings plc
-
Upload
quarterlyearningsreports2 -
Category
Documents
-
view
198 -
download
2
Transcript of HSBC Interim Report 2008

2008Interim ReportHSBC Holdings plc
HSBC Holdings plc8 Canada Square, London E14 5HQ, United KingdomTelephone: 44 020 7991 8888 Facsimile: 44 020 7992 4880www.hsbc.com
HSBC
Holdings plc
Interim Report 2008
H S B C H O L D I N G S P L C
Interim Report 2008
Headquartered in London, HSBC is one of the largest banking and financial services organisations in the world. Its international network comprises some 11,000 properties in 85 countries and territories in Europe; Hong Kong; Rest of Asia-Pacific, including the Middle East and Africa; North America and Latin America.
With listings on the London, Hong Kong, New York, Paris and Bermuda stock exchanges, shares in HSBC Holdings plc are held by about 200,000 shareholders in over 100 countries and territories. The shares are traded on the New York Stock Exchange in the form of American Depositary Shares.
HSBC provides a comprehensive range of financial services to more than 100 million customers through four customer groups and global businesses: Personal Financial Services (including consumer finance); Commercial Banking; Global Banking and Markets; and Private Banking.
Certain defined terms
Unless the context requires otherwise, ‘HSBC Holdings’ means HSBC Holdings plc and ‘HSBC’ or the ‘Group’ means HSBC Holdings together with its subsidiaries. Within this document, the Hong Kong Special Administrative Region of the People’s Republic of China is referred to as ‘Hong Kong’. When used in the terms ‘shareholders’ equity’ and ‘total shareholders’ equity’, ‘shareholders’ means holders of HSBC Holdings ordinary shares and those preference shares classified as equity.
The Interim Report 2008 of HSBC Holdings has been prepared in accordance with the requirements of English law, and liability in respect thereof is also governed by English law. In particular, the liability of the Directors for these reports is solely to HSBC Holdings. HSBC’s interim Financial Statements and Notes thereon, as set out on pages 207 to 236, have been prepared in accordance with International Accounting Standard (‘IAS’) 34 ‘Interim Financial Reporting’ as issued by the International Accounting Standards Board (‘IASB’) and endorsed by the European Union (‘EU’). The consolidated financial statements of HSBC at 31 December 2007 were prepared in accordance with International Financial Reporting Standards (‘IFRSs’) as issued by the IASB, and as endorsed by the EU. EU-endorsed IFRSs may differ from IFRSs as published by the IASB if, at any point in time, new or amended IFRSs have not been endorsed by the EU. At 30 June 2008, there were no unendorsed standards effective for the period ended 30 June 2008 affecting these consolidated financial statements, and there was no difference between IFRSs endorsed by the EU and IFRSs issued by the IASB in terms of their application to HSBC.
HSBC uses the US dollar as its presentation currency because the US dollar and currencies linked to it form the major currency bloc in which HSBC transacts its business. Unless otherwise stated, the information presented in this document has been prepared in accordance with IFRSs.
When reference is made to ‘underlying’ or ‘underlying basis’ in tables or commentaries, comparative information has been expressed at constant currency (see page 4) and adjusted for the effects of acquisitions and disposals.

H S B C H O L D I N G S P L C
Contents
1
Financial Highlights ...................................................................................................................................................................... 2 Group Chairman’s Statement ................................................................................................................................................ 5 Group Chief Executive’s Review .......................................................................................................................................... 7 Interim Management Report .................................................................................................................................................. 11
Business Review
Principal activities ................................................................ 11 Customer groups and global businesses .............................. 13 Strategic direction ................................................................. 11 Geographical regions ........................................................... 28 Reconciliation of reported and underlying profit ................. 11
Financial Review
Income statement .................................................................. 90 Loan impairment charges and other credit risk provisions . 103 Net interest income ............................................................... 92 Operating expenses .............................................................. 105 Net fee income ...................................................................... 94 Share of profit in associates and joint ventures ................... 107 Net trading income ............................................................... 96 Asset deployment ................................................................. 108 Net income/(expense) from financial instruments Trading assets, financial investments and derivatives.......... 109
designated at fair value ..................................................... 97 Funds under management .................................................... 109 Gains less losses from financial investments ....................... 99 Assets held in custody and under administration ................ 110 Net earned insurance premiums ........................................... 100 Review of transactions with related parties ......................... 110 Other operating income ........................................................ 101 Economic profit .................................................................... 110 Net insurance claims ............................................................. 102 Ratios of earnings to combined fixed charges ..................... 111
Impact of Market Turmoil
Background and disclosure policy ....................................... 112 Nature and extent of HSBC’s exposures ............................. 117 Overview of exposure ........................................................... 112 Fair values of financial instruments ..................................... 129 Business model ..................................................................... 115 Special purpose entities ........................................................ 137 Risk management ................................................................. 115 Other off-balance sheet arrangements Accounting policies .............................................................. 115 and commitments ............................................................. 151
Risk
Risk management ................................................................. 152 Operational risk .................................................................... 190 Credit risk ............................................................................. 152 Reputational risk .................................................................. 191 Liquidity and funding ........................................................... 179 Risk management of insurance operations .......................... 191 Market risk ............................................................................ 183 Capital management and allocation ..................................... 197 Board of Directors and Senior Management ................................................................................................................ 203 Financial Statements ................................................................................................................................................................... 207 Notes on the Financial Statements1 .................................................................................................................................. 211 Responsibility Statement ......................................................................................................................................................... 237 Review Report of the Auditors .............................................................................................................................................. 238 Additional Information ............................................................................................................................................................... 239
Directors’ interests ................................................................ 239 Final results and fourth interim dividend for 2008 .............. 250 Employee share plans ........................................................... 242 Corporate governance .......................................................... 250 Notifiable interests in share capital ...................................... 249 Telephone and online share-dealing service ........................ 251 Dealings in HSBC Holdings shares ..................................... 249 Stock codes ........................................................................... 251 Second interim dividend for 2008 ........................................ 249 Copies of the Interim Report 2008 and shareholder Proposed third interim dividend for 2008 ............................ 250 enquiries and communications ........................................ 251 Glossary of Terms and Index .................................................................................................................................................. 253
1 Detailed contents are provided on the referenced page.
H S B C H O L D I N G S P L C
Financial Highlights
2
For the half-year
• Net operating income before loan impairment charges up by US$982 million, 3 per cent, to US$39,475 million (US$38,493 million in the first half of 2007).
• Loan impairment charges and other credit risk provisions up by US$3,712 million (58 per cent) to US$10,058 million (US$6,346 million in the first half of 2007).
• Group pre-tax profit down by US$3,912 million (28 per cent) to US$10,247 million (US$14,159 million in the first half of 2007).
• Profit attributable to shareholders of the parent company down by US$3,173 million, 29 per cent, to US$7,722 million (US$10,895 million in the first half of 2007).
• Return on average shareholders’ equity of 12.1 per cent (19.1 per cent in the first half of 2007).
• Earnings per share down 32 per cent to US$0.65 (US$0.95 in the first half of 2007).
Dividends and capital position
• Second interim dividend for 2008 of US$0.18 per share which, together with the first interim dividend for 2008 of US$0.18 per share already paid, represents an increase of 6 per cent over the first and second interim dividends for 2007.
• Tier 1 capital ratio of 8.8 per cent and total capital ratio of 11.9 per cent.
Cautionary statement regarding forward-looking statements
This Interim Report 2008 contains certain forward-looking statements with respect to the financial condition, results of operations and business of HSBC. These forward-looking statements represent HSBC’s expectations or beliefs concerning future events and involve known and unknown risks and uncertainty that could cause actual results, performance or events to differ materially from those expressed or implied in such statements. For example, certain of the market risk disclosures, some of which are only estimates and, therefore, could be materially different from actual results, are dependent on key model characteristics and assumptions and are subject to various limitations. Certain statements, such as those that include the words ‘potential’, ‘value at risk’, ‘estimated’, ‘expects’, ‘anticipates’, ‘objective’, ‘intends’, ‘plans’, ‘believes’, ‘estimates’, and similar expressions or variations on such expressions may be considered ‘forward-looking statements’.
Written and/or oral forward-looking statements may also be made in the periodic reports to the US Securities and Exchange Commission (‘SEC’) on Form 20-F, Form 6-K, summary financial statements to shareholders, proxy statements, offering circulars and prospectuses, press releases and other written materials and in oral statements made by HSBC’s Directors, officers or employees to third parties, including financial analysts.
Forward-looking statements involve inherent risks and uncertainties. Readers should be cautioned that a number of factors could cause actual results to differ, in some instances materially, from those anticipated or implied in any forward-looking statement. Forward-looking statements speak only as of the date they are made, and it should not be assumed that they have been reviewed or updated in the light of new information or future events. Trends and factors that are expected to affect HSBC’s results of operations are described in the ‘Business Review’, the ‘Financial Review’, and ‘The Management of Risk’. A more detailed cautionary statement is given on pages 4 and 5 of the Annual Report and Accounts 2007.

3
Profitability and balance sheet data Half-year to 30 June
2008 US$m
30 June 2007 US$m
31 December 2007 US$m
For the period Total operating income .................................................................................... 42,912 42,092 45,509 Profit before tax ............................................................................................... 10,247 14,159 10,053 Profit attributable to shareholders of the parent company .............................. 7,722 10,895 8,238 Dividends ......................................................................................................... 6,823 6,192 4,049 At the period-end Total equity ...................................................................................................... 134,011 126,491 135,416 Total shareholders’ equity ............................................................................... 126,785 119,780 128,160 Capital resources1,2 .......................................................................................... 146,950 137,042 152,640 Customer accounts ........................................................................................... 1,161,923 980,832 1,096,140 Total assets ...................................................................................................... 2,546,678 2,150,441 2,354,266 Risk-weighted assets2 ...................................................................................... 1,231,481 1,041,540 1,123,782 US$ US$ US$ Per ordinary share Basic earnings .................................................................................................. 0.65 0.95 0.70 Diluted earnings ............................................................................................... 0.65 0.94 0.69 Dividends ......................................................................................................... 0.57 0.53 0.34 Net asset value at period end ........................................................................... 10.27 10.10 10.72 Capital and performance ratios (annualised)
% % % Capital ratios2 Tier 1 capital .................................................................................................... 8.8 9.3 9.3 Total capital ..................................................................................................... 11.9 13.2 13.6 Performance ratios Return on average invested capital3 ................................................................. 11.9 18.4 12.4 Return on average total shareholders’ equity4 ................................................. 12.1 19.1 13.0 Post-tax return on average total assets ............................................................. 0.68 1.19 0.78 Post-tax return on average risk-weighted assets ............................................. 1.39 2.30 1.63 Credit coverage ratios Loan impairment charges as a percentage of total operating income ............. 23.2 15.0 23.8 Loan impairment charges as a percentage of average gross customer
advances ...................................................................................................... 2.04 1.53 2.48 Total impairment allowances outstanding as a percentage of
impaired loans at period end ....................................................................... 108.1 98.4 104.9 Efficiency and revenue mix ratios Cost efficiency ratio5 ....................................................................................... 51.0 48.3 50.4 As a percentage of total operating income:
– net interest income .................................................................................. 49.4 43.3 43.0 – net fee income ......................................................................................... 25.6 24.9 25.3 – net trading income ................................................................................... 8.9 13.1 9.5
Financial ratio Average total shareholders’ equity to average total assets ............................. 5.2 5.9 5.5 1 Capital resources are total regulatory capital, the calculation of which is set out on page 201. 2 The calculation of capital resources, capital ratios and risk-weighted assets for 30 June 2008 is on a Basel II basis. Comparatives are
based on Basel I. 3 The definition of return on average invested capital and a reconciliation to the equivalent Generally Accepted Accounting Principles
(‘GAAP’) measures are set out on page 111. 4 The return on average total shareholders’ equity is defined as profit attributable to shareholders of the parent company divided by
average total shareholders’ equity. 5 The cost efficiency ratio is defined as total operating expenses divided by net operating income before loan impairment charges and
other credit risk provisions.

H S B C H O L D I N G S P L C
Financial Highlights (continued)
4
Share information
At 30 June
2008
At 30 June
2007
At 31 December
2007 US$0.50 ordinary shares in issue (million) ..................................................... 12,005 11,713 11,829 Market capitalisation (billion) ......................................................................... US$185 US$215 US$198 Closing market price per ordinary share:
– London .................................................................................................... £7.76 £9.15 £8.42 – Hong Kong .............................................................................................. HK$120.90 HK$142.50 HK$131.70
Closing market price per American Depositary Share (‘ADS’)1 .................... US$76.70 US$91.77 US$83.71 Over 1 year Over 3 years Over 5 years
HSBC total shareholder return to 30 June 20082 ............................................ 90.1 102.3 141.0 Benchmarks:
FTSE 1003 ................................................................................................... 88.4 122.2 166.0 MSCI World4 ............................................................................................... 89.8 131.1 180.6
1 Each ADS represents five ordinary shares. 2 Total shareholder return is defined on page 12 of the Annual Report and Accounts 2007. 3 The Financial Times Stock Exchange 100 Index. 4 The Morgan Stanley Capital International World Index.
Constant currency
Constant currency comparatives for the half-years to 30 June 2007 and 31 December 2007, used in the 2008 commentaries, are computed by retranslating into US dollars:
• the income statements for the half-years to 30 June 2007 and 31 December 2007 of non-US dollar branches, subsidiaries, joint ventures and associates at the average rates of exchange for the half-year to 30 June 2008; and
• the balance sheets at 30 June 2007 and 31 December 2007 for non-US dollar branches, subsidiaries, joint ventures and associates at the rates of exchange ruling at 30 June 2008.
No adjustment has been made to the exchange rates used to translate foreign currency denominated assets and liabilities into the functional currencies of any HSBC branches, subsidiaries, joint ventures or associates.
When reference is made to ‘constant currency’ or ‘constant exchange rates’ in tables or commentaries, comparative data reported in the functional currencies of HSBC’s operations have been translated at the appropriate exchange rates applied in the current period on the basis described above.

H S B C H O L D I N G S P L C
Group Chairman’s Statement
5
The first half of 2008 saw the most difficult financial markets for several decades, marked by significant declines in profitability throughout much of our industry, with consequent recapitalisation and restructuring. HSBC was not immune from the turmoil. Our pre-tax profit of US$10.2 billion was 28 per cent lower than in the first half of 2007. In the prevailing market conditions this is a resilient performance which enables us to maintain our capital strength, continue with our dividend policy and balance the need to conserve capital with our commitment to make it available for investment in our fast-growing businesses.
The Directors have approved a second interim dividend of US$0.18 per share, an increase of 6 per cent, which is payable on 8 October with a scrip alternative.
Resilient operating performance in the first half of 2008
In the first half of 2008 we remained profitable in all our customer groups. We also remained profitable in all of our geographical regions with the continuing exception of North America. Revenue rose by 3 per cent compared with the first half of 2007; loan impairments were up by 58 per cent but were 8 per cent lower than in the second half. Costs on an underlying basis were well contained, growing by only 4 per cent compared with the first half of 2007 and down by 2 per cent on the second half.
Compared with the second half of 2007, we improved profitability in all our customer groups and for the Group as a whole by 2 per cent. In particular, it is notable that profitability in Global Banking and Markets – where extremely difficult market conditions led to writedowns of US$3.9 billion – was 37 per cent higher than in the second half of 2007. Meanwhile, our US consumer finance business continued to face difficulties, but performed within our expectations, with loan impairments of US$6.6 billion, lower than in the second half of 2007 by 17 per cent. The Group Chief Executive’s Review covers our operational performance in more detail.
Financial strength maintained
HSBC’s commitment to maintaining its financial strength is unwavering. HSBC remains both strongly capitalised and liquid. The tier 1 capital ratio was 8.8 per cent and tier 1 capital grew by US$6.2 billion during the period. We have maintained our key credit ratings, generated good profitability in adverse market conditions and continued to focus investment on our strategic priorities.
Our principal concerns in this environment have been risk management, strict cost control, supporting our customers and continued investment to support our long-term strategic ambitions. Our broad-based and resilient revenue streams continue to provide a stable platform from which to achieve strong, long-term performance.
Strategic changes to HSBC’s shape
The sale of the regional bank network in France to Banque Populaire announced in February was completed on 2 July and a gain of US$2.1 billion will be recorded in our second half results. The HSBC business in France is now concentrated in France’s major urban areas, particularly Paris; the business is focused primarily on Global Banking and Markets, Premier, private banking and commercial banking, specifically for businesses involved in international markets.
We acquired the assets, liabilities and operations of The Chinese Bank in Taiwan in March, adding 36 branches and over one million customers to our operations in Asia’s fourth-largest banking market. In May, we announced an agreement to acquire 73.21 per cent of IL&FS Investsmart Ltd, a leading retail brokerage in India, for a total consideration of around US$260 million, giving us a securities presence alongside our banking and insurance businesses in Asia’s third largest economy.
Turbulent environment
The economic and financial environment deteriorated progressively through the first half of the year . In the major developed economies where we operate, economic growth slowed as asset prices, particularly of residential property, declined; this in turn affected consumer confidence and hence spending. In credit markets, illiquidity remained a major issue, with trading volumes low and no sign of resumption of normal activity levels in the securitisation markets. As a consequence, the banking system continued to deleverage, putting further pressure on asset prices and raising credit default risk.

H S B C H O L D I N G S P L C
Group Chairman’s Statement (continued)
6
In the emerging markets, where HSBC is the leading international bank, growth remained strong in the period as real asset prices continued to rise and infrastructure development continued to boost economic growth, which supported consumer confidence and spending. However, a number of these economies are now facing increasing inflationary pressures as their consumption of commodities, energy and foodstuffs grows.
Slowing global economy
The outlook for the near term remains highly challenging with significant uncertainty. Globally, consumer confidence is declining and despite the short-term success of the recent fiscal stimulus, the US economy continues to be weak, driven by continuing housing market difficulties. The UK and other economies in Europe which had enjoyed housing market booms, have also weakened. The decline in credit availability is accelerating this process.
We expect growth in emerging markets will hold up reasonably well, albeit with less momentum than in the recent past. In Asia, compared with the buoyant conditions of last year, it is apparent that corporate activity in some sectors is slowing and demand for equity-related and wealth products has reduced as equity markets have declined.
Positioning HSBC for long-term growth
It is clear that growth models in our industry based on high and increasing leverage will no longer be sustainable. It is also clear that complexity in financial services and the recent consequences of failed risk management need to be addressed. Along with its supervisors, our industry – including lenders, underwriters and investors – needs to reflect on the lessons for risk management, capital adequacy and funding. Ultimately, the real economy will recover from this crisis, although it may get worse before it gets better. Financial markets will not, and should not, return to the status quo ante.
Through this period of major uncertainty and beyond, we will continue to position HSBC for long-term growth. The major global long-term trends – the key drivers of change which underline our strategic thinking – remain intact. Emerging markets will grow faster than mature ones; world trade and investment will grow faster than world GDP; and the ageing of the world’s population continues. All of these trends have significant implications for financial services.
We will continue to build HSBC’s platform to serve our customers as these trends shape their societies, their businesses and their own needs. We will focus investment primarily on the faster growing markets and on servicing developed market customers with international connectivity. Our capital and balance sheet strength, and a commitment to strict cost control, will continue to underpin our performance.
While the near term poses real uncertainties and difficulties, it may also create opportunities for HSBC to accelerate the execution of our strategy. In a stressed environment, HSBC has the advantages of a powerful brand, a strong capital and funding position, and the ability to service our international customers around the world. We continue to have the capacity to deploy capital at a time when others may be constrained. The strength of our funding base means that, in many markets, we have an opportunity to attract new customers and deliver more for existing ones. We take a long-term view of our business and our customer relationships; we believe that this is the basis for sustainable long-term performance for our shareholders. We will never depart from this. With 335,000 colleagues, we will continue to serve our over 100 million customers around the world, working to fulfil their financial needs.
Stephen Green, Group Chairman 4 August 2008
H S B C H O L D I N G S P L C
Group Chief Executive’s Review
7
Resilient performance in a challenging environment
HSBC is the ‘world’s local bank’. And we are the world’s leading international bank in emerging markets. This gives us the opportunity to create value by focusing on faster growing markets, moving towards 60 per cent of our pre-tax profit coming from these economies over time. In developed markets, we are focusing both on businesses with international customers where emerging markets connectivity is critical and on businesses with local customers where our global scale means we can create efficiencies for them and us. Finally we have a suite of global products where we have a competitive advantage from scale, expertise and brand.
Our geographic balance and broad customer base is a protection which allowed us, in difficult markets, to achieve a pre-tax profit of US$10.2 billion, albeit 28 per cent lower than in the first half of 2007.
We measure our progress against key performance indicators. Our cost efficiency ratio of 51 per cent was within our range of 48-52 per cent, as we managed the balance between controlling costs and investing in the business.
Our total shareholder return was also on target for the period; top five in our peer group of 27 international banks.
On capital ratios, which reflect HSBC’s fundamental commitment to financial strength, our tier 1 ratio remained strong at 8.8 per cent, within the target range of 7.5-9 per cent.
Our return on average total shareholders’ equity at 12.1 per cent was below our target range of 15 to 19 per cent over the full cycle, but we would expect that in these difficult times.
Expanding Commercial Banking
Commercial Banking is a core business for us and it again performed strongly with pre-tax profit up by
35 per cent to US$4.6 billion. This included a gain of US$425 million from the sale of the UK card-acquiring business to a joint venture with Global Payments Inc. Excluding this, the growth was 22 per cent.
In keeping with our strategy, around 70 per cent of the business growth – excluding the card-acquiring gain – came from emerging economies, which now account for 54 per cent of Commercial Banking’s global profit before tax. Growth was strong in Asia-Pacific, Brazil and the Middle East, reflecting our established positions in these markets, particularly in mainland China, where we are substantially raising our Commercial Banking presence. In addition, profit before tax grew strongly in Brazil as transaction, lending and foreign exchange volumes grew, while loan impairment charges fell.
In the UK, profit before tax grew by 23 per cent, excluding the card acquiring gain, as Commercial Banking continued to expand with strong deposit growth, and increased fee income from card-issuing and foreign-exchange initiatives. Despite a 13 per cent growth in lending, we kept loan impairment charges in the UK broadly unchanged. In North America, profitability was affected by the slowing economy and by market interest rates. Loan impairment charges increased in both the US and Canada, while in the US and Bermuda, net interest income on liabilities was adversely affected by lower US dollar interest rates.
Commercial Banking grew its small business customer base by 8 per cent to 2.9 million, with particular growth in Turkey, Taiwan, India and mainland China. We are committed to the small business sector as a profit-growth opportunity, a strong source of deposits and fee income.
More and more of our commercial customers are now using our Business Direct service to do their banking online and by telephone. Since its launch in the UK two years ago, and in Brazil last year, over 150,000 businesses have signed up. We will launch in India and Northern Ireland in the second half.
We recognise that our particular advantage in the commercial markets sector is our ability to grow our cross-border income by being where our customers are, participating at both ends of international transactions. Our Commercial Banking revenues are growing at over four times the rate of world trade.
We are further developing our Global Links customer referral system, and cross-border referrals increased by 126 per cent to over 2,700. The

H S B C H O L D I N G S P L C
Group Chief Executive’s Review (continued)
8
aggregate value of these transactions increased by 83 per cent to US$5.6 billion. We continue to join up across functions, with revenues of Global Markets foreign exchange increasing by 44 per cent, and Commercial Banking referrals to Private Banking increasing net new money by 80 per cent.
Personal Financial Services: continued difficulties in the US, strength elsewhere
Profit before tax in Personal Financial Services fell by 51 per cent to US$2.3 billion. This was largely due to the higher loan impairment charges in the US consumer finance business. Elsewhere, the business performed strongly, with pre-tax profits excluding US consumer finance up by 23 per cent.
In emerging markets, we had a very strong six months. We maintained revenue momentum in Rest of Asia-Pacific as well as building out our branch network, with 63 new branches, notably in Greater China. We grew our business in the Middle East profitably on the back of balance sheet growth, and in Latin America with an increased share of credit cards in Mexico and strong deposit growth in Brazil.
We strengthened our position in the UK mortgage market with our successful RateMatcher campaign. Market share of new mortgage lending rose from 3 per cent in the first half of 2007 to 6 per cent in 2008, peaking at 12 per cent in May. We also grew our international customer base in France, through our Investor Services unit.
As part of our ‘Joining up the company’ strategy, we are focusing on attracting the affluent, high end, internationally mobile personal customers who we believe HSBC suits best. HSBC Premier was designed with these customers in mind. We attracted 208,000 new customers in the first half and now have close to 2.4 million in total. We are on track to achieve 2.6 million Premier customers by the end of the year.
We originally estimated that half of these customers would be new to HSBC but, in the period, over 80 per cent were new to the bank. Each customer generates an average annualised revenue of over US$2,000. This is further evidence that ‘Joining up the company’ is creating new revenue streams.
HSBC Direct, our online banking system, is also ahead of our expectations. In the face of the industry's desire to raise core deposits, we experienced stiff competition, particularly in the US, and it is testimony to our brand's strength that despite this, we increased our customer base by 15 per cent to 1.2 million customers and grew total deposits by 19 per cent to US$16.1 billion. The
intrinsic value of HSBC Direct will increase further as we begin to achieve cross-sales of other products to these customers.
We continued to expand One HSBC Cards, our global cards platform. In emerging markets, card growth was 5 per cent.
Personal Financial Services – US update
In the US, our Personal Financial Services business made a loss of US$2.2 billion. Loan impairment charges and other credit risk provisions rose by 85 per cent on the first half of 2007 to US$6.8 billion, but declined by 15 per cent compared with the second half. The US remains a difficult market, with rising unemployment and falling house prices, and we have recognised this with an impairment charge of US$527 million on the goodwill of our North American Personal Financial Services businesses at Group level.
We continued to take decisive action to mitigate our position. In the first half of 2008, excluding goodwill impairment, we reduced costs by 12 per cent compared with the first half of 2007. We continued to shrink the consumer lending branch network, from 1,000 to 900 branches.
Today, we have announced the run-off of our vehicle finance business. Our vehicle finance portfolio actually improved credit quality over the period but the business does not have sufficient critical mass or the pricing power to provide an acceptable return to the Group, and so we will not be originating further loans. We expect an orderly run-off of about 80 per cent of the portfolio of US$13 billion to be achieved in 3 years, with the remaining balance trailing off after that time.
Our US-based consumer finance business will now be focused mainly on cards and consumer lending.
In mortgage services, we reduced the portfolio outstandings by 13 per cent during the period, down from US$36 billion to US$31 billion, of which around 60 per cent was from repayments.
Emerging markets strength in Global Banking and Markets
Global Banking and Markets made a pre-tax profit of US$2.7 billion, down 35 per cent over the first half of 2007 but 37 per cent higher than in the second half. In emerging markets, profit before tax was up by 51 per cent.

9
We wrote down US$3.9 billion on credit trading, monoline exposures and leveraged acquisition financing loans. This reflected the effect of market illiquidity across all asset-backed and structured-product sectors. HSBC’s exposure to illiquid markets and the consequent uncertainty over mark-to-market values remains modest with only 3 per cent of our assets having to be valued with reference to significant unobservable price inputs. We have no material exposure to collateralised debt obligations backed by US sub-prime mortgages.
In the half, we created a stable funding basis for our Structured Investment Vehicles (‘SIVs’) by establishing new securities investment conduits. Since the end of 2007, assets held by the SIVs and the new conduits and consolidated on HSBC’s balance sheet have declined by US$11 billion to US$29 billion, primarily as assets have been sold or run off.
Our foreign exchange business reported record revenues. The gains reflected greater market volatility and higher customer volumes. Strong results were seen in Rates where increased customer activity and growth in deal volumes increased income.
Global Transaction Banking operates across Commercial Banking and Global Banking and Markets. It generated US$4.6 billion of revenue in the first half of 2008, up by US$0.7 billion. Payments and cash management revenues were 10 per cent ahead of the first half of 2007, the strong liability growth offsetting the effect of declining spreads following rate cuts. Trade and supply chain performed strongly, increasing by 27 per cent despite retail weakness in the US and the UK.
We continued to concentrate on Global Banking and Markets’ emerging markets-led and financing-focused strategy. The relevance of that cross-border strategy and the strength of HSBC’s corporate and institutional franchise was illustrated by the number of transactions in which we acted on behalf of our clients. In the first half of 2008, HSBC acted for more than 700 clients in 29 sectors in some 60 countries. The notional value of these transactions amounted to more than a trillion US dollars.
Recognition for what has been achieved included being awarded Best Emerging Market Bank by Euromoney. We closed a number of landmark cross-border deals, including Vale's US$12.2 billion global equity offering, the largest ever follow-on offering by a Latin American company. We advised Ford on the US$2.3 billion sale of its Jaguar and Land Rover businesses to Tata Motors and we were
sole book runner of PetroRabigh’s US$1.2 billion IPO, the first IPO by a Saudi Aramco affiliate.
Expanding Private Banking in emerging markets
Private Banking pre-tax profits increased by 5 per cent to US$822 million, primarily due to strong performances in Switzerland and Monaco. In difficult times, we increased total client assets by 1 per cent in the first half of 2008 to US$499 billion. Private Banking generates 59 per cent of its business from clients in emerging markets. We have recently opened three new Private Banking offices in mainland China.
Overall, referrals to Private Banking from other customer groups have increased by 28 per cent. Net new money from referrals is up over 70 per cent, to US$3.4 billion.
Building our insurance proposition
We continue to develop our insurance business worldwide, which now represents 16 per cent of the Group’s pre-tax profit. Premium growth was up by 30 per cent, driven mainly by Latin America, Hong Kong and Europe.
Insurance extended its reach with the start of operations in India and the launch of our joint venture in South Korea. Our Preferred Strategic Providers now operate in 23 countries with 82 product launches under way, emphasising the power of HSBC’s distribution capabilities.
We won several industry awards, including ‘Best Life Insurance Provider’ in Brazil and a Labels d’Excellence award in France.
Transforming our customers’ experience by ‘Joining up the company’
‘Joining up the company’ is about increasing revenues, particularly those which are new to the bank, and slowing cost growth. In previous paragraphs, I have outlined growth coming from Premier, Global Links and Private Banking and we expect this to continue. However, we are also working to develop the synergies that can be achieved by commonality of technology and process through ‘One HSBC’, particularly as it relates to reducing our cost base in developed markets. A slowing of the Group's cost growth is evident in our results for this half year.
One HSBC is our programme to re-engineer the company so that wherever possible we use global systems which provide leading customer experience and also drive down the cost of production. For
H S B C H O L D I N G S P L C
Group Chief Executive’s Review (continued)
10
example, One HSBC Call Centre is reducing call times for our customers’ most frequent transactions. One HSBC Collections improves our service and contact capabilities through holistic customer level views versus individual account views. About three-quarters of the Group’s global credit card base is now on the One HSBC Cards platform, and in 2008 we will be undertaking conversions in India and Indonesia. Standardising our service proposition under the One HSBC programme has cut our service interruptions in half.
We can now deploy One HSBC systems in a country as a fully integrated package. This is particularly beneficial in our emerging markets as the suite reduces bespoke software costs as well as producing operating benefits. In the first half of 2008, we deployed the One HSBC suite in seven countries (Poland, Brunei, Australia, Russia, Chile, Indonesia and Slovakia). We aim to deploy it in another seven countries in the second half of the year. Migration to our standard One HSBC will play a major part in creating value for customers and shareholders in the coming years. I will update you on our further progress at the year-end.
Continued focus on financial strength
We live in uncertain times, but we have a clear strategy that we are implementing in a focused and effective way. In April, HSBC was named the number one company in the Forbes 2000 list of the world’s largest companies – the first time a non-US company has topped the list. We were also named
the number one bank of The Banker’s Top 1000 World Banks 2008, for total tier 1 capital.
Our current customers, and our new customers, know we are here to serve and support them, wherever they wish to do business under the HSBC brand in the 85 countries and territories in which we operate.
We know that to extract HSBC’s full value for shareholders, we must continue to join up the company for the benefit of all. We have a long way to go, but value can and will be created by staying focused on this objective.
I would like to thank all our 335,000 staff for serving our over 100 million customers and protecting the interests of our 200,000 shareholders by remaining true to the fundamental principles of HSBC.
Michael Geoghegan, Group Chief Executive 4 August 2008
H S B C H O L D I N G S P L C
Interim Management Report: Business Review
11
Principal activities
HSBC is one of the largest banking and financial services organisations in the world, with a market capitalisation of US$185 billion at 30 June 2008.
Through its subsidiaries and associates, HSBC provides a comprehensive range of banking and related financial services. Headquartered in London, HSBC operates through long-established businesses and has an international network of some 11,000 properties in 85 countries and territories in five geographical regions: Europe; Hong Kong; Rest of Asia-Pacific, including the Middle East and Africa; North America; and Latin America. Within these regions, a comprehensive range of financial services is offered to personal, commercial, corporate, institutional, investment and private banking clients. Services are delivered primarily by domestic or regional banks, typically with large retail deposit bases, and by consumer finance operations.
Strategic direction
HSBC’s strategic direction reflects its position as ‘The world’s local bank’, combining the largest global emerging markets banking business and a uniquely cosmopolitan customer base with an extensive international network and substantial financial strength.
The Group’s strategy is aligned with key trends which are shaping the global economy. In particular, HSBC recognises that, over the long term, developing markets are growing faster than the mature economies, world trade is expanding at a greater rate than GDP and life expectancy is lengthening virtually everywhere. Against this backdrop, HSBC’s strategy is focused on delivering superior growth and earnings over time by building on the Group’s heritage and skills. Its origins in trade in Asia have had a considerable influence over the development of the Group and, as a consequence, HSBC has an established and longstanding presence in many countries. The combination of local knowledge and international breadth is supported by a substantial financial capability founded on balance sheet strength, largely attributable to the scale of the Group’s retail deposit bases.
HSBC is progressively reshaping its business by investing primarily in faster growing markets and, in the more developed markets, by focusing on businesses which have international connectivity. Central to these reshaping activities is a policy of maintaining HSBC’s capital strength and strong liquidity position.
The Group has identified three main business models for its customer groups and global businesses that embody HSBC’s areas of natural advantage:
• businesses with international customers for whom developing markets connectivity is crucial – Global Banking and Markets, Private Banking, the large business segment of Commercial Banking and the mass affluent segment of Personal Financial Services;
• businesses with local customers where efficiency can be enhanced through global scale – the small business segment of Commercial Banking and the mass market segment of Personal Financial Services; and
• products where global scale is possible through building efficiency, expertise and brand – global product platforms such as cards and direct banking.
The means of executing the strategy, and further utilising the linkages within the Group, are clear:
• the HSBC brand and global networks will be leveraged to reach new customers and offer further services to existing clients;
• efficiency will be enhanced by taking full advantage of local, regional and global economies of scale, in particular by adopting a common systems architecture wherever possible; and
• objectives and incentives will be aligned to motivate and reward staff for being fully engaged in delivering the strategy.
Reconciliation of reported and underlying profit before tax
HSBC measures its performance internally on a like-for-like basis, eliminating the effects of Group currency translation gains and losses, acquisitions and disposals of subsidiaries and businesses and gains from the dilution of the Group’s interests in associates, which distort the period-on-period comparison. HSBC refers to this as its underlying performance.
The tables below show the underlying performance of HSBC for the half-year to 30 June 2008 compared with the half-years to 30 June 2007 and 31 December 2007. Equivalent tables are provided for each of HSBC’s customer groups and geographical segments in their respective sections below.
The main differences between HSBC’s reported and underlying financial performance were:

H S B C H O L D I N G S P L C
Interim Management Report: Business Review (continued)
12
• Foreign currency translation differences were most significant in Europe due to the size of HSBC’s operations in the UK. The Group’s profit before tax for the first half of 2008 decreased by 28 per cent compared with the first half of 2007. The effect of the change in foreign currency translation rates accounted for an increase of 4 percentage points. The equivalents for the first half of 2008 compared with the second half of 2007 were increases of 2 per cent and 1 per cent, respectively.
• There were a number of acquisitions and disposals that affected both comparisons. The most significant were the acquisitions of
HSBC’s partner’s share in life insurer, Erisa S.A., and property and casualty insurer, Erisa I.A.R.D. (together now renamed ‘HSBC Assurances’) in France in March 2007, and the assets and liabilities of The Chinese Bank in Taiwan in March 2008; and the deemed disposals of the stakes in Ping An Insurance (Group) Company of China, Limited (‘Ping An Insurance’), Bank of Communications Limited (‘Bank of Communications’) and Industrial Bank Co. Limited (‘Industrial Bank’), as a consequence of their making share offerings on the domestic ‘A’ share market in mainland China in the first half of 2007.
Half-year to 30 June 2008 (‘1H08’) compared with half-year to 30 June 2007 (‘1H07’)
HSBC
1H07 as reported US$m
Disposals and dilution gains1
US$m
Currency translation2
US$m
1H07 at 1H08 exchange rates US$m
Acqui- sitions1
US$m
Under- lying change US$m
1H08 as reported US$m
Re- ported change %
Under- lying change %
Net interest income .......... 18,230 (7) 587 18,810 158 2,210 21,178 16 12 Net fee income ................. 10,495 70 351 10,916 (45) 120 10,991 5 1 Other income3 .................. 9,768 (1,177) 393 8,984 (45) (1,633) 7,306 (25) (18)
Net operating income4 ... 38,493 (1,114) 1,331 38,710 68 697 39,475 3 2
Loan impairment charges and other credit risk provisions .................... (6,346) – (124) (6,470) – (3,588) (10,058) (58) (55)
Net operating income .... 32,147 (1,114) 1,207 32,240 68 (2,891) 29,417 (8) (9)
Operating expenses .......... (18,611) 55 (738) (19,294) (28) (818) (20,140) (8) (4)
Operating profit ............. 13,536 (1,059) 469 12,946 40 (3,709) 9,277 (31) (29)
Income from associates ... 623 – 48 671 (12) 311 970 56 46
Profit before tax ............. 14,159 (1,059) 517 13,617 28 (3,398) 10,247 (28) (25)
Half-year to 30 June 2008 (‘1H08’) compared with half-year to 31 December 2007 (‘2H07’)
HSBC
2H07 as reported US$m
Disposals and dilution gains1
US$m
Currency translation2
US$m
2H07 at 1H08 exchange rates US$m
Acqui- sitions1
US$m
Under- lying change US$m
1H08 as reported US$m
Re- ported change %
Under- lying change %
Net interest income .......... 19,565 (5) 213 19,773 8 1,397 21,178 8 7 Net fee income ................. 11,507 (52) 98 11,553 1 (563) 10,991 (4) (5)Other income3 .................. 9,428 (15) 16 9,429 4 (2,127) 7,306 (23) (23)
Net operating income4 ..... 40,500 (72) 327 40,755 13 (1,293) 39,475 (3) (3)
Loan impairment charges and other credit risk provisions .................... (10,896) – (22) (10,918) – 860 (10,058) 8 8
Net operating income ...... 29,604 (72) 305 29,837 13 (433) 29,417 (1) (1)
Operating expenses .......... (20,431) 50 (227) (20,608) (11) 479 (20,140) 1 2
Operating profit ............... 9,173 (22) 78 9,229 2 46 9,277 1 –
Income from associates ... 880 – 37 917 – 53 970 10 6
Profit before tax ............... 10,053 (22) 115 10,146 2 99 10,247 2 1
For footnotes, see page 89.

13
Customer groups and global businesses
Summary
HSBC manages its business through two customer groups, Personal Financial Services and Commercial Banking, and two global businesses, Global Banking
and Markets, and Private Banking. Personal Financial Services incorporates the Group’s consumer finance businesses.
Profit before tax
Half-year to 30 June 2008 30 June 2007 31 December 2007 US$m % US$m % US$m % Personal Financial Services .................................................. 2,313 22.6 4,729 33.4 1,171 11.7 Commercial Banking ............................................................ 4,611 45.0 3,422 24.2 3,723 37.0 Global Banking and Markets ................................................ 2,690 26.2 4,158 29.4 1,963 19.5 Private Banking .................................................................... 822 8.0 780 5.5 731 7.3 Other5 .................................................................................... (189) (1.8) 1,070 7.5 2,465 24.5
10,247 100.0 14,159 100.0 10,053 100.0
Total assets6
At 30 June 2008 At 30 June 2007 At 31 December 2007 US$m % US$m % US$m % Personal Financial Services .................................................. 603,016 23.7 577,402 26.9 588,473 25.0 Commercial Banking ............................................................ 286,533 11.2 225,763 10.5 261,893 11.1 Global Banking and Markets ................................................ 1,509,390 59.3 1,220,316 56.7 1,375,240 58.4 Private Banking .................................................................... 98,039 3.8 81,916 3.8 88,510 3.8 Other ..................................................................................... 49,700 2.0 45,044 2.1 40,150 1.7
2,546,678 100.0 2,150,441 100.0 2,354,266 100.0
For footnotes, see page 89.
Basis of preparation
Customer group results are presented in accordance with the accounting policies used in the preparation of HSBC’s consolidated financial statements. HSBC’s operations are closely integrated and, accordingly, the presentation of customer group data includes internal allocations of certain items of income and expense. These allocations include the costs of certain support services and head office functions, to the extent that these can be
meaningfully attributed to operational business lines. While such allocations have been made on a systematic and consistent basis, they necessarily involve a degree of subjectivity.
Where relevant, income and expense amounts presented include the results of inter-segment funding as well as inter-company and inter-business line transactions. All such transactions are undertaken on arm’s length terms.

H S B C H O L D I N G S P L C
Interim Management Report: Business Review (continued)
14
Personal Financial Services
Profit before tax
Half-year to 30 June
2008 30 June 2007
31 December 2007
US$m US$m US$m
Net interest income ........... 15,217 13,998 15,071
Net fee income .................. 5,626 5,523 6,219
Trading income excluding net interest income ....... 142 1 37
Net interest income on trading activities ...... 42 92 48
Net trading income7 .......... 184 93 85 Net income/(expense) from
financial instruments designated at fair value . (1,135) 796 537
Gains less losses from financial investments .... 585 60 291
Dividend income ............... 15 41 14 Net earned insurance
premiums ...................... 4,746 3,735 4,536 Other operating income .... 390 255 132
Total operating income .. 25,628 24,501 26,885
Net insurance claims8 ....... (3,206) (3,605) (4,542)
Net operating income4 ..... 22,422 20,896 22,343
Loan impairment charges and other credit risk provisions ..................... (9,384) (5,928) (10,244)
Net operating income ..... 13,038 14,968 12,099
Total operating expenses .. (11,099) (10,452) (11,305)
Operating profit .............. 1,939 4,516 794
Share of profit in associates and joint ventures ......... 374 213 377
Profit before tax .............. 2,313 4,729 1,171
By geographical region Europe ............................... 1,324 604 977 Hong Kong ....................... 2,036 1,898 2,314 Rest of Asia-Pacific .......... 535 351 409 North America .................. (2,050) 1,488 (3,034)Latin America ................... 468 388 505
Profit before tax ................ 2,313 4,729 1,171 % % % Share of HSBC’s profit
before tax ...................... 22.6 33.4 11.7
Cost efficiency ratio ......... 49.5 50.0 50.6 Balance sheet data6 US$m US$m US$m Loans and advances to
customers (net) ............. 458,302 460,196 464,726 Total assets ....................... 603,016 577,402 588,473 Customer accounts ............ 474,263 416,525 450,071
For footnotes, see page 89.
Business highlights • Profit before tax in Personal Financial Services
was US$2.4 billion lower than that reported in the first half of 2007 and was 53 per cent lower on an underlying basis, primarily because of higher loan impairment charges in the US consumer finance business. Excluding this business, pre-tax profits rose by 23 per cent, 18 per cent on an underlying basis. Compared with the second half of 2007, on an underlying basis, profit before tax in Personal Financial Services was 89 per cent higher as both loan impairment charges and operating expenses fell.
• Market turmoil in the first half of 2008 led retail customers to move their assets from investment products into bank deposits and concentrate their savings in the largest and best regarded financial institutions. HSBC benefited from both these trends with customer accounts growing by US$24.2 billion or 5 per cent in the period.
• HSBC Premier (‘Premier’), the Group’s global banking service which offers affluent customers a seamless international service, continued to build on the success of its relaunch in 2007. In the first half of 2008, the service was extended to a further four countries, with a fifth added in July, taking the total to forty. 208,000 net new customers joined Premier, of whom more than 80 per cent were new to the Group. At 30 June 2008, HSBC had 2.4 million Premier customers who, on average, each generated more than US$2,000 of annualised revenues.
• HSBC Direct, the Group’s online banking product suite, continued to expand in the four markets in which the product has been launched to date. In aggregate, HSBC Direct balances reached US$16.1 billion and customer numbers 1.2 million, increases of 19 per cent and 15 per cent, respectively, from 31 December 2007.
• HSBC’s focus on emerging markets was reflected in growth in cards in force of 5 per cent in these countries compared with 31 December 2007.
• In the UK, HSBC successfully launched a RateMatcher promotion to attract higher quality customers facing an interest rate reset in the near term. In the three months of the offer, HSBC attracted a strong flow of new business, both for the RateMatcher product and other mortgages. Overall, HSBC attracted US$11 billion of balances during the campaign.
15
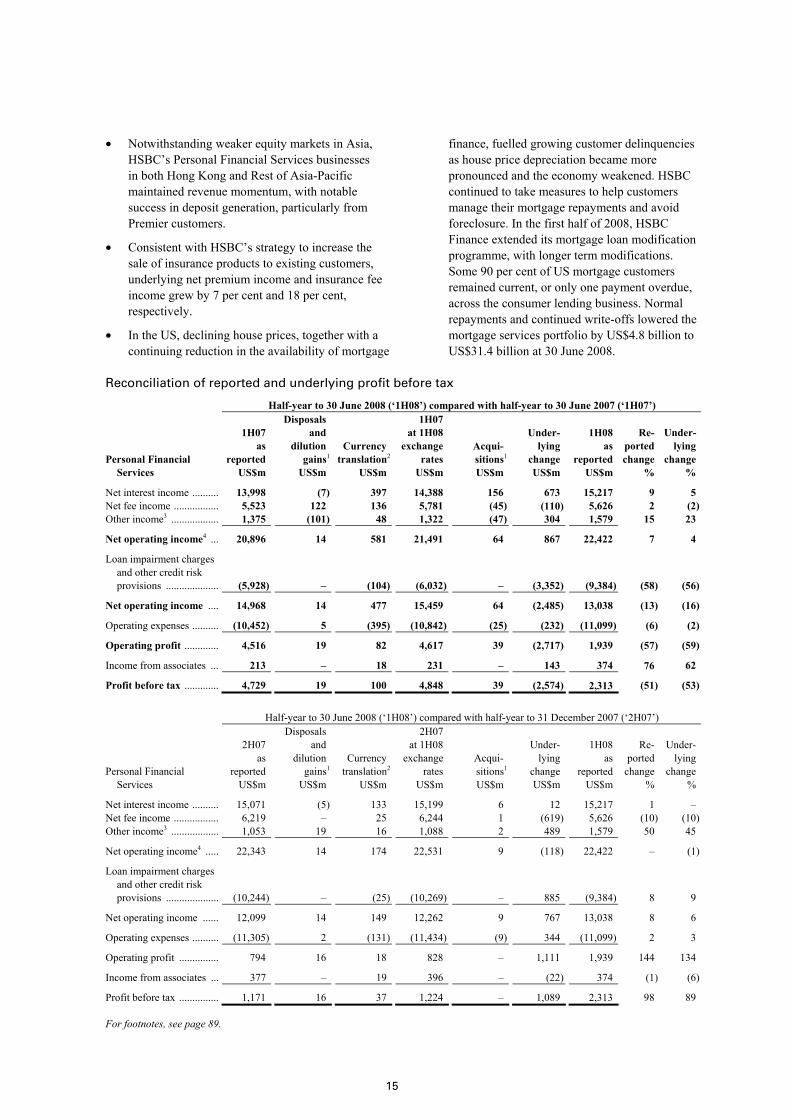
• Notwithstanding weaker equity markets in Asia, HSBC’s Personal Financial Services businesses in both Hong Kong and Rest of Asia-Pacific maintained revenue momentum, with notable success in deposit generation, particularly from Premier customers.
• Consistent with HSBC’s strategy to increase the sale of insurance products to existing customers, underlying net premium income and insurance fee income grew by 7 per cent and 18 per cent, respectively.
• In the US, declining house prices, together with a continuing reduction in the availability of mortgage
finance, fuelled growing customer delinquencies as house price depreciation became more pronounced and the economy weakened. HSBC continued to take measures to help customers manage their mortgage repayments and avoid foreclosure. In the first half of 2008, HSBC Finance extended its mortgage loan modification programme, with longer term modifications. Some 90 per cent of US mortgage customers remained current, or only one payment overdue, across the consumer lending business. Normal repayments and continued write-offs lowered the mortgage services portfolio by US$4.8 billion to US$31.4 billion at 30 June 2008.
Reconciliation of reported and underlying profit before tax
Half-year to 30 June 2008 (‘1H08’) compared with half-year to 30 June 2007 (‘1H07’)
Personal Financial Services
1H07 as reported US$m
Disposals and dilution gains1
US$m
Currency translation2
US$m
1H07 at 1H08 exchange rates US$m
Acqui- sitions1
US$m
Under- lying change US$m
1H08 as reported US$m
Re- ported change %
Under- lying change %
Net interest income .......... 13,998 (7) 397 14,388 156 673 15,217 9 5 Net fee income ................. 5,523 122 136 5,781 (45) (110) 5,626 2 (2)Other income3 .................. 1,375 (101) 48 1,322 (47) 304 1,579 15 23
Net operating income4 ... 20,896 14 581 21,491 64 867 22,422 7 4
Loan impairment charges and other credit risk provisions .................... (5,928) – (104) (6,032) – (3,352) (9,384) (58) (56)
Net operating income .... 14,968 14 477 15,459 64 (2,485) 13,038 (13) (16)
Operating expenses .......... (10,452) 5 (395) (10,842) (25) (232) (11,099) (6) (2)
Operating profit ............. 4,516 19 82 4,617 39 (2,717) 1,939 (57) (59)
Income from associates ... 213 – 18 231 – 143 374 76 62
Profit before tax ............. 4,729 19 100 4,848 39 (2,574) 2,313 (51) (53)
Half-year to 30 June 2008 (‘1H08’) compared with half-year to 31 December 2007 (‘2H07’)
Personal Financial Services
2H07 as reported US$m
Disposals and dilution gains1
US$m
Currency translation2
US$m
2H07 at 1H08 exchange rates US$m
Acqui- sitions1
US$m
Under- lying change US$m
1H08 as reported US$m
Re- ported change %
Under- lying change %
Net interest income .......... 15,071 (5) 133 15,199 6 12 15,217 1 – Net fee income ................. 6,219 – 25 6,244 1 (619) 5,626 (10) (10)Other income3 .................. 1,053 19 16 1,088 2 489 1,579 50 45
Net operating income4 ..... 22,343 14 174 22,531 9 (118) 22,422 – (1)
Loan impairment charges and other credit risk provisions .................... (10,244) – (25) (10,269) – 885 (9,384) 8 9
Net operating income ...... 12,099 14 149 12,262 9 767 13,038 8 6
Operating expenses .......... (11,305) 2 (131) (11,434) (9) 344 (11,099) 2 3
Operating profit ............... 794 16 18 828 – 1,111 1,939 144 134
Income from associates ... 377 – 19 396 – (22) 374 (1) (6)
Profit before tax ............... 1,171 16 37 1,224 – 1,089 2,313 98 89
For footnotes, see page 89.
H S B C H O L D I N G S P L C
Interim Management Report: Business Review (continued)
16
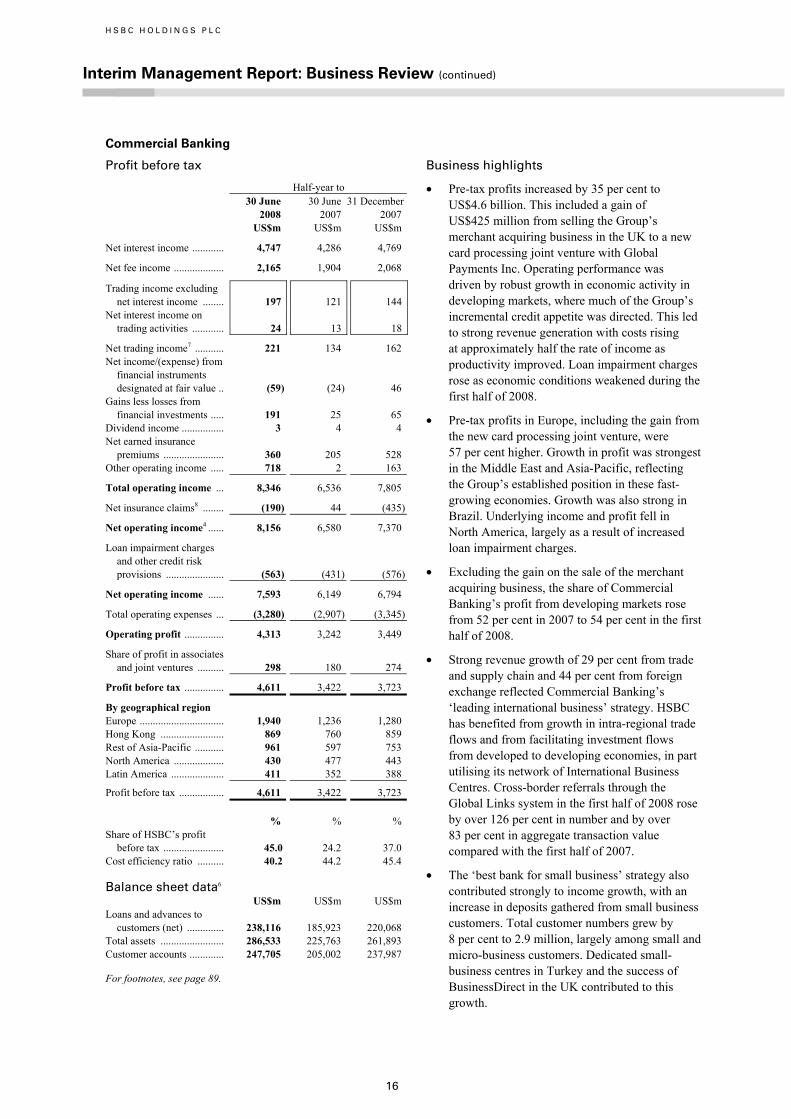
Commercial Banking
Profit before tax
Half-year to 30 June
2008 30 June 2007
31 December 2007
US$m US$m US$m
Net interest income ............ 4,747 4,286 4,769
Net fee income ................... 2,165 1,904 2,068
Trading income excluding net interest income ........ 197 121 144
Net interest income on trading activities ............ 24 13 18
Net trading income7 ........... 221 134 162 Net income/(expense) from
financial instruments designated at fair value .. (59) (24) 46
Gains less losses from financial investments ..... 191 25 65
Dividend income ................ 3 4 4 Net earned insurance
premiums ....................... 360 205 528 Other operating income ..... 718 2 163
Total operating income ... 8,346 6,536 7,805
Net insurance claims8 ........ (190) 44 (435)
Net operating income4 ...... 8,156 6,580 7,370
Loan impairment charges and other credit risk provisions ...................... (563) (431) (576)
Net operating income ...... 7,593 6,149 6,794
Total operating expenses ... (3,280) (2,907) (3,345)
Operating profit ............... 4,313 3,242 3,449
Share of profit in associates and joint ventures .......... 298 180 274
Profit before tax ............... 4,611 3,422 3,723
By geographical region Europe ................................ 1,940 1,236 1,280 Hong Kong ........................ 869 760 859 Rest of Asia-Pacific ........... 961 597 753 North America ................... 430 477 443 Latin America .................... 411 352 388
Profit before tax ................. 4,611 3,422 3,723 % % % Share of HSBC’s profit
before tax ....................... 45.0 24.2 37.0
Cost efficiency ratio .......... 40.2 44.2 45.4 Balance sheet data6 US$m US$m US$m Loans and advances to
customers (net) .............. 238,116 185,923 220,068 Total assets ........................ 286,533 225,763 261,893 Customer accounts ............. 247,705 205,002 237,987
For footnotes, see page 89.
Business highlights • Pre-tax profits increased by 35 per cent to
US$4.6 billion. This included a gain of US$425 million from selling the Group’s merchant acquiring business in the UK to a new card processing joint venture with Global Payments Inc. Operating performance was driven by robust growth in economic activity in developing markets, where much of the Group’s incremental credit appetite was directed. This led to strong revenue generation with costs rising at approximately half the rate of income as productivity improved. Loan impairment charges rose as economic conditions weakened during the first half of 2008.
• Pre-tax profits in Europe, including the gain from the new card processing joint venture, were 57 per cent higher. Growth in profit was strongest in the Middle East and Asia-Pacific, reflecting the Group’s established position in these fast-growing economies. Growth was also strong in Brazil. Underlying income and profit fell in North America, largely as a result of increased loan impairment charges.
• Excluding the gain on the sale of the merchant acquiring business, the share of Commercial Banking’s profit from developing markets rose from 52 per cent in 2007 to 54 per cent in the first half of 2008.
• Strong revenue growth of 29 per cent from trade and supply chain and 44 per cent from foreign exchange reflected Commercial Banking’s ‘leading international business’ strategy. HSBC has benefited from growth in intra-regional trade flows and from facilitating investment flows from developed to developing economies, in part utilising its network of International Business Centres. Cross-border referrals through the Global Links system in the first half of 2008 rose by over 126 per cent in number and by over 83 per cent in aggregate transaction value compared with the first half of 2007.
• The ‘best bank for small business’ strategy also contributed strongly to income growth, with an increase in deposits gathered from small business customers. Total customer numbers grew by 8 per cent to 2.9 million, largely among small and micro-business customers. Dedicated small-business centres in Turkey and the success of BusinessDirect in the UK contributed to this growth.
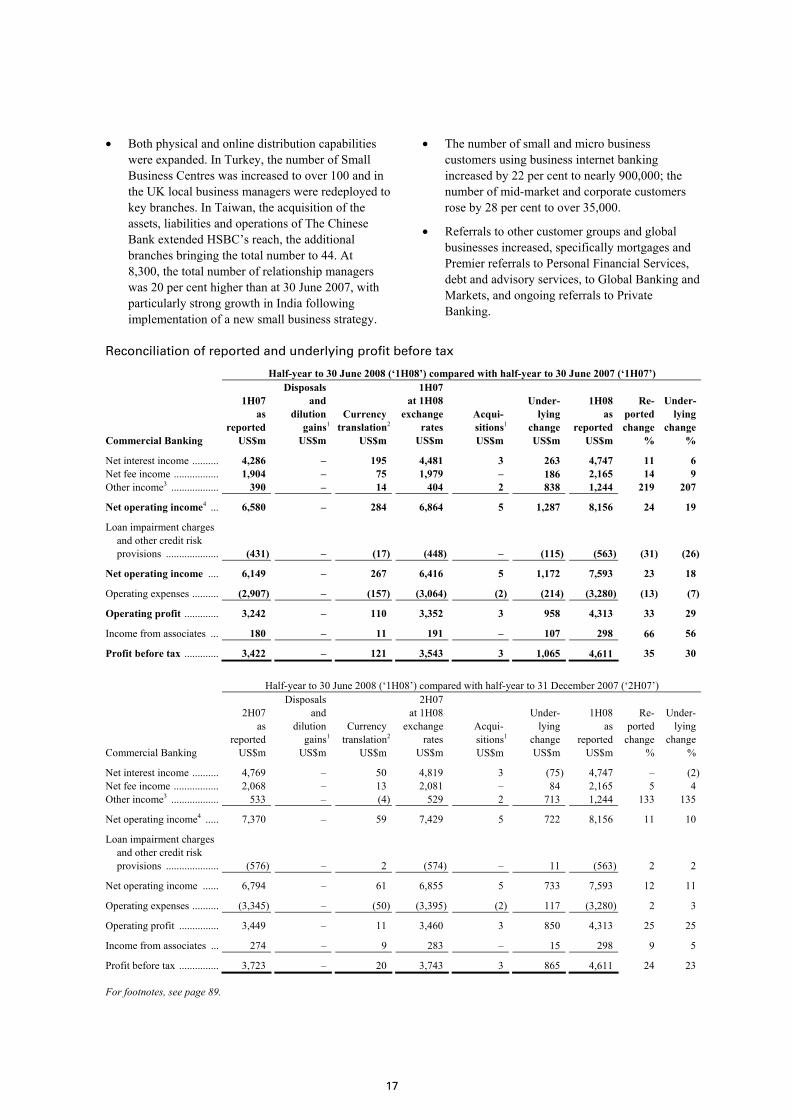
17
• Both physical and online distribution capabilities were expanded. In Turkey, the number of Small Business Centres was increased to over 100 and in the UK local business managers were redeployed to key branches. In Taiwan, the acquisition of the assets, liabilities and operations of The Chinese Bank extended HSBC’s reach, the additional branches bringing the total number to 44. At 8,300, the total number of relationship managers was 20 per cent higher than at 30 June 2007, with particularly strong growth in India following implementation of a new small business strategy.
• The number of small and micro business customers using business internet banking increased by 22 per cent to nearly 900,000; the number of mid-market and corporate customers rose by 28 per cent to over 35,000.
• Referrals to other customer groups and global businesses increased, specifically mortgages and Premier referrals to Personal Financial Services, debt and advisory services, to Global Banking and Markets, and ongoing referrals to Private Banking.
Reconciliation of reported and underlying profit before tax
Half-year to 30 June 2008 (‘1H08’) compared with half-year to 30 June 2007 (‘1H07’)
Commercial Banking
1H07 as reported US$m
Disposals and dilution gains1
US$m
Currency translation2
US$m
1H07 at 1H08 exchange rates US$m
Acqui- sitions1
US$m
Under- lying change US$m
1H08 as reported US$m
Re- ported change %
Under- lying change %
Net interest income .......... 4,286 – 195 4,481 3 263 4,747 11 6 Net fee income ................. 1,904 – 75 1,979 – 186 2,165 14 9 Other income3 .................. 390 – 14 404 2 838 1,244 219 207
Net operating income4 ... 6,580 – 284 6,864 5 1,287 8,156 24 19
Loan impairment charges and other credit risk provisions .................... (431) – (17) (448) – (115) (563) (31) (26)
Net operating income .... 6,149 – 267 6,416 5 1,172 7,593 23 18
Operating expenses .......... (2,907) – (157) (3,064) (2) (214) (3,280) (13) (7)
Operating profit ............. 3,242 – 110 3,352 3 958 4,313 33 29
Income from associates ... 180 – 11 191 – 107 298 66 56
Profit before tax ............. 3,422 – 121 3,543 3 1,065 4,611 35 30
Half-year to 30 June 2008 (‘1H08’) compared with half-year to 31 December 2007 (‘2H07’)
Commercial Banking
2H07 as reported US$m
Disposals and dilution gains1
US$m
Currency translation2
US$m
2H07 at 1H08 exchange rates US$m
Acqui- sitions1
US$m
Under- lying change US$m
1H08 as reported US$m
Re- ported change %
Under- lying change %
Net interest income .......... 4,769 – 50 4,819 3 (75) 4,747 – (2)Net fee income ................. 2,068 – 13 2,081 – 84 2,165 5 4 Other income3 .................. 533 – (4) 529 2 713 1,244 133 135
Net operating income4 ..... 7,370 – 59 7,429 5 722 8,156 11 10
Loan impairment charges and other credit risk provisions .................... (576) – 2 (574) – 11 (563) 2 2
Net operating income ...... 6,794 – 61 6,855 5 733 7,593 12 11
Operating expenses .......... (3,345) – (50) (3,395) (2) 117 (3,280) 2 3
Operating profit ............... 3,449 – 11 3,460 3 850 4,313 25 25
Income from associates ... 274 – 9 283 – 15 298 9 5
Profit before tax ............... 3,723 – 20 3,743 3 865 4,611 24 23
For footnotes, see page 89.

H S B C H O L D I N G S P L C
Interim Management Report: Business Review (continued)
18
Global Banking and Markets
Profit before tax
Half-year to 30 June
2008 30 June 2007
31 December 2007
US$m US$m US$m
Net interest income ............ 3,737 1,847 2,583
Net fee income ................... 2,354 2,264 2,637
Trading income excluding net interest income ........ 360 3,048 455
Net interest income/ (expense) on trading activities ......................... 273 (151) (85)
Net trading income7 ........... 633 2,897 370 Net income/(expense) from
financial instruments designated at fair value .. (211) 11 (175)
Gains less losses from financial investments ..... 244 768 545
Dividend income ................ 49 175 47 Net earned insurance
premiums ....................... 62 46 47 Other operating income ..... 551 529 689
Total operating income ... 7,419 8,537 6,743
Net insurance claims8 ........ (40) (38) (32)
Net operating income4 ...... 7,379 8,499 6,711
Net loan impairment (charges)/recoveries and other credit risk provisions ...................... (115) 24 (62)
Net operating income ...... 7,264 8,523 6,649
Total operating expenses ... (4,827) (4,479) (4,879)
Operating profit ............... 2,437 4,044 1,770
Share of profit in associates and joint ventures .......... 253 114 193
Profit before tax ............... 2,690 4,158 1,963 By geographical region Europe ................................ 1,190 1,674 853 Hong Kong ........................ 770 697 881 Rest of Asia-Pacific ........... 1,972 1,098 1,366 North America ................... (1,625) 436 (1,401)Latin America .................... 383 253 264
Profit before tax ................. 2,690 4,158 1,963 % % % Share of HSBC’s profit
before tax ....................... 26.2 29.4 19.5
Cost efficiency ratio .......... 65.4 52.7 72.7
For footnotes, see page 89.
Business highlights • In the most difficult financial market conditions
seen for many decades, Global Banking and Markets delivered pre-tax profits of US$2.7 billion, an improvement of US$727 million or 37 per cent on the six months ended 31 December 2007 but some US$1.5 billion lower than in the first half of 2007.
• The result reflected a total of US$3.9 billion of write-downs on credit trading, leveraged and acquisition financing positions and monoline credit exposures resulting from the continued deterioration in the credit markets. This compared with US$2.1 billion for the second half of 2007 and nil for the first half of 2007. Partly offsetting this was a US$262 million fair value gain on the widening of credit spreads on structured liabilities.
• Notwithstanding the challenging market conditions in credit trading and Principal Investments, where the opportunities to realise assets diminished in 2008, other businesses performed very well. The ‘emerging markets-led and financing-focused’ strategy continued to ensure that HSBC was well positioned to support clients as they undertook cross-border transactions into and out of emerging markets.
• In Global Markets, the foreign exchange business reported record revenues. This reflected greater market volatility and higher customer volumes.
• Strong results were seen in Rates, where increased customer activity and growth in deal volumes resulted in income rising by 120 per cent. In equities, excluding the effect of the gain on sale of HSBC’s investment in Euronext N.V. and the Montreal Exchange in 2007, revenues rose by 37 per cent.
• The securities services business continued to grow despite the backdrop of lower interest rates and lower equity markets, as stronger transaction volumes and new mandates resulted in higher revenues. This was particularly evident in Asia, as clients continued to rebalance their investment portfolios.

19
Management view of total operating income
Half-year to 30 June
2008 30 June 2007
31 December 2007
US$m US$m US$m
Global Markets .................. 1,688 3,825 1,895 Credit ............................. (3,124) 658 (1,977)Rates .............................. 1,303 592 699Foreign exchange .......... 1,546 909 1,269Equities10 ....................... 746 652 525Securities services ......... 1,112 855 1,071Asset and structured
finance ....................... 105 159 308
Global Banking .................. 2,432 1,974 2,216 Financing and equity
capital markets .......... 1,371 1,042 1,144Payments and cash
management .............. 839 751 881Other transaction
services....................... 222 181 191
Balance Sheet Management .................. 1,630 521 705
Global Asset Management 669 636 700 Principal Investments ........ 167 755 498 Other11 ................................ 833 826 729
Total operating income ...... 7,419 8,537 6,743 Balance sheet data6 Trading assets (including
derivatives) .................... 721,366 567,340 625,132 Trading liabilities
(including derivatives) .. 577,048 443,634 483,881 Financial investments ........ 211,486 174,095 224,057 Financial assets designated
at fair value ................... 7,469 5,269 7,936 Loans and advances to:
– customers (net) ........... 303,826 241,602 250,464 – banks (net) .................. 214,693 183,708 199,506
Total assets ........................ 1,509,390 1,220,316 1,375,240 Customer accounts ............. 328,952 265,739 299,879 Deposits by banks .............. 144,043 121,744 126,395
Comparative information has been restated to reflect the current management view.
In the first half of 2008, Global Markets included a US$262 million fair value gain on the widening of credit spreads on structured liabilities.
For footnotes, see page 89.
• Balance Sheet Management recorded significantly
higher income from positions taken in expectation of interest rate reductions by a number of central banks. As a result of these positions there was an associated increase in the total value at risk.
• In Global Banking, the write-downs on leveraged and acquisition finance positions were more than
offset by gains on credit default swap transactions in other parts of the portfolio. Increased transaction volumes drove robust growth in fees, particularly in emerging markets. Total operating income in payments and cash management was 12 per cent higher, led by a strong rise in deposit balances.
• HSBC’s extensive distribution network enabled the delivery of products to emerging markets as recognised by a number of industry awards including ‘Best Investment Bank’ and ‘Best at Risk Management’ in the Middle East, and ‘Best Debt House’ in Asia and in Western Europe by Euromoney.
• The strength of the Group’s corporate and institutional franchise was again illustrated by the number and variety of transactions in which Global Banking acted on behalf of clients. In the first half of 2008, HSBC acted for over 700 clients in 29 sectors and some 60 countries. The total notional transaction value was more than US$1,000 billion.
• Global Asset Management benefited from a significant increase in liquidity fund inflows with total funds under management growing to US$389 billion, as clients sought certainty in a volatile market. The Group maintained its position as one of the leading emerging markets asset managers, with assets increasing to US$86 billion, a rise of 18 per cent on the first half of 2007. The business continued to leverage the Group’s distribution capabilities with new funds including HSBC’s New Frontiers Fund, launched in February for the Group’s Private Banking clients, which raised US$300 million within three months.
• Within the Group’s available-for-sale portfolio, continuing illiquidity in asset-backed securities markets led to further write-downs of securities. However, as a consequence of the underlying credit quality and seniority of the tranches held by HSBC, the first half of 2008 included a relatively modest impairment charge through the income statement of US$55 million; a further US$134 million was absorbed by income note holders who take the first loss on positions within the securities investment conduits (‘SICs’) now consolidated in HSBC’s accounts. Further details on these SICs are provided on pages 137 to 141.

H S B C H O L D I N G S P L C
Interim Management Report: Business Review (continued)
20
Reconciliation of reported and underlying profit before tax
Half-year to 30 June 2008 (‘1H08’) compared with half-year to 30 June 2007 (‘1H07’)
Global Banking and Markets
1H07 as reported US$m
Disposals and dilution gains1
US$m
Currency translation2
US$m
1H07 at 1H08 exchange rates US$m
Acqui- sitions1
US$m
Under- lying change US$m
1H08 as reported US$m
Re- ported change %
Under- lying change %
Net interest income .......... 1,847 – 72 1,919 – 1,818 3,737 102 95 Net fee income ................. 2,264 – 104 2,368 – (14) 2,354 4 (1)Other income3 .................. 4,388 – 183 4,571 – (3,283) 1,288 (71) (72)
Net operating income4 ... 8,499 – 359 8,858 – (1,479) 7,379 (13) (17)
Loan impairment (charges)/recoveries and other credit risk provisions .................... 24 – (2) 22 – (137) (115) (579) (623)
Net operating income .... 8,523 – 357 8,880 – (1,616) 7,264 (15) (18)
Operating expenses .......... (4,479) – (151) (4,630) – (197) (4,827) (8) (4)
Operating profit ............. 4,044 – 206 4,250 – (1,813) 2,437 (40) (43)
Income from associates ... 114 – 5 119 – 134 253 122 113
Profit before tax ............. 4,158 – 211 4,369 – (1,679) 2,690 (35) (38)
Half-year to 30 June 2008 (‘1H08’) compared with half-year to 31 December 2007 (‘2H07’)
Global Banking and Markets
2H07 as reported US$m
Disposals and dilution gains1
US$m
Currency translation2
US$m
2H07 at 1H08 exchange rates US$m
Acqui- sitions1
US$m
Under- lying change US$m
1H08 as reported US$m
Re- ported change %
Under- lying change %
Net interest income .......... 2,583 – 37 2,620 – 1,117 3,737 45 43 Net fee income ................. 2,637 – 32 2,669 – (315) 2,354 (11) (12)Other income3 .................. 1,491 – 12 1,503 – (215) 1,288 (14) (14)
Net operating income4 ..... 6,711 – 81 6,792 – 587 7,379 10 9
Loan impairment charges and other credit risk provisions .................... (62) – 2 (60) – (55) (115) (85) (92)
Net operating income ...... 6,649 – 83 6,732 – 532 7,264 9 8
Operating expenses .......... (4,879) – (32) (4,911) – 84 (4,827) 1 2
Operating profit ............... 1,770 – 51 1,821 – 616 2,437 38 34
Income from associates ... 193 – 8 201 – 52 253 31 26
Profit before tax ............... 1,963 – 59 2,022 – 668 2,690 37 33
For footnotes, see page 89.

21
Private Banking
Profit before tax
Half-year to 30 June
2008 30 June 2007
31 December 2007
US$m US$m US$m
Net interest income ............ 783 567 649
Net fee income ................... 814 811 804
Trading income excluding net interest income ......... 211 255 270
Net interest income on trading activities ............. 7 4 5
Net trading income7 ........... 218 259 275 Net income/(expense) from
financial instruments designated at fair value .. 1 – (1)
Gains less losses from financial investments ..... 80 45 74
Dividend income ................ 4 5 2 Other operating income ..... 16 31 27
Total operating income ... 1,916 1,718 1,830
Net insurance claims8 ........ – – –
Net operating income4 ...... 1,916 1,718 1,830
Loan impairment (charges)/recoveries and other credit risk provisions ...................... 4 (9) (5)
Net operating income ...... 1,920 1,709 1,825
Total operating expenses ... (1,098) (929) (1,096)
Operating profit ............... 822 780 729
Share of profit in associates and joint ventures .......... – – 2
Profit before tax ............... 822 780 731
By geographical region Europe ................................ 579 493 422 Hong Kong ........................ 123 161 144 Rest of Asia-Pacific ........... 54 56 36 North America ................... 58 60 114 Latin America .................... 8 10 15
Profit before tax ................. 822 780 731 % % % Share of HSBC’s profit
before tax ....................... 8.0 5.5 7.3 Cost efficiency ratio .......... 57.3 54.1 59.9 Balance sheet data6 US$m US$m US$m Loans and advances to
customers (net) .............. 45,895 37,863 43,612 Total assets ........................ 98,039 81,916 88,510 Customer accounts ............. 109,776 91,228 106,197
For footnotes, see page 89.
Business highlights • Pre-tax profits increased by 5 per cent or 4 per
cent on an underlying basis to US$822 million, primarily due to strong performances in Switzerland and Monaco, offsetting lower revenues in Asia due to reduced client trading.
• Inward referrals from other customer groups in HSBC in the first half of 2008 resulted in US$3.4 billion of net new money, compared with US$2.0 billion in the first half of 2007.
• Despite a decline in market values, client assets at US$421.3 billion remained well ahead of 30 June 2007 and unchanged from 31 December 2007, assisted by net new money of US$14.5 billion in the first half of 2008. This was achieved with an improvement in net interest income in an environment of competitors offering above-market deposit rates to attract and retain clients. Within client assets, funds and mandates generating annuity income rose by 4 per cent to US$70.3 billion.
Client Assets
Half-year to
30 June 2008
30 June 2007
31 December 2007
US$bn US$bn US$bn At beginning of
period ............... 421 333 370 Net new money ... 15 17 19 Value change ...... (20) 12 7 Exchange/other ... 5 8 25
At end of period... 421 370 421
• Total client assets, a measure equivalent to many industry definitions of assets under management, which includes some non-financial assets held in client trusts, amounted to US$499.3 billion at 30 June 2008, an increase of US$5.2 billion on 31 December 2007, including US$18.6 billion of net new money.
• Private Banking clients continued to be attracted to alternative products, with total hedge funds under custody for clients growing to US$57.9 billion, and new product offerings in emerging markets. The HSBC New Frontiers Fund, which concentrates on the next generation emerging markets, and the HSBC Asia Private Equity fund, were notably successful in the first half of 2008.
• Offices in Guangzhou, Shanghai and Beijing were formally opened in early 2008 as part of the launch of Private Banking in mainland China.
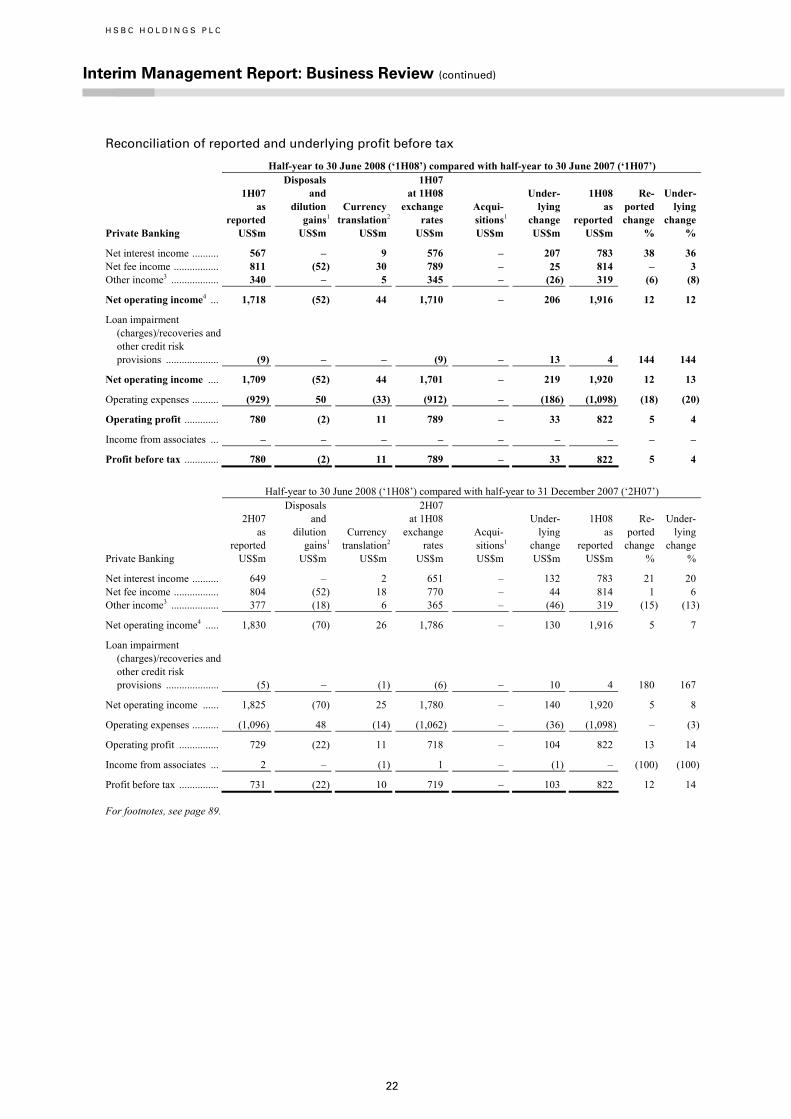
H S B C H O L D I N G S P L C
Interim Management Report: Business Review (continued)
22
Reconciliation of reported and underlying profit before tax
Half-year to 30 June 2008 (‘1H08’) compared with half-year to 30 June 2007 (‘1H07’)
Private Banking
1H07 as reported US$m
Disposals and dilution gains1
US$m
Currency translation2
US$m
1H07 at 1H08 exchange rates US$m
Acqui- sitions1
US$m
Under- lying change US$m
1H08 as reported US$m
Re- ported change %
Under- lying change %
Net interest income .......... 567 – 9 576 – 207 783 38 36 Net fee income ................. 811 (52) 30 789 – 25 814 – 3 Other income3 .................. 340 – 5 345 – (26) 319 (6) (8)
Net operating income4 ... 1,718 (52) 44 1,710 – 206 1,916 12 12
Loan impairment (charges)/recoveries and other credit risk provisions .................... (9) – – (9) – 13 4 144 144
Net operating income .... 1,709 (52) 44 1,701 – 219 1,920 12 13
Operating expenses .......... (929) 50 (33) (912) – (186) (1,098) (18) (20)
Operating profit ............. 780 (2) 11 789 – 33 822 5 4
Income from associates ... – – – – – – – – –
Profit before tax ............. 780 (2) 11 789 – 33 822 5 4
Half-year to 30 June 2008 (‘1H08’) compared with half-year to 31 December 2007 (‘2H07’)
Private Banking
2H07 as reported US$m
Disposals and dilution gains1
US$m
Currency translation2
US$m
2H07 at 1H08 exchange rates US$m
Acqui- sitions1
US$m
Under- lying change US$m
1H08 as reported US$m
Re- ported change %
Under- lying change %
Net interest income .......... 649 – 2 651 – 132 783 21 20 Net fee income ................. 804 (52) 18 770 – 44 814 1 6 Other income3 .................. 377 (18) 6 365 – (46) 319 (15) (13)
Net operating income4 ..... 1,830 (70) 26 1,786 – 130 1,916 5 7
Loan impairment (charges)/recoveries and other credit risk provisions .................... (5) – (1) (6) – 10 4 180 167
Net operating income ...... 1,825 (70) 25 1,780 – 140 1,920 5 8
Operating expenses .......... (1,096) 48 (14) (1,062) – (36) (1,098) – (3)
Operating profit ............... 729 (22) 11 718 – 104 822 13 14
Income from associates ... 2 – (1) 1 – (1) – (100) (100)
Profit before tax ............... 731 (22) 10 719 – 103 822 12 14
For footnotes, see page 89.
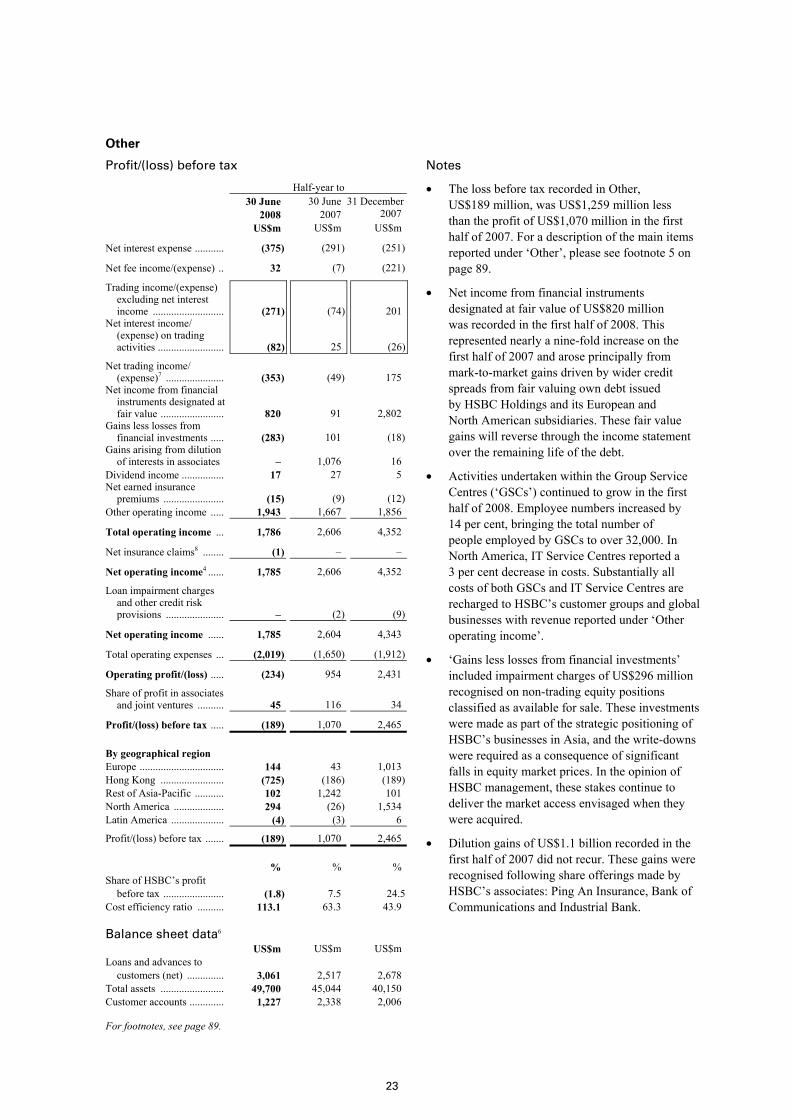
23
Other
Profit/(loss) before tax
Half-year to 30 June
2008 30 June 2007
31 December 2007
US$m US$m US$m
Net interest expense ........... (375) (291) (251)
Net fee income/(expense) .. 32 (7) (221)
Trading income/(expense) excluding net interest income ........................... (271) (74) 201
Net interest income/ (expense) on trading activities ......................... (82) 25 (26)
Net trading income/ (expense)7 ...................... (353) (49) 175
Net income from financial instruments designated at fair value ........................ 820 91 2,802
Gains less losses from financial investments ..... (283) 101 (18)
Gains arising from dilution of interests in associates – 1,076 16
Dividend income ................ 17 27 5 Net earned insurance
premiums ....................... (15) (9) (12)Other operating income ..... 1,943 1,667 1,856
Total operating income ... 1,786 2,606 4,352
Net insurance claims8 ........ (1) – –
Net operating income4 ...... 1,785 2,606 4,352
Loan impairment charges and other credit risk provisions ...................... – (2) (9)
Net operating income ...... 1,785 2,604 4,343
Total operating expenses ... (2,019) (1,650) (1,912)
Operating profit/(loss) ..... (234) 954 2,431
Share of profit in associates and joint ventures .......... 45 116 34
Profit/(loss) before tax ..... (189) 1,070 2,465 By geographical region Europe ................................ 144 43 1,013 Hong Kong ........................ (725) (186) (189)Rest of Asia-Pacific ........... 102 1,242 101 North America ................... 294 (26) 1,534 Latin America .................... (4) (3) 6
Profit/(loss) before tax ....... (189) 1,070 2,465 % % % Share of HSBC’s profit
before tax ....................... (1.8) 7.5 24.5
Cost efficiency ratio .......... 113.1 63.3 43.9 Balance sheet data6 US$m US$m US$m Loans and advances to
customers (net) .............. 3,061 2,517 2,678 Total assets ........................ 49,700 45,044 40,150 Customer accounts ............. 1,227 2,338 2,006
For footnotes, see page 89.
Notes
• The loss before tax recorded in Other, US$189 million, was US$1,259 million less than the profit of US$1,070 million in the first half of 2007. For a description of the main items reported under ‘Other’, please see footnote 5 on page 89.
• Net income from financial instruments designated at fair value of US$820 million was recorded in the first half of 2008. This represented nearly a nine-fold increase on the first half of 2007 and arose principally from mark-to-market gains driven by wider credit spreads from fair valuing own debt issued by HSBC Holdings and its European and North American subsidiaries. These fair value gains will reverse through the income statement over the remaining life of the debt.
• Activities undertaken within the Group Service Centres (‘GSCs’) continued to grow in the first half of 2008. Employee numbers increased by 14 per cent, bringing the total number of people employed by GSCs to over 32,000. In North America, IT Service Centres reported a 3 per cent decrease in costs. Substantially all costs of both GSCs and IT Service Centres are recharged to HSBC’s customer groups and global businesses with revenue reported under ‘Other operating income’.
• ‘Gains less losses from financial investments’ included impairment charges of US$296 million recognised on non-trading equity positions classified as available for sale. These investments were made as part of the strategic positioning of HSBC’s businesses in Asia, and the write-downs were required as a consequence of significant falls in equity market prices. In the opinion of HSBC management, these stakes continue to deliver the market access envisaged when they were acquired.
• Dilution gains of US$1.1 billion recorded in the first half of 2007 did not recur. These gains were recognised following share offerings made by HSBC’s associates: Ping An Insurance, Bank of Communications and Industrial Bank.
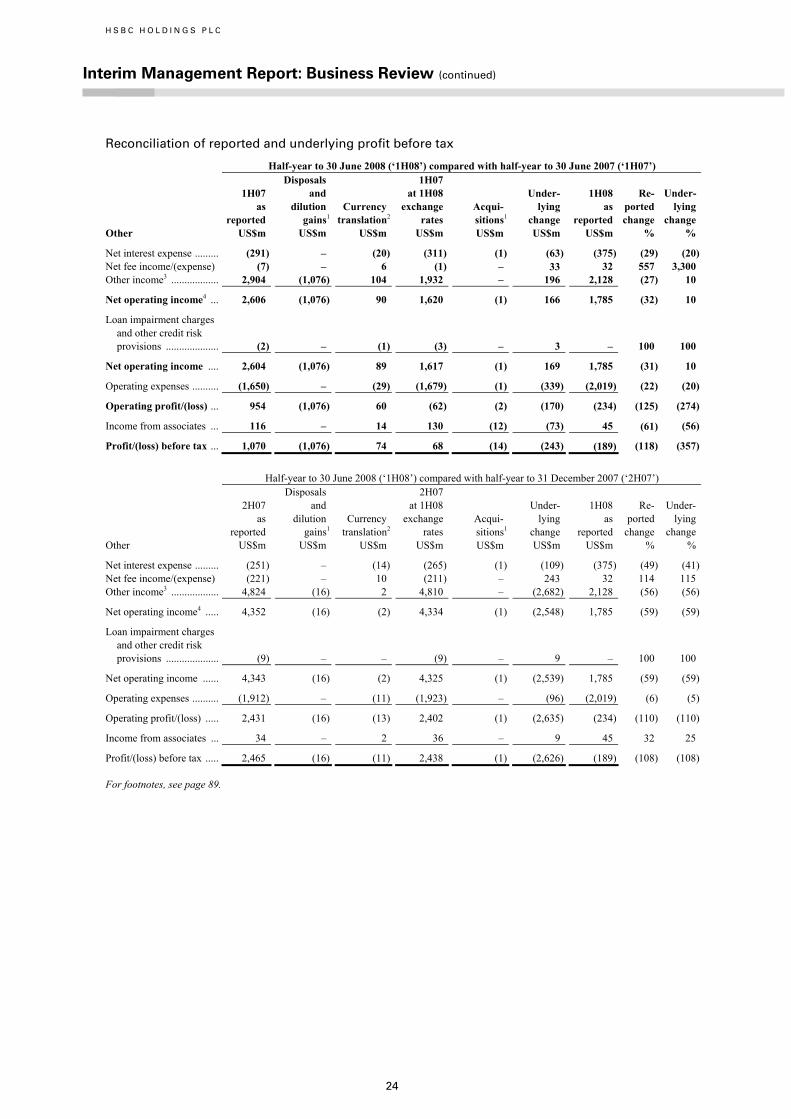
H S B C H O L D I N G S P L C
Interim Management Report: Business Review (continued)
24
Reconciliation of reported and underlying profit before tax
Half-year to 30 June 2008 (‘1H08’) compared with half-year to 30 June 2007 (‘1H07’)
Other
1H07 as reported US$m
Disposals and dilution gains1
US$m
Currency translation2
US$m
1H07 at 1H08 exchange rates US$m
Acqui- sitions1
US$m
Under- lying change US$m
1H08 as reported US$m
Re- ported change %
Under- lying change %
Net interest expense ......... (291) – (20) (311) (1) (63) (375) (29) (20)Net fee income/(expense) (7) – 6 (1) – 33 32 557 3,300 Other income3 .................. 2,904 (1,076) 104 1,932 – 196 2,128 (27) 10
Net operating income4 ... 2,606 (1,076) 90 1,620 (1) 166 1,785 (32) 10
Loan impairment charges and other credit risk provisions .................... (2) – (1) (3) – 3 – 100 100
Net operating income .... 2,604 (1,076) 89 1,617 (1) 169 1,785 (31) 10
Operating expenses .......... (1,650) – (29) (1,679) (1) (339) (2,019) (22) (20)
Operating profit/(loss) ... 954 (1,076) 60 (62) (2) (170) (234) (125) (274)
Income from associates ... 116 – 14 130 (12) (73) 45 (61) (56)
Profit/(loss) before tax ... 1,070 (1,076) 74 68 (14) (243) (189) (118) (357)
Half-year to 30 June 2008 (‘1H08’) compared with half-year to 31 December 2007 (‘2H07’)
Other
2H07 as reported US$m
Disposals and dilution gains1
US$m
Currency translation2
US$m
2H07 at 1H08 exchange rates US$m
Acqui- sitions1
US$m
Under- lying change US$m
1H08 as reported US$m
Re- ported change %
Under- lying change %
Net interest expense ......... (251) – (14) (265) (1) (109) (375) (49) (41)Net fee income/(expense) (221) – 10 (211) – 243 32 114 115 Other income3 .................. 4,824 (16) 2 4,810 – (2,682) 2,128 (56) (56)
Net operating income4 ..... 4,352 (16) (2) 4,334 (1) (2,548) 1,785 (59) (59)
Loan impairment charges and other credit risk provisions .................... (9) – – (9) – 9 – 100 100
Net operating income ...... 4,343 (16) (2) 4,325 (1) (2,539) 1,785 (59) (59)
Operating expenses .......... (1,912) – (11) (1,923) – (96) (2,019) (6) (5)
Operating profit/(loss) ..... 2,431 (16) (13) 2,402 (1) (2,635) (234) (110) (110)
Income from associates ... 34 – 2 36 – 9 45 32 25
Profit/(loss) before tax ..... 2,465 (16) (11) 2,438 (1) (2,626) (189) (108) (108)
For footnotes, see page 89.
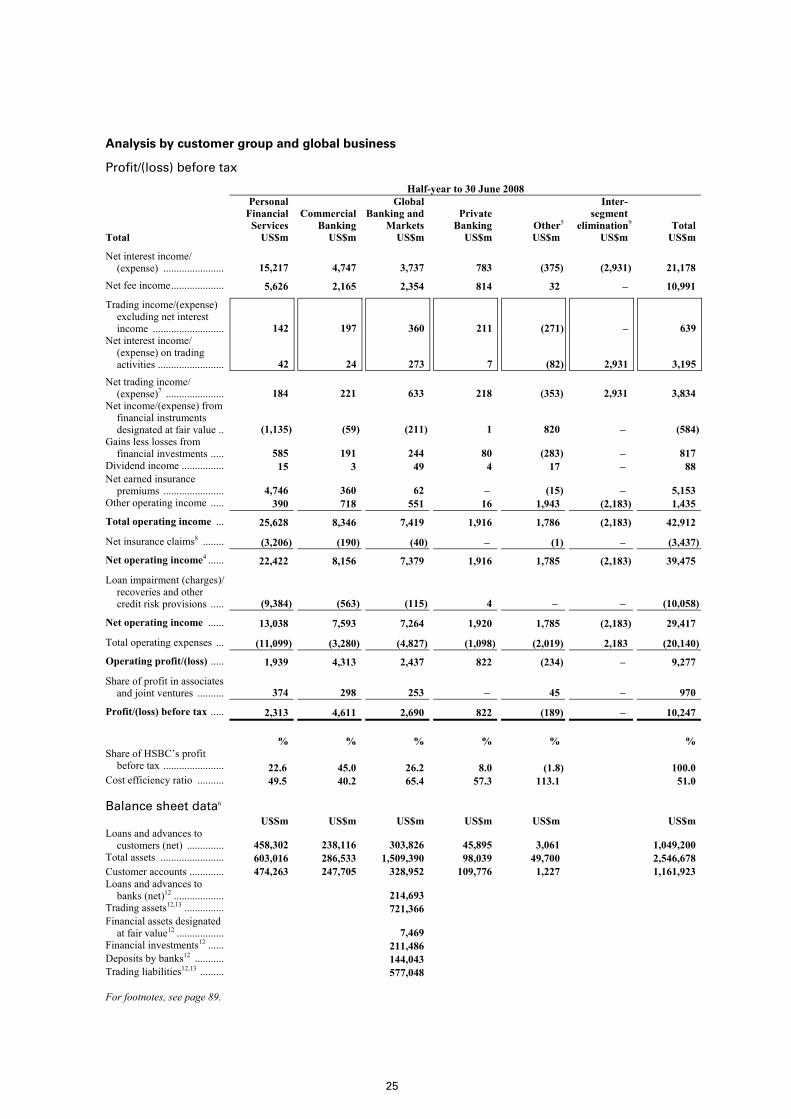
25
Analysis by customer group and global business
Profit/(loss) before tax
Half-year to 30 June 2008
Total
Personal Financial Services US$m
Commercial Banking US$m
Global Banking and Markets US$m
Private Banking US$m
Other5
US$m
Inter- segment elimination9
US$m Total US$m
Net interest income/ (expense) ....................... 15,217 4,747 3,737 783 (375) (2,931) 21,178
Net fee income.................... 5,626 2,165 2,354 814 32 – 10,991
Trading income/(expense) excluding net interest income ........................... 142 197 360 211 (271) – 639
Net interest income/ (expense) on trading activities ......................... 42 24 273 7 (82) 2,931 3,195
Net trading income/ (expense)7 ...................... 184 221 633 218 (353) 2,931 3,834
Net income/(expense) from financial instruments designated at fair value .. (1,135) (59) (211) 1 820 – (584)
Gains less losses from financial investments ..... 585 191 244 80 (283) – 817
Dividend income ................ 15 3 49 4 17 – 88 Net earned insurance
premiums ....................... 4,746 360 62 – (15) – 5,153 Other operating income ..... 390 718 551 16 1,943 (2,183) 1,435 Total operating income ... 25,628 8,346 7,419 1,916 1,786 (2,183) 42,912
Net insurance claims8 ........ (3,206) (190) (40) – (1) – (3,437)Net operating income4 ...... 22,422 8,156 7,379 1,916 1,785 (2,183) 39,475
Loan impairment (charges)/ recoveries and other credit risk provisions ..... (9,384) (563) (115) 4 – – (10,058)
Net operating income ...... 13,038 7,593 7,264 1,920 1,785 (2,183) 29,417
Total operating expenses ... (11,099) (3,280) (4,827) (1,098) (2,019) 2,183 (20,140)Operating profit/(loss) ..... 1,939 4,313 2,437 822 (234) – 9,277
Share of profit in associates and joint ventures .......... 374 298 253 – 45 – 970
Profit/(loss) before tax ..... 2,313 4,611 2,690 822 (189) – 10,247 % % % % % % Share of HSBC’s profit
before tax ....................... 22.6 45.0 26.2 8.0 (1.8) 100.0
Cost efficiency ratio .......... 49.5 40.2 65.4 57.3 113.1 51.0 Balance sheet data6 U$Sm US$m US$m US$m US$m US$m Loans and advances to
customers (net) .............. 458,302 238,116 303,826 45,895 3,061 1,049,200 Total assets ........................ 603,016 286,533 1,509,390 98,039 49,700 2,546,678 Customer accounts ............. 474,263 247,705 328,952 109,776 1,227 1,161,923 Loans and advances to
banks (net)12 ................... 214,693 Trading assets12,13 ............... 721,366 Financial assets designated
at fair value12 .................. 7,469 Financial investments12 ...... 211,486 Deposits by banks12 ........... 144,043 Trading liabilities12,13 ......... 577,048
For footnotes, see page 89.

H S B C H O L D I N G S P L C
Interim Management Report: Business Review (continued)
26
Analysis by customer group and global business (continued)
Profit before tax
Half-year to 30 June 2007
Total
Personal Financial Services US$m
Commercial Banking US$m
Global Banking and Markets US$m
Private Banking US$m
Other5
US$m
Inter- segment elimination9
US$m Total US$m
Net interest income/ (expense) ....................... 13,998 4,286 1,847 567 (291) (2,177) 18,230
Net fee income/(expense) .. 5,523 1,904 2,264 811 (7) – 10,495
Trading income/(expense) excluding net interest income ........................... 1 121 3,048 255 (74) – 3,351
Net interest income/ (expense) on trading activities ......................... 92 13 (151) 4 25 2,177 2,160
Net trading income/ (expense)7 ...................... 93 134 2,897 259 (49) 2,177 5,511
Net income/(expense) from financial instruments designated at fair value .. 796 (24) 11 – 91 – 874
Gains less losses from financial investments ..... 60 25 768 45 101 – 999
Gains arising from dilution of interests in associates – – – – 1,076 – 1,076
Dividend income ................ 41 4 175 5 27 – 252 Net earned insurance
premiums ....................... 3,735 205 46 – (9) – 3,977 Other operating income ..... 255 2 529 31 1,667 (1,806) 678
Total operating income ...... 24,501 6,536 8,537 1,718 2,606 (1,806) 42,092
Net insurance claims8 ........ (3,605) 44 (38) – – – (3,599)
Net operating income4 ........ 20,896 6,580 8,499 1,718 2,606 (1,806) 38,493
Loan impairment (charges)/ recoveries and other credit risk provisions ..... (5,928) (431) 24 (9) (2) – (6,346)
Net operating income ........ 14,968 6,149 8,523 1,709 2,604 (1,806) 32,147
Total operating expenses ... (10,452) (2,907) (4,479) (929) (1,650) 1,806 (18,611)
Operating profit ................. 4,516 3,242 4,044 780 954 – 13,536
Share of profit in associates and joint ventures .......... 213 180 114 – 116 – 623
Profit before tax ................. 4,729 3,422 4,158 780 1,070 – 14,159 % % % % % % Share of HSBC’s profit
before tax ....................... 33.4 24.2 29.4 5.5 7.5 100.0 Cost efficiency ratio .......... 50.0 44.2 52.7 54.1 63.3 48.3 Balance sheet data6 U$Sm US$m US$m US$m US$m US$m Loans and advances to
customers (net) .............. 460,196 185,923 241,602 37,863 2,517 928,101 Total assets ........................ 577,402 225,763 1,220,316 81,916 45,044 2,150,441 Customer accounts ............. 416,525 205,002 265,739 91,228 2,338 980,832 Loans and advances to
banks (net)12 ................... 183,708 Trading assets12,13 ............... 567,340 Financial assets designated
at fair value12 .................. 5,269 Financial investments12 ...... 174,095 Deposits by banks12 ........... 121,744 Trading liabilities12,13 ......... 443,634
For footnotes, see page 89.
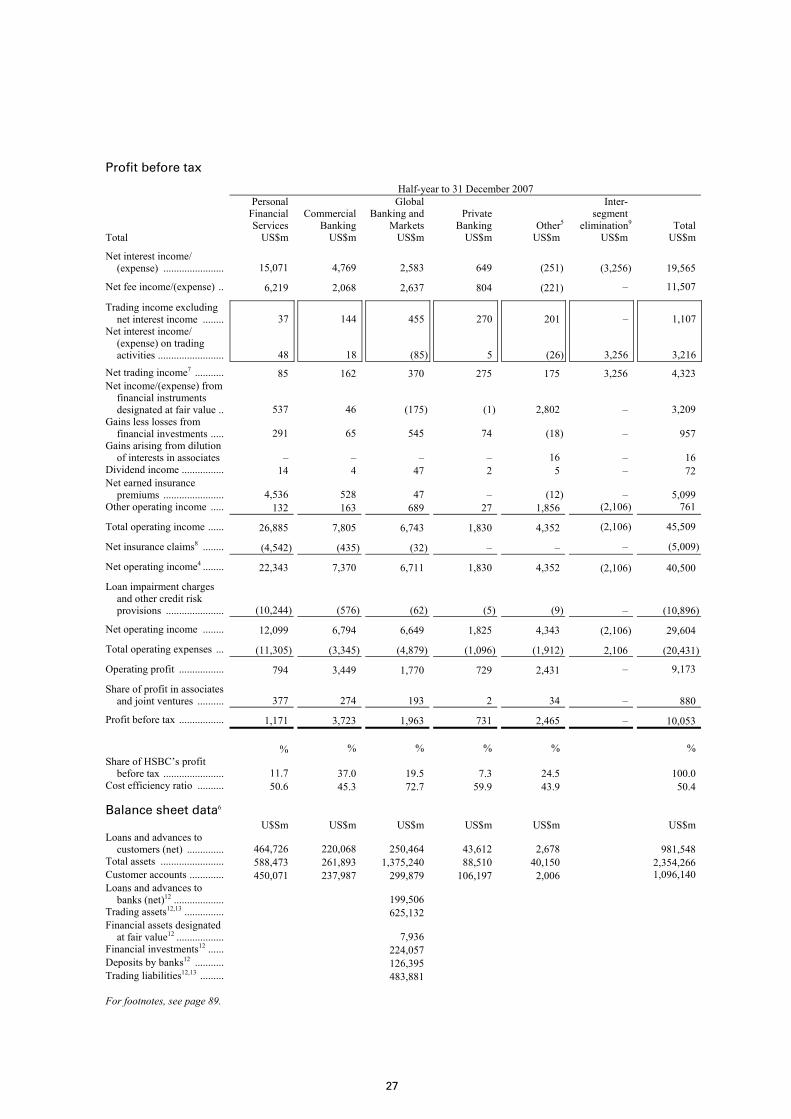
27
Profit before tax
Half-year to 31 December 2007
Personal Financial Services
Commercial Banking
Global Banking and Markets
Private Banking Other5
Inter- segment elimination9 Total
Total US$m US$m US$m US$m US$m US$m US$m
Net interest income/ (expense) ....................... 15,071 4,769 2,583 649 (251) (3,256) 19,565
Net fee income/(expense) .. 6,219 2,068 2,637 804 (221) – 11,507
Trading income excluding net interest income ........ 37 144 455 270 201 – 1,107
Net interest income/ (expense) on trading activities ......................... 48 18 (85) 5 (26) 3,256 3,216
Net trading income7 ........... 85 162 370 275 175 3,256 4,323 Net income/(expense) from
financial instruments designated at fair value .. 537 46 (175) (1) 2,802 – 3,209
Gains less losses from financial investments ..... 291 65 545 74 (18) – 957
Gains arising from dilution of interests in associates – – – – 16 – 16
Dividend income ................ 14 4 47 2 5 – 72 Net earned insurance
premiums ....................... 4,536 528 47 – (12) – 5,099 Other operating income ..... 132 163 689 27 1,856 (2,106) 761
Total operating income ...... 26,885 7,805 6,743 1,830 4,352 (2,106) 45,509
Net insurance claims8 ........ (4,542) (435) (32) – – – (5,009)
Net operating income4 ........ 22,343 7,370 6,711 1,830 4,352 (2,106) 40,500
Loan impairment charges and other credit risk provisions ...................... (10,244) (576) (62) (5) (9) – (10,896)
Net operating income ........ 12,099 6,794 6,649 1,825 4,343 (2,106) 29,604
Total operating expenses ... (11,305) (3,345) (4,879) (1,096) (1,912) 2,106 (20,431)
Operating profit ................. 794 3,449 1,770 729 2,431 – 9,173
Share of profit in associates and joint ventures .......... 377 274 193 2 34 – 880
Profit before tax ................. 1,171 3,723 1,963 731 2,465 – 10,053 % % % % % % Share of HSBC’s profit
before tax ....................... 11.7 37.0 19.5 7.3 24.5 100.0 Cost efficiency ratio .......... 50.6 45.3 72.7 59.9 43.9 50.4 Balance sheet data6 U$Sm US$m US$m US$m US$m US$m Loans and advances to
customers (net) .............. 464,726 220,068 250,464 43,612 2,678 981,548 Total assets ........................ 588,473 261,893 1,375,240 88,510 40,150 2,354,266 Customer accounts ............. 450,071 237,987 299,879 106,197 2,006 1,096,140 Loans and advances to
banks (net)12 ................... 199,506 Trading assets12,13 ............... 625,132 Financial assets designated
at fair value12 .................. 7,936 Financial investments12 ...... 224,057 Deposits by banks12 ........... 126,395 Trading liabilities12,13 ......... 483,881
For footnotes, see page 89.

H S B C H O L D I N G S P L C
Interim Management Report: Business Review (continued)
28
Geographical regions
Summary
In the analysis of profit and loss by geographical region that follows, operating income and operating expenses include intra-HSBC items of
US$1,169 million (first half of 2007: US$852 million; second half of 2007: US$1,133 million).
Profit/(loss) before tax
Half-year to 30 June 2008 30 June 2007 31 December 2007 US$m % US$m % US$m %
Europe ...................................................... 5,177 50.5 4,050 28.6 4,545 45.2 Hong Kong .............................................. 3,073 30.0 3,330 23.5 4,009 39.9 Rest of Asia-Pacific ................................. 3,624 35.4 3,344 23.6 2,665 26.5 North America ......................................... (2,893) (28.2) 2,435 17.2 (2,344) (23.3)Latin America .......................................... 1,266 12.3 1,000 7.1 1,178 11.7
10,247 100.0 14,159 100.0 10,053 100.0
Total assets6
At 30 June 2008 At 30 June 2007 At 31 December 2007 US$m % US$m % US$m %
Europe ...................................................... 1,313,319 51.5 1,040,019 48.3 1,184,315 50.3 Hong Kong .............................................. 325,692 12.8 300,681 14.0 332,691 14.1 Rest of Asia-Pacific ................................. 259,041 10.2 201,123 9.4 228,112 9.7 North America ......................................... 531,607 20.9 519,693 24.2 510,092 21.7 Latin America .......................................... 117,019 4.6 88,925 4.1 99,056 4.2
2,546,678 100.0 2,150,441 100.0 2,354,266 100.0
Europe
Profit/(loss) before tax by country within customer groups and global businesses
Personal Financial Services US$m
Commercial Banking US$m
Global Banking and Markets14
US$m
Private Banking US$m
Other US$m
Total US$m
Half-year to 30 June 2008 UK ......................................................................... 1,164 1,656 329 162 168 3,479 France15 ................................................................. 122 151 492 14 (70) 709 Germany ............................................................... – 21 122 20 (8) 155 Malta ..................................................................... 26 33 12 – – 71 Switzerland ........................................................... – – – 335 – 335 Turkey ................................................................... 19 51 56 – – 126 Other ..................................................................... (7) 28 179 48 54 302
1,324 1,940 1,190 579 144 5,177 Half-year to 30 June 2007 UK ......................................................................... 384 1,001 902 198 (79) 2,406 France15 ................................................................. 97 119 461 9 26 712 Germany ............................................................... – 19 125 25 – 169 Malta ..................................................................... 26 35 18 – – 79 Switzerland ........................................................... – – – 260 – 260 Turkey ................................................................... 71 34 56 – – 161 Other ..................................................................... 26 28 112 1 96 263
604 1,236 1,674 493 43 4,050
For footnotes, see page 89.

29
Personal Financial Services US$m
Commercial Banking US$m
Global Banking and Markets14
US$m
Private Banking US$m
Other US$m
Total US$m
Half-year to 31 December 2007 UK ..................................................................... 837 1,063 312 119 1,055 3,386 France15 ............................................................. 76 73 231 16 (75) 321 Germany ........................................................... – 17 70 20 19 126 Malta ................................................................. 19 32 27 – – 78 Switzerland ....................................................... – – – 215 – 215 Turkey ............................................................... 73 41 62 (1) – 175 Other ................................................................. (28) 54 151 53 14 244
977 1,280 853 422 1,013 4,545
Loans and advances to customers (net) by country
At30 June
2008US$m
At 30 June
2007 US$m
At 31 December
2007US$m
UK .................................................................................................................... 380,051 325,199 326,927 France15 ............................................................................................................ 78,376 67,670 81,473 Germany .......................................................................................................... 7,638 5,763 6,411 Malta ................................................................................................................ 4,684 3,700 4,157 Switzerland ...................................................................................................... 14,829 11,164 13,789 Turkey .............................................................................................................. 8,127 6,148 7,974 Other ................................................................................................................ 15,255 8,464 11,544
508,960 428,108 452,275
Customer accounts by country
At30 June
2008US$m
At 30 June
2007 US$m
At 31 December
2007US$m
UK .................................................................................................................... 413,593 346,547 367,363 France15 ............................................................................................................ 60,281 48,961 64,905 Germany .......................................................................................................... 11,054 9,671 10,282 Malta ................................................................................................................ 6,292 4,779 5,947 Switzerland ...................................................................................................... 42,125 35,266 41,015 Turkey .............................................................................................................. 7,090 5,074 6,473 Other ................................................................................................................ 9,205 8,210 8,969
549,640 458,508 504,954
For footnotes, see page 89.
Economic briefing
The UK economy slowed in the first half of 2008. Gross Domestic Product (‘GDP’) increased by 2.0 per cent during the first half of the year against the comparable period of 2007, below the average of the past decade. The housing market deteriorated markedly as the number of mortgage approvals for house purchases fell sharply and nominal house prices recorded small but persistent monthly declines. Employment growth was subdued, with some measures of unemployment increasing slightly during the second quarter of 2008. The Bank of England cut interest rates by 50 basis points during the first half of 2008, although a sharp rise in
inflation to an annual rate of 3.8 per cent in June complicated the outlook for monetary policy during the second half of the year.
Having expanded by 2.6 per cent in 2007, GDP in the eurozone rose by 2.1 per cent year-on-year in the first quarter of 2008 driven, in part, by a strong increase in business investment and a further rise in exports. Labour markets remained relatively robust, with the unemployment rate for the region remaining at about 7 per cent. However, consumer spending growth was subdued and most indicators of activity deteriorated as the second quarter progressed. Inflation continued to pick up during the first half of
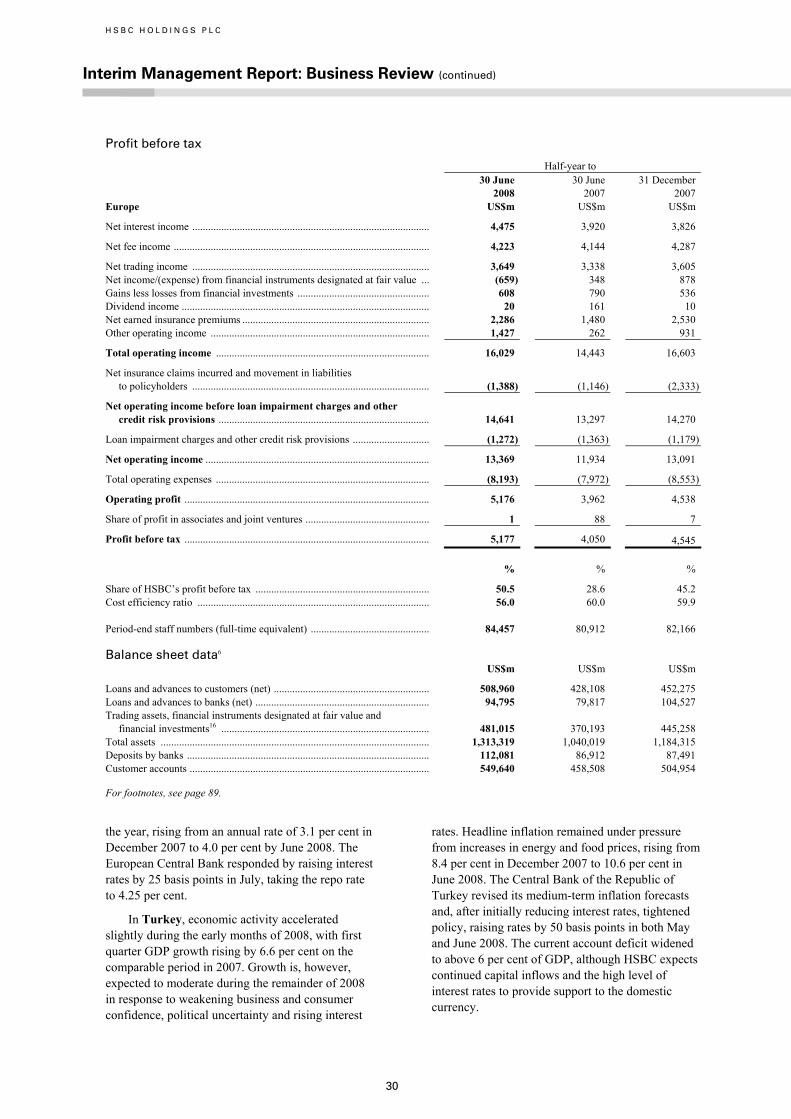
H S B C H O L D I N G S P L C
Interim Management Report: Business Review (continued)
30
Profit before tax
Half-year to
Europe
30 June2008
US$m
30 June 2007
US$m
31 December 2007 US$m
Net interest income .......................................................................................... 4,475 3,920 3,826
Net fee income ................................................................................................. 4,223 4,144 4,287
Net trading income .......................................................................................... 3,649 3,338 3,605 Net income/(expense) from financial instruments designated at fair value ... (659) 348 878 Gains less losses from financial investments .................................................. 608 790 536 Dividend income .............................................................................................. 20 161 10 Net earned insurance premiums ....................................................................... 2,286 1,480 2,530 Other operating income ................................................................................... 1,427 262 931
Total operating income ................................................................................. 16,029 14,443 16,603
Net insurance claims incurred and movement in liabilities to policyholders .......................................................................................... (1,388) (1,146) (2,333)
Net operating income before loan impairment charges and other credit risk provisions ................................................................................ 14,641 13,297 14,270
Loan impairment charges and other credit risk provisions ............................. (1,272) (1,363) (1,179)
Net operating income ..................................................................................... 13,369 11,934 13,091
Total operating expenses ................................................................................. (8,193) (7,972) (8,553)
Operating profit ............................................................................................. 5,176 3,962 4,538
Share of profit in associates and joint ventures ............................................... 1 88 7
Profit before tax ............................................................................................. 5,177 4,050 4,545 % % %
Share of HSBC’s profit before tax .................................................................. 50.5 28.6 45.2 Cost efficiency ratio ........................................................................................ 56.0 60.0 59.9 Period-end staff numbers (full-time equivalent) ............................................. 84,457 80,912 82,166 Balance sheet data6 US$m US$m US$m
Loans and advances to customers (net) ........................................................... 508,960 428,108 452,275 Loans and advances to banks (net) .................................................................. 94,795 79,817 104,527 Trading assets, financial instruments designated at fair value and
financial investments16 ............................................................................... 481,015 370,193 445,258 Total assets ...................................................................................................... 1,313,319 1,040,019 1,184,315 Deposits by banks ............................................................................................ 112,081 86,912 87,491 Customer accounts ........................................................................................... 549,640 458,508 504,954
For footnotes, see page 89.
the year, rising from an annual rate of 3.1 per cent in December 2007 to 4.0 per cent by June 2008. The European Central Bank responded by raising interest rates by 25 basis points in July, taking the repo rate to 4.25 per cent.
In Turkey, economic activity accelerated slightly during the early months of 2008, with first quarter GDP growth rising by 6.6 per cent on the comparable period in 2007. Growth is, however, expected to moderate during the remainder of 2008 in response to weakening business and consumer confidence, political uncertainty and rising interest
rates. Headline inflation remained under pressure from increases in energy and food prices, rising from 8.4 per cent in December 2007 to 10.6 per cent in June 2008. The Central Bank of the Republic of Turkey revised its medium-term inflation forecasts and, after initially reducing interest rates, tightened policy, raising rates by 50 basis points in both May and June 2008. The current account deficit widened to above 6 per cent of GDP, although HSBC expects continued capital inflows and the high level of interest rates to provide support to the domestic currency.

31
Reconciliation of reported and underlying profit before tax
Half-year to 30 June 2008 (‘1H08’) compared with half-year to 30 June 2007 (‘1H07’)
Europe
1H07 as reported US$m
Disposals and dilution gains1
US$m
Currency translation2
US$m
1H07 at 1H08 exchange rates US$m
Acqui- sitions1
US$m
Under- lying change US$m
1H08 as reported US$m
Re- ported change %
Under- lying change %
Net interest income .......... 3,920 (7) 129 4,042 150 283 4,475 14 7 Net fee income ................. 4,144 122 169 4,435 (46) (166) 4,223 2 (4)Other income3 .................. 5,233 (101) 213 5,345 (49) 647 5,943 14 12
Net operating income4 ... 13,297 14 511 13,822 55 764 14,641 10 6
Loan impairment charges and other credit risk provisions .................... (1,363) – (11) (1,374) – 102 (1,272) 7 7
Net operating income .... 11,934 14 500 12,448 55 866 13,369 12 7
Operating expenses .......... (7,972) 5 (299) (8,266) (17) 90 (8,193) (3) 1
Operating profit ............. 3,962 19 201 4,182 38 956 5,176 31 23
Income from associates ... 88 – 16 104 (12) (91) 1 (99) (88)
Profit before tax ............. 4,050 19 217 4,286 26 865 5,177 28 20
For footnotes, see page 89.
Review of business performance
European operations reported a pre-tax profit of US$5.2 billion compared with US$4.1 billion in the first half of 2007, an increase of 28 per cent. On an underlying basis, pre-tax profits increased by 20 per cent. In March 2007, HSBC acquired the remaining 50 per cent interest in HSBC Assurances in France. In October 2007, HSBC disposed of the Hamilton Insurance Company Limited and Hamilton Life Assurance Company Limited in the UK. Underlying net operating income grew by 6 per cent, in contrast with operating expenses, which fell by 1 per cent.
Personal Financial Services delivered the strongest increase in pre-tax profits due to a solid performance in the UK and continued expansion in Turkey. In the UK, growth was driven by lower operating expenses, in part reflecting the absence of the overdraft fee refund charges recognised in the first half of 2007, lower credit impairment charges and a one-off gain on the disposal of MasterCard Inc. (‘MasterCard’) shares. Commercial Banking was strongly ahead of the first half of 2007, as the strength of established businesses in the UK and France was complemented by strong growth in Turkey and other emerging markets. Commercial Banking also benefited from one-off gains on the disposal of the UK merchant acquiring business to a joint venture with Global Payments Inc., together with its share of the disposal gain on the sale of MasterCard shares. Private Banking performed well, as a result of significant inflows of client assets combined with increased foreign exchange trading profits due to volatile markets. Pre-tax profits
declined in Global Banking and Markets, driven by write-downs in credit-related trading exposures, which outweighed improvements in Balance Sheet Management and Rates.
In France, HSBC’s disposal of seven regional banks was completed on 2 July 2008 and a profit on disposal of US$2.1 billion will be recognised in the second half of 2008.
The following commentary is on an underlying basis.
Personal Financial Services reported a pre-tax profit of US$1.3 billion, an increase of 97 per cent compared with the first half of 2007. In the UK, pre-tax profit growth was driven by a reduction in loan impairment charges, following the enhanced credit controls introduced since 2006, together with lower operating expenses and a one-off gain on the disposal of MasterCard shares. In France, a US$38 million gain on the disposal of four mutual funds was offset by a fall in net interest income, as a contraction of spreads counteracted the benefit of higher balances. In Turkey, revenue growth, driven by increasing volumes on credit cards, deposit accounts and personal loans, outweighed the significant increase in costs incurred to support business growth and higher loan impairment charges as loan balances grew and seasoned.
In the UK, marketing campaigns primarily focused on higher value customers. The highly successful RateMatcher campaign, launched in April 2008, delivered a significant increase in new mortgage business, with balances transferred

H S B C H O L D I N G S P L C
Interim Management Report: Business Review (continued)
32
amounting to US$1.3 billion. Additional non-Rate Matcher mortgage business was also written as a result of the campaign. On current accounts, the acquisition of customers to fee-based packaged accounts continued with the ‘One Great Rate’ campaign launched in February 2008. The Group also continued its focus on Premier, which was re-launched during 2007 in order to provide seamless cross-border banking for affluent customers.
In France, HSBC’s disposal of seven regional banks was completed on 2 July 2008. These subsidiaries had been classified as held for sale and, accordingly, their net profits since February 2008 were reported within other operating income rather than in the individual income statement lines. In its core business in France, HSBC increased market share, building on its growing brand awareness. HSBC’s Personal Financial Services business in France, going forward, is focused on its core strategic segment of customers with a strong international connectivity. Premier was relaunched in France in the first half of 2008, supported by an extensive media campaign along with customer acquisition initiatives based on direct marketing. As a result, new Premier account openings have increased by more than 70 per cent since the first half of 2007.
In Turkey, HSBC’s organic growth strategy concentrated on delivery through branch expansion and new customer acquisition, predominantly led by credit card products. Investment in network expansion continued throughout the first half of 2008, with the opening of 78 new branches, supported by the addition of more than 1,500 staff since June 2007.
Net interest income was in line with the first half of 2007. In the UK, growth in savings balances and increased spreads on current accounts and credit cards were offset by the effect of a planned reduction in personal lending and credit card balances and a reduction in spreads on savings accounts.
HSBC’s increased focus on attracting and retaining deposit customers drove a 19 per cent increase in UK savings account balances for both new and existing customers. A number of new savings products launched in the past year, including a cash e-ISA and Online Bonus Saver, contributed to this growth. The resulting increase in net interest income from volume growth was partly offset by tightening spreads, due to competitive pricing and consecutive base rate cuts.
Average current account balances declined by 5 per cent, due to a reduction in the size of individual customer account balances, driven by recent
increases in food and utility costs. Despite this, the focus on high value customer account acquisition continued, with new Premier account openings 18 per cent above the first half of 2007. Current account spreads increased, driven by funding benefits, resulting in a 1 per cent growth in net interest income on current accounts.
Average unsecured lending balances in the UK declined by 10 per cent, reflecting a shift in risk preference and a greater focus on attracting deposit customers. HSBC maintained a cautious approach to unsecured lending, tightening its credit criteria and employing segmentation and risk-based pricing strategies in order to improve the profitability of new business. Spreads increased on unsecured loans as price rises implemented in the second half of 2007 flowed through the portfolio, while the cost of funds was largely fixed.
Credit card balances were 9 per cent lower than in the first half of 2007, falling to US$14.2 billion. This was predominantly due to the sale of certain non-core credit card portfolios between October 2007 and May 2008 and the more conservative approach to lending noted above. The resulting reduction in net interest income was partly offset by the benefit of a re-pricing exercise undertaken during 2007, which resulted in improved yields.
Average mortgage balances were 2 per cent lower than in the first half of 2007, driven by an industry-wide decline in mortgage volumes. Buy-to-let mortgages continue to represent less than 3 per cent of the UK mortgage portfolio, the result of a decision not to write brokered or self-certified mortgages. Despite turbulence in the UK mortgage industry, the market for remortgages remained relatively healthy and, with many lenders unable to compete, HSBC was able to expand its business, launching its mortgage RateMatcher campaign in April 2008. The campaign proved to be a success, generating significant press coverage and inbound call activity and a 38 per cent increase in mortgage applications compared with the first half of 2007. The RateMatcher campaign boosted HSBC’s market share of new mortgage business by value from 3 per cent in the first half of 2007 to 6 per cent in the first half of 2008, with a high of 12 per cent achieved in the month of May. The income benefits of the new business generated by the RateMatcher campaign will be seen in the second half of 2008 due to the time lag between loan approval and draw down.
Excluding the regional banks, net interest income in France fell. Growth in deposit and lending volumes from new customers attracted by direct marketing campaigns was more than offset by
33
narrower spreads, higher liquidity costs and a lower benefit from net free funds.
In Turkey, net interest income rose by 22 per cent, largely from increased card balances, where HSBC’s customer acquisition strategy led to a 37 per cent increase in credit cards in circulation, supported by a larger branch network and several new products, including co-branded and partnership cards. This volume-related growth was partially offset by a narrowing in spreads due to a sharp reduction in the interest rate cap set by the Central Bank of the Republic of Turkey. Competitive pricing designed to gain market share also led to an increase in volumes on deposit accounts and overdrafts, which more than compensated for the resulting decline in margins.
Net fee income was 5 per cent lower as an increase in Turkey offset a decline in France and a fall in the UK, partly due to a reduction in credit card fee income as a result of the partial disposal of the non-core credit card portfolios referred to above. In Turkey, credit card fees increased, driven by a 37 per cent increase in the number of cards in force, as a result of cards being deployed as the principal product to deliver customer acquisition. Excluding the regional banks, fee income in France was lower than in the first half of 2007. Increased sales of fee-based packaged accounts partly compensated for lower stock exchange and mutual fund fees, as poor market conditions deterred private investors.
Net trading income declined by 27 per cent. The movement in trading income largely reflected the fair value measurement of embedded options linked to government regulated home savings products in France.
Net income from financial instruments designated at fair value fell significantly to a loss of US$761 million. This was driven by falling investment markets affecting assets held within the life insurance businesses in France, the UK and Malta. A corresponding movement within net insurance claims and movement in liabilities to policyholders partially offset this decline.
Gains less losses from financial investments increased significantly to US$182 million, driven by a US$38 million gain on the disposal of four mutual funds in France during January 2008 and a US$160 million gain on disposal of MasterCard shares in the UK in June 2008.
Net earned insurance premiums increased by 4 per cent to US$2.1 billion, mainly in the UK due to continued sales of the new Guaranteed Income Bond which was launched in July 2007 and due to
the reclassification of certain pension contracts as ‘insurance’ rather than ‘investment’ products following the addition of enhanced life insurance features. In France, net insurance premiums reduced following the ceding of premiums under a significant reinsurance transaction in the first half of 2008. Excluding this, premium income was higher due to the success of promotional offers. The additional premiums led to additional policyholder liabilities being established and therefore to an increase in net insurance claims.
Other operating income increased to US$252 million, compared with an expense of US$110 million in the first half of 2007. This was mainly due to the non-recurrence of the Financial Services Authority (‘FSA’) rule changes implemented in May 2007, which affected the present value of in-force insurance (‘PVIF’) policies in the UK. In France, the reclassification of the regional banks as held for sale resulted in their net profits of US$15.3 million since February 2008 being reported in other operating income.
Loan impairment charges fell by 15 per cent; in the UK, they were 22 per cent below the same period in 2007 due to stable delinquency levels in the core unsecured portfolios and the disposal of selected non-core credit card portfolios referred to above. Mortgage impairment charges in the UK have gradually increased from their historically low levels in line with HSBC’s expectations and market conditions. In France, loan impairment charges increased slightly, mainly as a result of a reduction in limits applied to unauthorised overdrafts at the end of 2007 in accordance with new guidelines issued by the Commission Bancaire. Overall, credit quality in France remained good. In Turkey, loan impairment charges rose by 287 per cent, due to increased volumes of credit cards and personal loans, combined with rising delinquency rates. In recognition of this, HSBC tightened its new account underwriting criteria at the start of 2008, with increased cut-off scores, lower credit lines and revised account management policies.
Operating expenses improved by 9 per cent, mainly driven by the non-recurrence of overdraft fee refunds in the UK. There was a reduction in defined benefit pension costs, as a result of an actuarial assessment, and this partly offset an increase in rental charges following the sale and leaseback of UK branch properties. Excluding the regional banks, costs in France decreased, mainly due to a reduction in staff pension and post-retirement healthcare costs following the transfer of certain obligations to a third party. There was an increase in Premier marketing costs as the product was relaunched. Organic

H S B C H O L D I N G S P L C
Interim Management Report: Business Review (continued)
34
business expansion in Turkey was supported by a 34 per cent increase in operating expenses as 78 new branches were opened and staff numbers increased by more than 1,500 since June 2007.
Commercial Banking reported pre-tax profits of US$1.9 billion, an increase of 53 per cent compared with the first half of 2007. Revenues were boosted by gains of US$425 million and US$103 million on the sale of the UK merchant acquiring business to a joint venture with Global Payments Inc., as well as a share of the profits on the sale of MasterCard shares, respectively. Excluding these items, profit before tax rose by 11 per cent and revenues by 6 per cent, driven by the continued strength of established businesses in the UK and France augmented by new and growing operations in the developing markets in Turkey and in central and eastern Europe.
Following the roll-out of International Banking Centres and other infrastructure investment in previous years, the volume of cross-border business increased significantly. Successful outward referrals through the Group’s Global Links system increased by 122 per cent, including a 138 per cent rise in outward referrals from the UK. The attraction of HSBC’s international franchise was illustrated by the Group’s capture of a leading share of UK start-ups and business banking customers with an international focus.
In the UK, HSBC continued to focus on enhancing customer experience through the recruitment of sales staff and investment in direct channels in support of a strategic ambition to be recognised as the ‘best bank for small business’. In the first half of 2008, more than 100 branch-based business tills were opened and HSBC re-deployed 83 local business managers into key branch sites to provide additional local specialist support for customers located outside major conurbations.
HSBC continued to concentrate investment in the developing markets of central and eastern Europe and in Turkey. New receivables finance businesses were launched in Poland and the Czech Republic and, in Turkey, a further 18 branches were opened providing services to micro, small and mid-market customers. Across central and Eastern Europe, HSBC increased income by 49 per cent.
In France, following HSBC’s disposal of seven regional banks which was completed on 2 July 2008, HSBC remains well positioned to benefit from the Group’s international presence and is supporting this opportunity by investing in a new development programme, including 10 new Corporate Banking Centres and an expanded product range.
Net interest income rose by 2 per cent, to US$1.7 billion, largely driven by an increase of 43 per cent in Turkey and a more modest rise in the UK.
In the UK, average lending balances increased by 13 per cent. This was broadly based as strong volumes of new business were generated from HSBC’s client base, particularly in the mid-market segment. The income benefit from lending volume growth was partly offset by lower spreads as yields fell in the competitive market. However, new lending spreads in the corporate, mid and small business segments increased by 14 basis points and 21 basis points compared with the first and the second halves of 2007, respectively, as market liquidity for new credit reduced, driving prices higher. Net interest income on sterling overdrafts declined as the benefit of a modest increase in average balances was more than offset by tighter spreads. As part of its market positioning to its preferred customer base, HSBC reduced the rate charged to customers for unauthorised overdrafts, further constraining net interest income.
Average current account balances and spreads were broadly in line with the first half of 2007. Average foreign currency denominated current accounts grew, driven by customer acquisition, although the benefit of volume growth was more than offset by lower spreads in the declining US dollar interest rate environment.
HSBC’s strong capital position during a period of industry uncertainty helped to attract customer deposits and average deposits increased as a result. The benefit was offset by lower spreads as a reduction in interest rates paid to customers lagged base rate cuts in the first half of 2008.
In Turkey, higher net interest income was driven by growth in both loans and deposits as HSBC expanded across the country. Average loan and trade services balances increased by 15 per cent, following very strong customer acquisition. Micro, small and mid-sized customer numbers rose by 21 per cent in the period driven by branch expansion. The number of branches servicing Commercial Banking customers rose from 89 at 31 December 2007 to 107 at 30 June 2008. Customer acquisition was also boosted by the success of bundled products, including overdrafts, commercial car loans and small and micro business product bundles. The opening of three new Corporate Banking Centres in Istanbul also contributed. The benefits from loan growth were augmented by wider spreads as the proportion of higher yielding small and mid-market lending increased. Average deposit balances also rose, due to

35
customer acquisition and competitive pricing, offset by slightly lower spreads from a shift in product mix to higher yielding deposits.
Excluding HSBC’s French regional banks, net interest income in France was broadly in line with the first half of 2007 as growth in deposit and lending volumes were offset by narrower spreads, higher liquidity costs and a lower benefit from net free funds. Both average current account balances and deposits increased, driven by customer acquisition and initiatives taken to increase market share in small business banking. Average loan balances rose by 15 per cent as HSBC gained market share. This was partly offset by tighter spreads.
Net fee income increased by 3 per cent to US$1.1 billion. This was largely driven by higher fees in Turkey and the UK, where the rise in volumes in the mid-market segment, noted above, had a corresponding effect on related fee income. Payments and cash management, factoring, trade and insurance products also contributed to the growth in fees in Turkey.
Net fee income in the UK rose by 5 per cent. Higher card issuing fees were driven by an increase in transaction volumes, primarily due to the success of the revolving commercial credit card following its launch in 2006. Currency volatility in the first half of 2008 helped to drive higher transaction volumes and commissions from foreign exchange activity. A decline in lending fees offset these following a reduction in early repayment fees.
In France, excluding the regional banks, net fee income was 8 per cent higher than in the first half of 2007. Volumes rose as a consequence of the client acquisition noted above and increased marketing to existing customers, triggering a strong increase in banking transaction fees. This was offset by lower brokerage and mutual fund fees, as uncertain market conditions subdued investment sentiment and led customers to switch from investment fund products to deposit accounts.
A net loss from financial instruments designated at fair value of US$75 million compared with income of US$9 million in the first half of 2007. This fall was largely a result of a decline in value of equity investments held to support liabilities under insurance contracts, mainly offset by the change in net insurance claims and movement in liabilities to policyholders.
The sale of certain mutual funds in France and MasterCard shares in the UK led to an increase in gains less losses from financial investments.
As part of the Group’s strategy to grow the insurance business, HSBC introduced a new guaranteed investment bond and enhanced the benefits of some existing customer policies, which resulted in higher net insurance premiums and a PVIF gain in other operating income, respectively. The increase in other operating income was also driven by the gain on sale of the UK merchant acquiring business. Increased net insurance premiums were partly offset by a rise in net insurance claims.
Loan impairment charges of US$285 million were 10 per cent higher than in the first half of 2007, largely due to higher charges in France and Turkey following balance sheet growth. Loan impairment charges in the UK were broadly flat, notwithstanding a 13 per cent growth in lending and a weakening economic environment.
Operating expenses were unchanged from the first half of 2007. In the UK, a focus on efficient delivery of customer service through direct channels allowed investment in additional customer-facing staff in the commercial centres and the commercial wealth business. Additional investment in relationship managers and local business managers helped to improve customer retention and broaden the range of services delivered.
Increased utilisation of direct channels was evidenced by a 28 per cent rise in the number of active business internet banking customers. HSBC continued to develop its straight-through processing capability to enable more customers to buy products online. Business Direct, HSBC’s commercial direct banking service, attracted over 33,000 new accounts, of which approximately 75 per cent were opened by new HSBC customers.
Excluding the regional banks, costs in France were moderately lower than in the first half of 2007. This was due to reductions in staff pension and post-retirement healthcare costs following the transfer of certain obligations to external parties, and the beneficial effect of efficiency initiatives, partly offset by the non-recurrence of a litigation provision release.
In Turkey, costs rose by 32 per cent, driven by investment in a larger branch network together with increased marketing costs to support business expansion in the small and micro segments through the enlarged branch network. Staff costs increased by 15 per cent and customer facing staff numbers by 39 per cent as HSBC focused on customer service and product delivery in the expanded network.
H S B C H O L D I N G S P L C
Interim Management Report: Business Review (continued)
36
Global Banking and Markets’ profit before tax declined by 34 per cent to US$1.2 billion, primarily due to US$1.4 billion of write-downs in credit-related trading exposures and leveraged and acquisition finance loans, coupled with a reduction in Principal Investments revenues. These more than offset strong profit growth in Balance Sheet Management and Global Banking, and strong performances in the foreign exchange and Rates businesses.
Total operating income fell by 14 per cent to US$3.8 billion. The tighter credit and liquidity conditions in the UK which contributed to the write-downs referred to above were also reflected in a reduction in Principal Investments income after the excellent result in the first half of 2007. Higher revenues in other areas, most notably Rates in the UK and France and Balance Sheet Management in the UK, were driven by greater market volatility. Balance Sheet Management revenues increased by US$384 million in Europe. Global Banking revenues increased by 27 per cent as write-downs on leveraged and acquisition finance loans were more than offset by gains on credit default swap transactions in other parts of the portfolio.
Net interest income rose by 166 per cent, led by strong growth in Balance Sheet Management revenues in the UK due to increased margins driven by steepening sterling and US dollar yield curves. There was also growth in the UK from a focused enlargement of secured lending (repo) business. The UK also benefited from growth in payments and cash management activity, which was driven by a 33 per cent rise in deposits as customers responded to the volatile markets by increasing their cash holdings.
Net fee income declined in the UK and France in Global Markets. Higher cross-selling fees paid to Commercial Banking for generating foreign exchange business reduced net fee income but were more than compensated for by higher trading income on foreign exchange. A decline in equity markets also reduced funds under management in Global Asset Management, further contributing to lower fees.
Trading income fell by 29 per cent, chiefly from the write-downs noted above. As the market turmoil continued, the fair value of asset-backed securities and structured credit instruments further deteriorated as the credit and liquidity disruption that began in the US sub-prime market spread into other mortgage and mortgage-related products. HSBC had mitigated its risk from such events by purchasing protection from monoline insurers against losses from defaults,
primarily on asset-backed credit products. The market turmoil initially caused the fair value of this protection to increase significantly, reflecting the market view that it was more likely that defaults would occur on the underlying asset-backed paper. This sudden increase in the potential liabilities of the monoline insurers resulted in their credit ratings being downgraded as the scale of the liabilities incurred cast significant doubt on the ability of many monoline insurers to pay. Accordingly, a credit risk write-down was taken against the fair value of the exposure to monoline insurers. The market turmoil also caused the market value of some leveraged and acquisition finance loans to fall due to general credit and liquidity disruption. More information on these write-downs and the underlying assets is provided on page 113.
Partially offsetting these trading losses, Rates trading grew by 115 per cent due to high customer demand for inflation protection products in the UK and France. Foreign exchange trading revenues also rose, by 38 per cent, as market volatility continued, and equities grew by 79 per cent, excluding the effect of the gain on the sale of HSBC’s investment in Euronext N.V. in 2007. Further income arose from the fair value gains in Global Banking.
A loss of US$218 million was recognised in net income from financial instruments designated at fair value. This was due to a loss on euro-denominated debt which is offset in trading income.
Gains less losses from financial investments and dividend income both declined in comparison with the very strong performance in the first half of 2007 from the Principal Investments business. In 2008, the number of investments realised fell and the exit multiples achieved were reduced.
The loan impairment charge was small and represented only one basis point of customer loans and advances. This compared with a release in the first half of 2007. The UK credit environment for large corporate lending undoubtedly weakened in the first half of 2008, as evidenced by weak retail sales, falling commercial property prices and the restructuring of much of the UK house building sector.
Operating expenses fell by 2 per cent, reflecting lower bonus costs in the UK which were in line with financial performance. This was partly offset by higher administrative expenses in both the UK and France, where IT costs rose due to growth in headcount to support the increased volume and scope of business in Global Markets, including cross-sales and product control.
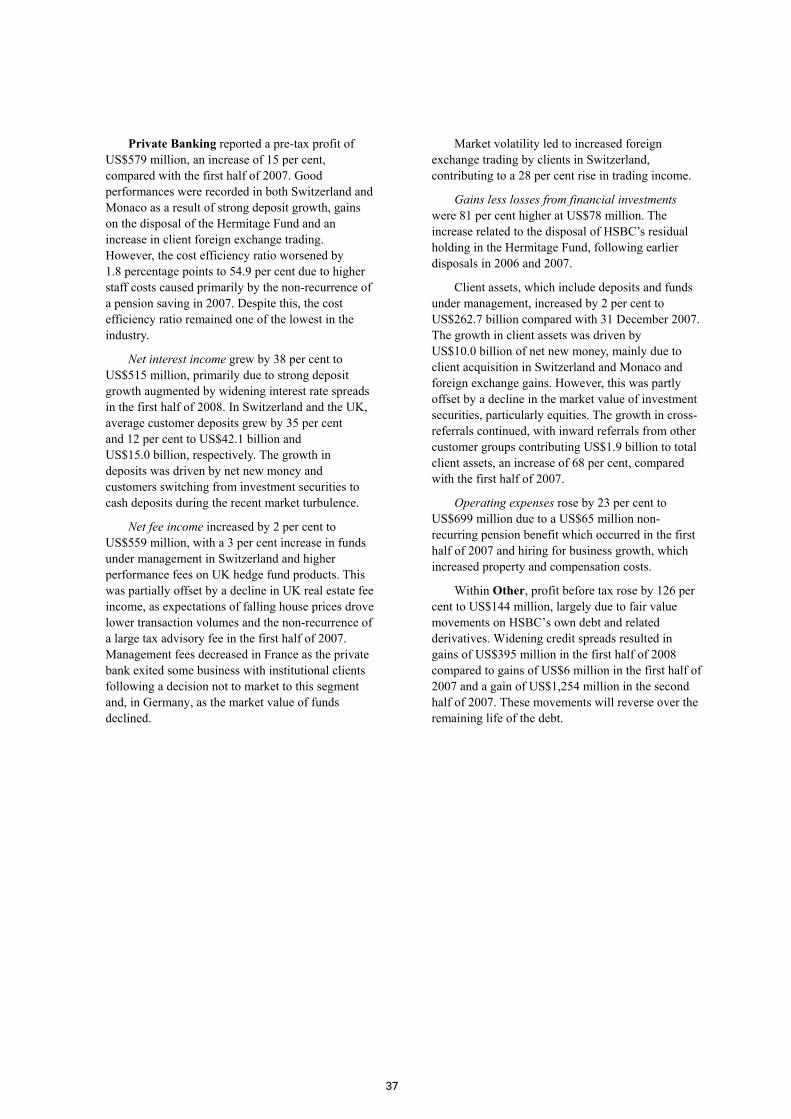
37
Private Banking reported a pre-tax profit of US$579 million, an increase of 15 per cent, compared with the first half of 2007. Good performances were recorded in both Switzerland and Monaco as a result of strong deposit growth, gains on the disposal of the Hermitage Fund and an increase in client foreign exchange trading. However, the cost efficiency ratio worsened by 1.8 percentage points to 54.9 per cent due to higher staff costs caused primarily by the non-recurrence of a pension saving in 2007. Despite this, the cost efficiency ratio remained one of the lowest in the industry.
Net interest income grew by 38 per cent to US$515 million, primarily due to strong deposit growth augmented by widening interest rate spreads in the first half of 2008. In Switzerland and the UK, average customer deposits grew by 35 per cent and 12 per cent to US$42.1 billion and US$15.0 billion, respectively. The growth in deposits was driven by net new money and customers switching from investment securities to cash deposits during the recent market turbulence.
Net fee income increased by 2 per cent to US$559 million, with a 3 per cent increase in funds under management in Switzerland and higher performance fees on UK hedge fund products. This was partially offset by a decline in UK real estate fee income, as expectations of falling house prices drove lower transaction volumes and the non-recurrence of a large tax advisory fee in the first half of 2007. Management fees decreased in France as the private bank exited some business with institutional clients following a decision not to market to this segment and, in Germany, as the market value of funds declined.
Market volatility led to increased foreign exchange trading by clients in Switzerland, contributing to a 28 per cent rise in trading income.
Gains less losses from financial investments were 81 per cent higher at US$78 million. The increase related to the disposal of HSBC’s residual holding in the Hermitage Fund, following earlier disposals in 2006 and 2007.
Client assets, which include deposits and funds under management, increased by 2 per cent to US$262.7 billion compared with 31 December 2007. The growth in client assets was driven by US$10.0 billion of net new money, mainly due to client acquisition in Switzerland and Monaco and foreign exchange gains. However, this was partly offset by a decline in the market value of investment securities, particularly equities. The growth in cross-referrals continued, with inward referrals from other customer groups contributing US$1.9 billion to total client assets, an increase of 68 per cent, compared with the first half of 2007.
Operating expenses rose by 23 per cent to US$699 million due to a US$65 million non-recurring pension benefit which occurred in the first half of 2007 and hiring for business growth, which increased property and compensation costs.
Within Other, profit before tax rose by 126 per cent to US$144 million, largely due to fair value movements on HSBC’s own debt and related derivatives. Widening credit spreads resulted in gains of US$395 million in the first half of 2008 compared to gains of US$6 million in the first half of 2007 and a gain of US$1,254 million in the second half of 2007. These movements will reverse over the remaining life of the debt.

H S B C H O L D I N G S P L C
Interim Management Report: Business Review (continued)
38
Reconciliation of reported and underlying profit before tax
Half-year to 30 June 2008 (‘1H08’) compared with half-year to 31 December 2007 (‘2H07’)
Europe
2H07 as reported US$m
Disposals and dilution gains1
US$m
Currency translation2
US$m
2H07 at 1H08 exchange rates US$m
Acqui- sitions1
US$m
Under- lying change US$m
1H08 as reported US$m
Re- ported change %
Under- lying change %
Net interest income .......... 3,826 (5) (11) 3,810 – 665 4,475 17 17 Net fee income ................. 4,287 – 6 4,293 – (70) 4,223 (1) (2)Other income3 .................. 6,157 19 (34) 6,142 – (199) 5,943 (3) (3)
Net operating income4 ..... 14,270 14 (39) 14,245 – 396 14,641 3 3
Loan impairment charges and other credit risk provisions .................... (1,179) – 26 (1,153) – (119) (1,272) (8) (10)
Net operating income ...... 13,091 14 (13) 13,092 – 277 13,369 2 2
Operating expenses .......... (8,553) 2 (12) (8,563) – 370 (8,193) 4 4
Operating profit ............... 4,538 16 (25) 4,529 – 647 5,176 14 14
Income from associates ... 7 – 1 8 – (7) 1 (86) (88)
Profit before tax ............... 4,545 16 (24) 4,537 – 640 5,177 14 14
For footnotes, see page 89.
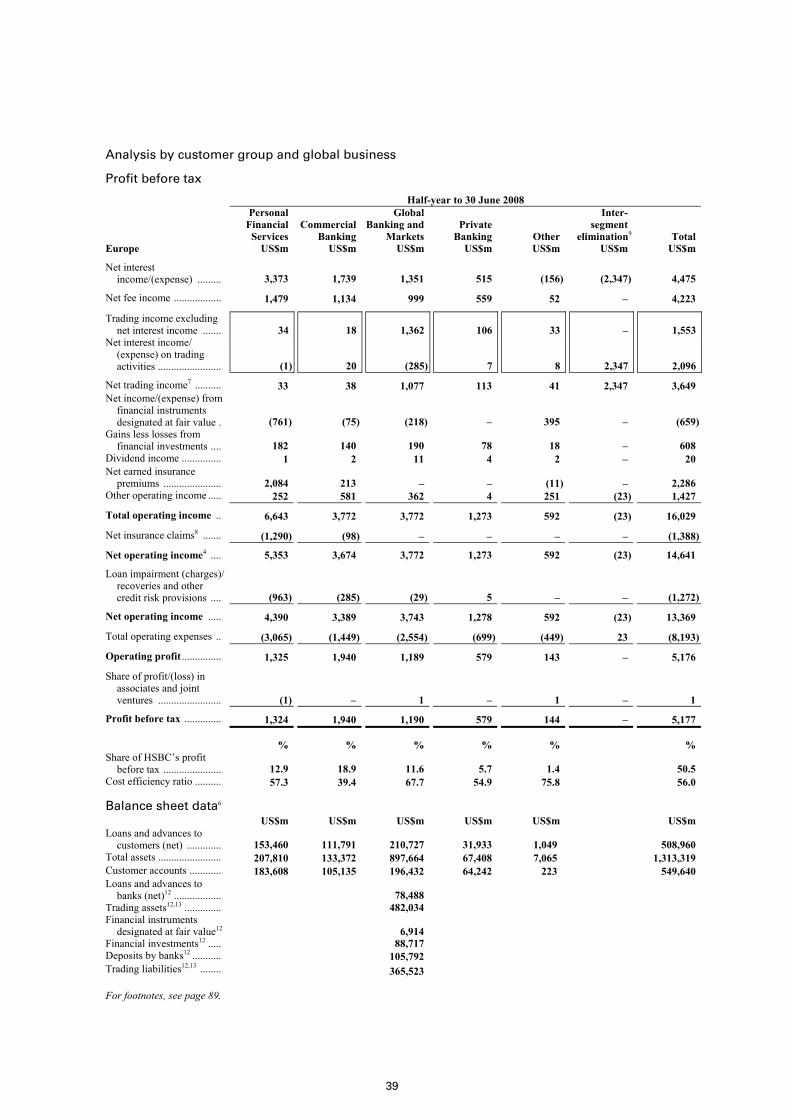
39
Analysis by customer group and global business
Profit before tax
Half-year to 30 June 2008
Europe
Personal Financial Services US$m
Commercial Banking US$m
Global Banking and Markets US$m
Private Banking US$m
Other
US$m
Inter- segment elimination9
US$m Total US$m
Net interest income/(expense) ......... 3,373 1,739 1,351 515 (156) (2,347) 4,475
Net fee income .................. 1,479 1,134 999 559 52 – 4,223
Trading income excluding net interest income ....... 34 18 1,362 106 33 – 1,553
Net interest income/ (expense) on trading activities ........................ (1) 20 (285) 7 8 2,347 2,096
Net trading income7 .......... 33 38 1,077 113 41 2,347 3,649 Net income/(expense) from
financial instruments designated at fair value . (761) (75) (218) – 395 – (659)
Gains less losses from financial investments .... 182 140 190 78 18 – 608
Dividend income ............... 1 2 11 4 2 – 20 Net earned insurance
premiums ...................... 2,084 213 – – (11) – 2,286 Other operating income ..... 252 581 362 4 251 (23) 1,427
Total operating income .. 6,643 3,772 3,772 1,273 592 (23) 16,029
Net insurance claims8 ....... (1,290) (98) – – – – (1,388)
Net operating income4 .... 5,353 3,674 3,772 1,273 592 (23) 14,641
Loan impairment (charges)/ recoveries and other credit risk provisions .... (963) (285) (29) 5 – – (1,272)
Net operating income ..... 4,390 3,389 3,743 1,278 592 (23) 13,369
Total operating expenses .. (3,065) (1,449) (2,554) (699) (449) 23 (8,193)
Operating profit ............... 1,325 1,940 1,189 579 143 – 5,176
Share of profit/(loss) in associates and joint ventures ........................ (1) – 1 – 1 – 1
Profit before tax .............. 1,324 1,940 1,190 579 144 – 5,177 % % % % % % Share of HSBC’s profit
before tax ...................... 12.9 18.9 11.6 5.7 1.4 50.5 Cost efficiency ratio .......... 57.3 39.4 67.7 54.9 75.8 56.0 Balance sheet data6 US$m US$m US$m US$m US$m US$m Loans and advances to
customers (net) ............. 153,460 111,791 210,727 31,933 1,049 508,960 Total assets ........................ 207,810 133,372 897,664 67,408 7,065 1,313,319 Customer accounts ............ 183,608 105,135 196,432 64,242 223 549,640 Loans and advances to
banks (net)12 .................. 78,488 Trading assets12,13 .............. 482,034 Financial instruments
designated at fair value12 6,914 Financial investments12 ..... 88,717 Deposits by banks12 ........... 105,792 Trading liabilities12,13 ........ 365,523
For footnotes, see page 89.
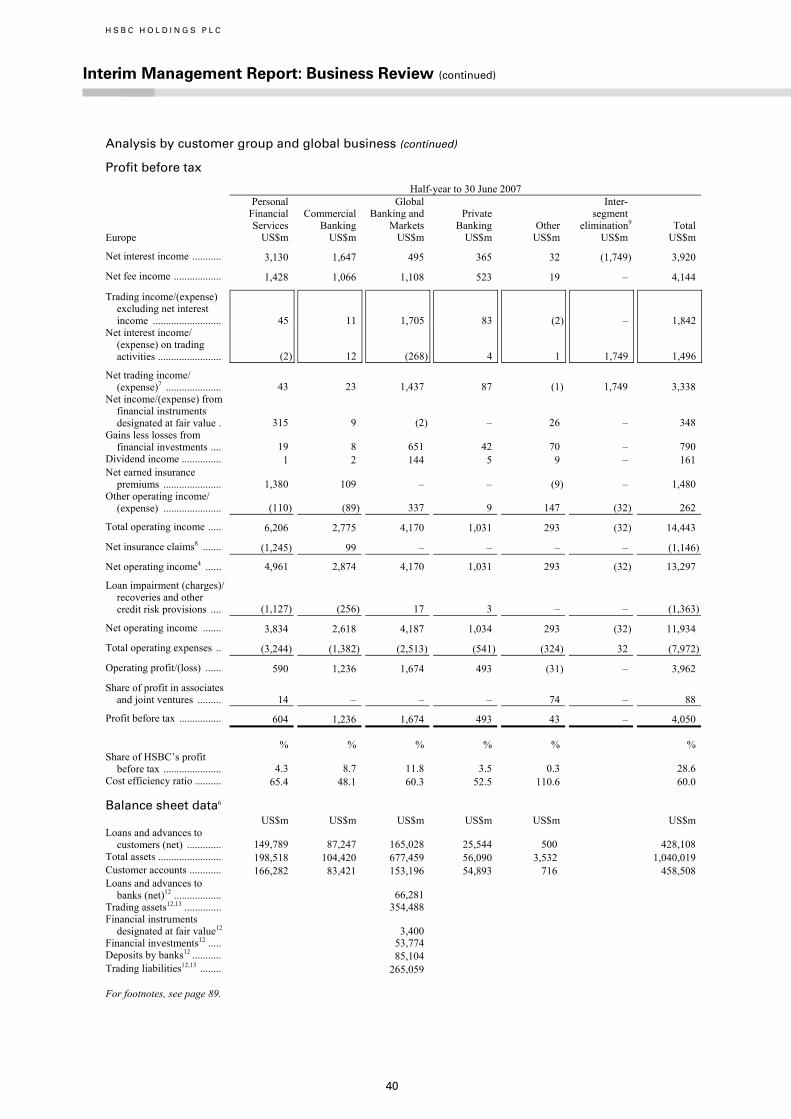
H S B C H O L D I N G S P L C
Interim Management Report: Business Review (continued)
40
Analysis by customer group and global business (continued)
Profit before tax
Half-year to 30 June 2007
Europe
Personal Financial Services US$m
Commercial Banking US$m
Global Banking and Markets US$m
Private Banking US$m
Other
US$m
Inter- segment elimination9
US$m Total US$m
Net interest income ........... 3,130 1,647 495 365 32 (1,749) 3,920
Net fee income .................. 1,428 1,066 1,108 523 19 – 4,144
Trading income/(expense) excluding net interest income .......................... 45 11 1,705 83 (2) – 1,842
Net interest income/ (expense) on trading activities ........................ (2) 12 (268) 4 1 1,749 1,496
Net trading income/ (expense)7 ..................... 43 23 1,437 87 (1) 1,749 3,338
Net income/(expense) from financial instruments designated at fair value . 315 9 (2) – 26 – 348
Gains less losses from financial investments .... 19 8 651 42 70 – 790
Dividend income ............... 1 2 144 5 9 – 161 Net earned insurance
premiums ...................... 1,380 109 – – (9) – 1,480 Other operating income/
(expense) ...................... (110) (89) 337 9 147 (32) 262
Total operating income ..... 6,206 2,775 4,170 1,031 293 (32) 14,443
Net insurance claims8 ....... (1,245) 99 – – – – (1,146)
Net operating income4 ...... 4,961 2,874 4,170 1,031 293 (32) 13,297
Loan impairment (charges)/ recoveries and other credit risk provisions .... (1,127) (256) 17 3 – – (1,363)
Net operating income ....... 3,834 2,618 4,187 1,034 293 (32) 11,934
Total operating expenses .. (3,244) (1,382) (2,513) (541) (324) 32 (7,972)
Operating profit/(loss) ...... 590 1,236 1,674 493 (31) – 3,962
Share of profit in associates and joint ventures ......... 14 – – – 74 – 88
Profit before tax ................ 604 1,236 1,674 493 43 – 4,050 % % % % % % Share of HSBC’s profit
before tax ...................... 4.3 8.7 11.8 3.5 0.3 28.6 Cost efficiency ratio .......... 65.4 48.1 60.3 52.5 110.6 60.0 Balance sheet data6 US$m US$m US$m US$m US$m US$m Loans and advances to
customers (net) ............. 149,789 87,247 165,028 25,544 500 428,108 Total assets ........................ 198,518 104,420 677,459 56,090 3,532 1,040,019 Customer accounts ............ 166,282 83,421 153,196 54,893 716 458,508 Loans and advances to
banks (net)12 .................. 66,281 Trading assets12,13 .............. 354,488 Financial instruments
designated at fair value12 3,400 Financial investments12 ..... 53,774 Deposits by banks12 ........... 85,104 Trading liabilities12,13 ........ 265,059
For footnotes, see page 89.

41
Half-year to 31 December 2007
Europe
Personal Financial Services US$m
Commercial Banking US$m
Global Banking and Markets US$m
Private Banking US$m
Other
US$m
Inter- segment elimination9
US$m Total US$m
Net interest income ........... 3,474 1,772 866 428 54 (2,768) 3,826
Net fee income/(expense) . 1,632 1,128 1,208 509 (190) – 4,287
Trading income excluding net interest income ....... 15 25 952 78 91 – 1,161
Net interest income/ (expense) on trading activities ........................ (5) 18 (342) 5 – 2,768 2,444
Net trading income7 .......... 10 43 610 83 91 2,768 3,605 Net income/(expense) from
financial instruments designated at fair value . (189) 22 (183) – 1,228 – 878
Gains less losses from financial investments .... 31 28 449 73 (45) – 536
Dividend income ............... – 2 11 2 (5) – 10 Net earned insurance
premiums ...................... 2,131 412 – – (13) – 2,530 Other operating income/
(expense) ...................... 164 54 516 (1) 154 44 931
Total operating income ..... 7,253 3,461 3,477 1,094 1,274 44 16,603
Net insurance claims8 ....... (1,969) (364) – – – – (2,333)
Net operating income4 ...... 5,284 3,097 3,477 1,094 1,274 44 14,270
Loan impairment (charges)/ recoveries and other credit risk provisions .... (917) (259) 9 (7) (5) – (1,179)
Net operating income ....... 4,367 2,838 3,486 1,087 1,269 44 13,091
Total operating expenses .. (3,391) (1,559) (2,637) (667) (255) (44) (8,553)
Operating profit ................ 976 1,279 849 420 1,014 – 4,538
Share of profit/(loss) in associates and joint ventures ........................ 1 1 4 2 (1) – 7
Profit before tax ................ 977 1,280 853 422 1,013 – 4,545 % % % % % % Share of HSBC’s profit
before tax ...................... 9.7 12.7 8.5 4.2 10.1 45.2 Cost efficiency ratio .......... 64.2 50.3 75.8 61.0 20.0 59.9 Balance sheet data6 US$m US$m US$m US$m US$m US$m Loans and advances to
customers (net) ............. 151,687 106,846 163,066 30,195 481 452,275 Total assets ........................ 200,432 124,464 794,673 60,010 4,736 1,184,315 Customer accounts ............ 178,757 99,704 163,713 62,055 725 504,954 Loans and advances to
banks (net)12 .................. 89,651 Trading assets12,13 .............. 396,487 Financial instruments
designated at fair value12 7,122 Financial investments12 ..... 94,416 Deposits by banks12 ........... 85,315 Trading liabilities12,13 ........ 305,697
For footnotes, see page 89.
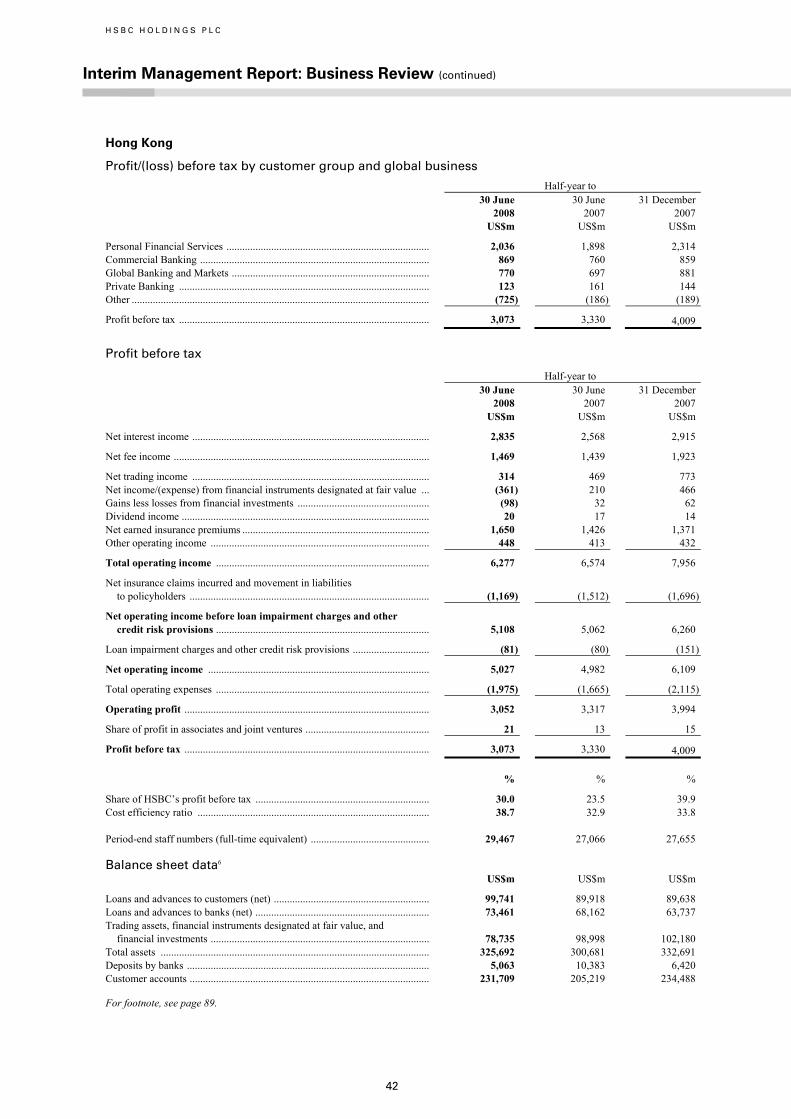
H S B C H O L D I N G S P L C
Interim Management Report: Business Review (continued)
42
Hong Kong
Profit/(loss) before tax by customer group and global business
Half-year to 30 June
2008 US$m
30 June 2007
US$m
31 December2007
US$m
Personal Financial Services ............................................................................. 2,036 1,898 2,314 Commercial Banking ....................................................................................... 869 760 859 Global Banking and Markets ........................................................................... 770 697 881 Private Banking ............................................................................................... 123 161 144 Other ................................................................................................................. (725) (186) (189)
Profit before tax ............................................................................................... 3,073 3,330 4,009
Profit before tax
Half-year to 30 June
2008US$m
30 June 2007
US$m
31 December2007
US$m
Net interest income .......................................................................................... 2,835 2,568 2,915
Net fee income ................................................................................................. 1,469 1,439 1,923
Net trading income .......................................................................................... 314 469 773 Net income/(expense) from financial instruments designated at fair value ... (361) 210 466 Gains less losses from financial investments .................................................. (98) 32 62 Dividend income .............................................................................................. 20 17 14 Net earned insurance premiums ....................................................................... 1,650 1,426 1,371 Other operating income ................................................................................... 448 413 432
Total operating income ................................................................................. 6,277 6,574 7,956
Net insurance claims incurred and movement in liabilities to policyholders ........................................................................................... (1,169) (1,512) (1,696)
Net operating income before loan impairment charges and other credit risk provisions ................................................................................. 5,108 5,062 6,260
Loan impairment charges and other credit risk provisions ............................. (81) (80) (151)
Net operating income .................................................................................... 5,027 4,982 6,109
Total operating expenses ................................................................................. (1,975) (1,665) (2,115)
Operating profit ............................................................................................. 3,052 3,317 3,994
Share of profit in associates and joint ventures ............................................... 21 13 15
Profit before tax ............................................................................................. 3,073 3,330 4,009 % % %
Share of HSBC’s profit before tax .................................................................. 30.0 23.5 39.9 Cost efficiency ratio ........................................................................................ 38.7 32.9 33.8 Period-end staff numbers (full-time equivalent) ............................................. 29,467 27,066 27,655 Balance sheet data6 US$m US$m US$m
Loans and advances to customers (net) ........................................................... 99,741 89,918 89,638 Loans and advances to banks (net) .................................................................. 73,461 68,162 63,737 Trading assets, financial instruments designated at fair value, and
financial investments ................................................................................... 78,735 98,998 102,180 Total assets ...................................................................................................... 325,692 300,681 332,691 Deposits by banks ............................................................................................ 5,063 10,383 6,420 Customer accounts ........................................................................................... 231,709 205,219 234,488
For footnote, see page 89.

43
Economic briefing
Hong Kong’s economy proved robust during the first months of 2008, with year-on-year GDP growth accelerating to 7.1 per cent in the first quarter from 6.9 per cent in the final quarter of 2007. Domestic demand was the major driver of this growth, with both private consumption and fixed asset investment rising sharply. Exports also rose during the first half of 2008, adding further impetus to the economy. Labour markets remained very tight and the unemployment
rate maintained a 10-year low of 3.3 per cent in the second quarter, supporting consumer spending. Investment demand was also strong in the first quarter in the falling interest environment. However, inflation accelerated during the first half of 2008 and while this largely reflected rising food and energy prices, increased rental and wage costs also contributed. The Government’s budget measures also supported domestic demand. Interest rates fell in line with US rates.
Reconciliation of reported and underlying profit before tax
Half-year to 30 June 2008 (‘1H08’) compared with half-year to 30 June 2007 (‘1H07’)
Hong Kong
1H07 as reported US$m
Disposals and dilution gains1
US$m
Currency translation2
US$m
1H07 at 1H08 exchange rates US$m
Acqui- sitions1
US$m
Under- lying change US$m
1H08 as reported US$m
Re- ported change %
Under- lying change %
Net interest income .......... 2,568 – 7 2,575 – 260 2,835 10 10 Net fee income ................. 1,439 – 4 1,443 – 26 1,469 2 2 Other income3 .................. 1,055 – (1) 1,054 – (250) 804 (24) (24)
Net operating income4 ... 5,062 – 10 5,072 – 36 5,108 1 1
Loan impairment charges and other credit risk provisions .................... (80) – (1) (81) – – (81) (1) –
Net operating income .... 4,982 – 9 4,991 – 36 5,027 1 1
Operating expenses .......... (1,665) – (4) (1,669) – (306) (1,975) (19) (18)
Operating profit ............. 3,317 – 5 3,322 – (270) 3,052 (8) (8)
Income from associates ... 13 – - 13 – 8 21 62 62
Profit before tax ............. 3,330 – 5 3,335 – (262) 3,073 (8) (8)
For footnotes, see page 89.
Review of business performance
HSBC’s operations in Hong Kong reported a pre-tax profit of US$3.1 billion, compared with US$3.3 billion in the first half of 2007, a decrease of 8 per cent on both a reported and an underlying basis. The decrease was due to the impairment of certain HSBC strategic investments, which were necessary as a consequence of significant falls in equity market prices. These impairments more than offset profit growth in Personal Financial Services, Commercial Banking and Global Banking and Markets. Underlying net operating income was largely in line with the first half of 2007, while operating expenses grew by 18 per cent, causing a worsening in the cost efficiency ratio to 38.7 per cent.
Pre-tax profits grew in Commercial Banking and Personal Financial Services despite the adverse effects of lower interest rates, driven by strong balance sheet growth through customer acquisition and new product offerings. Strong performance in Global Banking and Markets was driven by
increased income from Balance Sheet Management, as falling interest rates led to a lower cost of funds and a steeper yield curve partially offset by a write-down on an exposure to a monoline insurer. In Private Banking, pre-tax profits fell, largely due to a decline in the value of equities on the Hong Kong stock market, compared with the first half of 2007.
The following commentary is on an underlying basis.
Personal Financial Services reported pre-tax profits of US$2.0 billion, 7 per cent higher than in the first half of 2007. Revenues rose by 7 per cent due to growth in both net interest income and fee income. Higher cost incurred in generating increased business volumes led the cost efficiency ratio to worsen by 1.6 percentage points compared with the first half of 2007 to 29.1 per cent.
Net interest income rose by 6 per cent to US$1.7 billion, driven by deposit volume growth from higher savings balances and by wider margins
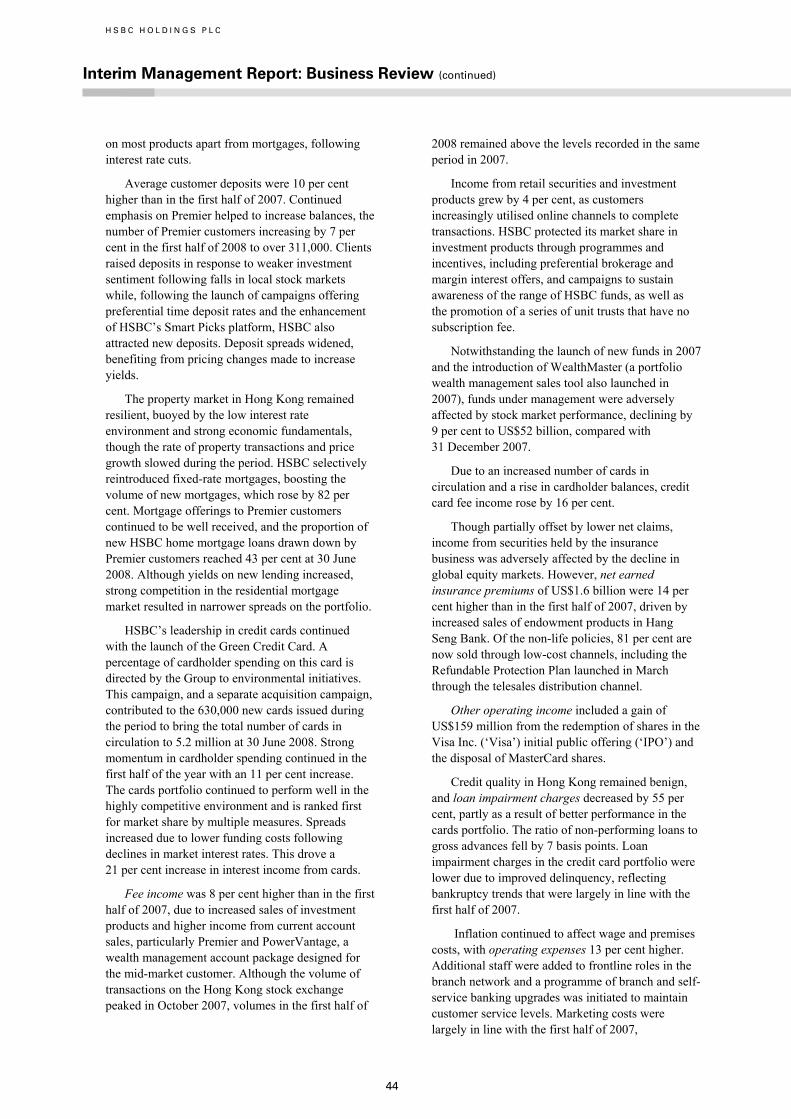
H S B C H O L D I N G S P L C
Interim Management Report: Business Review (continued)
44
on most products apart from mortgages, following interest rate cuts.
Average customer deposits were 10 per cent higher than in the first half of 2007. Continued emphasis on Premier helped to increase balances, the number of Premier customers increasing by 7 per cent in the first half of 2008 to over 311,000. Clients raised deposits in response to weaker investment sentiment following falls in local stock markets while, following the launch of campaigns offering preferential time deposit rates and the enhancement of HSBC’s Smart Picks platform, HSBC also attracted new deposits. Deposit spreads widened, benefiting from pricing changes made to increase yields.
The property market in Hong Kong remained resilient, buoyed by the low interest rate environment and strong economic fundamentals, though the rate of property transactions and price growth slowed during the period. HSBC selectively reintroduced fixed-rate mortgages, boosting the volume of new mortgages, which rose by 82 per cent. Mortgage offerings to Premier customers continued to be well received, and the proportion of new HSBC home mortgage loans drawn down by Premier customers reached 43 per cent at 30 June 2008. Although yields on new lending increased, strong competition in the residential mortgage market resulted in narrower spreads on the portfolio.
HSBC’s leadership in credit cards continued with the launch of the Green Credit Card. A percentage of cardholder spending on this card is directed by the Group to environmental initiatives. This campaign, and a separate acquisition campaign, contributed to the 630,000 new cards issued during the period to bring the total number of cards in circulation to 5.2 million at 30 June 2008. Strong momentum in cardholder spending continued in the first half of the year with an 11 per cent increase. The cards portfolio continued to perform well in the highly competitive environment and is ranked first for market share by multiple measures. Spreads increased due to lower funding costs following declines in market interest rates. This drove a 21 per cent increase in interest income from cards.
Fee income was 8 per cent higher than in the first half of 2007, due to increased sales of investment products and higher income from current account sales, particularly Premier and PowerVantage, a wealth management account package designed for the mid-market customer. Although the volume of transactions on the Hong Kong stock exchange peaked in October 2007, volumes in the first half of
2008 remained above the levels recorded in the same period in 2007.
Income from retail securities and investment products grew by 4 per cent, as customers increasingly utilised online channels to complete transactions. HSBC protected its market share in investment products through programmes and incentives, including preferential brokerage and margin interest offers, and campaigns to sustain awareness of the range of HSBC funds, as well as the promotion of a series of unit trusts that have no subscription fee.
Notwithstanding the launch of new funds in 2007 and the introduction of WealthMaster (a portfolio wealth management sales tool also launched in 2007), funds under management were adversely affected by stock market performance, declining by 9 per cent to US$52 billion, compared with 31 December 2007.
Due to an increased number of cards in circulation and a rise in cardholder balances, credit card fee income rose by 16 per cent.
Though partially offset by lower net claims, income from securities held by the insurance business was adversely affected by the decline in global equity markets. However, net earned insurance premiums of US$1.6 billion were 14 per cent higher than in the first half of 2007, driven by increased sales of endowment products in Hang Seng Bank. Of the non-life policies, 81 per cent are now sold through low-cost channels, including the Refundable Protection Plan launched in March through the telesales distribution channel.
Other operating income included a gain of US$159 million from the redemption of shares in the Visa Inc. (‘Visa’) initial public offering (‘IPO’) and the disposal of MasterCard shares.
Credit quality in Hong Kong remained benign, and loan impairment charges decreased by 55 per cent, partly as a result of better performance in the cards portfolio. The ratio of non-performing loans to gross advances fell by 7 basis points. Loan impairment charges in the credit card portfolio were lower due to improved delinquency, reflecting bankruptcy trends that were largely in line with the first half of 2007.
Inflation continued to affect wage and premises costs, with operating expenses 13 per cent higher. Additional staff were added to frontline roles in the branch network and a programme of branch and self-service banking upgrades was initiated to maintain customer service levels. Marketing costs were largely in line with the first half of 2007,
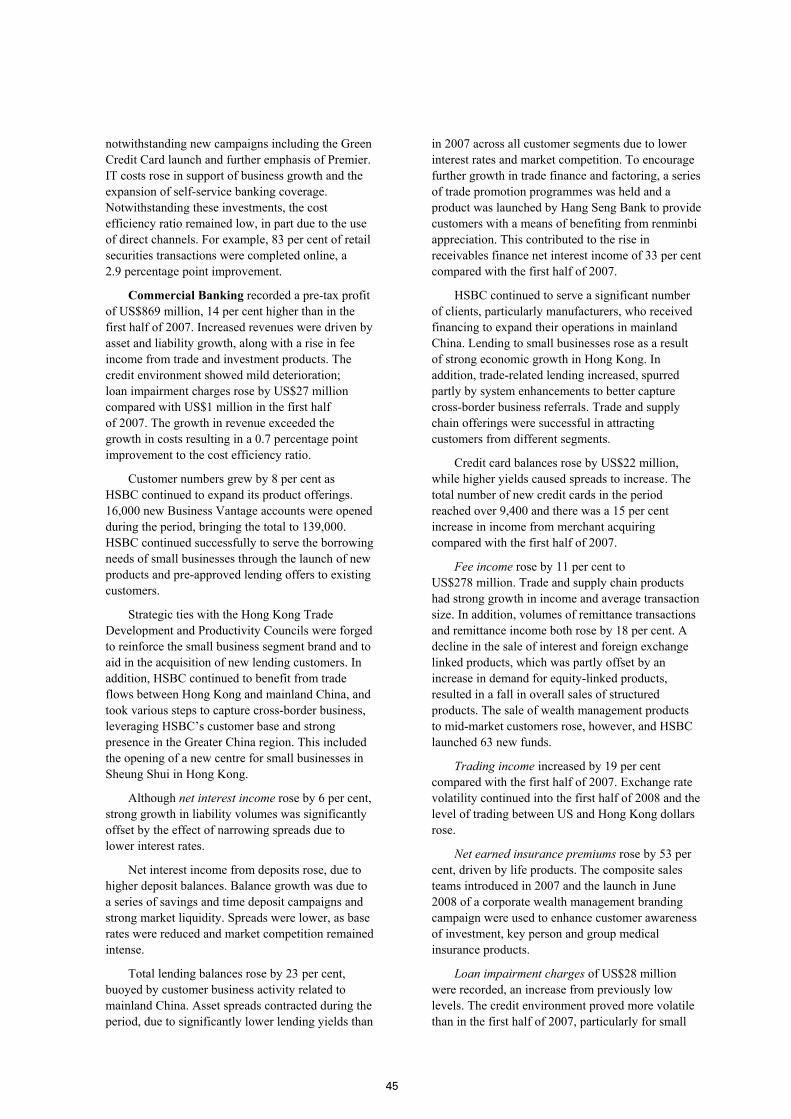
45
notwithstanding new campaigns including the Green Credit Card launch and further emphasis of Premier. IT costs rose in support of business growth and the expansion of self-service banking coverage. Notwithstanding these investments, the cost efficiency ratio remained low, in part due to the use of direct channels. For example, 83 per cent of retail securities transactions were completed online, a 2.9 percentage point improvement.
Commercial Banking recorded a pre-tax profit of US$869 million, 14 per cent higher than in the first half of 2007. Increased revenues were driven by asset and liability growth, along with a rise in fee income from trade and investment products. The credit environment showed mild deterioration; loan impairment charges rose by US$27 million compared with US$1 million in the first half of 2007. The growth in revenue exceeded the growth in costs resulting in a 0.7 percentage point improvement to the cost efficiency ratio.
Customer numbers grew by 8 per cent as HSBC continued to expand its product offerings. 16,000 new Business Vantage accounts were opened during the period, bringing the total to 139,000. HSBC continued successfully to serve the borrowing needs of small businesses through the launch of new products and pre-approved lending offers to existing customers.
Strategic ties with the Hong Kong Trade Development and Productivity Councils were forged to reinforce the small business segment brand and to aid in the acquisition of new lending customers. In addition, HSBC continued to benefit from trade flows between Hong Kong and mainland China, and took various steps to capture cross-border business, leveraging HSBC’s customer base and strong presence in the Greater China region. This included the opening of a new centre for small businesses in Sheung Shui in Hong Kong.
Although net interest income rose by 6 per cent, strong growth in liability volumes was significantly offset by the effect of narrowing spreads due to lower interest rates.
Net interest income from deposits rose, due to higher deposit balances. Balance growth was due to a series of savings and time deposit campaigns and strong market liquidity. Spreads were lower, as base rates were reduced and market competition remained intense.
Total lending balances rose by 23 per cent, buoyed by customer business activity related to mainland China. Asset spreads contracted during the period, due to significantly lower lending yields than
in 2007 across all customer segments due to lower interest rates and market competition. To encourage further growth in trade finance and factoring, a series of trade promotion programmes was held and a product was launched by Hang Seng Bank to provide customers with a means of benefiting from renminbi appreciation. This contributed to the rise in receivables finance net interest income of 33 per cent compared with the first half of 2007.
HSBC continued to serve a significant number of clients, particularly manufacturers, who received financing to expand their operations in mainland China. Lending to small businesses rose as a result of strong economic growth in Hong Kong. In addition, trade-related lending increased, spurred partly by system enhancements to better capture cross-border business referrals. Trade and supply chain offerings were successful in attracting customers from different segments.
Credit card balances rose by US$22 million, while higher yields caused spreads to increase. The total number of new credit cards in the period reached over 9,400 and there was a 15 per cent increase in income from merchant acquiring compared with the first half of 2007.
Fee income rose by 11 per cent to US$278 million. Trade and supply chain products had strong growth in income and average transaction size. In addition, volumes of remittance transactions and remittance income both rose by 18 per cent. A decline in the sale of interest and foreign exchange linked products, which was partly offset by an increase in demand for equity-linked products, resulted in a fall in overall sales of structured products. The sale of wealth management products to mid-market customers rose, however, and HSBC launched 63 new funds.
Trading income increased by 19 per cent compared with the first half of 2007. Exchange rate volatility continued into the first half of 2008 and the level of trading between US and Hong Kong dollars rose.
Net earned insurance premiums rose by 53 per cent, driven by life products. The composite sales teams introduced in 2007 and the launch in June 2008 of a corporate wealth management branding campaign were used to enhance customer awareness of investment, key person and group medical insurance products.
Loan impairment charges of US$28 million were recorded, an increase from previously low levels. The credit environment proved more volatile than in the first half of 2007, particularly for small

H S B C H O L D I N G S P L C
Interim Management Report: Business Review (continued)
46
and medium businesses with operations in mainland China. Impaired customer loans were 0.52 per cent of total loans and advances at 30 June 2008, a further 17 basis point improvement on its previously low level.
Operating expenses rose by 13 per cent, due to a combination of higher staff numbers, wage inflation and increased premises costs. Nearly 200 frontline staff were added since 30 June 2007, to provide additional capacity for business growth. IT costs rose as the number of IT-related projects, including the upgrade of internet systems, increased. The number of transactions through direct channels rose to 42 per cent of the total volume. 200,000 customers were registered as internet users at 30 June 2008, compared with 176,000 at the end of 2007. Call centres were also increasingly utilised to generate lower cost sales.
Global Banking and Markets reported a pre-tax profit of US$770 million, an increase of 10 per cent over the first half of 2007. This growth was mainly due to an increase in net interest income in Balance Sheet Management, partly offset by a decline in trading income, driven by a write-down on an exposure to a monoline insurer.
Total operating income rose by 13 per cent to US$1.3 billion. The fall in short-term US and Hong Kong dollar interest rates supported the strong results of Balance Sheet Management and Rates trading. Income from foreign exchange trading benefited from exchange rate volatility. The securities services business earned increased fees, principally in funds services. Partly offsetting this was a monoline exposure write-down in structured credit of US$0.2 billion.
Net interest income grew by 91 per cent to US$801 million, driven mainly by Balance Sheet Management, which increased by US$389 million due to a steepening of the US dollar and Hong Kong dollar yield curves. Net interest income from Global Banking increased by 13 per cent due to an improvement in lending spreads in a more conservative lending environment.
Net fee income decreased, mainly due to higher customer referral fees paid in respect of increased sales of equity-linked investments to retail banking customers; these sales drove a corresponding rise in trading income. Net fee income also decreased due to a decline in initial public offering (‘IPO’) success fees. This was partly offset by a rise in securities services revenues, particularly in funds services. Increased activity by fund managers and greater than expected cash balances contributed to this revenue growth. Higher fees in Global Asset Management
were driven by a number of successful product launches which contributed to US$4.2 billion net new money.
Trading income declined by 43 per cent to US$217 million, due to a write-down in a monoline exposure. For a description of the background to monoline write-downs, see page 36. Performance in Credit also weakened as spreads widened. These declines were mitigated in part by a 72 per cent growth in foreign exchange trading revenues, which were driven by volatile currency markets, increased investment flows and a greater focus on cross-sales to other customer groups. Equities increased by 39 per cent as a result of higher issuance of equity-linked products, in response to market demand from retail customers. Rates income grew by 28 per cent as market conditions drove clients to hedge interest rate risk exposure.
Operating expenses rose by 13 per cent, mainly due to an increase in performance costs resulting from improved revenues in certain businesses, and a rise in staff numbers to support the growth of product areas such as structured equities, securities services and corporate lending. IT costs increased, mainly due to systems development associated with the growth of the Global Markets.
Private Banking reported a pre-tax profit of US$123 million, a decrease of 24 per cent on the first half of 2007. With the decline in the value of equities on the Hong Kong stock market in the first half of 2008, demand for equity-linked structured products diminished, resulting in lower revenue than the strong results in 2007. The cost efficiency ratio worsened by 10.4 percentage points to 50.8 per cent.
Net interest income grew by 96 per cent to US$96 million, with a 33 per cent increase in customer deposits. The growth in customer deposits was driven by customers switching from investment securities to cash deposits, due to market turbulence and poor equity market performance.
Fee income rose by 19 per cent to US$95 million, owing largely to performance fees related to Asian discretionary portfolios and growth of the trust business. Partially offsetting this were lower fees from mutual funds, as funds under management decreased.
Trading income fell by 56 per cent to US$57 million, attributable to the downturn in the Hong Kong stock market. In particular, there was a decline in demand for equity-linked structured products, which were the primary driver of trading income in 2007.

47
Client assets decreased by 9 per cent to US$66.4 billion, compared with 31 December 2007 because of the lower market values of funds. Despite this, the growth in cross-referrals continued, with inward referrals from other customer groups contributing US$613 million to total client assets compared with US$190 million the first half of 2007.
Operating expenses increased by 17 per cent to US$127 million, primarily due to a rise in staff costs, which were driven by increased salaries in a competitive labour market and higher numbers of staff recruited in response to a greater number of clients.
Within Other, a loss of US$725 million was reported, compared with a loss of US$186 million in the first half of 2007. The decrease was driven by equity market declines, which resulted in total impairments of US$296 million in the value of several of HSBC’s strategic investments in the region.
The fall in net interest income was partly due to lower yields on core liquidity partly as a result of a switch to shorter maturities for these investments. Hong Kong head office and central IT costs rose by 22 per cent, reflecting increased activity in supporting business expansion. These costs were substantially offset by recoveries from Group entities.
Reconciliation of reported and underlying profit before tax
Half-year to 30 June 2008 (‘1H08’) compared with half-year to 31 December 2007 (‘2H07’)
Hong Kong
2H07 as reported US$m
Disposals and dilution gains1
US$m
Currency translation2
US$m
2H07 at 1H08 exchange rates US$m
Acqui- sitions1
US$m
Under- lying change US$m
1H08 as reported US$m
Re- ported change %
Under- lying change %
Net interest income .......... 2,915 – (2) 2,913 – (78) 2,835 (3) (3)Net fee income ................. 1,923 – (1) 1,922 – (453) 1,469 (24) (24)Other income3 .................. 1,422 – (2) 1,420 – (616) 804 (43) (43)
Net operating income4 ..... 6,260 – (5) 6,255 – (1,147) 5,108 (18) (18)
Loan impairment charges and other credit risk provisions .................... (151) – – (151) – 70 (81) 46 46
Net operating income ...... 6,109 – (5) 6,104 – (1,077) 5,027 (18) (18)
Operating expenses .......... (2,115) – 3 (2,112) – 137 (1,975) 7 6
Operating profit ............... 3,994 – (2) 3,992 – (940) 3,052 (24) (24)
Income from associates ... 15 – – 15 – 6 21 40 40
Profit before tax ............... 4,009 – (2) 4,007 – (934) 3,073 (23) (23)
For footnotes, see page 89.
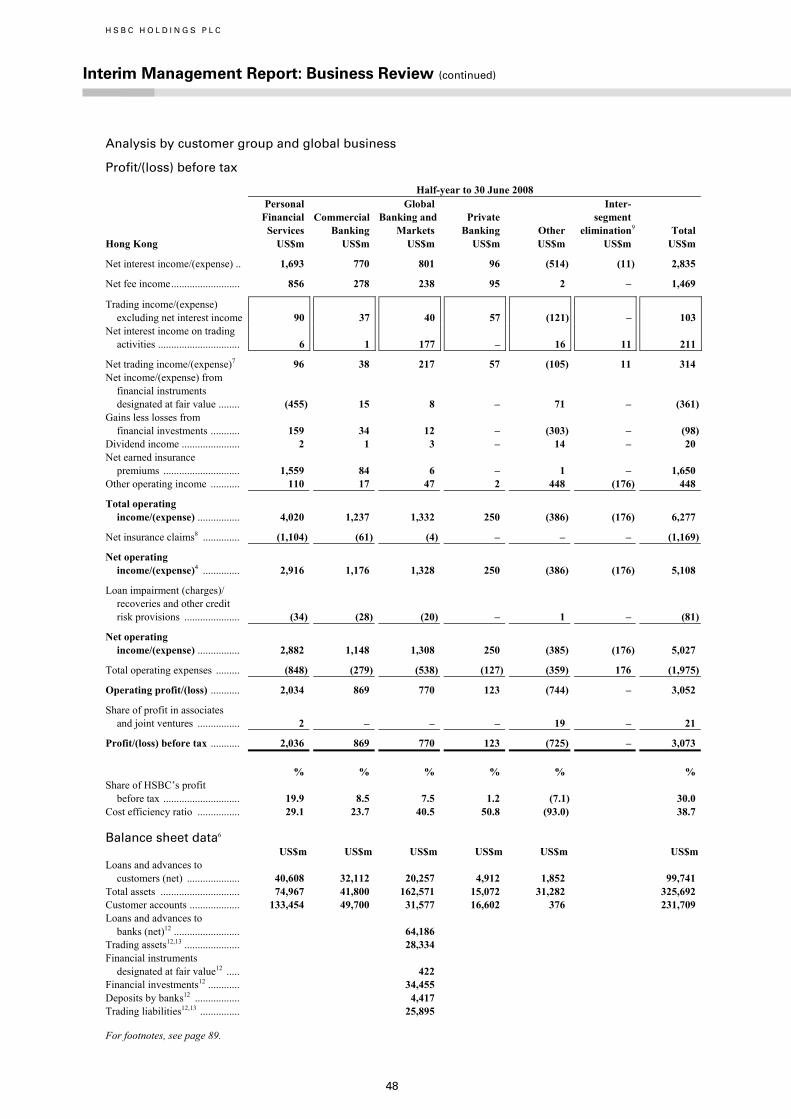
H S B C H O L D I N G S P L C
Interim Management Report: Business Review (continued)
48
Analysis by customer group and global business
Profit/(loss) before tax
Half-year to 30 June 2008
Hong Kong
Personal Financial Services US$m
Commercial Banking US$m
GlobalBanking and Markets US$m
Private Banking US$m
Other US$m
Inter- segment elimination9
US$m
Total US$m
Net interest income/(expense) .. 1,693 770 801 96 (514) (11) 2,835
Net fee income.......................... 856 278 238 95 2 – 1,469
Trading income/(expense) excluding net interest income 90 37 40 57 (121) – 103
Net interest income on trading activities ............................... 6 1 177 – 16 11 211
Net trading income/(expense)7 96 38 217 57 (105) 11 314 Net income/(expense) from
financial instruments designated at fair value ........ (455) 15 8 – 71 – (361)
Gains less losses from financial investments ........... 159 34 12 – (303) – (98)
Dividend income ...................... 2 1 3 – 14 – 20 Net earned insurance
premiums ............................. 1,559 84 6 – 1 – 1,650 Other operating income ........... 110 17 47 2 448 (176) 448
Total operating income/(expense) ................ 4,020 1,237 1,332 250 (386) (176) 6,277
Net insurance claims8 .............. (1,104) (61) (4) – – – (1,169)
Net operating income/(expense)4 .............. 2,916 1,176 1,328 250 (386) (176) 5,108
Loan impairment (charges)/ recoveries and other credit risk provisions ..................... (34) (28) (20) – 1 – (81)
Net operating income/(expense) ................ 2,882 1,148 1,308 250 (385) (176) 5,027
Total operating expenses ......... (848) (279) (538) (127) (359) 176 (1,975)
Operating profit/(loss) ........... 2,034 869 770 123 (744) – 3,052
Share of profit in associates and joint ventures ................ 2 – – – 19 – 21
Profit/(loss) before tax ........... 2,036 869 770 123 (725) – 3,073 % % % % % % Share of HSBC’s profit
before tax ............................. 19.9 8.5 7.5 1.2 (7.1) 30.0 Cost efficiency ratio ................ 29.1 23.7 40.5 50.8 (93.0) 38.7 Balance sheet data6 US$m US$m US$m US$m US$m US$mLoans and advances to
customers (net) .................... 40,608 32,112 20,257 4,912 1,852 99,741 Total assets .............................. 74,967 41,800 162,571 15,072 31,282 325,692 Customer accounts ................... 133,454 49,700 31,577 16,602 376 231,709 Loans and advances to
banks (net)12 ......................... 64,186 Trading assets12,13 ..................... 28,334 Financial instruments
designated at fair value12 ..... 422 Financial investments12 ............ 34,455 Deposits by banks12 ................. 4,417 Trading liabilities12,13 ............... 25,895
For footnotes, see page 89.

49
Profit/(loss) before tax
Half-year to 30 June 2007
Hong Kong
Personal Financial Services US$m
Commercial Banking US$m
Global Banking and Markets US$m
Private Banking US$m
Other US$m
Inter- segment elimination9 US$m
Total US$m
Net interest income/(expense) .. 1,588 726 418 49 (372) 159 2,568
Net fee income.......................... 791 250 318 80 – – 1,439
Trading income/(expense) excluding net interest income ................................. 74 32 302 130 (13) – 525
Net interest income on trading activities ............................... 2 – 80 – 21 (159) (56)
Net trading income7 ................. 76 32 382 130 8 (159) 469 Net income/(expense) from
financial instruments designated at fair value ........ 273 (36) 1 – (28) – 210
Gains less losses from financial investments ........... – – 1 1 30 – 32
Dividend income ...................... 1 – 1 – 15 – 17 Net earned insurance
premiums ............................. 1,366 55 5 – – – 1,426 Other operating income ........... 97 13 55 10 390 (152) 413
Total operating income ............ 4,192 1,040 1,181 270 43 (152) 6,574
Net insurance claims8 .............. (1,473) (34) (5) – – – (1,512)
Net operating income4 ............. 2,719 1,006 1,176 270 43 (152) 5,062
Loan impairment charges and other credit risk provisions .. (74) (1) (5) – – – (80)
Net operating income .............. 2,645 1,005 1,171 270 43 (152) 4,982
Total operating expenses ......... (750) (246) (474) (109) (238) 152 (1,665)
Operating profit/(loss) .............. 1,895 759 697 161 (195) – 3,317
Share of profit in associates and joint ventures ................ 3 1 – – 9 – 13
Profit/(loss) before tax ............. 1,898 760 697 161 (186) – 3,330 % % % % % % Share of HSBC’s profit
before tax ............................. 13.4 5.4 4.9 1.1 (1.3) 23.5 Cost efficiency ratio ................ 27.6 24.5 40.3 40.4 553.5 32.9 Balance sheet data6 US$m US$m US$m US$m US$m US$mLoans and advances to
customers (net) .................... 39,375 25,105 19,231 4,309 1,898 89,918 Total assets .............................. 62,199 31,043 163,766 12,553 31,120 300,681 Customer accounts ................... 120,638 44,719 26,978 12,340 544 205,219 Loans and advances to
banks (net)12 ......................... 61,850 Trading assets12,13 ..................... 29,224 Financial instruments
designated at fair value12 ..... 691 Financial investments12 ............ 50,099 Deposits by banks12 ................. 9,991 Trading liabilities12,13 ............... 24,045
For footnotes, see page 89.

H S B C H O L D I N G S P L C
Interim Management Report: Business Review (continued)
50
Analysis by customer group and global business (continued)
Profit/(loss) before tax
Half-year to 31 December 2007
Hong Kong
Personal Financial Services US$m
Commercial Banking US$m
Global Banking and Markets US$m
Private Banking US$m
Other US$m
Inter- segment elimination9 US$m
Total US$m
Net interest income/(expense) .. 1,754 814 568 21 (395) 153 2,915
Net fee income ......................... 1,182 276 364 99 2 – 1,923
Trading income excluding net interest income .............. 114 31 251 150 199 – 745
Net interest income on trading activities .................. 3 – 161 – 17 (153) 28
Net trading income7 ................. 117 31 412 150 216 (153) 773 Net income/(expense) from
financial instruments designated at fair value......... 547 23 6 – (110) – 466
Gains less losses from financial investments ........... – – 37 – 25 – 62
Dividend income ...................... 1 1 5 – 7 – 14 Net earned insurance
premiums .............................. 1,288 75 8 – – – 1,371 Other operating income/
(expense) ............................. 56 15 59 (4) 491 (185) 432
Total operating income ............ 4,945 1,235 1,459 266 236 (185) 7,956
Net insurance claims8 .............. (1,643) (48) (5) – – – (1,696)
Net operating income4 ............. 3,302 1,187 1,454 266 236 (185) 6,260
Loan impairment charges and other credit risk provisions .. (101) (27) (23) – – – (151)
Net operating income .............. 3,201 1,160 1,431 266 236 (185) 6,109
Total operating expenses ......... (889) (301) (551) (122) (437) 185 (2,115)
Operating profit/(loss) ............. 2,312 859 880 144 (201) – 3,994
Share of profit in associates and joint ventures ................ 2 – 1 – 12 – 15
Profit/(loss) before tax ............. 2,314 859 881 144 (189) – 4,009 % % % % % % Share of HSBC’s profit
before tax ............................. 23.0 8.5 8.8 1.4 (1.9) 39.9 Cost efficiency ratio ................ 26.9 25.4 37.9 45.9 185.2 33.8 Balance sheet data6 US$m US$m US$m US$m US$m US$m Loans and advances to
customers (net) .................... 38,197 25,890 19,171 4,329 2,051 89,638 Total assets .............................. 72,386 35,366 185,933 14,138 24,868 332,691 Customer accounts ................... 129,159 51,562 37,364 15,649 754 234,488 Loans and advances to
banks (net)12 ......................... 53,725 Trading assets12,13 ..................... 38,369 Financial instruments
designated at fair value12 ..... 546 Financial investments12 ............ 46,765 Deposits by banks12 ................. 6,251 Trading liabilities12,13 ............... 26,804
For footnotes, see page 89.
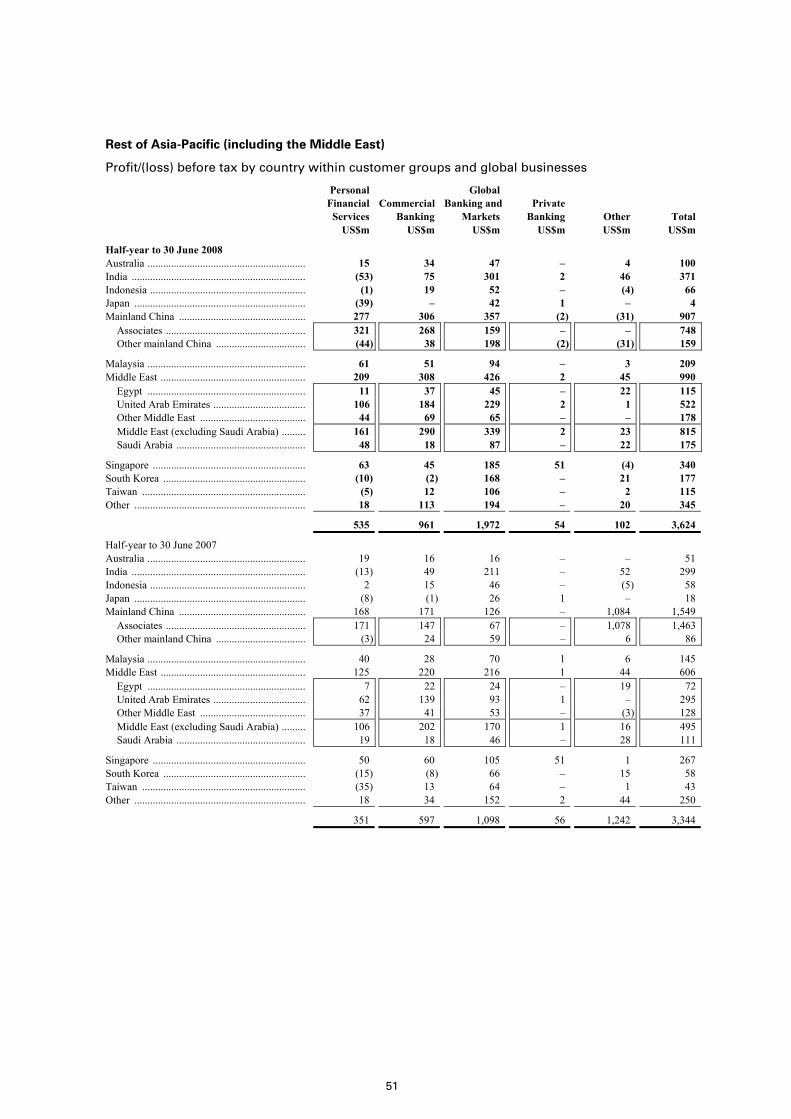
51
Rest of Asia-Pacific (including the Middle East)
Profit/(loss) before tax by country within customer groups and global businesses
Personal Financial Services US$m
Commercial Banking US$m
GlobalBanking and Markets US$m
Private Banking US$m
Other US$m
Total US$m
Half-year to 30 June 2008 Australia ............................................................ 15 34 47 – 4 100 India .................................................................. (53) 75 301 2 46 371 Indonesia ........................................................... (1) 19 52 – (4) 66 Japan ................................................................. (39) – 42 1 – 4 Mainland China ................................................ 277 306 357 (2) (31) 907
Associates ..................................................... 321 268 159 – – 748 Other mainland China .................................. (44) 38 198 (2) (31) 159
Malaysia ............................................................ 61 51 94 – 3 209 Middle East ....................................................... 209 308 426 2 45 990
Egypt ............................................................ 11 37 45 – 22 115 United Arab Emirates ................................... 106 184 229 2 1 522 Other Middle East ........................................ 44 69 65 – – 178 Middle East (excluding Saudi Arabia) ......... 161 290 339 2 23 815 Saudi Arabia ................................................. 48 18 87 – 22 175
Singapore .......................................................... 63 45 185 51 (4) 340 South Korea ...................................................... (10) (2) 168 – 21 177 Taiwan .............................................................. (5) 12 106 – 2 115 Other ................................................................. 18 113 194 – 20 345
535 961 1,972 54 102 3,624
Half-year to 30 June 2007 Australia ............................................................ 19 16 16 – – 51 India .................................................................. (13) 49 211 – 52 299 Indonesia ........................................................... 2 15 46 – (5) 58 Japan ................................................................. (8) (1) 26 1 – 18 Mainland China ................................................ 168 171 126 – 1,084 1,549
Associates ..................................................... 171 147 67 – 1,078 1,463Other mainland China .................................. (3) 24 59 – 6 86
Malaysia ............................................................ 40 28 70 1 6 145 Middle East ....................................................... 125 220 216 1 44 606
Egypt ............................................................ 7 22 24 – 19 72United Arab Emirates ................................... 62 139 93 1 – 295Other Middle East ........................................ 37 41 53 – (3) 128Middle East (excluding Saudi Arabia) ......... 106 202 170 1 16 495 Saudi Arabia ................................................. 19 18 46 – 28 111
Singapore .......................................................... 50 60 105 51 1 267 South Korea ...................................................... (15) (8) 66 – 15 58 Taiwan .............................................................. (35) 13 64 – 1 43 Other ................................................................. 18 34 152 2 44 250
351 597 1,098 56 1,242 3,344

H S B C H O L D I N G S P L C
Interim Management Report: Business Review (continued)
52
Profit/(loss) before tax by country within customer groups and global businesses (continued)
Personal Financial Services US$m
Commercial Banking US$m
Global Banking and Markets US$m
Private Banking US$m
Other US$m
Total US$m
Half-year to 31 December 2007 Australia ............................................................ 22 21 26 – 4 73 India .................................................................. (57) 39 218 (1) 31 230 Indonesia ........................................................... (9) 14 40 – 1 46 Japan ................................................................. (26) (2) 49 (1) 5 25 Mainland China ................................................ 326 226 243 – 17 812
Associates ..................................................... 345 204 153 – 15 717Other mainland China .................................. (19) 22 90 – 2 95
Malaysia ............................................................ 41 62 76 (1) 7 185 Middle East ....................................................... 120 262 279 2 38 701
Egypt ............................................................ 3 24 41 – 13 81United Arab Emirates ................................... 46 123 149 2 2 322Other Middle East ........................................ 46 60 63 – 3 172Middle East (excluding Saudi Arabia) ......... 95 207 253 2 18 575Saudi Arabia ................................................. 25 55 26 – 20 126
Singapore .......................................................... 51 52 135 39 6 283 South Korea ...................................................... (29) (12) 93 – 13 65 Taiwan .............................................................. (17) 14 80 – 3 80 Other ................................................................. (13) 77 127 (2) (24) 165
409 753 1,366 36 101 2,665
Loans and advances to customers (net) by country
At 30 June 2008 US$m
At 30 June 2007 US$m
At 31 December 2007 US$m
Australia ........................................................................................................... 12,664 9,845 11,339 India ................................................................................................................. 7,585 6,216 7,220 Indonesia .......................................................................................................... 1,924 1,296 1,642 Japan ................................................................................................................ 4,710 3,580 4,258 Mainland China ............................................................................................... 12,653 6,787 11,647 Malaysia ........................................................................................................... 9,295 8,003 8,856 Middle East (excluding Saudi Arabia) ............................................................ 25,004 17,047 21,607
Egypt ........................................................................................................... 2,265 1,196 1,853 United Arab Emirates .................................................................................. 16,416 10,928 14,103 Other Middle East ....................................................................................... 6,323 4,923 5,651
Singapore ......................................................................................................... 13,724 10,768 11,505 South Korea ..................................................................................................... 6,581 6,458 7,124 Taiwan ............................................................................................................. 5,330 3,834 3,658 Other ................................................................................................................ 14,287 14,340 12,996
113,757 88,174 101,852

53
Customer accounts by country
At 30 June 2008 US$m
At 30 June 2007 US$m
At 31 December 2007 US$m
Australia ........................................................................................................... 13,864 10,345 11,418 India ................................................................................................................. 11,365 8,827 12,021 Indonesia .......................................................................................................... 2,557 2,082 2,574 Japan ................................................................................................................ 4,728 3,944 4,657 Mainland China ............................................................................................... 18,205 9,229 14,537 Malaysia ........................................................................................................... 12,836 10,629 11,701 Middle East (excluding Saudi Arabia) ............................................................ 36,256 26,277 30,937
Egypt ........................................................................................................... 5,359 3,358 4,056United Arab Emirates .................................................................................. 20,658 15,362 18,455Other Middle East ....................................................................................... 10,239 7,557 8,426
Singapore ......................................................................................................... 32,784 25,885 28,962 South Korea ..................................................................................................... 4,509 4,705 5,760 Taiwan ............................................................................................................. 12,227 9,208 9,426 Other ................................................................................................................ 17,464 16,328 18,240
166,795 127,459 150,233
Economic briefing
Mainland China maintained a robust level of growth during the first half of 2008, although some mild deceleration was evident as the year-on-year rate of GDP growth slowed from 11.3 per cent in the final quarter of 2007 to 10.1 per cent in the second quarter of 2008. This reflected both a slowing of overseas demand for Chinese exports and the effect of unusual weather patterns and natural disaster. Consumer spending continued to advance at a rapid pace with retail spending increasing by 23 per cent over the year to June 2008, reflecting strong income growth and, in part, rising inflationary pressures. The annual rate of consumer price inflation rose to 7.1 per cent in June 2008, mainly due to higher food prices. Intense price pressures led to a further tightening of economic policy during the first half of 2008. The renminbi continued its gradual appreciation against the US dollar, rising at a slightly higher rate than that of recent years.
Japan’s economy, the largest in the region, proved unexpectedly strong during the first quarter of 2008 with GDP rising by 1.3 per cent year-on-year, driven in large part by a rebound in household expenditure and strong external demand. However, most indicators of growth deteriorated during the second quarter of the year. The annual rate of industrial production growth slowed to just 0.2 per cent in June 2008, household expenditure remained subdued and business confidence deteriorated during the second quarter. Inflationary pressures increased during 2008 and the headline rate of consumer price inflation hit a ten-year high of 2.0 per cent in June 2008.
The economies of the Middle East continued to perform strongly during the first half of 2008, although inflationary pressures grew as the year progressed. Sharply higher oil prices once again proved the catalyst for expansion, facilitating continued growth in public and private investment. Consumption rose as employment levels increased and low interest rates supported an ongoing expansion in credit. High oil revenues continued to boost fiscal and current account surpluses throughout the Middle East, supporting in turn increases in the holdings of foreign assets.
Elsewhere in Asia, most economies continued to perform reasonably strongly in the first half of 2008, although growing concerns arising from the inflationary outlook prompted a number of central banks across the region to tighten their policies. The Indian economy proved resilient, helped by the strength of activity within the service sector and a sharp rise in government investment expenditure. A sustained rise in inflation during the first half of 2008 prompted the Reserve Bank of India to tighten policy. Economic activity in Singapore was uneven during the first half of the year, with volatility in certain specific industrial sectors. Overall, high levels of loan demand boosted strong growth during the first quarter before activity slowed. The annual rate of inflation continued to advance, hitting a 26-year high of 7.5 per cent in June 2008. Inflation was also the predominant concern in Vietnam as the annual rate of consumer price inflation doubled to 27 per cent during the first half of 2008, prompting the State Bank of Vietnam to sanction substantial interest rate increases. The external trade position

H S B C H O L D I N G S P L C
Interim Management Report: Business Review (continued)
54
Profit before tax
Half-year to
Rest of Asia-Pacific (including the Middle East)
30 June2008
US$m
30 June 2007
US$m
31 December2007
US$m
Net interest income .......................................................................................... 2,633 1,901 2,242
Net fee income ................................................................................................. 1,338 1,010 1,236
Net trading income .......................................................................................... 1,329 797 846 Net income/(expense) from financial instruments designated at fair value ... (88) 78 33 Gains less losses from financial investments .................................................. 33 26 12 Gains arising from dilution of interests in associates ..................................... – 1,076 5 Dividend income .............................................................................................. 2 4 4 Net earned insurance premiums ...................................................................... 114 109 117 Other operating income ................................................................................... 484 360 438
Total operating income ................................................................................. 5,845 5,361 4,933
Net insurance claims incurred and movement in liabilities to policyholders .......................................................................................... (4) (141) (112)
Net operating income before loan impairment charges and other credit risk provisions ................................................................................ 5,841 5,220 4,821
Loan impairment charges and other credit risk provisions ............................. (369) (308) (308)
Net operating income .................................................................................... 5,472 4,912 4,513
Total operating expenses ................................................................................. (2,784) (2,075) (2,689)
Operating profit ............................................................................................. 2,688 2,837 1,824
Share of profit in associates and joint ventures ............................................... 936 507 841
Profit before tax ............................................................................................. 3,624 3,344 2,665 % % %
Share of HSBC’s profit before tax .................................................................. 35.4 23.6 26.5 Cost efficiency ratio ........................................................................................ 47.7 39.8 55.8 Period-end staff numbers (full-time equivalent) ............................................. 93,747 81,031 88,573 Balance sheet data6 US$m US$m US$m
Loans and advances to customers (net) ........................................................... 113,757 88,174 101,852 Loans and advances to banks (net) .................................................................. 51,739 34,678 39,861 Trading assets, financial instruments designated at fair value, and
financial investments ................................................................................... 68,132 52,189 64,381 Total assets ...................................................................................................... 259,041 201,123 228,112 Deposits by banks ............................................................................................ 20,539 13,709 17,560 Customer accounts ........................................................................................... 166,795 127,459 150,233
For footnotes, see page 89.
deteriorated considerably, raising concerns over the sustainability of the currency. First quarter growth in year-on-year terms remained at about 7 per cent in Malaysia, driven by rising food and energy exports. In Indonesia, further strong growth in the first quarter of the year was driven by robust business investment expenditure. However, rising inflationary pressures eventually led Bank Indonesia into a modest tightening of policy. South Korea’s economy suffered from its position as one of the most energy intensive economies of the region, with both the
outlook for growth and inflation deteriorating during the first half of 2008. Rising food prices proved particularly problematic for the Philippines’ economy, with inflation moving well above the central bank’s targeted range. Export growth in Taiwan was generally resilient in the face of deteriorating conditions overseas, while robust economic performance in Thailand and Pakistan in the first half of 2008 was overshadowed to varying degrees by lingering domestic uncertainty.
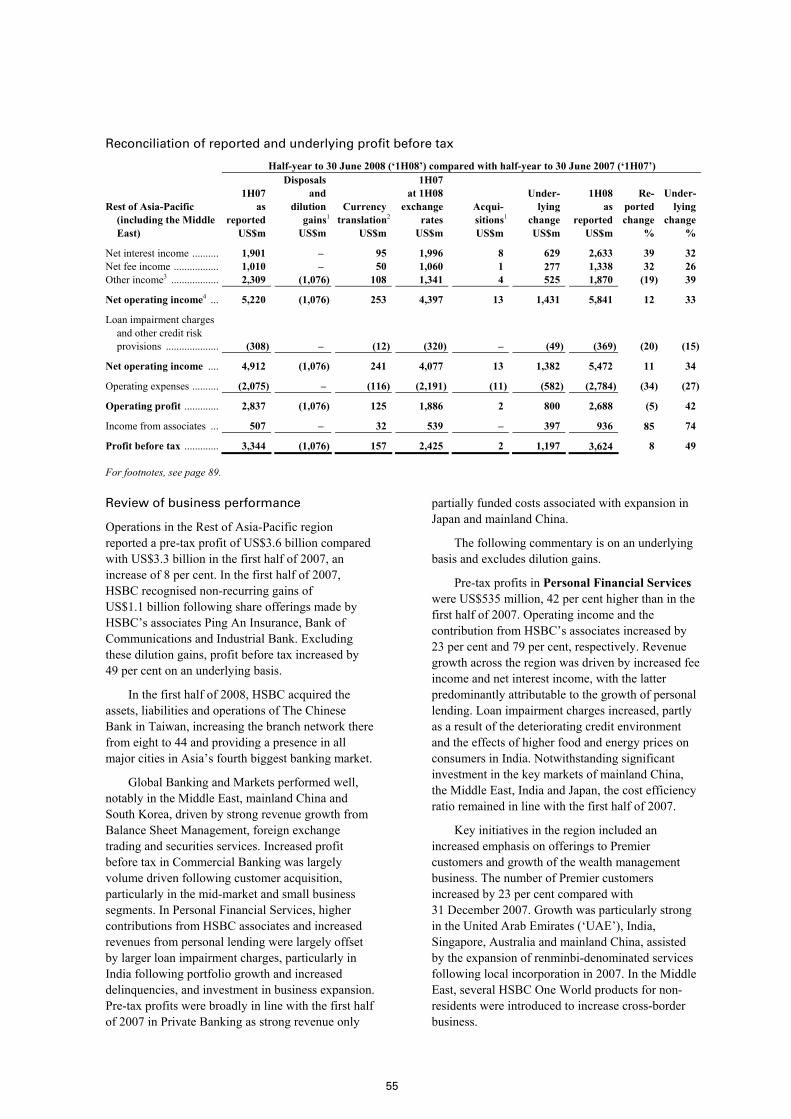
55
Reconciliation of reported and underlying profit before tax
Half-year to 30 June 2008 (‘1H08’) compared with half-year to 30 June 2007 (‘1H07’)
Rest of Asia-Pacific (including the Middle East)
1H07 as reported US$m
Disposals and dilution gains1
US$m
Currency translation2
US$m
1H07 at 1H08 exchange rates US$m
Acqui- sitions1
US$m
Under- lying change US$m
1H08 as reported US$m
Re- ported change %
Under- lying change %
Net interest income .......... 1,901 – 95 1,996 8 629 2,633 39 32 Net fee income ................. 1,010 – 50 1,060 1 277 1,338 32 26 Other income3 .................. 2,309 (1,076) 108 1,341 4 525 1,870 (19) 39
Net operating income4 ... 5,220 (1,076) 253 4,397 13 1,431 5,841 12 33
Loan impairment charges and other credit risk provisions .................... (308) – (12) (320) – (49) (369) (20) (15)
Net operating income .... 4,912 (1,076) 241 4,077 13 1,382 5,472 11 34
Operating expenses .......... (2,075) – (116) (2,191) (11) (582) (2,784) (34) (27)
Operating profit ............. 2,837 (1,076) 125 1,886 2 800 2,688 (5) 42
Income from associates ... 507 – 32 539 – 397 936 85 74
Profit before tax ............. 3,344 (1,076) 157 2,425 2 1,197 3,624 8 49
For footnotes, see page 89.
Review of business performance
Operations in the Rest of Asia-Pacific region reported a pre-tax profit of US$3.6 billion compared with US$3.3 billion in the first half of 2007, an increase of 8 per cent. In the first half of 2007, HSBC recognised non-recurring gains of US$1.1 billion following share offerings made by HSBC’s associates Ping An Insurance, Bank of Communications and Industrial Bank. Excluding these dilution gains, profit before tax increased by 49 per cent on an underlying basis.
In the first half of 2008, HSBC acquired the assets, liabilities and operations of The Chinese Bank in Taiwan, increasing the branch network there from eight to 44 and providing a presence in all major cities in Asia’s fourth biggest banking market.
Global Banking and Markets performed well, notably in the Middle East, mainland China and South Korea, driven by strong revenue growth from Balance Sheet Management, foreign exchange trading and securities services. Increased profit before tax in Commercial Banking was largely volume driven following customer acquisition, particularly in the mid-market and small business segments. In Personal Financial Services, higher contributions from HSBC associates and increased revenues from personal lending were largely offset by larger loan impairment charges, particularly in India following portfolio growth and increased delinquencies, and investment in business expansion. Pre-tax profits were broadly in line with the first half of 2007 in Private Banking as strong revenue only
partially funded costs associated with expansion in Japan and mainland China.
The following commentary is on an underlying basis and excludes dilution gains.
Pre-tax profits in Personal Financial Services were US$535 million, 42 per cent higher than in the first half of 2007. Operating income and the contribution from HSBC’s associates increased by 23 per cent and 79 per cent, respectively. Revenue growth across the region was driven by increased fee income and net interest income, with the latter predominantly attributable to the growth of personal lending. Loan impairment charges increased, partly as a result of the deteriorating credit environment and the effects of higher food and energy prices on consumers in India. Notwithstanding significant investment in the key markets of mainland China, the Middle East, India and Japan, the cost efficiency ratio remained in line with the first half of 2007.
Key initiatives in the region included an increased emphasis on offerings to Premier customers and growth of the wealth management business. The number of Premier customers increased by 23 per cent compared with 31 December 2007. Growth was particularly strong in the United Arab Emirates (‘UAE’), India, Singapore, Australia and mainland China, assisted by the expansion of renminbi-denominated services following local incorporation in 2007. In the Middle East, several HSBC One World products for non-residents were introduced to increase cross-border business.
H S B C H O L D I N G S P L C
Interim Management Report: Business Review (continued)
56
Branches were added during the last 12 months in mainland China, Indonesia, Pakistan, Japan, Sri Lanka and Jordan. Including 32 Hang Seng Bank outlets in Mainland China, the total number of branches in the region was 462, a 24 per cent rise from 30 June 2007. In mainland China, HSBC added 8 new outlets in the period, maintaining its leading position among foreign banks for own-branded branches. Operating expenses rose to support expansion, including more than 1,100 additional staff. HSBC now has over 10,000 frontline staff across the region.
Pre-tax profits rose by 52 per cent in mainland China, with a significant rise in revenues from the locally incorporated bank along with profits from associates which nearly doubled. Net interest income grew strongly, benefiting from substantial volume growth of mortgages and renminbi deposits following branch expansion into the important economic zones of the Pearl River Delta, the Yangtze River Delta and the Bohai Rim. Business expansion was curtailed slightly due to regulatory restrictions on lending growth for banks operating in mainland China, which took effect from the second half of 2007. Fees related to products offered through the Qualified Domestic Institutional Investors (‘QDII’) scheme contributed to a doubling of net fee income.
The Middle East reported profit before tax of US$209 million, an increase of 65 per cent. Revenues rose by 52 per cent, driven by higher net interest income from balance sheet growth and wider spreads in a falling interest rate environment, particularly for personal loans, cards and mortgages. Mortgage balances more than doubled in the UAE, with growth driven by customer demand. Fee income also rose as a result of strong sales of investment and insurance products and higher fees from cards, as both cards in force and cardholder spending increased. New structured products and mutual funds were introduced to match client appetite in the volatile stock market conditions. Trading income rose due to stronger than anticipated foreign exchange income, in part due to higher volatility fuelled by expectations that currencies in the region may be unpegged from the US dollar or revalued.
In Singapore, pre-tax profits grew by 17 per cent, largely attributable to higher net interest income from an increase in deposit balances. Fees rose strongly due to higher sales of investment products and the growth of the credit card business.
In India, a pre-tax loss of US$53 million was recorded, compared with a loss of US$13 million in
the first half of 2007. Investment in the business continued and drove higher asset balances and income growth. Loan impairment charges increased by 181 per cent, driven by volume growth in an adverse credit and collections environment as a result of high interest rates and inflation which inhibited customer repayment capabilities. Operating expenses increased due to higher business volumes and a rise in staff costs combined with a rise in fees paid to collection agencies.
A pre-tax loss in Taiwan was significantly lower than in the first half of 2007, due to reduced loan impairment charges.
Profit before tax in Malaysia rose by 42 per cent following strong revenue growth as a result of higher deposit balances and a rise in card and mortgage balances. In addition, there were gains from the redemption of Visa shares and sale of MasterCard shares. Growth was moderated by reduced consumer interest in investment products and competition in the mortgage sector which resulted in lower spreads.
Net interest income increased by 20 per cent to US$1.2 billion, driven mainly by wider spreads on credit cards and personal lending. Income was substantially higher in the Middle East, India, Indonesia and mainland China. Higher pricing resulted in a widening of asset spreads.
A 14 per cent increase in average deposit balances was largely driven by mainland China and Singapore. The success of Premier was also instrumental in deposit growth in mainland China and India. HSBC Direct balances rose by 58 per cent. Spreads contracted during the period due to falling interest rates.
The mortgage portfolio grew by 9 per cent, excluding New Zealand, where there had been the sale of a mortgage portfolio in the second half of 2007. Growth was recorded in the UAE, Singapore, Australia and mainland China. Mortgage spreads improved, due to lower base rates.
Average card balances increased by 29 per cent, and interest income related to credit cards rose significantly in the Middle East, India and Australia. In the Middle East, credit card balances rose following the success of efforts to increase cardholder spending and the number of cards in circulation. The latter rose by 12 per cent in the first half of 2008 to over 1.3 million. Total cards in issue in the Rest of Asia-Pacific region exceeded 9.3 million. Spreads on credit card lending widened, driven by the Middle East and India, where base rate cuts led to lower funding costs while asset pricing was maintained.
57
In Indonesia and India, lending growth, including personal instalment loans and cards, continued following the expansion of the consumer finance business begun in 2007 which continued in Indonesia with the addition of 24 branches. Spreads in each of these countries improved due to higher lending rates combined with stable base rates.
Net fee income increased by 23 per cent to US$434 million, with growth in cards and the sale of investment products. Credit card fee income increased by 33 per cent, driven by higher balances, cardholder spending and new cards in the Middle East and India. Funds under management continued to grow, reaching US$13.1 billion. Sales of investment products increased despite stock market volatility, as customers increasingly chose structured products over market-led unit trusts. HSBC increased fees from the sale of insurance products by 41 per cent as a result of new product launches, including credit enhancement insurance.
Declines in global equity markets resulted in lower net claims, however this was offset by a corresponding net loss on investments held by the insurance business.
Loan impairment charges rose by 43 per cent, driven by higher charges in India, the Middle East and, to a lesser extent, Australia. The main contributing factors in India were volume growth, seasoning of the personal lending portfolio, higher delinquency on credit cards and personal loans and a challenging collections environment. In the Middle East, volume growth of the credit card portfolio led to a rise in delinquency, notably in the UAE. Loan impairment charges increased by 83 per cent in Australia due to increased delinquencies on cards.
In Taiwan, loan impairment charges decreased by 67 per cent, due to an improvement in asset quality and increased collection efforts in the high risk segments.
HSBC continued to invest substantially in the region, particularly in India and mainland China. The number of staff increased in key markets including mainland China and the Middle East. Further branches in mainland China led to the hiring of over 800 additional staff. Deteriorating credit performance and increased loan delinquencies in the consumer finance business drove a rise in fees paid to collection agencies in India and Indonesia. In Japan, operating expenses increased, primarily due to the launch of Premier and branch expansion. Cost increases were controlled in part by customer use of low-cost channels. In the UAE, the number of e-Saver accounts increased by 204 per cent, along with a 96 per cent rise in internet transactions.
Income from associates rose substantially and was 79 per cent higher than in the first half of 2007. HSBC’s associate, Ping An Insurance, continued to be successful in increasing life insurance premiums, which, combined with an increase to long-term yield assumptions led to increased embedded value. In addition, contributions from Bank of Communications and The Saudi British Bank rose by 95 per cent and 146 per cent, respectively. The increase in the latter was primarily attributable to strong asset growth and limited loan impairment charges. The Saudi British Bank also launched three Premier centres.
Commercial Banking reported a pre-tax profit of US$961 million, 52 per cent higher than in the first half of 2007. Growth was largely attributable to mid-market and small business customer acquisition, and increased associates’ income from the Bank of Communications and Industrial Bank in mainland China. Revenue growth across the region was largely volume driven and the credit environment remained relatively benign. Asian intra-regional trade and investment flows continued to strengthen, mitigating the effects of the global economic slowdown. Notwithstanding the expansion of the network to ‘second tier’ cities in India, Taiwan and mainland China and an increase in staff numbers, the cost efficiency ratio remained broadly in line with the first half of 2007.
In the Middle East, profit before tax rose by 41 per cent, as buoyant economic conditions across the region contributed to notable customer and revenue growth. Additional staff were recruited to increase sales of trade services and actively manage relationships with customers of trade and supply-chain products.
In mainland China, operating profit grew by 46 per cent as HSBC continued to strengthen the local distribution network, adding a further branch in the first half of 2008 to supplement volume growth in deposits. The Greater China regional model continued to show strong results, demonstrated by a 163 per cent growth in the number of referrals from mainland China through Global Links, the cross-border referral system. Though hindered by restrictions on local currency lending imposed by the People’s Bank of China, HSBC continued to grow revenues by repricing assets and fee-based business.
Profit before tax in Singapore declined by 32 per cent, largely due to reduced net interest income as lower interest rates resulted in compressed margins on current accounts. This was partially offset by an increased focus on income generation
H S B C H O L D I N G S P L C
Interim Management Report: Business Review (continued)
58
from fund and ancillary services, augmented by net recoveries of loan impairment charges.
In India, profit before tax rose by 47 per cent to US$75 million. Strong revenue growth in the country was driven by increased customer acquisition, particularly in ‘second tier’ cities. This growth was supplemented by stronger bilateral business flows with Mauritius and higher deposit balances.
In Malaysia, profit before tax increased by 68 per cent, as loan impairment charges improved in comparison with the first half of 2007. Revenues increased by 12 per cent, due to growth in deposit and asset balances which more than offset the effect of narrower spreads for foreign currency deposits.
Profit before tax in Australia increased by 86 per cent. Revenue growth was broad-based with interest income growth of 36 per cent attributable to increased deposit balances.
HSBC further enhanced its cross-border business capabilities with the opening of a new International Banking Centre in Japan, taking coverage to 27 countries and territories in the region. Successful referral volumes originating within the Asia-Pacific region from Global Links, the cross-border referral system, more than doubled compared with the first half of 2007.
Net interest income increased by 25 per cent, due largely to growth in deposit volumes from enhanced focus on generating both local and foreign currency balances. Lower interest rates contributed to the contraction of liability and asset spreads, and to lower earnings from free funds.
Lending volumes rose by 22 per cent, particularly in India and the Middle East. In India, growth was spurred by an increase in customer numbers across all segments and product groups, along with higher spreads on customer advances. Receivables finance also reported increased income in India. Favourable economic conditions in the Middle East contributed to increased lending volumes, and spreads increased on corporate lending products, as pricing resulted in higher yields. Branch expansion in mainland China succeeded in increasing customer numbers by 29 per cent and driving lending growth.
Average deposit balances increased by 16 per cent, notwithstanding lower margins. In India, deposit volumes benefited from increased customer numbers. Customer numbers also rose in the Middle East and, with HSBC’s focus on payments and cash management, contributed to a 37 per cent rise in deposit balances. Lower interest rates caused spreads
on deposits to reduce in India, the Middle East and mainland China.
Net fee income rose by 37 per cent to US$290 million, predominantly driven by growth in fees from trade services products, notably in the Middle East and mainland China.
Trade-related lending fees rose by 36 per cent, largely in the Middle East as international and trading activity in the region remained strong, but also in India, Malaysia, South Korea and Australia. In the Middle East, volume growth was enhanced by inflation-induced increases in commodity prices, notably on materials vital to the booming construction industry. HSBC’s distribution capabilities in the region also contributed to growth. HSBC’s positioning in Dubai, a key trading market and international hub, resulted in over 65 per cent growth in import and export trading volumes in the UAE, along with similar growth in fees from trade and supply chain activities. In mainland China, growth in forfaiting led to a 32 per cent increase in trade-related fees. Customer acquisition in India drove significant volume increases in fees from trade services and payments and cash management.
Trading income grew by 70 per cent, mainly due to growth in volumes of transactions in the Middle East and in India, attributable to increased volatility in the foreign exchange markets. Within the Middle East, higher trading income also reflected growth in the total value of transactions due to the effects of inflation and increased remittances.
Loan impairment recoveries of US$16 million were largely due to the non-recurrence of downgrades to certain customers in Thailand and Malaysia. In addition benign credit conditions continued in the Middle East with net releases more than doubling.
Total operating expenses rose by 33 per cent, driven by rising staff costs across the majority of the region. Investment was undertaken to expand HSBC’s presence, notably in mainland China. Customer facing staff numbers increased across the region by 30 per cent to support business expansion. In the Middle East, increased staff numbers, wage inflation driven by competitive labour market conditions and higher performance related pay as a consequence of improved profits caused a 30 per cent rise in staff costs. Cost growth in India was principally due to geographical expansion into second tier cities and growth in the number of relationship managers.
The percentage of total transactions completed using lower-cost channels increased compared with

59
the first half of 2007. Over 3.5 million transactions were completed using these channels and the number of customers registered for business internet banking rose by 43 per cent.
HSBC’s associate, Bank of Communications, increased its contribution by 67 per cent, driving a 63 per cent increase in income from associates. Bank of Communications continued to expand its operations in mainland China. The contribution from Industrial Bank also increased compared with the first half of 2007 due to growth and rising margins.
Global Banking and Markets profit before tax rose by 71 per cent to US$2.0 billion, with growth in all major countries, with notable improvements in the Middle East, South Korea, mainland China and India.
In the Middle East, pre-tax profit doubled due to a combination of strong growth in foreign exchange trading and a robust contribution from Global Banking and Balance Sheet Management. Securities services profit also grew, reflecting the importance of the region for the securities services strategy. Global Banking increased lending, taking advantage of strong economic growth in the region and wider spreads. Balance Sheet Management profit was higher due to a lower cost of funds as local central banks reduced interest rates in line with the US.
In India, higher pre-tax profit was attributable to foreign exchange trading and securities services. Foreign exchange profits were driven by high customer demand and market volatility. The increased securities services profit was due to growth in deposit account balances and in the derivatives clearing business.
Pre-tax profit in mainland China rose substantially, driven by Balance Sheet Management, which earned higher revenues due to an increase in surplus funds as the People’s Bank of China restricted lending, combined with a steepening yield curve. Rates and foreign exchange trading also performed strongly, as did income from associates as Ping An Insurance and Bank of Communications expanded. Ping An Insurance continued to grow its asset management business, while Bank of Communications earned increased fees for asset custody and advisory work.
Balance Sheet Management was the main reason for increased profits in Singapore, benefiting from the reduction in short-term US and Singapore dollar interest rates.
In South Korea, pre-tax profits grew as Rates performed strongly, driven by increased client
demand for hedging products linked to financing activity.
In Malaysia, Rates and foreign exchange were the main contributors to profit growth. Significant client activity was driven by market volatility as inflationary expectations triggered a sharp upward move in interest rates, leading clients to demand products which protected them from interest and exchange rate risks.
The region’s total operating income grew by 55 per cent to US$2.4 billion. Foreign exchange trading delivered strong revenues throughout the region. During the first half of 2008 there was significant volatility in the foreign exchange markets contributing to increased trading and strong customer demand for foreign exchange products, while HSBC’s broad distribution network helped to attract clients. Balance Sheet Management benefited in most countries from the steepening of the yield curve as central banks responded to the credit market turmoil.
Net interest income increased by 58 per cent due to the strong performance of Balance Sheet Management, described above, and also growth in the Middle East as average customer lending rose by more than 40 per cent due to overall investment in infrastructure and business expansion in the region, and widening spreads.
Net fee income grew by 29 per cent, driven by the ongoing strength of the securities services and payments and cash management businesses. Transaction volumes and growing client balances drove the increase in payments and cash management. In securities services, higher client trading volumes increased the level of transactions which led to higher fees in the custody and clearing business. Global Asset Management also reported an increase in fees, as funds under management benefited from inflows of new funds and new product launches, despite declining local stock markets.
Trading income rose significantly, driven by foreign exchange products, as noted above. Foreign exchange trading income increased by 68 per cent, continuing its strong upward momentum. Rates trading in South Korea also contributed, in response to increased client activity in local rates markets and hedging relating to financing activity.
Gains less losses from financial investments were lower due to the non-recurrence of significant disposals in 2007 in the Philippines.
The corporate credit environment remained benign, with a very low loan impairment charge.
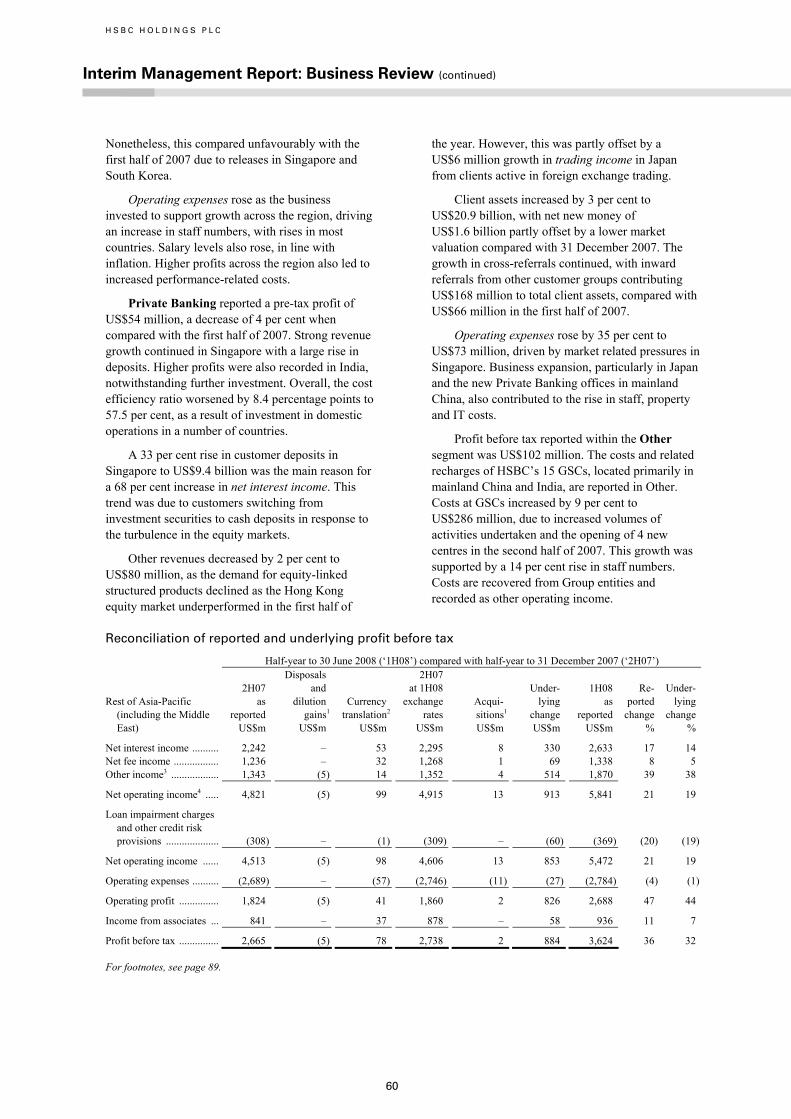
H S B C H O L D I N G S P L C
Interim Management Report: Business Review (continued)
60
Nonetheless, this compared unfavourably with the first half of 2007 due to releases in Singapore and South Korea.
Operating expenses rose as the business invested to support growth across the region, driving an increase in staff numbers, with rises in most countries. Salary levels also rose, in line with inflation. Higher profits across the region also led to increased performance-related costs.
Private Banking reported a pre-tax profit of US$54 million, a decrease of 4 per cent when compared with the first half of 2007. Strong revenue growth continued in Singapore with a large rise in deposits. Higher profits were also recorded in India, notwithstanding further investment. Overall, the cost efficiency ratio worsened by 8.4 percentage points to 57.5 per cent, as a result of investment in domestic operations in a number of countries.
A 33 per cent rise in customer deposits in Singapore to US$9.4 billion was the main reason for a 68 per cent increase in net interest income. This trend was due to customers switching from investment securities to cash deposits in response to the turbulence in the equity markets.
Other revenues decreased by 2 per cent to US$80 million, as the demand for equity-linked structured products declined as the Hong Kong equity market underperformed in the first half of
the year. However, this was partly offset by a US$6 million growth in trading income in Japan from clients active in foreign exchange trading.
Client assets increased by 3 per cent to US$20.9 billion, with net new money of US$1.6 billion partly offset by a lower market valuation compared with 31 December 2007. The growth in cross-referrals continued, with inward referrals from other customer groups contributing US$168 million to total client assets, compared with US$66 million in the first half of 2007.
Operating expenses rose by 35 per cent to US$73 million, driven by market related pressures in Singapore. Business expansion, particularly in Japan and the new Private Banking offices in mainland China, also contributed to the rise in staff, property and IT costs.
Profit before tax reported within the Other segment was US$102 million. The costs and related recharges of HSBC’s 15 GSCs, located primarily in mainland China and India, are reported in Other. Costs at GSCs increased by 9 per cent to US$286 million, due to increased volumes of activities undertaken and the opening of 4 new centres in the second half of 2007. This growth was supported by a 14 per cent rise in staff numbers. Costs are recovered from Group entities and recorded as other operating income.
Reconciliation of reported and underlying profit before tax
Half-year to 30 June 2008 (‘1H08’) compared with half-year to 31 December 2007 (‘2H07’)
Rest of Asia-Pacific (including the Middle East)
2H07 as reported US$m
Disposals and dilution gains1
US$m
Currency translation2
US$m
2H07 at 1H08 exchange rates US$m
Acqui- sitions1
US$m
Under- lying change US$m
1H08 as reported US$m
Re- ported change %
Under- lying change %
Net interest income .......... 2,242 – 53 2,295 8 330 2,633 17 14 Net fee income ................. 1,236 – 32 1,268 1 69 1,338 8 5 Other income3 .................. 1,343 (5) 14 1,352 4 514 1,870 39 38
Net operating income4 ..... 4,821 (5) 99 4,915 13 913 5,841 21 19
Loan impairment charges and other credit risk provisions .................... (308) – (1) (309) – (60) (369) (20) (19)
Net operating income ...... 4,513 (5) 98 4,606 13 853 5,472 21 19
Operating expenses .......... (2,689) – (57) (2,746) (11) (27) (2,784) (4) (1)
Operating profit ............... 1,824 (5) 41 1,860 2 826 2,688 47 44
Income from associates ... 841 – 37 878 – 58 936 11 7
Profit before tax ............... 2,665 (5) 78 2,738 2 884 3,624 36 32
For footnotes, see page 89.
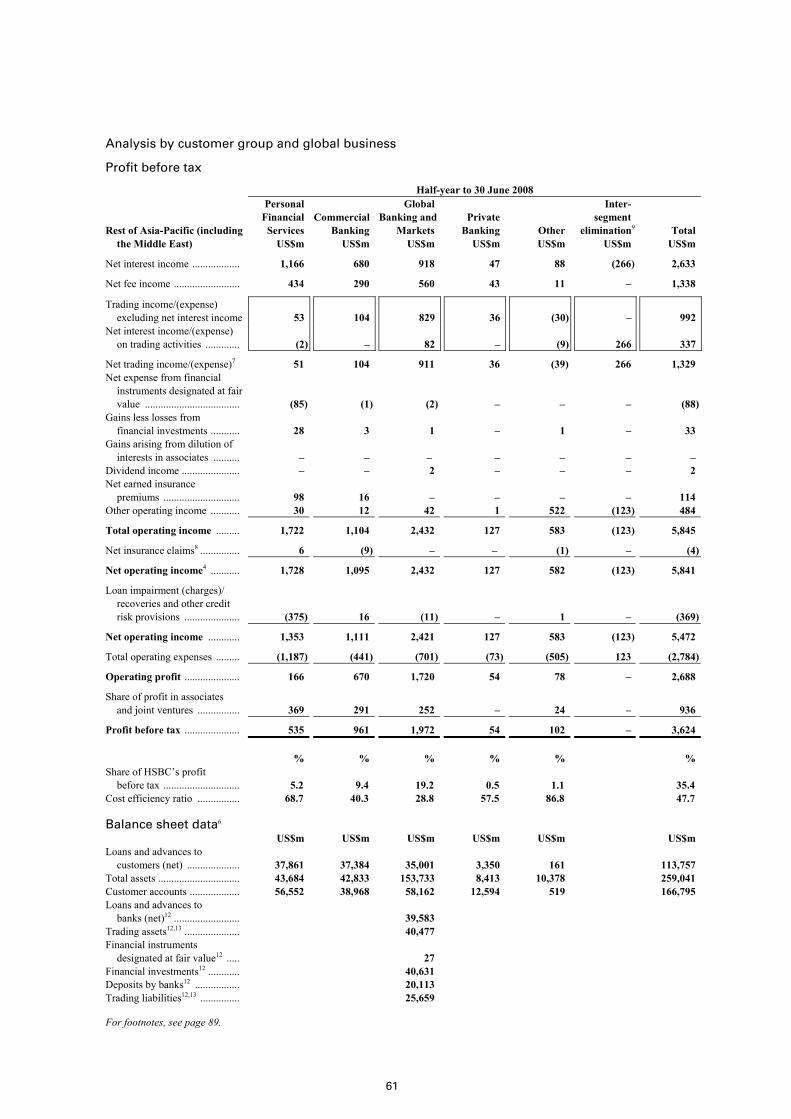
61
Analysis by customer group and global business
Profit before tax
Half-year to 30 June 2008 Rest of Asia-Pacific (including
the Middle East)
Personal Financial Services US$m
Commercial Banking US$m
GlobalBanking and Markets US$m
Private Banking US$m
Other US$m
Inter- segment elimination9 US$m
Total US$m
Net interest income .................. 1,166 680 918 47 88 (266) 2,633
Net fee income ......................... 434 290 560 43 11 – 1,338
Trading income/(expense) excluding net interest income 53 104 829 36 (30) – 992
Net interest income/(expense) on trading activities ............. (2) – 82 – (9) 266 337
Net trading income/(expense)7 51 104 911 36 (39) 266 1,329 Net expense from financial
instruments designated at fair value .................................... (85) (1) (2) – – – (88)
Gains less losses from financial investments ........... 28 3 1 – 1 – 33
Gains arising from dilution of interests in associates .......... – – – – – – –
Dividend income ...................... – – 2 – – – 2 Net earned insurance
premiums ............................. 98 16 – – – – 114 Other operating income ........... 30 12 42 1 522 (123) 484
Total operating income ......... 1,722 1,104 2,432 127 583 (123) 5,845
Net insurance claims8 ............... 6 (9) – – (1) – (4)
Net operating income4 ........... 1,728 1,095 2,432 127 582 (123) 5,841
Loan impairment (charges)/ recoveries and other credit risk provisions ..................... (375) 16 (11) – 1 – (369)
Net operating income ............ 1,353 1,111 2,421 127 583 (123) 5,472
Total operating expenses ......... (1,187) (441) (701) (73) (505) 123 (2,784)
Operating profit ..................... 166 670 1,720 54 78 – 2,688
Share of profit in associates and joint ventures ................ 369 291 252 – 24 – 936
Profit before tax ..................... 535 961 1,972 54 102 – 3,624 % % % % % % Share of HSBC’s profit
before tax ............................. 5.2 9.4 19.2 0.5 1.1 35.4 Cost efficiency ratio ................ 68.7 40.3 28.8 57.5 86.8 47.7 Balance sheet data6 US$m US$m US$m US$m US$m US$m Loans and advances to
customers (net) .................... 37,861 37,384 35,001 3,350 161 113,757 Total assets ............................... 43,684 42,833 153,733 8,413 10,378 259,041 Customer accounts ................... 56,552 38,968 58,162 12,594 519 166,795 Loans and advances to
banks (net)12 ......................... 39,583 Trading assets12,13 ..................... 40,477 Financial instruments
designated at fair value12 ..... 27 Financial investments12 ............ 40,631 Deposits by banks12 ................. 20,113 Trading liabilities12,13 ............... 25,659
For footnotes, see page 89.

H S B C H O L D I N G S P L C
Interim Management Report: Business Review (continued)
62
Analysis by customer group and global business (continued)
Profit before tax
Half-year to 30 June 2007 Rest of Asia-Pacific (including
the Middle East)
Personal Financial Services US$m
Commercial Banking US$m
Global Banking and Markets US$m
Private Banking US$m
Other US$m
Inter- segment elimination9 US$m
Total US$m
Net interest income .................. 914 517 551 28 66 (175) 1,901
Net fee income ......................... 336 202 409 52 11 – 1,010
Trading income excluding net interest income .................... 34 58 475 35 4 – 606
Net interest income/(expense) on trading activities ............. (1) – 14 – 3 175 191
Net trading income7 ................. 33 58 489 35 7 175 797 Net income from financial
instruments designated at fair value .......................... 55 3 5 – 15 – 78
Gains less losses from financial investments ........... 2 4 19 – 1 – 26
Gains arising from dilution of interests in associates .......... – – – – 1,076 – 1,076
Dividend income ...................... – – 1 – 3 – 4 Net earned insurance
premiums ............................. 100 9 – – – – 109 Other operating income/
(expense) ............................. 20 8 20 (6) 387 (69) 360
Total operating income ............ 1,460 801 1,494 109 1,566 (69) 5,361
Net insurance claims8 ............... (137) (4) – – – – (141)
Net operating income4 ............. 1,323 797 1,494 109 1,566 (69) 5,220
Loan impairment charges and other credit risk provisions .. (252) (54) (2) – – – (308)
Net operating income .............. 1,071 743 1,492 109 1,566 (69) 4,912
Total operating expenses ......... (911) (313) (510) (53) (357) 69 (2,075)
Operating profit ........................ 160 430 982 56 1,209 – 2,837
Share of profit in associates and joint ventures ................ 191 167 116 – 33 – 507
Profit before tax ....................... 351 597 1,098 56 1,242 – 3,344 % % % % % % Share of HSBC’s profit
before tax ............................. 2.5 4.2 7.8 0.4 8.8 23.6 Cost efficiency ratio ................ 68.9 39.3 34.1 48.6 22.8 39.8 Balance sheet data6 US$m US$m US$m US$m US$m US$m Loans and advances to
customers (net) .................... 31,768 25,996 27,575 2,716 119 88,174 Total assets ............................... 38,544 31,553 116,396 6,791 7,839 201,123 Customer accounts ................... 44,686 28,803 44,126 9,092 752 127,459 Loans and advances to
banks (net)12 ......................... 28,663 Trading assets12,13 ..................... 27,699 Financial instruments
designated at fair value12 ..... 979 Financial investments12 ............ 27,269 Deposits by banks12 ................. 12,860 Trading liabilities12,13 ............... 16,810
For footnotes, see page 89.

63
Profit before tax
Half-year to 31 December 2007 Rest of Asia-Pacific (including
the Middle East)
Personal Financial Services US$m
Commercial Banking US$m
Global Banking and Markets US$m
Private Banking US$m
Other US$m
Inter- segment elimination9 US$m
Total US$m
Net interest income .................. 1,051 614 744 32 87 (286) 2,242
Net fee income ......................... 430 227 543 33 3 – 1,236
Trading income/(expense) excluding net interest income ................................. 38 71 525 36 (74) – 596
Net interest income/(expense) on trading activities ............. (1) – (36) – 1 286 250
Net trading income/(expense)7 37 71 489 36 (73) 286 846 Net income/(expense) from
financial instruments designated at fair value......... 18 1 (8) (1) 23 – 33
Gains less losses from financial investments ........... 3 – 9 – – – 12
Gains arising from dilution of interests in associates .......... – – – – 5 – 5
Dividend income ...................... – – 1 – 3 – 4 Net earned insurance
premiums ............................. 109 7 – – 1 – 117 Other operating income ........... 20 7 33 8 462 (92) 438
Total operating income ............ 1,668 927 1,811 108 511 (92) 4,933
Net insurance claims8 .............. (109) (3) – – – – (112)
Net operating income4 ............. 1,559 924 1,811 108 511 (92) 4,821
Loan impairment charges and other credit risk provisions .. (300) (7) (1) – – – (308)
Net operating income .............. 1,259 917 1,810 108 511 (92) 4,513
Total operating expenses ......... (1,220) (426) (630) (72) (433) 92 (2,689)
Operating profit ....................... 39 491 1,180 36 78 – 1,824
Share of profit in associates and joint ventures ................ 370 262 186 – 23 – 841
Profit before tax ....................... 409 753 1,366 36 101 – 2,665 % % % % % % Share of HSBC’s profit
before tax ............................. 4.1 7.5 13.6 0.4 1.0 26.5 Cost efficiency ratio ................ 78.3 46.1 34.8 66.7 84.7 55.8 Balance sheet data6 US$m US$m US$m US$m US$m US$m Loans and advances to
customers (net) .................... 34,486 32,159 32,106 2,955 146 101,852 Total assets ............................... 40,092 37,215 133,814 7,561 9,430 228,112 Customer accounts ................... 49,703 34,891 54,120 11,116 403 150,233 Loans and advances to
banks (net)12 ......................... 30,853 Trading assets12,13 ..................... 29,966 Financial instruments
designated at fair value12 ..... 43 Financial investments12 ............ 39,448 Deposits by banks12 ................. 17,174 Trading liabilities12,13 ............... 18,257
For footnotes, see page 89.

H S B C H O L D I N G S P L C
Interim Management Report: Business Review (continued)
64
North America
Profit/(loss) before tax by country within customer groups and global businesses
Personal Financial Services US$m
Commercial Banking US$m
GlobalBanking and Markets US$m
Private Banking US$m
Other US$m
Total US$m
Half-year to 30 June 2008 US ..................................................................... (2,194) 167 (1,779) 48 277 (3,481)Canada .............................................................. 127 237 119 4 7 494 Bermuda ............................................................ 17 26 35 6 10 94
(2,050) 430 (1,625) 58 294 (2,893) Half-year to 30 June 2007 US ..................................................................... 1,336 215 292 50 (44) 1,849 Canada .............................................................. 145 222 120 4 2 493 Bermuda ............................................................ 7 40 24 6 16 93 1,488 477 436 60 (26) 2,435 Half-year to 31 December 2007 US ..................................................................... (3,160) 162 (1,535) 106 1,512 (2,915)Canada .............................................................. 120 244 119 4 3 490 Bermuda ............................................................ 6 37 15 4 18 80 Other ................................................................. – – – – 1 1
(3,034) 443 (1,401) 114 1,534 (2,344)
Loans and advances to customers (net) by country
At 30 June 2008 US$m
At 30 June 2007
US$m
At 31 December 2007 US$m
US .................................................................................................................... 215,909 233,592 233,706 Canada ............................................................................................................. 54,346 45,510 53,891 Bermuda ........................................................................................................... 2,235 2,193 2,263
272,490 281,295 289,860
Customer accounts by country
At 30 June 2008 US$m
At 30 June 2007 US$m
At 31 December 2007 US$m
US .................................................................................................................... 95,763 93,325 100,034 Canada ............................................................................................................. 38,367 32,744 37,061 Bermuda ........................................................................................................... 7,870 8,328 8,078
142,000 134,397 145,173

65
Profit/(loss) before tax
Half-year to 30 June
2008 30 June
2007 31 December
2007 North America US$m US$m US$m
Net interest income .......................................................................................... 7,873 7,307 7,540
Net fee income ................................................................................................. 2,822 2,904 2,906
Net trading income/(expense) ......................................................................... (1,816) 622 (1,164)Net income from financial instruments designated at fair value .................... 368 81 1,669 Gains less losses from financial investments .................................................. 106 53 192 Dividend income .............................................................................................. 40 64 41 Net earned insurance premiums ...................................................................... 203 231 218 Other operating income ................................................................................... 115 342 18
Total operating income ................................................................................. 9,711 11,604 11,420
Net insurance claims incurred and movement in liabilities to policyholders ........................................................................................... (112) (124) (117)
Net operating income before loan impairment charges and other credit risk provisions ................................................................................. 9,599 11,480 11,303
Loan impairment charges and other credit risk provisions ............................. (7,166) (3,820) (8,336)
Net operating income .................................................................................... 2,433 7,660 2,967
Total operating expenses ................................................................................. (5,334) (5,235) (5,321)
Operating profit/(loss) ................................................................................... (2,901) 2,425 (2,354)
Share of profit in associates and joint ventures ............................................... 8 10 10
Profit/(loss) before tax ................................................................................... (2,893) 2,435 (2,344) % % % Share of HSBC’s profit before tax .................................................................. (28.2) 17.2 (23.3)Cost efficiency ratio ........................................................................................ 55.6 45.6 47.1
Period-end staff numbers (full-time equivalent) ............................................. 48,069 56,693 52,722 Balance sheet data6 US$m US$m US$m
Loans and advances to customers (net) ........................................................... 272,490 281,295 289,860 Loans and advances to banks (net) .................................................................. 19,794 18,643 16,566 Trading assets, financial instruments designated at fair value, and
financial investments16 ................................................................................ 133,262 149,004 133,998 Total assets ...................................................................................................... 531,607 519,693 510,092 Deposits by banks ............................................................................................ 11,764 13,043 16,618 Customer accounts ........................................................................................... 142,000 134,397 145,173
For footnotes, see page 89.
Economic briefing
In the US, GDP growth was subdued during the early months of 2008, but appeared to develop some momentum in the second quarter in response to fiscal loosening. Housing activity again proved weak, with certain measures of house prices showing large declines in a number of regions, although tentative signs emerged of stability in housing sales, albeit at subdued levels. The rise in mortgage delinquencies remained of primary concern. Employment conditions weakened throughout the first half of 2008, with the unemployment rate rising from 5.0 per cent in December 2007 to 5.5 per cent in June 2008. Concerns over the labour market
appeared to influence consumer confidence although, for the most part, consumer spending proved resilient. Consumer price inflation remained high throughout the first half of 2008, standing at 5.0 per cent in June 2008. This was largely due to rising energy prices; excluding food and energy, consumer price inflation averaged 2.4 per cent during the period. The Federal Reserve lowered short-term interest rates by 225 basis points to 2 per cent in the first half of 2008, in an attempt to mitigate the worst effects of the sub-prime related credit squeeze on financial markets and economic activity. Declines in the second quarter of 2008 left Standard & Poor’s S&P500 stock market index about 13 per cent below its level at the end of 2007.

H S B C H O L D I N G S P L C
Interim Management Report: Business Review (continued)
66
Canadian GDP increased by just 1.2 per cent during the first five months of 2008 compared with the equivalent period in 2007, despite robust growth in consumer and government expenditure. Labour market conditions suffered a slight deterioration, although the unemployment rate of 6.2 per cent in June 2008 was only marginally above the historical low of 5.8 per cent recorded in October 2007. The
headline rate of consumer price inflation fluctuated at around 2 per cent during the first half of 2008 before moving to a level of 3.1 per cent, year-on-year, in June, while the level of core inflation held below the 1.5 per cent mark. The Bank of Canada cut its overnight interest rate from 4.25 per cent at the end of 2007 to 3 per cent in April 2008.
Reconciliation of reported and underlying profit before tax
Half-year to 30 June 2008 (‘1H08’) compared with half-year to 30 June 2007 (‘1H07’)
North America
1H07 as reported US$m
Disposals and dilution gains1
US$m
Currency translation2
US$m
1H07 at 1H08 exchange rates US$m
Acqui- sitions1
US$m
Under- lying change US$m
1H08 as reported US$m
Re- ported change %
Under- lying change %
Net interest income .......... 7,307 – 70 7,377 – 496 7,873 8 7 Net fee income ................. 2,904 (52) 26 2,878 – (56) 2,822 (3) (2)Other income/(expense)3 . 1,269 – 7 1,276 – (2,372) (1,096) (186) (186)
Net operating income4 ... 11,480 (52) 103 11,531 – (1,932) 9,599 (16) (17)
Loan impairment charges and other credit risk provisions .................... (3,820) – (3) (3,823) – (3,343) (7,166) (88) (87)
Net operating income .... 7,660 (52) 100 7,708 – (5,275) 2,433 (68) (68)
Operating expenses .......... (5,235) 50 (52) (5,237) – (97) (5,334) (2) (2)
Operating profit/(loss) ... 2,425 (2) 48 2,471 – (5,372) (2,901) (220) (217)
Income from associates ... 10 – – 10 – (2) 8 (20) (20)
Profit/(loss) before tax ... 2,435 (2) 48 2,481 – (5,374) (2,893) (219) (217)
For footnotes, see page 89.
Review of business performance
HSBC’s North America operations reported a pre-tax loss of US$2.9 billion in the first half of 2008, compared with a pre-tax profit of US$2.4 billion in the first half of 2007, a decline of 219 per cent, and 217 per cent on an underlying basis. The pre-tax loss was US$549 million more than in the second half of 2007.
The US economy was weak in the first half of 2008, with unemployment rising despite resilience in some sectors. It is now generally believed that the deterioration in the housing market will be deeper and longer in terms of its effect on housing prices, and that it will extend into 2009. Credit quality continued to deteriorate in much of the US loan book, including some increase in impairment in prime mortgage lending at the US retail bank, which is HSBC Bank USA, excluding its consumer finance operations. The US economy continued to weaken and credit conditions deteriorated in the first half of 2008. As a result, US$527 million of goodwill carried by North America Personal Financial Services was impaired. For further information see Note 20 to the Financial Statements. Loan
impairment charges rose by 88 per cent and the Personal Financial Services business recorded a pre-tax loss of US$2.1 billion. Profit before tax in Canada was broadly in line with the first half of 2007 at US$494 million, as the economy remained relatively strong.
The turmoil in the global credit markets persisted into 2008 and became more pronounced, leading to a loss before tax of US$1.6 billion in Global Banking and Markets. Further write-downs in credit trading positions, structured credit derivatives, leveraged and acquisition finance loans, and exposures to monoline insurers were only partly offset by strong performances in foreign exchange, equities, rates, metals trading, and payments and cash management. Commercial Banking profits declined by 10 per cent, as revenues fell due to tighter deposit spreads despite strong growth in balances, while loan impairment charges increased from the low levels of 2007. Pre-tax profits in Private Banking declined, as lower fee income more than offset the reduction in operating expenses driven by lower staff costs. Profit before tax in Bermuda was in line with the first half of 2007.
67
The following commentary is on an underlying basis.
Personal Financial Services reported a pre-tax loss of US$2.1 billion, a decline of US$3.5 billion from the first half of 2007.
Deteriorating economic conditions led to a significant rise in loan impairment charges as credit quality worsened. This more than offset the reduction in operating costs delivered by management actions in the consumer finance business such as closing branches, reduced marketing, discontinuing certain Taxpayer Financial Services products and relationships, restricting vehicle finance business and further tightening underwriting criteria across the loan portfolio. Impairment of goodwill was the primary driver of the 3 per cent rise in operating expenses. HSBC acted to mitigate the effect of the housing market decline on customers, with more loans modified and loan modification periods extended.
In the US, pre-tax losses in the first half of 2008 of US$2.2 billion compared with a US$1.3 billion profit in the same period in 2007. Losses were driven by increased loan impairment charges, as credit quality declined due to a combination of falling house prices, rising unemployment, higher fuel and food costs and tighter credit conditions. Portfolio seasoning also contributed to higher loan impairment charges. The turmoil in credit markets continued and debt securitisation activity remained very low. This severely reduced the number of refinancing options available to customers. Historically, customers facing financial hardship from unforeseen life events such as redundancy or ill-health have used mortgage refinancing to withdraw equity from their homes to meet their financial obligations. Reduced refinancing opportunities have increased the risk that these customers may default on some or all of their loan obligations. In response, management in the consumer finance business launched intensive programmes to limit foreclosures, modifying more than 34,000 loans. Losses incurred on repossessed properties were partly offset by one-off gains of US$129 million from the Visa IPO. Interest expense fell due to lower funding costs, while staff and marketing costs were lower following management action to reposition the business.
In Canada, profit before tax declined by 18 per cent to US$127 million as higher net interest income due to growth in lending and deposits following effective marketing campaigns was more than offset by an increase in loan impairment charges in the consumer finance business. This was driven by
deteriorating delinquency trends in mortgages and private label cards, as the consumer credit environment became more challenging in Western Canada. An expansion of the branch network of the Canadian retail bank, HSBC Bank Canada, and an increase in employee numbers resulted in increased administrative and staff costs.
Net interest income was in line with the first half of 2007, notwithstanding a 3 per cent fall in average loan balances. Spreads widened due to a significant reduction in funding costs following central bank rate cuts, together with the mix effect from an increased proportion of higher yielding credit and private label cards. These factors were partly offset by a decline in US lending balances, increased impaired loans and lower prepayment volumes.
In the US, net interest income was unchanged. US average deposit balances rose by 5 per cent, as online savings account and retail network savings and current account balances increased. At 30 June 2008, online savings account balances were US$13 billion, with customer numbers rising to over 860,000, attracted by the effect of promotional rates. The number of Premier customers rose by 17 per cent in the twelve months since 30 June 2007 to 215,000, due to marketing campaigns and sales efficiency improvements. Deposit spreads narrowed, reflecting a significant decline in base rates and the change in product mix to higher yielding savings accounts.
Average US mortgage balances declined by 11 per cent to US$112 billion, primarily due to the winding down of the mortgage services portfolio, the tightening of credit criteria for new lending and portfolio sales at the US retail bank and consumer finance business. The slowdown in the US housing market intensified in the first half of 2008, with prices, sales and new housing construction all declining and thereby reducing loan demand.
In the consumer finance business, spreads across the total mortgage loan portfolio widened as funding costs declined due to a 325 basis point reduction in US short-term interest rates compared with 30 June 2007.
Average mortgage balances in the branch-based consumer lending business increased by 5 per cent to US$50 billion due to growth in the second half of 2007. During the first six months of 2008, liquidations exceeded new originations, the latter declining sharply as a result of the closure of some 400 branches during 2007, with another 100 closed in 2008, and further tightening of underwriting standards. This was partly offset by lower run-off rates as a result of the decline in loan prepayments.

H S B C H O L D I N G S P L C
Interim Management Report: Business Review (continued)
68
Yields declined due to deteriorating credit quality as the volume of impaired loans increased and loan terms were modified downwards. A slowdown in the rate of liquidations mitigated the effect of lower originations but also led to lower prepayment penalty income and reduced revenues from amortisation of deferred loan origination fees. Yields on new lending rose despite tighter underwriting criteria which led to a change in mix towards higher quality assets that typically price at a lower level. Spreads widened as funding costs declined.
In mortgage services, average mortgage balances declined by 28 per cent to US$34 billion, largely due to liquidations in the normal course of business following the cessation of new originations in 2007. The pace of decline was partly moderated by lower loan prepayments due to fewer refinancing opportunities for customers. Spreads narrowed as lower funding costs were more than offset by a fall in yields as deteriorating credit quality led to lower levels of early repayment due to reduced prepayment penalty income.
Average mortgage balances held by the US retail bank declined by 10 per cent to US$28 billion as the bank continued to sell a majority of its new residential mortgage loan originations to government-sponsored enterprises and private investors, and allow its residential mortgage loan portfolio to run off including a US$4 billion portfolio sale in the first half of 2008. Spreads widened as yields declined by less than funding costs in the falling rate environment.
Average credit and private label card balances at 30 June 2008 were US$49 billion. Lending growth slowed to 4 per cent as HSBC reduced marketing and tightened underwriting standards during the second half of 2007 and into 2008. Spreads widened as yields declined less than funding costs. Yields declined, driven by changes in product mix in credit and private label cards. Partly offsetting this was the effect of card balances at their contractual floor.
Vehicle finance average balances were broadly flat. Growth in the near-prime portfolio was the result of expansion in the customer direct loan programme, partly offset by lower originations in the dealer network portfolio due to action taken in the second half of 2007 to improve the credit quality of new lending. In the first quarter of 2008, HSBC discontinued dealer relationships in several states, primarily in the Northeast, and withdrew some products. Spreads widened as yields increased and cost of funds declined. Yields increased due to an increased proportion of higher yielding consumer
finance loans, partly offset by changes in product mix towards lower yielding, lower risk loans.
In late July 2008 HSBC decided to cease originating new business within a 90-day period in the North America vehicle finance business of HSBC Finance Corporation. While credit quality in the vehicle finance business had improved during the first half of 2008, management considered that the business was sub-scale and did not have sufficient market strength for it to provide an acceptable level of risk adjusted returns. HSBC will manage an orderly run-off of the portfolio of US$12.5 billion. The estimated costs associated with the decision to exit the vehicle finance business are US$25 million, a substantial portion of which are expected to be recognised in the second half of 2008.
Personal non-credit card average balances declined by US$865 million as a result of actions taken to tighten underwriting standards in 2007. Despite a fall in funding costs, spreads narrowed as yields declined.
In Canada, net interest income rose by 11 per cent, primarily due to a 10 per cent increase in average lending balances, reflecting house price appreciation since the first half of 2007 and robust economic growth. Deposit balances rose, primarily reflecting growth in customer numbers. Premier customer numbers increased by more than 25,000 to over 93,000. Yields fell across most lending products as falling base rates were passed on to floating rate customers, while yields on deposits rose as competition increased. Spreads tightened across the majority of the portfolio as wider credit spreads meant base rate cuts were not fully reflected in funding costs.
Average deposit balances in Canada rose by 9 per cent, driven by strong growth in the direct savings account as HSBC increased its share of the market. Average balances in the high rate and direct savings accounts more than doubled to US$2.9 billion driven by a combination of new customer acquisition and higher average balances on existing accounts. Deposit spreads tightened as yields on deposits rose, despite lower base rates due to an increase in the mix of higher yielding savings accounts and as competition between deposit taking institutions intensified. Yields on surplus funds were broadly unchanged.
Average lending balances in Canada were 10 per cent higher, driven by demand for credit in a relatively robust economy. Lending in consumer finance rose, due to growth in the private label card portfolio, following a significant new relationship in the second half of 2007. In the Canadian retail bank,
69
lending rose driven by mortgages and other personal lending as economic growth continued. Yields declined across most products as interest rate cuts were immediately passed on to floating rate borrowers while overall spreads tightened despite lower base rates as credit spreads widened.
Fee income declined by 8 per cent, mainly due to changes to fee billing practices in the credit card business and the withdrawal of some products in Taxpayer Financial Services. In the US, fees fell by 9 per cent. Fee income from credit cards declined due to changes in overlimit fee billings implemented during the fourth quarter of 2007 and first half of 2008 to improve the customer proposition. A decline in credit quality, changes to the portfolio mix and higher balances led to an increase in the level of uncollectible fees in the credit card and private label portfolios. Fees for late payment rose due to an increase in overdue balances, changes in the merchant mix and amendments to terms. Enhancement services revenue rose as higher take-up rates led to increased fees from debt protection products and total insurance fee income increased by 34 per cent to US$390 million. Taxpayer Financial Services revenue decreased as a result of discontinuing pre-season and pre-file loan products for the 2008 tax season and the decision to reduce the number of relationships with third parties.
At the US retail bank, net fee income rose by 29 per cent to US$372 million, driven by higher service charges on deposits and increased credit card fees from higher transaction volume.
Fee income in Canada rose by 4 per cent. In the Canadian retail bank, the rise was driven by higher service charges, due to repricing; investment administration fees, as a result of growth in funds under management; foreign exchange fees, arising from increased client volumes resulting from volatility in the Canadian dollar to US dollar exchange rate; and Global Immigrant Investor Programme fees, due to growth in volumes. Fee income in consumer finance fell by 7 per cent from a low base in the first half of 2007.
Trading losses declined to US$16 million from US$97 million in the first half of 2007, due to the closure of the Decision One brokerage business.
The Visa IPO provided a US$92 million gain on financial investments.
Other operating income declined by 189 per cent, primarily due to losses on repossessed properties as volumes increased and values fell with the decline in house prices. In the consumer finance business, total foreclosed properties rose to nearly
11,000 from over 9,600 at 31 December 2007 although, following operational enhancements, the time which foreclosed assets remained on the market fell from 183 days to 171 days.
Other operating income in Canada fell, largely reflecting a net loss on the sale of a mortgage brokerage business within consumer finance. Other operating income fell in the Canadian retail bank due to the non-recurrence of a gain on the sale of shares in the Montreal stock exchange in the first half of 2007.
Loan impairment charges rose by 84 per cent on the first half of 2007 to US$7.0 billion, driven by a weakening US economy, continued deterioration in the consumer finance loan portfolio and a decline in the credit quality of prime and second lien mortgages held by HSBC Bank USA. Charges were US$1.2 billion lower than in the second half of 2007. US loan impairment charges rose by 85 per cent as delinquencies increased across much of the loan book. Part of the increase reflected the continued seasoning of the 2005, 2006 and early 2007 portfolios. The first half of 2008 saw a further weakening in the US economy and house price declines accelerated, reducing the amount of equity available for refinancing. Credit market turmoil meant the secondary market for securitised loans remained closed. Consequently, customers continued to experience difficulties in refinancing their loans. Bankruptcy levels increased as a rise in unemployment and increased fuel and food costs added to the financial pressures facing customers. Although the vast majority of mortgage customers continued to meet their commitments, delinquencies rose and loss severities increased.
HSBC continued to act to mitigate, where appropriate, the effects of the housing market decline on customers. In the first half of 2008, in the consumer finance business some 34,000 loans with an aggregate balance of approximately US$5.1 billion were modified. On a selective basis, longer term modifications were offered, typically for either two or five years.
Loan impairment charges in the mortgage services business more than doubled to US$1.9 billion. Rising delinquencies were partly offset by a decline in lending balances as the portfolio moved further into run-off.
In the consumer lending business, loan impairment charges rose by 69 per cent to US$2.1 billion as market conditions deteriorated. The decline was most severe in first lien loans in those states most affected by the housing market downturn. In addition, in the first half of 2008

H S B C H O L D I N G S P L C
Interim Management Report: Business Review (continued)
70
delinquencies increased markedly in those states experiencing significant rises in unemployment. In response, credit criteria were tightened and an additional 100 branches were closed in the first half of 2008.
At HSBC Bank USA, the credit quality of residential mortgages deteriorated in the Home Equity Line of Credit and Home Equity Loan portfolios, while prime first lien mortgages also experienced higher levels of delinquency.
Credit and private label card loan impairment charges rose by 58 per cent to US$2.3 billion due to higher levels of non-prime balances, portfolio seasoning, increased bankruptcy filings, and the deterioration in the economy. Strategic initiatives were implemented to mitigate deteriorating credit trends on cards, including increased collection capacity, closure of inactive accounts, reductions in credit limits, a tightened approval process and restricted balance transfer volumes.
Impairment charges on the personal non-credit card portfolio rose by 40 per cent to US$1.2 billion. The deterioration in credit quality was more pronounced in some regions driven by the weakening US economy, rising unemployment rates and higher levels of bankruptcy filings. Loan impairment charges at the vehicle finance business rose by 44 per cent to US$335 million as economic deterioration led to higher loan defaults, while reduced demand for used cars, particularly larger vehicles, led to higher losses when repossessed vehicles were sold at auction.
In Canada, loan impairment charges rose by 52 per cent to US$125 million due to deteriorating delinquency rates in private label cards and mortgages, within the consumer finance business particularly in Western Canada, as the credit environment became more challenging. Loan impairment charges in the Canadian retail bank rose by US$9 million, largely driven by the vehicle finance business as a result of portfolio seasoning and higher fuel prices.
Operating expenses increased by 3 per cent to US$3.9 billion because of the goodwill impairment. Excluding this, costs declined. In the US, the management actions in 2007 to close the Decision One mortgage brokerage unit, cease correspondent acquisitions and reduce the consumer lending branch network led to a decline in staff costs. In addition, costs fell due to staff cuts from the reduction in size of the vehicle finance business and ongoing global cost reduction campaigns in processing and support functions. Other operating expenses declined as marketing on credit and private
label cards was curtailed to limit growth in loan balances. Branch closures in the consumer finance business and reduced mortgage services activity also led to lower operating costs. At the US retail bank, a rise in staff and other operating costs reflected increased investment in branch expansion and higher federal deposit insurance expenses. These costs were more than offset by the release of a litigation provision relating to a legal settlement prior to the Visa IPO in the second half of 2007.
Operating expenses rose by 5 per cent in Canada. Staff costs rose by a percentage point due to increased headcount in the Canadian retail bank following expansion in the branch network, which was partly offset by lower costs in consumer finance as a result of reduced headcount following branch closures in 2007 and the sale of a mortgage brokerage business in 2008. Other administrative and support costs rose, as investments made in the business, including expanding the branch network and online banking resulted in higher premises and depreciation costs.
Commercial Banking pre-tax profit declined by 15 per cent to US$430 million as loan impairment charges rose in the deteriorating economic environment.
Revenue increased, lifted by asset sales from HSBC Finance and fee income in Canada, partly offset by a fall in net interest income due to tighter spreads on deposits.
In the US, profit before tax fell by 22 per cent, with performance driven by tighter deposit spreads and increased loan impairment charges.
In Canada, profit before tax fell by 6 per cent to US$237 million as increased fee income was more than offset by higher loan impairment charges due to increased delinquency rates in the export and manufacturing sectors as a result of the slowing US economy, higher energy costs and a stronger Canadian dollar.
In Bermuda, profit before tax declined by 29 per cent due to lower net interest income as deposit spreads tightened following base rate cuts, and higher costs.
Net interest income declined by 2 per cent. In the US, net interest income fell by 3 per cent, as tighter deposit spreads in the declining rate environment more than offset a rise in deposit and loan volumes. The US retail bank continued its strategy of balancing growth between its established business in New York State and its expansion in the West Coast, Chicago and the Southeast. Average

71
deposit balances rose by 11 per cent and loan balances increased by 11 per cent.
In the US, average loan balances to the middle market segment rose by 29 per cent to US$8.1 billion, outpacing the small business segment, where loans rose by 4 per cent in the face of increased competitive pressures. Management action led to a 3 per cent decline in commercial real estate activity compared with the first half of 2007, with increased repayments and reduced replacement business as the US retail bank took the opportunity to manage down lending exposures due to lower risk appetite and a deterioration in market conditions. Lending spreads widened on small business loans due to lower funding costs, but this was more than offset by tighter spreads on middle market and commercial real estate loans as yields declined due to a move towards higher credit quality customers, although spreads improved markedly in the second quarter.
Average deposit balances with small businesses in the US rose by 8 per cent to US$13 billion, due to strong growth in markets outside New York. Middle market deposits rose 23 per cent while commercial real estate deposit growth was subdued due to the exiting from selected associated lending relationships. The rise in balances was more than offset by narrower deposit spreads in the declining rate environment and competitive pricing pressures.
In Canada, net interest income was broadly in line with the first half of 2007 at US$337 million, as balance sheet growth offset tightening lending spreads. Average deposit balances rose by 8 per cent due to higher cash management balances, driven by an increase in account numbers following an expansion of the product offering. Deposit spreads remained constant as deposit rates and yields on surplus funds were unchanged despite lower base rates as credit spreads widened.
Average lending balances rose by 13 per cent, driven by lending growth, particularly in floating rate products, in the buoyant Western Canada region. Elsewhere, lending growth was experienced across all regions as the economy remained robust. Lending spreads tightened as interest rate cuts were immediately passed on to floating rate borrowers, in contrast to the wholesale cost of funding, which was adversely affected by wider credit spreads.
In Bermuda, net interest income decreased by 19 per cent, driven by tighter deposit spreads on current accounts as base rates declined. Average deposit balances rose by 23 per cent, reflecting continued strong demand from the insurance and construction sectors.
Net fee income rose by 20 per cent. In the US, fees increased by 7 per cent due to higher deposit service charges as a result of the successful expansion of cash management product offerings, higher debit card fees and increased loan syndication and agency fees for commercial real estate. In Canada, fee income rose by 36 per cent, driven by an increase in revenue as volumes of trade related money market instruments rose and higher fund transfer commissions as client activity increased.
Other operating income was higher due to increased gains from sales of assets in the legacy HSBC Finance commercial portfolio.
In the US, loan impairment charges more than doubled to US$106 million as the deteriorating economic outlook and customer downgrades prompted an increase in impairment allowances in the middle market and commercial real estate portfolios, as well as higher impairment charges for small business loans. While impairment allowances in middle market and commercial real estate increased, the level of write-offs on these portfolios improved, resulting in a small level of recoveries.
Loan impairment charges in Canada rose by US$38 million from the low levels reported in 2007 due to asset growth and higher delinquency rates in the manufacturing and export sectors, the result of the slowing US economy, higher energy costs and stronger Canadian dollar.
Operating expenses in the US were broadly unchanged as a decline in staff costs was offset by a rise in branch network-related costs. Staff costs fell due to lower incentive compensation and a decrease in headcount due to the consolidation of lending support functions. Administrative expenses rose by 9 per cent, mainly due to marketing spend.
Operating expenses in Canada were in line with the first half of 2007. Staff costs were broadly unchanged as higher salaries and benefits from growth in headcount due to continued investment in the business were offset by lower performance related pay. Other operating expenses fell due to lower capital taxes.
Global Banking and Markets reported a loss before tax of US$1.6 billion, compared with a profit of US$436 million in the first half of 2007. The disruption in global credit markets led to US$2.3 billion of write-downs in Credit and structured credit trading exposures and in monoline exposures and leveraged loans. Aside from these write-downs, pre-tax profit grew compared with the first half of 2007, as the performance of other trading

H S B C H O L D I N G S P L C
Interim Management Report: Business Review (continued)
72
businesses improved and net interest income and net fee income increased.
Total operating losses of US$843 million were driven by the write-downs noted above. These losses were partly mitigated by increased income in other trading product areas, and in Balance Sheet Management.
Net interest income increased by 58 per cent as Balance Sheet Management benefited from the falling short-term US interest rates. Strong deposit balance growth in payments and cash management also contributed.
Net fee income rose by 31 per cent. Global Asset Management benefited from the market turmoil as institutional clients moved assets into less volatile cash funds. Advisory fee income also rose in capital markets, chiefly due to earnings from the Visa IPO.
Trading losses of US$1.7 billion were primarily driven by the write-downs noted above. Due to the credit market turmoil, the fair value of credit instruments such as mortgage loans and structured credit instruments deteriorated as the credit and liquidity disruption that began in the US sub-prime market spread into other mortgage and mortgage-related products. Trading in new US mortgages and related products was discontinued in late 2007. HSBC transacts with monoline insurers to buy protection against losses from defaults, primarily on credit products. For a description of the background to monoline write-downs, see page 36. The market turmoil also caused the market value of some leveraged and acquisition finance loans to fall due to general credit and liquidity disruption. More information on these write-downs and the underlying assets is available on page 113.
Other trading product areas continued to perform strongly, including foreign exchange and Rates, up by 99 per cent and 355 per cent, respectively, compared with the same period in 2007. Rates trading benefited from reduced market liquidity, which provided opportunities for wider spreads, and from increased market volatility. Foreign exchange trading income increased on higher customer trading and a strengthening of major currencies against the US dollar. Metals trading revenues benefited from higher prices in gold and platinum. Income from the equities business grew from increased customer trading volumes, which were driven by equity market volatility, and through capital markets fees.
Market conditions led to lower Principal Investments activity, resulting in a decline in Other operating income, and Gains less losses from
financial investments fell as income from the disposal of securities declined.
Loan impairment charges rose because of weaker credit fundamentals which have resulted in a higher number of downgrades, particularly in comparison with the releases in the first half of 2007.
Operating expenses fell due to a 7 per cent reduction in staff numbers following the restructuring of a number of businesses during the second half of 2007 and first half of 2008 in response to market conditions. This included the closure of the mortgage-backed securities business in the US. The financial performance also led to lower performance-related costs, which further reduced operating expenses.
Private Banking reported a pre-tax profit of US$58 million in line with the first half of 2007, as unchanged revenues were offset by increased operating expenses. The cost efficiency ratio worsened by 4.8 percentage points to 74.2 per cent, with a number of new hires in the US and Canada.
Net interest income decreased by 5 per cent to US$112 million. Higher volumes of domestic savings and foreign time deposit accounts were driven by clients moving their assets under management to safer cash products, and new client relationships. However, this was offset by compressed spreads in the US due to a reduction in short-term US dollar interest rates.
Other revenues grew 5 per cent to US$117 million, driven mainly by an 11 per cent increase in net fee income. In the US, improved revenue sharing between customer groups led to increased asset management and custody fees and higher brokerage income. In Bermuda, HSBC also reported a rise in fee income, benefiting from improved brokerage and trust income fees, with the introduction of new tariffs.
Client assets increased by 1 per cent to US$58.8 billion compared with 31 December 2007, primarily in domestic custody and trust accounts, with net new money of US$1.4 billion offset by negative market movements.
Operating expenses were 7 per cent higher at US$170 million. A 7 per cent rise in staff costs was due to increased headcount relating to business expansion.
Within Other, profit before tax of US$294 million was reported compared with a loss of US$26 million in the first half of 2007.
Fair value movements on HSBC’s own debt resulted in gains of US$354 million, primarily due to

73
the widening credit spreads in the first quarter. Costs at HSBC.com and HSBC Technology USA Inc, the providers of technology services in North America,
decreased by 3 per cent to US$696 million. Related recharges are reported in other operating income.
Reconciliation of reported and underlying profit before tax
Half-year to 30 June 2008 (‘1H08’) compared with half-year to 31 December 2007 (‘2H07’)
North America
2H07 as reported US$m
Disposals and dilution gains1
US$m
Currency translation2
US$m
2H07 at 1H08 exchange rates US$m
Acqui- sitions1
US$m
Under- lying change US$m
1H08 as reported US$m
Re- ported change %
Under- lying change %
Net interest income .......... 7,540 – 3 7,543 – 330 7,873 4 4 Net fee income ................. 2,906 (52) 1 2,855 – (33) 2,822 (3) (1)Other income/(expense)3 . 857 (18) 1 840 – (1,936) (1,096) (228) (230)
Net operating income4 ..... 11,303 (70) 5 11,238 – (1,639) 9,599 (15) (15)
Loan impairment charges and other credit risk provisions .................... (8,336) – 2 (8,334) – 1,168 (7,166) 14 14
Net operating income ...... 2,967 (70) 7 2,904 – (471) 2,433 (18) (16)
Operating expenses .......... (5,321) 48 (3) (5,276) – (58) (5,334) – (1)
Operating loss .................. (2,354) (22) 4 (2,372) – (529) (2,901) (23) (22)
Income from associates ... 10 – – 10 – (2) 8 (20) (20)
Loss before tax ................. (2,344) (22) 4 (2,362) – (531) (2,893) (23) (22)
For footnotes, see page 89.
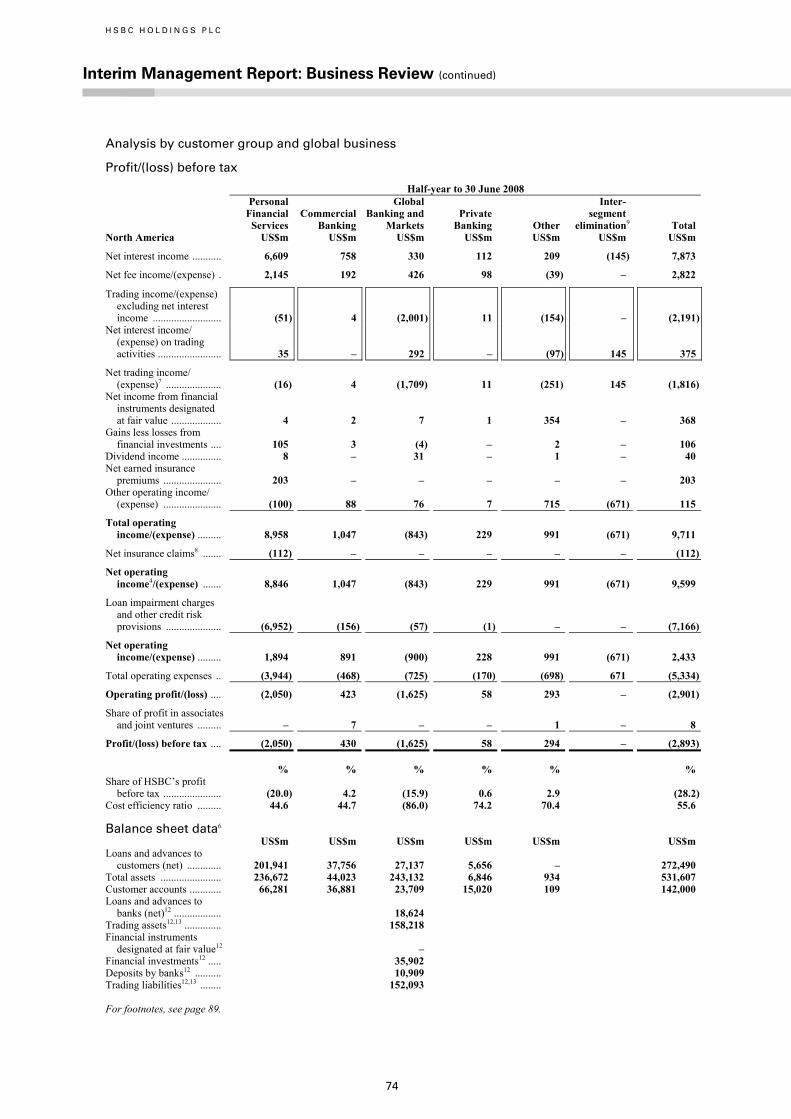
H S B C H O L D I N G S P L C
Interim Management Report: Business Review (continued)
74
Analysis by customer group and global business
Profit/(loss) before tax
Half-year to 30 June 2008
North America
Personal Financial Services US$m
Commercial Banking US$m
Global Banking and Markets US$m
Private Banking US$m
Other
US$m
Inter- segment elimination9 US$m
Total US$m
Net interest income ........... 6,609 758 330 112 209 (145) 7,873
Net fee income/(expense) . 2,145 192 426 98 (39) – 2,822
Trading income/(expense) excluding net interest income .......................... (51) 4 (2,001) 11 (154) – (2,191)
Net interest income/ (expense) on trading activities ........................ 35 – 292 – (97) 145 375
Net trading income/ (expense)7 ..................... (16) 4 (1,709) 11 (251) 145 (1,816)
Net income from financial instruments designated at fair value ................... 4 2 7 1 354 – 368
Gains less losses from financial investments .... 105 3 (4) – 2 – 106
Dividend income ............... 8 – 31 – 1 – 40 Net earned insurance
premiums ...................... 203 – – – – – 203 Other operating income/
(expense) ...................... (100) 88 76 7 715 (671) 115
Total operating income/(expense) ......... 8,958 1,047 (843) 229 991 (671) 9,711
Net insurance claims8 ....... (112) – – – – – (112)
Net operating income4/(expense) ....... 8,846 1,047 (843) 229 991 (671) 9,599
Loan impairment charges and other credit risk provisions ..................... (6,952) (156) (57) (1) – – (7,166)
Net operating income/(expense) ......... 1,894 891 (900) 228 991 (671) 2,433
Total operating expenses .. (3,944) (468) (725) (170) (698) 671 (5,334)
Operating profit/(loss) .... (2,050) 423 (1,625) 58 293 – (2,901)
Share of profit in associates and joint ventures ......... – 7 – – 1 – 8
Profit/(loss) before tax .... (2,050) 430 (1,625) 58 294 – (2,893) % % % % % % Share of HSBC’s profit
before tax ...................... (20.0) 4.2 (15.9) 0.6 2.9 (28.2)Cost efficiency ratio ......... 44.6 44.7 (86.0) 74.2 70.4 55.6 Balance sheet data6 US$m US$m US$m US$m US$m US$m Loans and advances to
customers (net) ............. 201,941 37,756 27,137 5,656 – 272,490 Total assets ....................... 236,672 44,023 243,132 6,846 934 531,607 Customer accounts ............ 66,281 36,881 23,709 15,020 109 142,000 Loans and advances to
banks (net)12 .................. 18,624 Trading assets12,13 .............. 158,218 Financial instruments
designated at fair value12 – Financial investments12 ..... 35,902 Deposits by banks12 .......... 10,909 Trading liabilities12,13 ........ 152,093
For footnotes, see page 89.
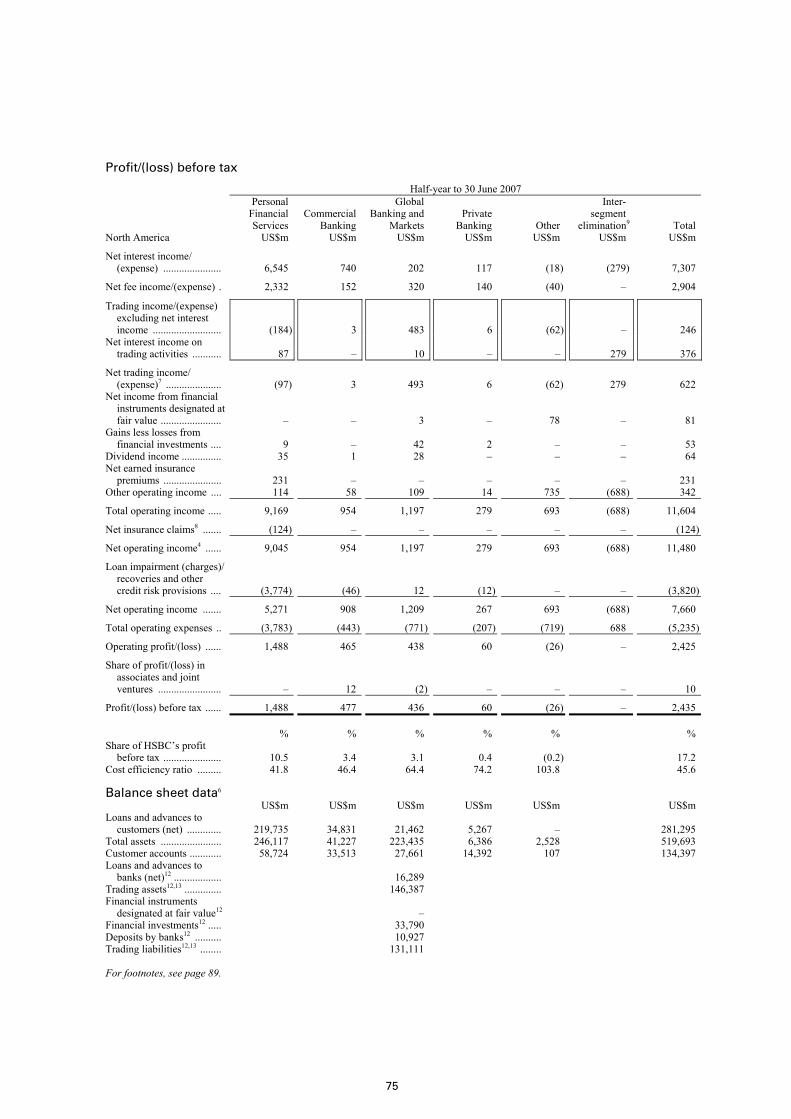
75
Profit/(loss) before tax
Half-year to 30 June 2007
North America
Personal Financial Services US$m
Commercial Banking US$m
Global Banking and Markets US$m
Private Banking US$m
Other
US$m
Inter- segment elimination9 US$m
Total US$m
Net interest income/ (expense) ...................... 6,545 740 202 117 (18) (279) 7,307
Net fee income/(expense) . 2,332 152 320 140 (40) – 2,904
Trading income/(expense) excluding net interest income .......................... (184) 3 483 6 (62) – 246
Net interest income on trading activities ........... 87 – 10 – – 279 376
Net trading income/ (expense)7 ..................... (97) 3 493 6 (62) 279 622
Net income from financial instruments designated at fair value ....................... – – 3 – 78 – 81
Gains less losses from financial investments .... 9 – 42 2 – – 53
Dividend income ............... 35 1 28 – – – 64 Net earned insurance
premiums ...................... 231 – – – – – 231 Other operating income .... 114 58 109 14 735 (688) 342
Total operating income ..... 9,169 954 1,197 279 693 (688) 11,604
Net insurance claims8 ....... (124) – – – – – (124)
Net operating income4 ...... 9,045 954 1,197 279 693 (688) 11,480
Loan impairment (charges)/ recoveries and other credit risk provisions .... (3,774) (46) 12 (12) – – (3,820)
Net operating income ....... 5,271 908 1,209 267 693 (688) 7,660
Total operating expenses .. (3,783) (443) (771) (207) (719) 688 (5,235)
Operating profit/(loss) ...... 1,488 465 438 60 (26) – 2,425
Share of profit/(loss) in associates and joint ventures ........................ – 12 (2) – – – 10
Profit/(loss) before tax ...... 1,488 477 436 60 (26) – 2,435 % % % % % % Share of HSBC’s profit
before tax ...................... 10.5 3.4 3.1 0.4 (0.2) 17.2 Cost efficiency ratio ......... 41.8 46.4 64.4 74.2 103.8 45.6 Balance sheet data6 US$m US$m US$m US$m US$m US$m Loans and advances to
customers (net) ............. 219,735 34,831 21,462 5,267 – 281,295 Total assets ....................... 246,117 41,227 223,435 6,386 2,528 519,693 Customer accounts ............ 58,724 33,513 27,661 14,392 107 134,397 Loans and advances to
banks (net)12 .................. 16,289 Trading assets12,13 .............. 146,387 Financial instruments
designated at fair value12 – Financial investments12 ..... 33,790 Deposits by banks12 .......... 10,927 Trading liabilities12,13 ........ 131,111
For footnotes, see page 89.

H S B C H O L D I N G S P L C
Interim Management Report: Business Review (continued)
76
Analysis by customer group and global business (continued)
Profit/(loss) before tax
Half-year to 31 December 2007
North America
Personal Financial Services US$m
Commercial Banking US$m
Global Banking and Markets US$m
Private Banking US$m
Other
US$m
Inter- segment elimination9 US$m
Total US$m
Net interest income ........... 6,630 818 176 156 1 (241) 7,540
Net fee income/(expense) . 2,239 186 381 139 (39) – 2,906
Trading income/(expense) excluding net interest income .......................... (165) (5) (1,354) 5 (16) – (1,535)
Net interest income/ (expense) on trading activities ........................ 47 – 127 – (44) 241 371
Net trading income/ (expense)7 ..................... (118) (5) (1,227) 5 (60) 241 (1,164)
Net expense from financial instruments designated at fair value ................... – – 8 – 1,661 – 1,669
Gains less losses from financial investments .... 167 (1) 23 – 3 – 192
Dividend income ............... 12 – 29 – – – 41 Net earned insurance
premiums ...................... 218 – – – – – 218 Other operating income/
(expense) ...................... (119) 30 58 20 745 (716) 18
Total operating income/ (expense) ...................... 9,029 1,028 (552) 320 2,311 (716) 11,420
Net insurance claims8 ....... (117) – – – – – (117)
Net operating income/ (expense)4 ..................... 8,912 1,028 (552) 320 2,311 (716) 11,303
Loan impairment (charges)/ recoveries and other credit risk provisions .... (8,135) (145) (58) 2 – – (8,336)
Net operating income ....... 777 883 (610) 322 2,311 (716) 2,967
Total operating expenses .. (3,811) (450) (791) (208) (777) 716 (5,321)
Operating profit/(loss) ...... (3,034) 433 (1,401) 114 1,534 – (2,354)
Share of profit in associates and joint ventures ......... – 10 – – – – 10
Profit/(loss) before tax ...... (3,034) 443 (1,401) 114 1,534 – (2,344) % % % % % % Share of HSBC’s profit
before tax ...................... (30.2) 4.4 (13.9) 1.1 15.3 (23.3)Cost efficiency ratio ......... 42.8 43.8 143.3 65.0 33.6 47.1 Balance sheet data6 US$m US$m US$m US$m US$m US$m Loans and advances to
customers (net) ............. 218,676 38,930 26,186 6,068 – 289,860 Total assets ....................... 240,734 43,920 217,808 6,541 1,089 510,092 Customer accounts ............ 61,824 36,306 30,732 16,187 124 145,173 Loans and advances to
banks (net)12 ..................
14,938
Trading assets12,13 .............. 149,926 Financial instruments
designated at fair value12 – Financial investments12 ..... 33,273 Deposits by banks12 .......... 14,825 Trading liabilities12,13 ........ 126,139
For footnotes, see page 89.

77
Latin America
Profit/(loss) before tax by country within customer groups and global businesses
Personal Financial Services US$m
Commercial Banking US$m
GlobalBanking and Markets US$m
Private Banking US$m
Other US$m
Total US$m
Half-year to 30 June 2008 Brazil ................................................................. 262 200 193 6 (1) 660 Mexico .............................................................. 151 127 106 1 – 385 Argentina .......................................................... 21 43 55 – – 119 Panama .............................................................. 31 18 13 1 – 63 Other ................................................................. 3 23 16 – (3) 39
468 411 383 8 (4) 1,266 Half-year to 30 June 2007 Brazil ................................................................. 101 116 141 4 (2) 360 Mexico .............................................................. 251 169 50 5 – 475 Argentina .......................................................... 10 33 49 – 3 95 Panama .............................................................. 17 11 10 1 – 39 Other ................................................................. 9 23 3 – (4) 31
388 352 253 10 (3) 1,000 Half-year to 31 December 2007 Brazil ................................................................. 192 170 156 5 (4) 519 Mexico .............................................................. 263 164 63 6 9 505 Argentina .......................................................... 26 42 41 – (3) 106 Panama .............................................................. 28 7 6 6 – 47 Other ................................................................. (4) 5 (2) (2) 4 1
505 388 264 15 6 1,178
Loans and advances to customers (net) by country
At 30 June 2008 US$m
At 30 June 2007
US$m
At 31 December 2007 US$m
Brazil ................................................................................................................ 23,721 14,104 18,491 Mexico ............................................................................................................. 18,557 16,063 18,059 Argentina ......................................................................................................... 2,704 2,026 2,485 Panama ............................................................................................................. 4,294 4,059 4,158 Other ................................................................................................................ 4,976 4,354 4,730
54,252 40,606 47,923
Customer accounts by country
At 30 June 2008 US$m
At 30 June 2007
US$m
At 31 December 2007 US$m
Brazil ................................................................................................................ 35,285 23,660 26,231 Mexico ............................................................................................................. 22,562 19,916 22,307 Argentina ......................................................................................................... 3,300 2,659 2,779 Panama ............................................................................................................. 5,338 4,678 5,062 Other ................................................................................................................ 5,294 4,336 4,913
71,779 55,249 61,292
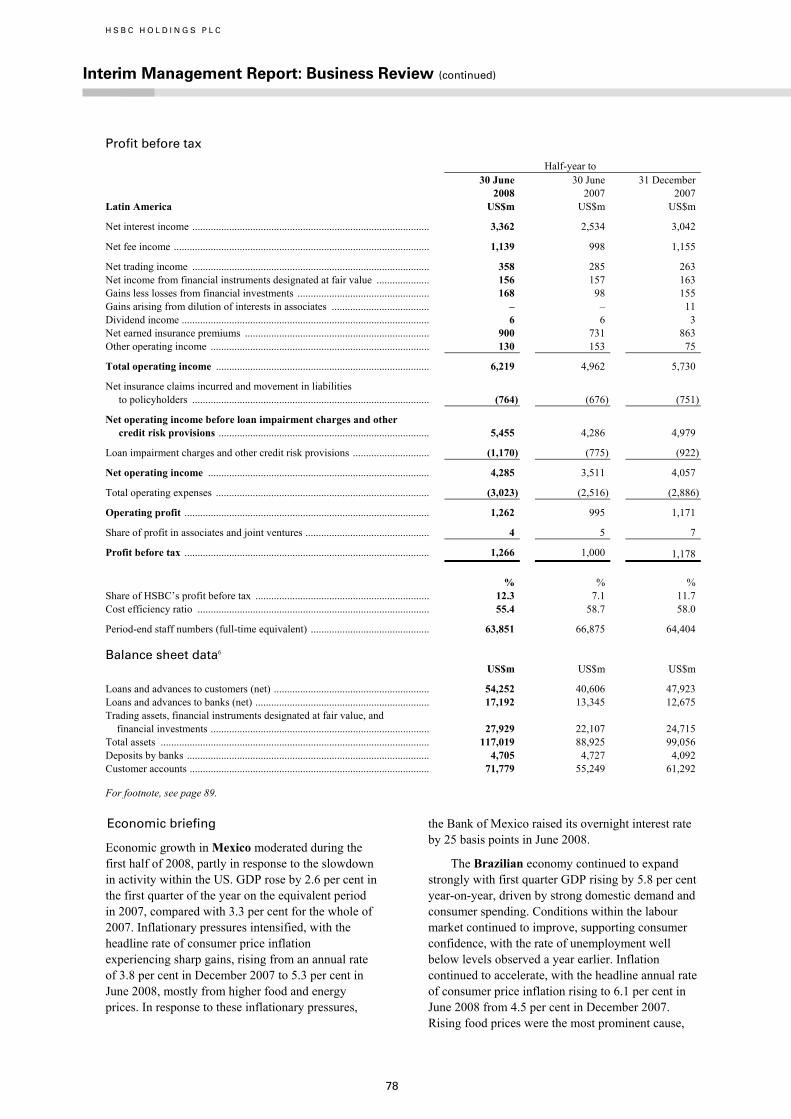
H S B C H O L D I N G S P L C
Interim Management Report: Business Review (continued)
78
Profit before tax
Half-year to
30 June
2008 30 June
2007 31 December
2007 Latin America US$m US$m US$m
Net interest income .......................................................................................... 3,362 2,534 3,042
Net fee income ................................................................................................. 1,139 998 1,155
Net trading income .......................................................................................... 358 285 263 Net income from financial instruments designated at fair value .................... 156 157 163 Gains less losses from financial investments .................................................. 168 98 155 Gains arising from dilution of interests in associates ..................................... – – 11 Dividend income .............................................................................................. 6 6 3 Net earned insurance premiums ...................................................................... 900 731 863 Other operating income ................................................................................... 130 153 75
Total operating income ................................................................................. 6,219 4,962 5,730
Net insurance claims incurred and movement in liabilities to policyholders .......................................................................................... (764) (676) (751)
Net operating income before loan impairment charges and other credit risk provisions ................................................................................ 5,455 4,286 4,979
Loan impairment charges and other credit risk provisions ............................. (1,170) (775) (922)
Net operating income .................................................................................... 4,285 3,511 4,057
Total operating expenses ................................................................................. (3,023) (2,516) (2,886)
Operating profit ............................................................................................. 1,262 995 1,171
Share of profit in associates and joint ventures ............................................... 4 5 7
Profit before tax ............................................................................................. 1,266 1,000 1,178 % % % Share of HSBC’s profit before tax .................................................................. 12.3 7.1 11.7 Cost efficiency ratio ........................................................................................ 55.4 58.7 58.0
Period-end staff numbers (full-time equivalent) ............................................. 63,851 66,875 64,404 Balance sheet data6 US$m US$m US$m
Loans and advances to customers (net) ........................................................... 54,252 40,606 47,923 Loans and advances to banks (net) .................................................................. 17,192 13,345 12,675 Trading assets, financial instruments designated at fair value, and
financial investments ................................................................................... 27,929 22,107 24,715 Total assets ...................................................................................................... 117,019 88,925 99,056 Deposits by banks ............................................................................................ 4,705 4,727 4,092 Customer accounts ........................................................................................... 71,779 55,249 61,292
For footnote, see page 89.
Economic briefing
Economic growth in Mexico moderated during the first half of 2008, partly in response to the slowdown in activity within the US. GDP rose by 2.6 per cent in the first quarter of the year on the equivalent period in 2007, compared with 3.3 per cent for the whole of 2007. Inflationary pressures intensified, with the headline rate of consumer price inflation experiencing sharp gains, rising from an annual rate of 3.8 per cent in December 2007 to 5.3 per cent in June 2008, mostly from higher food and energy prices. In response to these inflationary pressures,
the Bank of Mexico raised its overnight interest rate by 25 basis points in June 2008.
The Brazilian economy continued to expand strongly with first quarter GDP rising by 5.8 per cent year-on-year, driven by strong domestic demand and consumer spending. Conditions within the labour market continued to improve, supporting consumer confidence, with the rate of unemployment well below levels observed a year earlier. Inflation continued to accelerate, with the headline annual rate of consumer price inflation rising to 6.1 per cent in June 2008 from 4.5 per cent in December 2007. Rising food prices were the most prominent cause,
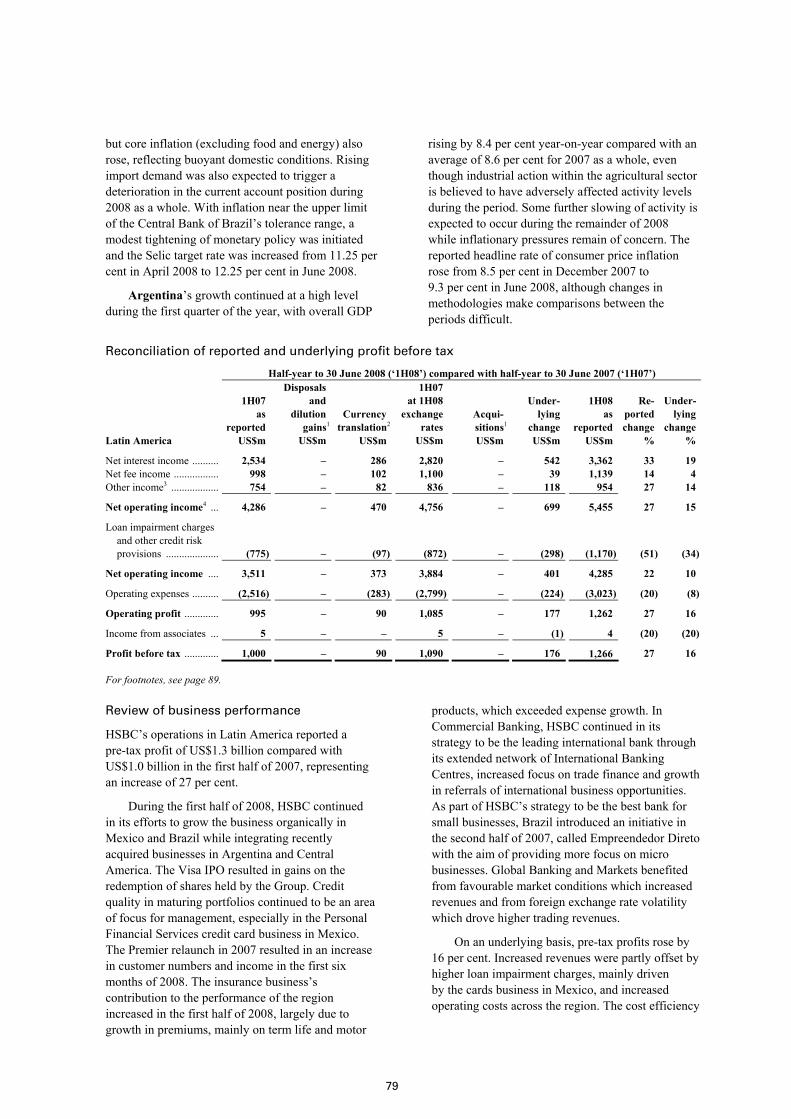
79
but core inflation (excluding food and energy) also rose, reflecting buoyant domestic conditions. Rising import demand was also expected to trigger a deterioration in the current account position during 2008 as a whole. With inflation near the upper limit of the Central Bank of Brazil’s tolerance range, a modest tightening of monetary policy was initiated and the Selic target rate was increased from 11.25 per cent in April 2008 to 12.25 per cent in June 2008.
Argentina’s growth continued at a high level during the first quarter of the year, with overall GDP
rising by 8.4 per cent year-on-year compared with an average of 8.6 per cent for 2007 as a whole, even though industrial action within the agricultural sector is believed to have adversely affected activity levels during the period. Some further slowing of activity is expected to occur during the remainder of 2008 while inflationary pressures remain of concern. The reported headline rate of consumer price inflation rose from 8.5 per cent in December 2007 to 9.3 per cent in June 2008, although changes in methodologies make comparisons between the periods difficult.
Reconciliation of reported and underlying profit before tax
Half-year to 30 June 2008 (‘1H08’) compared with half-year to 30 June 2007 (‘1H07’)
Latin America
1H07 as reported US$m
Disposals and dilution gains1
US$m
Currency translation2
US$m
1H07 at 1H08 exchange rates US$m
Acqui- sitions1
US$m
Under- lying change US$m
1H08 as reported US$m
Re- ported change %
Under- lying change %
Net interest income .......... 2,534 – 286 2,820 – 542 3,362 33 19 Net fee income ................. 998 – 102 1,100 – 39 1,139 14 4 Other income3 .................. 754 – 82 836 – 118 954 27 14
Net operating income4 ... 4,286 – 470 4,756 – 699 5,455 27 15
Loan impairment charges and other credit risk provisions .................... (775) – (97) (872) – (298) (1,170) (51) (34)
Net operating income .... 3,511 – 373 3,884 – 401 4,285 22 10
Operating expenses .......... (2,516) – (283) (2,799) – (224) (3,023) (20) (8)
Operating profit ............. 995 – 90 1,085 – 177 1,262 27 16
Income from associates ... 5 – – 5 – (1) 4 (20) (20)
Profit before tax ............. 1,000 – 90 1,090 – 176 1,266 27 16
For footnotes, see page 89.
Review of business performance
HSBC’s operations in Latin America reported a pre-tax profit of US$1.3 billion compared with US$1.0 billion in the first half of 2007, representing an increase of 27 per cent.
During the first half of 2008, HSBC continued in its efforts to grow the business organically in Mexico and Brazil while integrating recently acquired businesses in Argentina and Central America. The Visa IPO resulted in gains on the redemption of shares held by the Group. Credit quality in maturing portfolios continued to be an area of focus for management, especially in the Personal Financial Services credit card business in Mexico. The Premier relaunch in 2007 resulted in an increase in customer numbers and income in the first six months of 2008. The insurance business’s contribution to the performance of the region increased in the first half of 2008, largely due to growth in premiums, mainly on term life and motor
products, which exceeded expense growth. In Commercial Banking, HSBC continued in its strategy to be the leading international bank through its extended network of International Banking Centres, increased focus on trade finance and growth in referrals of international business opportunities. As part of HSBC’s strategy to be the best bank for small businesses, Brazil introduced an initiative in the second half of 2007, called Empreendedor Direto with the aim of providing more focus on micro businesses. Global Banking and Markets benefited from favourable market conditions which increased revenues and from foreign exchange rate volatility which drove higher trading revenues.
On an underlying basis, pre-tax profits rose by 16 per cent. Increased revenues were partly offset by higher loan impairment charges, mainly driven by the cards business in Mexico, and increased operating costs across the region. The cost efficiency
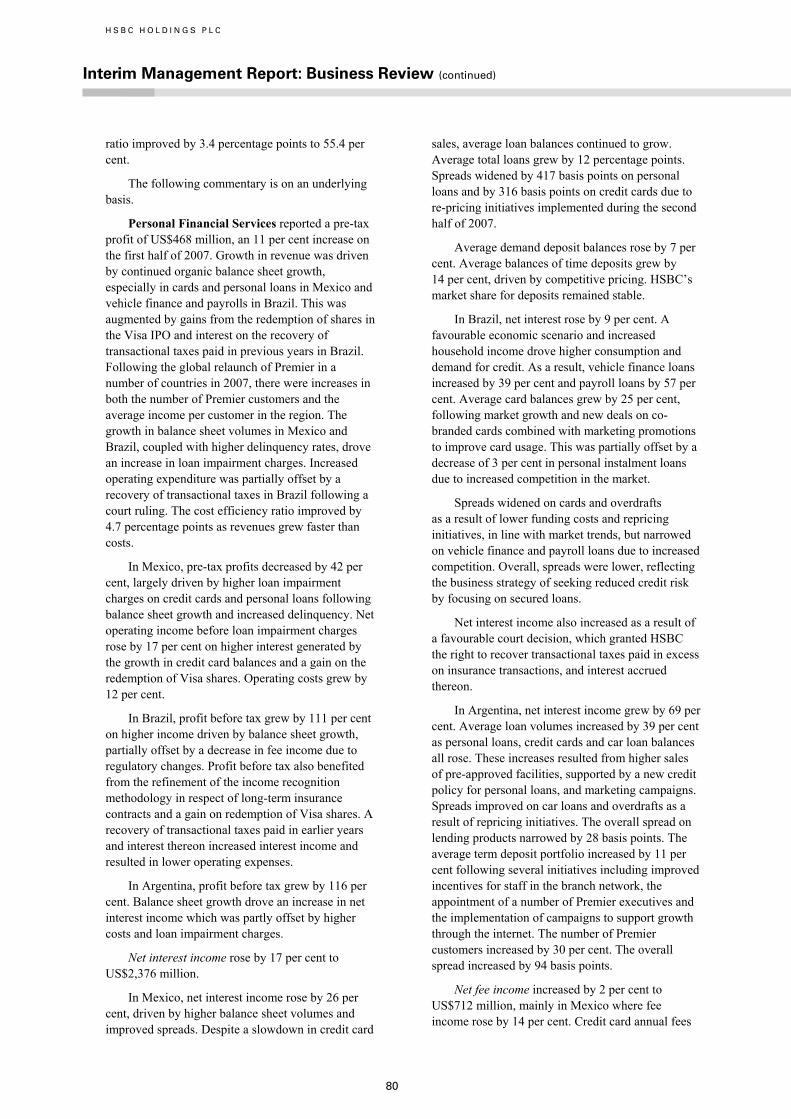
H S B C H O L D I N G S P L C
Interim Management Report: Business Review (continued)
80
ratio improved by 3.4 percentage points to 55.4 per cent.
The following commentary is on an underlying basis.
Personal Financial Services reported a pre-tax profit of US$468 million, an 11 per cent increase on the first half of 2007. Growth in revenue was driven by continued organic balance sheet growth, especially in cards and personal loans in Mexico and vehicle finance and payrolls in Brazil. This was augmented by gains from the redemption of shares in the Visa IPO and interest on the recovery of transactional taxes paid in previous years in Brazil. Following the global relaunch of Premier in a number of countries in 2007, there were increases in both the number of Premier customers and the average income per customer in the region. The growth in balance sheet volumes in Mexico and Brazil, coupled with higher delinquency rates, drove an increase in loan impairment charges. Increased operating expenditure was partially offset by a recovery of transactional taxes in Brazil following a court ruling. The cost efficiency ratio improved by 4.7 percentage points as revenues grew faster than costs.
In Mexico, pre-tax profits decreased by 42 per cent, largely driven by higher loan impairment charges on credit cards and personal loans following balance sheet growth and increased delinquency. Net operating income before loan impairment charges rose by 17 per cent on higher interest generated by the growth in credit card balances and a gain on the redemption of Visa shares. Operating costs grew by 12 per cent.
In Brazil, profit before tax grew by 111 per cent on higher income driven by balance sheet growth, partially offset by a decrease in fee income due to regulatory changes. Profit before tax also benefited from the refinement of the income recognition methodology in respect of long-term insurance contracts and a gain on redemption of Visa shares. A recovery of transactional taxes paid in earlier years and interest thereon increased interest income and resulted in lower operating expenses.
In Argentina, profit before tax grew by 116 per cent. Balance sheet growth drove an increase in net interest income which was partly offset by higher costs and loan impairment charges.
Net interest income rose by 17 per cent to US$2,376 million.
In Mexico, net interest income rose by 26 per cent, driven by higher balance sheet volumes and improved spreads. Despite a slowdown in credit card
sales, average loan balances continued to grow. Average total loans grew by 12 percentage points. Spreads widened by 417 basis points on personal loans and by 316 basis points on credit cards due to re-pricing initiatives implemented during the second half of 2007.
Average demand deposit balances rose by 7 per cent. Average balances of time deposits grew by 14 per cent, driven by competitive pricing. HSBC’s market share for deposits remained stable.
In Brazil, net interest rose by 9 per cent. A favourable economic scenario and increased household income drove higher consumption and demand for credit. As a result, vehicle finance loans increased by 39 per cent and payroll loans by 57 per cent. Average card balances grew by 25 per cent, following market growth and new deals on co-branded cards combined with marketing promotions to improve card usage. This was partially offset by a decrease of 3 per cent in personal instalment loans due to increased competition in the market.
Spreads widened on cards and overdrafts as a result of lower funding costs and repricing initiatives, in line with market trends, but narrowed on vehicle finance and payroll loans due to increased competition. Overall, spreads were lower, reflecting the business strategy of seeking reduced credit risk by focusing on secured loans.
Net interest income also increased as a result of a favourable court decision, which granted HSBC the right to recover transactional taxes paid in excess on insurance transactions, and interest accrued thereon.
In Argentina, net interest income grew by 69 per cent. Average loan volumes increased by 39 per cent as personal loans, credit cards and car loan balances all rose. These increases resulted from higher sales of pre-approved facilities, supported by a new credit policy for personal loans, and marketing campaigns. Spreads improved on car loans and overdrafts as a result of repricing initiatives. The overall spread on lending products narrowed by 28 basis points. The average term deposit portfolio increased by 11 per cent following several initiatives including improved incentives for staff in the branch network, the appointment of a number of Premier executives and the implementation of campaigns to support growth through the internet. The number of Premier customers increased by 30 per cent. The overall spread increased by 94 basis points.
Net fee income increased by 2 per cent to US$712 million, mainly in Mexico where fee income rose by 14 per cent. Credit card annual fees

81
increased by 29 per cent, reflecting an increase of almost 35,000 in the number of cards in force. Collection fees and late-payment fees increased following the application of stricter guidelines in June 2007. Income from deposit accounts continued to rise, as a result of an increase in membership fees and the introduction of a flexible pricing option. Income from e-channels rose by 6 per cent on higher usage.
In Brazil, fee income fell by 15 per cent, following a ruling by the Brazilian Central Bank removing certain fees, such as charges on early loan repayments and returned cheques. The effect was compounded by a lower number of transactions, which reduced current account fees, and the discontinuation of commission paid by the Brazilian social security agency for pension payment services. This was partly offset by a rise in pension administration fees and higher cards income driven by growth in cards in force.
In Argentina, net fee income decreased by 18 per cent, mainly because lower commissions were earned from the pension fund business following pension-related reform introduced by the government. Higher general insurance sales resulted in increased commissions paid. This was partially offset by higher commission income on vehicle loans and credit cards, reflecting volume growth.
Gains from financial investments increased by US$74 million, mainly because of a gain on redemption of Visa shares following the global IPO. Gains were recorded in Mexico (US$55 million), Panama (US$12 million), Brazil (US$11 million) and other Central American countries (US$5 million). Brazil also recorded a gain of US$16 million on the sale of shares in a local stock exchange. A gain of US$33 million on a similar sale of shares was registered in the first half of 2007.
Other operating income fell, mainly because, in the first half of 2007, results benefited from a one-off refinement of the income recognition methodology used in respect of long-term insurance contracts in Mexico. This was partially offset by a similar adjustment in Brazil in the first half of 2008 which resulted in a non-recurrent gain of US$45 million.
Net insurance premiums rose by 8 per cent to US$802 million. In Mexico, growth of 20 per cent was mainly driven by higher gross premiums on life and motor products. Sales of life products grew faster than non-life products due to an increased focus by HSBC on life insurance sales through the branch network and other distribution channels, in particular, the telemarketing of personal accident
insurance. In Brazil, net insurance premiums rose by 9 per cent. Pension-related business grew, driven by sales initiatives which generated organic growth in both regular and additional contributions.
In Argentina, insurance premium growth was driven by the general insurance business from a mixture of higher premiums and increased sales. Vehicle insurance products generated the largest increases, mainly because of higher prices. Overall, premium income on life insurance decreased due to the cessation of part of the business related to the pension fund portfolio as a consequence of changes in government legislation.
Loan impairment charges rose by 35 per cent, to US$1.1 billion. In Mexico, loan impairment charges rose by 76 per cent, largely from portfolio growth and higher delinquency in the credit card portfolio following HSBC’s targeted expansion in the market in previous years. The increase in loan impairment charges is a cost of building higher market share through organic growth in an area where HSBC was previously under-represented. Personal instalment loans also contributed to the increase in loan impairment charges.
Loan impairment charges in Brazil rose by 8 per cent, reflecting strong asset growth and higher delinquency levels in vehicle finance, and store loans which were partly offset by the gain on sale of an impaired loan portfolio. The impaired loan to total customer loans ratio, improved by 1.2 percentage points. Credit models were updated during the first half of 2008 to reflect recent underwriting experience and were supplemented by improved collection strategies.
In Argentina, growth in loan impairment charges of 68 per cent was driven by increased customer advances and higher delinquency levels on the consumer finance portfolio.
Operating expenses increased by 5 per cent to US$2.1 billion.
In Mexico, operating expenses grew by 12 per cent. Staff costs rose as a result of the annual salary review in earlier 2008, partly offset by lower staff numbers. Non-staff costs rose on the increased use of the cash-back facility on the Tu Cuenta product. This was partly offset by a decrease in contract personnel as a result of a refinement in asset growth strategy in the latter part of 2007.
In Brazil, expenses decreased by 5 per cent, as a result of the recognition of a tax credit related to a court decision granting the right to recover excess taxes paid on insurance transactions. Transactional taxes reduced further, due to the removal of tax on
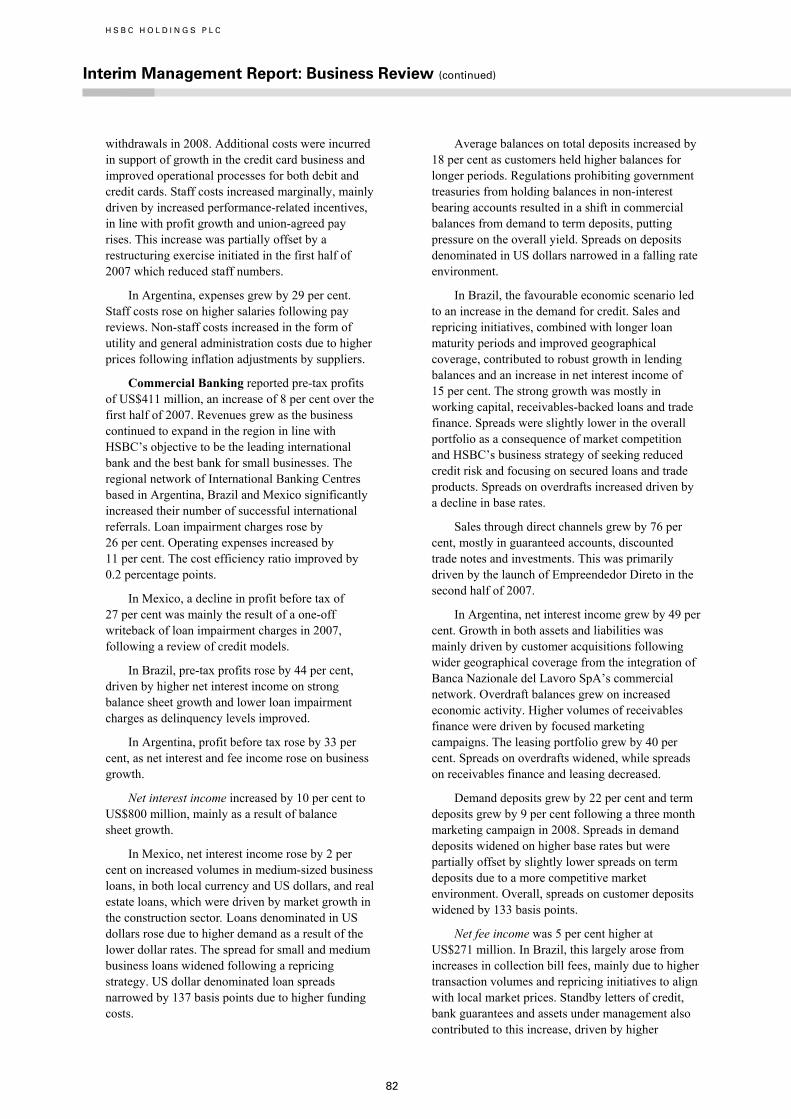
H S B C H O L D I N G S P L C
Interim Management Report: Business Review (continued)
82
withdrawals in 2008. Additional costs were incurred in support of growth in the credit card business and improved operational processes for both debit and credit cards. Staff costs increased marginally, mainly driven by increased performance-related incentives, in line with profit growth and union-agreed pay rises. This increase was partially offset by a restructuring exercise initiated in the first half of 2007 which reduced staff numbers.
In Argentina, expenses grew by 29 per cent. Staff costs rose on higher salaries following pay reviews. Non-staff costs increased in the form of utility and general administration costs due to higher prices following inflation adjustments by suppliers.
Commercial Banking reported pre-tax profits of US$411 million, an increase of 8 per cent over the first half of 2007. Revenues grew as the business continued to expand in the region in line with HSBC’s objective to be the leading international bank and the best bank for small businesses. The regional network of International Banking Centres based in Argentina, Brazil and Mexico significantly increased their number of successful international referrals. Loan impairment charges rose by 26 per cent. Operating expenses increased by 11 per cent. The cost efficiency ratio improved by 0.2 percentage points.
In Mexico, a decline in profit before tax of 27 per cent was mainly the result of a one-off writeback of loan impairment charges in 2007, following a review of credit models.
In Brazil, pre-tax profits rose by 44 per cent, driven by higher net interest income on strong balance sheet growth and lower loan impairment charges as delinquency levels improved.
In Argentina, profit before tax rose by 33 per cent, as net interest and fee income rose on business growth.
Net interest income increased by 10 per cent to US$800 million, mainly as a result of balance sheet growth.
In Mexico, net interest income rose by 2 per cent on increased volumes in medium-sized business loans, in both local currency and US dollars, and real estate loans, which were driven by market growth in the construction sector. Loans denominated in US dollars rose due to higher demand as a result of the lower dollar rates. The spread for small and medium business loans widened following a repricing strategy. US dollar denominated loan spreads narrowed by 137 basis points due to higher funding costs.
Average balances on total deposits increased by 18 per cent as customers held higher balances for longer periods. Regulations prohibiting government treasuries from holding balances in non-interest bearing accounts resulted in a shift in commercial balances from demand to term deposits, putting pressure on the overall yield. Spreads on deposits denominated in US dollars narrowed in a falling rate environment.
In Brazil, the favourable economic scenario led to an increase in the demand for credit. Sales and repricing initiatives, combined with longer loan maturity periods and improved geographical coverage, contributed to robust growth in lending balances and an increase in net interest income of 15 per cent. The strong growth was mostly in working capital, receivables-backed loans and trade finance. Spreads were slightly lower in the overall portfolio as a consequence of market competition and HSBC’s business strategy of seeking reduced credit risk and focusing on secured loans and trade products. Spreads on overdrafts increased driven by a decline in base rates.
Sales through direct channels grew by 76 per cent, mostly in guaranteed accounts, discounted trade notes and investments. This was primarily driven by the launch of Empreendedor Direto in the second half of 2007.
In Argentina, net interest income grew by 49 per cent. Growth in both assets and liabilities was mainly driven by customer acquisitions following wider geographical coverage from the integration of Banca Nazionale del Lavoro SpA’s commercial network. Overdraft balances grew on increased economic activity. Higher volumes of receivables finance were driven by focused marketing campaigns. The leasing portfolio grew by 40 per cent. Spreads on overdrafts widened, while spreads on receivables finance and leasing decreased.
Demand deposits grew by 22 per cent and term deposits grew by 9 per cent following a three month marketing campaign in 2008. Spreads in demand deposits widened on higher base rates but were partially offset by slightly lower spreads on term deposits due to a more competitive market environment. Overall, spreads on customer deposits widened by 133 basis points.
Net fee income was 5 per cent higher at US$271 million. In Brazil, this largely arose from increases in collection bill fees, mainly due to higher transaction volumes and repricing initiatives to align with local market prices. Standby letters of credit, bank guarantees and assets under management also contributed to this increase, driven by higher

83
volumes as the business focused on cross-sales using customer relationship management tools. These tools enabled relationship managers to offer suitable products to customers which were more in line with their particular banking preferences.
In Mexico, fee income decreased by 3 per cent. Increased usage by non-HSBC customers following the recent extension of the network drove an increase of 76 per cent in automated teller machine (‘ATM’) fees. Higher prices resulted in income growth on payments and cash management. These factors were offset by lower income on remittances, which fell in line with decreased volumes in the more competitive environment, coupled with the effects of the weakening US economy.
Higher fee income in Argentina was mainly due to increased account services commissions on greater customer activity and repricing of fees.
Trading income rose by 85 per cent to US$37 million, mainly in Brazil due to higher volumes of treasury products and spot foreign exchange deals which benefited from increased demand in the favourable economic conditions.
Loan impairment charges increased by 26 per cent to US$110 million due to higher loan impairment charges in Mexico, partially offset by lower ones Brazil.
In Mexico, higher loan impairment charges on commercial and real estate loans were mainly driven by organic growth in the portfolio. In 2007, net releases of loan allowances were reported in Mexico due to changes made to the credit models to more accurately represent the most recent behaviour in the underlying commercial loan portfolios. The risk profile of the loan portfolio remained stable during the first half of 2008.
In Brazil, loan impairment charges decreased by 18 per cent despite a 38 per cent growth in average lending balances. This was driven by improved delinquency levels in the small and medium enterprises segment and the absence of any new significant individual loan impairment charges in the current period.
Operating expenses increased by 11 per cent to US$643 million.
In Mexico, operating expenses increased by 10 per cent. Staff costs decreased as the effects of the annual salary review and higher performance-related compensation were offset by refinements in the allocation of statutory profit sharing compensation. Other operating expenses increased, primarily driven by higher operational losses.
Operating expenses in Brazil rose by 9 per cent. Staff costs grew as a result of higher remuneration and performance-related incentives aligned with business growth, and union-agreed pay rises. These factors were partly offset by lower headcount following business restructuring, resulting in increased efficiency. Other operating costs also grew due to higher litigation expenses, mainly driven by civil claims, and transactional taxes increased on higher volumes.
In Argentina, expenses increased by 65 per cent, mainly driven by higher indirect costs. Staff costs rose on following pay reviews in line with labour union agreements. Other costs also grew in the inflationary environment.
Global Banking and Markets reported a pre-tax profit of US$383 million, representing an increase of 36 per cent compared with the first half of 2007. In Mexico, pre-tax profits increased by 100 per cent, mainly as a result of higher net interest income. In Brazil, pre-tax profits grew by 12 per cent due to higher foreign exchange trading revenues. In Argentina, growth was driven by an increase in net interest income and foreign exchange trading income. The cost efficiency ratio for the region improved by 0.5 percentage points.
Total operating income rose by 33 per cent to US$726 million, mainly due to growth in foreign exchange trading in Brazil, reflecting the success of HSBC’s strategy to provide a wider product range with a focus on structured derivatives, particularly to Commercial Banking customers, and due to an increase in income earned in Balance Sheet Management.
In Mexico, pre-tax profits increased due to strong growth in net interest income as favourable market conditions led to a robust performance from Balance Sheet Management. Trading income declined, despite growth in foreign exchange, as the Mexican financial markets continued to exhibit low levels of volatility.
In Brazil, pre-tax profits were 12 per cent higher, due to strong growth in foreign exchange trading and an increase in securities services deposits as clients moved funds into Brazil for investment. A significant increase in operating expenses was due to an investment in new IT systems to support volume growth as well as growth in staff numbers as HSBC enhanced its capabilities, including the establishment of a new global research team.
In Argentina, pre-tax profits improved by 14 per cent. Higher revenues were driven by growth in net interest income and an increase in foreign exchange

H S B C H O L D I N G S P L C
Interim Management Report: Business Review (continued)
84
trading income due to market volatility. This was partly offset by higher operating expenses, driven by high levels of inflation, an increase in staff costs following labour union agreements.
Net interest income rose by 68 per cent to US$337 million, predominantly from growth in Mexico. Balance Sheet Management performed well, driven by favourable market conditions in Mexico and Argentina, due to an increase in balance sheet volumes and wider spreads. In addition, the strong equity markets in Brazil led to an increase in securities services deposits as clients moved funds into the country for investment.
Net fee income grew by 5 per cent to US$131 million, largely in Mexico where increased loan facility fees were driven by higher lending volumes. Fee income increased in securities services, partly in Brazil, as a result of the increase in deposits discussed above. The development of the retail equity trading platform in Brazil also contributed to the increase in fee income.
Trading income was 29 per cent higher at US$137 million, driven by solid growth in foreign exchange trading in Brazil, due to a wider product offering which was particularly targeted at Commercial Banking customers. In Mexico, trading income declined, despite growth in foreign exchange, as the Mexican financial markets continued to exhibit low volatility, resulting in challenging trading conditions. Trading income in Argentina increased as a result of strong performance in foreign exchange in the volatile markets.
Gains less losses from financial investments decreased by 25 per cent to US$45 million, due to a lower value of disposals in Mexico, Brazil and Argentina compared with the first half of 2007.
A small release of loan impairment charges was in line with the first half of 2007.
Operating expenses increased by 33 per cent to US$309 million. A significant rise in operating expenses in Brazil was partly caused by higher IT costs due to investment in new systems to support volume growth and automate processes on complex products. Staff numbers increased in Global Markets, as HSBC enhanced its customer proposition, including the establishment of a new global research team. Performance costs also rose in line with improved performance in Global Markets. Operating expenses in Argentina increased, mainly driven by an increase in staff costs following a labour union pay agreement. Other costs grew in the inflationary environment.
Private Banking reported a pre-tax profit of US$8 million, a decrease of 20 per cent. An improved performance in Brazil was offset by higher expenditure in the region. As a result, the cost efficiency ratio worsened by 9.6 percentage points to 78.4 per cent.
Revenues grew by 16 per cent to US$37 million, with improvements in both net interest income and fee income. Balance sheet growth across the region drove the 44 per cent increase in net interest income, while improvements in securities trading in Brazil underpinned the rise in net fee income. This was offset by lower brokerage fees in Mexico, however, due to a general slowdown in the market.
Client assets were US$12.6 billion, compared with US$11.6 billion at 31 December 2007, due to new product offerings in Brazil. Inward referrals from other customer groups contributed US$444 million to total client assets, flat when compared with the first half of 2007.
Operating expenses grew by 32 per cent to US$29 million, driven by a rise in staff costs to support business expansion and increased bonuses.
Amounts reported in Other were largely in line with the first half of 2007.
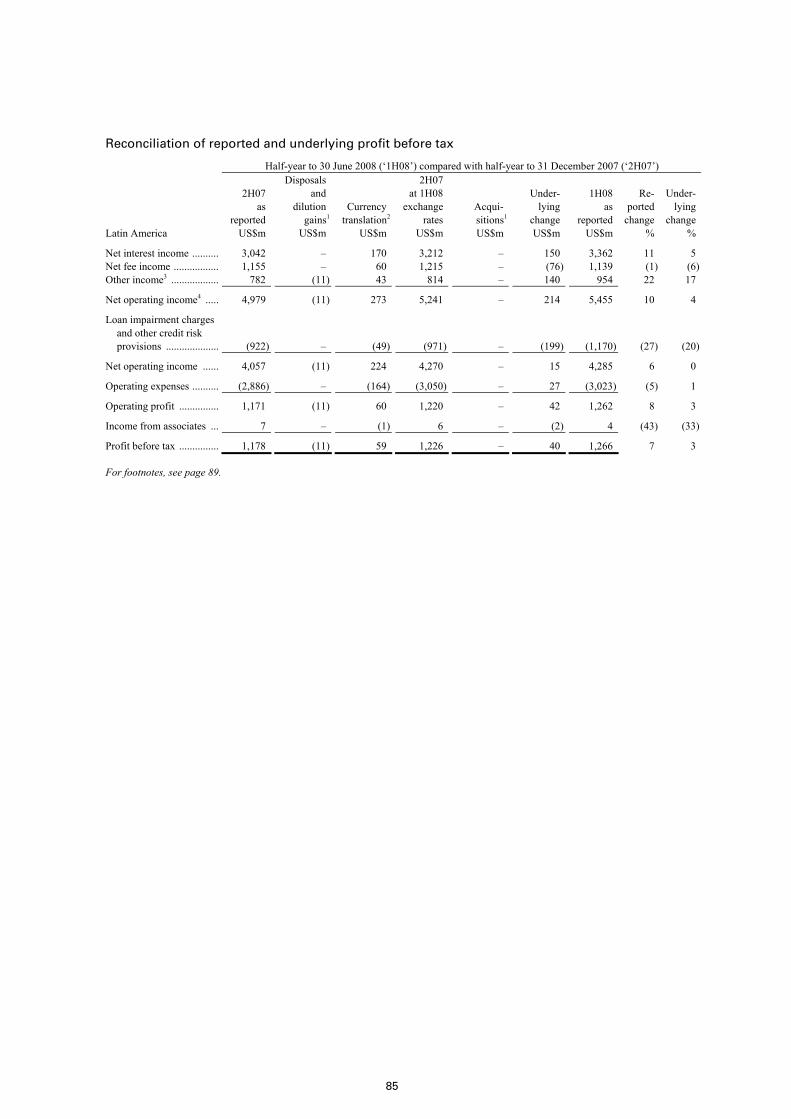
85
Reconciliation of reported and underlying profit before tax
Half-year to 30 June 2008 (‘1H08’) compared with half-year to 31 December 2007 (‘2H07’)
Latin America
2H07 as reported US$m
Disposals and dilution gains1
US$m
Currency translation2
US$m
2H07 at 1H08 exchange rates US$m
Acqui- sitions1
US$m
Under- lying change US$m
1H08 as reported US$m
Re- ported change %
Under- lying change %
Net interest income .......... 3,042 – 170 3,212 – 150 3,362 11 5 Net fee income ................. 1,155 – 60 1,215 – (76) 1,139 (1) (6)Other income3 .................. 782 (11) 43 814 – 140 954 22 17
Net operating income4 ..... 4,979 (11) 273 5,241 – 214 5,455 10 4
Loan impairment charges and other credit risk provisions .................... (922) – (49) (971) – (199) (1,170) (27) (20)
Net operating income ...... 4,057 (11) 224 4,270 – 15 4,285 6 0
Operating expenses .......... (2,886) – (164) (3,050) – 27 (3,023) (5) 1
Operating profit ............... 1,171 (11) 60 1,220 – 42 1,262 8 3
Income from associates ... 7 – (1) 6 – (2) 4 (43) (33)
Profit before tax ............... 1,178 (11) 59 1,226 – 40 1,266 7 3
For footnotes, see page 89.
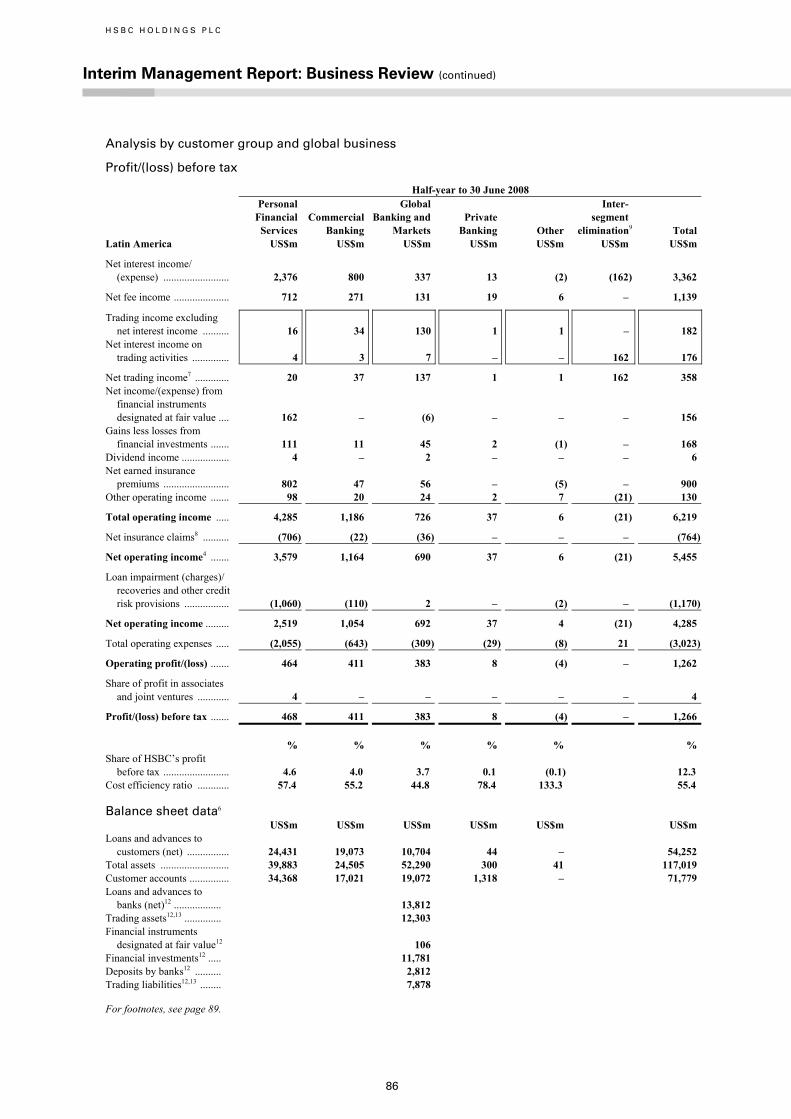
H S B C H O L D I N G S P L C
Interim Management Report: Business Review (continued)
86
Analysis by customer group and global business
Profit/(loss) before tax
Half-year to 30 June 2008
Latin America
Personal Financial Services US$m
Commercial Banking US$m
Global Banking and Markets US$m
Private Banking US$m
Other
US$m
Inter- segment elimination9 US$m
Total US$m
Net interest income/ (expense) ......................... 2,376 800 337 13 (2) (162) 3,362
Net fee income ..................... 712 271 131 19 6 – 1,139
Trading income excluding net interest income .......... 16 34 130 1 1 – 182
Net interest income on trading activities ..............
4
3 7 – – 162 176
Net trading income7 ............. 20 37 137 1 1 162 358 Net income/(expense) from
financial instruments designated at fair value .... 162 – (6) – – – 156
Gains less losses from financial investments ....... 111 11 45 2 (1) – 168
Dividend income .................. 4 – 2 – – – 6 Net earned insurance
premiums ......................... 802 47 56 – (5) – 900 Other operating income ....... 98 20 24 2 7 (21) 130
Total operating income ..... 4,285 1,186 726 37 6 (21) 6,219
Net insurance claims8 .......... (706) (22) (36) – – – (764)
Net operating income4 ....... 3,579 1,164 690 37 6 (21) 5,455
Loan impairment (charges)/ recoveries and other credit risk provisions ................. (1,060) (110) 2 – (2) – (1,170)
Net operating income ......... 2,519 1,054 692 37 4 (21) 4,285
Total operating expenses ..... (2,055) (643) (309) (29) (8) 21 (3,023)
Operating profit/(loss) ....... 464 411 383 8 (4) – 1,262
Share of profit in associates and joint ventures ............ 4 – – – – – 4
Profit/(loss) before tax ....... 468 411 383 8 (4) – 1,266 % % % % % %Share of HSBC’s profit
before tax ......................... 4.6 4.0 3.7 0.1 (0.1) 12.3 Cost efficiency ratio ............ 57.4 55.2 44.8 78.4 133.3 55.4 Balance sheet data6 US$m US$m US$m US$m US$m US$mLoans and advances to
customers (net) ................ 24,431 19,073 10,704 44 – 54,252 Total assets .......................... 39,883 24,505 52,290 300 41 117,019 Customer accounts ............... 34,368 17,021 19,072 1,318 – 71,779 Loans and advances to
banks (net)12 .................. 13,812 Trading assets12,13 .............. 12,303 Financial instruments
designated at fair value12 106 Financial investments12 ..... 11,781 Deposits by banks12 .......... 2,812 Trading liabilities12,13 ........ 7,878
For footnotes, see page 89.

87
Profit/(loss) before tax
Half-year to 30 June 2007
Latin America
Personal Financial Services US$m
Commercial Banking US$m
Global Banking and Markets US$m
Private Banking US$m
Other
US$m
Inter- segment elimination9 US$m
Total US$m
Net interest income............... 1,821 656 181 8 1 (133) 2,534
Net fee income ..................... 636 234 109 16 3 – 998
Trading income/(expense) excluding net interest income ............................. 32 17 83 1 (1) – 132
Net interest income on trading activities .............. 6 1 13 – – 133 153
Net trading income/ (expense)7 ........................ 38 18 96 1 (1) 133 285
Net income from financial instruments designated at fair value ...................... 153 – 4 – – – 157
Gains less losses from financial investments ....... 30 13 55 – – – 98
Dividend income .................. 4 1 1 – – – 6 Net earned insurance
premiums ......................... 658 32 41 – – – 731 Other operating income ....... 134 12 8 4 8 (13) 153
Total operating income ........ 3,474 966 495 29 11 (13) 4,962
Net insurance claims8 .......... (626) (17) (33) – – – (676)
Net operating income4 ......... 2,848 949 462 29 11 (13) 4,286
Loan impairment (charges)/ recoveries and other credit risk provisions ................. (701) (74) 2 – (2) – (775)
Net operating income .......... 2,147 875 464 29 9 (13) 3,511
Total operating expenses ..... (1,764) (523) (211) (19) (12) 13 (2,516)
Operating profit/(loss) ......... 383 352 253 10 (3) – 995
Share of profit in associates and joint ventures ............ 5 – – – – – 5
Profit/(loss) before tax ......... 388 352 253 10 (3) – 1,000 % % % % % %Share of HSBC’s profit
before tax ......................... 2.7 2.5 1.8 0.1 – 7.1 Cost efficiency ratio ............ 61.9 55.1 45.7 65.5 109.1 58.7 Balance sheet data6 US$m US$m US$m US$m US$m US$mLoans and advances to
customers (net) ................ 19,529 12,744 8,306 27 – 40,606 Total assets .......................... 32,024 17,520 39,260 96 25 88,925 Customer accounts ............... 26,195 14,546 13,778 511 219 55,249 Loans and advances to
banks (net)12 .................. 10,625 Trading assets12,13 .............. 9,541 Financial instruments
designated at fair value12 199 Financial investments12 ..... 9,163 Deposits by banks12 .......... 2,862 Trading liabilities12,13 ........ 6,609
For footnotes, see page 89.

H S B C H O L D I N G S P L C
Interim Management Report: Business Review (continued)
88
Analysis by customer group and global business (continued)
Profit/(loss) before tax
Half-year to 31 December 2007
Latin America
Personal Financial Services US$m
Commercial Banking US$m
Global Banking and Markets US$m
Private Banking US$m
Other
US$m
Inter- segment elimination9 US$m
Total US$m
Net interest income .............. 2,162 751 229 12 2 (114) 3,042
Net fee income ..................... 736 251 141 24 3 – 1,155
Trading income excluding net interest income .......... 35 22 81 1 1 – 140
Net interest income on trading activities .............. 4 – 5 – – 114 123
Net trading income7 ............. 39 22 86 1 1 114 263Net income from financial
instruments designated at fair value ...................... 161 – 2 – – – 163
Gains less losses from financial investments ....... 90 38 27 1 (1) – 155
Gains arising from dilution of interests in associates .. – – – – 11 – 11
Dividend income .................. 1 1 1 – – – 3Net earned insurance
premiums ......................... 790 34 39 – – – 863Other operating income ........ 11 57 23 4 4 (24) 75
Total operating income ........ 3,990 1,154 548 42 20 (24) 5,730
Net insurance claims8 .......... (704) (20) (27) – – – (751)
Net operating income4 ......... 3,286 1,134 521 42 20 (24) 4,979
Loan impairment (charges)/ recoveries and other credit risk provisions ................. (791) (138) 11 – (4) – (922)
Net operating income .......... 2,495 996 532 42 16 (24) 4,057
Total operating expenses ..... (1,994) (609) (270) (27) (10) 24 (2,886)
Operating profit ................... 501 387 262 15 6 – 1,171
Share of profit in associates and joint ventures ............ 4 1 2 – – – 7
Profit before tax ................... 505 388 264 15 6 – 1,178 % % % % % %Share of HSBC’s profit
before tax ......................... 5.0 3.9 2.6 0.1 0.1 11.7Cost efficiency ratio ............ 60.7 53.7 51.8 64.3 50.0 58.0 Balance sheet data6 US$m US$m US$m US$m US$m US$mLoans and advances to
customers (net) ................ 21,680 16,243 9,935 65 – 47,923 Total assets .......................... 34,829 20,928 43,012 260 27 99,056 Customer accounts ............... 30,628 15,524 13,950 1,190 – 61,292 Loans and advances to
banks (net)12 ..................
10,339
Trading assets12,13 .............. 10,384 Financial instruments
designated at fair value12 225 Financial investments12 ..... 10,155 Deposits by banks12 .......... 2,830 Trading liabilities12,13 ........ 6,984
For footnotes, see page 89.

89
Footnotes to the Business Review
The footnotes below refer to the reconciliations of reported and underlying profit before tax, and the analyses of customer groups and global businesses on pages 13 to 27 and the geographical regions on pages 28 to 89.
1 Columns headed ‘Acquisitions’ and, in 2007, ‘Disposals and dilution gains’, comprise the net increment or decrement in profits in the current half-year (compared with the previous half-years) which are attributable to acquisitions or disposals of subsidiaries made, or dilution gains, in the relevant periods. Acquisitions and disposals are determined based on the review and analysis of the events in each period.
2 ‘Currency translation’ is the effect of translating the results of subsidiaries and associates for the previous half-years at the average rates of exchange applicable in the current half-year.
3 Other income in this context comprises net trading income (see 7 below), net income from financial instruments designated at fair value, gains less losses from financial investments, gains arising from dilution of interests in associates, dividend income, net earned insurance premiums and other operating income less net insurance claims incurred and investment in liabilities to policyholders.
4 Net operating income before loan impairment charges and other credit risk provisions. 5 The main items reported under ‘Other’ are certain property activities, unallocated investment activities including hsbc.com, centrally
held investment companies, gains arising from the dilution of interests in associates, movements in the fair value of own debt designated at fair value (the rest of the Group’s debt is included in Global Banking and Markets), and HSBC’s holding company and financing operations. The results also include net interest earned on free capital held centrally, operating costs incurred by the head office operations in providing stewardship and central management services to HSBC, and costs incurred by the Group Service Centres and Shared Service Organisations and associated recoveries. At 30 June 2008, gains arising from the dilution of interests in associates were nil (first half of 2007: US$1.076 million; second half of 2007: US$16 million) and fair value gains on HSBC’s debt designated at fair value were US$749 million (first half of 2007: US$84 million; second half of 2007: US$2,909 million).
6 Third party only. 7 In the customer group analyses, net trading income comprises all gains and losses from changes in the fair value of financial assets
and financial liabilities classified as held for trading, together with related external and internal interest income and interest expense, and dividends received; in the statutory presentation internal interest income and expense are eliminated.
8 Net insurance claims incurred and movement in liabilities to policyholders. 9 Inter-segment elimination comprises (i) the costs of shared services and Group Service Centres included within ‘Other’ which are
recovered from customer groups, and (ii) the intra-segment funding costs of trading activities undertaken within Global Banking and Markets. HSBC’s balance sheet management business reported within Global Banking and Markets, provides funding to the trading businesses. To report Global Banking and Markets’ net trading income on a fully funded basis, net interest income and net interest income/(expense) on trading activities are grossed up to reflect internal funding transactions prior to their elimination in the inter-segment column.
10 ‘Equities’ includes a total gain of US$107 million in the first half of 2007 from the disposal of HSBC’s investments in Euronext N.V. and the Montreal Exchange.
11 ‘Other’ in Global Banking and Markets includes net interest earned on free capital held in the global business not assigned to products.
12 Assets and liabilities which were significant to Global Banking and Markets. 13 Trading assets and trading liabilities include derivatives. 14 Global Banking and Markets in Europe includes venture capital gains of US$187 million in the first half of 2008 (US$548 million in
the first half of 2007: US$443 million in the second half of 2007). 15 France primarily comprises the domestic operations of HSBC France and the Paris branch of HSBC Bank plc. 16 Trading assets, financial instruments designated at fair value and financial investments held in Europe, and by Global Banking and
Markets in North America, include financial assets which may be repledged or resold by counterparties.

H S B C H O L D I N G S P L C
Interim Management Report: Financial Review
90
Income statement
Half-year to
30 June2008
US$m
30 June 2007
US$m
31 December2007
US$m
Interest income ................................................................................................ 47,164 43,567 48,792Interest expense ............................................................................................... (25,986) (25,337) (29,227)
Net interest income .......................................................................................... 21,178 18,230 19,565
Fee income ....................................................................................................... 13,381 12,488 13,849Fee expense ...................................................................................................... (2,390) (1,993) (2,342)
Net fee income ................................................................................................. 10,991 10,495 11,507
Trading income excluding net interest income ............................................... 639 3,351 1,107Net interest income on trading activities ......................................................... 3,195 2,160 3,216
Net trading income .......................................................................................... 3,834 5,511 4,323
Net income/(expense) from financial instruments designated at fair value ... (584) 874 3,209 Gains less losses from financial investments .................................................. 817 999 957 Gains arising from dilution of interests in associates ..................................... – 1,076 16 Dividend income .............................................................................................. 88 252 72 Net earned insurance premiums ...................................................................... 5,153 3,977 5,099 Other operating income ................................................................................... 1,435 678 761
Total operating income ................................................................................. 42,912 42,092 45,509
Net insurance claims incurred and movement in liabilities to policyholders ......................................................................................... (3,437) (3,599) (5,009)
Net operating income before loan impairment charges and other credit risk provisions ................................................................................ 39,475 38,493 40,500
Loan impairment charges and other credit risk provisions ............................. (10,058) (6,346) (10,896)
Net operating income .................................................................................... 29,417 32,147 29,604
Employee compensation and benefits ............................................................. (10,925) (10,430) (10,904)General and administrative expenses .............................................................. (7,479) (7,022) (8,272)Depreciation of property, plant and equipment ............................................... (863) (817) (897)Amortisation and impairment of intangible assets .......................................... (346) (342) (358)Goodwill impairment ....................................................................................... (527) – –
Total operating expenses ............................................................................... (20,140) (18,611) (20,431)
Operating profit ............................................................................................. 9,277 13,536 9,173
Share of profit in associates and joint ventures ............................................... 970 623 880
Profit before tax ............................................................................................. 10,247 14,159 10,053
Tax expense ..................................................................................................... (1,941) (2,645) (1,112)
Profit for the period ....................................................................................... 8,306 11,514 8,941 Profit attributable to shareholders of the parent company .............................. 7,722 10,895 8,238 Profit attributable to minority interests ........................................................... 584 619 703
In the first half of 2008, a period marked by significant declines in profitability throughout much of the banking industry in the most difficult financial markets for decades, HSBC produced a pre-tax profit of US$10.2 billion which, although 28 per cent lower than in the first half of 2007, demonstrated the strength and resilience of the Group’s diversified business model in troubled times. On an underlying basis pre-tax profit was 25 per cent lower.
Results in the first half of 2007 benefited from US$1.1 billion of one-off dilution gains arising on shares issued by the Group’s mainland China
associates: Industrial Bank, Ping An Insurance and Bank of Communications. This translated into a benefit to earnings per share of US$0.09. In the first half of 2008, results incorporated a non-cash pre- and post-tax impairment charge of US$527 million in North America Personal Financial Services. This represented US$0.04 per share.
During this period, HSBC remained profitable in all customer groups, most notably considering the market turmoil, Global Banking and Markets. In Commercial Banking and Private Banking, profits reached new heights for a six-month period, as they

91
did in the developing markets operations of both Personal Financial Services and Global Banking and Markets. The Group also remained profitable in all geographical regions with the continuing exception of North America, where the consumer finance business remained heavily affected by the deepening housing market weakness and general economic slowdown. In addition, Global Banking and Markets suffered further credit turmoil-related write-downs on trading exposures and leveraged loans.
These continuing areas of weakness contrasted with the very strong financial performance across most developing markets businesses, which was augmented by significant improvements in profitability in the European businesses, which achieved good revenue growth without substantially adding to costs.
Changes in the composition of the Group in this period were modest with the only major transaction being the acquisition of the assets, liabilities and operations of The Chinese Bank in Taiwan, which was completed in March. The sale of the regional bank network in France to Banque Populaire announced in February was completed on 2 July 2008 and a gain of US$2.1 billion will be recorded in second half results.
Earnings per share declined by 32 per cent to US$0.65, with return on shareholders’ equity below 15 per cent. HSBC’s capital ratios remained strong, with a tier one capital ratio of 8.8 per cent on a Basel II basis.
Revenues increased by US$982 million, or 3 per cent, affected significantly by the drag from the deterioration in credit quality in the US consumer finance business and write-downs in Global Banking and Markets of US$3.9 billion. Cost growth of US$1.5 billion, or 8 per cent, was slower than that reported in the first half of 2007, and primarily reflected action taken to remove costs from the underperforming US businesses. The Group’s retail deposit and lending businesses, both personal and commercial, contributed strongly to revenue growth, delivering increases in net interest income and fee income of 9 per cent and 5 per cent, respectively, despite margin pressure on certain deposit products due to sharp declines in interest rates in the US and Hong Kong.
Within Global Banking and Markets’ emerging markets businesses, in addition to the strong revenue growth in foreign exchange and transaction banking, Balance Sheet Management recovered strongly.
Geographically, the share of profits from Hong Kong, the Rest of Asia-Pacific region and Latin America grew to 78 per cent of total Group profits.
In Europe, profit before tax rose by 28 per cent, with strong performances in Commercial Banking, Personal Financial Services and Private Banking. These offset credit-related write-downs which held back Global Banking and Markets, despite the good performance of Balance Sheet Management, foreign exchange and the Rates business. Operating expenses benefited from the suspension of ex gratia payments for UK overdraft fees pending legal proceedings. Gains were recorded on the sale of MasterCard shares and the disposal of the UK merchant acquiring business, and from fair value gains on certain portions of the Group’s own debt. Despite deterioration in the outlook for the UK economy, credit conditions remained stable with loan impairment charges declining, partly offset by a rise in Turkey.
Pre-tax profits from HSBC’s operations in Hong Kong of US$3.1 billion were, however, lower than the US$3.3 billion reported in the first half of 2007, a decrease of 8 per cent due to the impairment of certain of HSBC’s strategic investments in the Asian region as stock markets declined. In the opinion of HSBC management, these stakes continue to deliver the market access envisaged when they were acquired.
Pre-tax profits grew in Commercial Banking and Personal Financial Services despite the adverse effects of lower interest rates on deposit spreads, driven by strong balance sheet growth through customer acquisition and new product offerings. Strong performance in Global Banking and Markets was driven by increased income from Balance Sheet Management, as falling interest rates led to a lower cost of funds and a steeper yield curve, partially offset by write-downs on exposure to monoline insurers. In Private Banking, pre-tax profits fell, largely due to a decline in the value of equities on the Hong Kong stock market compared with the first half of 2007.
Operations in the Rest of Asia-Pacific region reported a pre-tax profit of US$3.6 billion compared with US$3.3 billion in the first half of 2007, an increase of 8 per cent. In the first half of 2007, HSBC recognised non-recurring gains of US$1.1 billion following share offerings made by HSBC associates Ping An Insurance, Bank of Communications and Industrial Bank. Excluding these dilution gains, profit before tax increased by 49 per cent on an underlying basis.
H S B C H O L D I N G S P L C
Interim Management Report: Financial Review (continued)
92
In North America, profitability declined by US$5.3 billion to reflect a pre-tax loss of US$2.9 billion, due to a rise in loan impairment charges in Personal Financial Services and credit-related write-downs in Global Banking and Markets which exceeded the savings in operating costs instigated by management. The ongoing restriction in credit availability in the US economy resulted in an acceleration in house price declines as refinancing opportunities remained limited. Unemployment increased and personal bankruptcies rose, resulting in a widening of the credit quality deterioration that, in 2007, had been concentrated in sub-prime mortgage portfolios. Where foreclosures could not be avoided, losses rose due to the decline in property values. The Commercial Banking business was also affected by spread compression on its deposit-taking business, and a rise in loan impairments due to provisioning for the weaker economic outlook.
In Latin America, pre-tax profits rose by 27 per cent, driven by Commercial Banking, where HSBC continued to use its international banking connections to expand trade finance and cross-border referrals, and Global Banking and Markets, which
benefited from strong growth in foreign exchange and Balance Sheet Management revenues. Personal Financial Services profit before tax increased on balance sheet expansion and from a number of one-off gains, partly offset by rising loan impairment charges on credit cards in Mexico as the portfolio matured.
Outside Asia, insurance operations, whose results are reported mainly in Personal Financial Services and Commercial Banking, continued to increase their contribution to the Group’s results. In Asia, impairments booked against certain investments and declines in insurance assets due to weaker equity markets exceeded the contribution from associates.
HSBC’s strategy of using investment stakes where appropriate to increase exposure in fast growing markets, particularly mainland China, made a material contribution to Group’s results as the share of profit in associates increased by 56 per cent to US$970 million.
Net interest income
Half-year to 30 June 2008 30 June 2007 31 December 2007 US$m % US$m % US$m % By geographical region Europe ...................................................... 4,475 21.1 3,920 21.5 3,826 19.6 Hong Kong .............................................. 2,835 13.4 2,568 14.1 2,915 14.9 Rest of Asia-Pacific ................................. 2,633 12.4 1,901 10.4 2,242 11.5 North America ......................................... 7,873 37.2 7,307 40.1 7,540 38.5 Latin America .......................................... 3,362 15.9 2,534 13.9 3,042 15.5
Net interest income .................................. 21,178 100.0 18,230 100.0 19,565 100.0
Half-year to 30 June
2008 30 June
2007 31 December
2007 US$m US$m US$m
Net interest income .......................................................................................... 21,178 18,230 19,565 Average interest-earning assets ....................................................................... 1,420,288 1,230,903 1,361,428
% % %
Gross interest yield1 ......................................................................................... 6.68 7.14 7.11 Net interest spread2 .......................................................................................... 3.03 2.93 2.80 Net interest margin3 ......................................................................................... 3.00 2.99 2.85
1 Gross interest yield is the average annualised interest rate earned on average interest-earning assets (‘AIEA’). 2 Net interest spread is the difference between the average annualised interest rate earned on AIEA, net of amortised premiums and loan
fees, and the average annualised interest rate payable on average interest-bearing funds. 3 Net interest margin is net interest income expressed as an annualised percentage of AIEA.
93
Net interest income of US$21.2 billion was 16 per cent higher than in the first half of 2007, 12 per cent higher on an underlying basis. The commentary below is on an underlying basis.
Movements in net interest income were particularly influenced by the following factors:
• turmoil in global credit markets and significant corrections to equity markets since August 2007 drove companies and individuals to shield their assets from the worst effects of the disruption. Consequently HSBC, with its strong capital base, succeeded in attracting US$17 billion of deposits in the period;
• lower average interest rates across many of the major economies of the world, as central banks cut base rates to mitigate the effects of the US house market correction and the related credit crisis;
• as interest rates fell, yield curves steepened and this, together with an increase in surplus funds following the rise in deposits noted above, led to higher Balance Sheet Management revenues;
• an expansion in the Group’s trading activities led to a higher cost of funding this business. Net interest income includes the cost of funding trading assets, while the related external revenues are reported in trading income; and
• growth in commercial lending, in particular, to the mid-market segment with strongest growth in the Asia-Pacific region and in Latin America.
In Europe, net interest income increased by 7 per cent to US$4.5 billion, notwithstanding a 28 per cent rise in the funding costs of trading activities. In Global Banking and Markets, recent interest rate reductions in the US and Europe lowered funding costs which, together with a steeper yield curve, underpinned a tripling of Balance Sheet Management revenues. Payments and cash management net interest income increased by 8 per cent as customers sought a safe haven for their sterling funds. In Switzerland, net interest income in Private Banking rose strongly as clients switched funds from investment products to deposits as equity markets weakened. Net interest income in both Personal Financial Services and Commercial Banking was broadly in line with the first half of 2007. However, branch expansion and the resulting customer acquisition in Turkey drove higher average lending and deposit balances and increased net interest income.
Net interest income in Hong Kong of US$2.8 billion was 10 per cent higher than in
the first half of 2007. Higher Balance Sheet Management revenues were the primary driver of a rise in net interest income in Global Banking and Markets. Significant and deep cuts to interest rates in the US, which were followed in Hong Kong, resulted in lower funding costs and a steeper yield curve, providing increased opportunities to deploy a larger surplus pool of funds from higher deposits in the retail businesses. Net interest income in Global Banking and Markets was further boosted by a widening of lending spreads as the business took advantage of a more conservative lending environment to increase spreads.
In Personal Financial Services, a focus on Premier and the increasing attractiveness of deposits over equity investments helped to drive a rise in savings balances and a 6 per cent increase in net interest income. In Commercial Banking, net interest income rose by 6 per cent due to higher liability balances following several targeted marketing campaigns, partly offset by lower deposit spreads in the declining rate environment.
Net interest income was 32 per cent higher in Rest of Asia-Pacific. Lower funding costs in Global Banking and Markets drove a significant increase in Balance Sheet Management revenues for the reasons noted above. Strong economic growth stimulated a strong increase in lending balances in the Middle East, generating higher net interest income. In Personal Financial Services, growth in cards and personal lending, together with higher spreads on these asset products following lower cost of funds, generated increased revenue. In Commercial Banking, a rise in deposit volumes was the primary cause of higher net interest income as HSBC continued to focus on organic growth in the region.
In North America, net interest income rose by 7 per cent. This was largely due to a rebound in Balance Sheet Management.
In Personal Financial Services, net interest income was broadly in line with the first half of 2007, as the effect of lower balances as HSBC reduced the size of the consumer lending business, curtailed marketing and the ongoing running down of the mortgage services portfolio was offset by increased spreads as the cost of funds fell in the declining rate environment. In Commercial Banking, net interest income was also broadly unchanged as higher loan and deposit volumes driven by organic growth was offset by tighter deposit spreads as base rates declined.
Net interest income in Latin America of US$3.4 billion was 19 per cent higher than in
H S B C H O L D I N G S P L C
Interim Management Report: Financial Review (continued)
94
the first half of 2007, largely driven by organic lending and deposit growth throughout the region, particularly in Personal Financial Services where net interest income rose by 17 per cent.
Growth in average Personal Financial Services asset balances in the region was driven by credit card sales in Mexico, albeit at a slower rate than in recent years, and by strong demand for credit in Brazil’s buoyant economy. Deposit balances were boosted by competitive pricing in Mexico. The benefit of balance sheet growth was augmented by improved asset spreads. In Global Banking and Markets, higher net interest income was driven by balance
sheet management in Mexico. Net interest income in Commercial Banking rose by 10 per cent to US$800 million, largely due to increased lending volumes in Mexico, particularly in the real estate sector, and in Brazil from sales and pricing initiatives.
Average interest-earning assets of US$1,420 billion were US$189 billion higher than in the first half of 2007, while HSBC’s net interest margin was broadly unchanged. Net free funds declined as a higher proportion of assets were deployed to trading activities.
Net fee income
Half-year to 30 June 2008 30 June 2007 31 December 2007 US$m % US$m % US$m % By geographical region Europe ...................................................... 4,223 38.4 4,144 39.5 4,287 37.3 Hong Kong .............................................. 1,469 13.4 1,439 13.7 1,923 16.7 Rest of Asia-Pacific ................................. 1,338 12.1 1,010 9.6 1,236 10.7 North America ......................................... 2,822 25.7 2,904 27.7 2,906 25.3 Latin America .......................................... 1,139 10.4 998 9.5 1,155 10.0
Net fee income ......................................... 10,991 100.0 10,495 100.0 11,507 100.0 Half-year to
30 June2008
US$m
30 June 2007
US$m
31 December2007
US$m
Cards ................................................................................................................ 3,089 3,092 3,404 Account services .............................................................................................. 2,260 1,961 2,398 Funds under management ................................................................................ 1,572 1,390 1,585 Broking income ............................................................................................... 954 928 1,084 Insurance .......................................................................................................... 942 804 1,032 Global custody ................................................................................................. 757 557 847 Credit facilities ................................................................................................ 639 672 466 Imports/exports ................................................................................................ 496 407 459 Unit trusts ........................................................................................................ 337 420 455 Remittances ..................................................................................................... 307 273 283 Corporate finance ............................................................................................ 232 220 189 Underwriting .................................................................................................... 204 196 171 Trust income .................................................................................................... 164 146 153 Taxpayer financial services ............................................................................. 154 234 18 Maintenance income on operating leases ........................................................ 70 69 70 Mortgage servicing .......................................................................................... 56 53 56 Other ................................................................................................................ 1,148 1,066 1,179
Total fee income .............................................................................................. 13,381 12,488 13,849
Less: fee expense ............................................................................................. (2,390) (1,993) (2,342)
Net fee income ................................................................................................. 10,991 10,495 11,507
Net fee income increased by 5 per cent to US$11.0 billion, 1 per cent on an underlying basis. The commentary that follows is on an underlying basis.
• Card fee income decreased overall due to a substantial fall in income in the consumer
finance business in the US. This decline resulted from changes in fee billing arrangements implemented in the latter part of 2007 and early 2008 to improve the customer proposition. Measures included the curtailment of the over-limit fee and enhanced billing practices. The
95
decrease more than offset increased income in other countries, mainly in Mexico and the UK.
• Although the buoyant stock market performance in Hong Kong peaked in October 2007, trading volumes in the first half of 2008 were still higher than those recorded in the comparative period in 2007. Customer appetite for investment services in Asia and the Middle East drove higher income from broking services, securities services and funds under management. Despite stock market volatility, the sale of investment products rose as customers increasingly chose structured products.
In Europe, net fee income decreased by 4 per cent. In France, fee income decreased as the regional banks were reclassified as held for sale and their income was recorded in other operating income. Fees payable increased in the UK on brokerage, stock borrowing and lending and on cards, driven by increased transaction volumes. Card-generated income increased, mainly in the UK and Turkey, on higher transaction volumes and portfolio growth. Interchange and acquiring income increased on higher transaction volumes in the UK, while a significant rise in cash advance turnover in Turkey also resulted in higher income. The benefits offered as part of the Plus account in the UK resulted in a migration from non-fee paying current accounts to the Plus account, contributing to higher income from account services.
In Hong Kong, fee income rose by 2 per cent, mainly driven by business growth in the region. The number of cards in circulation grew over the comparable period in 2007 as the Group maintained its leadership position in Hong Kong and continued to be innovative in this category with the launch of the Green Credit Card. Stock market activity during the current period was higher than in the first half of 2007, resulting in increased income from broking services, securities services and funds under management. HSBC actively marketed its investment products through targeted programmes and incentives and introduced a portfolio wealth
management sales tool in the second half of 2007. In the insurance business, sales of the Life Invest protection plan increased significantly. Higher account services fee income was generated on bundled products, mainly on PowerVantage. Unit trust income decreased due to less favourable US equity market conditions.
In Rest of Asia-Pacific, fee income increased by 26 per cent. Cards fee income rose strongly across the region driven by growth in the number of cards in circulation, balances and card usage. Income from funds under management increased, particularly in Singapore and Japan. Increased economic activity in the Middle East resulted in higher income. The region registered strong sales of investment products and higher fees from cards and trade-related lending fees. Income on insurance and securities services also grew.
In North America, fee income fell by 2 per cent. In the consumer finance business, income fell on credit cards due to changes in fee billing arrangements implemented to improve the customer proposition. Insurance fee income rose as more customers took up the debt protection enhancement service on credit cards. Underwriting income grew on a number of transactions including the Visa IPO. The previously announced decision to stop offering pre-season funding loans based on the previous year’s tax return led to lower fee income in Taxpayer Financial Services.
In Latin America, fee income increased by 4 per cent. Card fee income rose, mainly in Mexico on a higher number of cards in force and higher collection and late payment fees, mainly due to the application of stricter guidelines and higher fees charged. Income from deposit accounts continued to rise, driven by an increase in membership fees. In Brazil, a ruling by the Central Bank removing certain fees, such as charges on early loan repayments and returned cheques and the discontinuation of commissions paid by the Brazilian social security agency for pension payment services negatively affected revenues.
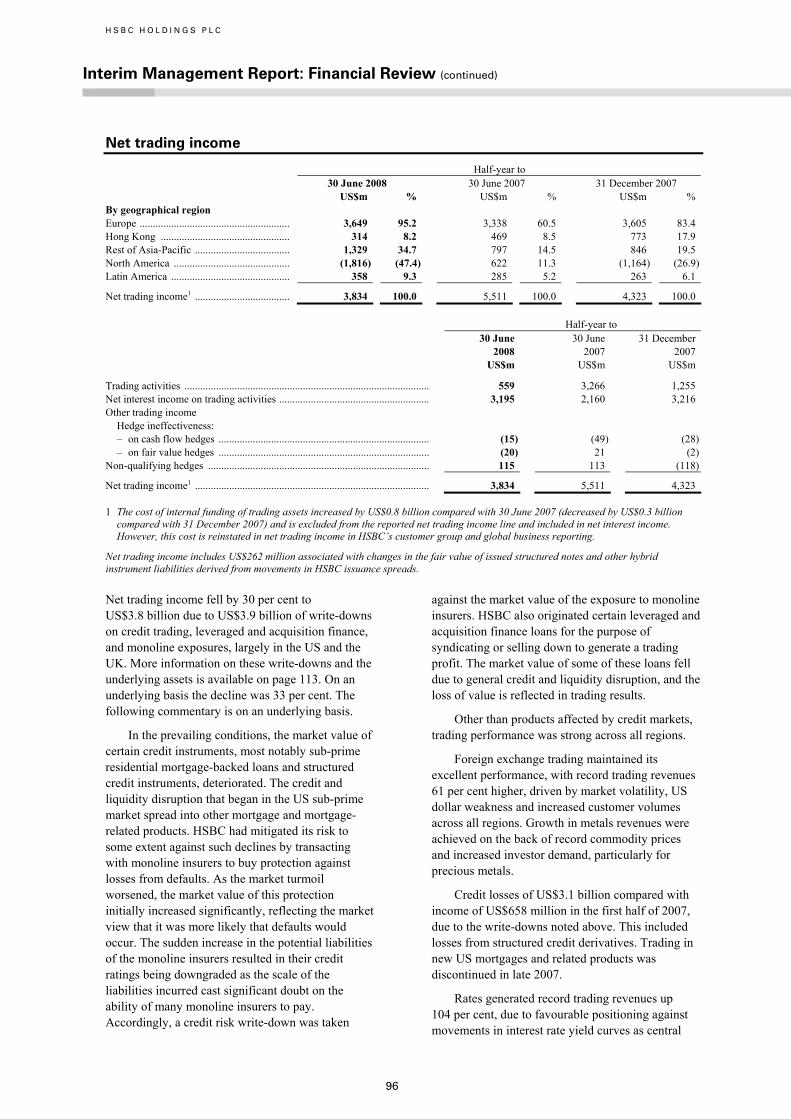
H S B C H O L D I N G S P L C
Interim Management Report: Financial Review (continued)
96
Net trading income
Half-year to 30 June 2008 30 June 2007 31 December 2007
US$m % US$m % US$m % By geographical region Europe ......................................................... 3,649 95.2 3,338 60.5 3,605 83.4 Hong Kong ................................................. 314 8.2 469 8.5 773 17.9 Rest of Asia-Pacific .................................... 1,329 34.7 797 14.5 846 19.5 North America ............................................ (1,816) (47.4) 622 11.3 (1,164) (26.9)Latin America ............................................. 358 9.3 285 5.2 263 6.1
Net trading income1 .................................... 3,834 100.0 5,511 100.0 4,323 100.0 Half-year to 30 June
2008 US$m
30 June 2007 US$m
31 December 2007 US$m
Trading activities ............................................................................................. 559 3,266 1,255 Net interest income on trading activities ......................................................... 3,195 2,160 3,216 Other trading income
Hedge ineffectiveness: – on cash flow hedges ................................................................................ (15) (49) (28)– on fair value hedges ................................................................................ (20) 21 (2)
Non-qualifying hedges .................................................................................... 115 113 (118)
Net trading income1 ......................................................................................... 3,834 5,511 4,323
1 The cost of internal funding of trading assets increased by US$0.8 billion compared with 30 June 2007 (decreased by US$0.3 billion compared with 31 December 2007) and is excluded from the reported net trading income line and included in net interest income. However, this cost is reinstated in net trading income in HSBC’s customer group and global business reporting.
Net trading income includes US$262 million associated with changes in the fair value of issued structured notes and other hybrid instrument liabilities derived from movements in HSBC issuance spreads.
Net trading income fell by 30 per cent to US$3.8 billion due to US$3.9 billion of write-downs on credit trading, leveraged and acquisition finance, and monoline exposures, largely in the US and the UK. More information on these write-downs and the underlying assets is available on page 113. On an underlying basis the decline was 33 per cent. The following commentary is on an underlying basis.
In the prevailing conditions, the market value of certain credit instruments, most notably sub-prime residential mortgage-backed loans and structured credit instruments, deteriorated. The credit and liquidity disruption that began in the US sub-prime market spread into other mortgage and mortgage-related products. HSBC had mitigated its risk to some extent against such declines by transacting with monoline insurers to buy protection against losses from defaults. As the market turmoil worsened, the market value of this protection initially increased significantly, reflecting the market view that it was more likely that defaults would occur. The sudden increase in the potential liabilities of the monoline insurers resulted in their credit ratings being downgraded as the scale of the liabilities incurred cast significant doubt on the ability of many monoline insurers to pay. Accordingly, a credit risk write-down was taken
against the market value of the exposure to monoline insurers. HSBC also originated certain leveraged and acquisition finance loans for the purpose of syndicating or selling down to generate a trading profit. The market value of some of these loans fell due to general credit and liquidity disruption, and the loss of value is reflected in trading results.
Other than products affected by credit markets, trading performance was strong across all regions.
Foreign exchange trading maintained its excellent performance, with record trading revenues 61 per cent higher, driven by market volatility, US dollar weakness and increased customer volumes across all regions. Growth in metals revenues were achieved on the back of record commodity prices and increased investor demand, particularly for precious metals.
Credit losses of US$3.1 billion compared with income of US$658 million in the first half of 2007, due to the write-downs noted above. This included losses from structured credit derivatives. Trading in new US mortgages and related products was discontinued in late 2007.
Rates generated record trading revenues up 104 per cent, due to favourable positioning against movements in interest rate yield curves as central

97
banks’ responses to the credit turmoil drove short-term interest rates lower. Rates revenues were also boosted by new deals and the widening of spreads, due to increased customer demand.
Excluding the effect of the gain on the sale of HSBC’s investments in Euronext N.V. and the Montreal Exchange in the first half of 2007, equities trading income doubled due to increased commission and equity financing revenues.
Net trading income in Europe rose by 5 per cent, despite US$1.4 billion of write-downs in the UK, as discussed above. The effect of the write-downs in the UK was offset by increased Rates revenue as short-term interest rates fell and the yield curve steepened, and by increased foreign exchange revenue as exchange rate volatility drove higher customer volumes. In France, trading income grew significantly as the Rates business saw high customer demand for inflation protection products.
In Hong Kong, a net trading income decline of 33 per cent was caused by write-downs on exposures to monoline insurers, partly offset by higher foreign exchange revenues and significantly increased sales
of equity-linked investment products to retail customers.
Strong growth in Rest of Asia-Pacific came from foreign exchange and Rates trading, reflecting increased customer volumes and favourable positioning against market movements. Significant contributions to revenue growth were made in South Korea, Middle East, mainland China and India, in particular.
A net trading loss of US$1.8 billion in North America was due to the US$2.3 billion of write-downs in the US from the factors noted above. Other product areas performed well, notably foreign exchange and Rates. Foreign exchange benefited from the volatility in the US dollar exchange rate against most currencies, and Rates benefited from positioning correctly for the Federal Reserve’s sudden and deep cuts to US interest rates, and the consequent steepening of the yield curve.
Net trading income grew by 12 per cent in Latin America, primarily in Brazil and Mexico, as customer demand drove higher foreign exchange volumes.
Net income/(expense) from financial instruments designated at fair value
Half-year to 30 June 2008
At 30 June 2008
Net income/(expense) Assets Liabilities US$m % US$m US$m By geographical region Europe ................................................................................................. (659) 112.8 28,283 50,366 Hong Kong ......................................................................................... (361) 61.8 7,075 4,218 Rest of Asia-Pacific ............................................................................ (88) 15.1 849 349 North America .................................................................................... 368 (63.0) – 34,825 Latin America ..................................................................................... 156 (26.7) 4,579 –
(584) 100.0 40,786 89,758
Half-year to
30 June 2007 At
30 June 2007 Net income Assets Liabilities US$m % US$m US$m By geographical region Europe ................................................................................................. 348 39.8 24,936 36,749 Hong Kong ......................................................................................... 210 24.0 5,507 4,393 Rest of Asia-Pacific ............................................................................ 78 8.9 1,836 480 North America .................................................................................... 81 9.3 – 34,344 Latin America ..................................................................................... 157 18.0 2,570 –
874 100.0 34,849 75,966
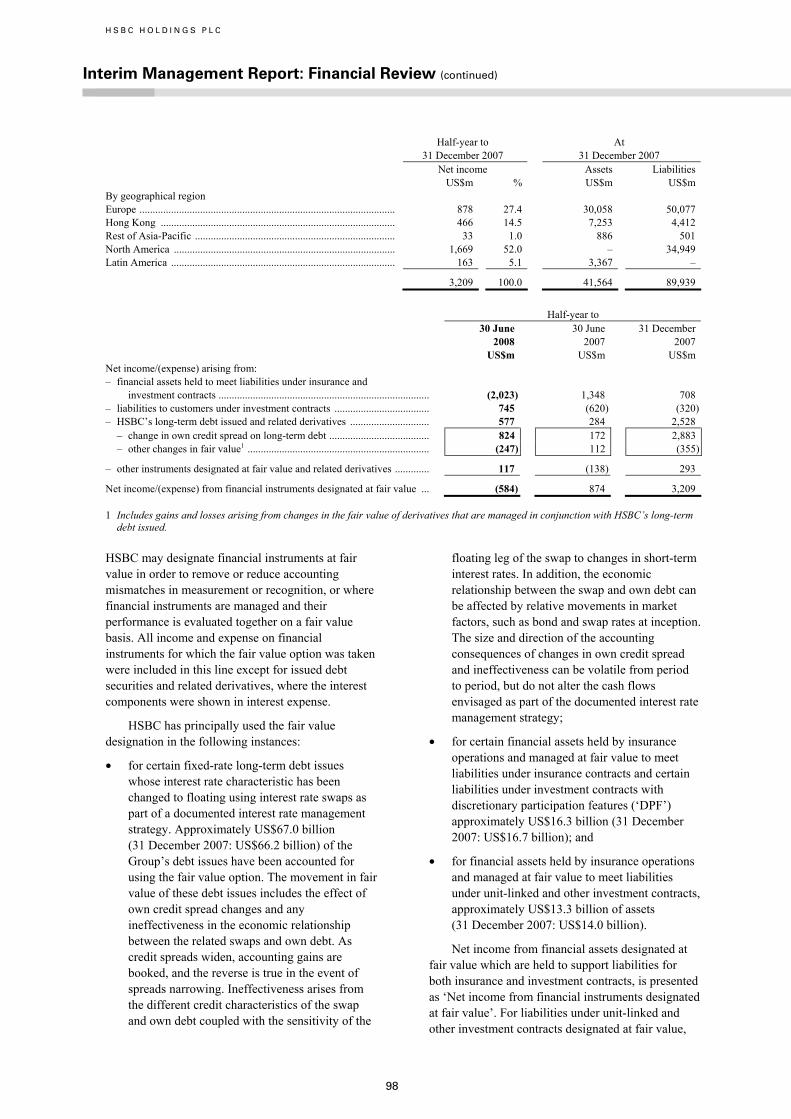
H S B C H O L D I N G S P L C
Interim Management Report: Financial Review (continued)
98
Half-year to 31 December 2007
At 31 December 2007
Net income Assets Liabilities US$m % US$m US$m By geographical region Europe ................................................................................................. 878 27.4 30,058 50,077 Hong Kong ......................................................................................... 466 14.5 7,253 4,412 Rest of Asia-Pacific ............................................................................ 33 1.0 886 501 North America .................................................................................... 1,669 52.0 – 34,949 Latin America ..................................................................................... 163 5.1 3,367 –
3,209 100.0 41,564 89,939
Half-year to 30 June
2008US$m
30 June 2007
US$m
31 December2007
US$m Net income/(expense) arising from: – financial assets held to meet liabilities under insurance and
investment contracts ................................................................................ (2,023) 1,348 708 – liabilities to customers under investment contracts .................................... 745 (620) (320)– HSBC’s long-term debt issued and related derivatives .............................. 577 284 2,528
– change in own credit spread on long-term debt ...................................... 824 172 2,883– other changes in fair value1 ..................................................................... (247) 112 (355)
– other instruments designated at fair value and related derivatives ............. 117 (138) 293
Net income/(expense) from financial instruments designated at fair value ... (584) 874 3,209
1 Includes gains and losses arising from changes in the fair value of derivatives that are managed in conjunction with HSBC’s long-term debt issued.
HSBC may designate financial instruments at fair value in order to remove or reduce accounting mismatches in measurement or recognition, or where financial instruments are managed and their performance is evaluated together on a fair value basis. All income and expense on financial instruments for which the fair value option was taken were included in this line except for issued debt securities and related derivatives, where the interest components were shown in interest expense.
HSBC has principally used the fair value designation in the following instances:
• for certain fixed-rate long-term debt issues whose interest rate characteristic has been changed to floating using interest rate swaps as part of a documented interest rate management strategy. Approximately US$67.0 billion (31 December 2007: US$66.2 billion) of the Group’s debt issues have been accounted for using the fair value option. The movement in fair value of these debt issues includes the effect of own credit spread changes and any ineffectiveness in the economic relationship between the related swaps and own debt. As credit spreads widen, accounting gains are booked, and the reverse is true in the event of spreads narrowing. Ineffectiveness arises from the different credit characteristics of the swap and own debt coupled with the sensitivity of the
floating leg of the swap to changes in short-term interest rates. In addition, the economic relationship between the swap and own debt can be affected by relative movements in market factors, such as bond and swap rates at inception. The size and direction of the accounting consequences of changes in own credit spread and ineffectiveness can be volatile from period to period, but do not alter the cash flows envisaged as part of the documented interest rate management strategy;
• for certain financial assets held by insurance operations and managed at fair value to meet liabilities under insurance contracts and certain liabilities under investment contracts with discretionary participation features (‘DPF’) approximately US$16.3 billion (31 December 2007: US$16.7 billion); and
• for financial assets held by insurance operations and managed at fair value to meet liabilities under unit-linked and other investment contracts, approximately US$13.3 billion of assets (31 December 2007: US$14.0 billion).
Net income from financial assets designated at fair value which are held to support liabilities for both insurance and investment contracts, is presented as ‘Net income from financial instruments designated at fair value’. For liabilities under unit-linked and other investment contracts designated at fair value,

99
changes are taken to the same income statement line to match the net income on the related assets. There is, however, a mismatch in presentation for insurance contracts and investment contracts with DPF, where the change in the value of the insurance contract liabilities is included within ‘Net insurance claims incurred and movement in liabilities to policyholders’, whereas any related asset returns are included within ‘Net income from financial instruments designated at fair value’.
A negative movement in the fair value of financial instruments designated at fair value of US$584 million compared with a positive movement of US$874 million in the first half of 2007.
Net income from financial instruments designated at fair value relating to the change in credit spread on certain long-term debt issued by HSBC Holdings and its subsidiaries increased significantly compared with the first half of 2007. Credit spreads widened significantly during the first quarter of 2008, leading to substantial positive fair value movements. However, this effect was partly reversed in the second quarter as credit spreads narrowed, leading to an overall gain of US$824 million compared with US$172 million in the first half of 2007. Over the life of this debt, these
fair value movements will fully reverse. The cumulative fair value adjustment since this policy was first applied is US$2.4 billion.
A negative movement in the fair value of assets held to meet insurance and investment contracts of US$2.0 billion compared with a positive movement US$1.3 billion in the first half of 2007. The negative movement was mainly driven by declining equity market performance in Hong Kong, France and the UK compared with strong performance in the first half of 2007, which affected the value of investments held in equity portfolios within the insurance operations. To the extent that these assets are utilised to meet liabilities held under insurance and investment contracts with DPF, the above movement is wholly or partially offset by a corresponding reduction in ‘Net insurance claims and movement in liabilities to policyholders’.
The reduction in the fair value of liabilities held under investment contracts of US$745 million compared with an increase of US$620 million in the first half of 2007, as the fall in the value of assets backing unit-linked investment contracts noted above led to a corresponding reduction in the liability to customers.
Gains less losses from financial investments
Half-year to 30 June 2008 30 June 2007 31 December 2007
US$m % US$m % US$m % By geographical region Europe ......................................................... 608 74.4 790 79.1 536 56.0 Hong Kong ................................................. (98) (12.0) 32 3.2 62 6.5 Rest of Asia-Pacific .................................... 33 4.0 26 2.6 12 1.3 North America ............................................ 106 13.0 53 5.3 192 20.0 Latin America ............................................. 168 20.6 98 9.8 155 16.2
Gains less losses from financial investments ............................................. 817
100.0 999
100.0 957
100.0
Half-year to 30 June
2008US$m
30 June 2007
US$m
31 December2007
US$m Net gains from disposal of:
– debt securities .......................................................................................... 38 133 (13)– equity securities ....................................................................................... 1,107 852 1,009 – other financial investments ..................................................................... (11) 14 –
Impairment of equity securities ....................................................................... (317) – (39)
Gains less losses from financial investments .................................................. 817 999 957
HSBC reported net gains of US$817 million during the first half of 2008 from the sale of financial investments, 18 per cent lower than in the first half of 2007 and 23 per cent lower on an underlying basis.
The following commentary is on an underlying basis.
In the first half of 2008, US$332 million of gains were attributable to the redemption of Visa shares following its IPO. These gains were

H S B C H O L D I N G S P L C
Interim Management Report: Financial Review (continued)
100
regionally dispersed across Hong Kong, North America, Latin America and the Rest of Asia-Pacific regions as shares in Visa were allocated in the IPO to member banks and subsequently redeemed. Similarly, gains were realised on the sale of MasterCard shares, following its IPO.
In Europe, gains of US$608 million were 27 per cent less than in the first half of 2007. Profit on the disposal of MasterCard shares was more than offset by lower gains from the sale of equity holdings in the UK and France. In Private Banking, a gain of US$73 million was derived from the sale of HSBC’s residual holding in the Hermitage Fund, which compared with US$23 million in the first half of 2007.
In Hong Kong, a loss of US$98 million in the first half of 2008 compared with a gain of US$32 million in the first half of 2007. The redemption of MasterCard shares, along with the gains from Visa referred to above, were more
than offset by impairments booked against certain of HSBC’s strategic investments in the region. These investments were made as part of the strategic positioning of HSBC’s businesses in Asia, and the write-downs were required following significant falls in equity market prices.
In North America, gains of US$106 million were 89 per cent higher than in the first half of 2007, largely due to the Visa share redemption. This increase was marginally offset by lower gains from the sale of debt securities due to less favourable market conditions compared with the first half of 2007.
Gains of US$168 million in Latin America were 50 per cent higher than in the first half of 2007, principally due to Visa gains in Mexico, Central America and Brazil. In the latter, gains were lower than in the first half of 2007, which included the gain on sale of an equity holding related to a credit bureau.
Net earned insurance premiums
Half-year to 30 June 2008 30 June 2007 31 December 2007 US$m % US$m % US$m %
By geographical region Europe ...................................................... 2,286 44.4 1,480 37.2 2,530 49.6 Hong Kong .............................................. 1,650 32.0 1,426 35.9 1,371 26.9 Rest of Asia-Pacific ................................. 114 2.2 109 2.7 117 2.3 North America ......................................... 203 3.9 231 5.8 218 4.3 Latin America .......................................... 900 17.5 731 18.4 863 16.9
Net earned insurance premiums .............. 5,153 100.0 3,977 100.0 5,099 100.0
Half-year to 30 June
2007US$m
30 June 2007
US$m
31 December2007
US$m
Gross insurance premium income ................................................................... 6,591 4,532 6,469 Reinsurance premiums .................................................................................... (1,438) (555) (1,370)
Net earned insurance premiums ...................................................................... 5,153 3,977 5,099
Net earned insurance premiums increased by 30 per cent to US$5.2 billion. HSBC acquired the remaining 51 per cent interest in HSBC Assurances in France in March 2007 and sold the Hamilton Insurance Company Limited and Hamilton Life Assurance Company Limited in the UK in October 2007. On an underlying basis, net earned insurance premiums increased by 11 per cent.
The commentary that follows is on an underlying basis.
In Europe, net earned insurance premiums increased by 10 per cent, primarily driven by the UK business, which launched the new Guaranteed
Income Bond in June 2007 within the life insurance business. UK net insurance premiums were also boosted by a reclassification of certain pension contracts as ‘insurance’ rather than ‘investment’ products following the addition of enhanced life insurance benefits. In France, net insurance premiums in the first half of 2008 were reduced by a reinsurance transaction which passed insurance premiums to a third party reinsurance provider. Excluding this, gross premiums in France increased as a result of promotional offers during the first half of 2008.
In Hong Kong, net earned insurance premiums of US$1.7 billion were 15 per cent higher than in the

101
first half of 2007. Higher premium income from the life insurance business was driven by increased sales of endowment savings products in Hang Seng Life, which was the leading writer of life insurance new business in Hong Kong in the first quarter of 2008, with a market share of 16 per cent. The fluctuating investment market and lower interest rate environment helped the growth of the life insurance business as customers sought more secure, steady growth products.
In the Rest of Asia-Pacific region, net insurance premiums were 4 per cent lower than in the first half of 2007. Increased life insurance business in Singapore, mainly due to growth of the Life Manager Plus product, which was launched in March 2007, was offset by a decline in Malaysia, due to the non-recurrence of income from a closed-end fund, sold for a one month period in the first half of 2007.
In North America, net insurance premiums decreased by 13 per cent. Life insurance premiums fell as credit life products in North America declined due to falling loan volumes within HSBC Finance, which led to a reduction in income from associated credit protection products. These declines were
partially offset by increased sales of a simplified issue term life product, which was launched in 2007 and rolled out across all states in the second half of the year. Non-life insurance premiums also fell, due to lower loan origination.
In Latin America, net earned insurance premiums rose to US$900 million, an increase of 11 per cent. This was mainly driven by an increase in Brazil in the level of voluntary pension fund contributions. The number of pension fund contracts in force in Brazil increased by 7 per cent, as a result of sales initiatives designed to attract new customers. In Mexico, growth reflected an increase in life, personal accident and vehicle products. An increased focus on life insurance sales through HSBC and other distribution channels, made a significant contribution to growth. Vehicle insurance premiums also increased in Argentina as prices rose in response to underlying vehicle price inflation. Life insurance premium income decreased in Argentina due to the cessation of part of the pension business as a consequence of a change in government legislation.
Other operating income
Half-year to 30 June 2008 30 June 2007 31 December 2007 US$m % US$m % US$m % By geographical region Europe ...................................................... 1,427 54.8 262 17.1 931 49.2 Hong Kong .............................................. 448 17.2 413 27.0 432 22.8 Rest of Asia-Pacific ................................. 484 18.6 360 23.5 438 23.1 North America ......................................... 115 4.4 342 22.4 18 0.9 Latin America .......................................... 130 5.0 153 10.0 75 4.0
2,604 100.0 1,530 100.0 1,894 100.0 Intra-HSBC elimination ........................... (1,169) (852) (1,133)
Other operating income ........................... 1,435 678 761
Half-year to 30 June
2008US$m
30 June 2007
US$m
31 December2007
US$m
Rent received ................................................................................................... 326 315 315 Gain/(loss) on assets held for sale ................................................................... (16) (37) 42 Valuation gains on investment properties ....................................................... 27 48 104 Gain on disposal of property, plant and equipment, intangible assets
and non-financial investments .................................................................... 412 152 61 Change in present value of in-force long-term insurance business ................ 324 (155) 10 Other ................................................................................................................ 362 355 229
Other operating income ................................................................................... 1,435 678 761 Other operating income of US$1.4 billion was US$757 million, or 112 per cent, higher than in the first half of 2007, an 84 per cent increase on an underlying basis.
The commentary that follows is on an underlying basis.
In Europe, other operating income increased significantly. In the UK, other operating income

H S B C H O L D I N G S P L C
Interim Management Report: Financial Review (continued)
102
included a gain on the sale of a merchant acquiring business to a joint venture with Global Payments Inc. This income line also benefited from a non-recurring reduction in the PVIF in 2007 following a change in FSA regulations. In 2008, a pension product was enhanced with life insurance features and reclassified as an insurance product, resulting in an uplift to PVIF. Gain on sale and leaseback of branches increased as 140 branches were sold in the first half of 2008 compared with 12 in the comparative period in 2007. In France, the regional banks were reclassified as held for sale following a decision to sell them, resulting in their profits of US$32 million for the half-year being reported in other operating income.
In Hong Kong, other operating income remained broadly unchanged.
Other operating income in Rest of Asia-Pacific rose by 13 per cent, mostly driven by recharges from increased business volumes at the Group Service Centres.
In North America, other operating income decreased due to higher losses on repossessed properties driven by an increase in foreclosures and continuing falls in house prices. Further losses were incurred on the sale of investment in two funds due to adverse market conditions. A loss was registered on the sale of a brokerage business which was not considered to be part of the strategic operations of the group. Gains in the first half of 2007 were boosted by the sale and leaseback of an HSBC building.
In Latin America, other operating income declined due to the non-recurrence of the gain recorded in Mexico in the first half of 2007, following a refinement of the income recognition methodology in respect of long-term insurance products. This was partially offset by a similar gain of US$45 million in Brazil in the current period. Further gains were registered on expired investment contracts and on the disposal of property.
Net insurance claims incurred and movement in liabilities to policyholders
Half-year to 30 June 2008 30 June 2007 31 December 2007 US$m % US$m % US$m % By geographical region Europe ...................................................... 1,388 40.4 1,146 31.8 2,333 46.6 Hong Kong .............................................. 1,169 34.0 1,512 42.1 1,696 33.9 Rest of Asia-Pacific ................................. 4 0.1 141 3.9 112 2.2 North America ......................................... 112 3.3 124 3.4 117 2.3 Latin America .......................................... 764 22.2 676 18.8 751 15.0
Net insurance claims incurred and movement in liabilities to policyholders1 .................................. 3,437
100.0 3,599
100.0 5,009
100.0 Half-year to
30 June2008
US$m
30 June 2007
US$m
31 December2007
US$m
Gross insurance claims and movement in liabilities to policyholders ............ 4,769 3,428 6,122 Reinsurers’ share of claims incurred and movement in liabilities
to policyholders ........................................................................................... (1,332) 171 (1,113)
Net insurance claims incurred and movement in liabilities to policyholders1 .......................................................................................... 3,437
3,599 5,009
1 Net insurance claims incurred and movement in liabilities to policyholders arise from both life and non-life insurance business. For non-life business, amounts reported represent the cost of claims paid during the year and the estimated cost of notified claims. For life business, the main element of claims is the liability to policyholders created on the initial underwriting of the policy and any subsequent movement in the liability that arises, primarily from the attribution of investment performance to savings-related policies. Consequently, claims rise in line with increases in sales of savings-related business and with investment market growth.
Net insurance claims incurred and movement in liabilities to policyholders decreased by 5 per cent compared with the first half of 2007, to US$3.4 billion. HSBC acquired the remaining shares in HSBC Assurances in France in March 2007 and sold the Hamilton Insurance Company Limited and
Hamilton Life Assurance Company Limited in the UK in October 2007. Net insurance claims incurred and movement in liabilities to policyholders decreased by 14 per cent on an underlying basis.
The commentary that follows is on an underlying basis.

103
In Europe, net insurance claims incurred and movement in liabilities to policyholders rose by 1 per cent to US$1.4 billion. This was mainly due to a release of policyholder liabilities in the UK in the first half of 2007 following revised regulatory guidance issued by the FSA and by the rise in new liabilities associated with the launch of the Guaranteed Income Bond by HSBC Life in June 2007. This was offset by a reduction in policyholder provisions in France which reflected the creation of a reinsurance asset with a third party insurer on a portion of the life insurance business. Falling values of assets within the investment portfolio flowed through to lower liabilities on associated policies.
In Hong Kong, reductions in net insurance claims incurred and in liabilities to policyholders of 23 per cent reflected lower stock market values in Hong Kong, which fed through to a decrease in the value of unit-linked and participating funds.
In Rest of Asia-Pacific, similarly, a reduction in net insurance claims incurred and movement in liabilities to policyholders of 97 per cent was due to
falling equity markets affecting unit-linked and participating life insurance products.
In North America, net insurance claims incurred and movement in liabilities to policyholders fell by 10 per cent. Life insurance claims fell, mostly due to a fall in credit life payments in the consumer lending business, in line with the fall in premiums. This was partly offset by an increase in provisions from the new simplified issue term life insurance product, due to an increase in sales.
In Latin America, net insurance claims incurred and movement in liabilities to policyholders were in line with the first half of 2007. In the life insurance business, the benefit of a higher level voluntary pension fund contributions in Brazil was largely offset by the cessation of part of the pension business in Argentina. An increase in non-life insurance claims was driven by the vehicle insurance business in Argentina, which experienced a higher frequency of vehicle related claims in line with greater sales of vehicle contracts, combined with an increase in the value of claims due to rising levels of inflation.
Loan impairment charges and other credit risk provisions
Half-year to 30 June 2008 30 June 2007 31 December 2007 US$m % US$m % US$m % By geographical region Europe ...................................................... 1,272 12.6 1,363 21.5 1,179 10.8 Hong Kong .............................................. 81 0.8 80 1.3 151 1.4 Rest of Asia-Pacific ................................. 369 3.7 308 4.8 308 2.8 North America ......................................... 7,166 71.3 3,820 60.2 8,336 76.5 Latin America .......................................... 1,170 11.6 775 12.2 922 8.5
Loan impairment charges and other credit risk provisions ........................... 10,058 100.0 6,346 100.0 10,896
100.0
Half-year to
30 June2008
US$m
30 June 2007
US$m
31 December2007
US$m Loan impairment charges
New allowances net of allowance releases ................................................. 10,436 6,635 11,547 Recoveries of amounts previously written off ............................................ (479) (307) (698)
9,957 6,328 10,849
Individually assessed allowances .................................................................... 332 385 411Collectively assessed allowances .................................................................... 9,625 5,943 10,438
Impairment of available-for-sale debt securities ............................................. 67 – 44
Other credit risk provisions ............................................................................. 34 18 3
Loan impairment charges and other credit risk provisions ............................. 10,058 6,346 10,896 Customer impaired loans ................................................................................. 19,029 14,555 18,304 Customer loan impairment allowances ........................................................... 20,580 14,323 19,205
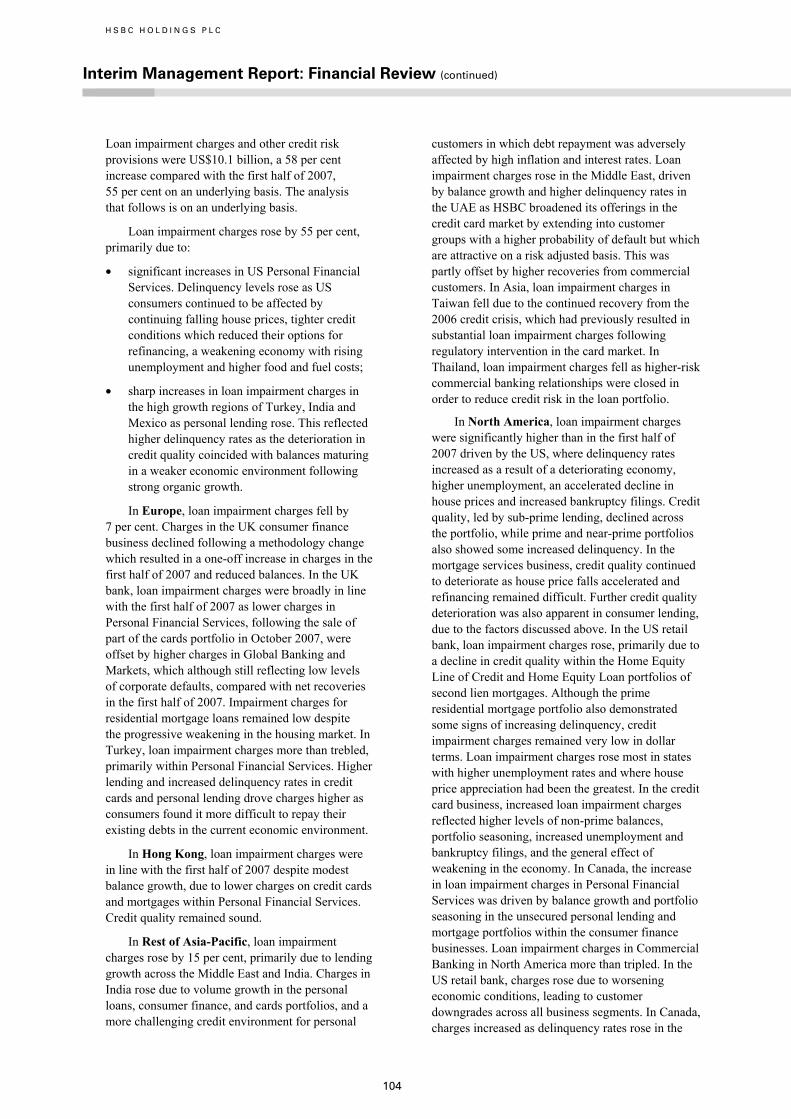
H S B C H O L D I N G S P L C
Interim Management Report: Financial Review (continued)
104
Loan impairment charges and other credit risk provisions were US$10.1 billion, a 58 per cent increase compared with the first half of 2007, 55 per cent on an underlying basis. The analysis that follows is on an underlying basis.
Loan impairment charges rose by 55 per cent, primarily due to:
• significant increases in US Personal Financial Services. Delinquency levels rose as US consumers continued to be affected by continuing falling house prices, tighter credit conditions which reduced their options for refinancing, a weakening economy with rising unemployment and higher food and fuel costs;
• sharp increases in loan impairment charges in the high growth regions of Turkey, India and Mexico as personal lending rose. This reflected higher delinquency rates as the deterioration in credit quality coincided with balances maturing in a weaker economic environment following strong organic growth.
In Europe, loan impairment charges fell by 7 per cent. Charges in the UK consumer finance business declined following a methodology change which resulted in a one-off increase in charges in the first half of 2007 and reduced balances. In the UK bank, loan impairment charges were broadly in line with the first half of 2007 as lower charges in Personal Financial Services, following the sale of part of the cards portfolio in October 2007, were offset by higher charges in Global Banking and Markets, which although still reflecting low levels of corporate defaults, compared with net recoveries in the first half of 2007. Impairment charges for residential mortgage loans remained low despite the progressive weakening in the housing market. In Turkey, loan impairment charges more than trebled, primarily within Personal Financial Services. Higher lending and increased delinquency rates in credit cards and personal lending drove charges higher as consumers found it more difficult to repay their existing debts in the current economic environment.
In Hong Kong, loan impairment charges were in line with the first half of 2007 despite modest balance growth, due to lower charges on credit cards and mortgages within Personal Financial Services. Credit quality remained sound.
In Rest of Asia-Pacific, loan impairment charges rose by 15 per cent, primarily due to lending growth across the Middle East and India. Charges in India rose due to volume growth in the personal loans, consumer finance, and cards portfolios, and a more challenging credit environment for personal
customers in which debt repayment was adversely affected by high inflation and interest rates. Loan impairment charges rose in the Middle East, driven by balance growth and higher delinquency rates in the UAE as HSBC broadened its offerings in the credit card market by extending into customer groups with a higher probability of default but which are attractive on a risk adjusted basis. This was partly offset by higher recoveries from commercial customers. In Asia, loan impairment charges in Taiwan fell due to the continued recovery from the 2006 credit crisis, which had previously resulted in substantial loan impairment charges following regulatory intervention in the card market. In Thailand, loan impairment charges fell as higher-risk commercial banking relationships were closed in order to reduce credit risk in the loan portfolio.
In North America, loan impairment charges were significantly higher than in the first half of 2007 driven by the US, where delinquency rates increased as a result of a deteriorating economy, higher unemployment, an accelerated decline in house prices and increased bankruptcy filings. Credit quality, led by sub-prime lending, declined across the portfolio, while prime and near-prime portfolios also showed some increased delinquency. In the mortgage services business, credit quality continued to deteriorate as house price falls accelerated and refinancing remained difficult. Further credit quality deterioration was also apparent in consumer lending, due to the factors discussed above. In the US retail bank, loan impairment charges rose, primarily due to a decline in credit quality within the Home Equity Line of Credit and Home Equity Loan portfolios of second lien mortgages. Although the prime residential mortgage portfolio also demonstrated some signs of increasing delinquency, credit impairment charges remained very low in dollar terms. Loan impairment charges rose most in states with higher unemployment rates and where house price appreciation had been the greatest. In the credit card business, increased loan impairment charges reflected higher levels of non-prime balances, portfolio seasoning, increased unemployment and bankruptcy filings, and the general effect of weakening in the economy. In Canada, the increase in loan impairment charges in Personal Financial Services was driven by balance growth and portfolio seasoning in the unsecured personal lending and mortgage portfolios within the consumer finance businesses. Loan impairment charges in Commercial Banking in North America more than tripled. In the US retail bank, charges rose due to worsening economic conditions, leading to customer downgrades across all business segments. In Canada, charges increased as delinquency rates rose in the
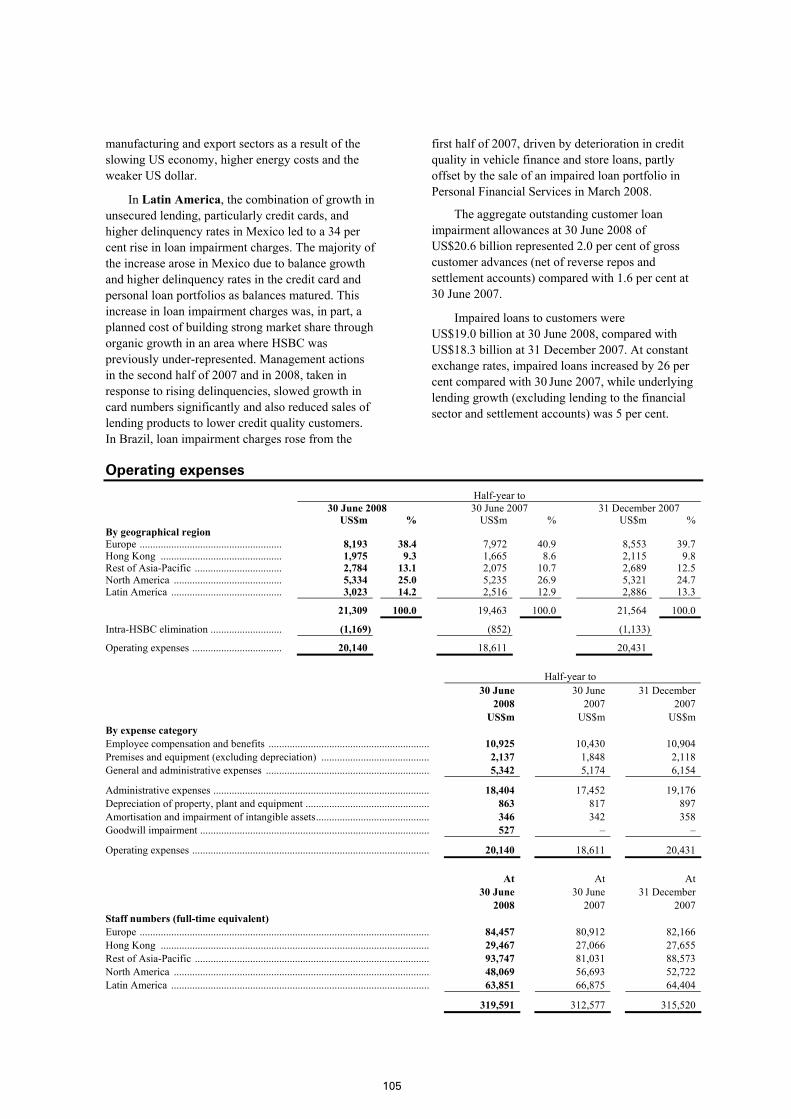
105
manufacturing and export sectors as a result of the slowing US economy, higher energy costs and the weaker US dollar.
In Latin America, the combination of growth in unsecured lending, particularly credit cards, and higher delinquency rates in Mexico led to a 34 per cent rise in loan impairment charges. The majority of the increase arose in Mexico due to balance growth and higher delinquency rates in the credit card and personal loan portfolios as balances matured. This increase in loan impairment charges was, in part, a planned cost of building strong market share through organic growth in an area where HSBC was previously under-represented. Management actions in the second half of 2007 and in 2008, taken in response to rising delinquencies, slowed growth in card numbers significantly and also reduced sales of lending products to lower credit quality customers. In Brazil, loan impairment charges rose from the
first half of 2007, driven by deterioration in credit quality in vehicle finance and store loans, partly offset by the sale of an impaired loan portfolio in Personal Financial Services in March 2008.
The aggregate outstanding customer loan impairment allowances at 30 June 2008 of US$20.6 billion represented 2.0 per cent of gross customer advances (net of reverse repos and settlement accounts) compared with 1.6 per cent at 30 June 2007.
Impaired loans to customers were US$19.0 billion at 30 June 2008, compared with US$18.3 billion at 31 December 2007. At constant exchange rates, impaired loans increased by 26 per cent compared with 30 June 2007, while underlying lending growth (excluding lending to the financial sector and settlement accounts) was 5 per cent.
Operating expenses
Half-year to 30 June 2008 30 June 2007 31 December 2007 US$m % US$m % US$m % By geographical region Europe ...................................................... 8,193 38.4 7,972 40.9 8,553 39.7 Hong Kong .............................................. 1,975 9.3 1,665 8.6 2,115 9.8 Rest of Asia-Pacific ................................. 2,784 13.1 2,075 10.7 2,689 12.5 North America ......................................... 5,334 25.0 5,235 26.9 5,321 24.7 Latin America .......................................... 3,023 14.2 2,516 12.9 2,886 13.3
21,309 100.0 19,463 100.0 21,564 100.0
Intra-HSBC elimination ........................... (1,169) (852) (1,133)
Operating expenses .................................. 20,140 18,611 20,431
Half-year to 30 June
2008 30 June
2007 31 December
2007 US$m US$m US$m
By expense category Employee compensation and benefits ............................................................. 10,925 10,430 10,904 Premises and equipment (excluding depreciation) ......................................... 2,137 1,848 2,118 General and administrative expenses .............................................................. 5,342 5,174 6,154
Administrative expenses .................................................................................. 18,404 17,452 19,176 Depreciation of property, plant and equipment ............................................... 863 817 897 Amortisation and impairment of intangible assets........................................... 346 342 358 Goodwill impairment ....................................................................................... 527 – –
Operating expenses .......................................................................................... 20,140 18,611 20,431 At
30 June 2008
At 30 June
2007
At31 December
2007 Staff numbers (full-time equivalent) Europe .............................................................................................................. 84,457 80,912 82,166 Hong Kong ...................................................................................................... 29,467 27,066 27,655 Rest of Asia-Pacific ......................................................................................... 93,747 81,031 88,573 North America ................................................................................................. 48,069 56,693 52,722 Latin America .................................................................................................. 63,851 66,875 64,404
319,591 312,577 315,520
H S B C H O L D I N G S P L C
Interim Management Report: Financial Review (continued)
106
Operating expenses increased by US$1.5 billion to US$20.1 billion. On an underlying basis, cost growth was 4 per cent, the main drivers being:
• in Rest of Asia-Pacific, HSBC continued to invest in India and mainland China through increased staff numbers to support growth in business volumes. In the Middle East, staff numbers also increased, predominantly in customer facing roles. Similarly, costs rose in Hong Kong. In Europe, headcount and administrative costs in Turkey grew as the branch network was extended; and
• management’s decision in the US in 2007 to close the Decision One mortgage brokerage business, cease the acquisition of mortgages from correspondent banks and brokers and reduce the consumer lending branch network in the US helped control costs. Marketing expenditure on credit card origination was curtailed to limit growth in loan balances.
In Europe, costs decreased by 1 per cent, compared with an increase of 6 per cent in net operating income before loan impairment charges. The main drivers of this decrease were businesses in the UK and France, partially offset by higher costs in Turkey and Switzerland. In the UK, costs declined, in part due to the non-recurrence of ex gratia payments in respect of overdraft fees applied in previous years which were expensed in 2007. A reduction in defined benefit pension costs, the result of an updated actuarial assessment, also decreased costs. Lower performance bonuses in Global Banking and Markets reflected the lower profits being earned in the current conditions. In France, reported costs decreased as the regional banks were classified as held for sale and all relevant income and costs were therefore reported in other operating income. Business expansion in Turkey was reflected in an increase of 84 branches and 220 ATMs over the first half of 2007. Staff numbers increased by 35 per cent resulting in higher staff, premises and marketing costs. Higher business transaction volumes arising from organic growth strategy and inflation, also pushed costs up. In Private Banking, costs rose, mainly due to a non-recurring saving in pension costs in 2007, and general business expansion.
In Hong Kong, operating expenses increased by 18 per cent, compared with growth of 1 per cent in net operating income before loan impairment charges. Inflation and business growth were the main drivers behind the increase in costs. Staff numbers increased as additional capacity was required to meet growing business needs, contributing to a 9 per cent
increase in staff costs. Rental costs increased under inflationary pressures. IT cost growth reflected business growth and the expansion of self-service banking coverage. Call centres were increasingly used to generate sales at lower costs.
Operating costs increased by 27 per cent in Rest of Asia-Pacific compared with a 33 per cent growth in net operating income before loan impairment charges. The main driver of cost growth remained the significant organic business expansion in the region, most notably in the Middle East, mainland China and India. Staff costs rose on increases in headcount and performance-related bonuses due to higher revenue. Growth in IT and premises and equipment costs were driven by the opening of 10 additional branches in the Middle East and 29 outlets in mainland China where Hang Seng Bank also opened 14. Marketing costs increased in the Middle East. Costs in India also rose on higher fees paid to collection agencies.
In North America, operating expenses increased by 2 per cent, compared with lower net operating income before loan impairment charges of 17 per cent. The increase in costs was driven by an impairment charge of US$527 million in the goodwill carried by Personal Financial Services in North America. For further information see Note 20 to the Financial Statements. Excluding this impairment charge, operating expenses declined by 8 per cent. Consumer finance continued to implement its business rationalisation programme commenced in 2007, with staff numbers decreasing due to the reduction in the number of branches, the closure of Decision One and the correspondent channel, and the transfer of certain operations and support for card and retail services to Group Service Centres. Also as part of this strategy, marketing expenditure was curtailed in an effort to restrict lending growth. In the retail bank, litigation expenses recorded in the latter part of 2007, arising from an indemnification agreement with Visa, were released following redemption of the company’s shares in the IPO. In Global Banking and Markets, discretionary bonuses decreased due to lower performance in the Global Markets business. Operating expenses rose in Canada on higher staff costs driven by increased staff numbers in the retail bank and a rise in support costs. This was partly offset by lower costs in consumer finance as a result of reduced headcount following branch closures in 2007 and the sale of a mortgage brokerage business in 2008.
In Latin America, operating expenses grew by 8 per cent compared with growth in net operating income before loan impairment charges of 15 per

107
cent. In Mexico, staff costs rose, even though headcount numbers decreased. Salary costs grew following the annual salary review at the start of the year. Costs on the Tu Cuenta cashback facility rose as usage increased. Ongoing upgrading work on the branch and ATM retail network resulted in higher property rental costs and software maintenance and development. Inflationary pressures in Argentina resulted in higher operating expenditure, particularly staff costs, following a union agreement. Cost
growth in Brazil was mitigated by a recovery of transactional taxes paid in earlier years, following a court ruling. An agreement reached with the employees’ unions in the second half of 2007 resulted in higher salaries and wages partially offset by lower headcount. Non-staff expenses increased with higher outsourcing costs on phone services and collections, and improvement of operational processes for debit and credit cards.
Half-year to
Cost efficiency ratios
30 June2008
%
30 June 2007
%
31 December2007
%
HSBC .............................................................................................................. 51.0 48.3 50.4 Personal Financial Services .......................................................................... 49.5 50.0 50.6 Europe .............................................................................................................. 57.3 65.4 64.2 Hong Kong ...................................................................................................... 29.1 27.6 26.9 Rest of Asia-Pacific ......................................................................................... 68.7 68.9 78.3 North America ................................................................................................. 44.6 41.8 42.8 Latin America .................................................................................................. 57.4 61.9 60.7 Commercial Banking ..................................................................................... 40.2 44.2 45.4 Europe .............................................................................................................. 39.4 48.1 50.3 Hong Kong ...................................................................................................... 23.7 24.5 25.4 Rest of Asia-Pacific ......................................................................................... 40.3 39.3 46.1 North America ................................................................................................. 44.7 46.4 43.8 Latin America .................................................................................................. 55.2 55.1 53.7
Share of profit in associates and joint ventures
Half-year to 30 June 2008 30 June 2007 31 December 2007 US$m % US$m % US$m % By geographical region Europe ...................................................... 1 0.1 88 14.1 7 0.8 Hong Kong .............................................. 21 2.2 13 2.1 15 1.7 Rest of Asia-Pacific ................................. 936 96.5 507 81.4 841 95.6 North America ......................................... 8 0.8 10 1.6 10 1.1 Latin America .......................................... 4 0.4 5 0.8 7 0.8
Share of profit in associates and joint ventures ................................ 970
100.0 623
100.0 880
100.0
Half-year to
30 June2008
US$m
30 June 2007
US$m
31 December2007
US$m
Bank of Communications ................................................................................ 349 190 255 Ping An Insurance ........................................................................................... 297 144 374 Industrial Bank ................................................................................................ 102 50 78 The Saudi British Bank ................................................................................... 146 101 115 Other ................................................................................................................ 47 122 37
Share of profit in: – associates ................................................................................................. 941 607 859 – joint ventures ........................................................................................... 29 16 21
Share of profit in associates and joint ventures ............................................... 970 623 880
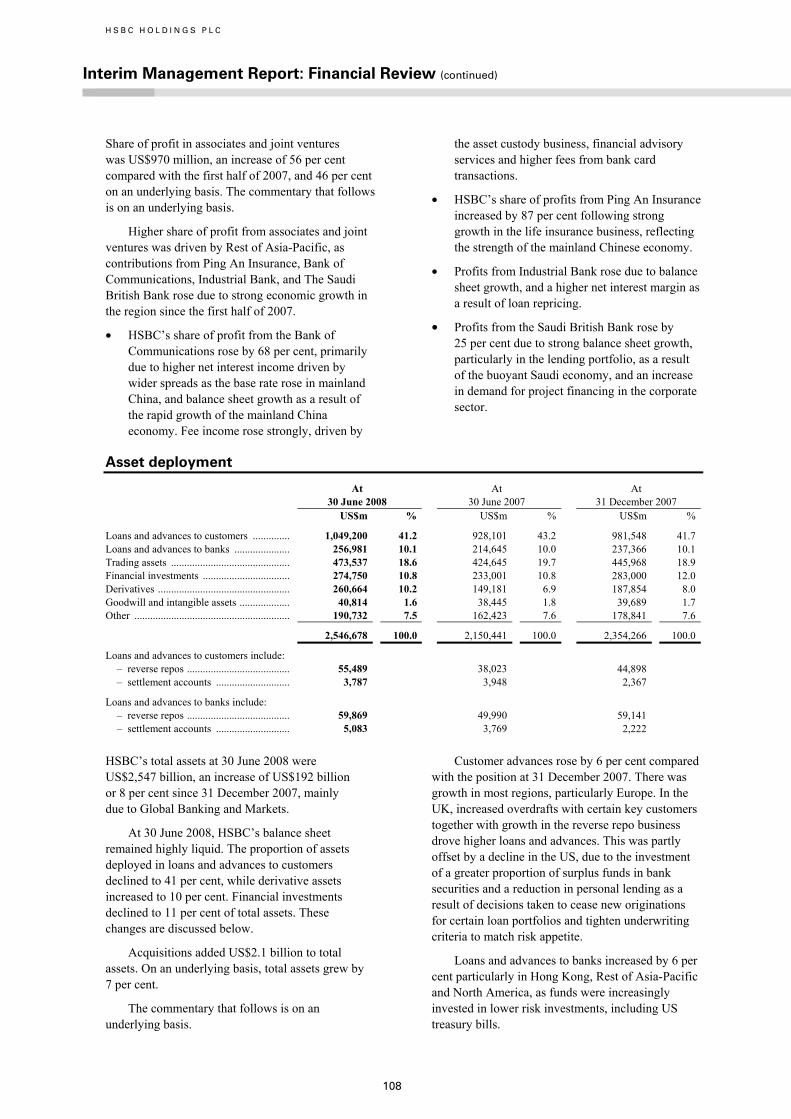
H S B C H O L D I N G S P L C
Interim Management Report: Financial Review (continued)
108
Share of profit in associates and joint ventures was US$970 million, an increase of 56 per cent compared with the first half of 2007, and 46 per cent on an underlying basis. The commentary that follows is on an underlying basis.
Higher share of profit from associates and joint ventures was driven by Rest of Asia-Pacific, as contributions from Ping An Insurance, Bank of Communications, Industrial Bank, and The Saudi British Bank rose due to strong economic growth in the region since the first half of 2007.
• HSBC’s share of profit from the Bank of Communications rose by 68 per cent, primarily due to higher net interest income driven by wider spreads as the base rate rose in mainland China, and balance sheet growth as a result of the rapid growth of the mainland China economy. Fee income rose strongly, driven by
the asset custody business, financial advisory services and higher fees from bank card transactions.
• HSBC’s share of profits from Ping An Insurance increased by 87 per cent following strong growth in the life insurance business, reflecting the strength of the mainland Chinese economy.
• Profits from Industrial Bank rose due to balance sheet growth, and a higher net interest margin as a result of loan repricing.
• Profits from the Saudi British Bank rose by 25 per cent due to strong balance sheet growth, particularly in the lending portfolio, as a result of the buoyant Saudi economy, and an increase in demand for project financing in the corporate sector.
Asset deployment
At 30 June 2008
At 30 June 2007
At 31 December 2007
US$m % US$m % US$m %
Loans and advances to customers .............. 1,049,200 41.2 928,101 43.2 981,548 41.7 Loans and advances to banks ..................... 256,981 10.1 214,645 10.0 237,366 10.1 Trading assets ............................................. 473,537 18.6 424,645 19.7 445,968 18.9 Financial investments ................................. 274,750 10.8 233,001 10.8 283,000 12.0 Derivatives .................................................. 260,664 10.2 149,181 6.9 187,854 8.0 Goodwill and intangible assets ................... 40,814 1.6 38,445 1.8 39,689 1.7 Other ........................................................... 190,732 7.5 162,423 7.6 178,841 7.6
2,546,678 100.0 2,150,441 100.0 2,354,266 100.0
Loans and advances to customers include: – reverse repos ....................................... 55,489 38,023 44,898 – settlement accounts ............................ 3,787 3,948 2,367
Loans and advances to banks include: – reverse repos ....................................... 59,869 49,990 59,141 – settlement accounts ............................ 5,083 3,769 2,222
HSBC’s total assets at 30 June 2008 were US$2,547 billion, an increase of US$192 billion or 8 per cent since 31 December 2007, mainly due to Global Banking and Markets.
At 30 June 2008, HSBC’s balance sheet remained highly liquid. The proportion of assets deployed in loans and advances to customers declined to 41 per cent, while derivative assets increased to 10 per cent. Financial investments declined to 11 per cent of total assets. These changes are discussed below.
Acquisitions added US$2.1 billion to total assets. On an underlying basis, total assets grew by 7 per cent.
The commentary that follows is on an underlying basis.
Customer advances rose by 6 per cent compared with the position at 31 December 2007. There was growth in most regions, particularly Europe. In the UK, increased overdrafts with certain key customers together with growth in the reverse repo business drove higher loans and advances. This was partly offset by a decline in the US, due to the investment of a greater proportion of surplus funds in bank securities and a reduction in personal lending as a result of decisions taken to cease new originations for certain loan portfolios and tighten underwriting criteria to match risk appetite.
Loans and advances to banks increased by 6 per cent particularly in Hong Kong, Rest of Asia-Pacific and North America, as funds were increasingly invested in lower risk investments, including US treasury bills.
109
Trading assets, financial investments and derivatives
Trading assets principally consist of debt and equity instruments acquired for the purpose of market making or to benefit from short-term price movements. Securities classified as held for trading are carried in the balance sheet at fair value, with movements in fair value recognised in the income statement.
Trading assets of US$474 billion at 30 June 2008 were 4 per cent higher than at 31 December 2007. The increase was mainly due to the growth of the collateralised lending business in Europe, though the rate of growth slowed over the reporting period. Debt securities rose in line with the strong performance in the Rates business as a result of the higher trading activity and demand for Rates products. Holdings in equity securities fell in the first half of 2008 due to a reduction in trading positions since year end following the considerable growth in many key equity products areas in 2007.
Financial investments primarily include debt and equity instruments that are classified as held for sale or, to a lesser extent, held to maturity. The held for sale investments generally represent a core element of the Group’s liquidity and may be disposed of either to manage that liquidity or in response to investment opportunities arising from favourable movements in economic indicators, such as interest rates, foreign exchange rates and equity prices. In addition, financial investments include a portfolio of ABSs held by securities investment conduits (‘SICs’) that are consolidated into the Group balance sheet. More information on these SICs and the underlying assets is available on pages 137 to 151. All financial investments are carried at fair value with unrealised gains and losses from movements thereon reported in equity until disposal. On disposal, the accumulated unrealised gain or loss is recognised through the income statement and reported as ‘Gains less losses from financial investments’.
Financial investments fell by 4 per cent compared with the reported figures at 31 December 2007. Investors in Cullinan Finance Ltd and Asscher Finance Ltd, two SIVs managed by HSBC and consolidated in 2007, were offered the opportunity to exchange their investments for notes in new SIVs, and during the first half of 2008 most of them accepted. In total, holdings in ABSs decreased due to a combination of asset sales, amortisations and write-downs. Net unrealised gains from the valuation of equities amounted to US$2.4 billion.
Derivatives are financial instruments that derive their value from the price of an underlying item. HSBC transacts derivatives for three primary purposes: to create risk management solutions for clients, for proprietary trading purposes, and to manage and mitigate HSBC’s own risks.
Derivative assets of US$261 billion rose by 36 per cent from 31 December 2007, primarily across foreign exchange, interest rate and credit derivatives. The main drivers of growth were mark-to-market movement across the entire portfolio arising from volatility and movements in interest rates and credit spreads, as well as new transactions during the period. Interest rate derivatives increased in value in the UK and France, particularly in the first quarter, as customers reacted to the fall in central bank interest rates and the consequent steepening of the yield curve. Widening credit spreads in the US, caused by the general turmoil in the credit markets, led to a significant mark-to-market increase in the value of credit derivative assets and liabilities. Again, this effect was substantially seen in the first quarter. Further growth in the US and much of the growth in the UK came from foreign exchange derivatives, as continuing currency volatility and, in particular, the declining US dollar drove customer demand.
Funds under management
Funds under management at 30 June 2008 were US$857 billion, an increase of 2 per cent when compared with 31 December 2007. Both Global Asset Management and Private Banking fund holdings increased, despite both businesses being negatively affected by poor equity market performance.
Global Asset Management funds increased to US$389 billion. Net new money, driven by clients moving their funds to money market investments, and favourable foreign exchange movements were partly offset by a weaker investment performance caused by turbulent markets. Notwithstanding a decrease in emerging markets funds during the first half of 2008, Global Asset Management remains one of the world’s largest emerging market asset managers, with US$86 billion of funds under management, an increase of 18 per cent since 30 June 2007.
Private Banking funds increased by 5 per cent to US$289 billion, driven primarily by foreign exchange movements and net new money of US$5 billion, offset by a poor equity market performance.
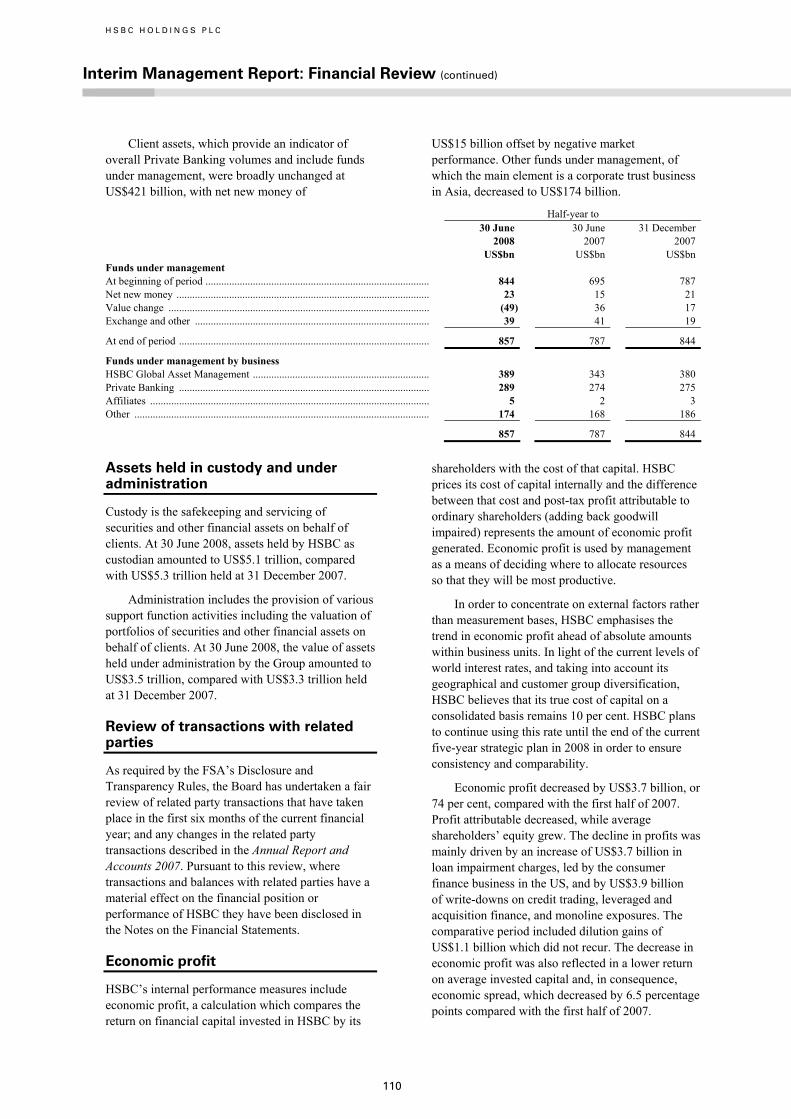
H S B C H O L D I N G S P L C
Interim Management Report: Financial Review (continued)
110
Client assets, which provide an indicator of overall Private Banking volumes and include funds under management, were broadly unchanged at US$421 billion, with net new money of
US$15 billion offset by negative market performance. Other funds under management, of which the main element is a corporate trust business in Asia, decreased to US$174 billion.
Half-year to 30 June
2008 30 June
2007 31 December
2007 US$bn US$bn US$bn Funds under management At beginning of period ..................................................................................... 844 695 787 Net new money ................................................................................................ 23 15 21 Value change ................................................................................................... (49) 36 17 Exchange and other ......................................................................................... 39 41 19
At end of period ............................................................................................... 857 787 844
Funds under management by business HSBC Global Asset Management ................................................................... 389 343 380 Private Banking ............................................................................................... 289 274 275 Affiliates .......................................................................................................... 5 2 3 Other ................................................................................................................ 174 168 186
857 787 844
Assets held in custody and under administration
Custody is the safekeeping and servicing of securities and other financial assets on behalf of clients. At 30 June 2008, assets held by HSBC as custodian amounted to US$5.1 trillion, compared with US$5.3 trillion held at 31 December 2007.
Administration includes the provision of various support function activities including the valuation of portfolios of securities and other financial assets on behalf of clients. At 30 June 2008, the value of assets held under administration by the Group amounted to US$3.5 trillion, compared with US$3.3 trillion held at 31 December 2007.
Review of transactions with related parties
As required by the FSA’s Disclosure and Transparency Rules, the Board has undertaken a fair review of related party transactions that have taken place in the first six months of the current financial year; and any changes in the related party transactions described in the Annual Report and Accounts 2007. Pursuant to this review, where transactions and balances with related parties have a material effect on the financial position or performance of HSBC they have been disclosed in the Notes on the Financial Statements.
Economic profit
HSBC’s internal performance measures include economic profit, a calculation which compares the return on financial capital invested in HSBC by its
shareholders with the cost of that capital. HSBC prices its cost of capital internally and the difference between that cost and post-tax profit attributable to ordinary shareholders (adding back goodwill impaired) represents the amount of economic profit generated. Economic profit is used by management as a means of deciding where to allocate resources so that they will be most productive.
In order to concentrate on external factors rather than measurement bases, HSBC emphasises the trend in economic profit ahead of absolute amounts within business units. In light of the current levels of world interest rates, and taking into account its geographical and customer group diversification, HSBC believes that its true cost of capital on a consolidated basis remains 10 per cent. HSBC plans to continue using this rate until the end of the current five-year strategic plan in 2008 in order to ensure consistency and comparability.
Economic profit decreased by US$3.7 billion, or 74 per cent, compared with the first half of 2007. Profit attributable decreased, while average shareholders’ equity grew. The decline in profits was mainly driven by an increase of US$3.7 billion in loan impairment charges, led by the consumer finance business in the US, and by US$3.9 billion of write-downs on credit trading, leveraged and acquisition finance, and monoline exposures. The comparative period included dilution gains of US$1.1 billion which did not recur. The decrease in economic profit was also reflected in a lower return on average invested capital and, in consequence, economic spread, which decreased by 6.5 percentage points compared with the first half of 2007.

111
Economic profit
Half-year to 30 June 2008 30 June 2007 31 December 2007 US$m %1 US$m %1 US$m %1
Average total shareholders’ equity .......... 128,409 114,776 125,825 Adjusted by:
Goodwill previously amortised or written off ........................................ 8,304 8,172 8,172
Property revaluation reserves .............. (847) (917) (879) Reserves representing unrealised gains
on effective cash flow hedges ......... 1,069 215 632 Reserves representing unrealised (gains)/
losses on available-for-sale securities 3,989 (2,214) (1,627) Preference shares and other equity
instruments ....................................... (1,939) (1,405) (1,405)
Average invested capital2 ......................... 138,985 118,627 130,718
Return on invested capital3 ...................... 8,204 11.9 10,850 18.4 8,193 12.4
Benchmark cost of capital ....................... (6,911) (10.0) (5,883) (10.0) (6,589) (10.0)
Economic profit/spread ........................... 1,293 1.9 4,967 8.4 1,604 2.4
1 Expressed as a percentage of average invested capital. 2 Average invested capital is measured as average total shareholders’ equity after:
– adding back the average balance of goodwill impaired, amortised or previously written-off directly to reserves; – deducting the average balance of HSBC’s revaluation surplus relating to property held for own use. This reserve was generated when
determining the deemed carrying cost of such properties on transition to IFRSs and will run down as the properties are sold; – deducting average preference shares issued by HSBC Holdings, and; – deducting average reserves for unrealised gains/(losses) on effective cash flow hedges and available-for-sale securities.
3 Return on invested capital is based on the profit attributable to ordinary shareholders of the parent company adding back goodwill impaired.
Ratios of earnings to combined fixed charges (and preference share dividends)
Half-year to 30 June Year ended 31 December
2008 2007 2006 2005 2004 2003 Ratios of earnings to combined fixed charges
Ratios in accordance with IFRSs – excluding interest on deposits ........................................ 6.11 7.52 7.93 9.60 8.64 – – including interest on deposits ......................................... 1.30 1.34 1.41 1.59 1.86 –
Ratios in accordance with UK GAAP – excluding interest on deposits ........................................ – – – – 8.07 7.41 – including interest on deposits ......................................... – – – – 1.81 1.80
Ratios of earnings to combined fixed charges and preference share dividends
Ratios in accordance with IFRSs: – excluding interest on deposits ........................................ 5.93 6.96 7.22 9.16 8.64 – – including interest on deposits ......................................... 1.30 1.34 1.40 1.59 1.86 –
Ratios in accordance with UK GAAP – excluding interest on deposits ........................................ – – – – 8.07 7.41 – including interest on deposits ......................................... – – – – 1.81 1.80
For the purpose of calculating the ratios, earnings consist of income from continuing operations before taxation and minority interests, plus fixed charges, and after deduction of the unremitted pre-tax income of associated undertakings. Fixed charges consist of total interest expense, including or excluding interest on deposits, as appropriate, preference share dividends, as applicable, and the proportion of rental expense deemed representative of the interest factor.
The above table contains ratios based on UK GAAP, HSBC’s previous primary GAAP, which is not comparable to financial information based upon IFRSs, as explained in HSBC’s 2004 IFRSs Comparative Financial Information published on 5 July 2004.

H S B C H O L D I N G S P L C
Interim Management Report: Impact of Market Turmoil
112
Background and disclosure policy
During the summer of 2007, credit risk concerns emanating from the US sub-prime mortgage market triggered a widespread deterioration in the markets for securitised and structured financial assets, with consequent disruption to the global financial system. As a result, many institutions recorded considerable reductions in the fair values of their asset-backed securities (‘ABSs’) and leveraged structured transactions, most significantly in those related to sub-prime mortgages, but also in other asset classes. As price observability for structured credit risk, including the prime tranches of such risk, became opaque, many markets for such assets became illiquid. The resulting constraint on the ability of financial institutions to access wholesale markets to fund such assets reduced capacity, adding further stress to all asset prices.
These market conditions continued in the first six months of 2008. In general, financial institutions took steps to reduce leveraged exposures, build liquidity and raise additional capital where necessary. However, money markets remained volatile, exhibiting wide interest spreads, and markets for securitised and structured financial assets continued to be highly constrained. This lack of market liquidity, together with the restricted availability of credit, contributed to general weakness in economic conditions in the US, UK, and Europe, in particular affecting housing and commercial property markets, and added to the difficult market conditions for such assets.
The deterioration in the fair value of assets supported by sub-prime mortgages continued in the first half of 2008 with the primary market for non-US government sponsored issues remaining weak. Spreads widened due to credit and liquidity concerns, and mortgage delinquencies continued to increase beyond the levels priced into securitisation issuance over the last few years. The impact continued to extend beyond sub-prime related assets, with the fair value of securities backed by Alt-A collateral (defined below), in particular, suffering a significant deterioration in fair value.
This section contains disclosures about the effect on HSBC’s securitisation activities and structured products of the recent market turmoil.
Details of HSBC’s principal exposure to the US and the UK mortgage markets, which primarily takes the form of credit risk from loans and advances to customers, are provided on page 161.
It is HSBC’s policy to provide meaningful disclosures that help investors and other stakeholders understand the financial position, performance and changes in the financial position of the Group. Whenever appropriate, the Group provides information that goes beyond the minimum levels required by accounting standards, statutory and regulatory requirements and listing rules. In the specific context of the recent market turmoil in markets for securitised and structured assets, HSBC has considered the recent recommendations relating to disclosure contained within the report of the Financial Stability Forum on ‘Enhancing Market and Institutional Resilience’ (April 2008) and the report by the Committee of European Banking Supervisors on ‘Banks’ Transparency on Activities and Products Affected by the Recent Market Turmoil’ (June 2008) and, in addition, has considered feedback from investors and other stakeholders on the disclosures that investors would find most useful. As a result, HSBC has expanded certain disclosures provided in the Annual Report and Accounts 2007 and included them in the Interim Report 2008.
The specific topics covered in respect of HSBC’s securitisation activities and structured products are as follows:
• overview of exposure;
• business model;
• risk management;
• accounting policies;
• nature and extent of HSBC’s exposures;
• fair values of financial instruments; and
• special purpose entities.
Overview of exposure
At 30 June 2008 the carrying value of HSBC’s exposure to ABSs, trading loans held for securitisation plus the exposure to leveraged finance transactions was US$117 billion (31 December 2007: US$135 billion), summarised as follows:
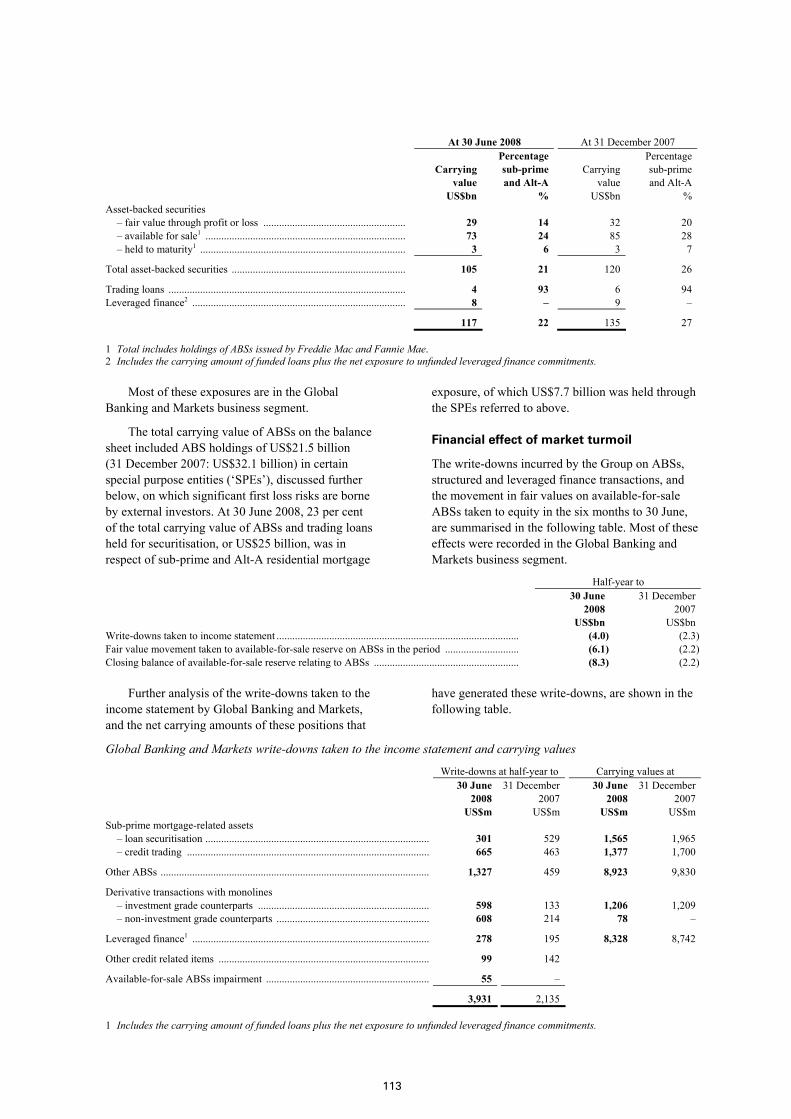
113
At 30 June 2008 At 31 December 2007
Carrying value
Percentage sub-prime and Alt-A
Carrying value
Percentage sub-prime and Alt-A
US$bn % US$bn % Asset-backed securities
– fair value through profit or loss ...................................................... 29 14 32 20 – available for sale1 ............................................................................ 73 24 85 28 – held to maturity1 .............................................................................. 3 6 3 7
Total asset-backed securities .................................................................. 105 21 120 26
Trading loans .......................................................................................... 4 93 6 94 Leveraged finance2 ................................................................................. 8 – 9 –
117 22 135 27
1 Total includes holdings of ABSs issued by Freddie Mac and Fannie Mae. 2 Includes the carrying amount of funded loans plus the net exposure to unfunded leveraged finance commitments.
Most of these exposures are in the Global Banking and Markets business segment.
The total carrying value of ABSs on the balance sheet included ABS holdings of US$21.5 billion (31 December 2007: US$32.1 billion) in certain special purpose entities (‘SPEs’), discussed further below, on which significant first loss risks are borne by external investors. At 30 June 2008, 23 per cent of the total carrying value of ABSs and trading loans held for securitisation, or US$25 billion, was in respect of sub-prime and Alt-A residential mortgage
exposure, of which US$7.7 billion was held through the SPEs referred to above.
Financial effect of market turmoil
The write-downs incurred by the Group on ABSs, structured and leveraged finance transactions, and the movement in fair values on available-for-sale ABSs taken to equity in the six months to 30 June, are summarised in the following table. Most of these effects were recorded in the Global Banking and Markets business segment.
Half-year to 30 June
2008 31 December
2007 US$bn US$bn Write-downs taken to income statement ............................................................................................ (4.0) (2.3)Fair value movement taken to available-for-sale reserve on ABSs in the period ............................ (6.1) (2.2)Closing balance of available-for-sale reserve relating to ABSs ....................................................... (8.3) (2.2)
Further analysis of the write-downs taken to the income statement by Global Banking and Markets, and the net carrying amounts of these positions that
have generated these write-downs, are shown in the following table.
Global Banking and Markets write-downs taken to the income statement and carrying values
Write-downs at half-year to Carrying values at
30 June 2008
31 December 2007
30 June 2008
31 December 2007
US$m US$m US$m US$m Sub-prime mortgage-related assets
– loan securitisation ..................................................................................... 301 529 1,565 1,965 – credit trading ............................................................................................ 665 463 1,377 1,700
Other ABSs ...................................................................................................... 1,327 459 8,923 9,830
Derivative transactions with monolines – investment grade counterparts ................................................................. 598 133 1,206 1,209 – non-investment grade counterparts .......................................................... 608 214 78 –
Leveraged finance1 .......................................................................................... 278 195 8,328 8,742
Other credit related items ................................................................................ 99 142
Available-for-sale ABSs impairment .............................................................. 55 –
3,931 2,135
1 Includes the carrying amount of funded loans plus the net exposure to unfunded leveraged finance commitments.
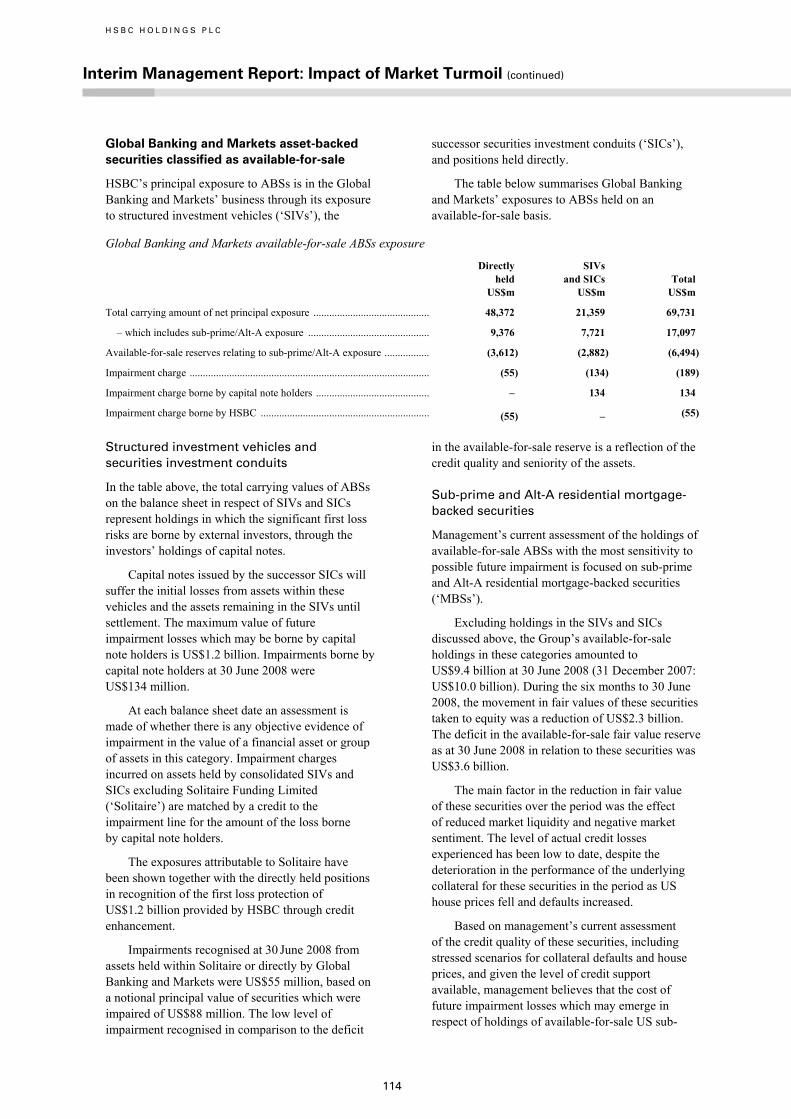
H S B C H O L D I N G S P L C
Interim Management Report: Impact of Market Turmoil (continued)
114
Global Banking and Markets asset-backed securities classified as available-for-sale
HSBC’s principal exposure to ABSs is in the Global Banking and Markets’ business through its exposure to structured investment vehicles (‘SIVs’), the
successor securities investment conduits (‘SICs’), and positions held directly.
The table below summarises Global Banking and Markets’ exposures to ABSs held on an available-for-sale basis.
Global Banking and Markets available-for-sale ABSs exposure
Directly held
SIVs and SICs Total
US$m US$m US$m
Total carrying amount of net principal exposure ............................................ 48,372 21,359 69,731
– which includes sub-prime/Alt-A exposure .............................................. 9,376 7,721 17,097
Available-for-sale reserves relating to sub-prime/Alt-A exposure ................. (3,612) (2,882) (6,494)
Impairment charge ........................................................................................... (55) (134) (189)
Impairment charge borne by capital note holders ........................................... – 134 134
Impairment charge borne by HSBC ................................................................ (55) – (55)
Structured investment vehicles and securities investment conduits
In the table above, the total carrying values of ABSs on the balance sheet in respect of SIVs and SICs represent holdings in which the significant first loss risks are borne by external investors, through the investors’ holdings of capital notes.
Capital notes issued by the successor SICs will suffer the initial losses from assets within these vehicles and the assets remaining in the SIVs until settlement. The maximum value of future impairment losses which may be borne by capital note holders is US$1.2 billion. Impairments borne by capital note holders at 30 June 2008 were US$134 million.
At each balance sheet date an assessment is made of whether there is any objective evidence of impairment in the value of a financial asset or group of assets in this category. Impairment charges incurred on assets held by consolidated SIVs and SICs excluding Solitaire Funding Limited (‘Solitaire’) are matched by a credit to the impairment line for the amount of the loss borne by capital note holders.
The exposures attributable to Solitaire have been shown together with the directly held positions in recognition of the first loss protection of US$1.2 billion provided by HSBC through credit enhancement.
Impairments recognised at 30 June 2008 from assets held within Solitaire or directly by Global Banking and Markets were US$55 million, based on a notional principal value of securities which were impaired of US$88 million. The low level of impairment recognised in comparison to the deficit
in the available-for-sale reserve is a reflection of the credit quality and seniority of the assets.
Sub-prime and Alt-A residential mortgage-backed securities
Management’s current assessment of the holdings of available-for-sale ABSs with the most sensitivity to possible future impairment is focused on sub-prime and Alt-A residential mortgage-backed securities (‘MBSs’).
Excluding holdings in the SIVs and SICs discussed above, the Group’s available-for-sale holdings in these categories amounted to US$9.4 billion at 30 June 2008 (31 December 2007: US$10.0 billion). During the six months to 30 June 2008, the movement in fair values of these securities taken to equity was a reduction of US$2.3 billion. The deficit in the available-for-sale fair value reserve as at 30 June 2008 in relation to these securities was US$3.6 billion.
The main factor in the reduction in fair value of these securities over the period was the effect of reduced market liquidity and negative market sentiment. The level of actual credit losses experienced has been low to date, despite the deterioration in the performance of the underlying collateral for these securities in the period as US house prices fell and defaults increased.
Based on management’s current assessment of the credit quality of these securities, including stressed scenarios for collateral defaults and house prices, and given the level of credit support available, management believes that the cost of future impairment losses which may emerge in respect of holdings of available-for-sale US sub-
115
prime and Alt-A residential MBSs is likely to be modest in relation to the fair value deficit in the available-for-sale fair value reserve at 30 June 2008.
Business model
Asset-backed securities, structured products and leveraged acquisition finance
HSBC is or has been involved in the following activities in these areas:
• the purchase of US mortgage loans with the intention of structuring and placing securitisations into the market;
• trading in ABSs, including MBSs, in secondary markets;
• the holding of MBSs and other ABSs in balance sheet management activities, with the intention of earning net interest income over the life of the securities;
• the holding of MBSs and other ABSs as part of investment portfolios, including the SIVs, SICs and money market funds described under ‘Special purpose entities’ below, with the intention of earning net interest income and management fees;
• MBSs or other ABSs held in the trading portfolio hedged through credit derivative protection, typically purchased from monoline insurers, with the intention of earning the spread differential over the life of the instruments; and
• leveraged acquisition finance: originating loans for the purposes of syndicating or selling them down in order to generate a trading profit and, to a lesser extent, holding them in order to earn interest margin over their lives.
Overall, these business activities were historically not a significant part of Global Banking and Markets’ business, and Global Banking and Markets was not reliant on the activities for any material aspect of its business operations or profitability.
The purchase and securitisation of US mortgage loans and the secondary trading of US MBSs was conducted in HSBC’s US MBSs business. This business was discontinued in 2007.
Special purpose entities
HSBC enters into certain transactions with customers in the ordinary course of business which involve the establishment of SPEs to facilitate customer transactions. Some of these SPEs hold assets whose fair values have been adversely affected by recent market conditions.
SPEs are used in HSBC’s business in order to provide structured investment opportunities for customers, facilitate the raising of funding for customers’ business activities, or diversify HSBC’s sources of funding and/or improve capital efficiency.
The use of SPEs is not a significant part of HSBC’s activities and HSBC is not reliant on the use of SPEs for any material part of its business operations or profitability. Detailed disclosures of HSBC’s sponsored SPEs are provided on page 137.
Risk management
The effect of the recent market turmoil on HSBC’s risk exposures, the way in which HSBC has managed risk exposures in this context, and any changes made in HSBC’s risk management polices and procedures in response to the market conditions, are set out in the following sections:
• Liquidity risk – ‘The impact of market turmoil on the Group’s liquidity risk position’ (see page 182).
• Market risk – ‘The impact of market turmoil on market risk’ (see page 184).
In addition to holdings of securitised and structured assets, HSBC also provides personal loans to customers in the US, a proportion of which are in the nature of sub-prime loans. HSBC’s exposure to US personal loans and receivables is set out in the Risk section – see ‘Areas of special interest – credit risk’ on page 161.
Accounting policies
HSBC’s accounting policies regarding the classification and valuation of financial instruments are in accordance with the requirements of IAS 32 ‘Financial Instruments: Presentation’ and IAS 39 ‘Financial Instruments: Recognition and Measurement’. HSBC has not made any changes to the accounting policies described on pages 347 to 361 of the Annual Report and Accounts 2007.
The following is a summary of certain key policies relevant to an understanding of the market turmoil disclosures:

H S B C H O L D I N G S P L C
Interim Management Report: Impact of Market Turmoil (continued)
116
Assets held at fair value with movements in fair value recognised in the income statement: this category includes ABSs that are held for trading or that are designated at fair value through profit or loss, and direct lending positions held for trading. The majority of HSBC’s holdings of these assets arise from securitisation and secondary market trading activity.
Both assets held for trading and assets designated at fair value through profit or loss, are recorded initially at fair value less transaction costs. Transaction costs are taken directly to the income statement. Subsequently, the fair values are remeasured, and gains and losses from changes in fair value are recognised in the income statement.
Assets are classified as held for trading if they have been acquired principally for the purpose of selling or repurchasing in the near term, or they form part of a portfolio of identified financial instruments that are managed together and for which there is evidence of a recent pattern of short-term profit-taking. Assets, other than those held for trading, are designated at fair value through profit or loss if they meet one or more of the designation criteria set out on page 352 of the Annual Report and Accounts 2007, and are so designated by management. The fair value designation once made, is irrevocable.
Assets held at fair value with movements in fair value recognised in equity: this category includes ABSs that are classified as available-for-sale including asset holdings in consolidated SPEs such as securities investment vehicles and conduits.
These securities are initially measured at fair value plus direct and incremental transaction costs. They are subsequently remeasured at fair value, and changes therein are recognised in equity in the ‘Available-for-sale fair value reserve’ until the securities are either sold, or impaired. When available-for-sale securities are sold, cumulative gains or losses previously recognised in equity are recognised in the income statement as ‘Gains less losses from financial investments’.
At each balance sheet date, an assessment is made of whether there is any objective evidence of impairment in the value of a financial asset or group of assets in this category.
Impairment losses are recognised if, and only if, there is objective evidence of impairment as a result of one or more events that occurred after the initial recognition of the asset (a ‘loss event’) and that loss event (or events) has an impact on the estimated future cash flows of the asset that can be reliably estimated.
If the asset is impaired, the difference between the asset’s acquisition cost and the current fair value, less any previous impairment, is removed from equity and recognised in the income statement. Any subsequent reduction in the fair value of an impaired asset is taken to the income statement.
Impairment losses for available-for-sale debt securities are recognised within ‘Loan impairment charges and other credit risk provisions’ in the income statement and impairment losses for available-for-sale equity securities are recognised within ‘Gains less losses from financial investments’ in the income statement.
Any impairment losses recognised in the income statement relating to ABSs are recorded in the income statement in the ‘Loan impairment charges and other credit risk provisions’ line. Impairment losses incurred on assets held by consolidated securities investment vehicles and conduits are matched by a credit to the impairment line for the amount of the loss borne by capital note holders.
In a subsequent period, if the fair value of the debt security increases and the increase can be objectively related to an event occurring after the impairment loss was recognised in the income statement that indicates that the debt security is no longer impaired, the impairment loss may be reversed through the income statement. Impairment losses on available-for-sale equity securities are not reversed.
Assets held at amortised cost: a small proportion of HSBC’s holdings of ABSs are held to maturity. These assets are initially recorded at fair value plus any directly attributable transaction costs and are subsequently measured at amortised cost using the effective interest method, less any impairment losses.
An analysis of ABSs and direct lending by balance sheet category is provided on page 118.
Leveraged finance: For certain leveraged finance and syndicated lending activities, HSBC may commit to underwrite loans on fixed contractual terms for specified periods of time, where the drawdown of the loan is contingent upon certain future events outside the control of HSBC. Where the loan arising from the lending commitment is expected to be held for trading, the commitment to lend is recorded as a trading derivative and measured at fair value through profit or loss. On drawdown, the loan is classified as held for trading, and measured at fair value through profit or loss.
Where it is not HSBC’s intention to trade the loan, a provision on the loan commitment is only

117
recorded where it is probable that HSBC will incur a loss. This may occur, for example, where a loss of principal is probable or the interest rate charged on the loan is lower than the cost of funding. On inception of the loan, the hold portion is recorded at its fair value. Where this fair value is lower than the cash amount advanced (for example, due to the rate of interest charged on the loan being below the market rate of interest), the write-down is charged to the income statement. The write-down will be recovered over the life of the loan, through the recognition of interest income using the effective interest rate method, unless the loan is or becomes impaired. The write-down is recorded as a reduction to other operating income.
An analysis of HSBC’s leveraged finance lending activity and its exposure to leveraged finance transactions through holdings of ABSs that are supported by leveraged finance-related collateral, is provided on page 127. The accounting policy for these securities is consistent with holdings of other ABSs described above.
Nature and extent of HSBC’s exposures
This section contains information on HSBC’s exposures to direct lending held at fair value through profit or loss, ABSs including MBSs and collateralised debt obligations (‘CDOs’), monoline insurers and leveraged finance transactions.
MBSs are securities that represent an interest in a group of mortgages. Investors in these securities have the right to receive future mortgage payments (interest and/or principal). Where an MBS references mortgages with different risk profiles, the MBS is classified according to the highest risk class. Consequently, an MBS with both sub-prime and Alt-A exposures is classified as sub-prime.
CDOs are securities in which ABSs and/or certain other related assets have been purchased and securitised by a third party, or securities which pay a return which is referenced to those assets. CDOs may feature exposure to sub-prime mortgage assets through the underlying assets. As there is often uncertainty surrounding the nature of the underlying collateral supporting CDOs, all CDOs supported by residential mortgage-related assets, irrespective of the level of sub-prime assets, are classified as sub-prime.
HSBC’s holdings of ABSs and CDOs, and its direct lending positions, include the following categories of collateral and lending activity:
• sub-prime: loans to customers who have limited credit histories, modest incomes, high debt-to-income ratios or have experienced credit problems caused by occasional delinquencies, prior charge-offs, bankruptcy or other credit-related actions. For US mortgages, US credit scores are primarily used to determine whether a loan is sub-prime. US home equity lines of credit are classified as sub-prime. For non-US mortgages, management judgement is used to identify loans of similar risk characteristics to sub-prime, for example, UK non-conforming mortgages (see below);
• US home equity lines of credit (‘HELOCs’): a form of revolving credit facility provided to customers, which is supported by a first or second lien charge over residential property;
• US Alt-A: loans classified as Alt-A are regarded as lower risk than sub-prime, but they share higher risk characteristics than lending under normal criteria. US credit scores, as well as the level of mortgage documentation held (such as proof of income), are considered when determining whether an Alt-A classification is appropriate. Non-agency mortgages in the US are classified as Alt-A if they do not meet the criteria for classification as sub-prime. These are mortgages not eligible to be sold to the major US government agency, Ginnie Mae (Government National Mortgage Association), and government sponsored enterprises in the mortgage market, Fannie Mae (the Federal National Mortgage Association) and Freddie Mac (the Federal Home Loan Mortgage Corporation);
• US government agency mortgage-related assets: securities that are guaranteed by US Government agencies, such as Ginnie Mae;
• US Government sponsored enterprises mortgage-related assets: securities that are guaranteed by US Government sponsored entities, including Fannie Mae and Freddie Mac;
• UK non-conforming mortgage-related assets: UK mortgages that do not meet normal lending criteria. This includes instances where the normal level of documentation has not been provided (for example, in the case of self-certification of income), or where increased risk factors, such as poor credit history, result in lending at a rate that is higher than the normal lending rate. UK non-conforming mortgages are treated as sub-prime exposures; and
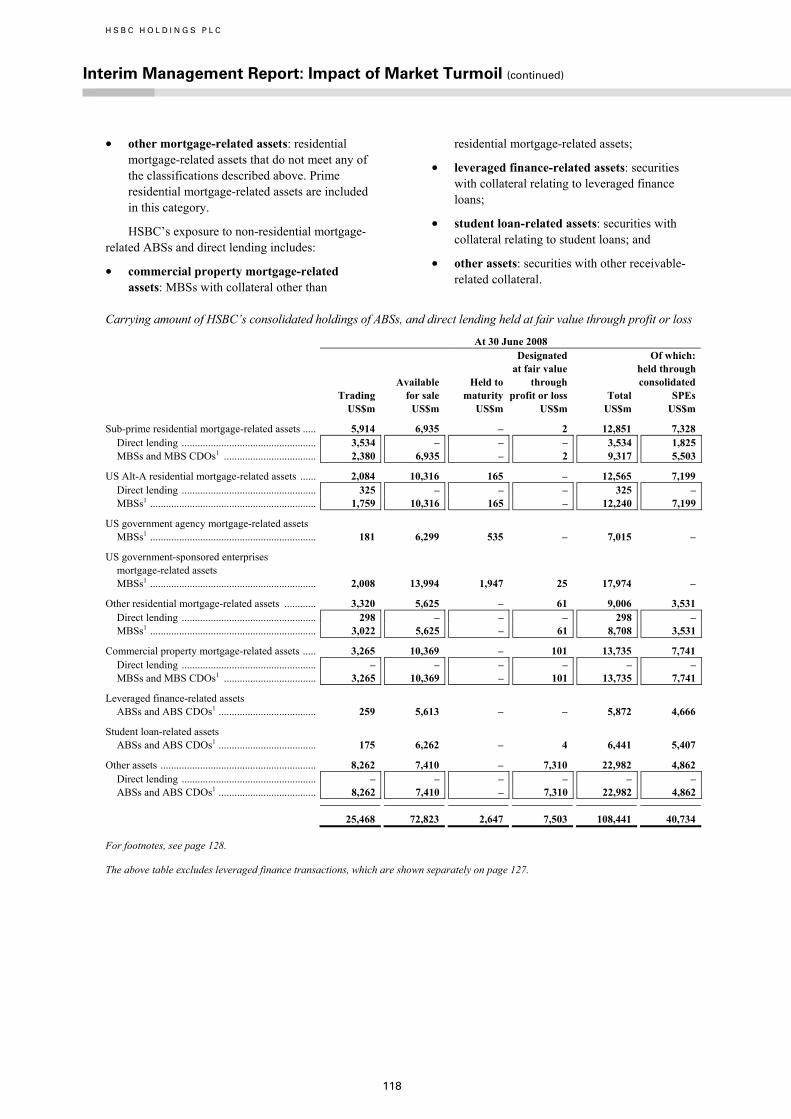
H S B C H O L D I N G S P L C
Interim Management Report: Impact of Market Turmoil (continued)
118
• other mortgage-related assets: residential mortgage-related assets that do not meet any of the classifications described above. Prime residential mortgage-related assets are included in this category.
HSBC’s exposure to non-residential mortgage-related ABSs and direct lending includes:
• commercial property mortgage-related assets: MBSs with collateral other than
residential mortgage-related assets;
• leveraged finance-related assets: securities with collateral relating to leveraged finance loans;
• student loan-related assets: securities with collateral relating to student loans; and
• other assets: securities with other receivable-related collateral.
Carrying amount of HSBC’s consolidated holdings of ABSs, and direct lending held at fair value through profit or loss
At 30 June 2008
Trading Available for sale
Held to maturity
Designated at fair value through profit or loss Total
Of which:held through consolidated SPEs
US$m US$m US$m US$m US$m US$m
Sub-prime residential mortgage-related assets ..... 5,914 6,935 – 2 12,851 7,328 Direct lending ................................................... 3,534 – – – 3,534 1,825MBSs and MBS CDOs1 ................................... 2,380 6,935 – 2 9,317 5,503
US Alt-A residential mortgage-related assets ...... 2,084 10,316 165 – 12,565 7,199 Direct lending ................................................... 325 – – – 325 –MBSs1 ............................................................... 1,759 10,316 165 – 12,240 7,199
US government agency mortgage-related assets MBSs1 ............................................................... 181 6,299 535 – 7,015 –
US government-sponsored enterprises mortgage-related assets
MBSs1 ............................................................... 2,008 13,994 1,947 25 17,974 –
Other residential mortgage-related assets ............ 3,320 5,625 – 61 9,006 3,531 Direct lending ................................................... 298 – – – 298 –MBSs1 ............................................................... 3,022 5,625 – 61 8,708 3,531
Commercial property mortgage-related assets ..... 3,265 10,369 – 101 13,735 7,741 Direct lending ................................................... – – – – – –MBSs and MBS CDOs1 ................................... 3,265 10,369 – 101 13,735 7,741
Leveraged finance-related assets ABSs and ABS CDOs1 ..................................... 259 5,613 – – 5,872 4,666
Student loan-related assets ABSs and ABS CDOs1 ..................................... 175 6,262 – 4 6,441 5,407
Other assets ........................................................... 8,262 7,410 – 7,310 22,982 4,862 Direct lending ................................................... – – – – – –ABSs and ABS CDOs1 ..................................... 8,262 7,410 – 7,310 22,982 4,862
25,468 72,823 2,647 7,503 108,441 40,734
For footnotes, see page 128.
The above table excludes leveraged finance transactions, which are shown separately on page 127.
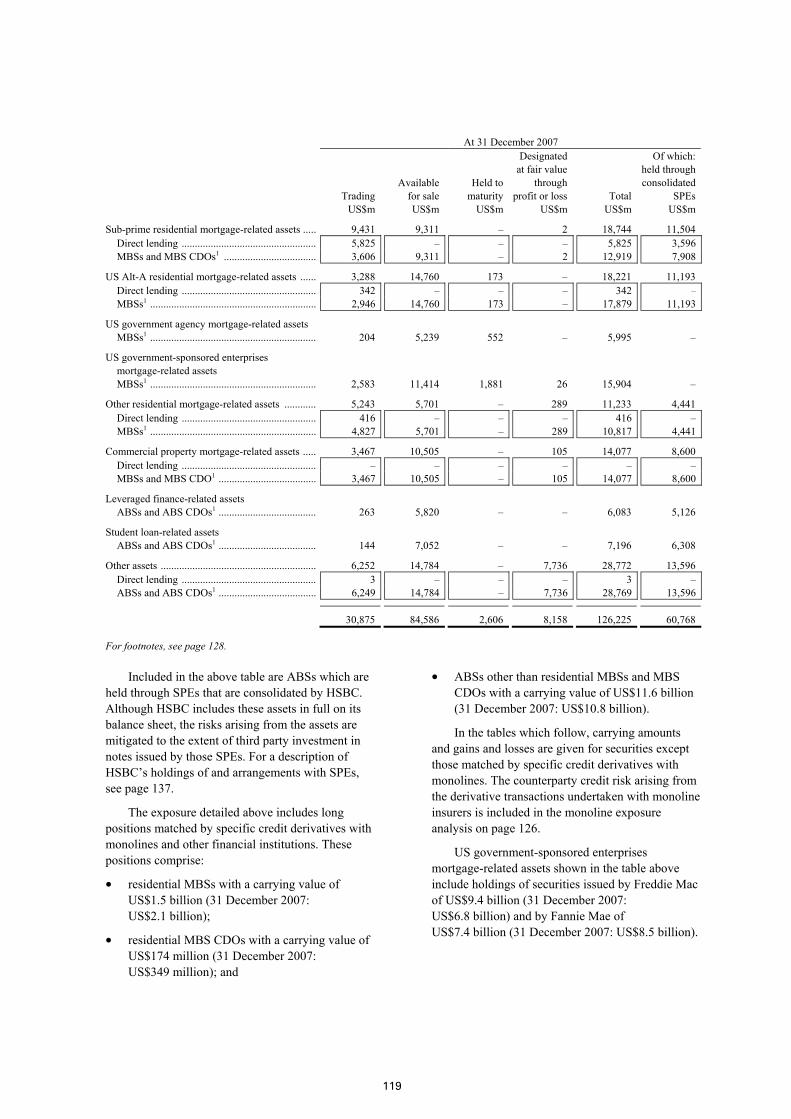
119
At 31 December 2007
Trading Available for sale
Held to maturity
Designated at fair value through profit or loss Total
Of which: held through consolidated SPEs
US$m US$m US$m US$m US$m US$m
Sub-prime residential mortgage-related assets ..... 9,431 9,311 – 2 18,744 11,504 Direct lending ................................................... 5,825 – – – 5,825 3,596MBSs and MBS CDOs1 ................................... 3,606 9,311 – 2 12,919 7,908
US Alt-A residential mortgage-related assets ...... 3,288 14,760 173 – 18,221 11,193 Direct lending ................................................... 342 – – – 342 –MBSs1 ............................................................... 2,946 14,760 173 – 17,879 11,193
US government agency mortgage-related assets MBSs1 ............................................................... 204 5,239 552 – 5,995 –
US government-sponsored enterprises mortgage-related assets
MBSs1 ............................................................... 2,583 11,414 1,881 26 15,904 –
Other residential mortgage-related assets ............ 5,243 5,701 – 289 11,233 4,441 Direct lending ................................................... 416 – – – 416 –MBSs1 ............................................................... 4,827 5,701 – 289 10,817 4,441
Commercial property mortgage-related assets ..... 3,467 10,505 – 105 14,077 8,600 Direct lending ................................................... – – – – – –MBSs and MBS CDO1 ..................................... 3,467 10,505 – 105 14,077 8,600
Leveraged finance-related assets ABSs and ABS CDOs1 ..................................... 263 5,820 – – 6,083 5,126
Student loan-related assets ABSs and ABS CDOs1 ..................................... 144 7,052 – – 7,196 6,308
Other assets ........................................................... 6,252 14,784 – 7,736 28,772 13,596 Direct lending ................................................... 3 – – – 3 –ABSs and ABS CDOs1 ..................................... 6,249 14,784 – 7,736 28,769 13,596
30,875 84,586 2,606 8,158 126,225 60,768
For footnotes, see page 128.
Included in the above table are ABSs which are held through SPEs that are consolidated by HSBC. Although HSBC includes these assets in full on its balance sheet, the risks arising from the assets are mitigated to the extent of third party investment in notes issued by those SPEs. For a description of HSBC’s holdings of and arrangements with SPEs, see page 137.
The exposure detailed above includes long positions matched by specific credit derivatives with monolines and other financial institutions. These positions comprise:
• residential MBSs with a carrying value of US$1.5 billion (31 December 2007: US$2.1 billion);
• residential MBS CDOs with a carrying value of US$174 million (31 December 2007: US$349 million); and
• ABSs other than residential MBSs and MBS CDOs with a carrying value of US$11.6 billion (31 December 2007: US$10.8 billion).
In the tables which follow, carrying amounts and gains and losses are given for securities except those matched by specific credit derivatives with monolines. The counterparty credit risk arising from the derivative transactions undertaken with monoline insurers is included in the monoline exposure analysis on page 126.
US government-sponsored enterprises mortgage-related assets shown in the table above include holdings of securities issued by Freddie Mac of US$9.4 billion (31 December 2007: US$6.8 billion) and by Fannie Mae of US$7.4 billion (31 December 2007: US$8.5 billion).

H S B C H O L D I N G S P L C
Interim Management Report: Impact of Market Turmoil (continued)
120
HSB
C’s
con
solid
ated
hol
ding
s of U
S AB
Ss, a
nd d
irec
t len
ding
hel
d at
fair
val
ue th
roug
h pr
ofit
or lo
ss
H
alf-y
ear
to 3
0 Ju
ne 2
008
A
t 30
June
200
8
At 3
1 D
ecem
ber 2
007
U
nrea
lised
gain
s and
(loss
es)3
R
ealis
ed
gai
ns a
nd
(lo
sses
)4
Fai
r va
lue
mov
emen
ts
thro
ugh
eq
uity
5
Impa
ir-
m
ent6
G
ross
pri
ncip
al7
C
DS
gr
oss
prot
ectio
n8 N
et
pri
ncip
al e
xpos
ure9
Car
ryin
g
amou
nt10
G
ross
prin
cipa
l7
C
DS
gr
oss
pro
tect
ion8
N
et
pr
inci
pal
ex
posu
re9
C
arry
ing
am
ount
10
US$
m
U
S$m
US$
m
U
S$m
US$
m
U
S$m
US$
m
U
S$m
US$
m
U
S$m
US$
m
U
S$m
U
S su
b-pr
ime
resi
dent
ial m
ortg
age-
rela
ted
asse
ts
Dire
ct le
ndin
g ...
......
......
......
......
......
......
......
(2
34)
(8)
– –
4,19
9 –
4,19
9 3,
534
6,28
8 –
6,28
8 5,
825
MB
Ss1 ..
......
......
......
......
......
......
......
......
......
. (6
21)
6 (9
03)
(29)
8,23
9 60
1 7,
638
5,28
3 9,
576
657
8,91
9 7,
981
– hi
gh g
rade
2 .....
......
......
......
......
......
......
...
(228
)7
(518
)(2
9)5,
930
571
5,35
94,
142
9,07
964
78,
432
7,80
7 –
rate
d C
to A
.....
......
......
......
......
......
......
.. (3
33)
–(3
85)
–2,
292
30
2,26
21,
118
462
1045
215
3 –
not p
ublic
ly ra
ted
......
......
......
......
......
....
(60)
(1)
––
17–
1723
35
–35
21
MB
S C
DO
s1 .....
......
......
......
......
......
......
......
. (1
23)
– (3
2)(2
1)1,
200
569
631
152
1,15
7 65
2 50
5 44
0 –
high
gra
de2 ..
......
......
......
......
......
......
......
(8
)–
(32)
–23
050
18
0 97
92
345
446
941
1 –
rate
d C
to A
.....
......
......
......
......
......
......
.. (1
15)
––
(21)
970
519
451
55
234
198
3629
–
not p
ublic
ly ra
ted
......
......
......
......
......
....
––
––
––
– –
––
––
(9
78)
(2)
(935
)(5
0)13
,638
1,
170
12,4
68
8,96
9 17
,021
1,
309
15,7
12
14,2
46
US
Alt-
A re
side
ntia
l mor
tgag
e-re
late
d
asse
ts
Dire
ct le
ndin
g ...
......
......
......
......
......
......
......
–
– –
– 32
9 –
329
325
341
– 34
1 34
2 M
BSs
1 .....
......
......
......
......
......
......
......
......
....
(368
)(5
9)(3
,243
)(5
)17
,548
20
4 17
,344
11
,349
19
,175
20
5 18
,970
17
,708
–
high
gra
de2 ..
......
......
......
......
......
......
......
(3
40)
(49)
(3,1
15)
(5)
16,8
9820
4 16
,694
10
,969
19
,099
205
18,8
9417
,640
–
rate
d C
to A
.....
......
......
......
......
......
......
.. (2
9)(9
)(1
00)
–53
3–
533
299
64–
6456
–
not p
ublic
ly ra
ted
......
......
......
......
......
....
1(1
)(2
8)–
117
– 11
7 81
12
–12
12
(3
68)
(59)
(3,2
43)
(5)
17,8
77
204
17,6
73
11,6
74
19,5
16
205
19,3
11
18,0
50
US
gove
rnm
ent a
genc
y m
ortg
age-
rela
ted
asse
ts
MB
Ss1 ..
......
......
......
......
......
......
......
......
......
. (2
)–
(54)
– 7,
052
– 7,
052
7,01
5 5,
996
– 5,
996
5,99
5 –
high
gra
de2 ..
......
......
......
......
......
......
......
(2
)–
(54)
–7,
052
– 7,
052
7,01
5 5,
996
–5,
996
5,99
5 –
rate
d C
to A
.....
......
......
......
......
......
......
.. –
––
––
– –
––
––
– –
not p
ublic
ly ra
ted
......
......
......
......
......
....
––
––
––
– –
––
––
US
gove
rnm
ent-s
pons
ored
ent
erpr
ises
m
ortg
age-
rela
ted
asse
ts
MB
Ss1 ..
......
......
......
......
......
......
......
......
......
. (5
0)40
(9
1)–
18,2
49
– 18
,249
17
,974
16
,125
–
16,1
25
15,9
04
– hi
gh g
rade
2 .....
......
......
......
......
......
......
...
(50)
40(9
1)–
18,2
49–
18,2
49
17,9
74
16,1
25–
16,1
2515
,904
–
rate
d C
to A
.....
......
......
......
......
......
......
.. –
––
––
– –
––
––
– –
not p
ublic
ly ra
ted
......
......
......
......
......
....
––
––
––
– –
––
––
Bal
ance
car
ried
forw
ard
......
......
......
......
......
.. (1
,398
)(2
1)(4
,323
)(5
5)56
,816
1,
374
55,4
42
45,6
32
58,6
58
1,51
4 57
,144
54
,195
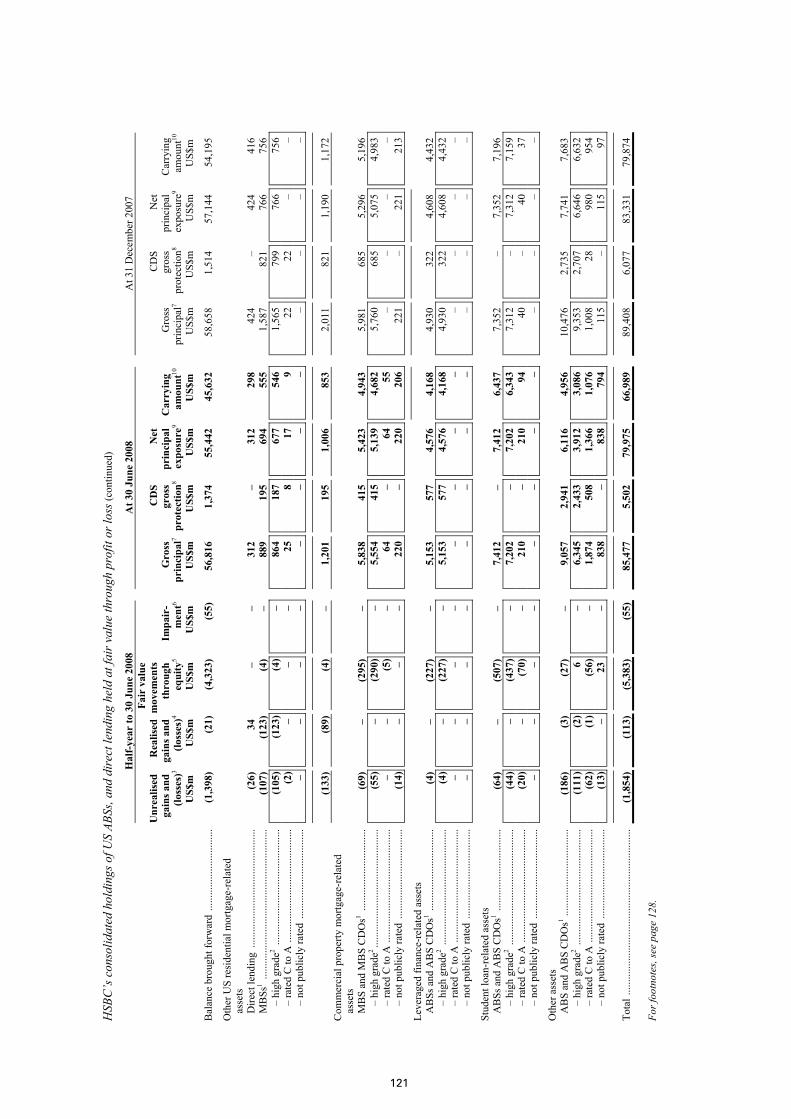
121
HSB
C’s
con
solid
ated
hol
ding
s of U
S AB
Ss, a
nd d
irec
t len
ding
hel
d at
fair
val
ue th
roug
h pr
ofit
or lo
ss (c
ontin
ued)
H
alf-y
ear
to 3
0 Ju
ne 2
008
A
t 30
June
200
8
At 3
1 D
ecem
ber 2
007
U
nrea
lised
gain
s and
(loss
es)3
R
ealis
ed
gai
ns a
nd
(lo
sses
)4
Fai
r va
lue
mov
emen
ts
th
roug
h
equi
ty5
Im
pair
-
men
t6
G
ross
pri
ncip
al7
C
DS
gros
s pr
otec
tion8
Net
p
rinc
ipal
exp
osur
e9 C
arry
ing
am
ount
10
G
ross
prin
cipa
l7
C
DS
gr
oss
pro
tect
ion8
N
et
pr
inci
pal
ex
posu
re9
C
arry
ing
am
ount
10
US$
m
US$
m
U
S$m
US$
m
U
S$m
US$
m
U
S$m
US$
m
US$
m
U
S$m
US$
m
U
S$m
Bal
ance
bro
ught
forw
ard
......
......
......
......
......
. (1
,398
)(2
1)(4
,323
)(5
5)56
,816
1,
374
55,4
42
45,6
32
58,6
58
1,51
4 57
,144
54
,195
Oth
er U
S re
side
ntia
l mor
tgag
e-re
late
d
asse
ts
D
irect
lend
ing
......
......
......
......
......
......
......
...
(26)
34
– –
312
– 31
2 29
8 42
4 –
424
416
MB
Ss1 ..
......
......
......
......
......
......
......
......
......
. (1
07)
(123
)(4
)–
889
195
694
555
1,58
7 82
1 76
6 75
6 –
high
gra
de2 ..
......
......
......
......
......
......
......
(1
05)
(123
)(4
)–
864
187
677
546
1,56
579
976
675
6 –
rate
d C
to A
.....
......
......
......
......
......
......
.. (2
)–
––
258
179
2222
––
– no
t pub
licly
rate
d ...
......
......
......
......
......
. –
––
––
– –
––
––
–
(1
33)
(89)
(4)
– 1,
201
195
1,00
6 85
3 2,
011
821
1,19
0 1,
172
Com
mer
cial
pro
perty
mor
tgag
e-re
late
d
asse
ts
M
BS
and
MB
S C
DO
s1 ....
......
......
......
......
...
(69)
– (2
95)
– 5,
838
415
5,42
3 4,
943
5,98
1 68
5 5,
296
5,19
6 –
high
gra
de2...
......
......
......
......
......
......
......
(5
5)–
(290
)–
5,55
441
5 5,
139
4,68
25,
760
685
5,07
54,
983
– ra
ted
C to
A ..
......
......
......
......
......
......
.....
––
(5)
–64
– 64
55–
––
– –
not p
ublic
ly ra
ted
......
......
......
......
......
....
(14)
––
–22
0–
220
206
221
–22
121
3
Leve
rage
d fin
ance
-rel
ated
ass
ets
A
BSs
and
AB
S C
DO
s1 .....
......
......
......
......
.. (4
)–
(227
)–
5,15
3 57
7 4,
576
4,16
8 4,
930
322
4,60
8 4,
432
– hi
gh g
rade
2 .....
......
......
......
......
......
......
...
(4)
–(2
27)
–5,
153
577
4,57
64,
168
4,93
032
24,
608
4,43
2 –
rate
d C
to A
.....
......
......
......
......
......
......
.. –
––
––
– –
––
––
– –
not p
ublic
ly ra
ted
......
......
......
......
......
....
––
––
––
––
––
––
Stud
ent l
oan-
rela
ted
asse
ts
A
BSs
and
AB
S C
DO
s1 .....
......
......
......
......
.. (6
4)–
(507
)–
7,41
2 –
7,41
2 6,
437
7,35
2 –
7,35
2 7,
196
– hi
gh g
rade
2 .....
......
......
......
......
......
......
...
(44)
–(4
37)
–7,
202
– 7,
202
6,34
37,
312
–7,
312
7,15
9 –
rate
d C
to A
.....
......
......
......
......
......
......
.. (2
0)–
(70)
–21
0–
210
9440
–40
37
– no
t pub
licly
rate
d ...
......
......
......
......
......
. –
––
––
– –
––
––
–
Oth
er a
sset
s
AB
S an
d A
BS
CD
Os1 ..
......
......
......
......
......
. (1
86)
(3)
(27)
– 9,
057
2,94
1 6,
116
4,95
6 10
,476
2,
735
7,74
1 7,
683
– hi
gh g
rade
2 .....
......
......
......
......
......
......
...
(111
)(2
)6
–6,
345
2,43
3 3,
912
3,08
69,
353
2,70
76,
646
6,63
2 –
rate
d C
to A
.....
......
......
......
......
......
......
.. (6
2)(1
)(5
6)–
1,87
450
8 1,
366
1,07
61,
008
2898
095
4 –
not p
ublic
ly ra
ted
......
......
......
......
......
....
(13)
–23
–83
8–
838
794
115
–11
597
Tota
l ....
......
......
......
......
......
......
......
......
......
.....
(1,8
54)
(113
)(5
,383
)(5
5)85
,477
5,
502
79,9
75
66,9
89
89,4
08
6,07
7 83
,331
79
,874
For f
ootn
otes
, see
pag
e 12
8.

122
H S B C H O L D I N G S P L C
Interim Management Report: Impact of Market Turmoil (continued)
HSB
C’s
con
solid
ated
hol
ding
s of U
K A
BSs,
and
dire
ct le
ndin
g he
ld a
t fai
r val
ue th
roug
h pr
ofit
or lo
ss
H
alf-y
ear
to 3
0 Ju
ne 2
008
A
t 30
June
200
8
At 3
1 D
ecem
ber 2
007
U
nrea
lised
gain
s and
(loss
es)3
R
ealis
ed
gai
ns a
nd
(lo
sses
)4
Fai
r va
lue
mov
emen
ts
th
roug
h
equi
ty5
Im
pair
-
men
t6
G
ross
p
rinc
ipal
7
C
DS
gros
s pr
otec
tion8
Net
p
rinc
ipal
exp
osur
e9 C
arry
ing
am
ount
10
G
ross
prin
cipa
l7
C
DS
gr
oss
pro
tect
ion8
N
et
pr
inci
pal
ex
posu
re9
C
arry
ing
am
ount
10
US$
m
U
S$m
US$
m
U
S$m
US$
m
U
S$m
US$
m
U
S$m
U
S$m
US$
m
U
S$m
US$
m
UK
non
-con
form
ing
resi
dent
ial m
ortg
age-
rela
ted
asse
ts
Dire
ct le
ndin
g ...
......
......
......
......
......
......
......
–
– –
– –
– –
– –
– –
– M
BSs
1 .....
......
......
......
......
......
......
......
......
....
(20)
10
(92)
– 2,
851
– 2,
851
2,62
5 3,
355
– 3,
355
3,21
1 –
high
gra
de2 ..
......
......
......
......
......
......
......
(1
2)10
(88)
–2,
793
–
2,79
3 2,
585
3,32
1–
3,32
13,
183
– ra
ted
C to
A ..
......
......
......
......
......
......
.....
(8)
–(4
)–
52–
52
36
28–
2824
–
not p
ublic
ly ra
ted
......
......
......
......
......
....
––
––
6–
6
46
–6
4
MB
S C
DO
s1 .....
......
......
......
......
......
......
......
. –
– –
– –
– –
– –
– –
– –
high
gra
de2 ..
......
......
......
......
......
......
......
–
––
––
–
– –
––
––
– ra
ted
C to
A ..
......
......
......
......
......
......
.....
––
––
––
–
––
––
– –
not p
ublic
ly ra
ted
......
......
......
......
......
....
––
––
––
–
––
––
–
(2
0)10
(9
2)–
2,85
1 –
2,85
1 2,
625
3,35
5 –
3,35
5 3,
211
Oth
er U
K re
siden
tial m
ortg
age-
rela
ted
asse
ts
Dire
ct le
ndin
g ...
......
......
......
......
......
......
......
–
– –
– –
– –
– –
– –
– M
BSs
1 .....
......
......
......
......
......
......
......
......
....
(39)
– (9
9)–
5,49
4 –
5,49
4 5,
128
5,94
3 –
5,94
3 5,
640
– hi
gh g
rade
2 .....
......
......
......
......
......
......
...
(23)
–(9
8)–
5,12
6–
5,
126
4,80
35,
411
–5,
411
5,15
6 –
rate
d C
to A
.....
......
......
......
......
......
......
.. (1
6)–
(1)
–35
9–
35
9 31
652
0–
520
472
– no
t pub
licly
rate
d ...
......
......
......
......
......
. –
––
–9
–
9 9
12–
1212
(3
9)–
(99)
– 5,
494
– 5,
494
5,12
8 5,
943
– 5,
943
5,64
0
Com
mer
cial
pro
perty
mor
tgag
e-re
late
d
asse
ts
Dire
ct le
ndin
g ...
......
......
......
......
......
......
......
–
– –
– –
– –
– –
– –
– M
BSs
and
MB
S C
DO
s1 .....
......
......
......
......
. (7
1)–
(186
)–
5,29
5 10
5,
285
4,83
3 5,
330
– 5,
330
4,90
2 –
high
gra
de2 ..
......
......
......
......
......
......
......
(2
2)–
(180
)–
4,33
610
4,32
6 3,
980
4,43
7–
4,43
74,
095
– ra
ted
C to
A ..
......
......
......
......
......
......
.....
(12)
–(2
)–
185
–
185
151
173
–17
311
3 –
not p
ublic
ly ra
ted
......
......
......
......
......
....
(37)
–(4
)–
774
–
774
702
720
–72
069
4
(7
1)–
(186
)–
5,29
5 10
5,
285
4,83
3 5,
330
– 5,
330
4,90
2
Bal
ance
car
ried
forw
ard
......
......
......
......
......
.. (1
30)
10
(377
)–
13,6
40
10
13,6
30
12,5
86
14,6
28
– 14
,628
13
,753

123
HSB
C’s
con
solid
ated
hol
ding
s of U
K A
BSs,
and
dire
ct le
ndin
g he
ld a
t fai
r val
ue th
roug
h pr
ofit
or lo
ss (c
ontin
ued)
H
alf-y
ear
to 3
0 Ju
ne 2
008
A
t 30
June
200
8
At 3
1 D
ecem
ber 2
007
U
nrea
lised
gain
s and
(loss
es)3
R
ealis
ed
gai
ns a
nd
(lo
sses
)4
Fai
r va
lue
mov
emen
ts
th
roug
h
equi
ty5
Im
pair
-
men
t6
G
ross
p
rinc
ipal
7
C
DS
gros
s pr
otec
tion8
Net
p
rinc
ipal
exp
osur
e9 C
arry
ing
am
ount
10
G
ross
prin
cipa
l7
C
DS
gr
oss
pro
tect
ion8
N
et
pr
inci
pal
ex
posu
re9
C
arry
ing
am
ount
10
US$
m
U
S$m
US$
m
U
S$m
US$
m
U
S$m
US$
m
U
S$m
U
S$m
US$
m
U
S$m
US$
m
Bal
ance
bro
ught
forw
ard
......
......
......
......
......
. (1
30)
10
(377
)–
13,6
40
10
13,6
30
12,5
86
14
,628
–
14,6
28
13,7
53
Leve
rage
d fin
ance
-rel
ated
ass
ets
AB
Ss a
nd A
BS
CD
Os1 ..
......
......
......
......
.....
– –
(13)
– 1,
315
946
369
347
675
330
345
336
– hi
gh g
rade
2 .....
......
......
......
......
......
......
...
––
(13)
–98
461
5 36
934
7 36
621
345
336
– ra
ted
C to
A ..
......
......
......
......
......
......
.....
––
––
––
––
––
––
– no
t pub
licly
rate
d ...
......
......
......
......
......
. –
––
–33
133
1 –
– 30
930
9–
–
Stud
ent l
oan-
rela
ted
asse
ts
AB
Ss a
nd A
BS
CD
Os1 ..
......
......
......
......
.....
– –
– –
4 –
4 4
– –
– –
– hi
gh g
rade
2 .....
......
......
......
......
......
......
...
––
––
4–
44
––
––
– ra
ted
C to
A ..
......
......
......
......
......
......
.....
––
––
––
––
––
––
– no
t pub
licly
rate
d ...
......
......
......
......
......
. –
––
––
––
––
––
Oth
er a
sset
s
D
irect
lend
ing
......
......
......
......
......
......
......
...
– –
– –
– –
– –
– –
– –
AB
S an
d A
BS
CD
Os1 ..
......
......
......
......
......
. (8
1)–
(186
)–
10,1
24
6,76
0 3,
364
3,03
3 9,
766
6,80
2 2,
964
2,87
9 –
high
gra
de2 ..
......
......
......
......
......
......
......
(5
3)–
(152
)–
2,77
2–
2,77
22,
496
2,31
5–
2,31
52,
258
– ra
ted
C to
A ..
......
......
......
......
......
......
.....
(10)
–(3
4)–
203
– 20
315
9 31
7–
317
309
– no
t pub
licly
rate
d ...
......
......
......
......
......
. (1
8)–
––
7,14
96,
760
389
378
7,13
46,
802
332
312
(8
1)–
(186
)–
10,1
24
6,76
0 3,
364
3,03
3 9,
766
6,80
2 2,
964
2,87
9
Tota
l ....
......
......
......
......
......
......
......
......
......
.....
(211
)10
(5
76)
– 25
,083
7,
716
17,3
67
15,9
70
25,0
69
7,13
2 17
,937
16
,968
For f
ootn
otes
, see
pag
e 12
8.
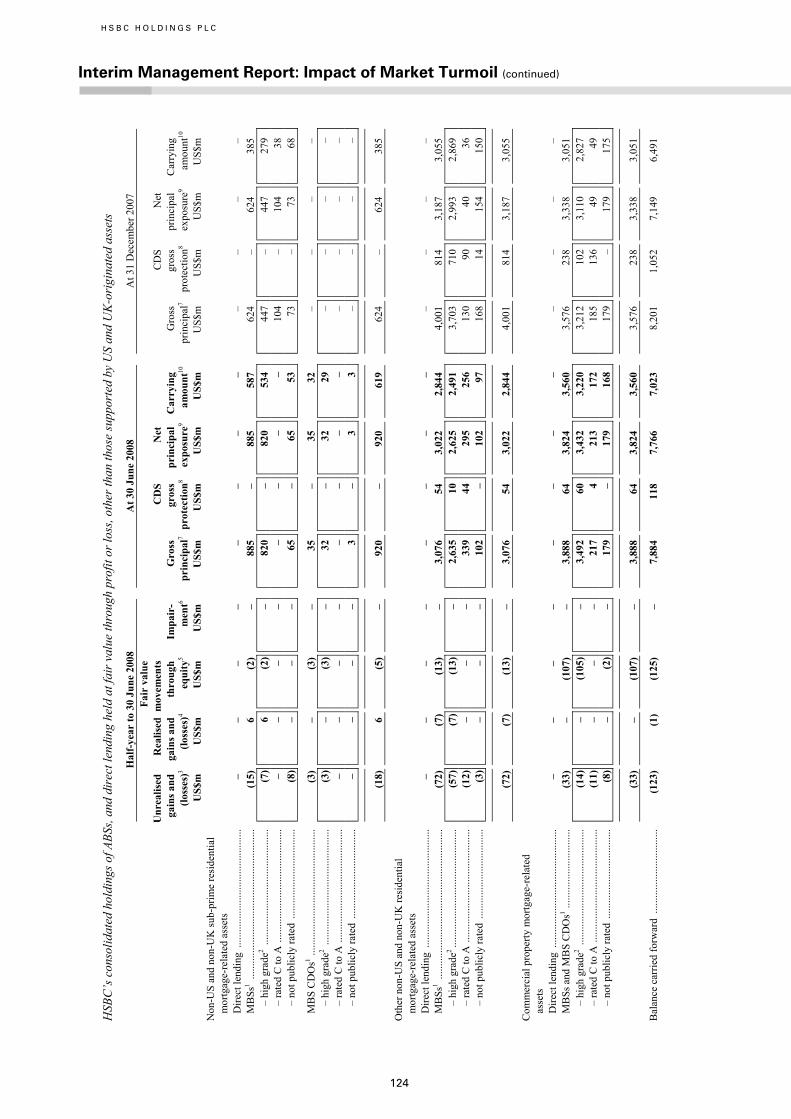
124
H S B C H O L D I N G S P L C
Interim Management Report: Impact of Market Turmoil (continued)
HSB
C’s
con
solid
ated
hol
ding
s of A
BSs,
and
dire
ct le
ndin
g he
ld a
t fai
r val
ue th
roug
h pr
ofit
or lo
ss, o
ther
than
thos
e su
ppor
ted
by U
S an
d U
K-o
rigi
nate
d as
sets
H
alf-y
ear
to 3
0 Ju
ne 2
008
A
t 30
June
200
8
At 3
1 D
ecem
ber 2
007
U
nrea
lised
gain
s and
(loss
es)3
R
ealis
ed
gai
ns a
nd
(lo
sses
)4
Fai
r va
lue
mov
emen
ts
thro
ugh
e
quity
5
Impa
ir-
m
ent6
G
ross
p
rinc
ipal
7
C
DS
gros
s pr
otec
tion8
Net
p
rinc
ipal
exp
osur
e9 C
arry
ing
am
ount
10
G
ross
prin
cipa
l7
C
DS
gr
oss
pro
tect
ion8
N
et
pr
inci
pal
ex
posu
re9
C
arry
ing
am
ount
10
US$
m
U
S$m
US$
m
U
S$m
US$
m
U
S$m
US$
m
U
S$m
U
S$m
US$
m
U
S$m
US$
m
Non
-US
and
non-
UK
sub-
prim
e re
side
ntia
l m
ortg
age-
rela
ted
asse
ts
Dire
ct le
ndin
g ...
......
......
......
......
......
......
......
–
– –
– –
– –
– –
– –
– M
BSs
1 .....
......
......
......
......
......
......
......
......
....
(15)
6 (2
)–
885
– 88
5 58
7 62
4 –
624
385
– hi
gh g
rade
2 .....
......
......
......
......
......
......
...
(7)
6(2
)–
820
–
820
534
447
–44
7 27
9 –
rate
d C
to A
.....
......
......
......
......
......
......
.. –
––
––
–
– –
104
–10
4 38
–
not p
ublic
ly ra
ted
......
......
......
......
......
....
(8)
––
–65
–
65
53
73–
73
68
MB
S C
DO
s1 .....
......
......
......
......
......
......
......
. (3
)–
(3)
– 35
–
35
32
– –
– –
– hi
gh g
rade
2 .....
......
......
......
......
......
......
...
(3)
–(3
)–
32–
32
29
–
––
– –
rate
d C
to A
.....
......
......
......
......
......
......
.. –
––
––
–
– –
––
– –
– no
t pub
licly
rate
d ...
......
......
......
......
......
. –
––
–3
–
3 3
––
– –
(1
8)6
(5)
– 92
0 –
920
619
624
– 62
4 38
5
Oth
er n
on-U
S an
d no
n-U
K re
side
ntia
l m
ortg
age-
rela
ted
asse
ts
Dire
ct le
ndin
g ...
......
......
......
......
......
......
......
–
– –
– –
– –
– –
– –
– M
BSs
1 .....
......
......
......
......
......
......
......
......
....
(72)
(7)
(13)
– 3,
076
54
3,02
2 2,
844
4,00
1 81
4 3,
187
3,05
5 –
high
gra
de2...
......
......
......
......
......
......
......
(5
7)(7
)(1
3)–
2,63
510
2,62
5 2,
491
3,70
371
02,
993
2,86
9 –
rate
d C
to A
.....
......
......
......
......
......
......
.. (1
2)–
––
339
44
29
5 25
6 13
090
40
36
– no
t pub
licly
rate
d ...
......
......
......
......
......
. (3
)–
––
102
–
102
97
168
1415
4 15
0
(7
2)(7
)(1
3)–
3,07
6 54
3,
022
2,84
4 4,
001
814
3,18
7 3,
055
Com
mer
cial
pro
perty
mor
tgag
e-re
late
d
asse
ts
Dire
ct le
ndin
g ...
......
......
......
......
......
......
......
–
– –
– –
– –
– –
– –
– M
BSs
and
MB
S C
DO
s1 .....
......
......
......
......
. (3
3)–
(107
)–
3,88
8 64
3,
824
3,56
0 3,
576
238
3,33
8 3,
051
– hi
gh g
rade
2 ..
......
......
......
......
......
......
......
(1
4)–
(105
)–
3,49
260
3,43
2 3,
220
3,21
210
23,
110
2,82
7 –
rate
d C
to A
.....
......
......
......
......
......
......
.. (1
1)–
––
217
4
213
172
185
136
49
49
– no
t pub
licly
rate
d ...
......
......
......
......
......
. (8
)–
(2)
–17
9–
17
9 16
8 17
9–
179
175
(3
3)–
(107
)–
3,88
8 64
3,
824
3,56
0 3,
576
238
3,33
8 3,
051
Bal
ance
car
ried
forw
ard
......
......
......
......
......
.. (1
23)
(1)
(125
)–
7,88
4 11
8 7,
766
7,02
3 8,
201
1,05
2 7,
149
6,49
1
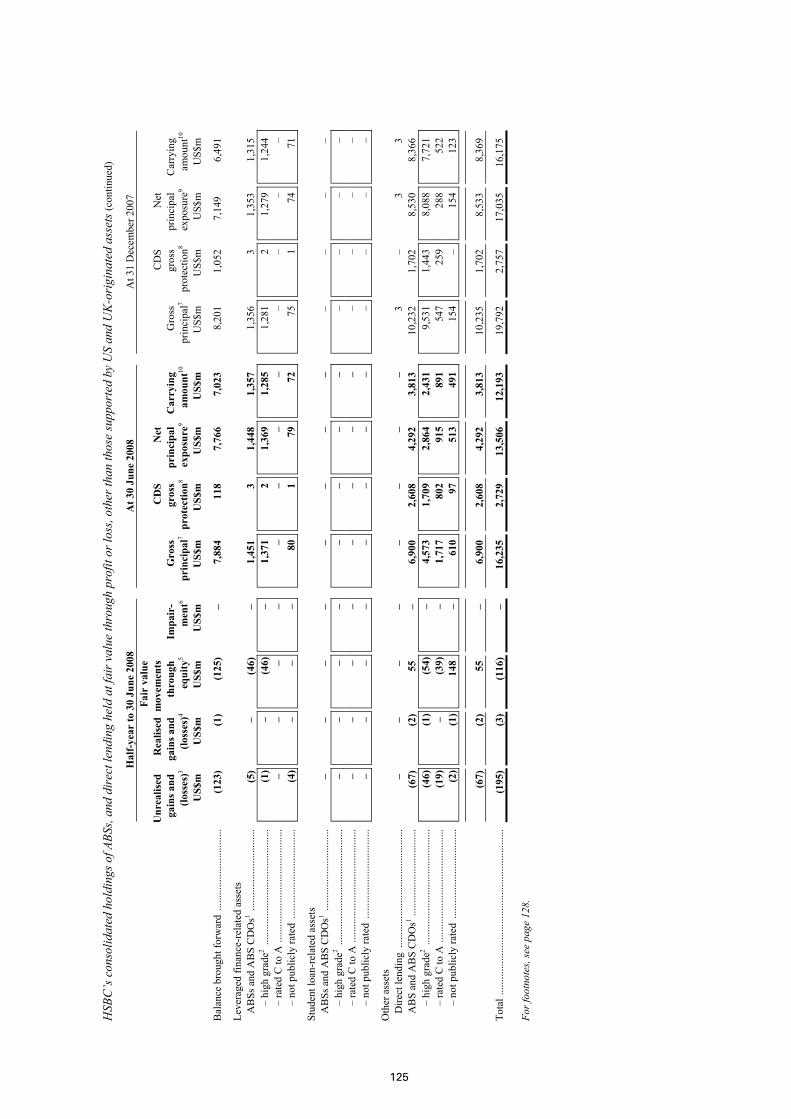
125
HSB
C’s
con
solid
ated
hol
ding
s of A
BSs,
and
dire
ct le
ndin
g he
ld a
t fai
r val
ue th
roug
h pr
ofit
or lo
ss, o
ther
than
thos
e su
ppor
ted
by U
S an
d U
K-o
rigi
nate
d as
sets
(con
tinue
d)
H
alf-y
ear
to 3
0 Ju
ne 2
008
A
t 30
June
200
8
At 3
1 D
ecem
ber 2
007
U
nrea
lised
gain
s and
(loss
es)3
R
ealis
ed
gai
ns a
nd
(lo
sses
)4
Fai
r va
lue
mov
emen
ts
th
roug
h
equi
ty5
Im
pair
-
men
t6
G
ross
p
rinc
ipal
7
C
DS
gros
s pr
otec
tion8
Net
p
rinc
ipal
exp
osur
e9 C
arry
ing
am
ount
10
G
ross
prin
cipa
l7
C
DS
gr
oss
pro
tect
ion8
N
et
pr
inci
pal
ex
posu
re9
C
arry
ing
am
ount
10
US$
m
U
S$m
US$
m
U
S$m
US$
m
U
S$m
US$
m
U
S$m
U
S$m
US$
m
U
S$m
US$
m
Bal
ance
bro
ught
forw
ard
......
......
......
......
......
. (1
23)
(1)
(125
)–
7,88
4 11
8 7,
766
7,02
3
8,20
1 1,
052
7,14
9 6,
491
Leve
rage
d fin
ance
-rel
ated
ass
ets
AB
Ss a
nd A
BS
CD
Os1 ..
......
......
......
......
.....
(5)
– (4
6)–
1,45
1 3
1,44
8 1,
357
1,35
6 3
1,35
3 1,
315
– hi
gh g
rade
2 .....
......
......
......
......
......
......
...
(1)
–(4
6)–
1,37
12
1,36
91,
285
1,28
12
1,27
91,
244
– ra
ted
C to
A ..
......
......
......
......
......
......
.....
––
––
––
––
––
––
– no
t pub
licly
rate
d ...
......
......
......
......
......
. (4
)–
––
801
7972
75
174
71
Stud
ent l
oan-
rela
ted
asse
ts
AB
Ss a
nd A
BS
CD
Os1 ..
......
......
......
......
.....
– –
– –
– –
– –
– –
– –
– hi
gh g
rade
2 .....
......
......
......
......
......
......
...
––
––
––
––
––
––
– ra
ted
C to
A ..
......
......
......
......
......
......
.....
––
––
––
––
––
––
– no
t pub
licly
rate
d ...
......
......
......
......
......
. –
––
––
– –
– –
––
–
Oth
er a
sset
s
D
irect
lend
ing
......
......
......
......
......
......
......
...
– –
– –
– –
– –
3 –
3 3
AB
S an
d A
BS
CD
Os1 ..
......
......
......
......
......
. (6
7)(2
)55
–
6,90
0 2,
608
4,29
2 3,
813
10,2
32
1,70
2 8,
530
8,36
6 –
high
gra
de2 ..
......
......
......
......
......
......
......
(4
6)(1
)(5
4)–
4,57
31,
709
2,86
42,
431
9,53
11,
443
8,08
87,
721
– ra
ted
C to
A ..
......
......
......
......
......
......
.....
(19)
–(3
9)–
1,71
780
2 91
589
1 54
725
928
852
2 –
not p
ublic
ly ra
ted
......
......
......
......
......
....
(2)
(1)
148
–61
097
51
349
1 15
4–
154
123
(6
7)(2
)55
–
6,90
0 2,
608
4,29
2 3,
813
10,2
35
1,70
2 8,
533
8,36
9
Tota
l ....
......
......
......
......
......
......
......
......
......
.....
(195
)(3
)(1
16)
– 16
,235
2,
729
13,5
06
12,1
93
19,7
92
2,75
7 17
,035
16
,175
For f
ootn
otes
, see
pag
e 12
8.

H S B C H O L D I N G S P L C
Interim Management Report: Impact of Market Turmoil (continued)
126
The following table shows the vintages of the collateral assets supporting HSBC’s holdings of US sub-prime and Alt-A MBSs. Market prices for these instruments generally incorporate higher discounts
for later vintages. The majority of HSBC’s holdings of US sub-prime MBSs are originated pre-2007; holdings of US Alt-A MBSs are more evenly distributed between pre and post 2007 vintages.
Vintages of US sub-prime and Alt-A mortgage-backed securities
US sub-prime mortgage-backed
securities US Alt-A mortgage-backed
securities
Gross principal7
at 30 June 2008
Gross principal7
at 31 December 2007
Gross principal7
at 30 June 2008
Gross principal7
at 31 December 2007
US$m US$m US$m US$m Mortgage vintage Pre-2006 ........................................................................ 2,860 3,170 2,591 2,870 2006 .............................................................................. 4,990 5,186 7,710 7,777 2007 .............................................................................. 1,589 2,377 7,247 8,528
9,439 10,733 17,548 19,175
For footnotes, see page 128.
HSBC’s exposure to derivative transactions entered into directly with monoline insurers
HSBC’s principal exposure to monoline insurers, or monolines, is through a number of over-the-counter (‘OTC’) derivative transactions, primarily credit default swaps (‘CDSs’). HSBC entered into these CDSs primarily to purchase credit protection against securities held within the trading portfolio.
During the second half of 2007, and continuing in 2008, the market value of the securities declined, with offsetting increases in the mark-to-market value of the CDS transactions, thereby increasing OTC counterparty credit risk to the monolines. The table below sets out the fair value of the derivative transactions at 30 June 2008, and hence the amount at risk, based on 30 June 2008 security prices, if the CDS protection purchased were to be wholly ineffective because, for example, the monoline
insurer was unable to meet its obligations. In order to assess that risk, protection purchased is shown sub-divided between those monoline insurers that were rated by S&P at ‘BBB or above’ at 30 June 2008, and those that were ‘below BBB’. As certain monolines have been downgraded during the first half of 2008, the exposure to monolines rated ‘below BBB’ at 30 June 2008 increased from the position as at 31 December 2007. The ‘Credit risk adjustment’ column indicates the valuation adjustment taken against the mark-to-market exposures, and reflects the assessed loss of value on purchased protection arising from the deterioration in creditworthiness of the monoline insurers evidenced during the first half of 2008. These valuation adjustments, which reflect the possibility of the irrecoverability of the protection purchased, have been charged to the income statement.
HSBC’s exposure to derivative transactions entered into directly with monoline insurers
Notional amount
Net exposure before credit risk adjustment13
Credit risk adjustment14
Net exposure after credit risk adjustment
US$m US$m US$m US$m At 30 June 2008 Derivative transactions with monoline counterparties
Monoline – BBB or above ....................................... 12,444 1,937 (731) 1,206 Monoline – below BBB ........................................... 2,123 900 (822) 78
14,567 2,837 (1,553) 1,284
At 31 December 2007 Derivative transactions with monoline counterparties
Monoline – BBB or above ....................................... 14,314 1,342 (133) 1,209 Monoline – below BBB ........................................... 1,120 214 (214) –
15,434 1,556 (347) 1,209
For footnotes, see page 128.
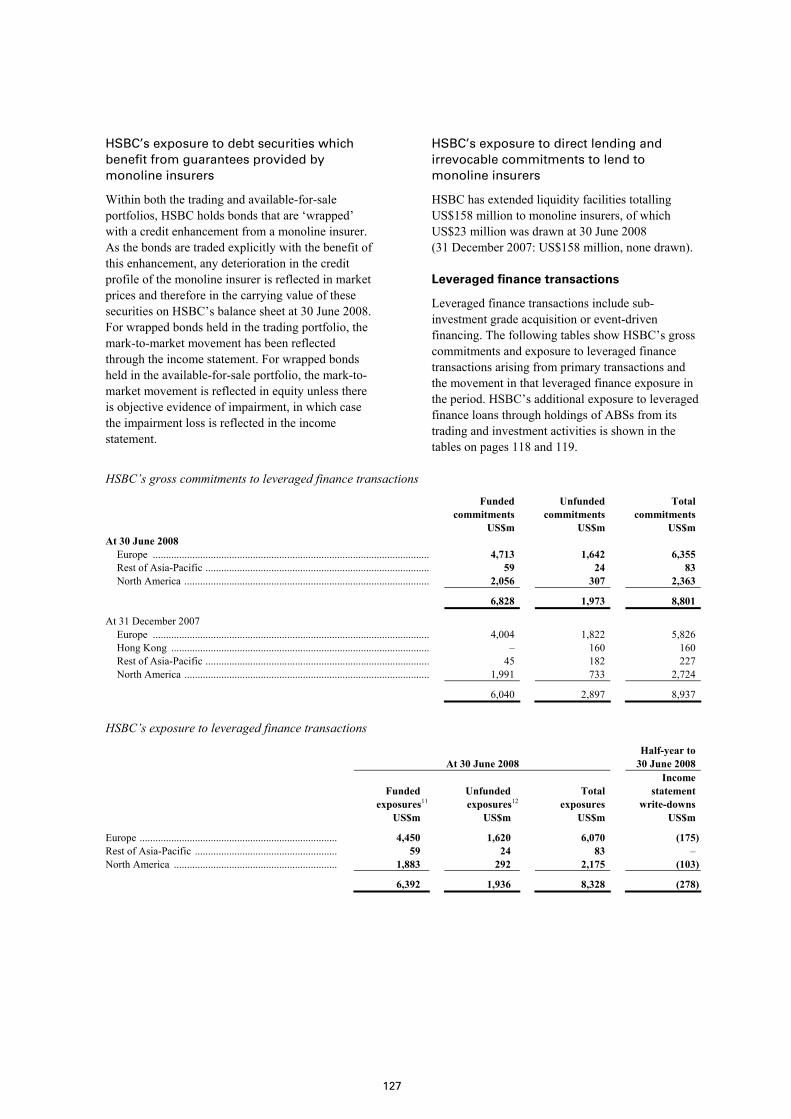
127
HSBC’s exposure to debt securities which benefit from guarantees provided by monoline insurers
Within both the trading and available-for-sale portfolios, HSBC holds bonds that are ‘wrapped’ with a credit enhancement from a monoline insurer. As the bonds are traded explicitly with the benefit of this enhancement, any deterioration in the credit profile of the monoline insurer is reflected in market prices and therefore in the carrying value of these securities on HSBC’s balance sheet at 30 June 2008. For wrapped bonds held in the trading portfolio, the mark-to-market movement has been reflected through the income statement. For wrapped bonds held in the available-for-sale portfolio, the mark-to-market movement is reflected in equity unless there is objective evidence of impairment, in which case the impairment loss is reflected in the income statement.
HSBC’s exposure to direct lending and irrevocable commitments to lend to monoline insurers
HSBC has extended liquidity facilities totalling US$158 million to monoline insurers, of which US$23 million was drawn at 30 June 2008 (31 December 2007: US$158 million, none drawn).
Leveraged finance transactions
Leveraged finance transactions include sub-investment grade acquisition or event-driven financing. The following tables show HSBC’s gross commitments and exposure to leveraged finance transactions arising from primary transactions and the movement in that leveraged finance exposure in the period. HSBC’s additional exposure to leveraged finance loans through holdings of ABSs from its trading and investment activities is shown in the tables on pages 118 and 119.
HSBC’s gross commitments to leveraged finance transactions
Funded commitments
Unfunded commitments
Total commitments
US$m US$m US$m At 30 June 2008
Europe ......................................................................................................... 4,713 1,642 6,355 Rest of Asia-Pacific ..................................................................................... 59 24 83 North America ............................................................................................. 2,056 307 2,363
6,828 1,973 8,801
At 31 December 2007 Europe ......................................................................................................... 4,004 1,822 5,826 Hong Kong .................................................................................................. – 160 160 Rest of Asia-Pacific ..................................................................................... 45 182 227 North America ............................................................................................. 1,991 733 2,724
6,040 2,897 8,937
HSBC’s exposure to leveraged finance transactions
At 30 June 2008 Half-year to
30 June 2008
Funded exposures11
Unfunded exposures12
Total exposures
Income statement write-downs
US$m US$m US$m US$m
Europe ........................................................................... 4,450 1,620 6,070 (175)Rest of Asia-Pacific ...................................................... 59 24 83 – North America .............................................................. 1,883 292 2,175 (103)
6,392 1,936 8,328 (278)

H S B C H O L D I N G S P L C
Interim Management Report: Impact of Market Turmoil (continued)
128
At 31 December 2007 Half-year to 31
December 2007
Funded exposures11
Unfunded exposures12
Total exposures
Income statement write-downs
US$m US$m US$m US$m
Europe ........................................................................... 3,903 1,813 5,716 (110)Hong Kong ................................................................... – 160 160 – Rest of Asia-Pacific ...................................................... 45 182 227 – North America .............................................................. 1,917 722 2,639 (85)
5,865 2,877 8,742 (195)
For footnotes, see below.
Movement in leveraged finance exposures
Funded exposures11
Unfunded exposures12
Total exposures
US$m US$m US$m
At 31 December 2007 ...................................................................................... 5,865 2,877 8,742 Additions .......................................................................................................... 98 554 652 Fundings .......................................................................................................... 855 (855) – Sales, repayments and other movements ........................................................ (171) (617) (788)Write-downs .................................................................................................... (255) (23) (278)
At 30 June 2008 ............................................................................................... 6,392 1,936 8,328
For footnotes, see below.
At 30 June 2008, HSBC’s principal exposures were to companies in two sectors: US$3.6 billion to data processing (31 December 2007: US$3.8 billion) and US$2.6 billion to communications and
infrastructure (31 December 2007: US$2.7 billion). During the period, 99 per cent of the total write-downs were against exposures in these two sectors.
Footnotes to ‘Nature and extent of HSBC’s exposures’ 1 Mortgage-backed securities (‘MBSs’), asset-backed securities (‘ABSs’) and collateralised debt obligations (‘CDOs’). 2 High grade assets rated AA or AAA. 3 Unrealised gains and losses on the net principal exposure (see footnote 9) recognised during the half year in the income statement as a
result of changes in the fair value of the asset, adjusted for the cumulative amount of transfers to realised gains and losses as a result of the disposal of assets.
4 Realised gains and losses on the net principal exposure (see footnote 9) recognised during the half year in the income statement as a result of the disposal of assets.
5 Fair value gains and losses on the net principal exposure (see footnote 9) recognised in equity during the half year as a result of the changes in the fair value of available-for-sale assets, adjusted for transfers from the available-for-sale reserve to the income statement as a result of impairment, and adjusted for transfers to realised gains and losses following the disposal of assets.
6 Impairment losses recognised in the income statement in respect of the net principal amount (see footnote 9) of available-for-sale and held-to-maturity assets.
7 The gross principal is the redemption amount on maturity or, in the case of an amortising instrument, the sum of the future redemption amounts through the residual life of the security.
8 A CDS is a credit default swap. CDS gross protection is the gross principal of the underlying instrument that is protected by CDSs. 9 Net principal exposure is the gross principal amount of assets that are not protected by CDSs. It includes assets that benefit from
monoline protection, except where this protection is purchased with a CDS. 10 Carrying amount of the net principal exposure. 11 Funded exposure represents the loan amount advanced to the customer, less any fair value write-downs, net of fees held on deposit. 12 Unfunded exposures represent the contractually committed loan facility amount not yet drawn down by the customer, less any fair value
write-downs, net of fees held on deposit. 13 Net exposure after legal netting and any other relevant credit mitigation prior to deduction of the credit risk adjustment. 14 Cumulative fair value adjustment recorded against OTC derivative counterparty exposures to reflect the creditworthiness of the
counterparty.

129
Fair values of financial instruments
The classification of financial instruments is determined in accordance with the accounting policies set out on pages 347 to 361 of the Annual Report and Accounts 2007. The following is a description of HSBC’s control framework surrounding the determination of fair values, its methods of determining fair value, and a quantification of its exposure to financial instruments measured at fair value.
Fair value is the amount for which an asset could be exchanged, or a liability settled, between knowledgeable, willing parties in an arm’s length transaction.
Financial instruments measured at fair value on an ongoing basis include trading assets and liabilities, instruments designated at fair value, derivatives, and financial investments classified as available for sale (including treasury and other eligible bills, debt securities, and equity securities).
Fair values of financial instruments carried at fair value
Control framework
Fair values are subject to a control framework designed to ensure that they are either determined, or validated, by a function independent of the risk-taker. To this end, ultimate responsibility for the determination of fair values lies with Finance, which reports functionally to the Group Finance Director. Finance establishes the accounting policies and procedures governing valuation, and is responsible for ensuring that these comply with all relevant accounting standards.
For fair values determined by reference to external quotation or evidenced pricing parameters, independent price determination or validation is utilised. In less liquid markets, direct observation of a traded price may not be possible. In these circumstances, HSBC will source alternative market information to validate the financial instrument’s fair value. Greater weight will be given to information that is considered to be more relevant and reliable. The factors that are considered in this regard are, inter alia:
• the extent to which prices may be expected to represent genuine traded or tradeable prices;
• the degree of similarity between financial instruments;
• the degree of consistency between different sources;
• the process followed by the pricing provider to derive the data;
• the elapsed time between the date to which the market data relates and the balance sheet date; and
• the manner in which the data was sourced.
The results of the independent price validation process is reported to senior management, and adjustments to fair values resulting from considerations of the above information are recorded where appropriate.
For fair values determined using a valuation model, the model being a logical framework for the capture and processing of necessary valuation inputs, the control framework may include, as applicable, independent development or validation of the logic within valuation models, the inputs to those models, any adjustments required outside the valuation models, and, where possible, model outputs.
The results of the independent validation process are reported to, and considered by, Valuation Committees. Valuation Committees are composed of valuation experts from several independent support functions (Product Control, Market Risk Management, Derivative Model Review Group and Finance) in addition to senior trading management. Any adjustments made to the assessed fair values as a result of the validation process are reported to senior management.
Determination of fair value
Fair values are determined according to the following hierarchy:
(a) Quoted market price: financial instruments with quoted prices for identical instruments in active markets.
(b) Valuation technique using observable inputs: financial instruments with quoted prices for similar instruments in active markets or quoted prices for identical or similar instruments in inactive markets and financial instruments valued using models where all significant inputs are observable.
(c) Valuation technique with significant non-observable inputs: financial instruments valued using valuation techniques where one or more significant inputs are not observable.
The best evidence of fair value is a quoted price in an actively traded market. In the event that the market for a financial instrument is not active, a valuation technique is used. The majority of

H S B C H O L D I N G S P L C
Interim Management Report: Impact of Market Turmoil (continued)
130
valuation techniques employ only observable market data, and so the reliability of the fair value measurement is high. However, certain financial instruments are valued on the basis of valuation techniques that feature one or more significant market inputs that are not observable. For these instruments, the fair value derived is more judgemental. ‘Not observable’ in this context means that there is little or no current market data available from which to determine the level at which an arm’s length transaction would be likely to occur, but it generally does not mean that there is no market data available at all upon which to base a determination of fair value (consensus pricing data may, for example, be used). Furthermore, the majority of the fair value derived from a valuation technique with significant non-observable inputs may in some cases still be attributable to the observable inputs. Consequently, the impact of uncertainty in the determination of the unobservable inputs will generally only give rise to a degree of uncertainty about the overall fair value of the financial instrument being measured. To assist in understanding the extent and the range of this uncertainty, additional information is provided in respect of instruments valued using non-observable inputs in the section headed ‘Effect of changes in significant unobservable assumptions to reasonably possible alternatives’ below.
In certain circumstances, primarily where debt is hedged with interest rate derivatives or structured notes issued, HSBC uses fair value to measure the carrying value of its own debt in issue. Where available, fair value is based upon quoted prices in an active market for the specific instrument concerned. Where unavailable, these instruments are valued using valuation techniques, the inputs of which are based either upon quoted prices in an inactive market for the specific instrument concerned, or estimated by comparison with quoted prices in an active market for similar instruments. The fair value of these instruments therefore includes the effect of applying the credit spread which is appropriate to HSBC’s liabilities. For all issued debt securities, discounted cash flow modelling is utilised to isolate that element of the change in fair value that may be attributed to HSBC credit spread movements rather than movements in other market factors such as benchmark interest rates or foreign exchange rates.
Structured notes issued and certain other hybrid instrument liabilities are included within trading liabilities and are measured at fair value. The credit spread applied to these instruments is derived from the spreads at which HSBC issues structured notes.
These market spreads are significantly smaller than credit spreads observed for plain vanilla debt or in the credit default swap markets.
Gains and losses arising from changes in the credit spread of liabilities issued by HSBC reverse over the contractual life of the debt, provided that the debt is not repaid early.
All net positions in non-derivative financial instruments, and all derivative portfolios, are valued at bid or offer prices as appropriate. Long positions are marked at bid prices; short positions are marked at offer prices.
The fair values of large holdings of non-derivative financial instruments are based on a multiple of the value of a single instrument, and do not include block adjustments for the size of the holding.
The valuation techniques used when quoted market prices are not available incorporate certain assumptions that HSBC believes would be made by a market participant to establish fair value. When HSBC considers that there are additional considerations not included within the valuation model, appropriate adjustments may be made. Examples of such adjustments are:
• Credit risk adjustment: an adjustment to reflect the creditworthiness of OTC derivative counterparties.
• Market data/model uncertainty: an adjustment to reflect uncertainties in fair values based on unobservable market data inputs (for example, as a result of illiquidity) or in areas where the choice of valuation model is particularly subjective.
• Inception profit (‘day 1 P&L reserves’): for financial instruments valued at inception, on the basis of one or more significant unobservable inputs, the difference between transaction price and model value (as adjusted) at inception is not recognised in the consolidated income statement, but is deferred. This is referred to as a ‘day 1’ profit or loss reserve. An analysis of the movement in deferred inception profit is provided on page 221.
Transaction costs are not included in the fair value calculation. Trade origination costs such as brokerage fees and post-trade costs are included in operating expenses. The future costs of administering the OTC derivative portfolio are also not included in fair value, but are expensed as incurred.
131
• Private equity
HSBC’s private equity positions are generally classified as available for sale and are not traded in active markets. In the absence of an active market, an investment’s fair value is estimated on the basis of an analysis of the investee’s financial position and results, risk profile, prospects and other factors, as well as by reference to market valuations for similar entities quoted in an active market, or the price at which similar companies have changed ownership. The exercise of judgement is required because of uncertainties inherent in estimating fair value for private equity investments.
• Debt securities, treasury and other eligible bills, and equities
The fair value of these instruments is based on quoted market prices from an exchange, dealer, broker, industry group or pricing service, when available. When unavailable, the fair value is determined by reference to quoted market prices for similar instruments.
Illiquidity and a lack of transparency in the market for debt securities backed by US sub-prime mortgages has resulted in less observable data being available. While quoted market prices are generally used to determine the fair value of these securities, valuation models are used to substantiate the reliability of the limited market data available and to identify whether any adjustments to quoted market prices are required.
In the absence of quoted market prices, fair value is determined using valuation techniques. The inputs to these valuation techniques are derived from observable market data and, where relevant, assumptions in respect of unobservable inputs. In respect of ABSs and mortgages, the assumptions may include prepayment speeds, default rates and loss severity based on collateral type, and performance as appropriate.
• Derivatives
OTC (i.e. non-exchange traded) derivatives are valued using valuation models. Valuation models calculate the present value of expected future cash flows, based upon ‘no-arbitrage’ principles. For many vanilla derivative products,
such as interest rate swaps and European options, the modelling approaches used are standard across the industry. For more complex derivative products, there may be some differences in market practice. Inputs to valuation models are determined from observable market data wherever possible, including prices available from exchanges, dealers, brokers or providers of consensus pricing. Certain inputs may not be observable in the market directly, but can be determined from observable prices via model calibration procedures. Finally, some inputs are not observable, but can generally be estimated from historical data or other sources. Examples of inputs that are generally observable include foreign exchange spot and forward rates, benchmark interest rate curves and volatility surfaces for commonly traded option products. Examples of inputs that may be unobservable include volatility surfaces, in whole or in part, for less commonly traded option products, and correlations between market factors.
• Loans including leveraged loans and loans held for securitisation
Loans held at fair value are valued from broker quotes and/or market data consensus providers when available. In the absence of an observable market, the fair value is determined using valuation techniques including discounted cash flow models, which incorporate assumptions regarding an appropriate credit spread for the loan derived from other market instruments issued by the same or comparable entities.
• Structured notes
For structured notes whose fair value is derived from a valuation technique, the fair value will be derived from the fair value of the underlying debt security as described above, and the fair value of the embedded derivative determined as described in the section above on derivatives.
Fair value valuation bases
The following table provides an analysis of the various bases described above which have been deployed for valuing financial assets and financial liabilities measured at fair value in the consolidated financial statements:

H S B C H O L D I N G S P L C
Interim Management Report: Impact of Market Turmoil (continued)
132
Bases of valuing financial assets and liabilities measured at fair value
Valuation techniques:
Quoted market price
using observable inputs
with significant non-observable inputs Total
US$m US$m US$m US$m At 30 June 2008 Assets Trading assets .................................................................. 224,459 234,478 14,600 473,537 Financial assets designated at fair value ......................... 22,884 17,352 550 40,786 Derivatives ....................................................................... 7,208 247,894 5,562 260,664 Financial investments: available-for-sale ........................ 92,881 162,860 7,986 263,727
Liabilities Trading liabilities ............................................................. 143,134 188,130 9,347 340,611 Financial liabilities at fair value ...................................... 27,097 62,503 158 89,758 Derivatives ....................................................................... 7,998 240,779 2,580 251,357 At 31 December 2007 Assets Trading assets .................................................................. 209,339 222,678 13,951 445,968 Financial assets designated at fair value ......................... 28,565 12,694 305 41,564 Derivatives ....................................................................... 8,132 175,493 4,229 187,854 Financial investments: available-for-sale ........................ 77,045 187,677 8,510 273,232
Liabilities Trading liabilities ............................................................. 140,629 167,967 5,984 314,580 Financial liabilities at fair value ...................................... 37,709 52,230 – 89,939 Derivatives ....................................................................... 8,879 171,444 3,070 183,393
Financial assets and liabilities measured at fair value with significant unobservable inputs are concentrated in trading assets and liabilities. At
30 June 2008 this represented 3 per cent of these assets and liabilities (31 December 2007: 3 per cent).
Financial instruments measured at fair value using a valuation technique with significant unobservable inputs
Assets Liabilities
Available for sale
Held for trading
Designated at fair value through profit or loss Derivatives
Held for trading
Designated at fair value through profit or loss
Derivatives US$m US$m US$m US$m US$m US$m US$m At 30 June 2008 Private equity investments ........... 2,904 43 56 – – – – Asset-backed securities ............... 4,495 3,655 – – – – – Leveraged finance ....................... – 3,376 – – – – – Loans held for securitisation ....... – 4,125 – – – – – Structured notes ........................... – 240 – – 7,548 – – Derivatives with monolines ......... – – – 1,284 – – – Other derivatives .......................... – – – 4,278 – – 2,580 Other portfolios ............................ 587 3,161 494 – 1,799 158 –
7,986 14,600 550 5,562 9,347 158 2,580
At 31 December 2007 Private equity investments ........... 3,037 – – – – – – Asset-backed securities ............... 4,223 2,073 – – 300 – – Leveraged finance ....................... – 3,349 – – – – – Loans held for securitisation ........ – 5,100 – – – – – Structured notes ........................... – – – – 5,396 – – Derivatives with monolines ......... – – – 1,010 – – – Other derivatives .......................... – – – 3,219 – – 3,070 Other portfolios ............................ 1,250 3,429 305 – 288 – –
8,510 13,951 305 4,229 5,984 – 3,070

133
At 30 June 2008, available-for-sale assets using a valuation technique with significant unobservable inputs, principally comprise various ABSs and private equity investments similar to the position at 31 December 2007. The reduction in financial instruments measured at fair value using a valuation technique with significant unobservable inputs in the first half of 2008 is due to an improvement in the liquidity of unquoted equity securities recognised within ‘Other portfolios’.
Trading assets valued using a valuation technique with significant unobservable inputs principally comprise various ABSs, loans held for syndication, leveraged loans underwritten by HSBC, and other portfolios. Other portfolios include holdings in various bonds, preference shares and corporate and mortgage loans. The increase in the period largely reflects the reduced availability of market observable inputs for the valuation of certain ABSs which necessitated reclassifying some of the existing exposures. This has been partially offset by a fall in the amount of bonds and mortgage loans classified in this category as a result of reduced asset valuations.
Derivative products valued using valuation techniques with significant unobservable inputs include certain types of correlation products, such as foreign exchange basket options, foreign exchange-interest rate hybrid transactions and long-dated option transactions. Examples of the latter are equity options, interest rate and foreign exchange options
and certain credit derivatives. Credit derivatives include tranched credit default swap transactions. The increase in derivative assets during the period was mainly due to the reclassification of certain leveraged credit derivative transactions because widening credit spreads have increased the significance of unobservable credit spread volatilities.
Trading liabilities valued using a valuation technique with significant unobservable inputs have increased in the period in line with the issuance of equity linked structured note transactions. HSBC issues these notes to investors which provide the counterparty with a return that is linked to the performance of certain equity securities. The valuation of these securities is dependent upon the implied volatility of the reference equities which is often not observable for the maturity of the note.
Effect of changes in significant unobservable assumptions to reasonably possible alternatives
As discussed above, the fair value of financial instruments are, in certain circumstances, measured using valuation techniques that incorporate assumptions that are not evidenced by prices from observable current market transactions in the same instrument and cannot be based on observable market data. The following table shows the sensitivity of fair values to reasonably possible alternative assumptions:
Reflected in profit or loss Reflected in equity
Favourable changes
Unfavourable changes
Favourable changes
Unfavourable changes
US$m US$m US$m US$m At 30 June 2008 Derivatives, trading assets and trading liabilities1 ........ 1,176 (962) – – Financial assets and liabilities designated at fair value 33 (28) – – Financial investments: available for sale ..................... – – 860 (936) At 31 December 2007 Derivatives, trading assets and trading liabilities1 ........ 602 (415) – – Financial assets and liabilities designated at fair value 30 (30) – – Financial investments: available for sale ..................... – – 529 (591)
1 Derivatives, trading assets and trading liabilities are presented as one category to reflect the manner in which these financial instruments are risk-managed.
The increase in the effect of changes in significant unobservable inputs in relation to derivatives, trading assets and trading liabilities in the period primarily reflects increased uncertainty in determining the fair value of credit derivative transactions executed against certain monoline insurers. In addition, there has been a general increase in structured derivative business exposures
and the valuation measurement uncertainty of certain ABSs.
Changes in fair value recorded in the income statement
The following table quantifies the changes in fair values recognised in profit or loss during the period in respect of exposures where the fair value of these exposures is estimated using valuation techniques

H S B C H O L D I N G S P L C
Interim Management Report: Impact of Market Turmoil (continued)
134
that incorporate significant assumptions that are not evidenced by prices from observable current market transactions in the same instrument, and are not based on observable market data:
• the table details the total change in fair value of these instruments; it does not isolate the component of the change that is attributable to the unobservable component;
• instruments valued with significant unobservable inputs are frequently dynamically managed with instruments valued using observable inputs; the table does not include any changes in fair value of these latter instruments; and
• for assets and liabilities valued using significant unobservable inputs at 30 June 2008 where these inputs were observable at 31 December 2007; the table reflects the full change in fair value of those instruments during the period.
Half-year to 30 June 2008
US$m
Recorded profit/(loss) on: Derivatives, trading assets and trading
liabilities ..................................................... (1,415)Financial assets and liabilities designated
at fair value ................................................. 13
The loss in the period primarily reflects reductions in the fair value of credit derivatives reclassified from using a valuation technique with significant observable inputs to significant unobservable inputs. In addition, other reductions occurred due to write-downs of MBSs, mortgage loans acquired for the purpose of securitisation and credit derivative transactions executed against monoline insurers.
Assessing available-for-sale assets for impairment
HSBC’s policy on impairment of available-for-sale assets is described on page 116. The following is a description of HSBC’s application of that policy.
An impairment review is carried out systematically and periodically of all available-for-sale assets and all available indicators are considered to determine whether there is any objective evidence that an impairment may have occurred, whether the result of a single loss event or the combined effect of several events.
Debt securities
For available-for-sale debt securities, objective evidence includes observable data or information about events specifically relating to the securities, which may result in a shortfall in recovery of future cash flows. These may include a significant financial difficulty of the issuer; a breach of contract, such as a default; bankruptcy or other financial reorganisation; or the disappearance of an active market for that debt security because of financial difficulties relating to the issuer.
These types of specific event and other factors such as information about the issuers’ liquidity, business and financial risk exposures, levels of and trends in default for similar financial assets, national and local economic trends and conditions, and the fair value of collateral and guarantees may be considered individually, or in combination, to determine if there is objective evidence of impairment of a debt security.
In assessing whether there is any objective evidence of impairment of available-for-sale ABSs at the balance sheet date, factors such as the performance of underlying collateral, the extent and depth of market price declines and changes in credit ratings are considered.
The population of available-for-sale ABSs at 30 June 2008 which have been identified to be the most at risk of impairment, includes residential MBSs backed by sub-prime and Alt-A mortgages originated in the US and CDOs with significant exposure to this sector. The estimated future cash flows of available-for-sale ABSs are assessed to determine whether any of these cash flows are unlikely to be recovered as a result of events occurring before the balance sheet date. The estimated future cash flows of residential MBSs are assessed by determining the future projected cash flows arising on the underlying collateral, taking into consideration the delinquency status of underlying loans, the probability of delinquent loans progressing to default and the subsequent proportion of the advances recoverable. A determination is made of cash flows on loans that are not delinquent as of the assessment date by applying a modelling approach which reflects observed progression rates to default. If the decline in projected cash flows from the underlying collateral exceeds the expected credit support, the investment is considered to be impaired.
The estimated future cash flows of CDOs are assessed by applying management’s expectations of losses arising from cumulative defaults on the underlying collateral occurring prior to the balance sheet date. A determination is made as to whether

135
expected future losses will exceed the current credit support available to the CDOs.
Where a security benefits from a contract provided by a monoline insurer that insures payments of principal and interest, the expected recovery on this contract is assessed in determining the total expected credit support available to the ABS.
Equity securities
Objective evidence of impairment for available- for-sale equity securities may include specific information about the issuer as detailed above, but may also include information about significant changes that have taken place in the technological, market, economic or legal environments, which provide evidence that the cost of the equity securities may not be recovered. A significant or prolonged decline in the fair value of the asset below its cost is also objective evidence of impairment.
For impairment losses on available-for-sale debt and equity securities, see pages 103 and 99, respectively.
Fair values of financial instruments not carried at fair value
Financial instruments that are not measured at fair value on the balance sheet include loans and advances to banks and customers, debt securities, deposits by banks, customer accounts, debt securities in issue and subordinated liabilities. Their fair values are, however, provided for information by way of note disclosure and are calculated as described below.
The calculation of fair value incorporates HSBC’s estimate of the amount at which financial assets could be exchanged, or financial liabilities settled, between knowledgeable, willing parties in an arm’s length transaction. It does not reflect the economic benefits and costs that HSBC expects to flow from the instruments’ cash flows over their expected future lives. Other reporting entities may use different valuation methodologies and assumptions in determining fair values for which no observable market prices are available, so comparisons of fair values between entities may not be meaningful and users are advised to exercise caution when using this data.
Since August 2007, the unstable market conditions in the US mortgage lending industry have resulted in a significant reduction in the secondary market demand for US consumer lending assets. Uncertainty over the extent and timing of future
credit losses, together with an absence of liquidity for non-prime ABSs, continued to be reflected in a lack of bid prices at 30 June 2008. It is not possible to distinguish from the indicative market prices that are available the relative discount to nominal value within the fair value measurement that reflects cash flow impairment due to expected losses to maturity, from the discount that the market is demanding for holding an illiquid and out of favour asset. Under impairment accounting for loans and advances, there is no need nor requirement to adjust carrying values to reflect illiquidity as the intention is to fund assets until the earlier of prepayment, charge-off or repayment on maturity. Market fair values, on the other hand, reflect both incurred loss and loss expected through the life of the asset, a discount for illiquidity, and a credit spread which reflects the market’s current risk preferences rather than the credit spread applicable in the market at the time the loan was underwritten and funded.
The estimated fair values at 31 December 2007 and 30 June 2008 of loans and advances to customers in North America reflect the combined effect of these conditions. This results in fair values that are substantially lower than the carrying value of customer loans held on-balance sheet and lower than would otherwise be reported under more normal market conditions. Accordingly, the fair values reported do not reflect HSBC’s estimate of the underlying long-term value of the assets.
Fair values at the balance sheet date of the assets and liabilities set out below are estimated for the purpose of disclosure as follows:
(i) Loans and advances to banks and customers
The fair value of loans and advances is based on observable market transactions, where available. In the absence of observable market transactions, fair value is estimated using discounted cash flow models. Performing loans are grouped, as far as possible, into homogeneous pools segregated by maturity and coupon rates. In general, contractual cash flows are discounted using HSBC’s estimate of the discount rate that a market participant would use in valuing instruments with similar maturity, repricing and credit risk characteristics.
The fair value of a loan portfolio reflects both loan impairments at the balance sheet date and estimates of market participants’ expectations of credit losses over the life of the loans.

H S B C H O L D I N G S P L C
Interim Management Report: Impact of Market Turmoil (continued)
136
For impaired loans, fair value is estimated by discounting the future cash flows over the time period they are expected to be recovered.
(ii) Financial investments
The fair values of listed financial investments are determined using bid market prices. The fair values of unlisted financial investments are determined using valuation techniques that take into consideration the prices and future earnings streams of equivalent quoted securities.
(iii) Deposits by banks and customer accounts
For the purposes of estimating fair value, deposits by banks and customer accounts are grouped by residual maturity. Fair values are estimated using discounted cash flows, applying current rates offered for deposits of similar remaining maturities. The fair value of a deposit repayable on demand is assumed to be the amount payable on demand at the balance sheet date.
(iv) Debt securities in issue and subordinated liabilities
Fair values are determined using quoted market prices at the balance sheet date where available, or by reference to quoted market prices for similar instruments.
The fair values in this note are stated at a specific date and may be significantly different from the amounts which will actually be paid on the maturity or settlement dates of the instruments. In many cases, it would not be possible to realise immediately the estimated fair values given the size of the portfolios measured. Accordingly, these fair
values do not represent the value of these financial instruments to HSBC as a going concern.
For all classes of financial instruments, fair value represents the product of the value of a single instrument, multiplied by the number of instruments held. No block discount or premium adjustments are made.
The fair values of intangible assets related to the businesses which originate and hold the financial instruments subject to fair value measurement, such as values placed on portfolios of core deposits, credit card and customer relationships, are not included above because they are not classified as financial instruments. Accordingly, an aggregation of fair value measurements does not approximate to the value of the organisation as a whole as a going concern.
The following table lists financial instruments whose carrying amount is a reasonable approximation of fair value because, for example, they are short-term in nature or reprice to current market rates frequently:
Assets Cash and balances at central banks Items in the course of collection from other banks Hong Kong Government certificates of indebtedness Endorsements and acceptances Short-term receivables within ‘Other assets’ Accrued income Liabilities Hong Kong currency notes in circulation Items in the course of transmission to other banks Endorsements and acceptances Short-term payables within ‘Other liabilities’ Accruals
Fair values of financial instruments which are not carried at fair value on the balance sheet
At 30 June 2008 At 31 December 2007
Carrying amount
Fair value
Carrying amount
Fair value
US$m US$m US$m US$m Assets Loans and advances to banks ....................................................................... 256,981 256,944 237,366 237,374 Loans and advances to customers ................................................................ 1,049,200 1,013,869 981,548 951,850 Financial investments: debt securities .......................................................... 11,023 11,159 9,768 10,154 Liabilities Deposits by banks ......................................................................................... 154,152 154,284 132,181 132,165 Customer accounts ........................................................................................ 1,161,923 1,161,845 1,096,140 1,095,727 Debt securities in issue ................................................................................. 230,267 226,199 246,579 243,802 Subordinated liabilities ................................................................................. 31,517 29,942 24,819 23,853

137
Fair values of financial investments classified as held for sale which are not carried at fair value on the balance sheet
At 30 June 2008 At 31 December 2007
Carrying amount
Fair value1
Carrying amount
Fair value1
US$m US$m US$m US$m Assets classified as held for sale Loans and advances to banks and customers ............................................... 1,852 1,526 14 14 Financial investments: debt securities .......................................................... 37 37 27 27
1 The fair values exclude balances relating to the regional French banks sold on 2 July 2008 (see Note 22 on the Financial Statements).
Analysis of loans and advances to customers by geographical segment At 30 June 2008 At 31 December 2007
Carrying amount
Fair value
Carrying amount
Fair value
US$m US$m US$m US$m Loans and advances to customers Europe ........................................................................................................... 508,960 507,280 452,275 450,010 Hong Kong ................................................................................................... 99,741 99,368 89,638 89,908 Rest of Asia-Pacific ...................................................................................... 113,757 113,869 101,852 101,860 North America1 ............................................................................................. 272,490 239,208 289,860 262,123 Latin America ............................................................................................... 54,252 54,144 47,923 47,949
1,049,200 1,013,869 981,548 951,850
1 The reasons for the significant difference between carrying amount and fair value of loans and advances to customers in North America are discussed on page 135.
Special purpose entities
This section contains disclosures about HSBC-sponsored SPEs that are included in HSBC’s consolidated balance sheet, with a particular focus on SPEs containing exposures affected by recent turmoil in credit markets, and those that are not consolidated by HSBC under IFRSs. In addition to the disclosures about SPEs, information on other off-balance sheet arrangements has been included in this section.
HSBC enters into certain transactions with customers in the ordinary course of business which involve the establishment of SPEs to facilitate or secure customer transactions.
HSBC structures that utilise SPEs are authorised centrally when they are established to ensure appropriate purpose and governance. The activities of SPEs administered by HSBC are closely monitored by senior management. HSBC’s involvement with SPE transactions is described below.
HSBC-sponsored SPEs
HSBC sponsors the formation of entities which are designed to accomplish certain narrow and well-defined objectives, such as securitising financial assets or effecting a lease and this requires a form of legal structure that restricts the assets and liabilities
within the structure to the single purpose for which it was established. HSBC consolidates these SPEs when the substance of the relationship indicates that HSBC controls them. The qualitative and quantitative factors considered by HSBC when determining if HSBC controls an SPE are described on page 183 of the Annual Report and Accounts 2007.
HSBC reassesses the required consolidation accounting tests whenever there is a change in the substance of a relationship between HSBC and an SPE, for example, when the nature of HSBC’s involvement or the governing rules, contractual arrangements or capital structure of the SPE change. The most significant categories of SPEs are discussed in more detail below.
Structured investment vehicles and conduits
Structured investment vehicles
SIVs are SPEs which invest in diversified portfolios of interest-earning assets, generally funded through issues of commercial paper (‘CP’), medium-term notes (‘MTNs’) and other senior debt to take advantage of the spread differentials between the assets in the SIV and the funding cost. Prior to the implementation of Basel II, it was capital efficient to many bank investors to invest in highly-rated investment securities in this way. HSBC sponsored the establishment of two SIVs, Cullinan Finance
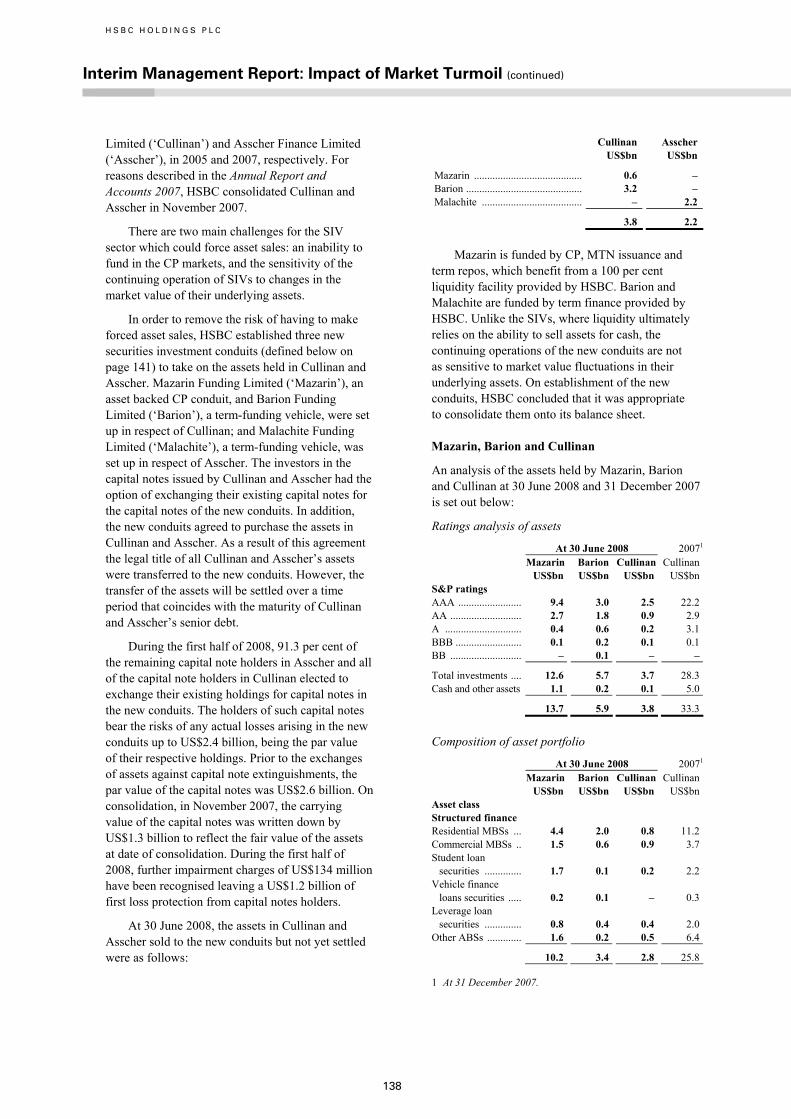
H S B C H O L D I N G S P L C
Interim Management Report: Impact of Market Turmoil (continued)
138
Limited (‘Cullinan’) and Asscher Finance Limited (‘Asscher’), in 2005 and 2007, respectively. For reasons described in the Annual Report and Accounts 2007, HSBC consolidated Cullinan and Asscher in November 2007.
There are two main challenges for the SIV sector which could force asset sales: an inability to fund in the CP markets, and the sensitivity of the continuing operation of SIVs to changes in the market value of their underlying assets.
In order to remove the risk of having to make forced asset sales, HSBC established three new securities investment conduits (defined below on page 141) to take on the assets held in Cullinan and Asscher. Mazarin Funding Limited (‘Mazarin’), an asset backed CP conduit, and Barion Funding Limited (‘Barion’), a term-funding vehicle, were set up in respect of Cullinan; and Malachite Funding Limited (‘Malachite’), a term-funding vehicle, was set up in respect of Asscher. The investors in the capital notes issued by Cullinan and Asscher had the option of exchanging their existing capital notes for the capital notes of the new conduits. In addition, the new conduits agreed to purchase the assets in Cullinan and Asscher. As a result of this agreement the legal title of all Cullinan and Asscher’s assets were transferred to the new conduits. However, the transfer of the assets will be settled over a time period that coincides with the maturity of Cullinan and Asscher’s senior debt.
During the first half of 2008, 91.3 per cent of the remaining capital note holders in Asscher and all of the capital note holders in Cullinan elected to exchange their existing holdings for capital notes in the new conduits. The holders of such capital notes bear the risks of any actual losses arising in the new conduits up to US$2.4 billion, being the par value of their respective holdings. Prior to the exchanges of assets against capital note extinguishments, the par value of the capital notes was US$2.6 billion. On consolidation, in November 2007, the carrying value of the capital notes was written down by US$1.3 billion to reflect the fair value of the assets at date of consolidation. During the first half of 2008, further impairment charges of US$134 million have been recognised leaving a US$1.2 billion of first loss protection from capital notes holders.
At 30 June 2008, the assets in Cullinan and Asscher sold to the new conduits but not yet settled were as follows:
Cullinan Asscher US$bn US$bn
Mazarin ......................................... 0.6 – Barion ............................................ 3.2 – Malachite ...................................... – 2.2
3.8 2.2
Mazarin is funded by CP, MTN issuance and term repos, which benefit from a 100 per cent liquidity facility provided by HSBC. Barion and Malachite are funded by term finance provided by HSBC. Unlike the SIVs, where liquidity ultimately relies on the ability to sell assets for cash, the continuing operations of the new conduits are not as sensitive to market value fluctuations in their underlying assets. On establishment of the new conduits, HSBC concluded that it was appropriate to consolidate them onto its balance sheet.
Mazarin, Barion and Cullinan
An analysis of the assets held by Mazarin, Barion and Cullinan at 30 June 2008 and 31 December 2007 is set out below:
Ratings analysis of assets
At 30 June 2008 20071
Mazarin Barion Cullinan Cullinan US$bn US$bn US$bn US$bnS&P ratings AAA ........................ 9.4 3.0 2.5 22.2AA ........................... 2.7 1.8 0.9 2.9A ............................. 0.4 0.6 0.2 3.1BBB ......................... 0.1 0.2 0.1 0.1BB ........................... – 0.1 – –
Total investments .... 12.6 5.7 3.7 28.3Cash and other assets 1.1 0.2 0.1 5.0
13.7 5.9 3.8 33.3
Composition of asset portfolio
At 30 June 2008 20071
Mazarin Barion Cullinan Cullinan US$bn US$bn US$bn US$bnAsset class Structured finance Residential MBSs ... 4.4 2.0 0.8 11.2Commercial MBSs .. 1.5 0.6 0.9 3.7Student loan
securities .............. 1.7 0.1 0.2 2.2Vehicle finance
loans securities ..... 0.2 0.1 – 0.3Leverage loan
securities .............. 0.8 0.4 0.4 2.0Other ABSs ............. 1.6 0.2 0.5 6.4
10.2 3.4 2.8 25.8
1 At 31 December 2007.

139
At 30 June 2008 20071
Mazarin Barion Cullinan Cullinan US$bn US$bn US$bn US$bn
Finance Commercial bank
securities and deposits ................ 1.7 1.6 0.8 6.3
Investment bank debt securities .............. 1.8 0.9 0.2 0.7
Finance company debt securities ...... – – – 0.5
3.5 2.5 1.0 7.5
13.7 5.9 3.8 33.3
The reduction in Cullinan’s asset portfolio from US$33.3 billion at 31 December 2007 to US$3.8 billion at 30 June 2008 reflects asset sales to the new conduits, exchanges of assets against capital note extinguishments with HSBC and third parties, as well as amortisation and fair value movements of the portfolio.
Exposure to US sub-prime and Alt-A
At 30 June 2008 20071
Mazarin Barion Cullinan Cullinan US$bn US$bn US$bn US$bnUS sub-prime
mortgages ............. 0.4 1.5 0.1 3.2Alt-A ....................... 2.5 0.1 0.1 4.4
2.9 1.6 0.2 7.6
During the first half of 2008, the credit ratings of certain ABSs, many with exposures to US sub-prime and Alt-A mortgages, were downgraded by rating agencies. As at 30 June 2008, 84 per cent remain AAA rated (31 December 2007: all the assets exposed to US sub-prime and Alt-A mortgages were AAA rated).
Total assets by balance sheet classification
At 30 June 2008 20071
Mazarin Barion Cullinan Cullinan US$bn US$bn US$bn US$bn
Derivative assets ..... – – – 0.2Loans and advances
to banks ................ 0.6 0.1 – 2.4Financial investments 13.0 5.8 3.8 30.5Other assets ............. 0.1 – – 0.2
13.7 5.9 3.8 33.3
Weighted average maturity of assets
At 30 June 2008 20071
Mazarin Barion Cullinan Cullinan US$bn US$bn US$bn US$bn
0-6 months .............. 0.2 0.2 0.4 6.16-12 months ............ 0.5 0.1 – 1.6Over 12 months ....... 13.0 5.6 3.4 25.6
13.7 5.9 3.8 33.3
The weighted average lives of the portfolios at 30 June 2008 were 4.3 years for Mazarin, 4.1 years for Barion and 4.4 years for Cullinan (31 December 2007: 4 years).
Funding structure
At 30 June 2008
At 31 December 2007
Total
Provided by HSBC Total
Provided by HSBC
US$bn US$bn US$bn US$bnMazarin Capital notes ......... 0.7 – – –Commercial paper . 9.9 9.4 – –Medium-term notes 2.3 0.6 – –Term repos executed 2.4 2.4 – –
15.3 12.4 – –
At 30 June
2008 At 31 December
2007
Total Provided by HSBC Total
Provided by HSBC
US$bn US$bn US$bn US$bnBarion Capital notes ......... 0.2 – – –Medium-term notes 2.7 2.7 – –Term repos executed 3.6 3.6 – –
6.5 6.3 – –
Cullinan Capital notes ......... – – 1.0 –Commercial paper . 2.0 2.0 5.3 2.3Medium-term notes 1.6 0.3 19.7 3.8Term repos executed 0.3 0.3 7.1 7.1
3.9 2.6 33.1 13.2
The weighted average lives of CP funding liabilities were 0.3 years for Mazarin and 0.6 years for Cullinan (2007: 0.56 years), and the weighted average lives of MTN funding liabilities were 4.2 years for Mazarin, 10.9 years for Barion and 0.3 years for Cullinan (2007: 1.13 years). Cullinan’s CP and MTN funding will be repaid when they fall due using the proceeds of asset sales to Mazarin and Barion at a pre-agreed price.
1 At 31 December 2007.
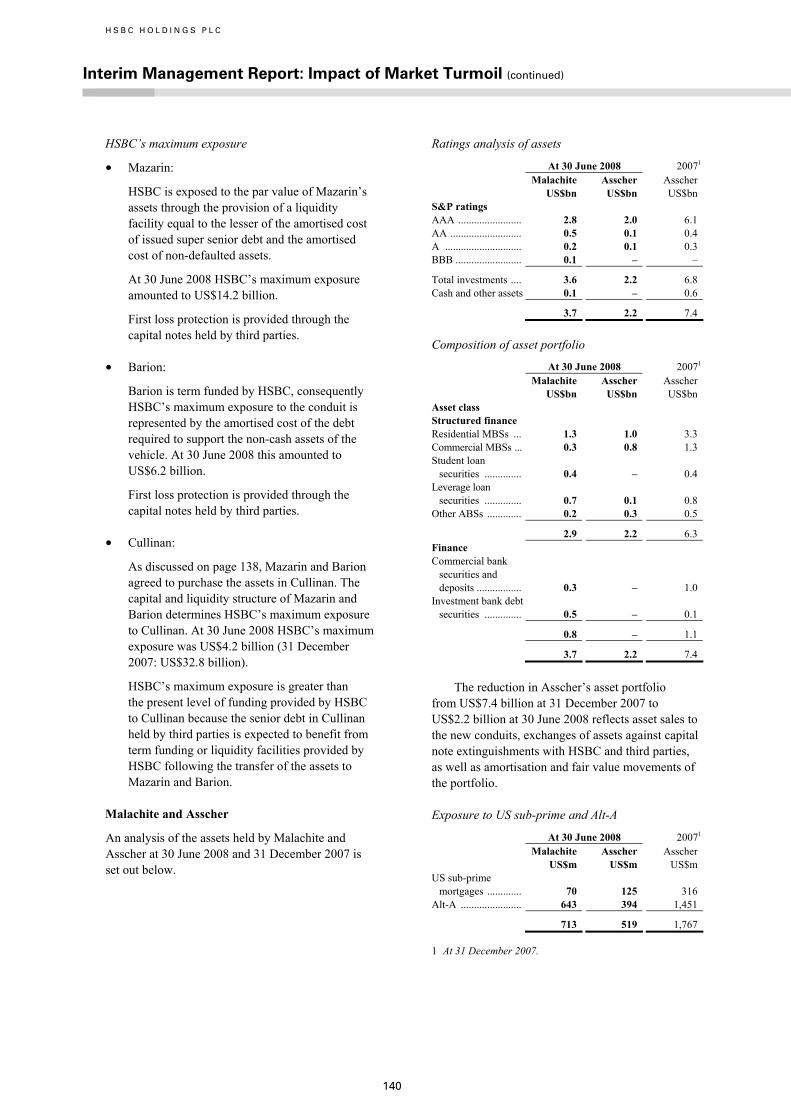
H S B C H O L D I N G S P L C
Interim Management Report: Impact of Market Turmoil (continued)
140
HSBC’s maximum exposure
• Mazarin:
HSBC is exposed to the par value of Mazarin’s assets through the provision of a liquidity facility equal to the lesser of the amortised cost of issued super senior debt and the amortised cost of non-defaulted assets.
At 30 June 2008 HSBC’s maximum exposure amounted to US$14.2 billion.
First loss protection is provided through the capital notes held by third parties.
• Barion:
Barion is term funded by HSBC, consequently HSBC’s maximum exposure to the conduit is represented by the amortised cost of the debt required to support the non-cash assets of the vehicle. At 30 June 2008 this amounted to US$6.2 billion.
First loss protection is provided through the capital notes held by third parties.
• Cullinan:
As discussed on page 138, Mazarin and Barion agreed to purchase the assets in Cullinan. The capital and liquidity structure of Mazarin and Barion determines HSBC’s maximum exposure to Cullinan. At 30 June 2008 HSBC’s maximum exposure was US$4.2 billion (31 December 2007: US$32.8 billion).
HSBC’s maximum exposure is greater than the present level of funding provided by HSBC to Cullinan because the senior debt in Cullinan held by third parties is expected to benefit from term funding or liquidity facilities provided by HSBC following the transfer of the assets to Mazarin and Barion.
Malachite and Asscher
An analysis of the assets held by Malachite and Asscher at 30 June 2008 and 31 December 2007 is set out below.
Ratings analysis of assets
At 30 June 2008 20071
Malachite Asscher Asscher US$bn US$bn US$bn S&P ratings AAA ........................ 2.8 2.0 6.1 AA ........................... 0.5 0.1 0.4 A ............................. 0.2 0.1 0.3 BBB ......................... 0.1 – –
Total investments .... 3.6 2.2 6.8 Cash and other assets 0.1 – 0.6
3.7 2.2 7.4
Composition of asset portfolio
At 30 June 2008 20071
Malachite Asscher Asscher US$bn US$bn US$bn Asset class Structured finance Residential MBSs ... 1.3 1.0 3.3 Commercial MBSs ... 0.3 0.8 1.3 Student loan
securities .............. 0.4 – 0.4 Leverage loan
securities .............. 0.7 0.1 0.8 Other ABSs ............. 0.2 0.3 0.5
2.9 2.2 6.3 Finance Commercial bank
securities and deposits ................. 0.3 – 1.0
Investment bank debt securities .............. 0.5 – 0.1
0.8 – 1.1
3.7 2.2 7.4
The reduction in Asscher’s asset portfolio from US$7.4 billion at 31 December 2007 to US$2.2 billion at 30 June 2008 reflects asset sales to the new conduits, exchanges of assets against capital note extinguishments with HSBC and third parties, as well as amortisation and fair value movements of the portfolio.
Exposure to US sub-prime and Alt-A
At 30 June 2008 20071
Malachite Asscher Asscher US$m US$m US$m US sub-prime
mortgages ............. 70 125 316 Alt-A ....................... 643 394 1,451
713 519 1,767
1 At 31 December 2007.

141
During the first half of 2008, the credit ratings of certain ABSs, many with exposures to US sub-prime and Alt-A mortgages, were downgraded by rating agencies. As at 30 June 2008, 84 per cent remain AAA rated (31 December 2007: all the assets exposed to US sub-prime and Alt-A mortgages were AAA rated).
Total assets by balance sheet classification
At 30 June 2008 20071
Malachite Asscher Asscher US$bn US$bn US$bn
Derivative assets ..... – – 0.1 Loans and advances
to banks ................ 0.1 – 0.7 Financial investments 3.6 2.2 6.6
3.7 2.2 7.4
Weighted average maturity of assets
At 30 June 2008 20071
Malachite Asscher Asscher US$bn US$bn US$bn
0-6 months .............. – – 0.8 6-12 months ............ 0.2 0.2 0.6 Over 12 months ...... 3.5 2.0 6.0
3.7 2.2 7.4
1 At 31 December 2007.
The weighted average lives of the portfolios at 30 June 2008 were 4.0 years for Malachite and 2.6 years for Asscher (31 December 2007: 3.7 years).
Funding structure
At 30 June 2008
At 31 December 2007
Total
Provided by HSBC Total
Provided by HSBC
US$bn US$bn US$bn US$bnMalachite Capital notes ........... 0.3 – – –Medium-term notes 0.3 0.3 – –Term repos executed 3.6 3.6 – –
4.2 3.9 – –
Asscher Capital notes ........... – – 0.3 –Commercial paper .. – – 2.0 0.1Medium-term notes 2.1 0.1 3.5 1.5Term repos executed 0.2 0.2 1.6 1.1
2.3 0.3 7.4 2.7
The weighted average lives of MTN funding liabilities for Asscher was 0.1 years (31 December 2007: 1.03 years) and 5.12 years for Malachite. These MTNs will be repaid when they fall due using the proceeds from asset sales to Malachite at a pre-agreed price. There was no outstanding CP at 30 June 2008; the weighted average lives of CP funding at 31 December 2007 was 0.44 years.
HSBC’s maximum exposure
• Malachite:
Malachite is term funded by HSBC, consequently HSBC’s maximum exposure to the conduit is represented by the amortised cost of the debt required to support the non-cash assets of the vehicle. At 30 June 2008, this amounted to US$3.9 billion.
First loss protection is provided through the capital notes held by third parties.
• Asscher:
As discussed on page 138, Malachite agreed to purchase the assets in Asscher. The capital and liquidity structure of Malachite determines HSBC’s maximum exposure to Asscher. At 30 June 2008, HSBC’s maximum exposure was US$2.3 billion (31 December 2007: US$7.2 billion).
HSBC’s maximum exposure is greater than the present level of funding provided by HSBC to Asscher because the senior debt in Asscher held by third parties is not expected to be refinanced in the market following the transfer of the assets to Malachite.
Conduits
HSBC sponsors and manages two types of conduits which issue CP; multi-seller conduits and securities investment conduits. HSBC has consolidated these conduits from inception because it is exposed to the majority of risks and rewards of ownership.
Securities investment conduits
Solitaire purchases highly rated ABSs to facilitate tailored investment opportunities. HSBC’s other securities investment conduits, Mazarin, Barion and Malachite evolved from the restructuring of HSBC’s sponsored SIVs and are discussed above.
The following tables analyse the assets held by Solitaire at 30 June 2008 is set out below:
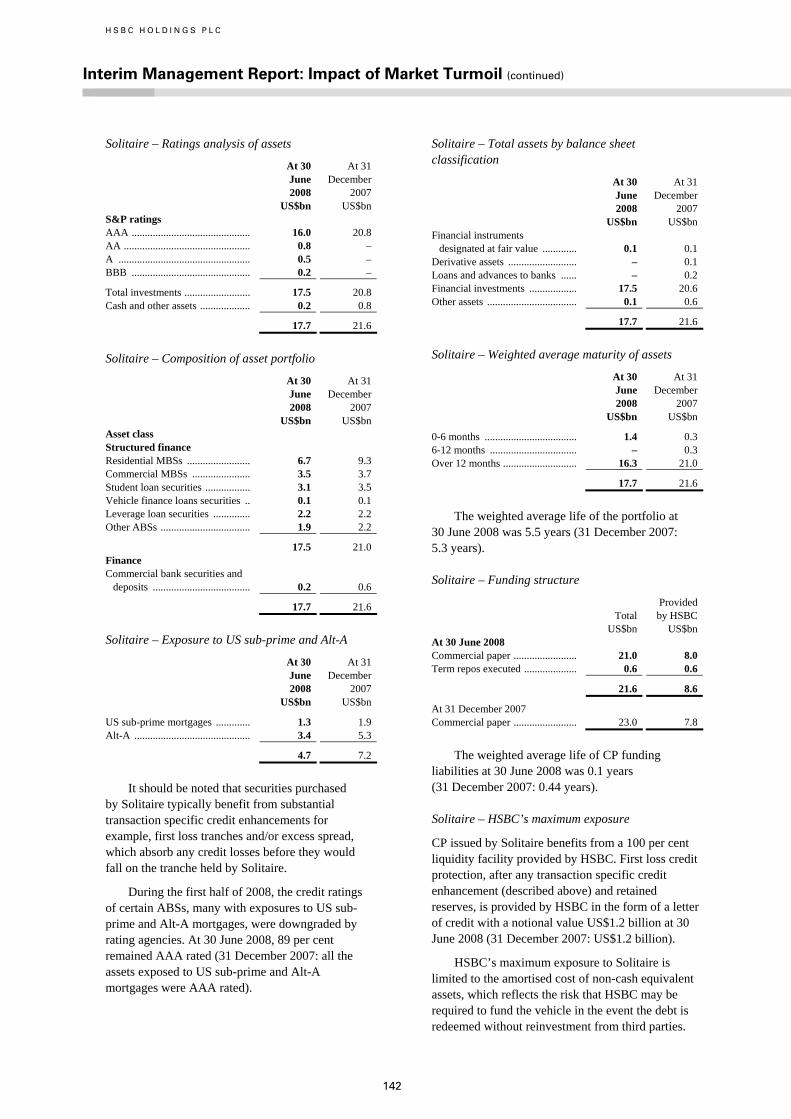
H S B C H O L D I N G S P L C
Interim Management Report: Impact of Market Turmoil (continued)
142
Solitaire – Ratings analysis of assets
At 30 June 2008
At 31 December 2007
US$bn US$bn S&P ratings AAA ............................................. 16.0 20.8 AA ................................................ 0.8 – A .................................................. 0.5 – BBB ............................................. 0.2 –
Total investments ......................... 17.5 20.8 Cash and other assets ................... 0.2 0.8
17.7 21.6
Solitaire – Composition of asset portfolio
At 30 June 2008
At 31 December 2007
US$bn US$bn Asset class Structured finance Residential MBSs ........................ 6.7 9.3 Commercial MBSs ...................... 3.5 3.7 Student loan securities ................. 3.1 3.5 Vehicle finance loans securities .. 0.1 0.1 Leverage loan securities .............. 2.2 2.2 Other ABSs .................................. 1.9 2.2
17.5 21.0 Finance Commercial bank securities and
deposits ..................................... 0.2 0.6
17.7 21.6
Solitaire – Exposure to US sub-prime and Alt-A
At 30 June 2008
At 31 December 2007
US$bn US$bn
US sub-prime mortgages ............. 1.3 1.9 Alt-A ............................................ 3.4 5.3
4.7 7.2
It should be noted that securities purchased by Solitaire typically benefit from substantial transaction specific credit enhancements for example, first loss tranches and/or excess spread, which absorb any credit losses before they would fall on the tranche held by Solitaire.
During the first half of 2008, the credit ratings of certain ABSs, many with exposures to US sub-prime and Alt-A mortgages, were downgraded by rating agencies. At 30 June 2008, 89 per cent remained AAA rated (31 December 2007: all the assets exposed to US sub-prime and Alt-A mortgages were AAA rated).
Solitaire – Total assets by balance sheet classification
At 30 June 2008
At 31 December 2007
US$bn US$bn Financial instruments
designated at fair value ............. 0.1 0.1 Derivative assets .......................... – 0.1 Loans and advances to banks ...... – 0.2 Financial investments .................. 17.5 20.6 Other assets .................................. 0.1 0.6
17.7 21.6
Solitaire – Weighted average maturity of assets
At 30 June 2008
At 31 December 2007
US$bn US$bn
0-6 months ................................... 1.4 0.3 6-12 months ................................. – 0.3 Over 12 months ............................ 16.3 21.0
17.7 21.6
The weighted average life of the portfolio at 30 June 2008 was 5.5 years (31 December 2007: 5.3 years).
Solitaire – Funding structure
Total
Provided by HSBC
US$bn US$bn At 30 June 2008 Commercial paper ........................ 21.0 8.0 Term repos executed .................... 0.6 0.6
21.6 8.6
At 31 December 2007 Commercial paper ........................ 23.0 7.8
The weighted average life of CP funding liabilities at 30 June 2008 was 0.1 years (31 December 2007: 0.44 years).
Solitaire – HSBC’s maximum exposure
CP issued by Solitaire benefits from a 100 per cent liquidity facility provided by HSBC. First loss credit protection, after any transaction specific credit enhancement (described above) and retained reserves, is provided by HSBC in the form of a letter of credit with a notional value US$1.2 billion at 30 June 2008 (31 December 2007: US$1.2 billion).
HSBC’s maximum exposure to Solitaire is limited to the amortised cost of non-cash equivalent assets, which reflects the risk that HSBC may be required to fund the vehicle in the event the debt is redeemed without reinvestment from third parties.

143
HSBC’s maximum exposure at 30 June 2008 amounted to US$21.6 billion (31 December 2007: US$25.7 billion).
Multi-seller conduits
These vehicles were established for the purpose of providing access to flexible market-based sources of finance for HSBC’s clients, for example, to finance discrete pools of third party-originated vehicle finance loan receivables. HSBC’s principal multi-seller conduits are Regency Assets Limited (‘Regency’), Bryant Park Funding Limited LLC (‘Bryant Park’), Abington Square Funding LLC (‘Abington Square’) and Performance Trust.
The multi-seller conduits purchase or fund interests in diversified pools of third party assets financed by the issuance of CP. The cash flows received by the conduits from the third party assets are used to service the funding, and to provide a commercial rate of return for HSBC for structuring, various other administrative services and the liquidity support it provides to the conduits. The asset pools acquired by the conduits are structured so that on the back of the credit enhancement the conduits receive, equating to senior investment grade ratings and the benefit of liquidity facilities typically provided by HSBC, the CP issued by the multi-seller conduits is itself highly rated.
During the first half of 2008, the finance provided by HSBC to Abington Square Funding LLC at the end of 2007 was repaid using the proceeds received from refinancing the assets within the conduit. At 30 June 2008, the conduit did not enter into any new securitisation transactions.
An analysis of the assets held by the multi-seller conduits is set out below:
Multi-seller conduits – Total assets by balance sheet classification
At 30 June 2008
At 31 December 2007
US$bn US$bn Loans and advances to customers 15.8 14.9 Financial investments .................. – 0.5 Other assets .................................. 0.4 0.4
16.2 15.8
Composition of collateral supporting multi-seller conduit assets
At 30 June 2008
At 31 December 2007
US$bn US$bn Asset class Structured finance Vehicle loans and equipment
leases ......................................... 4.2 3.6 Consumer receivables .................. 0.7 0.8 Credit card receivables ................ 1.1 1.5 Residential MBSs ........................ 1.7 2.0 Commercial MBSs ....................... 0.2 0.1 Auto floor plan ............................. 2.5 2.0 Trade receivables ......................... 2.7 3.1 Other ABSs .................................. 2.4 2.3
15.5 15.4 Finance Commercial bank securities and
deposits ...................................... 0.2 – Investment bank securities ........... 0.5 0.4
0.7 0.4
16.2 15.8
Exposure to US sub-prime and Alt-A
At 30 June 2008
At 31 December 2007
US$bn US$bn
US sub-prime mortgages ............. – 0.1 Alt-A ............................................ – –
– 0.1
Weighted average maturity of assets
At 30 June 2008
At 31 December 2007
US$bn US$bn
0-6 months ................................... 5.8 5.6 6-12 months ................................. 1.9 2.5 Over 12 months ............................ 8.5 7.7
16.2 15.8
These revolving credit facilities will predominantly have expected average lives with maturities of less than 12 months, but typically have a range of 1 to 60 months.
Multi-seller conduits – HSBC’s maximum exposure
HSBC provides transaction specific liquidity facilities to each of its multi-seller conduits, these are designed to be drawn in order to ensure the repayment of the CP issued. At 30 June 2008, the committed liquidity facilities amounted to US$20.5 billion (31 December 2007: US$21.2 billion).
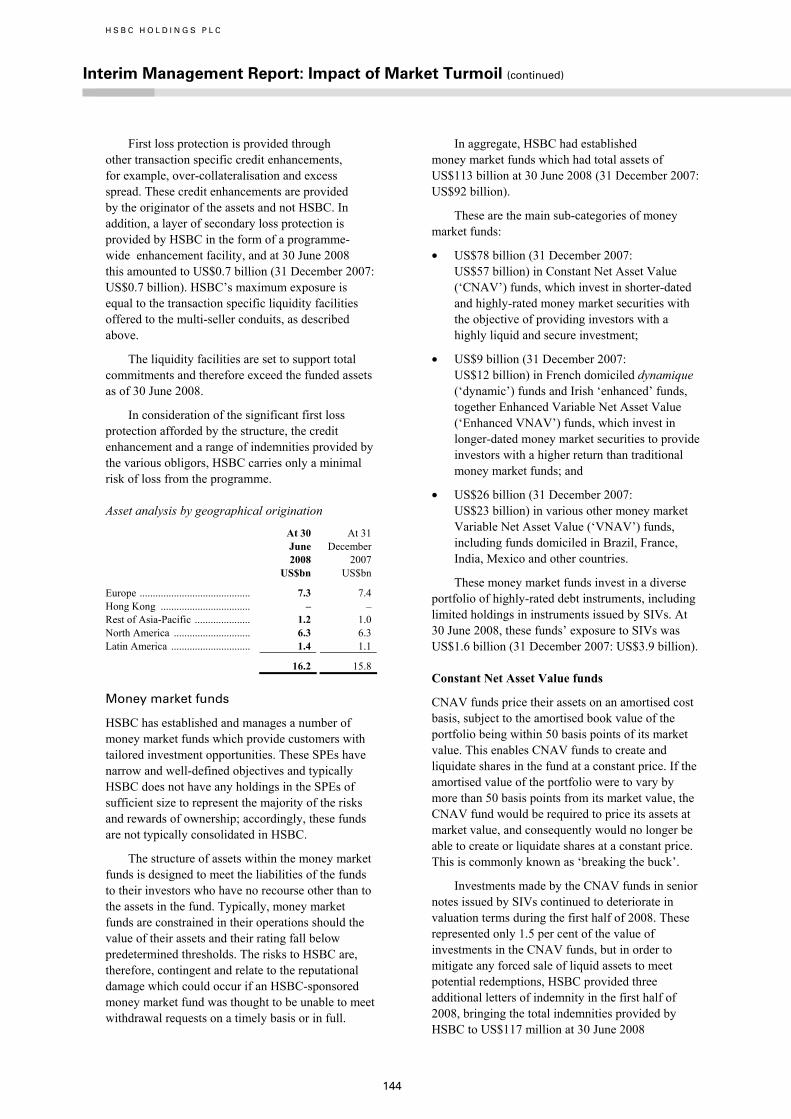
H S B C H O L D I N G S P L C
Interim Management Report: Impact of Market Turmoil (continued)
144
First loss protection is provided through other transaction specific credit enhancements, for example, over-collateralisation and excess spread. These credit enhancements are provided by the originator of the assets and not HSBC. In addition, a layer of secondary loss protection is provided by HSBC in the form of a programme-wide enhancement facility, and at 30 June 2008 this amounted to US$0.7 billion (31 December 2007: US$0.7 billion). HSBC’s maximum exposure is equal to the transaction specific liquidity facilities offered to the multi-seller conduits, as described above.
The liquidity facilities are set to support total commitments and therefore exceed the funded assets as of 30 June 2008.
In consideration of the significant first loss protection afforded by the structure, the credit enhancement and a range of indemnities provided by the various obligors, HSBC carries only a minimal risk of loss from the programme.
Asset analysis by geographical origination
At 30 June 2008
At 31 December 2007
US$bn US$bn
Europe .......................................... 7.3 7.4 Hong Kong .................................. – – Rest of Asia-Pacific ..................... 1.2 1.0 North America ............................. 6.3 6.3 Latin America .............................. 1.4 1.1
16.2 15.8
Money market funds
HSBC has established and manages a number of money market funds which provide customers with tailored investment opportunities. These SPEs have narrow and well-defined objectives and typically HSBC does not have any holdings in the SPEs of sufficient size to represent the majority of the risks and rewards of ownership; accordingly, these funds are not typically consolidated in HSBC.
The structure of assets within the money market funds is designed to meet the liabilities of the funds to their investors who have no recourse other than to the assets in the fund. Typically, money market funds are constrained in their operations should the value of their assets and their rating fall below predetermined thresholds. The risks to HSBC are, therefore, contingent and relate to the reputational damage which could occur if an HSBC-sponsored money market fund was thought to be unable to meet withdrawal requests on a timely basis or in full.
In aggregate, HSBC had established money market funds which had total assets of US$113 billion at 30 June 2008 (31 December 2007: US$92 billion).
These are the main sub-categories of money market funds:
• US$78 billion (31 December 2007: US$57 billion) in Constant Net Asset Value (‘CNAV’) funds, which invest in shorter-dated and highly-rated money market securities with the objective of providing investors with a highly liquid and secure investment;
• US$9 billion (31 December 2007: US$12 billion) in French domiciled dynamique (‘dynamic’) funds and Irish ‘enhanced’ funds, together Enhanced Variable Net Asset Value (‘Enhanced VNAV’) funds, which invest in longer-dated money market securities to provide investors with a higher return than traditional money market funds; and
• US$26 billion (31 December 2007: US$23 billion) in various other money market Variable Net Asset Value (‘VNAV’) funds, including funds domiciled in Brazil, France, India, Mexico and other countries.
These money market funds invest in a diverse portfolio of highly-rated debt instruments, including limited holdings in instruments issued by SIVs. At 30 June 2008, these funds’ exposure to SIVs was US$1.6 billion (31 December 2007: US$3.9 billion).
Constant Net Asset Value funds
CNAV funds price their assets on an amortised cost basis, subject to the amortised book value of the portfolio being within 50 basis points of its market value. This enables CNAV funds to create and liquidate shares in the fund at a constant price. If the amortised value of the portfolio were to vary by more than 50 basis points from its market value, the CNAV fund would be required to price its assets at market value, and consequently would no longer be able to create or liquidate shares at a constant price. This is commonly known as ‘breaking the buck’.
Investments made by the CNAV funds in senior notes issued by SIVs continued to deteriorate in valuation terms during the first half of 2008. These represented only 1.5 per cent of the value of investments in the CNAV funds, but in order to mitigate any forced sale of liquid assets to meet potential redemptions, HSBC provided three additional letters of indemnity in the first half of 2008, bringing the total indemnities provided by HSBC to US$117 million at 30 June 2008

145
(31 December 2007: US$41 million). The total assets under management (‘AUM’) of the funds where indemnities have been provided amounted to US$46.8 billion at 30 June 2008 (31 December 2007: US$27.1 billion)
The provision of limited indemnities to these funds did not result in HSBC consolidating the funds because HSBC was not exposed to the majority of the risks and rewards of ownership and the investors continue to bear the first loss.
During the first half of 2008, four of the SIVs in which HSBC’s CNAV funds had invested were placed in enforcement, the process by which the winding down of the independent SIVs and repaying secured creditors begins. At 30 June 2008, the CNAV funds held notes issued by third party sponsored SIVs in enforcement amounting to US$0.6 billion (31 December 2007: US$0.3 billion).
HSBC’s maximum exposure
HSBC’s maximum exposure to consolidated CNAV funds is represented by HSBC’s investment in the units of each CNAV fund, and by the maximum limit of the letters of limited indemnity provided to the CNAV funds. HSBC’s exposure at 30 June 2008 amounted to US$0.8 billion (31 December 2007: US$1.3 billion) and US$0.1 billion (31 December 2007: US$1.3 billion), for investment in units within the CNAV funds and letters of limited indemnity, respectively.
Enhanced Variable Net Asset Value funds
Enhanced VNAV funds price their assets on a fair value basis and consequently prices may change from one day to the next. These funds pursue an ‘enhanced’ investment strategy, as part of which investors accept greater credit and duration risk in the expectation of higher returns.
As part of action taken in respect of these funds in the second half of 2007, HSBC acquired the underlying assets and shares in two of its French dynamic money market funds. HSBC’s aggregate holding in these funds at 30 June 2008 was €0.6 billion (US$0.9 billion) and at 31 December 2007 was €0.9 billion (US$1.4 billion). As a result of continued redemptions by unit holders in the period to 30 June 2008, HSBC’s holding in the two funds increased to a level where it obtained the majority of the risks and rewards of ownership, and therefore consolidated these funds.
HSBC’s maximum exposure
HSBC’s maximum exposure to consolidated and unconsolidated Enhanced VNAV and unconsolidated VNAV funds is represented by HSBC’s investment in the units of each fund. HSBC’s maximum exposure at 30 June 2008 amounted to US$6.6 billion (31 December 2007: US$5.9 billion) and US$200 million (31 December 2007: US$260 million), for enhanced VNAV and VNAV funds, respectively.
Total assets of HSBC’s money market funds which are on-balance sheet by balance sheet classification
At 30 June 2008
At 31 December 2007
US$bn US$bn
Trading assets .............................. 0.5 0.7 Financial instruments
designated at fair value ............ 7.0 5.0
7.5 5.7
Non-money market investment funds
HSBC through its fund management business has also established a large number of non-money market funds to enable customers to invest in a range of assets, typically equities and debt securities. At the launch of a fund HSBC, as fund manager, typically provides a limited amount of initial capital known as ‘seed capital’ to enable the fund to start purchasing assets. These holdings are normally redeemed over time. The majority of these funds are off-balance sheet because, in view of HSBC’s limited economic interest, HSBC does not have the majority of the risks and rewards of ownership. As the non-money market funds explicitly provide tailored risk to investors, the risk to HSBC is restricted to HSBC’s own investments in the funds.
In aggregate, HSBC had established non-money market funds which had total assets of US$276.2 billion at 30 June 2008 (31 December 2007: US$288.8 billion).
These are the main sub-categories of non-money market funds:
• US$119.9 billion (31 December 2007: US$132 billion) in specialist funds, which comprise fundamental active specialists and active quantitative specialists;
• US$125.2 billion (31 December 2007: US$126.4 billion) in local investment management funds, which invest in domestic products, primarily for retail and private clients; and

H S B C H O L D I N G S P L C
Interim Management Report: Impact of Market Turmoil (continued)
146
• US$31.1 billion (31 December 2007: US$30.4 billion) in multi-manager funds, which offer fund of funds and manager of manager products across a diversified portfolio of assets.
Total assets of HSBC’s non-money market funds which are on-balance sheet by balance sheet classification
At 30 June 2008
At 31 December 2007
US$bn US$bn
Cash ............................................. 1.1 0.4 Trading assets .............................. 0.1 0.5 Financial instruments
designated at fair value ............ 6.4 3.0 Financial investments .................. 0.2 0.2
7.8 4.1
HSBC’s maximum exposure
HSBC’s maximum exposure to consolidated and unconsolidated non-money market funds is represented by HSBC’s investment in the units of each respective fund. HSBC’s exposure at 30 June 2008 amounted to US$6.5 billion (31 December 2007: US$6.0 billion).
Securitisations
HSBC uses SPEs to securitise customer loans and advances it has originated, mainly in order to diversify its sources of funding for asset origination and for capital efficiency. In such cases, the loans and advances are transferred by HSBC to the SPEs for cash, and the SPEs issue debt securities to investors to fund the cash purchases. Credit enhancements to the underlying assets may be used to obtain investment grade ratings on the senior debt issued by the SPEs. Except in one instance, these securitisations are all consolidated by HSBC. HSBC has also established securitisation programmes in the US and Germany where third party originated loans are securitised. The majority of these vehicles are not consolidated by HSBC as it is not exposed to the majority of risks and rewards of ownerships in the SPEs.
In addition, HSBC uses SPEs to mitigate the capital absorbed by some of its originated customer loans and advances. Credit derivatives are used to transfer the credit risk associated with such customer loans and advances to an SPE. These securitisations are commonly known as synthetic securitisations. These SPEs are consolidated where HSBC is exposed to the majority of risks and rewards of ownership.
Total assets of HSBC’s securitisations which are on-balance sheet, by balance sheet classification
At 30 June 2008
At 31 December 2007
US$bn US$bn
Trading assets .............................. 1.8 3.6 Loans and advances to customers. 60.4 69.6 Financial investments .................. – 0.1 Other assets .................................. 1.3 1.3 Derivatives ................................... 0.3 0.1
63.8 74.7
These assets include US$1.8 billion (31 December 2007: US$3.6 billion) of exposure to US sub-prime mortgages.
HSBC’s maximum exposure
The maximum exposure is the aggregate of any holdings of notes issued by these vehicles and the reserve account positions intended to provide credit support under certain pre-defined circumstances to senior note holders. HSBC is not obligated to provide further funding. At 30 June 2008, HSBC’s maximum exposure to consolidated and unconsolidated securitisations amounted to US$31.1 billion (31 December 2007: US$31 billion).
Other
HSBC also establishes SPEs in the normal course of business for a number of purposes, for example, structured credit transactions for customers to provide finance to public and private sector infrastructure projects, and for asset and structured finance (‘ASF’) transactions.
Structured credit transactions
HSBC provides structured credit transactions to third party professional and institutional investors who wish to obtain exposure, sometimes on a leveraged basis, to a reference portfolio of debt instruments. In such structures, the investor receives rewards referenced to the underlying portfolio by purchasing notes issued by the SPEs. HSBC enters into contracts with the SPEs, generally in the form of derivatives, in order to pass the required risks and rewards of the reference portfolios to the SPEs. HSBC’s risk in relation to the derivative contracts with the SPEs is managed within HSBC’s trading market risk framework (see Market Risk on page 183). In certain transactions HSBC is exposed to risk often referred to as gap risk. Gap risk typically arises in transactions where the aggregate potential claims against the SPE by HSBC pursuant to one or more derivatives could be greater than the
147
value of the collateral held by the SPE and securing such derivatives. HSBC often mitigates such gap risk through incorporation of features which allow for deleveraging, a managed liquidation of the portfolio, or other mechanisms embedded in the SPE transaction. Following the operation of such risk reduction mechanisms, HSBC has, in certain circumstances, retained all or a portion of the underlying exposure in the transaction. Where such exposure represents ABSs, such exposure retained has been included in ‘Nature and extent of HSBC’s exposures’ on page 117.
The transactions are facilitated through SPEs to enable the notes issued to the investors to be rated. The SPEs are not consolidated by HSBC because the investors bear substantially all the risks and rewards of ownership through the notes. An exception would be made when HSBC itself holds a majority of the notes issued by particular SPEs.
The total fair value of liabilities (notes issued and derivatives) in structured credit transaction SPEs was US$21.9 billion at 30 June 2008 (31 December 2007: US$23.6 billion). These amounts included US$0.2 billion (31 December 2007: US$0.1 billion) in SPEs that were consolidated by HSBC.
Other uses of SPEs
HSBC participates in Public-Private Partnerships to provide financial support for infrastructure projects initiated by government authorities. The funding structure is commonly achieved through the use of SPEs. HSBC consolidates these SPEs when it is exposed to the majority of risks and rewards of the vehicles.
HSBC’s ASF business specialises in leasing and arranging finance for aircraft and other physical assets, which it is customary to ring-fence through the use of SPEs, and in structured loans and deposits, where SPEs introduce cost efficiencies. HSBC consolidates these SPEs when the substance of the relationship indicates that HSBC controls the SPE.
HSBC’s risks and rewards of ownership in these SPEs are in respect of its on-balance sheet assets and liabilities.
Maximum exposures to SPEs
The following tables show the total assets of the various types of SPEs, and the amount and types of funding provided by HSBC to these SPEs. The tables also show HSBC’s maximum exposure to the SPEs, and within that exposure the types of liquidity and credit enhancements provided by HSBC. The maximum exposures to SPEs represent HSBC’s maximum possible risk exposure that could occur as a result of the Group’s arrangements and commitments to SPEs. The maximum amounts are contingent in nature, and may arise as a result of drawdowns under liquidity facilities, where these have been provided, any other funding commitments, or as a result of any loss protection provided by HSBC to the SPEs. The conditions under which such exposure might arise differ depending on the nature of each SPE and HSBC’s involvement with it. The aggregation of such maximum exposures across the different forms of SPEs results in a theoretical total maximum exposure number. The elements of the maximum exposure to an SPE are not necessarily additive and a detailed explanation of how maximum exposures are determined is provided under each category of SPE.

H S B C H O L D I N G S P L C
Interim Management Report: Impact of Market Turmoil (continued)
148
HSB
C’s
max
imum
exp
osur
e to
con
solid
ated
SPE
s affe
cted
by
the
rece
nt m
arke
t tur
moi
l
Se
curi
ties
Non
-mon
ey m
arke
t fun
ds
SIV
s i
nves
tmen
t
cond
uits
1 M
ulti-
selle
r
cond
uits
E
nhan
ced
VN
AV
fund
s
Spec
ialis
t
fund
s
Loc
al
fu
nds2
Se
curi
t-
isat
ions
3
Oth
er
T
otal
U
S$bn
US$
bn
U
S$bn
U
S$bn
U
S$bn
US$
bn
U
S$bn
US$
bn
U
S$bn
A
t 30
June
200
8
To
tal a
sset
s ...
......
......
......
......
......
......
......
......
......
......
......
......
......
......
......
6.0
41
.0
16
.2
7.5
0.
8
7.0
63
.8
0.
2
142.
5 D
irect
lend
ing4 ..
......
......
......
......
......
......
......
......
......
......
......
......
......
....
–
–
–
–
–
–
1.8
–
1.
8A
BSs
4 ....
......
......
......
......
......
......
......
......
......
......
......
......
......
......
......
...
5.
0
33.8
–
–
–
–
–
0.1
38
.9O
ther
.....
......
......
......
......
......
......
......
......
......
......
......
......
......
......
......
....
1.
0
7.2
16
.27.
5
0.8
7.
0
62.0
0.
1
101.
8
Fund
ing
prov
ided
by
HSB
C ..
......
......
......
......
......
......
......
......
......
......
.....
2.9
31
.2
3.
2 6.
6
0.3
4.
6
0.6
–
49
.4
CP
......
......
......
......
......
......
......
......
......
......
......
......
......
......
......
......
......
.
2.0
17
.4
3.2
–
–
–
–
–
22.6
MTN
s ....
......
......
......
......
......
......
......
......
......
......
......
......
......
......
......
....
0.
4
3.6
–
–
–
–
0.4
–
4.
4Ju
nior
not
es .
......
......
......
......
......
......
......
......
......
......
......
......
......
......
...
–
–
–
–
–
–
0.2
–
0.
2Te
rm re
pos e
xecu
ted
......
......
......
......
......
......
......
......
......
......
......
......
..
0.
5
10.2
–
–
–
–
–
–
10.7
Inve
stm
ents
in fu
nds
......
......
......
......
......
......
......
......
......
......
......
......
..
–
–
–
6.6
0.
3
4.6
–
–
11
.5
Tota
l max
imum
exp
osur
e to
con
solid
ated
SPE
s ...
......
......
......
......
......
...
6.
5
45.9
20.5
6.
6
0.3
4.
6
30.8
0.1
11
5.3
Liqu
idity
and
cre
dit e
nhan
cem
ents
D
eal-s
peci
fic li
quid
ity fa
cilit
ies
......
......
......
......
......
......
......
......
......
...
–
–
20
.5
–
–
–
–
–
20.5
Pr
ogra
mm
e-w
ide
liqui
dity
faci
litie
s ...
......
......
......
......
......
......
......
.....
0.5
35
.7
–
–
–
–
–
–
36.2
Pr
ogra
mm
e-w
ide
limite
d cr
edit
enha
ncem
ents
....
......
......
......
......
.....
–
1.2
0.
7 –
–
–
–
–
1.
9 O
ther
liqu
idity
and
cre
dit e
nhan
cem
ents
....
......
......
......
......
......
......
...
–
–
–
–
–
–
0.2
–
0.
2

149
Se
curit
ies
Non
-mon
ey m
arke
t fun
ds
SIV
s
inve
stm
ent
co
ndui
ts1
Mul
ti-se
ller
co
ndui
ts
En
hanc
ed
VN
AV
fund
s
Spec
ialis
t
fund
s
Loca
l
fund
s2
Secu
rit-
is
atio
ns3
O
ther
Tota
l
U
S$bn
US$
bn
U
S$bn
US$
bn
U
S$bn
US$
bn
U
S$bn
US$
bn
U
S$bn
A
t 31
Dec
embe
r 200
7
Tota
l ass
ets
......
......
......
......
......
......
......
......
......
......
......
......
......
......
......
...
40
.7
21
.6
15
.8
5.
7
1.0
3.
1
74.7
0.1
16
2.7
Dire
ct le
ndin
g4 .....
......
......
......
......
......
......
......
......
......
......
......
......
......
.
–
–
–
–
–
–
3.6
–
3.
6A
BSs
4 ....
......
......
......
......
......
......
......
......
......
......
......
......
......
......
......
...
36
.2
21.0
–
–
–
–
–
–
57
.2O
ther
.....
......
......
......
......
......
......
......
......
......
......
......
......
......
......
......
....
4.
5
0.6
15
.8
5.7
1.
0
3.1
71
.1
0.1
10
1.9
Fund
ing
prov
ided
by
HSB
C ..
......
......
......
......
......
......
......
......
......
......
.....
15.9
7.8
8.
6
4.6
0.
4
2.8
1.
0
–
41.1
C
P ...
......
......
......
......
......
......
......
......
......
......
......
......
......
......
......
......
....
2.
4
7.8
8.
6
–
–
–
–
–
18.8
MTN
s ....
......
......
......
......
......
......
......
......
......
......
......
......
......
......
......
....
5.
3
–
–
–
–
–
0.3
–
5.
6Ju
nior
not
es .
......
......
......
......
......
......
......
......
......
......
......
......
......
......
...
–
–
–
–
–
–
0.
7
–
0.7
Term
repo
s exe
cute
d ...
......
......
......
......
......
......
......
......
......
......
......
.....
8.2
–
–
–
–
–
–
–
8.
2In
vest
men
ts in
fund
s ...
......
......
......
......
......
......
......
......
......
......
......
.....
–
–
–
4.6
0.
4
2.8
–
–
7.
8
Tota
l max
imum
exp
osur
e to
con
solid
ated
SPE
s ...
......
......
......
......
......
...
40
.0
25
.7
21
.2
4.
6
0.4
2.
8
30.6
0.1
12
5.4
Liqu
idity
and
cre
dit e
nhan
cem
ents
....
......
......
......
......
......
......
......
......
....
D
eal-s
peci
fic li
quid
ity fa
cilit
ies
......
......
......
......
......
......
......
......
......
...
–
–
21
.2
–
–
–
–
–
21
.2
Prog
ram
me-
wid
e liq
uidi
ty fa
cilit
ies
......
......
......
......
......
......
......
......
..
0.
8
25.7
–
–
–
–
–
–
26.5
Pr
ogra
mm
e-w
ide
limite
d cr
edit
enha
ncem
ents
....
......
......
......
......
.....
–
0.2
0.
7
–
–
–
–
–
0.9
Oth
er li
quid
ity a
nd c
redi
t enh
ance
men
ts .
......
......
......
......
......
......
......
–
–
–
–
–
–
0.2
–
0.
2
1 Th
e se
curi
ties i
nves
tmen
t con
duits
incl
ude
Maz
arin
, Bar
ion,
Mal
achi
te a
nd S
olita
ire.
2
Loca
l inv
estm
ent m
anag
emen
t fun
ds.
3 Al
so in
clud
es c
onso
lidat
ed S
PEs t
hat h
old
mor
tgag
e lo
ans h
eld
at fa
ir v
alue
. 4
Thes
e as
sets
onl
y in
clud
e th
ose
mea
sure
d at
fair
val
ue. F
or d
etai
ls o
n th
e ge
ogra
phic
al o
rigi
n of
the
mor
tgag
e lo
ans h
eld
at fa
ir v
alue
and
ABS
s, in
clud
ing
thos
e re
pres
ente
d by
MBS
s and
CD
Os h
eld
in
cons
olid
ated
SIV
s and
secu
ritie
s inv
estm
ent c
ondu
its, s
ee ‘N
atur
e an
d ex
tent
of H
SBC
’s e
xpos
ures
’ on
pag
e 11
8. T
he g
eogr
aphi
cal o
rigi
n of
the
loan
s and
rece
ivab
les h
eld
by th
e m
ulti-
selle
r con
duits
is
disc
lose
d on
pag
e 14
4.
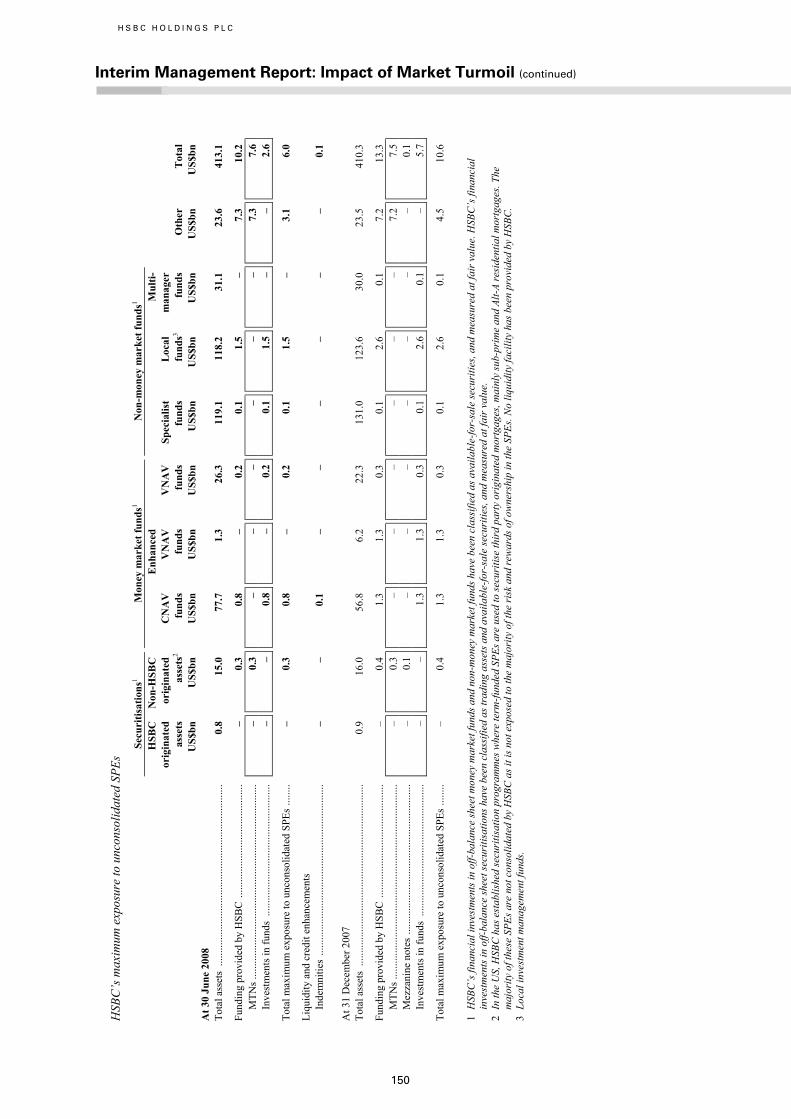
H S B C H O L D I N G S P L C
Interim Management Report: Impact of Market Turmoil (continued)
150
HSB
C’s
max
imum
exp
osur
e to
unc
onso
lidat
ed S
PEs
Se
curi
tisat
ions
1 M
oney
mar
ket f
unds
1 N
on-m
oney
mar
ket f
unds
1
H
SBC
or
igin
ated
asse
ts
Non
-HSB
C
orig
inat
ed
as
sets
2
CN
AV
fu
nds
E
nhan
ced
V
NA
V
fund
s
VN
AV
fu
nds
Sp
ecia
list
fu
nds
L
ocal
fund
s3
M
ulti-
m
anag
er
fu
nds
O
ther
Tot
al
US$
bn
U
S$bn
US$
bn
U
S$bn
US$
bn
U
S$bn
US$
bn
U
S$bn
US$
bn
U
S$bn
A
t 30
June
200
8
To
tal a
sset
s ...
......
......
......
......
......
......
......
......
......
......
......
0.8
15
.0
77
.7
1.
3
26.3
119.
1
118.
2
31.1
23.6
413.
1
Fund
ing
prov
ided
by
HSB
C ..
......
......
......
......
......
......
.....
–
0.
3
0.8
–
0.
2
0.1
1.
5
–
7.3
10
.2
MTN
s ....
......
......
......
......
......
......
......
......
......
......
......
....
–
0.
3
–
–
–
–
–
–
7.3
7.
6In
vest
men
ts in
fund
s ...
......
......
......
......
......
......
......
.....
–
–
0.
8
–
0.2
0.
1
1.5
–
–
2.
6
Tota
l max
imum
exp
osur
e to
unc
onso
lidat
ed S
PEs
......
..
–
0.3
0.
8
–
0.2
0.
1
1.5
–
3.
1
6.0
Liqu
idity
and
cre
dit e
nhan
cem
ents
In
dem
nitie
s ...
......
......
......
......
......
......
......
......
......
......
..
–
–
0.1
–
–
–
–
–
–
0.
1
At 3
1 D
ecem
ber 2
007
Tota
l ass
ets
......
......
......
......
......
......
......
......
......
......
......
...
0.
9
16.0
56.8
6.2
22
.3
13
1.0
12
3.6
30
.0
23
.5
41
0.3
Fund
ing
prov
ided
by
HSB
C ..
......
......
......
......
......
......
.....
–
0.
4
1.3
1.
3
0.3
0.
1
2.6
0.
1
7.2
13
.3
MTN
s ....
......
......
......
......
......
......
......
......
......
......
......
....
–
0.
3
–
–
–
–
–
–
7.2
7.
5M
ezza
nine
not
es ..
......
......
......
......
......
......
......
......
......
.
–
0.1
–
–
–
–
–
–
–
0.
1In
vest
men
ts in
fund
s ...
......
......
......
......
......
......
......
.....
–
–
1.
3
1.3
0.
3
0.1
2.
6
0.1
–
5.
7
Tota
l max
imum
exp
osur
e to
unc
onso
lidat
ed S
PEs
......
..
–
0.4
1.
3
1.3
0.
3
0.1
2.
6
0.1
4.
5
10.6
1 H
SBC
’s fi
nanc
ial i
nves
tmen
ts in
off-
bala
nce
shee
t mon
ey m
arke
t fun
ds a
nd n
on-m
oney
mar
ket f
unds
hav
e be
en c
lass
ified
as a
vaila
ble-
for-
sale
secu
ritie
s, an
d m
easu
red
at fa
ir v
alue
. HSB
C’s
fina
ncia
l in
vest
men
ts in
off-
bala
nce
shee
t sec
uriti
satio
ns h
ave
been
cla
ssifi
ed a
s tra
ding
ass
ets a
nd a
vaila
ble-
for-
sale
secu
ritie
s, an
d m
easu
red
at fa
ir v
alue
. 2
In th
e U
S, H
SBC
has
est
ablis
hed
secu
ritis
atio
n pr
ogra
mm
es w
here
term
-fund
ed S
PEs a
re u
sed
to se
curi
tise
thir
d pa
rty
orig
inat
ed m
ortg
ages
, mai
nly
sub-
prim
e an
d Al
t-A re
side
ntia
l mor
tgag
es. T
he
maj
ority
of t
hese
SPE
s are
not
con
solid
ated
by
HSB
C a
s it i
s not
exp
osed
to th
e m
ajor
ity o
f the
risk
and
rew
ards
of o
wne
rshi
p in
the
SPEs
. No
liqui
dity
faci
lity
has b
een
prov
ided
by
HSB
C.
3 Lo
cal i
nves
tmen
t man
agem
ent f
unds
.

151
Third party sponsored SPEs
HSBC has, through standby liquidity facility commitments, exposure to third party sponsored SIVs, conduits and securitisations, under normal banking arrangements on standard market terms. These exposures are quantified below:
HSBC’s commitments under liquidity facilities to third party SIVs, conduits and securitisations
Commit- ments Drawn
US$bn US$bn At 30 June 2008 Third party SIVs ............................ 0.1 – Third party conduits ...................... 1.6 – Third party securitisations ............. 0.7 –
2.4 – At 31 December 2007 Third party SIVs ............................ 0.3 – Third party conduits ...................... 4.4 0.4 Third party securitisations ............. 0.5 –
5.2 0.4
Other exposures to third party SIVs, conduits and securitisations where a liquidity facility has been provided
At 30 June 2008
At 31 December 2007
US$bn US$bn
Derivative assets .......................... – 0.2
Other off-balance sheet arrangements and commitments
Financial guarantees, letters of credit and similar undertakings
Note 17 on the Financial Statements describes various types of guarantees and discloses the maximum potential future payments under such arrangements. Credit risk associated with all forms of guarantees is assessed in the same manner as for on-balance sheet credit advances and, where necessary, provisions for assessed impairment are included in ‘Other provisions’.
Commitments to lend
Undrawn credit lines are disclosed in Note 17 on the Financial Statements. The majority by value of undrawn credit lines arise from ‘open to buy’ lines on personal credit cards, advised overdraft limits and other pre-approved loan products, and mortgage offers awaiting customer acceptance. HSBC generally has the right to change or terminate any conditions of a personal customer’s overdraft, credit card or other credit line upon notification to the customer. In respect of corporate commitments to lend, in most cases HSBC’s position will be protected through restrictions on access to funding in the event of material adverse change.
Leveraged finance transactions
Loan commitments in respect of leveraged finance transactions are accounted for as derivatives where it is HSBC’s intention to sell the loan after origination. Further information is provided on page 127.

H S B C H O L D I N G S P L C
Interim Management Report: Risk
152
Risk management
All HSBC’s activities involve, to varying degrees, the analysis, evaluation, acceptance and management of risks or combinations of risks. The most important risk categories that the Group is exposed to are credit risk (including cross-border country risk), liquidity risk, market risk, operational risk, reputational risk and insurance risk. Market risk includes foreign exchange, interest rate and equity price risks.
HSBC’s risk management policies are designed to identify and analyse these risks, to set appropriate risk limits and controls, and to monitor the risks and adherence to limits by means of reliable and up-to-date administrative and information systems. HSBC regularly reviews its risk management policies and systems to reflect changes in markets, products and emerging best practice. Individual responsibility and accountability, instilled through training, are designed to deliver a disciplined, conservative and constructive culture of risk management and control.
The Group Management Board (‘GMB’), under authority delegated by the Board of Directors, formulates high-level Group risk management policy. A separately convened Risk Management Meeting of GMB monitors risk and receives reports which allow it to review the effectiveness of HSBC’s risk management policies.
The management of all HSBC’s significant risks was discussed in detail in the Annual Report and Accounts 2007. There have been no changes to the Group’s risk management methodology since 31 December 2007 which are material to understanding the current reporting period.
The insurance businesses manage their own credit, liquidity and market risk, along with insurance risk, separately from the rest of HSBC, due to the different nature of their businesses.
Credit risk
HSBC’s credit risk management and internal control procedures are designed for all stages of economic and financial cycles, including the current protracted and challenging period of market volatility and downturn. The Credit Risk function continues to focus on regular dialogue with business origination teams to set priorities, refine risk appetite, and monitor and report higher-risk exposures. It is also actively enhancing credit risk management methodologies and policies as experience gained from the Group’s roll-out of its advanced internal ratings-based approach to the adoption of Basel II (see ‘Capital Management’ on page 197) feeds back
into capital and risk management processes.
As explained on page 197 of the Annual Report and Accounts 2007, the fundamental credit risk governance structures and control frameworks that the Group judges appropriate for its business are in place; there were no material changes during the first half of 2008, as the framework already encompassed stress test scenarios with characteristics similar to the market conditions experienced. The Credit Risk function continues to refine ‘early warning’ indicators and reporting, stress testing scenarios and economic capital measurement on the basis of current experience. These risk management tools are embedded within the Group’s business planning processes. Action has been taken, where necessary, to improve the Group’s resilience to risks in the current market conditions by selectively discontinuing business lines or products, tightening underwriting criteria and investing in improved fraud prevention technologies (see ‘Areas of special interest – credit risk’ on page 161).
Credit exposure
HSBC’s exposure to credit risk is spread over several asset classes, including trading assets, loans to customers, loans to banks and financial investments. The balance of exposure across the Group has not changed significantly since 31 December 2007, although the growth in loans and advances was more restrained than in other asset classes, reflecting a marginal decline in lending to the personal sector, primarily in the US. Derivatives exposure is shown gross under IFRSs, and movement in credit spreads and increased volatility caused both derivative assets and liabilities to move markedly higher. Trading assets increased, reflecting primarily the growth of collateralised lending business and the strong demand for Rates products in Europe. The proportion of total assets deployed in loans and advances to customers therefore decreased by half of one per cent, as the proportion represented by derivative assets rose by 2 percentage points while that of trading assets declined marginally.
Within loans and advances to customers, the proportion of lending to personal customers fell slightly compared with 31 December 2007, although the share of residential mortgages within total personal lending increased slightly. Amounts due from non-bank financial institutions increased by 15 per cent, primarily reflecting settlement accounts arising from the higher trading volumes in Global Markets as well as higher levels of secured lending through reverse repos. Loans and advances to banks and financial investments amounted to
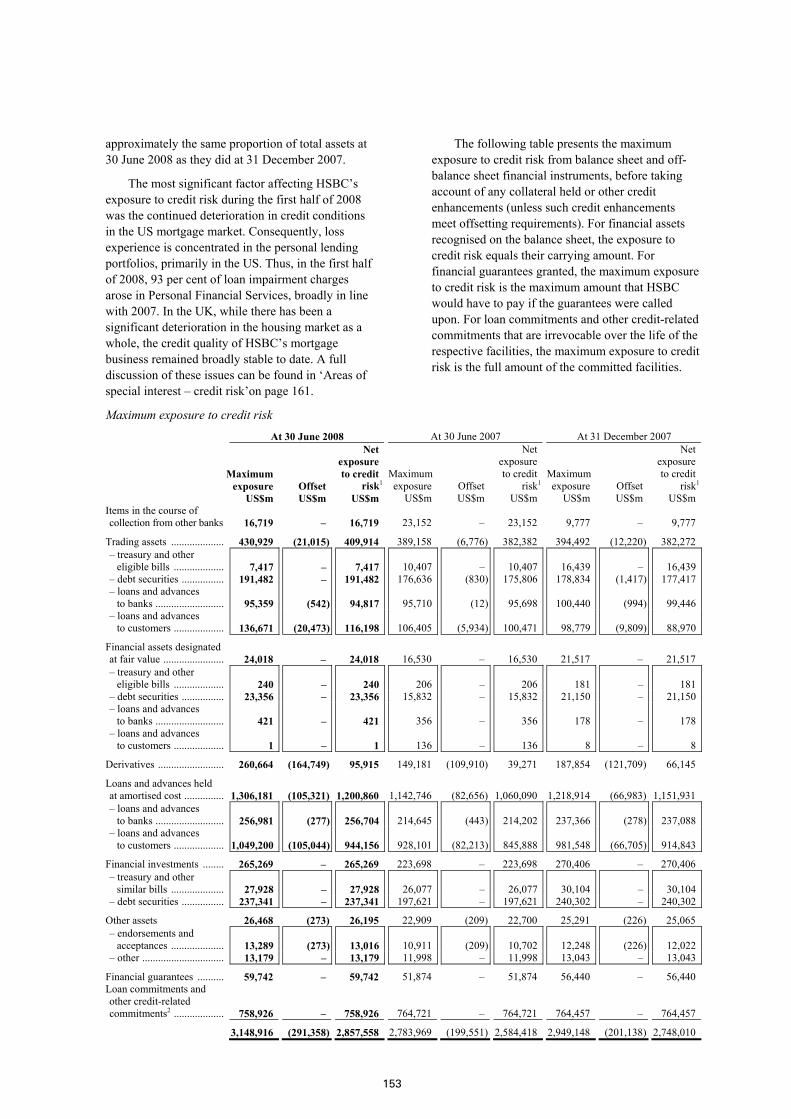
153
approximately the same proportion of total assets at 30 June 2008 as they did at 31 December 2007.
The most significant factor affecting HSBC’s exposure to credit risk during the first half of 2008 was the continued deterioration in credit conditions in the US mortgage market. Consequently, loss experience is concentrated in the personal lending portfolios, primarily in the US. Thus, in the first half of 2008, 93 per cent of loan impairment charges arose in Personal Financial Services, broadly in line with 2007. In the UK, while there has been a significant deterioration in the housing market as a whole, the credit quality of HSBC’s mortgage business remained broadly stable to date. A full discussion of these issues can be found in ‘Areas of special interest – credit risk’on page 161.
The following table presents the maximum exposure to credit risk from balance sheet and off-balance sheet financial instruments, before taking account of any collateral held or other credit enhancements (unless such credit enhancements meet offsetting requirements). For financial assets recognised on the balance sheet, the exposure to credit risk equals their carrying amount. For financial guarantees granted, the maximum exposure to credit risk is the maximum amount that HSBC would have to pay if the guarantees were called upon. For loan commitments and other credit-related commitments that are irrevocable over the life of the respective facilities, the maximum exposure to credit risk is the full amount of the committed facilities.
Maximum exposure to credit risk
At 30 June 2008 At 30 June 2007 At 31 December 2007
Maximum exposure Offset
Net exposure to credit risk1
Maximum exposure Offset
Net exposure to credit risk1
Maximum exposure Offset
Net exposure to credit risk1
US$m US$m US$m US$m US$m US$m US$m US$m US$m Items in the course of collection from other banks 16,719 – 16,719 23,152 – 23,152 9,777 – 9,777
Trading assets .................... 430,929 (21,015) 409,914 389,158 (6,776) 382,382 394,492 (12,220) 382,272 – treasury and other
eligible bills ................... 7,417 – 7,417 10,407 – 10,407 16,439 – 16,439– debt securities ................ 191,482 – 191,482 176,636 (830) 175,806 178,834 (1,417) 177,417– loans and advances
to banks .......................... 95,359 (542) 94,817 95,710 (12) 95,698 100,440 (994) 99,446– loans and advances
to customers ................... 136,671 (20,473) 116,198 106,405 (5,934) 100,471 98,779 (9,809) 88,970
Financial assets designated at fair value ....................... 24,018 – 24,018 16,530 – 16,530 21,517 – 21,517 – treasury and other
eligible bills ................... 240 – 240 206 – 206 181 – 181– debt securities ................ 23,356 – 23,356 15,832 – 15,832 21,150 – 21,150– loans and advances
to banks .......................... 421 – 421 356 – 356 178 – 178– loans and advances
to customers ................... 1 – 1 136 – 136 8 – 8
Derivatives ......................... 260,664 (164,749) 95,915 149,181 (109,910) 39,271 187,854 (121,709) 66,145
Loans and advances held at amortised cost ............... 1,306,181 (105,321) 1,200,860 1,142,746 (82,656) 1,060,090 1,218,914 (66,983) 1,151,931 – loans and advances
to banks .......................... 256,981 (277) 256,704 214,645 (443) 214,202 237,366 (278) 237,088– loans and advances
to customers ................... 1,049,200 (105,044) 944,156 928,101 (82,213) 845,888 981,548 (66,705) 914,843
Financial investments ........ 265,269 – 265,269 223,698 – 223,698 270,406 – 270,406 – treasury and other
similar bills .................... 27,928 – 27,928 26,077 – 26,077 30,104 – 30,104– debt securities ................ 237,341 – 237,341 197,621 – 197,621 240,302 – 240,302
Other assets 26,468 (273) 26,195 22,909 (209) 22,700 25,291 (226) 25,065 – endorsements and
acceptances .................... 13,289 (273) 13,016 10,911 (209) 10,702 12,248 (226) 12,022– other ............................... 13,179 – 13,179 11,998 – 11,998 13,043 – 13,043
Financial guarantees .......... 59,742 – 59,742 51,874 – 51,874 56,440 – 56,440 Loan commitments and other credit-related commitments2 ................... 758,926 – 758,926 764,721 – 764,721 764,457 – 764,457
3,148,916 (291,358) 2,857,558 2,783,969 (199,551) 2,584,418 2,949,148 (201,138) 2,748,010
H S B C H O L D I N G S P L C
Interim Management Report: Risk (continued)
154
1 Excluding the value of any collateral held or other credit enhancements. 2 The amount of the loan commitments reflects, where relevant, the expected level of take-up of pre-approved loan offers made by
mailshots to personal customers. In addition to those amounts, there is a further maximum possible exposure to credit risk of US$318,071 million (30 June 2007: US$319,380 million; 31 December 2007: US$317,834 million), reflecting the full take-up of such irrevocable loan commitments. The take-up of such offers is generally at modest levels.
Note 9 on the Financial Statements gives more information on credit risk exposure to derivatives counterparties.
HSBC typically has legally enforceable rights to offset certain credit exposures against amounts owing to the same counterparty. In normal circumstances there would be no intention of settling net, nor of realising the financial assets and settling the financial liabilities simultaneously. Consequently, for reporting purposes the financial assets are not offset against the respective financial liabilities. However, the exposure to credit risk relating to the respective financial assets is reduced as tabulated above.
Concentration of exposure
Concentrations of credit risk exist when a number of counterparties are engaged in similar activities, or operate in the same geographical areas or industry sectors and have comparable economic characteristics, so that their ability to meet contractual obligations is uniformly affected by changes in economic, political or other conditions.
Financial investments
At US$265 billion, total financial investments excluding equity securities were 2 per cent lower at 30 June 2008 than at 31 December 2007. Debt securities, at US$237 billion, represented the largest concentration of financial investments at 89 per cent of the total, compared with US$240 billion (89 per cent) at 31 December 2007. HSBC’s holdings of corporate debt and other securities were spread across a wide range of issuers and geographical regions, with 49 per cent invested in securities issued by banks and other financial institutions. Investors in Cullinan Finance Ltd and Asscher Finance Ltd, two SIVs managed by HSBC and consolidated in 2007, were offered the opportunity to exchange their investments for notes in new SIVs, and during the first half of 2008 most of them accepted. More information on these SIVs and the underlying assets is available on pages 137 to 141. In total, holdings in ABSs decreased by US$15 billion due to a combination of asset sales, amortisations and write-downs.
Investments in governments and government agencies of US$95 billion were 34 per cent of overall financial investments, 2 percentage points higher than at 31 December 2007. US$28 billion of these investments comprised treasury and other eligible bills.
A more detailed analysis of financial investments is set out in Note 10 on the Financial Statements.
At 30 June 2008, the insurance businesses held diversified portfolios of debt and equity securities designated at fair value of US$32 billion (31 December 2007: US$34 billion).
Derivatives
Derivative assets at 30 June 2008 were US$261 billion, a rise of 39 per cent from 31 December 2007, primarily across foreign exchange, interest rate and credit derivatives. The main drivers of growth were the mark-to-market movement across the entire portfolio arising from volatility and movements in interest rates and credit spreads, as well as new transactions during the period.
Securities held for trading
Total securities held for trading within trading assets were US$242 billion at 30 June 2008 (31 December 2007: US$247 billion). The largest concentration of these assets was to government and government agency securities, which amounted to US$123 billion, or 51 per cent of overall trading securities (31 December 2007: US$115 billion, 46 per cent). This included US$7 billion (31 December 2007: US$16 billion) of treasury and other eligible bills. Corporate debt and other securities were US$57 billion or 24 per cent of overall trading securities, in line with the level at 31 December 2007 of US$59 billion, or 24 per cent. Included within total securities held for trading were US$62 billion (31 December 2007: US$70 billion) of debt securities issued by banks and other financial institutions.
A more detailed analysis of securities held for trading is set out in Note 7 on the Financial Statements.
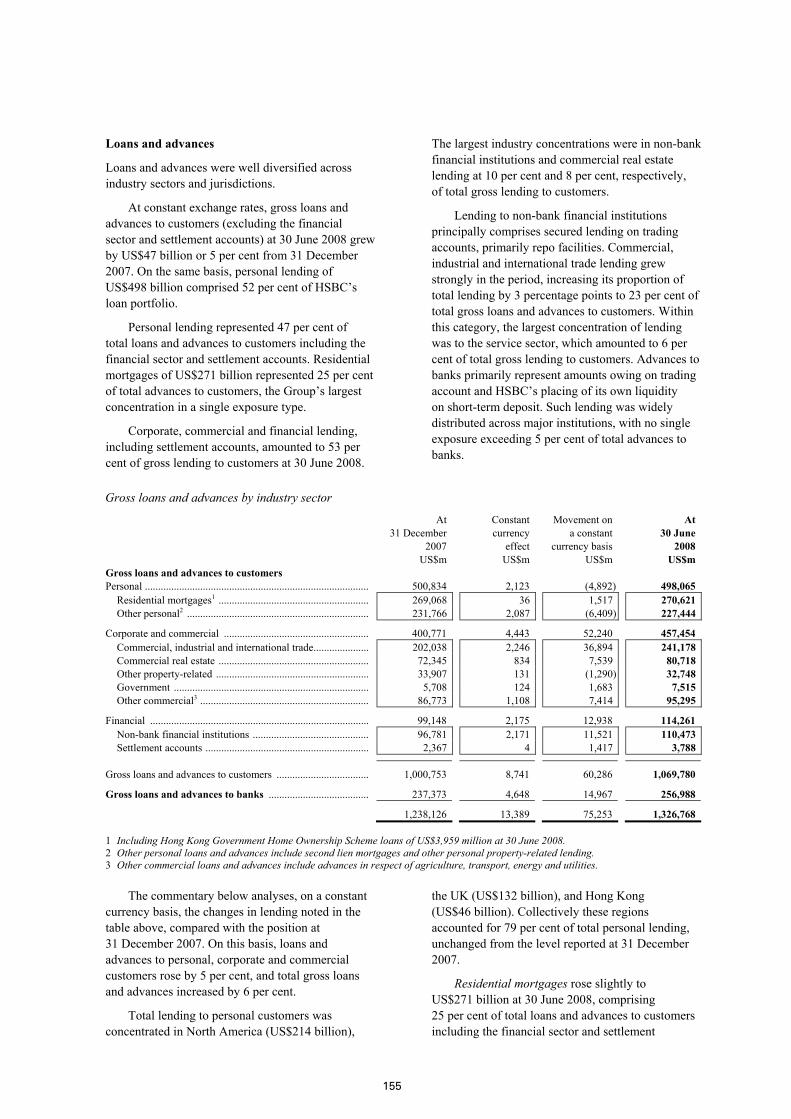
155
Loans and advances
Loans and advances were well diversified across industry sectors and jurisdictions.
At constant exchange rates, gross loans and advances to customers (excluding the financial sector and settlement accounts) at 30 June 2008 grew by US$47 billion or 5 per cent from 31 December 2007. On the same basis, personal lending of US$498 billion comprised 52 per cent of HSBC’s loan portfolio.
Personal lending represented 47 per cent of total loans and advances to customers including the financial sector and settlement accounts. Residential mortgages of US$271 billion represented 25 per cent of total advances to customers, the Group’s largest concentration in a single exposure type.
Corporate, commercial and financial lending, including settlement accounts, amounted to 53 per cent of gross lending to customers at 30 June 2008.
The largest industry concentrations were in non-bank financial institutions and commercial real estate lending at 10 per cent and 8 per cent, respectively, of total gross lending to customers.
Lending to non-bank financial institutions principally comprises secured lending on trading accounts, primarily repo facilities. Commercial, industrial and international trade lending grew strongly in the period, increasing its proportion of total lending by 3 percentage points to 23 per cent of total gross loans and advances to customers. Within this category, the largest concentration of lending was to the service sector, which amounted to 6 per cent of total gross lending to customers. Advances to banks primarily represent amounts owing on trading account and HSBC’s placing of its own liquidity on short-term deposit. Such lending was widely distributed across major institutions, with no single exposure exceeding 5 per cent of total advances to banks.
Gross loans and advances by industry sector
At 31 December 2007
Constant currency
effect
Movement on a constant currency basis
At 30 June 2008
US$m US$m US$m US$m Gross loans and advances to customers Personal ..................................................................................... 500,834 2,123 (4,892) 498,065
Residential mortgages1 ......................................................... 269,068 36 1,517 270,621 Other personal2 ..................................................................... 231,766 2,087 (6,409) 227,444
Corporate and commercial ....................................................... 400,771 4,443 52,240 457,454 Commercial, industrial and international trade..................... 202,038 2,246 36,894 241,178 Commercial real estate ......................................................... 72,345 834 7,539 80,718 Other property-related .......................................................... 33,907 131 (1,290) 32,748 Government .......................................................................... 5,708 124 1,683 7,515 Other commercial3 ................................................................ 86,773 1,108 7,414 95,295
Financial ................................................................................... 99,148 2,175 12,938 114,261 Non-bank financial institutions ............................................ 96,781 2,171 11,521 110,473 Settlement accounts .............................................................. 2,367 4 1,417 3,788
Gross loans and advances to customers ................................... 1,000,753 8,741 60,286 1,069,780
Gross loans and advances to banks ...................................... 237,373 4,648 14,967 256,988
1,238,126 13,389 75,253 1,326,768
1 Including Hong Kong Government Home Ownership Scheme loans of US$3,959 million at 30 June 2008. 2 Other personal loans and advances include second lien mortgages and other personal property-related lending. 3 Other commercial loans and advances include advances in respect of agriculture, transport, energy and utilities.
The commentary below analyses, on a constant currency basis, the changes in lending noted in the table above, compared with the position at 31 December 2007. On this basis, loans and advances to personal, corporate and commercial customers rose by 5 per cent, and total gross loans and advances increased by 6 per cent.
Total lending to personal customers was concentrated in North America (US$214 billion),
the UK (US$132 billion), and Hong Kong (US$46 billion). Collectively these regions accounted for 79 per cent of total personal lending, unchanged from the level reported at 31 December 2007.
Residential mortgages rose slightly to US$271 billion at 30 June 2008, comprising 25 per cent of total loans and advances to customers including the financial sector and settlement

H S B C H O L D I N G S P L C
Interim Management Report: Risk (continued)
156
accounts. Modest increases in mortgage lending in Hong Kong, Rest of Asia-Pacific, Latin America and Europe more than offset a 7 per cent fall in the value of the mortgage lending book in North America.
In Europe, residential mortgage balances rose by 6 per cent to US$102 billion. Mortgage lending rose by 8 per cent in the UK with the successful launch of the RateMatcher campaign contributing to an increase in HSBC’s market share in mortgages. This was partly offset by a fall of 17 per cent in mortgage lending in France due to the reclassification of the assets of the regional banks as held for sale. Excluding the reclassification, mortgage lending rose. Mortgage lending in Turkey was broadly in line with the second half of 2007.
In Hong Kong, residential mortgage lending increased by 7 per cent owing to the continued strength of the local economy.
In Rest of Asia-Pacific, mortgage lending balances rose by 4 per cent, driven by strong growth in mainland China as the branch network expanded, in the Middle East as favourable economic conditions resulted in higher originations, and in Taiwan following the acquisition of the assets, liabilities and operations of The Chinese Bank in March 2008.
In North America, residential mortgage balances declined by 7 per cent. In the US, the level of mortgage lending stood at US$90 billion at 30 June 2008, a fall of 9 per cent since 31 December 2007. Balances in the mortgage services business fell by 13 per cent as no new originations were made and the remainder of the portfolio continued to run-off. In consumer lending, balances fell by 2 per cent, driven by actions taken to reduce risk in the portfolio including tightening underwriting criteria and increasing collateral requirements for new originations. In the US retail bank, balances fell by 17 per cent as the majority of loan originations were sold in the secondary markets, while the existing loan portfolio declined through run-off and the sale of approximately US$4 billion of prime adjustable-rate mortgages (‘ARMs’) in May 2008 to the US Government-sponsored enterprises. In Canada, balances rose by 4 per cent as higher originations in the retail bank were driven by the continued strength of the Canadian economy and rising house prices.
In Latin America, balances rose by 13 per cent. In Mexico, an increase in fixed rate mortgages contributed to a rise in mortgage lending balances.
Other personal lending declined by 3 per cent to US$227 billion at 30 June 2008, representing
21 per cent of total loans and advances to customers including the financial sector and settlement accounts.
In Europe, other personal lending fell by 5 per cent from the end of 2007 to US$70 billion. This was driven by a decline in the UK, where tightened underwriting criteria in HSBC Bank constrained originations as the UK economy weakened in the first half of 2008. Lower lending in France reflected the reclassification of the assets of the regional banks as held for sale. In Turkey, customer acquisition was driven by the credit card business, which grew as the branch network expanded and the Black and Rouge and Pegasus cards were successfully launched in February 2008.
In Hong Kong, other personal lending rose by 7 per cent to US$14 billion, caused by the reclassification of vehicle finance within Personal Financial Services.
In Rest of Asia-Pacific, other personal lending rose by 14 per cent, driven by higher loan balances and increased numbers of credit cards in circulation in the Middle East as a result of enhanced marketing activity and strong economic growth. Elsewhere, growth was spread across the region, with notable increases in India and Taiwan, the latter primarily due to the acquisition of the assets, liabilities and operations of The Chinese Bank.
In North America, other personal lending balances declined by 7 per cent. In the US, consumer finance business and credit card lending fell due to the effect of tighter underwriting criteria and lower marketing expenditure. Non-credit card personal lending declined, driven by the decision to cease new business in guaranteed direct mail loans and personal homeowner loans in the second half of 2007, and tighter underwriting criteria applied to the remainder of the portfolio. In the mortgage services business, second lien mortgage balances fell due to the continued run-off of the portfolio following the cessation of originations in 2007. In the US retail bank, other personal lending fell, driven by the discontinuation of originations of indirect vehicle finance loans. This was partly offset by higher second lien mortgage lending following the success of a Home Equity campaign channelled through the branch network in the first half of 2008. In Canada, the tightening of credit underwriting criteria in the consumer finance business in line with a reduced risk appetite led to lower balances.
In Latin America, other personal lending balances rose by 7 per cent to US$20 billion. In

157
Brazil, vehicle and payroll lending drove other personal lending 9 per cent higher as demand for credit increased due to rising average household incomes and a positive economic outlook. In Mexico, balances were broadly stable as management directed the product offering towards customers of higher credit quality, in line with the refined asset growth strategy. Further growth was constrained through closing payroll loans to new originations and tightening underwriting criteria on cards, leading to a sharp reduction in the number of new cards issued in the first half of 2008.
Loans and advances to corporate and commercial customers rose by 12 per cent to US$457 billion, with strong growth in most regions. Lending was primarily concentrated in Europe, where it accounted for 57 per cent of advances to this sector, of which more than 43 per cent were in the UK.
In Europe, corporate and commercial advances rose by 14 per cent. In the UK, lending rose by 18 per cent, driven by growth in overdrafts, particularly to large corporates. Elsewhere in Europe, strong lending growth was experienced in Germany in a number of industrial sectors, as the product offering was expanded, and in Greece due to asset growth in the small and mid-market sectors. This was partly offset by lower balances in France due to the reclassification of the assets of the regional banks as held for sale.
In Hong Kong, corporate and commercial lending rose by 6 per cent, driven by trade finance products as the local economy continued to experience robust growth.
In Rest of Asia-Pacific, strong commercial lending growth was experienced in the Middle East and Singapore, which rose by 15 per cent and 39 per cent respectively and, to a lesser extent, in India and Taiwan, the latter due to the acquisition of The Chinese Bank in March 2008. In the Middle East, the corporate loan book continued to grow, reflecting the buoyant economic conditions in the region. In Singapore, lending rose, driven by the successful launch of a trade finance campaign in April 2008 and commercial real estate lending as the property market remained strong. Lending in mainland China fell slightly as restrictions on local currency lending imposed by the People’s Bank of China took effect. This partly offset strong growth elsewhere in the region.
In North America, corporate and commercial lending grew by 4 per cent, driven by growth in Canada and, to a lesser extent, the US retail bank. In Canada, corporate and commercial lending rose by 7 per cent, driven by robust economic conditions in Western Canada. In the US retail bank, higher lending to corporate and commercial clients reflected the targeted expansion of middle market activities and drawdown of commitments, partly offset by a decline in commercial real estate activity as the bank managed down its lending exposures in light of lower risk appetite and a deterioration in market conditions.
In Latin America, corporate and commercial lending rose by 19 per cent, mainly in Brazil where corporate and commercial lending rose as a result of strong growth in the trade loans portfolio and working capital products. Rising consumption due to increasing household income, sales and repricing initiatives and longer loan maturity periods were all contributory factors.
Loans and advances to the financial sector rose by 13 per cent to US$114 billion, driven by strong growth in Europe, which was up 27 per cent due to the increased provision of secured funding facilities through capital-efficient client-driven reverse repo business. This was partly offset in North America, where balances fell by 6 per cent due to a reduction in activities in light of the continued credit market dislocation.
Loans and advances to banks increased by 6 per cent to US$257 billion with growth experienced in most regions, particularly Hong Kong and Rest of Asia-Pacific as liquidity was concentrated in lower risk placements. Lending to banks in North America rose, as higher customer deposit balances, in part from growth in HSBC’s online savings proposition, were invested in Federal funds and certificates of deposit. In Europe, lending to banks fell by 12 per cent, driven by HSBC Bank, as reverse repo balances and money market term lending fell.
The following tables analyse loans by industry sector and by the location of the principal operations of the lending subsidiary or, in the case of the operations of The Hongkong and Shanghai Banking Corporation Limited, HSBC Bank plc, HSBC Bank Middle East Limited and HSBC Bank USA N.A., by the location of the lending branch.

H S B C H O L D I N G S P L C
Interim Management Report: Risk (continued)
158
Loans and advances to customers by industry sector and by geographical region
Europe Hong Kong
Rest of Asia- Pacific
North America
Latin America
Gross loans and advances to customers
Gross loans by industry sector as a % of total gross loans
US$m US$m US$m US$m US$m US$m % At 30 June 2008 Personal ........................................ 171,711 46,077 40,471 214,427 25,379 498,065 46.6
Residential mortgages1 ............. 101,620 31,774 21,786 110,373 5,068 270,621 25.3 Other personal ........................... 70,091 14,303 18,685 104,054 20,311 227,444 21.3
Corporate and commercial .......... 259,547 50,472 68,683 50,210 28,542 457,454 42.7 Commercial, industrial and
international trade .................. 147,452 21,427 41,216 14,540 16,543 241,178 22.5 Commercial real estate ............. 40,779 13,793 8,642 15,018 2,486 80,718 7.5 Other property-related .............. 9,542 8,673 5,759 8,349 425 32,748 3.1 Government .............................. 1,797 244 2,156 264 3,054 7,515 0.7 Other commercial2 .................... 59,977 6,335 10,910 12,039 6,034 95,295 8.9
Financial ...................................... 81,441 3,565 5,568 21,040 2,647 114,261 10.7 Non-bank financial
institutions .............................. 79,336 2,949 5,400 20,302 2,486 110,473 10.3 Settlement accounts .................. 2,105 616 168 738 161 3,788 0.4
Total gross loans and advances to customers3 ............................. 512,699 100,114 114,722 285,677 56,568 1,069,780 100.0
Percentage of loans and advances by geographical region ............. 47.9% 9.4% 10.7% 26.7% 5.3% 100.0%
Impaired loans ............................. 5,889 438 1,117 8,912 2,673 19,029 – as a percentage of gross loans
and advances to customers ..... 1.1% 0.4% 1.0% 3.1% 4.7% 1.8%
Impairment allowances on impaired loans ........................... 2,901 145 552 8,137 1,519 13,254 – as a percentage of impaired
loans ....................................... 49.3% 33.1% 49.4% 91.3% 56.8% 69.7%
At 30 June 2007 Personal ........................................ 163,962 43,800 33,793 228,698 18,623 488,876 51.9
Residential mortgages1 ............. 94,792 28,448 18,958 120,621 4,005 266,824 28.3 Other personal ........................... 69,170 15,352 14,835 108,077 14,618 222,052 23.6
Corporate and commercial .......... 213,600 41,565 50,832 40,392 21,842 368,231 39.1 Commercial, industrial and
international trade ................. 106,209 16,699 30,243 11,844 11,356 176,351 18.7 Commercial real estate ............. 31,706 11,584 6,788 13,115 1,145 64,338 6.8 Other property-related .............. 9,541 7,585 3,767 6,634 1,346 28,873 3.1 Government .............................. 1,981 356 1,076 256 3,895 7,564 0.8 Other commercial2 .................... 64,163 5,341 8,958 8,543 4,100 91,105 9.7
Financial ...................................... 54,189 4,888 4,489 19,919 1,832 85,317 9.0 Non-bank financial institutions 52,683 3,671 3,969 19,287 1,759 81,369 8.6 Settlement accounts .................. 1,506 1,217 520 632 73 3,948 0.4
Total gross loans and advances to customers3 ............................. 431,751 90,253 89,114 289,009 42,297 942,424 100.0
Percentage of loans and advances by geographical region ............. 45.8% 9.6% 9.4% 30.7% 4.5% 100.0%
Impaired loans ............................. 5,849 467 1,209 5,226 1,804 14,555 – as a percentage of gross loans
and advances to customers ..... 1.4% 0.5% 1.4% 1.8% 4.3% 1.5%
Impairment allowances on impaired loans4 ......................... 2,883 128 607 4,600 1,309 9,527 – as a percentage of impaired
loans4 ...................................... 49.3% 27.4% 50.2% 88.0% 72.6% 65.5%
For footnotes, see page 159.
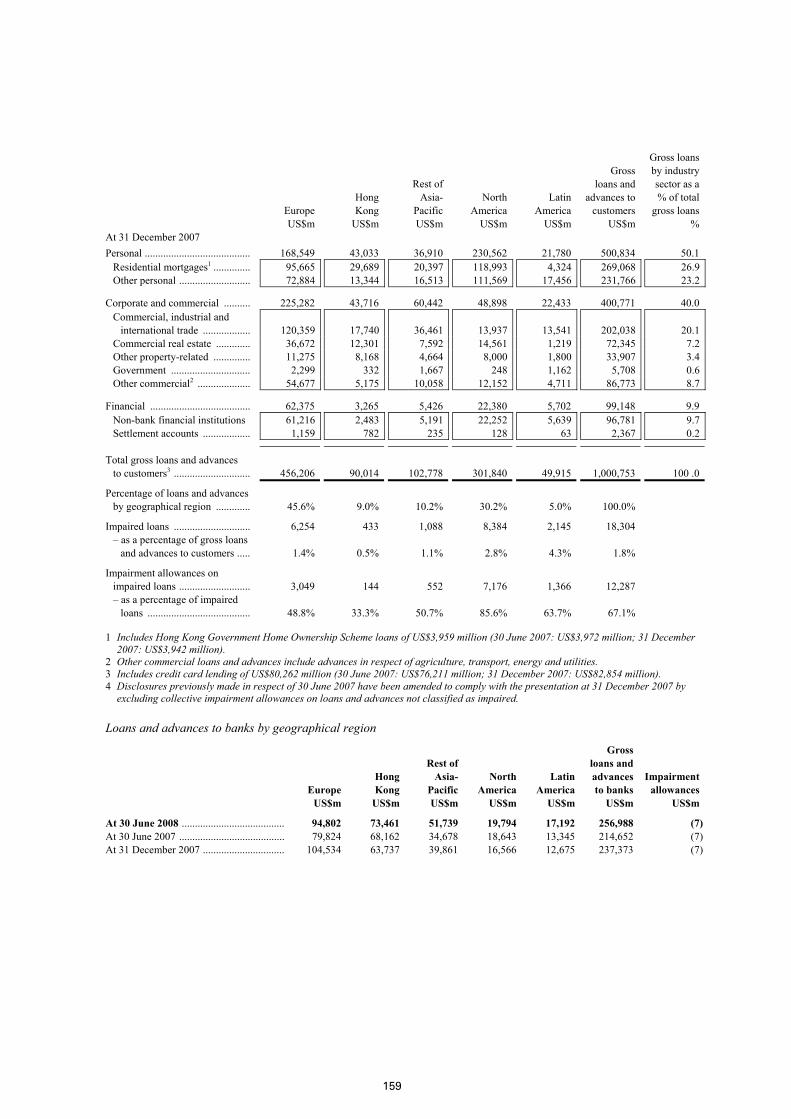
159
Europe Hong Kong
Rest of Asia- Pacific
North America
Latin America
Gross loans and advances to customers
Gross loans by industry sector as a % of total gross loans
US$m US$m US$m US$m US$m US$m % At 31 December 2007 Personal ........................................ 168,549 43,033 36,910 230,562 21,780 500,834 50.1
Residential mortgages1 .............. 95,665 29,689 20,397 118,993 4,324 269,068 26.9 Other personal ........................... 72,884 13,344 16,513 111,569 17,456 231,766 23.2
Corporate and commercial .......... 225,282 43,716 60,442 48,898 22,433 400,771 40.0 Commercial, industrial and
international trade .................. 120,359 17,740 36,461 13,937 13,541 202,038 20.1 Commercial real estate ............. 36,672 12,301 7,592 14,561 1,219 72,345 7.2 Other property-related .............. 11,275 8,168 4,664 8,000 1,800 33,907 3.4 Government .............................. 2,299 332 1,667 248 1,162 5,708 0.6 Other commercial2 .................... 54,677 5,175 10,058 12,152 4,711 86,773 8.7
Financial ...................................... 62,375 3,265 5,426 22,380 5,702 99,148 9.9 Non-bank financial institutions 61,216 2,483 5,191 22,252 5,639 96,781 9.7 Settlement accounts .................. 1,159 782 235 128 63 2,367 0.2
Total gross loans and advances to customers3 ............................. 456,206 90,014 102,778 301,840 49,915 1,000,753 100 .0
Percentage of loans and advances by geographical region ............. 45.6% 9.0% 10.2% 30.2% 5.0% 100.0%
Impaired loans ............................. 6,254 433 1,088 8,384 2,145 18,304 – as a percentage of gross loans
and advances to customers ..... 1.4% 0.5% 1.1% 2.8% 4.3% 1.8%
Impairment allowances on impaired loans ........................... 3,049 144 552 7,176 1,366 12,287 – as a percentage of impaired
loans ....................................... 48.8% 33.3% 50.7% 85.6% 63.7% 67.1%
1 Includes Hong Kong Government Home Ownership Scheme loans of US$3,959 million (30 June 2007: US$3,972 million; 31 December 2007: US$3,942 million).
2 Other commercial loans and advances include advances in respect of agriculture, transport, energy and utilities. 3 Includes credit card lending of US$80,262 million (30 June 2007: US$76,211 million; 31 December 2007: US$82,854 million). 4 Disclosures previously made in respect of 30 June 2007 have been amended to comply with the presentation at 31 December 2007 by
excluding collective impairment allowances on loans and advances not classified as impaired.
Loans and advances to banks by geographical region
Europe Hong Kong
Rest of Asia- Pacific
North America
Latin America
Gross loans and advances to banks
Impairment allowances
US$m US$m US$m US$m US$m US$m US$m
At 30 June 2008 ....................................... 94,802 73,461 51,739 19,794 17,192 256,988 (7)At 30 June 2007 ........................................ 79,824 68,162 34,678 18,643 13,345 214,652 (7)At 31 December 2007 ............................... 104,534 63,737 39,861 16,566 12,675 237,373 (7)
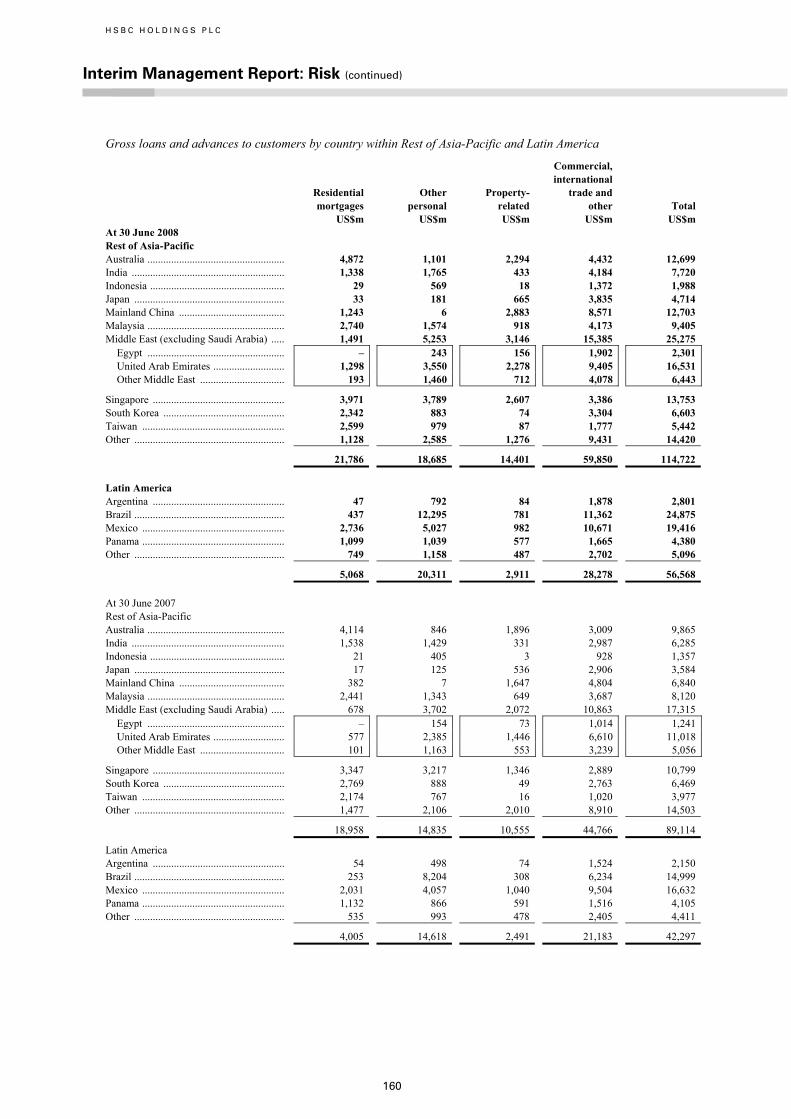
H S B C H O L D I N G S P L C
Interim Management Report: Risk (continued)
160
Gross loans and advances to customers by country within Rest of Asia-Pacific and Latin America
Residential mortgages US$m
Other personal US$m
Property- related US$m
Commercial, international trade and other US$m
Total US$m
At 30 June 2008 Rest of Asia-Pacific Australia .................................................... 4,872 1,101 2,294 4,432 12,699 India .......................................................... 1,338 1,765 433 4,184 7,720 Indonesia ................................................... 29 569 18 1,372 1,988 Japan ......................................................... 33 181 665 3,835 4,714 Mainland China ........................................ 1,243 6 2,883 8,571 12,703 Malaysia .................................................... 2,740 1,574 918 4,173 9,405 Middle East (excluding Saudi Arabia) ..... 1,491 5,253 3,146 15,385 25,275
Egypt .................................................... – 243 156 1,902 2,301 United Arab Emirates ........................... 1,298 3,550 2,278 9,405 16,531 Other Middle East ................................ 193 1,460 712 4,078 6,443
Singapore .................................................. 3,971 3,789 2,607 3,386 13,753 South Korea .............................................. 2,342 883 74 3,304 6,603 Taiwan ...................................................... 2,599 979 87 1,777 5,442 Other ......................................................... 1,128 2,585 1,276 9,431 14,420
21,786 18,685 14,401 59,850 114,722 Latin America Argentina .................................................. 47 792 84 1,878 2,801 Brazil ......................................................... 437 12,295 781 11,362 24,875 Mexico ...................................................... 2,736 5,027 982 10,671 19,416 Panama ...................................................... 1,099 1,039 577 1,665 4,380 Other ......................................................... 749 1,158 487 2,702 5,096
5,068 20,311 2,911 28,278 56,568 At 30 June 2007 Rest of Asia-Pacific Australia .................................................... 4,114 846 1,896 3,009 9,865 India .......................................................... 1,538 1,429 331 2,987 6,285 Indonesia ................................................... 21 405 3 928 1,357 Japan ......................................................... 17 125 536 2,906 3,584 Mainland China ........................................ 382 7 1,647 4,804 6,840 Malaysia .................................................... 2,441 1,343 649 3,687 8,120 Middle East (excluding Saudi Arabia) ..... 678 3,702 2,072 10,863 17,315
Egypt .................................................... – 154 73 1,014 1,241 United Arab Emirates ........................... 577 2,385 1,446 6,610 11,018 Other Middle East ................................ 101 1,163 553 3,239 5,056
Singapore .................................................. 3,347 3,217 1,346 2,889 10,799 South Korea .............................................. 2,769 888 49 2,763 6,469 Taiwan ...................................................... 2,174 767 16 1,020 3,977 Other ......................................................... 1,477 2,106 2,010 8,910 14,503
18,958 14,835 10,555 44,766 89,114
Latin America Argentina .................................................. 54 498 74 1,524 2,150 Brazil ......................................................... 253 8,204 308 6,234 14,999 Mexico ...................................................... 2,031 4,057 1,040 9,504 16,632 Panama ...................................................... 1,132 866 591 1,516 4,105 Other ......................................................... 535 993 478 2,405 4,411
4,005 14,618 2,491 21,183 42,297
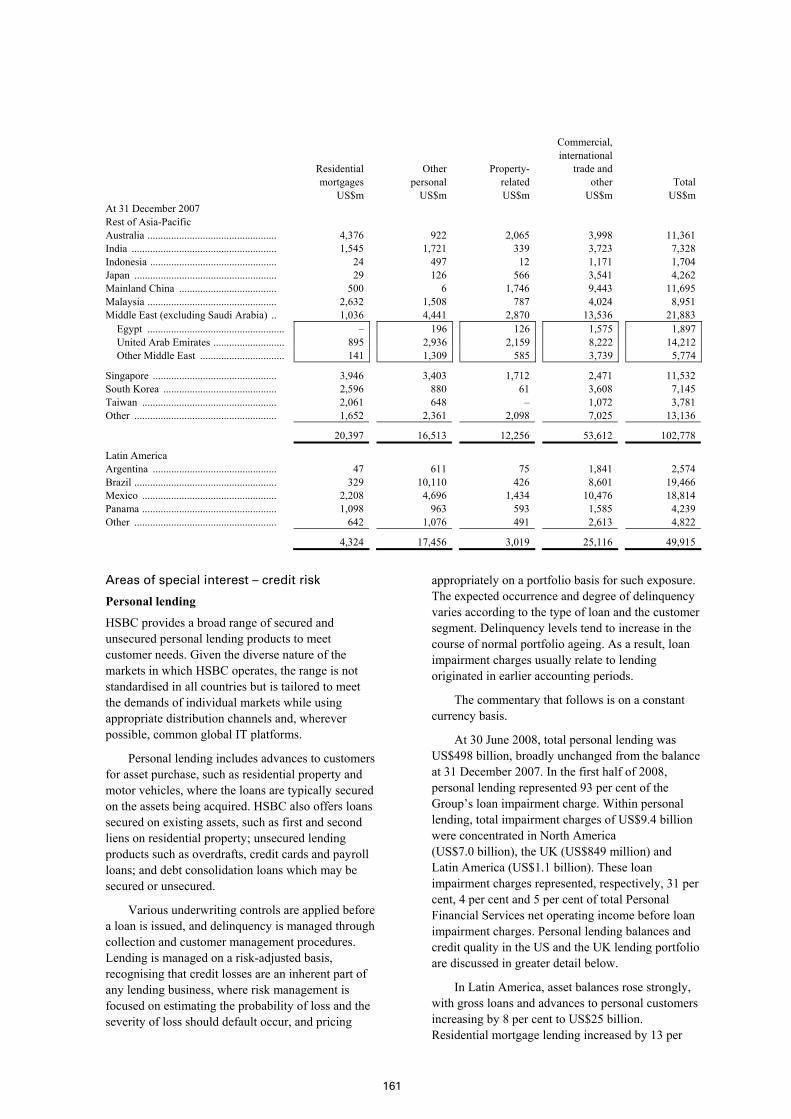
161
Residential mortgages US$m
Other personal US$m
Property- related US$m
Commercial, international trade and other US$m
Total US$m
At 31 December 2007 Rest of Asia-Pacific Australia ................................................. 4,376 922 2,065 3,998 11,361 India ....................................................... 1,545 1,721 339 3,723 7,328 Indonesia ................................................ 24 497 12 1,171 1,704 Japan ...................................................... 29 126 566 3,541 4,262 Mainland China ..................................... 500 6 1,746 9,443 11,695 Malaysia ................................................. 2,632 1,508 787 4,024 8,951 Middle East (excluding Saudi Arabia) .. 1,036 4,441 2,870 13,536 21,883
Egypt .................................................... – 196 126 1,575 1,897 United Arab Emirates ........................... 895 2,936 2,159 8,222 14,212 Other Middle East ................................ 141 1,309 585 3,739 5,774
Singapore ............................................... 3,946 3,403 1,712 2,471 11,532 South Korea ........................................... 2,596 880 61 3,608 7,145 Taiwan ................................................... 2,061 648 – 1,072 3,781 Other ...................................................... 1,652 2,361 2,098 7,025 13,136
20,397 16,513 12,256 53,612 102,778
Latin America Argentina ............................................... 47 611 75 1,841 2,574 Brazil ...................................................... 329 10,110 426 8,601 19,466 Mexico ................................................... 2,208 4,696 1,434 10,476 18,814 Panama ................................................... 1,098 963 593 1,585 4,239 Other ...................................................... 642 1,076 491 2,613 4,822
4,324 17,456 3,019 25,116 49,915
Areas of special interest – credit risk
Personal lending
HSBC provides a broad range of secured and unsecured personal lending products to meet customer needs. Given the diverse nature of the markets in which HSBC operates, the range is not standardised in all countries but is tailored to meet the demands of individual markets while using appropriate distribution channels and, wherever possible, common global IT platforms.
Personal lending includes advances to customers for asset purchase, such as residential property and motor vehicles, where the loans are typically secured on the assets being acquired. HSBC also offers loans secured on existing assets, such as first and second liens on residential property; unsecured lending products such as overdrafts, credit cards and payroll loans; and debt consolidation loans which may be secured or unsecured.
Various underwriting controls are applied before a loan is issued, and delinquency is managed through collection and customer management procedures. Lending is managed on a risk-adjusted basis, recognising that credit losses are an inherent part of any lending business, where risk management is focused on estimating the probability of loss and the severity of loss should default occur, and pricing
appropriately on a portfolio basis for such exposure. The expected occurrence and degree of delinquency varies according to the type of loan and the customer segment. Delinquency levels tend to increase in the course of normal portfolio ageing. As a result, loan impairment charges usually relate to lending originated in earlier accounting periods.
The commentary that follows is on a constant currency basis.
At 30 June 2008, total personal lending was US$498 billion, broadly unchanged from the balance at 31 December 2007. In the first half of 2008, personal lending represented 93 per cent of the Group’s loan impairment charge. Within personal lending, total impairment charges of US$9.4 billion were concentrated in North America (US$7.0 billion), the UK (US$849 million) and Latin America (US$1.1 billion). These loan impairment charges represented, respectively, 31 per cent, 4 per cent and 5 per cent of total Personal Financial Services net operating income before loan impairment charges. Personal lending balances and credit quality in the US and the UK lending portfolio are discussed in greater detail below.
In Latin America, asset balances rose strongly, with gross loans and advances to personal customers increasing by 8 per cent to US$25 billion. Residential mortgage lending increased by 13 per

H S B C H O L D I N G S P L C
Interim Management Report: Risk (continued)
162
cent, and other personal lending by 7 per cent. In Mexico, HSBC’s other personal lending balances at 30 June 2008 were US$5.0 billion, a rise of 1 per cent from 31 December 2007, mainly due to growth in credit card balances.
Loan impairment charges in Personal Financial Services in Mexico rose by 76 per cent to US$553 million in the first half of 2008, compared with the first half of 2007 driven by strong growth in loan balances, a deterioration in credit delinquency and portfolio seasoning.
Total gross personal lending At
30 June 2008
At 30 June
2007
At 31 December
2007 US$m US$m US$m
Total personal lending in the US ..................................................................... 184,211 201,360 199,336 US residential mortgages1 ........................................................................... 89,985 102,563 98,816Motor vehicle finance ................................................................................. 12,777 13,205 13,266MasterCard and Visa credit cards ............................................................... 30,534 30,393 32,223Private label cards ....................................................................................... 16,184 15,942 17,411Other personal lending ................................................................................ 34,731 39,257 37,620
Personal lending in North America excluding the US .................................... 30,216 27,338 31,226 Residential mortgages ................................................................................. 20,388 18,058 20,177Other personal lending ................................................................................ 9,828 9,280 11,049
Total personal lending in North America ........................................................ 214,427 228,698 230,562
Total personal lending in UK .......................................................................... 132,420 130,211 128,400 Residential mortgages ................................................................................. 91,522 85,827 85,356Other personal lending ................................................................................ 40,898 44,384 43,044
Total personal lending in other geographical regions ..................................... 151,218 129,967 141,872 Residential mortgages ................................................................................. 68,726 60,376 64,719Other personal lending ................................................................................ 82,492 69,591 77,153
498,065 488,876 500,834
1 Includes residential mortgages of HSBC Bank USA and HSBC Finance.
US personal lending – portfolio review
Total US personal lending at 30 June 2008 declined by 8 per cent to US$184 billion from the end of 2007. Residential mortgage balances fell by 9 per cent to US$90 billion due to the impact of decisions taken in 2007 to end new correspondent originations in mortgage services and limit new loans in the consumer lending business, as well as portfolio run-off and charge-offs, including a US$4 billion sale of a portfolio of loans by the US retail bank.
Other personal lending fell by 8 per cent to US$35 billion as tightened underwriting criteria and lower marketing expenditure matched HSBC’s reduced appetite for risk and constrained new originations. For similar reasons, card balances declined by 5 per cent to US$31 billion. Motor vehicle finance loans declined by 4 per cent to US$13 billion, as growth in the direct-to-consumer channel was offset by a decline in loans sold through dealerships as risk appetite was adjusted to reflect, in part, changed vehicle purchase preferences in the US as fuel prices rose markedly. HSBC ended relationships with a number of dealers in the first half of 2008.
In late July 2008 HSBC decided to cease originating new business within a 90 day period in the North America vehicle finance business of HSBC Finance Corporation. While credit quality in the vehicle finance business had improved during the first half of 2008, management considered that the business was sub-scale and did not have sufficient market strength for it to provide an acceptable level of risk adjusted returns. HSBC will manage an orderly run-off of the portfolio of US$12.5 billion. The estimated costs associated with the decision to exit the vehicle finance business are US$25 million, a substantial portion of which are expected to be recognised in the second half of 2008.
Mortgage lending – portfolio review
The Group offers a wide range of mortgage products designed to meet customer needs. The range includes capital or principal repayment mortgages subject to fixed or variable interest rates, and products designed to meet demand for housing loans with more flexible payment structures. HSBC underwrites both first lien residential mortgages and loans secured by second lien mortgages; the latter are reported within ‘Other personal lending’ in the

163
market sector analysis on page 156. The bulk of the mortgage lending products sold in the US consumer lending branch network are for refinancing and debt consolidation, rather than for house purchase.
Interest-only mortgages are those where customers make regular payments of interest during the life of the loan and repay the principal from the sale of their home or alternative sources of funds such as an endowment or other investment policy.
Introductory interest-only mortgages are typically where the interest-only element is for a fixed term at the start of the loan, after which principal repayments commence. Affordability mortgages include all products where the customer’s monthly payments are set at a low initial rate, either variable or fixed, before resetting to a higher rate once the introductory period is over. These include ARMs, loans on which the interest rate is periodically changed based on a reference price.
HSBC has not offered, and does not expect to offer, ARMs with self-select payment options or other negative amortisation products.
Affordability mortgages are primarily offered in the US and the UK. Under the HFC and Beneficial brands, HSBC Finance and HFC UK offer a range of products and delivery channels designed for the needs of customers with non-standard or less favourable credit profiles. In the US, these mortgages continue to experience heightened levels of delinquency that began to emerge in late 2006. In 2008, management continued to tighten underwriting criteria, reducing loan to value ratios, with tighter restrictions in certain states to respond to these elevated levels of delinquency. These actions contributed to the reduction in HSBC Finance’s mortgage balances to US$83 billion at 30 June 2008 (31 December 2007: US$89 billion) as set out in the table on page 164.
In the UK, affordability mortgages have shown significantly lower levels of delinquency due to the different credit profiles of the customers to those in the US, tighter underwriting criteria and less marked weakness in house prices to date.
US mortgage lending
US mortgage lending, comprising residential mortgage and second lien lending, made up 21 per cent of the Group’s gross loans and advances to personal customers at 30 June 2008.
Balances declined by 9 per cent from 31 December 2007, reflecting decisions made in the consumer finance business to run down the mortgage services portfolio and tighten underwriting standards
in the consumer lending portfolio. The retail bank sold a US$4 billion portfolio of loans in the first half of 2008, and continued to sell newly originated residential mortgages to the US government-sponsored mortgage agencies.
UK mortgage lending
The UK mortgage business increased balances while maintaining overall credit quality, despite a significant deterioration in the housing market as a whole. The withdrawal of some competitors from the market and the consequent repricing of risk allowed HSBC Bank to expand its share of the new lending market while staying within its targeted customer segments.
Total mortgage lending rose from US$87 billion at 31 December 2007 to US$93 billion at 30 June 2008. The increase reflected a US$3 billion rise in first lien prime mortgages at HSBC Bank, driven by the success of the RateMatcher mortgage campaign in the first half of 2008 in generating new business, and a US$3 billion increase at First Direct as a result of a similar campaign.
HSBC Bank only accepts new originations through its own salesforce and carries out no business through third parties. The vast majority of lending is to existing customers holding a current account relationship with the bank. At 30 June 2008 only a low percentage of the bank’s book consisted of lending to purchase property for rent to third parties, for which the bank applies higher collateral requirements.
Interest-only mortgage balances rose from US$32 billion at 31 December 2007 to US$37 billion at 30 June 2008, driven by the increase in First Direct balances. The vast bulk of First Direct mortgages are offset mortgages linked to a current account and are classified as interest-only, using the categories described above.
Second lien balances, which were all held by HFC UK, declined from US$1.9 billion at 31 December 2007 to US$1.8 billion at 30 June 2008 due to tighter underwriting criteria restricting originations. In the first half of 2008, HFC UK ceased originating loans through brokers.
UK mortgage credit quality remained broadly stable. The portion of mortgages with a loan to value ratio greater than 90 per cent declined as virtually no new loans were originated in this category, in line with measures initiated in 2007 and extended in 2008. The average loan to value ratio for new business in the first half of 2008, at 56 per cent, was at its lowest for four years.

H S B C H O L D I N G S P L C
Interim Management Report: Risk (continued)
164
Despite the weakening in the housing market, delinquency rates on mortgages in the UK increased only gradually. At the retail bank 30 days or more delinquency rates rose from 1.8 per cent at 31 December 2007 to 1.9 per cent at 30 June 2008. Credit quality at First Direct remained high, with delinquency rates less than 0.1 per cent, marking a slight increase from a very low base. Delinquencies on second lien mortgages offered through HFC UK
increased in 2008. There was a small increase in loan impairment charges on mortgages, reflecting the weaker economic environment and less liquid property market.
The following table shows the levels of mortgage lending products in the various portfolios in the US and the UK, together with the rest of the HSBC Group.
Mortgage lending products
US
Rest of North America UK
Rest of Europe Other Total
US$m US$m US$m US$m US$m US$m At 30 June 2008 Residential mortgages ................................ 90,096 20,277 91,522 10,098 58,628 270,621 Second lien mortgages ................................ 16,136 1,266 1,754 – 519 19,675
Total mortgage lending ............................... 106,232 21,543 93,276 10,098 59,147 290,296
Second lien as a percentage of total mortgage lending .................................... 15.2% 5.9% 1.9% –
0.9% 6.8%
Interest-only (including endowment) mortgages ............................................... – 1,408 37,270 532 1,115 40,325
Affordability mortgages, including ARMs 31,995 – 8,304 820 4,961 46,080 Other ........................................................... – – 392 – 287 679
Total interest-only and affordability mortgages ............................................... 31,995 1,408 45,966 1,352 6,363 87,084
– as a percentage of total mortgage lending 30.1% 6.5% 49.3% 13.4% 10.8% 30.0%
Negative equity mortgages ......................... 9,673 46 913 – 127 10,759 Other loan to value ratios greater than
90 per cent .............................................. 39,098 1,726 10,242 151 666 51,883
48,771 1,772 11,155 151 793 62,642
– as a percentage of total mortgage lending 45.9% 8.2% 12.0% 1.5% 1.3% 21.6% At 31 December 2007 Residential mortgages ................................ 98,928 20,065 85,356 10,309 54,410 269,068 Second lien mortgages ................................ 17,590 1,256 1,930 – 748 21,524
Total mortgage lending ............................... 116,518 21,321 87,286 10,309 55,158 290,592
Second lien as a percentage of total mortgage lending .................................... 15.1% 5.9% 2.2% –
1.4% 7.4%
Interest-only (including endowment) mortgages ............................................... – 174 32,314 602 1,335 34,425
Affordability mortgages, including ARMs 40,201 219 8,695 685 4,993 54,793 Other1 .......................................................... – 274 241 27 621 1,163
Total interest-only and affordability mortgages ............................................... 40,201 667 41,250 1,314 6,949 90,381
– as a percentage of total mortgage lending 34.5% 3.1% 47.3% 12.7% 12.6% 31.1%
Negative equity mortgages ......................... 11,079 107 646 – 525 12,357 Other loan to value ratios greater than
90 per cent .............................................. 42,246 679 10,969 211 1,333 55,438
53,325 786 11,615 211 1,858 67,795
– as a percentage of total mortgage lending 45.8% 3.7% 13.3% 2.0% 3.4% 23.3%
1 December 2007 has been restated to exclude mortgages in the UK that are fixed for a period of time before reverting to a standard variable rate.
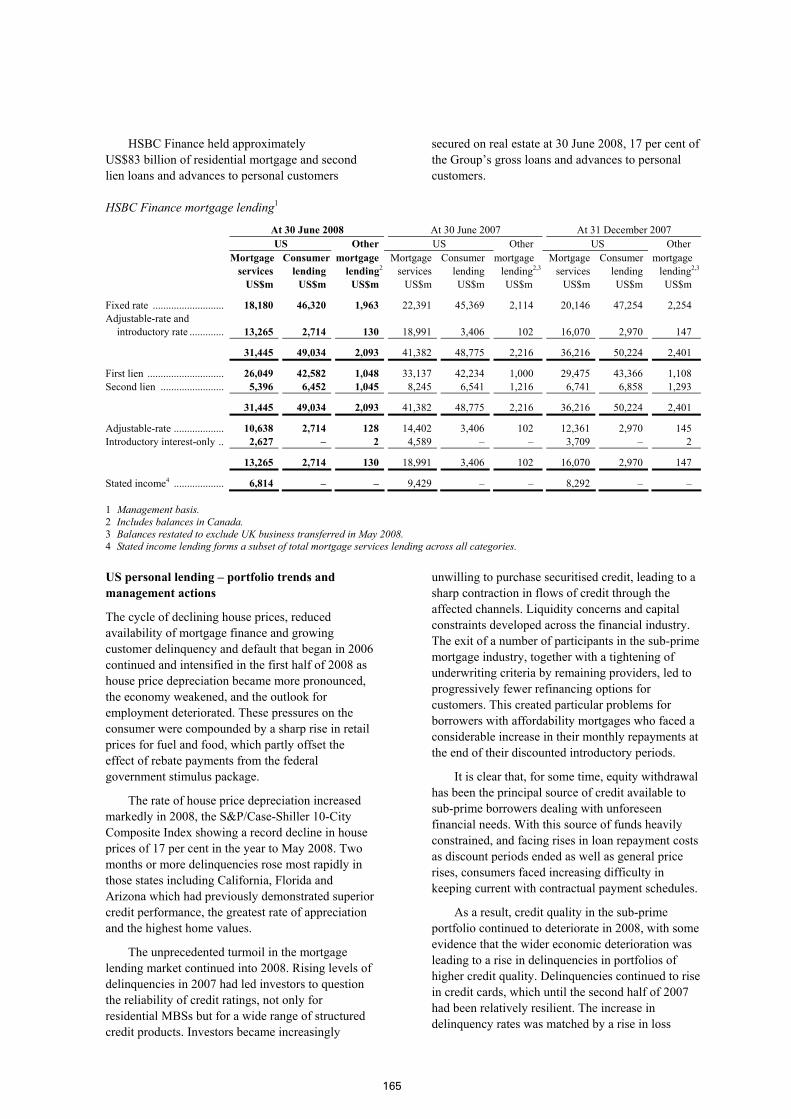
165
HSBC Finance held approximately US$83 billion of residential mortgage and second lien loans and advances to personal customers
secured on real estate at 30 June 2008, 17 per cent of the Group’s gross loans and advances to personal customers.
HSBC Finance mortgage lending1 At 30 June 2008 At 30 June 2007 At 31 December 2007 US Other US Other US Other Mortgage Consumer mortgage Mortgage Consumer mortgage Mortgage Consumer mortgage services lending lending2 services lending lending2,3 services lending lending2,3
US$m US$m US$m US$m US$m US$m US$m US$m US$m
Fixed rate ........................... 18,180 46,320 1,963 22,391 45,369 2,114 20,146 47,254 2,254 Adjustable-rate and
introductory rate ............. 13,265 2,714 130 18,991 3,406 102 16,070 2,970 147
31,445 49,034 2,093 41,382 48,775 2,216 36,216 50,224 2,401
First lien ............................. 26,049 42,582 1,048 33,137 42,234 1,000 29,475 43,366 1,108 Second lien ........................ 5,396 6,452 1,045 8,245 6,541 1,216 6,741 6,858 1,293
31,445 49,034 2,093 41,382 48,775 2,216 36,216 50,224 2,401
Adjustable-rate ................... 10,638 2,714 128 14,402 3,406 102 12,361 2,970 145 Introductory interest-only .. 2,627 – 2 4,589 – – 3,709 – 2
13,265 2,714 130 18,991 3,406 102 16,070 2,970 147
Stated income4 ................... 6,814 – – 9,429 – – 8,292 – –
1 Management basis. 2 Includes balances in Canada. 3 Balances restated to exclude UK business transferred in May 2008. 4 Stated income lending forms a subset of total mortgage services lending across all categories.
US personal lending – portfolio trends and management actions
The cycle of declining house prices, reduced availability of mortgage finance and growing customer delinquency and default that began in 2006 continued and intensified in the first half of 2008 as house price depreciation became more pronounced, the economy weakened, and the outlook for employment deteriorated. These pressures on the consumer were compounded by a sharp rise in retail prices for fuel and food, which partly offset the effect of rebate payments from the federal government stimulus package.
The rate of house price depreciation increased markedly in 2008, the S&P/Case-Shiller 10-City Composite Index showing a record decline in house prices of 17 per cent in the year to May 2008. Two months or more delinquencies rose most rapidly in those states including California, Florida and Arizona which had previously demonstrated superior credit performance, the greatest rate of appreciation and the highest home values.
The unprecedented turmoil in the mortgage lending market continued into 2008. Rising levels of delinquencies in 2007 had led investors to question the reliability of credit ratings, not only for residential MBSs but for a wide range of structured credit products. Investors became increasingly
unwilling to purchase securitised credit, leading to a sharp contraction in flows of credit through the affected channels. Liquidity concerns and capital constraints developed across the financial industry. The exit of a number of participants in the sub-prime mortgage industry, together with a tightening of underwriting criteria by remaining providers, led to progressively fewer refinancing options for customers. This created particular problems for borrowers with affordability mortgages who faced a considerable increase in their monthly repayments at the end of their discounted introductory periods.
It is clear that, for some time, equity withdrawal has been the principal source of credit available to sub-prime borrowers dealing with unforeseen financial needs. With this source of funds heavily constrained, and facing rises in loan repayment costs as discount periods ended as well as general price rises, consumers faced increasing difficulty in keeping current with contractual payment schedules.
As a result, credit quality in the sub-prime portfolio continued to deteriorate in 2008, with some evidence that the wider economic deterioration was leading to a rise in delinquencies in portfolios of higher credit quality. Delinquencies continued to rise in credit cards, which until the second half of 2007 had been relatively resilient. The increase in delinquency rates was matched by a rise in loss
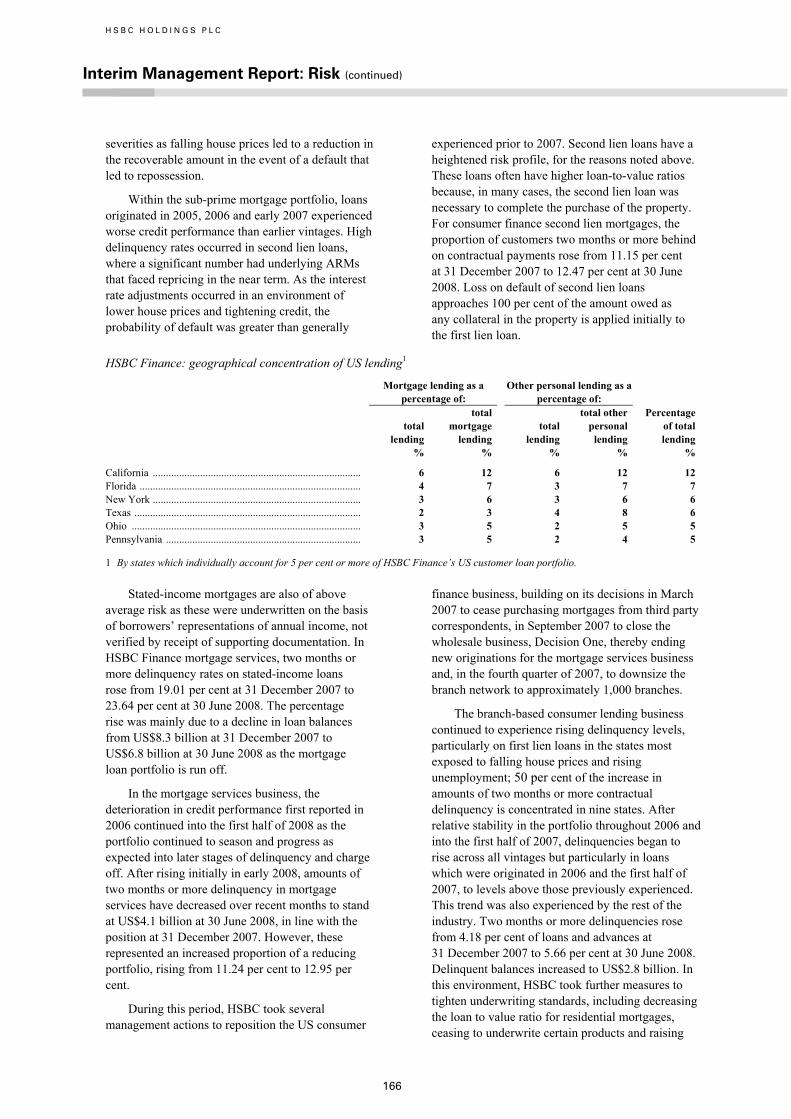
H S B C H O L D I N G S P L C
Interim Management Report: Risk (continued)
166
severities as falling house prices led to a reduction in the recoverable amount in the event of a default that led to repossession.
Within the sub-prime mortgage portfolio, loans originated in 2005, 2006 and early 2007 experienced worse credit performance than earlier vintages. High delinquency rates occurred in second lien loans, where a significant number had underlying ARMs that faced repricing in the near term. As the interest rate adjustments occurred in an environment of lower house prices and tightening credit, the probability of default was greater than generally
experienced prior to 2007. Second lien loans have a heightened risk profile, for the reasons noted above. These loans often have higher loan-to-value ratios because, in many cases, the second lien loan was necessary to complete the purchase of the property. For consumer finance second lien mortgages, the proportion of customers two months or more behind on contractual payments rose from 11.15 per cent at 31 December 2007 to 12.47 per cent at 30 June 2008. Loss on default of second lien loans approaches 100 per cent of the amount owed as any collateral in the property is applied initially to the first lien loan.
HSBC Finance: geographical concentration of US lending1
Mortgage lending as a percentage of:
Other personal lending as a percentage of:
total lending
total mortgage lending
total lending
total other personal lending
Percentage of total lending
% % % % %
California ............................................................................... 6 12 6 12 12 Florida .................................................................................... 4 7 3 7 7 New York ............................................................................... 3 6 3 6 6 Texas ...................................................................................... 2 3 4 8 6 Ohio ....................................................................................... 3 5 2 5 5 Pennsylvania .......................................................................... 3 5 2 4 5
1 By states which individually account for 5 per cent or more of HSBC Finance’s US customer loan portfolio.
Stated-income mortgages are also of above average risk as these were underwritten on the basis of borrowers’ representations of annual income, not verified by receipt of supporting documentation. In HSBC Finance mortgage services, two months or more delinquency rates on stated-income loans rose from 19.01 per cent at 31 December 2007 to 23.64 per cent at 30 June 2008. The percentage rise was mainly due to a decline in loan balances from US$8.3 billion at 31 December 2007 to US$6.8 billion at 30 June 2008 as the mortgage loan portfolio is run off.
In the mortgage services business, the deterioration in credit performance first reported in 2006 continued into the first half of 2008 as the portfolio continued to season and progress as expected into later stages of delinquency and charge off. After rising initially in early 2008, amounts of two months or more delinquency in mortgage services have decreased over recent months to stand at US$4.1 billion at 30 June 2008, in line with the position at 31 December 2007. However, these represented an increased proportion of a reducing portfolio, rising from 11.24 per cent to 12.95 per cent.
During this period, HSBC took several management actions to reposition the US consumer
finance business, building on its decisions in March 2007 to cease purchasing mortgages from third party correspondents, in September 2007 to close the wholesale business, Decision One, thereby ending new originations for the mortgage services business and, in the fourth quarter of 2007, to downsize the branch network to approximately 1,000 branches.
The branch-based consumer lending business continued to experience rising delinquency levels, particularly on first lien loans in the states most exposed to falling house prices and rising unemployment; 50 per cent of the increase in amounts of two months or more contractual delinquency is concentrated in nine states. After relative stability in the portfolio throughout 2006 and into the first half of 2007, delinquencies began to rise across all vintages but particularly in loans which were originated in 2006 and the first half of 2007, to levels above those previously experienced. This trend was also experienced by the rest of the industry. Two months or more delinquencies rose from 4.18 per cent of loans and advances at 31 December 2007 to 5.66 per cent at 30 June 2008. Delinquent balances increased to US$2.8 billion. In this environment, HSBC took further measures to tighten underwriting standards, including decreasing the loan to value ratio for residential mortgages, ceasing to underwrite certain products and raising
167
the credit requirements for some risk factors. As a consequence, originations fell to some 30 per cent of the levels experienced in the first half of 2007. As part of an ongoing branch optimisation programme, a further 100 branches were closed in the first half of 2008.
At the US retail bank, prime and second lien mortgages experienced a rise in delinquencies. Two months or more delinquencies in prime mortgages rose from 1.03 per cent at 31 December 2007 to 1.78 per cent of loans and advances at 30 June 2008, the increase partly reflecting the US$4 billion asset sale in the first half of 2008. Management took action to increase collateral requirements and tighten credit criteria.
The US retail bank also experienced an increase in delinquency in its US$2.4 billion portfolio of stated-income loans. Two months or more delinquencies rose from 3.66 per cent at 31 December 2007 to 5.79 per cent at 30 June 2008. In response, the US retail bank stopped originating these products through the wholesale channel, curtailed certain stated income products and tightened underwriting criteria.
In the US credit card portfolio, delinquencies of two months or more declined marginally from 5.68 per cent at 31 December 2007 to 5.57 per cent of balances at 30 June 2008. Improvements in collections and the effects of tax rebates and the federal stimulus tax payments credit were broadly offset by an increase in bankruptcy filings, rising unemployment rates and a weakening US economy, as discussed above. There was also the effect of change in product mix, as originations in the sub-prime and near-prime parts of the portfolio grew at faster rates than the overall portfolio.
Higher delinquencies were also experienced in unsecured lending excluding credit cards. In the consumer lending personal non-credit card portfolio, credit quality deteriorated in all vintages, particularly in those markets most exposed to the slowdown in house prices and economic activity.
In vehicle finance, two months or more delinquencies moved favourably from 3.68 per cent at 31 December 2007 to 3.48 per cent at 30 June 2008. HSBC continued to tighten underwriting criteria in the vehicle finance business in both the dealer and direct-to-consumer channels, and reposition the business towards originating through the direct channel, where loans are of higher credit quality. A number of dealer relationships were terminated in 2008, particularly in the Northeast, and certain products were discontinued.
HSBC has been proactive in approaching customers to provide financial assistance in restructuring their debts to avoid foreclosure. As a consequence, HSBC restructured and modified loans that it believed could be serviced on revised terms. In particular, customers with ARM loans approaching the first reset were contacted in order to assess their ability to make the higher payments and, where appropriate, to refinance or modify their loans. The duration of loan modification periods available was also expanded, with some modifications given for two and five years. HSBC increased its collections capacity and reorganised operations to increase efficiency. As a result, in the first half of 2008 HSBC modified more than 34,000 loans with an aggregate balance of more than US$5.1 billion, bringing the total modified since inception of the ARM re-set programme to some 44,000 loans, with an aggregate value of US$6.7 billion.
In the first half of 2008, approximately US$0.7 billion of ARM loans reached their first interest rate reset. In 2008 as a whole, approximately US$2.8 billion of ARMs will reach their first interest rate reset, of which US$1.4 billion relates to HSBC Bank USA and US$1.4 billion to HSBC Finance. Within the latter, US$0.8 billion is in mortgage services; the remainder in consumer lending. ARMs in the US retail bank are largely prime balances.
US personal lending – loan delinquency
Two months and over contractual delinquency ratios in the second quarter of 2008 increased compared with both the first quarter of the year and the fourth quarter of 2007. The overall delinquency ratio in the period was negatively affected by lower balances resulting from portfolio run-off, and lower origination volumes resulting from the risk mitigation efforts and changes to product offerings which began in the second half of 2007 and continued into 2008.
Delinquency ratios were also affected by the continued deterioration in the marketplace and broader economic conditions, portfolio seasoning and higher non-prime lending in some portfolios. Delinquencies in dollar terms increased modestly in the second quarter of 2008, tempered by improvements in domestic collections as a result of an extended seasonal benefit due to the federal stimulus rebate cheques issued during the second quarter of 2008, increased collection capacity and increases in the volume of loan restructures and modifications.

H S B C H O L D I N G S P L C
Interim Management Report: Risk (continued)
168
The table below sets out the trends in two months and over contractual delinquencies.
Two months and over contractual delinquency in Personal Financial Services in the US
Quarter ended 30 June
2008 31March 2008
31 December 2007
30 September 2007
30 June 2007
31 March 2007
31 December 2006
30 September 2006
US$m US$m US$m US$m US$m US$m US$m US$m
Residential mortgages ... 6,213 5,892 5,404 3,868 2,992 2,703 2,733 2,335 Second lien mortgage
lending ....................... 1,584 1,630 1,589 1,240 941 855 810 580 Vehicle finance .............. 445 370 488 451 384 302 415 421 Credit card ..................... 1,700 1,782 1,830 1,581 1,314 1,274 1,312 1,217 Private label ................... 590 591 598 536 434 429 471 444 Personal non-credit card 2,606 2,650 2,634 2,238 2,000 1,881 1,888 1,696
Total ............................... 13,138 12,915 12,543 9,914 8,065 7,444 7,629 6,693
%1 %1 %1 %1 %1 %1 %1 %1
Residential mortgages ... 6.90 6.09 5.47 3.83 2.92 2.54 2.54 2.19 Second lien mortgage
lending ....................... 9.83 9.71 9.02 6.81 5.02 4.35 3.97 2.79 Vehicle finance .............. 3.48 2.83 3.68 3.40 2.91 2.29 3.16 3.21 Credit card ..................... 5.57 5.81 5.68 5.09 4.32 4.43 4.48 4.46 Private label ................... 3.65 3.66 3.43 3.28 2.72 2.65 2.83 2.88 Personal non-credit card 14.00 13.71 13.16 10.88 9.69 9.33 9.05 8.23
Total ............................... 7.13 6.70 6.29 4.95 4.00 3.64 3.67 3.28
Two months and over mortgage contractual delinquency in mortgage services and consumer lending
Quarter ended 30 June
2008 31 March 2008
31 December 2007
30 September 2007
30 June 2007
31 March 2007
31 December 2006
30 September 2006
US$m US$m US$m US$m US$m US$m US$m US$m Mortgage services:
– first lien .................... 3,175 3,221 3,033 2,345 1,909 1,695 1,728 1,489 – second lien ................ 897 1,020 1,038 832 660 595 570 405
Total mortgage services.. 4,072 4,241 4,071 3,177 2,569 2,290 2,298 1,894
Consumer lending: – first lien .................... 2,194 1,954 1,622 1,259 907 832 820 677 – second lien ................ 583 530 478 346 236 220 200 143
Total consumer lending . 2,777 2,484 2,100 1,605 1,143 1,052 1,020 820
%1 %1 %1 %1 %1 %1 %1 %1
Mortgage services: – first lien .................... 12.19 11.56 10.29 7.46 5.76 4.53 4.39 3.68 – second lien ................ 16.62 16.85 15.40 11.16 7.87 6.40 5.60 3.61
Total mortgage services . 12.95 12.51 11.24 8.17 6.19 4.90 4.64 3.67
Consumer lending: – first lien .................... 5.15 4.52 3.74 2.92 2.15 2.03 2.08 1.85 – second lien ................ 9.04 7.96 6.97 5.03 3.60 3.34 3.08 2.45
Total consumer lending . 5.66 4.98 4.18 3.21 2.34 2.21 2.22 1.93
1 Expressed as a percentage of loans and advances in Personal Financial Services in the US.

169
Analysis of Group credit quality
The following tables set out the Group’s distribution of loans and advances by measures of credit quality, notably identifying and analysing loans and advances that were past due but not impaired.
These analyses demonstrate credit quality across the majority of the Group’s businesses that is broadly stable in terms of impairment compared with 31 December 2007. However, there is clear evidence of weakening economic fundamentals in many markets which, although not translating to impairment at 30 June 2008, is likely to lead to higher impaired loans in subsequent periods. The proportion of total loans and advances to customers that were neither past due nor impaired rose marginally, to 93 per cent. Within this picture, the deterioration in quality of US mortgage portfolios and the relative stability of the UK mortgage
portfolio are fully commented on in ‘Areas of special interest – credit risk’ on page 161. The credit quality of loans and advances to banks remained high.
Compared with 31 December 2007, there was no material change in the profile of the ageing analysis of past due loans and advances. A small increase in unimpaired loans and advances past due under 30 days was partly offset by a decline in those past due under 60 days. The coverage ratio of impairment allowances to impaired loans remained at a similar high level to that reached at 31 December 2007. There was a modest increase in total impaired loans, further details of which, with their related individual and collective impairment allowances, are provided below.
For details of impairment incurred on available-for-sale debt and equity securities, see ‘Accounting policies’ on page 115.
Distribution of loans and advances by credit quality
At 30 June 2008 At 30 June 2007 At 31 December 2007 Loans and
advances to customers
Loans and advances to banks
Loans and advances to customers
Loans and advances to banks
Loans and advances to customers
Loans and advances to banks
US$m US$m US$m US$m US$m US$m Loans and advances:
– neither past due nor impaired .............. 999,217 256,860 885,815 214,277 931,872 237,339 – past due but not impaired .................... 51,534 112 42,054 363 50,577 22 – impaired ............................................... 19,029 16 14,555 12 18,304 12
1,069,780 256,988 942,424 214,652 1,000,753 237,373
Loans and advances which were past due but not impaired
At 30 June 2008 At 30 June 2007 At 31 December 2007 Loans and
advances to customers1
Loans and advances to banks
Loans and advances to customers1
Loans and advances to banks
Loans and advances to customers1
Loans and advances to banks
US$m US$m US$m US$m US$m US$m
Past due up to 29 days ................................. 35,534 112 29,243 363 33,909 22 Past due 30 – 59 days .................................. 9,496 – 7,766 – 10,546 – Past due 60 – 89 days .................................. 3,934 – 3,014 – 3,992 –
48,964 112 40,023 363 48,447 22 Past due 90 – 179 days2 ............................... 2,407 – 1,733 – 1,767 – Past due over 180 days2 ............................... 163 – 298 – 363 –
51,534 112 42,054 363 50,577 22
1 The majority of the loans and advances to customers that are operating within revised terms following restructuring, for details of which see ‘Renegotiated loans’ on page 172, are excluded from this table.
2 Loans and advances past due 90 days or more, but unimpaired, include such transactions as loans fully secured by cash collateral, residential mortgages where the value of collateral is sufficient to repay both principal and all interest for at least one year, short-term trade facilities technically overdue but where there is no concern over the creditworthiness of the counterparty and certain accruing credit card receivable balances that have been appropriately provided for.
This ageing analysis includes loans and advances on which collective impairment allowances have been assessed, though at their early stage of arrears there is no identifiable impairment as such.
Certain loans and advances are individually assessed for impairment and, if found to be impaired, have impairment allowances assigned to them on an individual basis. It is not practicable to individually identify impaired loans and advances within

H S B C H O L D I N G S P L C
Interim Management Report: Risk (continued)
170
portfolios of homogeneous loans which are assessed on a collective basis for impairment. In practice, such loans and advances are not individually identified as impaired until the time each impaired loan is written off. It is therefore necessary to estimate the carrying value of impaired loans and advances within these portfolios.
The approach adopted by HSBC to estimating the carrying value of impaired loans and advances within portfolios of homogeneous loans that are collectively assessed for impairment is to classify these loans and advances as impaired when the balances are 90 days or more past due, except for US vehicle loans which are classified as impaired when 60 days or more past due, and except for certain other balances on which the level of recoverability is judged to be adequate. All other collectively assessed loans and advances, including those which are less than 90 days past due (less than 60 days for US vehicle loans), are classified as not impaired and
reported either as past due but not impaired or, if they are up to date, neither past due nor impaired.
Collective impairment allowances are recognised in relation to losses that are likely to have been incurred at each reporting date on loans collectively assessed for impairment which are classified as unimpaired, typically, these would represent a small percentage of the unimpaired loans and advances.
Loans and advances to customers and impairment allowances by geographical region
The table below presents an analysis of the impairment allowances recognised for impaired loans and advances that are either individually assessed or collectively assessed, and an analysis of collective impairment allowances on loans and advances classified as not impaired.
Loans and advances to customers and impairment allowances by geographical region
Individually assessed loans and advances to customers
Collectively assessed loans and advances to customers1 Total
Individual impairment allowances
Gross loans and advances
Collective impairment allowances
Gross loans and advances
Total impairment allowances
Gross loans and advances
US$m US$m % US$m US$m % US$m US$m % At 30 June 2008 Impaired loans and advances2 .................... 2,404 6,061 39.7 10,850 12,968 83.7 13,254 19,029 69.7
Europe ..................... 1,567 4,113 38.1 1,334 1,776 75.1 2,901 5,889 49.3 Hong Kong .............. 133 380 35.0 12 58 20.7 145 438 33.1 Rest of Asia-Pacific .. 340 636 53.5 212 481 44.1 552 1,117 49.4 North America ........ 160 486 32.9 7,977 8,426 94.7 8,137 8,912 91.3 Latin America ......... 204 446 45.7 1,315 2,227 59.0 1,519 2,673 56.8
Collectively assessed loans and advances not impaired3 ...........
7,326 1,050,751 0.7 7,326 1,050,751 0.7 Europe ..................... 838 506,810 0.2 838 506,810 0.2 Hong Kong .............. 228 99,676 0.2 228 99,676 0.2 Rest of Asia-Pacific .. 413 113,605 0.4 413 113,605 0.4 North America ........ 5,050 276,765 1.8 5,050 276,765 1.8 Latin America ......... 797 53,895 1.5 797 53,895 1.5
2,404 6,061 39.7 18,176 1,063,719 1.7 20,580 1,069,780 1.9

171
Individually assessed loans and advances to customers
Collectively assessed loans and advances to customers1 Total
Individual impairment allowances
Gross loans and advances
Collective impairment allowances
Gross loans and advances
Total impairment allowances
Gross loans and advances
US$m US$m % US$m US$m % US$m US$m %
At 30 June 2007 Impaired loans and advances2 .................... 2,614 6,052 43.2 6,913 8,503 81.3 9,527 14,555 65.5
Europe ..................... 1,771 4,146 42.7 1,112 1,705 65.2 2,883 5,849 49.3 Hong Kong .............. 118 414 28.5 10 53 18.9 128 467 27.4 Rest of Asia-Pacific .. 392 711 55.1 215 498 43.2 607 1,209 50.2 North America ........ 115 485 23.7 4,485 4,740 94.6 4,600 5,226 88.0 Latin America ......... 218 296 73.6 1,091 1,507 72.4 1,309 1,804 72.6
Collectively assessed loans and advances not impaired3 ...........
4,796 927,869 0.5 4,796 927,869 0.5 Europe ..................... 760 425,902 0.2 760 425,902 0.2 Hong Kong .............. 207 89,786 0.2 207 89,786 0.2 Rest of Asia-Pacific .. 333 87,905 0.4 333 87,905 0.4 North America ........ 3,114 283,783 1.1 3,114 283,783 1.1 Latin America ......... 382 40,493 0.9 382 40,493 0.9
2,614 6,052 43.2 11,709 936,372 1.3 14,323 942,424 1.5 At 31 December 2007 Impaired loans and advances2 .................... 2,699 6,477 41.7 9,588 11,827 81.1 12,287 18,304 67.1
Europe ..................... 1,846 4,558 40.5 1,203 1,696 70.9 3,049 6,254 48.8 Hong Kong .............. 132 378 34.9 12 55 21.8 144 433 33.3 Rest of Asia-Pacific .. 349 678 51.5 203 410 49.5 552 1,088 50.7 North America ........ 119 421 28.3 7,057 7,963 88.6 7,176 8,384 85.6 Latin America ......... 253 442 57.2 1,113 1,703 65.4 1,366 2,145 63.7
Collectively assessed loans and advances not impaired3 ...........
6,918 982,449 0.7 6,918 982,449 0.7 Europe ..................... 882 449,952 0.2 882 449,952 0.2 Hong Kong .............. 232 89,581 0.3 232 89,581 0.3 Rest of Asia-Pacific .. 374 101,690 0.4 374 101,690 0.4 North America ........ 4,804 293,456 1.6 4,804 293,456 1.6 Latin America ......... 626 47,770 1.3 626 47,770 1.3
2,699 6,477 41.7 16,506 994,276 1.7 19,205 1,000,753 1.9
1 Collectively assessed loans and advances comprise homogeneous groups of loans that are not considered individually significant, and loans subject to individual assessment where no impairment has been identified on an individual basis, but on which a collective impairment allowance has been calculated to reflect losses which have been incurred but not yet identified.
2 Impaired loans and advances are those identified as impaired on an individual basis and collectively assessed loans classified as impaired based on number of days past due.
3 Collectively assessed loans and advances not impaired are predominantly those under 90 days past due (less than 60 days for US vehicle loans).
Total impaired loans to customers were US$19 billion at 30 June 2008, an increase of 4 per cent since the end of 2007. At constant currency, the increase was 2 per cent. Impaired loans were 2 per cent of gross customer loans and advances, broadly in line with 31 December 2007.
The commentary that follows compares balances at 30 June 2008 with those at 31 December 2007 at constant exchange rates.
In Europe, impaired loans at US$5.9 billion were 8 per cent less than at the end of 2007, mainly
due to the reclassification of the French regional banks as held for sale. Despite house price depreciation, credit quality in the UK remained resilient, helping to offset an increase in impaired loans in Turkey caused by strong balance sheet growth coupled with increased delinquency rates.
In Hong Kong, despite an increase in balances, impaired loans were flat at US$438 million reflecting favourable credit conditions due to the strong local economy.
In Rest of Asia-Pacific, impaired loans
H S B C H O L D I N G S P L C
Interim Management Report: Risk (continued)
172
increased slightly as a rise in impaired loans in India and Australia, were partly offset by a decline in Taiwan, where credit quality improved in credit cards.
In North America, impaired loan balances rose by 6 per cent to US$8.9 billion from 31 December 2007. Credit performance in the consumer finance business continued to deteriorate. Loan portfolios seasoned and progressed as expected into later stages of delinquency and charge-off as the economy weakened, house prices continued to fall and unemployment rose. The broader decline in the economy spread to the US retail bank which experienced a rise in impairment on second lien mortgages. Delinquency ratios deteriorated in most categories, partly due to lower balances because of portfolio run-off and lower origination volumes as risk appetite was restricted. Delinquency balances benefited from the federal stimulus tax rebates made in the second quarter of 2008, enhanced collection efforts and increases in restructuring and modification of loans to assist customers to avoid foreclosures. A full discussion of these developments and their effect on credit quality is provided in ‘Areas of special interest – credit risk’ on page 161 and under ‘Renegotiated loans’ below.
In Latin America, impaired loans increased by 15 per cent to US$2.7 billion, primarily in Brazil, where there was strong growth in balances and credit quality deteriorated in vehicle finance and store loans.
Renegotiated loans
Restructuring activity is designed to manage customer relationships, maximise collection opportunities and, if possible, help customers avoid
foreclosure or repossession. Such activities include extended payment arrangements, approved external debt management plans, deferring foreclosure, modification, loan rewrites and/or deferral of payments pending a change in circumstances. Following restructuring, an overdue consumer account is normally reset from delinquent to current status. Restructuring policies and practices are based on indicators or criteria which, in the judgement of local management, indicate that repayment will probably continue. These policies are required to be kept under continual review and their application varies according to the nature of the market, the product, and the availability of empirically based data. Criteria vary between products, but typically include: receipt of one or more qualifying payments within a certain period, a minimum lapse of time from origination before restructuring may occur, and restrictions on the number and/or frequency of successive restructurings. When empirical evidence indicates an increased propensity to default on restructured accounts, the use of roll rate methodology ensures this factor is taken into account when calculating impairment allowances.
Renegotiated loans that would otherwise be past due or impaired totalled US$31 billion at 30 June 2008 (US$28 billion at 31 December 2007). Restructuring is most commonly applied to consumer finance portfolios. The largest concentration was in the US and amounted to US$27 billion (31 December 2007: US$24 billion) or 87 per cent (31 December 2007: 86 per cent) of the Group’s total renegotiated loans at 30 June 2008. The increase was due to a significant deterioration in credit quality in the US. Most restructurings in the US related to loans secured on real estate.

173
Impairment allowances and charges
Movement in allowance accounts for total loans and advances
Individually assessed
Collectively assessed Total
US$m US$m US$m
At 1 January 2008 ............................................................................................ 2,706 16,506 19,212 Amounts written off ........................................................................................ (370) (8,436) (8,806)Recoveries of loans and advances written off in previous years .................... 58 421 479 Charge to income statement ............................................................................ 332 9,625 9,957 Exchange and other movements ...................................................................... (315) 60 (255)
At 30 June 2008 ............................................................................................... 2,411 18,176 20,587 At 1 January 2007 ............................................................................................ 2,572 11,013 13,585 Amounts written off ........................................................................................ (390) (5,673) (6,063)Recoveries of loans and advances written off in previous years .................... 57 287 344 Charge to income statement ............................................................................ 385 5,943 6,328 Exchange and other movements ...................................................................... (3) 139 136
At 30 June 2007 ............................................................................................... 2,621 11,709 14,330 At 1 July 2007 .................................................................................................. 2,621 11,709 14,330 Amounts written off ........................................................................................ (507) (6,274) (6,781)Recoveries of loans and advances written off in previous years .................... 72 589 661 Charge to income statement ............................................................................ 411 10,438 10,849 Exchange and other movements ...................................................................... 109 44 153
At 31 December 2007 ...................................................................................... 2,706 16,506 19,212
Net loan impairment charge to the income statement by geographical region
Europe US$m
Hong Kong US$m
Rest of Asia- Pacific US$m
North America US$m
Latin America US$m
Total US$m
Half-year to 30 June 2008 Individually assessed impairment allowances
New allowances .............................................. 476 30 62 160 22 750 Releases of allowances no longer required .... (253) (14) (48) (31) (14) (360)Recoveries of amounts previously written
off ............................................................... (16) (6) (15) (17) (4) (58)
207 10 (1) 112 4 332
Collectively assessed impairment allowances New allowances net of allowance releases ..... 1,195 81 423 7,017 1,330 10,046 Recoveries of amounts previously written
off ............................................................... (154) (14) (57) (32) (164) (421)
1,041 67 366 6,985 1,166 9,625
Total charge for impairment losses .................... 1,248 77 365 7,097 1,170 9,957 Banks .............................................................. – – – – – –Customers ....................................................... 1,248 77 365 7,097 1,170 9,957
% % % % % % Charge for impairment losses as a percentage
of closing gross loans and advances (annualised) .................................................... 0.41 0.09 0.44 4.67 3.19 1.51
US$m US$m US$m US$m US$m US$m At 30 June 2008 Impaired loans .................................................... 5,905 438 1,117 8,912 2,673 19,045 Impairment allowances ....................................... 3,746 373 965 13,187 2,316 20,587
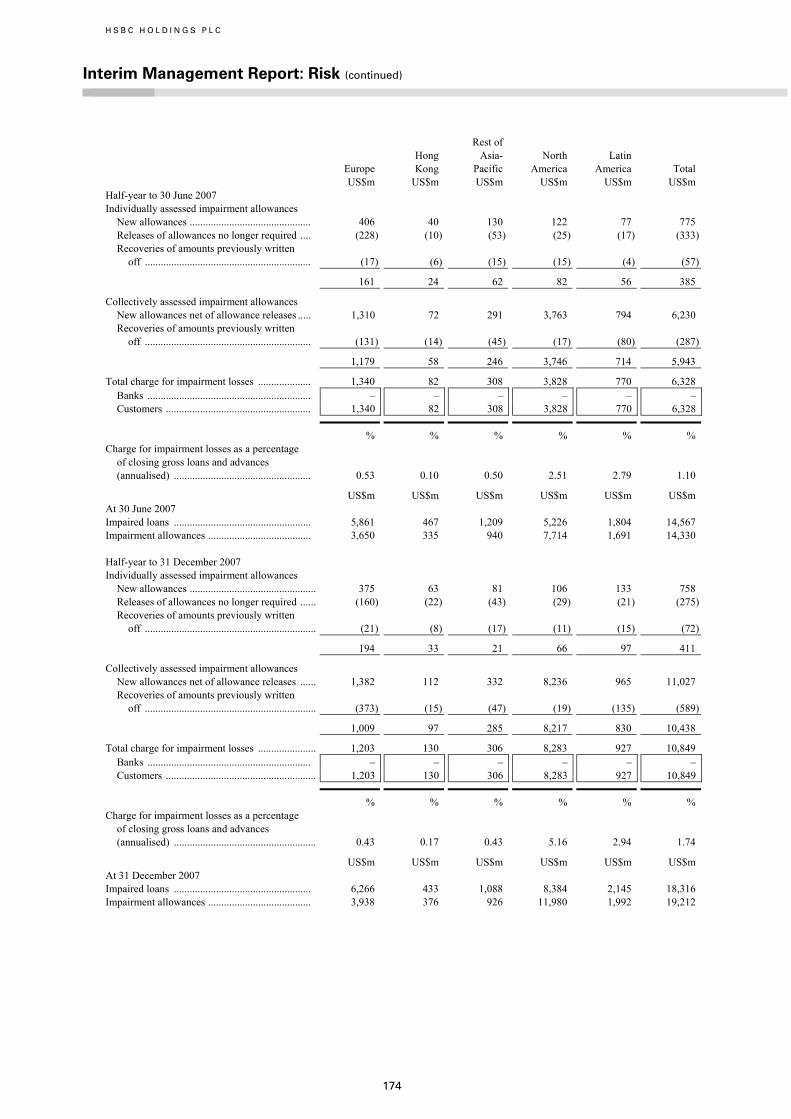
H S B C H O L D I N G S P L C
Interim Management Report: Risk (continued)
174
Europe US$m
Hong Kong US$m
Rest of Asia- Pacific US$m
North America US$m
Latin America US$m
Total US$m
Half-year to 30 June 2007 Individually assessed impairment allowances
New allowances .............................................. 406 40 130 122 77 775 Releases of allowances no longer required .... (228) (10) (53) (25) (17) (333)Recoveries of amounts previously written
off ............................................................... (17) (6) (15) (15) (4) (57)
161 24 62 82 56 385
Collectively assessed impairment allowances New allowances net of allowance releases ..... 1,310 72 291 3,763 794 6,230 Recoveries of amounts previously written
off ............................................................... (131) (14) (45) (17) (80) (287)
1,179 58 246 3,746 714 5,943
Total charge for impairment losses .................... 1,340 82 308 3,828 770 6,328 Banks .............................................................. – – – – – – Customers ....................................................... 1,340 82 308 3,828 770 6,328
% % % % % % Charge for impairment losses as a percentage
of closing gross loans and advances (annualised) .................................................... 0.53 0.10 0.50 2.51 2.79 1.10
US$m US$m US$m US$m US$m US$m At 30 June 2007 Impaired loans .................................................... 5,861 467 1,209 5,226 1,804 14,567 Impairment allowances ....................................... 3,650 335 940 7,714 1,691 14,330 Half-year to 31 December 2007 Individually assessed impairment allowances
New allowances ................................................ 375 63 81 106 133 758 Releases of allowances no longer required ...... (160) (22) (43) (29) (21) (275)Recoveries of amounts previously written
off ................................................................. (21) (8) (17) (11) (15) (72)
194 33 21 66 97 411
Collectively assessed impairment allowances New allowances net of allowance releases ...... 1,382 112 332 8,236 965 11,027 Recoveries of amounts previously written
off ................................................................. (373) (15) (47) (19) (135) (589)
1,009 97 285 8,217 830 10,438
Total charge for impairment losses ...................... 1,203 130 306 8,283 927 10,849 Banks .............................................................. – – – – – – Customers ......................................................... 1,203 130 306 8,283 927 10,849
% % % % % % Charge for impairment losses as a percentage
of closing gross loans and advances (annualised) ...................................................... 0.43 0.17 0.43 5.16 2.94 1.74
US$m US$m US$m US$m US$m US$m At 31 December 2007 Impaired loans .................................................... 6,266 433 1,088 8,384 2,145 18,316 Impairment allowances ....................................... 3,938 376 926 11,980 1,992 19,212
175
Impairment allowances as a percentage of loans and advances to customers
At 30 June 2008
At 30 June 2007
At 31 December 2007
% % % Total impairment allowances to gross lending1 Individually assessed impairment allowances ................................................ 0.24 0.29 0.28 Collectively assessed impairment allowances ................................................ 1.80 1.30 1.73
2.04 1.59 2.01
1 Net of reverse repo transactions, settlement accounts and stock borrowings.
Loan impairment charges increased to US$10.1 billion in the first half of 2008, a rise of 58 per cent compared with the first half of 2007. The commentary that follows is on a constant currency basis.
New allowances for loan impairment charges rose by 51 per cent in the first half of 2008 compared with the first half of 2007, to US$10.8 billion. Releases and recoveries of allowances rose by 16 per cent to US$839 million.
In Europe, new loan impairment charges were US$1.7 billion, a decline of 4 per cent compared with the first half of 2007. Credit charges in Europe remained stable despite emerging economic and housing market weakness, particularly in the UK. In the UK retail bank, new loan impairment charges were in line with the first half of 2007 as lower new charges following the sale of a non-core portion of the cards portfolio in October 2007 were offset by the impact of balance growth in commercial lending. In the UK consumer finance business, new loan impairment charges fell following a methodology change which resulted in a one-off increase in new charges in the first half of 2007 and reduced balances. Elsewhere in Europe, new loan impairment charges rose due to growth in personal and credit card lending and higher delinquency rates in Turkey as some consumers encountered difficulties repaying their existing debts in the current economic climate. In France, new loan impairment charges rose reflecting a reduction in limits for recognising impairment on unauthorised overdrafts at the end of 2007 in accordance with new guidelines issued by the Commission Bancaire.
Releases and recoveries in Europe were US$423 million, an increase of 7 per cent, as the non-recurrence of higher recoveries in Global Banking and Markets in the UK in the first half of 2007 was more than offset by recoveries in Personal Financial Services and Commercial Banking in the UK retail bank.
In Hong Kong, new loan impairment charges were US$111 million, a decline of 2 per cent from
the first half of 2007, reflecting the strong economy and rising asset prices.
Releases and recoveries in Hong Kong rose by 13 per cent from the first half of 2007 to US$34 million.
In Rest of Asia-Pacific, new loan impairment charges rose by 10 per cent to US$485 million. Balances grew strongly, particularly in lending to corporate and commercial clients and banks, reflecting buoyant economic conditions in the region. New loan impairment charges in India rose as a result of a more challenging credit environment for personal customers in which debt repayment was adversely affected by high inflation and interest rates, as well as balance sheet growth in cards, consumer finance, and personal loans. In the Middle East, increased delinquencies in the credit cards portfolio reflected balance growth, resulting in higher new loan impairment charges. This was partly offset in Taiwan, where new loan impairment charges fell due to the continued recovery from the 2006 credit crisis that had previously resulted in substantial new charges following regulatory intervention. In Thailand, new loan impairment charges also fell as a result of managing out of higher risk commercial banking relationships, as efforts were made to reduce risk in the portfolio.
Releases and recoveries in Rest of Asia-Pacific were broadly in line with the first half of 2007 at US$120 million.
New loan impairment charges in North America rose by 85 per cent to US$7.2 billion, notwithstanding a decline in balances due to portfolio run-off and the effect of tighter credit underwriting standards and the continuing effect of management actions taken in 2007 to curtail new originations. The significant deterioration in US credit quality against the prior year period was driven by rising unemployment rates, accelerating house price declines and increased bankruptcy filings. The ability of many US consumers to refinance debt was constrained as a result of reductions in housing equity and the tightening of

H S B C H O L D I N G S P L C
Interim Management Report: Risk (continued)
176
underwriting criteria by most lenders. Combined with a general weakening of the economy and portfolio run-off, these factors resulted in higher delinquency rates across the portfolio. Delinquency rates rose in the mortgage services and consumer lending businesses because of the problems discussed above. Asset quality declined in certain portfolios within the US retail bank, particularly within the Home Equity Line of Credit and Home Equity Loan portfolios of the second lien lending book, which resulted in higher new loan impairment charges. The prime residential mortgage portfolio also showed some increased delinquency but impairment remained low. New loan impairment charges rose in the credit cards business following increased delinquency rates as a result of the deterioration in the US economy, higher levels of non-prime lending, portfolio seasoning and growth in bankruptcy filings. In the personal non-credit card business, new loan impairment charges rose as delinquency rates increased, driven by rising unemployment and economic weakness.
Releases and recoveries in North America rose by 38 per cent from the first half of 2007 to US$80 million, driven by higher releases in the US in the first half of 2008.
In Latin America, new loan impairment charges rose by 37 per cent to US$1.4 billion. Mexico was the main driver of the increase, with balance growth and higher delinquency rates in its credit card and personal loan portfolios as recent strong growth seasoned and credit experience in the market deteriorated. The increase in new loan impairment charges is seen as a cost of building strong market share in an area where HSBC was previously under-represented. New loan impairment charges in Brazil also rose, driven by balance growth and a deterioration in credit quality in vehicle finance and store loans.
Releases and recoveries in Latin America rose by 54 per cent to US$182 million due to higher releases in Brazil as a result of the sale of an impaired loan portfolio in Personal Financial Services in March 2008.
Charge for impairment losses as a percentage of average gross loans and advances to customers
Europe Hong Kong
Rest of Asia- Pacific
North America
Latin America Total
% % % % % % Half-year to 30 June 2008 New allowances net of allowance releases .......... 0.66 0.20 0.80 4.89 5.07 2.14 Recoveries ............................................................ (0.08) (0.04) (0.14) (0.04) (0.64) (0.10)
Total charge for impairment losses ...................... 0.58 0.16 0.66 4.85 4.43 2.04
Amount written off net of recoveries ................... 0.52 0.16 0.56 3.98 3.74 1.71 Half-year to 30 June 2007 New allowances net of allowance releases .......... 0.89 0.24 0.89 2.74 4.41 1.61 Recoveries.............................................................. (0.08) (0.04) (0.14) (0.02) (0.42) (0.08)
Total charge for impairment losses ...................... 0.81 0.20 0.75 2.72 3.99 1.53
Amount written off net of recoveries ................... 0.83 0.24 0.60 2.40 3.07 1.39 Half-year to 31 December 2007 New allowances net of allowance releases .......... 0.89 0.34 0.83 5.69 5.03 2.64 Recoveries ............................................................ (0.22) (0.04) (0.14) (0.02) (0.71) (0.16)
Total charge for impairment losses ...................... 0.67 0.30 0.69 5.67 4.32 2.48
Amount written off net of recoveries ................... 0.56 0.24 0.77 2.74 3.07 1.39
177
Risk elements in the loan portfolio
The disclosure of credit risk elements under the following headings reflects US accounting practice and classifications:
• loans accounted for on a non-accrual basis;
• accruing loans contractually past due 90 days or more as to interest or principal; and
• troubled debt restructurings not included in the above.
Troubled debt restructurings
The SEC requires separate disclosure of any loans whose terms have been modified, because of problems with the borrower, to grant concessions other than are warranted by market conditions. These are classified as ‘troubled debt restructurings’ and are distinct from the normal restructuring activities in personal loan portfolios described in ‘Renegotiated loans’ on page 172. Classification as a troubled debt restructuring may be discontinued after the first year if the debt performs in accordance with the new terms.
Troubled debt restructurings increased by 29 per cent in the first half of 2008, as more long-term modifications were offered to customers
experiencing payment difficulties, particularly in the real estate secured portfolios in the US.
Unimpaired loans past due 90 days or more
Unimpaired loans contractually past due 90 days or more increased by 21 per cent. The rise was mainly due to the US consumer finance business, where credit quality deteriorated.
Impaired loans
In accordance with IFRSs, HSBC recognises interest income on assets after they have been written down as a result of an impairment loss. In the following tables, HSBC represents information on its impaired loans and advances which are designated in accordance with the policy described above.
Potential problem loans
Credit risk elements also cover potential problem loans. These are loans where information on possible credit problems among borrowers causes management to seriously doubt their ability to comply with the loan repayment terms. There are no potential problem loans other than those identified in the table of risk elements set out below, and as discussed in ‘Areas of special interest – credit risk’ above, including ARMs and stated-income products.

H S B C H O L D I N G S P L C
Interim Management Report: Risk (continued)
178
Analysis of risk elements in the loan portfolio by geographical region
At30 June
2008 US$m
At 30 June
2007 US$m
At 31 December 2007 US$m
Impaired loans Europe .............................................................................................................. 5,905 5,861 6,266 Hong Kong ...................................................................................................... 438 467 433 Rest of Asia-Pacific ......................................................................................... 1,117 1,209 1,088 North America ................................................................................................. 8,912 5,226 8,384 Latin America .................................................................................................. 2,673 1,804 2,145
19,045 14,567 18,316
Troubled debt restructurings Europe .............................................................................................................. 602 601 648 Hong Kong ...................................................................................................... 125 162 146 Rest of Asia-Pacific ......................................................................................... 35 47 34 North America ................................................................................................. 4,456 2,232 3,322 Latin America .................................................................................................. 1,212 796 848
6,430 3,838 4,998
Unimpaired loans contractually past due 90 days or more as to principal or interest
Europe .............................................................................................................. 345 193 202 Hong Kong ...................................................................................................... 38 58 49 Rest of Asia-Pacific ......................................................................................... 240 135 156 North America ................................................................................................. 1,722 1,327 1,302 Latin America .................................................................................................. 225 318 421
2,570 2,031 2,130
Trading loans classified as impaired North America ................................................................................................. 897 130 675
Risk elements on loans Europe .............................................................................................................. 6,852 6,655 7,116 Hong Kong ...................................................................................................... 601 687 628 Rest of Asia-Pacific ......................................................................................... 1,392 1,391 1,278 North America ................................................................................................. 15,987 8,915 13,683 Latin America .................................................................................................. 4,110 2,918 3,414
28,942 20,566 26,119
Assets held for resale Europe .............................................................................................................. 82 48 59 Hong Kong ...................................................................................................... 23 28 29 Rest of Asia-Pacific ......................................................................................... 18 16 7 North America ................................................................................................. 1,262 1,106 1,172 Latin America .................................................................................................. 120 93 101
1,505 1,291 1,368
Total risk elements Europe .............................................................................................................. 6,934 6,703 7,175 Hong Kong ...................................................................................................... 624 715 657 Rest of Asia-Pacific ......................................................................................... 1,410 1,407 1,285 North America ................................................................................................. 17,249 10,021 14,855 Latin America .................................................................................................. 4,230 3,011 3,515
30,447 21,857 27,487 % % %
Loan impairment allowances as a percentage of risk elements on loans, excluding those trading loans classified as impaired .................................. 73.4
70.1
75.5

179
Liquidity and funding
The liquidity and funding risk framework is adapted in response to changes in the mix of business that HSBC undertakes, and to changes in the nature of the markets in which HSBC operates. There have been no material changes to HSBC’s objectives, policies or procedures for the management of liquidity and funding risks as described in the Annual Report and Accounts 2007, the key features of which are repeated below. HSBC has continuously monitored the impact of recent market events on the Group’s liquidity positions and introduced more conservative assumptions where justified. The impact of these recent market events is discussed more fully later in this section. The liquidity and funding risk framework will continue to adapt, particularly as the Group assimilates further knowledge from the recent dislocations in the market.
The management of liquidity and funding is primarily carried out locally in the operating entities of HSBC in accordance with practices and limits set by the Risk Management Meeting (‘RMM’). These limits vary by entity to take into account the depth and liquidity of the market in which the entity operates. It is HSBC’s general policy that each banking entity should be self-sufficient with regards to funding its own operations.
Current accounts and savings deposits payable on demand or at short notice form a significant part of HSBC’s funding. HSBC places considerable importance on maintaining the stability of these deposits. Stability depends upon preserving depositor confidence in HSBC’s capital strength and liquidity, and on competitive and transparent deposit-pricing strategies.
HSBC also accesses professional markets in order to provide funding for non-banking subsidiaries that do not accept deposits, to maintain a presence in local money markets and to optimise the funding of asset maturities not naturally matched by core deposit funding. In aggregate, HSBC’s banking entities are liquidity providers to the interbank market, placing significantly more funds with other banks than they borrow.
The main operating subsidiary that does not accept deposits is HSBC Finance, which funds itself principally by taking term funding in the professional markets and by securitising assets. At 30 June 2008, US$132 billion (30 June 2007: US$144 billion; 31 December 2007: US$142 billion) of HSBC Finance’s liabilities were drawn from professional markets, utilising a range of products,
maturities and currencies to avoid undue reliance on any particular funding source.
Advances to deposits ratio
HSBC emphasises the importance of current accounts and savings accounts as a source of funds to finance lending to customers, and discourages reliance on short-term professional funding. To achieve this goal, limits are placed on Group banking entities which restrict their ability to grow loans to customers without corresponding growth in core current accounts and savings accounts. This measure is referred to as the ‘advances to deposits’ ratio.
Advances to deposits ratio limits are set by the RMM and monitored by Group Finance. The ratio compares loans and advances to customers as a percentage of core customer current and savings accounts together with term funding with a remaining term to maturity in excess of one year. Loans to customers which are part of reverse repurchase arrangements, and where the Group receives securities which are deemed to be liquid, are excluded from the advances to deposits ratio. Current accounts and savings accounts from customers deemed to be ‘professional’ are excluded. The definition of a professional customer takes account of the size of the customer’s total deposit balances by applying a tiering classification. Generally, any customer with total funds deposited in excess of US$2 million is regarded as professional. Due to the distinction between core and professional depositors, the Group’s measure of advances to deposits will be more restrictive than that which could be inferred from the published financial statements.
The three major Group banking entities shown separately in the table below represented 70 per cent of the Group’s total core deposits at 30 June 2008 (30 June 2007: 72 per cent; 31 December 2007: 71 per cent). The table demonstrates that loans to customers in the Group’s principal banking entities are broadly financed by reliable and stable sources of funding.
HSBC would meet any unexpected net cash outflows by selling securities and accessing additional funding sources such as interbank or collateralised lending markets. In addition to the advances to deposits ratio, the Group uses a range of other measures for managing liquidity risk. These other measures include the ratio of net liquid assets to customer liabilities and projected cash flow scenario analyses.

H S B C H O L D I N G S P L C
Interim Management Report: Risk (continued)
180
The advances to deposits ratios of the Group’s principal banking entities
Half-year to 30 June
2008 30 June 2007
31 December 2007
% % % HSBC Bank
(UK operations)
Period-end .......... 100.9 96.6 97.5 Maximum ........... 101.0 101.7 97.5 Minimum ............ 97.5 95.5 92.6 Average .............. 99.4 98.6 95.5
The Hongkong and Shanghai Banking Corporation
Period-end .......... 82.9 77.4 76.7 Maximum ........... 82.9 78.2 82.2 Minimum ............ 76.7 72.4 73.5 Average .............. 80.5 75.3 77.6
HSBC Bank USA Period-end .......... 110.3 112.2 114.9 Maximum ........... 115.9 116.8 116.0 Minimum ............ 110.3 107.0 109.3 Average .............. 113.1 111.5 113.7
Total of Group’s other principal banking entities
Period-end .......... 91.1 88.2 88.4 Maximum ........... 92.3 88.2 89.3 Minimum ............ 86.4 86.2 87.3 Average .............. 89.4 87.1 88.4
Ratio of net liquid assets to customer
liabilities
Net liquid assets are liquid assets less all funds maturing in the next 30 days from wholesale market sources and from customers who are deemed to be professional. The Group defines liquid assets for the purposes of the liquidity ratio as cash balances, short-term interbank deposits and highly rated debt securities available for immediate sale and for which a deep and liquid market exists. As noted above, the definition of a professional customer takes account of the size of the customer’s total deposits. Contingent liquidity risk associated with committed loan facilities is not reflected in the ratios. The Group’s framework for monitoring this risk is outlined below.
Limits for the ratio of net liquid assets to customer liabilities are set for each bank operating entity. As HSBC Finance does not accept customer deposits, it is not appropriate to manage their liquidity using the standard liquidity ratios. The liquidity and funding risk framework of HSBC Finance is discussed below. Ratios of net liquid assets to customer liabilities are provided in the following table. For additional information, the US dollar equivalents of net liquid assets are also provided.
Net liquid assets and the ratio of net liquid assets to customer liabilities
Half-year to 30 June 2008 30 June 2007 31 December 2007
Ratio Net liquid assets Ratio
Net liquid assets
Ratio
Net liquid assets
% US$bn % US$bn % US$bn
HSBC Bank (UK operations) Period-end .................................................. 9.8 37.3 14.5 47.5 12.1 44.2 Maximum ................................................... 14.1 52.5 16.3 48.7 21.5 80.6 Minimum .................................................... 9.8 37.0 13.5 39.9 12.1 44.2 Average ...................................................... 11.5 42.2 14.5 44.8 16.6 59.3
The Hongkong and Shanghai Banking Corporation
Period-end .................................................. 19.9 51.1 18.8 42.9 21.8 53.9 Maximum ................................................... 22.7 57.7 22.9 52.6 24.1 56.9 Minimum .................................................... 19.9 51.1 16.1 35.3 17.4 42.9 Average ...................................................... 21.5 54.9 20.2 44.9 21.2 50.7
HSBC Bank USA Period-end .................................................. 17.0 17.1 20.9 20.7 15.8 17.1 Maximum ................................................... 20.4 21.7 25.7 26.1 23.0 23.4 Minimum .................................................... 15.8 17.1 20.9 20.7 15.8 17.1 Average ...................................................... 18.6 19.6 23.4 23.8 19.2 20.0
Total of Group’s other principal banking entities1
Period-end .................................................. 19.4 68.3 25.3 68.3 21.0 66.1 Maximum ................................................... 22.1 74.4 25.3 68.3 26.1 72.7 Minimum .................................................... 19.4 66.1 23.7 58.8 21.0 64.5 Average ...................................................... 21.1 70.2 24.3 61.4 23.9 69.6

181
1 This reflects the other main banking subsidiaries and, as such, includes businesses spread across a range of locations, in many of which the Group may require a higher ratio of net liquid assets to customer liabilities to reflect local market conditions.
Projected cash flow scenario analysis
The Group uses a number of standard projected cash flow scenarios which are designed to model both Group-specific and market-wide liquidity crises. The scenarios vary the rate and timing of deposit withdrawals and drawdowns on committed lending facilities, and restrict access to interbank funding, term debt markets and the ability to generate funds from asset portfolios. The scenarios are modelled by all Group banking entities and by HSBC Finance. The assumptions for each scenario are regularly reviewed for appropriateness. In addition to the Group’s standard projected cash flow scenarios, individual entities are required to design their own scenarios tailored to reflect specific local market conditions, products and funding bases.
Limits for cumulative net cash flows under stress scenarios are set for each banking entity and for HSBC Finance.
Both ratio and cash flow limits reflect the local market place, the diversity of funding sources available and the concentration risk from large depositors. Compliance with entity level limits is monitored centrally by Group Finance and reported regularly to the RMM.
HSBC Finance
As HSBC Finance does not accept customer deposits, it takes funding from the professional markets. HSBC Finance uses a range of measures to monitor funding risk, including projected cash flow scenario analysis and placing caps on the amount of unsecured term funding that can mature in any rolling three-month and rolling 12-month periods. HSBC Finance also maintains access to committed sources of secured funding and has in place committed backstop lines for short-term refinancing CP programmes. At 30 June 2008, the maximum
amounts of unsecured term funding maturing in any rolling three-month and rolling 12-month periods were US$6.2 billion and US$17.7 billion, respectively (30 June 2007: US$6.2 billion and US$16.2 billion; 31 December 2007: US$6.2 billion and US$17.7 billion). At 30 June 2008, HSBC Finance also had in place unused committed sources of secured funding, for which eligible assets were held, of US$2.9 billion (30 June 2007: US$9.1 billion; 31 December 2007: US$6.2 billion) and committed backstop lines from non-Group entities in support of CP programmes totalling US$6.3 billion (30 June 2007: US$9.3 billion; 31 December 2007: US$9.3 billion).
Contingent liquidity risk
In the normal course of its business, the Group provides committed facilities to customers; these facilities include committed backstop lines to conduit vehicles sponsored by the Group, as well as standby facilities to corporate customers. These facilities would increase the funding requirements of the Group should customers choose to raise drawdown levels over and above their normal utilisation rates. The liquidity risk consequences of drawdowns on these committed loan facilities provided by Group entities are reflected in projected cash flow scenario analyses, in which the level of drawdown is increased under different stress scenarios. The Group also sets total notional limits by Group entity for certain categories of non-cancellable contingent funding commitments. The limits are set by the RMM after due consideration of the entity’s ability to fund the commitments. The limits are split according to the borrower, the liquidity of the underlying assets and the size of the committed line.
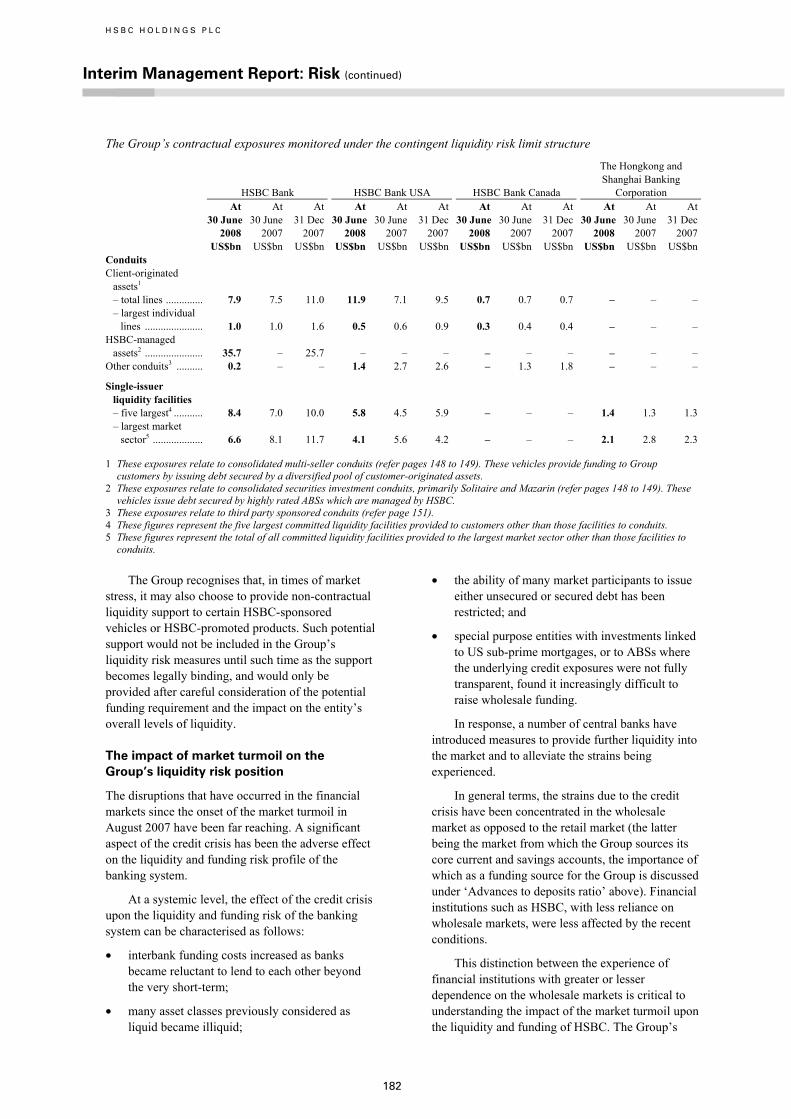
H S B C H O L D I N G S P L C
Interim Management Report: Risk (continued)
182
The Group’s contractual exposures monitored under the contingent liquidity risk limit structure
HSBC Bank HSBC Bank USA HSBC Bank Canada
The Hongkong and Shanghai Banking
Corporation At
30 June 2008
At 30 June 2007
At 31 Dec 2007
At 30 June 2008
At 30 June 2007
At 31 Dec 2007
At 30 June 2008
At 30 June 2007
At 31 Dec 2007
At 30 June 2008
At 30 June 2007
At 31 Dec 2007
US$bn US$bn US$bn US$bn US$bn US$bn US$bn US$bn US$bn US$bn US$bn US$bnConduits Client-originated
assets1
– total lines .............. 7.9 7.5 11.0 11.9 7.1 9.5 0.7 0.7 0.7 – – –– largest individual
lines ...................... 1.0 1.0 1.6 0.5 0.6 0.9 0.3 0.4 0.4 – – –HSBC-managed
assets2 ...................... 35.7 – 25.7 – – – – – – – – –Other conduits3 .......... 0.2 – – 1.4 2.7 2.6 – 1.3 1.8 – – –
Single-issuer liquidity facilities – five largest4 ........... 8.4 7.0 10.0 5.8 4.5 5.9 – – – 1.4 1.3 1.3– largest market
sector5 ................... 6.6 8.1 11.7 4.1 5.6 4.2 – – – 2.1 2.8 2.3
1 These exposures relate to consolidated multi-seller conduits (refer pages 148 to 149). These vehicles provide funding to Group customers by issuing debt secured by a diversified pool of customer-originated assets.
2 These exposures relate to consolidated securities investment conduits, primarily Solitaire and Mazarin (refer pages 148 to 149). These vehicles issue debt secured by highly rated ABSs which are managed by HSBC.
3 These exposures relate to third party sponsored conduits (refer page 151). 4 These figures represent the five largest committed liquidity facilities provided to customers other than those facilities to conduits. 5 These figures represent the total of all committed liquidity facilities provided to the largest market sector other than those facilities to
conduits.
The Group recognises that, in times of market stress, it may also choose to provide non-contractual liquidity support to certain HSBC-sponsored vehicles or HSBC-promoted products. Such potential support would not be included in the Group’s liquidity risk measures until such time as the support becomes legally binding, and would only be provided after careful consideration of the potential funding requirement and the impact on the entity’s overall levels of liquidity.
The impact of market turmoil on the Group’s liquidity risk position
The disruptions that have occurred in the financial markets since the onset of the market turmoil in August 2007 have been far reaching. A significant aspect of the credit crisis has been the adverse effect on the liquidity and funding risk profile of the banking system.
At a systemic level, the effect of the credit crisis upon the liquidity and funding risk of the banking system can be characterised as follows:
• interbank funding costs increased as banks became reluctant to lend to each other beyond the very short-term;
• many asset classes previously considered as liquid became illiquid;
• the ability of many market participants to issue either unsecured or secured debt has been restricted; and
• special purpose entities with investments linked to US sub-prime mortgages, or to ABSs where the underlying credit exposures were not fully transparent, found it increasingly difficult to raise wholesale funding.
In response, a number of central banks have introduced measures to provide further liquidity into the market and to alleviate the strains being experienced.
In general terms, the strains due to the credit crisis have been concentrated in the wholesale market as opposed to the retail market (the latter being the market from which the Group sources its core current and savings accounts, the importance of which as a funding source for the Group is discussed under ‘Advances to deposits ratio’ above). Financial institutions such as HSBC, with less reliance on wholesale markets, were less affected by the recent conditions.
This distinction between the experience of financial institutions with greater or lesser dependence on the wholesale markets is critical to understanding the impact of the market turmoil upon the liquidity and funding of HSBC. The Group’s
183
limited dependence upon the wholesale or professional markets for funding has been a significant competitive advantage to HSBC through the recent period of dislocation in the financial markets.
The extent to which the liquidity and funding of HSBC has been affected by the market turmoil, has been largely limited to the Group’s activities that had historically depended upon the asset-backed commercial paper markets for funding, specifically SIVs and conduits, and certain money market funds. This was discussed in detail on page 183 of the Annual Report and Accounts 2007 and updated for developments in the first six months of 2008 in this Interim Report.
The deterioration of the US sub-prime credit market has reduced the availability of committed financing to entities with exposures to the US sub-prime market. However, HSBC Finance, by virtue of its position within the Group, continues to enjoy and renew, albeit at a lower level, committed financing facilities. HSBC Finance also continues to have access to term funding markets, although the price of this funding has increased to reflect the downturn in credit markets. Funding plans are in place to enable HSBC Finance to deal with continued stress in the credit markets.
HSBC Holdings has continued to have access to debt capital markets at normal market pricing levels.
The customer deposit base of the Group has grown since August 2007. During this period, the Group has not increased deposit pricing to attract additional deposits. As a net provider of funds to the interbank market, the Group has not been significantly affected by the scarcity of interbank funding.
The Group has regularly reviewed the quality of assets to ensure that only those assets for which a deep and liquid market exists are classified as liquid within liquidity and funding risk measures.
Market risk
There have been no material changes to HSBC’s objectives for the management of market risk as described in the Annual Report and Accounts 2007. The key features are reported below.
Market risk is the risk that movements in market risk factors, including foreign exchange rates and commodity prices, interest rates, credit spreads and equity prices will reduce HSBC’s income or the value of its portfolios.
HSBC separates exposures to market risk into trading and non-trading portfolios. Trading portfolios include those positions arising from market-making, proprietary position-taking and other marked-to-market positions so designated.
Non-trading portfolios primarily arise from the interest rate management of HSBC’s retail and commercial banking assets and liabilities, financial investments classified as available for sale and held to maturity, and exposure arising from HSBC’s insurance operations.
HSBC uses a range of tools to monitor and limit market risk exposures. These include sensitivity analysis, value at risk (‘VAR’) and stress testing.
Sensitivity analysis
Sensitivity measures are used to monitor the market risk positions within each risk type, for example, present value of a basis point movement in interest rates, for interest rate risk. Sensitivity limits are set for portfolios, products and risk types, with the depth of the market being one of the principal factors in determining the level of limits set.
Value at risk
VAR is a technique that estimates the potential losses that could occur on risk positions as a result of movements in market rates and prices over a specified time horizon and to a given level of confidence.
The VAR models used by HSBC are based predominantly on historical simulation. These models derive plausible future scenarios from past series of recorded market rates and prices, taking into account inter-relationships between different markets and rates such as interest rates and foreign exchange rates. The models also incorporate the effect of option features on the underlying exposures.
The historical simulation models used by HSBC incorporate the following features:
• potential market movements are calculated with reference to data from the past two years;
• historical market rates and prices are calculated with reference to foreign exchange rates and commodity prices, interest rates, equity prices and the associated volatilities; and
• VAR is calculated to a 99 per cent confidence level and for a one-day holding period.
HSBC routinely validates the accuracy of its VAR models by back-testing the actual daily profit

H S B C H O L D I N G S P L C
Interim Management Report: Risk (continued)
184
and loss results, adjusted to remove non-modelled items such as fees and commissions, against the corresponding VAR numbers. Statistically, HSBC would expect to see losses in excess of VAR only one per cent of the time over a one-year period. The actual number of excesses over this period can therefore be used to gauge how well the models are performing.
Although a valuable guide to risk, VAR should always be viewed in the context of its limitations. For example:
• the use of historical data as a proxy for estimating future events may not encompass all potential events, particularly those which are extreme in nature;
• the use of a one-day holding period assumes that all positions can be liquidated or the risks offset in one day. This may not fully reflect the market risk arising at times of severe illiquidity, when a one-day holding period may be insufficient to liquidate or hedge all positions fully;
• the use of a 99 per cent confidence level, by definition, does not take into account losses that might occur beyond this level of confidence;
• VAR is calculated on the basis of exposures outstanding at the close of business and therefore does not necessarily reflect intra-day exposures; and
• VAR is unlikely to reflect loss potential on exposures that only arise under significant market moves.
Stress testing
In recognition of the limitations of VAR, HSBC augments VAR with stress testing to evaluate the potential impact on portfolio values of more extreme, although plausible, events or movements in a set of financial variables.
Stress testing is performed at a portfolio level, as well as on the consolidated positions of the Group, and covers the following scenarios:
• Sensitivity scenarios, which consider the impact of market moves to any single risk factor or a set of factors. For example the impact resulting from a break of a currency peg that is unlikely to be captured within the VAR models;
• Technical scenarios, which consider the largest move in each risk factor, without consideration of any underlying market correlation;
• Hypothetical scenarios, which consider potential macro economic events; and
• Historical scenarios, which incorporate historical observations of market moves during previous periods of stress which would not be captured within VAR.
Stress testing is governed by the ‘Stress Testing Review Group’ forum that coordinates the Group stress testing scenarios in conjunction with the regional risk managers. Consideration is given to the actual market risk exposures, along with market events in determining the stress scenarios.
Stress testing results are reported to senior management and provide them with an assessment of the financial impact such events would have on the profit of HSBC. The daily losses experienced in the first half of 2008 were within the stress loss scenarios reported to senior management.
The impact of market turmoil on market risk
The years preceding the current market turmoil were characterised by historically low levels of volatility, with ample market liquidity. This period was associated with falling levels of VAR as the level of observed market volatility is a key determinant in the VAR calculation. As a consequence HSBC reduced the overall VAR limit to reflect the lower level of volatility, and associated VAR.
The increase in market volatility experienced during the last six months of 2007 was most noticeable in the credit spreads of financial institutions and ABSs/MBSs. The increase in the volatility of credit spreads reflected the market’s uncertainty of financial institutions exposure to the US sub-prime market, either directly or through structured products. This is discussed further in ‘Credit spread risk’ on page 187.
The tightening of both credit and liquidity within the wholesale markets prompted remedial action from the central banks, which included injecting liquidity into the wholesale markets and cutting rates.
Credit spread volatility has continued to increase during 2008, and as the effect of the market turmoil on the wider economy has become more apparent, there has been a larger increase in the volatility of other risk types, such as interest rates.
Positions taken in anticipation of rate reductions led to an increase in the total VAR in early 2008. VAR continued to increase during the period as a result of higher volatility; however, the impact on VAR was limited as a result of a reduction in positions towards the end of the period (see ‘Value at risk of the trading and non-trading portfolios’ below).

185
The overall VAR limit for the Group remained unchanged from the level prior to the market turmoil, despite the increase in volatility.
The following table provides an overview of the reporting of risks within this section:
Portfolio Trading Non-trading Risk type Foreign exchange ............... VAR VAR1
Interest rate ........................ VAR VAR2
Commodity ........................ VAR N/AEquity ................................. VAR SensitivityCredit spread ...................... Sensitivity Sensitivity3
1 The structural foreign exchange risk is monitored using sensitivity analysis.
2 The VAR for the fixed-rate securities issued by HSBC Holdings is not included within the Group VAR. See page 188. In addition, see Sensitivity of net interest income on page 189.
3 Credit spread VAR is reported for the credit derivatives transacted by Global Banking. See page 187.
Value at risk of the trading and non-trading portfolios
The VAR, both trading and non-trading, for the Group was as follows:
Value at risk
Half-year to 30 June
2008 30 June 2007
31 December 2007
US$m US$m US$m
At period end .......... 144.2 84.2 70.1 Average ................... 135.5 62.5 67.9 Minimum ................ 59.8 43.8 57.3 Maximum ................ 230.5 98.1 85.9
As a result of improvements in the Group VAR data collection process during 2008, all entities within the Group are now aggregated on a historical simulation basis, reflecting the full diversification effects across the Group’s VAR. The 2007 VAR has been adjusted, reducing the total VAR by US$18.9 million as at 30 June 2007 and by US$25.2 million as at 31 December 2007. The maximum, minimum and average VARs have also been adjusted on a comparable basis in order to fairly present the trend.
The daily VAR, both trading and non-trading, for the Group was as follows:
Daily VAR (trading and non-trading) (US$m)
0
50
100
150
200
250
Dec-06 Feb-07 Apr-07 Jun-07 Aug-07 Oct-07 Dec-07 Feb-08 Apr-08 Jun-08
The major contributor to the trading and non-trading VAR for the Group was Global Markets.
The histogram below illustrates the frequency of daily revenue arising from Global Markets’ trading, balance sheet management and other trading activities.
The average daily revenue earned therefrom in the first half of 2008 was US$21.7 million, compared with US$26.3 million in the first half of 2007. The standard deviation of these daily revenues was US$48.3 million compared with US$17.8 million in the first half of 2007. The standard deviation measures the variation of daily revenues about the mean value of those revenues.
An analysis of the frequency distribution of daily revenue shows that there were 33 days with negative revenue during the first half of 2008 compared with one day in the first half of 2007. The most frequent result was a daily revenue of between US$46 million and US$50 million with 8 occurrences.
Daily distribution of Global Markets’ trading, balance sheet management and other trading revenues1
Half-year to 30 June 2008
Number of days
1 1
4
12
3
5
7
4
6
12
14
16
20
11
7 8
2
4
1
0
5
10
15
20
25
-174 -162 -106 -94 -82 -70 -58 -46 -34 -22 -10 2 14 26 38 50 62 74 86 98 110 122 Revenues (US$m)
Profit and loss frequency
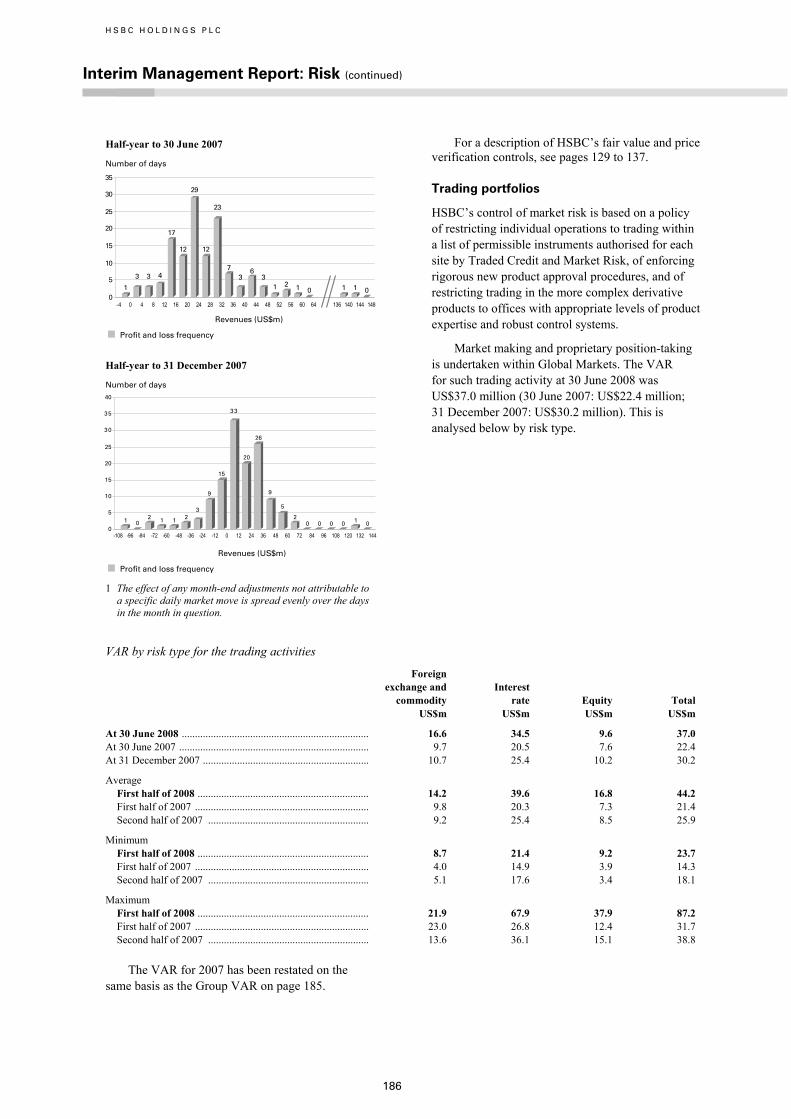
H S B C H O L D I N G S P L C
Interim Management Report: Risk (continued)
186
Half-year to 30 June 2007
Number of days
1
3 3 4
17
12
29
12
23
73
63
1 2 1 0 1 1 00
5
10
15
20
25
30
35
-4 0 4 8 12 16 20 24 28 32 36 40 44 48 52 56 60 64 136 140 144 148 Revenues (US$m)
Profit and loss frequency
Half-year to 31 December 2007
Number of days
1 02 1 1 2
3
9
15
33
20
26
9
5
20 0 0 0 1 0
0
5
10
15
20
25
30
35
40
-108 -96 -84 -72 -60 -48 -36 -24 -12 0 12 24 36 48 60 72 84 96 108 120 132 144 Revenues (US$m)
Profit and loss frequency
1 The effect of any month-end adjustments not attributable to a specific daily market move is spread evenly over the days in the month in question.
For a description of HSBC’s fair value and price verification controls, see pages 129 to 137.
Trading portfolios
HSBC’s control of market risk is based on a policy of restricting individual operations to trading within a list of permissible instruments authorised for each site by Traded Credit and Market Risk, of enforcing rigorous new product approval procedures, and of restricting trading in the more complex derivative products to offices with appropriate levels of product expertise and robust control systems.
Market making and proprietary position-taking is undertaken within Global Markets. The VAR for such trading activity at 30 June 2008 was US$37.0 million (30 June 2007: US$22.4 million; 31 December 2007: US$30.2 million). This is analysed below by risk type.
VAR by risk type for the trading activities
Foreign exchange and commodity
Interest rate Equity Total
US$m US$m US$m US$m
At 30 June 2008 ....................................................................... 16.6 34.5 9.6 37.0 At 30 June 2007 ........................................................................ 9.7 20.5 7.6 22.4 At 31 December 2007 ............................................................... 10.7 25.4 10.2 30.2
Average First half of 2008 ................................................................. 14.2 39.6 16.8 44.2 First half of 2007 .................................................................. 9.8 20.3 7.3 21.4 Second half of 2007 ............................................................. 9.2 25.4 8.5 25.9
Minimum First half of 2008 ................................................................. 8.7 21.4 9.2 23.7 First half of 2007 .................................................................. 4.0 14.9 3.9 14.3 Second half of 2007 ............................................................. 5.1 17.6 3.4 18.1
Maximum First half of 2008 ................................................................. 21.9 67.9 37.9 87.2 First half of 2007 .................................................................. 23.0 26.8 12.4 31.7 Second half of 2007 ............................................................. 13.6 36.1 15.1 38.8
The VAR for 2007 has been restated on the same basis as the Group VAR on page 185.

187
Credit spread risk
The risk associated with movements in credit spreads is primarily managed through sensitivity limits, stress testing and VAR on those portfolios where it is calculated.
The Group is introducing credit spread as a separate risk type within its VAR models and, at 30 June 2008, credit spread VAR was calculated for the London trading and New York credit derivatives portfolios. At 30 June 2008, the total VAR for the trading activities, including credit spread VAR for the above portfolios, was US$46.8 million (31 December 2007: US$39.8 million).
The sensitivity of trading income to the effect of movements in credit spreads on the total trading activities of the Group was US$188.1 million at 30 June 2008 (30 June 2007: US$18.5 million; 31 December 2007: US$95.4 million). This sensitivity was calculated using simplified assumptions based on one-day movements in average market credit spreads over a two-year period at a confidence level of 99 per cent. It should be noted that diversification effects with other risk types is likely to lead to a reduced impact on trading income.
The increase in the sensitivity at 30 June 2008, compared with 30 June 2007 was mainly due to the effect of higher volatility in credit spreads.
Credit spread risk also arises on credit derivative transactions entered into by Global Banking in order to manage the risk concentrations within the corporate loan portfolio and so enhance capital efficiency. The mark-to-market of these transactions is taken through the income statement.
At 30 June 2008, the credit spread VAR on the credit derivatives transactions entered into by Global Banking was US$33.7 million (30 June 2007: US$4.8 million; 31 December 2007: US$19.7 million). The VAR shows the effect on trading income from a one-day movement in credit spreads over a two-year period, calculated to a 99 per cent confidence level.
Gap risk
Certain transactions are structured such that the risk to HSBC is negligible under a wide range of market conditions or events, but in which there exists a remote probability that a significant gap event could lead to loss. A gap event could be seen as a change in market price from one level to another with no trading opportunity in between, and where the price change breaches the threshold beyond which the risk profile changes from having no open risk to having
full exposure to the underlying structure. Such movements may occur, for example, when there are adverse news announcements and the market for a specific investment becomes illiquid, making hedging impossible.
Given the characteristics of these transactions, they will make little or no contribution to VAR or to traditional market risk sensitivity measures. HSBC captures the risks for such transactions within its stress testing scenarios. Gap risk arising is monitored on an ongoing basis, and HSBC incurred no gap losses on such transactions in the first half of 2008.
ABSs/MBSs positions
The ABSs/MBSs exposures within the trading portfolios are managed within sensitivity and VAR limits, as described on page 249 in the Annual Report and Accounts 2007, and are included within the stress testing scenarios as described on page 184.
Non-trading portfolios
Interest rate risk in non-trading portfolios arises principally from mismatches between the future yield on assets and their funding cost, as a result of interest rate changes. Analysis of this risk is complicated by having to make assumptions on embedded optionality within certain product areas such as the incidence of mortgage prepayments, and from behavioural assumptions regarding the economic duration of liabilities which are contractually repayable on demand such as current accounts. The prospective change in future net interest income from non-trading portfolios will be reflected in the current realisable value of these positions, should they be sold or closed prior to maturity. In order to manage this risk optimally, market risk in non-trading portfolios is transferred to Global Markets or to separate books managed under the supervision of the local Asset and Liability Committee (‘ALCO’).
Once market risk has been consolidated in Global Markets or ALCO-managed books, the net exposure is typically managed through the use of interest rate swaps within agreed limits. The VAR for these portfolios is included within the Group VAR (see ‘Value at risk of the trading and non-trading portfolios’ above).
Credit spread risk
At 30 June 2008, the sensitivity of equity to the effect of movements in credit spreads on the Group’s available-for-sale debt securities was US$345.1 million (30 June 2007: US$45.0 million; 31 December 2007: US$206.5 million). The

H S B C H O L D I N G S P L C
Interim Management Report: Risk (continued)
188
sensitivity was calculated on the same basis as that applied to the trading portfolio. Including the gross exposure to the SIVs consolidated within HSBC’s balance sheet the sensitivity increased to US$393.1 million (31 December 2007: US$279.8 million). This sensitivity was calculated, however, before taking account of any losses which would have been absorbed by the income note holders. At 30 June 2008, the income note holders would have absorbed the first US$1.2 billion of any losses incurred by the SIVs prior to HSBC incurring any.
The increase in this sensitivity at 30 June 2008, compared with 30 June 2007, was due to the effect of higher volatility in credit spreads.
Fixed-rate securities
Market risk also arises on fixed-rate securities issued by HSBC Holdings. These securities are issued to support long-term capital investments in subsidiaries and include non-cumulative preference shares, non-cumulative perpetual preferred securities and fixed-rate subordinated debt. The interest rate VAR for these capital instruments, which is not included within the Group VAR, was as follows:
Capital instruments VAR
VAR US$m
At 30 June 2008 ................................................. 223.3 At 30 June 2007 .................................................. 61.8 At 31 December 2007 ......................................... 104.7
Average First half of 2008 ........................................... 148.0 First half of 2007 ............................................ 67.8 Second half of 2007 ....................................... 83.7
Minimum First half of 2008 ........................................... 101.8 First half of 2007 ............................................ 61.8 Second half of 2007 ....................................... 63.3
Maximum First half of 2008 ........................................... 223.3 First half of 2007 ............................................ 72.0 Second half of 2007 ....................................... 105.4
The increase in the VAR is due to the issuance of fixed rate securities during the first half of 2008, coupled with an increase in market volatility.
Equity securities classified as available for sale
Market risk arises on equity securities held as available for sale. The fair value of these securities at 30 June 2008 was US$9.5 billion (30 June 2007: US$9.3 billion; 31 December 2007: US$12.6 billion), including private equity holdings
of US$3.4 billion (30 June 2007: US$2.7 billion; 31 December 2007: US$3.2 billion). Investments in private equity are primarily made through managed funds that are subject to limits on the amount invested. Potential new commitments are subject to risk appraisal to ensure that industry and geographical concentrations remain within acceptable levels for the portfolio as a whole. Regular reviews are performed to substantiate the value of the investments within the portfolio. At 30 June 2008, funds typically invested for short-term cash management represented US$1.8 billion (30 June 2007: US$2.2 billion; 31 December 2007: US$3.1 billion), and investments held to facilitate ongoing business, such as holdings in government-sponsored enterprises and local stock exchanges, represented US$1.4 billion (30 June 2007: US$1.3 billion; 31 December 2007: US$1.7 billion). Other strategic investments represented US$2.9 billion at 30 June 2008 (30 June 2007: US$3.1 billion; 31 December 2007: US$4.6 billion). The fair value of the constituents of equity securities classified as available for sale can fluctuate considerably. A 10 per cent reduction in the value of the available-for-sale equities at 30 June 2008 would have reduced equity by US$0.9 billion (30 June 2007: US$0.9 billion; 31 December 2007: US$1.3 billion). For details of the impairment incurred on available-for-sale equity securities see ‘Accounting policies’ on page 116.
Defined benefit pension scheme
Market risk also arises within HSBC’s defined benefit pension schemes to the extent that the obligations of the schemes are not fully matched by assets with determinable cash flows. Pension scheme obligations fluctuate with changes in long-term interest rates, inflation, salary levels and the longevity of scheme members. Pension scheme assets include equities and debt securities, the cash flows from which change as equity prices and interest rates vary. There are risks that market movements in equity prices and interest rates could result in asset values which are insufficient over time to cover the level of projected obligations and these, in turn, could increase with a rise in inflation and members living longer. Management, together with the trustees who act on behalf of the pension scheme beneficiaries, assess these risks using reports prepared by independent external actuaries and, where appropriate, adjust investment strategies and contribution levels accordingly.
The present value of HSBC’s defined benefit pension schemes’ liabilities was US$32.3 billion at 30 June 2008, compared with US$31.0 billion at

189
30 June 2007 and US$32.4 billion at 31 December 2007. Assets of the defined benefit pension schemes at 30 June 2008 comprised 21 per cent equity investments (30 June 2007: 26 per cent; 31 December 2007: 26 per cent); 64 per cent debt securities (30 June 2007: 62 per cent; 31 December 2007: 62 per cent) and 15 per cent other (including property) (30 June 2007: 12 per cent; 31 December 2007: 12 per cent).
Sensitivity of net interest income
There have been no material changes since 31 December 2007 to HSBC’s measurement and management of the sensitivity of net interest income to movements in interest rates.
A principal part of HSBC’s management of market risk in non-trading portfolios is to monitor the sensitivity of projected net interest income under varying interest rate scenarios (simulation modelling). HSBC aims, through its management of market risk in non-trading portfolios, to mitigate the effect of prospective interest rate movements which could reduce future net interest income, while
balancing the cost of such hedging activities on the current net revenue stream.
The table below sets out the effect on future net interest income of an incremental 25 basis points parallel rise or fall in all yield curves worldwide at the beginning of each quarter during the 12 months from 1 July 2008. Assuming no management actions, a series of such rises would decrease planned net interest income for the 12 months to 30 June 2009 by US$610 million (to 31 December 2008: US$503 million), while a series of such falls would increase planned net interest income by US$430 million (to 31 December 2008: US$525 million). These figures incorporate the effect of any option features in the underlying exposures.
Instead of assuming that all interest rates move together, HSBC groups its interest rate exposures into blocs of currencies whose rates are considered likely to move together. The sensitivity of projected net interest income, on this basis, is as follows:
Sensitivity of projected net interest income
US dollar bloc
Rest of Americas bloc
Hong Kong dollar bloc
Rest of Asia bloc
Sterling bloc
Euro bloc
Total US$m US$m US$m US$m US$m US$m US$m Change in July 2008 to June 2009
projected net interest income + 25 basis points shift in yield curves at
the beginning of each quarter .............. (258) 82 (29) 128 (164) (369) (610)– 25 basis points shift in yield curves at
the beginning of each quarter .............. 271 (95) (155) (113) 165 357 430 Change in January 2008 to December
2008 projected net interest income + 25 basis points shift in yield curves at
the beginning of each quarter .............. (275) 96 9 77 (140) (270) (503)– 25 basis points shift in yield curves at
the beginning of each quarter .............. 272 (95) 11 (65) 142 260 525
The interest rate sensitivities set out in the table above are illustrative only and are based on simplified scenarios. The figures represent the effect on projected net interest income of the pro forma movements of the yield curve based on the Group’s current interest rate risk profile. This effect, however, does not incorporate actions that would be taken by Global Markets or in the business units to mitigate the effect of this interest rate risk. In reality, Global Markets proactively seeks to change the interest rate risk profile to minimise losses and optimise net revenues. The projections above also assume that interest rates of all maturities move by the same amount and, therefore, do not reflect the potential effect on net interest income of some rates changing while others remain unchanged. The
projections take account of the effect on net interest income of anticipated differences in changes between interbank interest rates and interest rates linked to other bases (such as Central Bank rates or product rates for which the entity has discretion over the timing and extent of rate changes). The projections make other simplifying assumptions too, including that all positions run to maturity.
HSBC’s core exposure to the effect of movements in interest rates on its net interest income arise from three areas: core deposit franchises, HSBC Finance and Global Markets. This is described more fully in the Annual Report and Accounts 2007.
The major driver of the changes in the
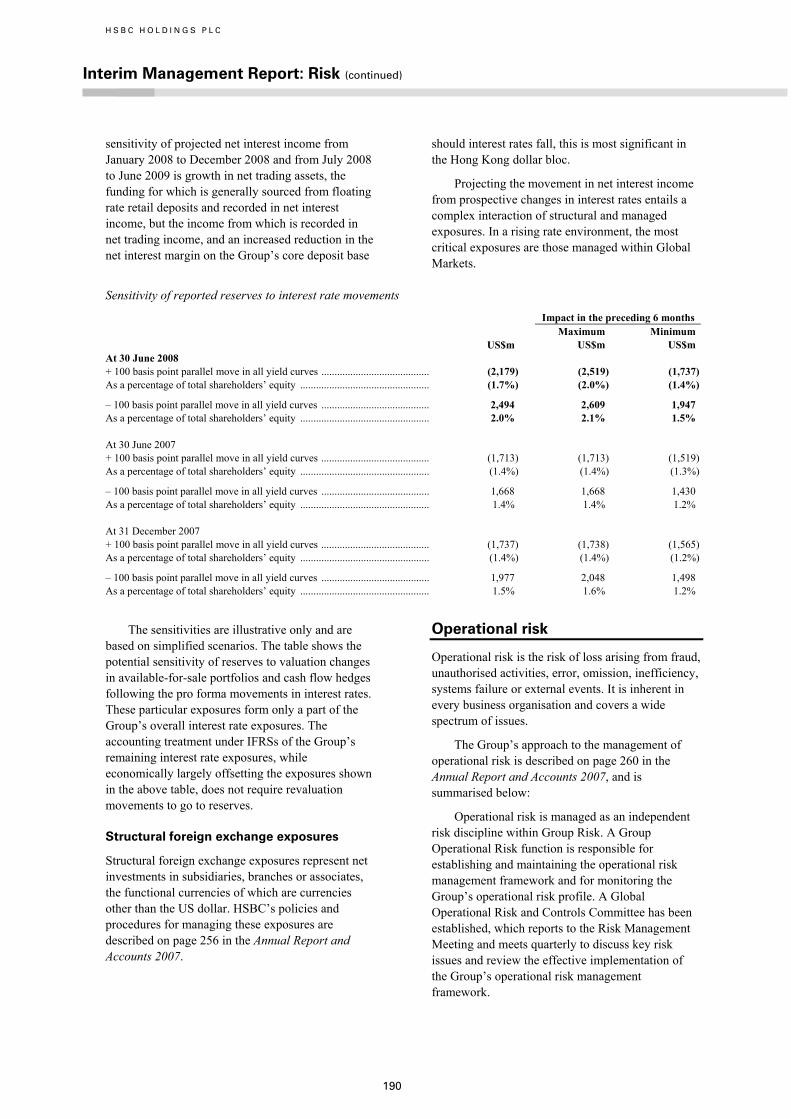
H S B C H O L D I N G S P L C
Interim Management Report: Risk (continued)
190
sensitivity of projected net interest income from January 2008 to December 2008 and from July 2008 to June 2009 is growth in net trading assets, the funding for which is generally sourced from floating rate retail deposits and recorded in net interest income, but the income from which is recorded in net trading income, and an increased reduction in the net interest margin on the Group’s core deposit base
should interest rates fall, this is most significant in the Hong Kong dollar bloc.
Projecting the movement in net interest income from prospective changes in interest rates entails a complex interaction of structural and managed exposures. In a rising rate environment, the most critical exposures are those managed within Global Markets.
Sensitivity of reported reserves to interest rate movements
Impact in the preceding 6 months
US$m Maximum US$m
Minimum US$m
At 30 June 2008 + 100 basis point parallel move in all yield curves ......................................... (2,179) (2,519) (1,737)As a percentage of total shareholders’ equity ................................................. (1.7%) (2.0%) (1.4%)
– 100 basis point parallel move in all yield curves ......................................... 2,494 2,609 1,947 As a percentage of total shareholders’ equity ................................................. 2.0% 2.1% 1.5% At 30 June 2007 + 100 basis point parallel move in all yield curves ......................................... (1,713) (1,713) (1,519)As a percentage of total shareholders’ equity ................................................. (1.4%) (1.4%) (1.3%)
– 100 basis point parallel move in all yield curves ......................................... 1,668 1,668 1,430 As a percentage of total shareholders’ equity ................................................. 1.4% 1.4% 1.2% At 31 December 2007 + 100 basis point parallel move in all yield curves ......................................... (1,737) (1,738) (1,565)As a percentage of total shareholders’ equity ................................................. (1.4%) (1.4%) (1.2%)
– 100 basis point parallel move in all yield curves ......................................... 1,977 2,048 1,498 As a percentage of total shareholders’ equity ................................................. 1.5% 1.6% 1.2%
The sensitivities are illustrative only and are
based on simplified scenarios. The table shows the potential sensitivity of reserves to valuation changes in available-for-sale portfolios and cash flow hedges following the pro forma movements in interest rates. These particular exposures form only a part of the Group’s overall interest rate exposures. The accounting treatment under IFRSs of the Group’s remaining interest rate exposures, while economically largely offsetting the exposures shown in the above table, does not require revaluation movements to go to reserves.
Structural foreign exchange exposures
Structural foreign exchange exposures represent net investments in subsidiaries, branches or associates, the functional currencies of which are currencies other than the US dollar. HSBC’s policies and procedures for managing these exposures are described on page 256 in the Annual Report and Accounts 2007.
Operational risk
Operational risk is the risk of loss arising from fraud, unauthorised activities, error, omission, inefficiency, systems failure or external events. It is inherent in every business organisation and covers a wide spectrum of issues.
The Group’s approach to the management of operational risk is described on page 260 in the Annual Report and Accounts 2007, and is summarised below:
Operational risk is managed as an independent risk discipline within Group Risk. A Group Operational Risk function is responsible for establishing and maintaining the operational risk management framework and for monitoring the Group’s operational risk profile. A Global Operational Risk and Controls Committee has been established, which reports to the Risk Management Meeting and meets quarterly to discuss key risk issues and review the effective implementation of the Group’s operational risk management framework.

191
HSBC has codified its operational risk management framework in a high level standard, supplemented by more detailed formal policies. The detailed policies explain HSBC’s approach to identifying, assessing, monitoring and controlling operational risk and give guidance on mitigating action to be taken when weaknesses are identified.
In each of HSBC’s subsidiaries, business managers are responsible for maintaining an acceptable level of internal control, commensurate with the scale and nature of their operations. They are responsible for identifying and assessing risks, designing controls and monitoring the effectiveness of these controls. The operational risk management framework helps managers to fulfil these responsibilities by defining a standard risk assessment methodology and providing a tool for the systematic reporting of operational loss data.
The control environment in each subsidiary is subject to an independent programme of periodic reviews undertaken by Internal Audit. This is supported by the monitoring of external operational risk events, which ensures that HSBC stays in line with industry best practice and takes account of lessons learned from publicised operational failures.
Legal risk
Each operating company is required to implement policies, procedures and guidelines in respect of the management and control of legal risk which conform to HSBC standards. Legal risk falls within the definition of operational risk and includes contractual risk, legislative risk, intellectual property risk and litigation risk. Litigation risk is the risk of:
• failing to act appropriately in response to a claim made against any HSBC company; or
• being unable to defend successfully a claim brought against any HSBC company; or
• HSBC being unable to take action to enforce its rights through the courts.
HSBC has a global legal function dedicated to managing legal risk in accordance with policies and procedures as described on page 261 in the Annual Report and Accounts 2007.
Reputational risk
The safeguarding of HSBC’s reputation is of paramount importance to its continued prosperity and is the responsibility of every member of staff. Reputational risks can arise from social, ethical or environmental issues, or as a consequence of operational risk events. As a banking group, HSBC’s
good reputation depends upon the way in which it conducts its business, but it can also be affected by the way in which its clients conduct themselves.
For this reason a Group Reputational Risk Committee (‘GRRC’) has been established, chaired by the Head of Group Compliance with membership drawn from senior Group business and functional heads. GRRC will meet as required, but at least quarterly, to consider issues and areas of policy relating to reputational risk, and where required make recommendations to senior Group management. A wider description of HSBC’s management of reputational risk is described on page 263 in the Annual Report and Accounts 2007.
Risk management of insurance operations
HSBC operates a bancassurance model which provides insurance products for customers with whom the Group has a banking relationship. Many of these products are manufactured by HSBC subsidiaries but, where the Group considers it operationally more effective, third parties are engaged to manufacture and provide insurance products which HSBC sells through its banking network.
Life insurance contracts include participating business (with discretionary participation features) such as endowments and pensions, credit life business in respect of income and payment protection, annuities, term assurance and critical illness covers.
Non-life insurance contracts include motor, fire and other damage to property, accident and health, repayment protection and commercial insurances.
The principal insurance risk faced by HSBC is that, over time, the combined cost of claims, administration and acquisition of the contract may exceed the aggregate amount of premiums received and investment income.
In respect of financial risks, subsidiaries manufacturing products with guarantees are usually exposed to falls in market interest rates and equity prices to the extent that the exposure cannot be managed through the discretionary bonus policy.
HSBC manages its exposure to insurance risk by applying underwriting, reinsurance and claims-handling procedures designed to ensure compliance with regulations and insurance risk appetite, the latter proposed by local businesses and authorised centrally. This is supplemented by undertaking stress testing. The following tables provide an analysis of the insurance risk exposures by geography and by

H S B C H O L D I N G S P L C
Interim Management Report: Risk (continued)
192
type of business. Life business tends to be longer term in nature than non-life business and frequently involves an element of savings and investment in the contract. Separate tables are therefore provided for life and non-life businesses, reflecting their distinctive risk characteristics. The life insurance risk table provides an analysis of insurance liabilities as the best available overall measure of insurance exposure, because provisions for life contracts are
typically set by reference to expected future cash outflows relating to the underlying policies. The table for non-life business uses written premiums as the best available measure of risk exposure.
HSBC’s management of insurance risk, including the risks relating to different life and non-life products, is described on page 264 in the Annual Report and Accounts 2007.
Analysis of life insurance risk – liabilities to policyholders
Europe Hong Kong
Rest of Asia- Pacific
North America
Latin America Total
US$m US$m US$m US$m US$m US$m At 30 June 2008 Life (non-linked)
Insurance contracts with DPF1 ....................... 1,094 9,744 238 – – 11,076 Credit life ........................................................ 280 – – 72 – 352 Annuities ........................................................ 484 – 29 826 1,697 3,036 Term assurance and other long-term
contracts ..................................................... 933 79 97 131 341 1,581
Total life (non-linked) ........................................ 2,791 9,823 364 1,029 2,038 16,045 Life (linked) ........................................................ 2,289 2,263 429 – 2,751 7,732 Investment contracts with DPF1,2 ....................... 20,218 – 45 – – 20,263
Insurance liabilities to policyholders .................. 25,298 12,086 838 1,029 4,789 44,040
At 30 June 2007 Life (non-linked)
Insurance contracts with DPF1 ....................... 844 7,173 201 – – 8,218 Credit life ........................................................ 234 – – 201 – 435 Annuities ........................................................ 310 – 26 1,210 1,480 3,026 Term assurance and other long-term
contracts ..................................................... 94 76 93 – 291 554
Total life (non-linked) ........................................ 1,482 7,249 320 1,411 1,771 12,233 Life (linked) ........................................................ 1,693 1,058 426 – 1,677 4,854 Investment contracts with DPF1,2 ....................... 17,100 – 22 – – 17,122
Insurance liabilities to policyholders .................. 20,275 8,307 768 1,411 3,448 34,209
At 31 December 2007 Life (non-linked)
Insurance contracts with DPF1 ....................... 940 8,489 231 – – 9,660 Credit life ........................................................ 235 – – 82 – 317 Annuities ........................................................ 413 – 28 1,154 1,532 3,127 Term assurance and other long-term
contracts ..................................................... 675 74 85 125 307 1,266
Total life (non-linked) ........................................ 2,263 8,563 344 1,361 1,839 14,370 Life (linked) ........................................................ 1,720 2,019 467 – 2,193 6,399 Investment contracts with DPF1,2 ....................... 18,954 – 29 – – 18,983
Insurance liabilities to policyholders .................. 22,937 10,582 840 1,361 4,032 39,752
1 Insurance contracts and investment contracts with discretionary participation features (‘DPF’) can give policyholders the contractual right to receive, as a supplement to their guaranteed benefits, additional benefits that may be a significant portion of the total contractual benefits, but whose amount and timing is determined by HSBC. These additional benefits are contractually based on the performance of a specified pool of contracts or assets, or the profit of the company issuing the contracts.
2 Although investment contracts with DPF are financial instruments, HSBC continues to account for them as insurance contracts as permitted by IFRS 4.

193
Analysis of non-life insurance risk – net written insurance premiums1
Europe Hong Kong
Rest of Asia- Pacific
North America
Latin America Total
US$m US$m US$m US$m US$m US$m Half-year to 30 June 2008 Accident and health ............................................ 7 76 2 – 13 98 Motor .................................................................. 149 7 6 – 134 296 Fire and other damage ........................................ 71 13 4 1 13 102 Liability ............................................................... – 9 2 – 19 30 Credit (non-life) .................................................. 43 – – 75 – 118 Marine, aviation and transport ............................ – 7 2 – 13 22 Other non-life insurance contracts ..................... 28 14 – 8 12 62
Total net written insurance premiums ................ 298 126 16 84 204 728
Net insurance claims incurred and movement in liabilities to policyholders .......................... (268) (50) (5) (41) (82) (446)
Half-year to 30 June 2007 Accident and health ............................................ 18 68 2 – 8 96 Motor .................................................................. 172 8 5 – 96 281 Fire and other damage ........................................ 99 11 2 1 6 119 Liability ............................................................... – 9 2 8 15 34 Credit (non-life) .................................................. 125 – – 90 – 215 Marine, aviation and transport ............................ – 6 2 – 8 16 Other non-life insurance contracts ..................... 24 11 – 6 8 49
Total net written insurance premiums ................ 438 113 13 105 141 810
Net insurance claims incurred and movement in liabilities to policyholders .......................... (259) (43) (5) (40) (63) (410)
Half-year to 31 December 2007 Accident and health ............................................ 9 64 3 – 17 93 Motor .................................................................. 197 7 5 – 128 337 Fire and other damage ........................................ 79 12 5 1 13 110 Liability ............................................................... – 3 1 – 19 23 Credit (non-life) .................................................. (49) – – 67 – 18 Marine, aviation and transport ............................ – 6 2 – 10 18 Other non-life insurance contracts ..................... 6 13 – 24 16 59
Total net written insurance premiums ................ 242 105 16 92 203 658
Net insurance claims incurred and movement in liabilities to policyholders .......................... (339) (47) (5) (39) (88) (518)
1 Net written insurance premiums represent gross written premiums less gross written premiums ceded to reinsurers.
Balance sheet of insurance manufacturing operations by type of contract
A principal tool used to manage the Group’s exposure to insurance risk, in particular for life insurance contracts, is asset and liability matching. Of particular importance is the need to match the expected pattern of cash inflows with the benefits payable on the underlying contracts which, in some cases, can extend for many years. The table below shows the composition of assets and liabilities and demonstrates that there was an appropriate level of matching at 30 June 2008. It may not always be possible to achieve a complete matching of asset and liability durations, partly because there is uncertainty over the receipt of all future premiums and partly because the duration of liabilities may exceed the duration of the longest available dated fixed interest investments.
Asset-backed securities and CDOs comprised US$249 million of the total US$69.3 billion of financial assets in Insurance; and in response to more difficult equity markets HSBC has reduced its exposure to equities by US$3.3 billion since 31 December 2007.
Models are used to assess the effect of a range of future scenarios on the values of financial assets and associated liabilities. The stresses applied include economic and non-economic factors. The economic stress tests include measuring the sensitivity of the asset and liability values to changes in equity prices and changes in interest rates. Non-economic stress tests include measuring the sensitivity of the liability values to mortality, lapse and expense rates. ALCOs consider the outcomes in determining the composition of assets supporting the customer liabilities.
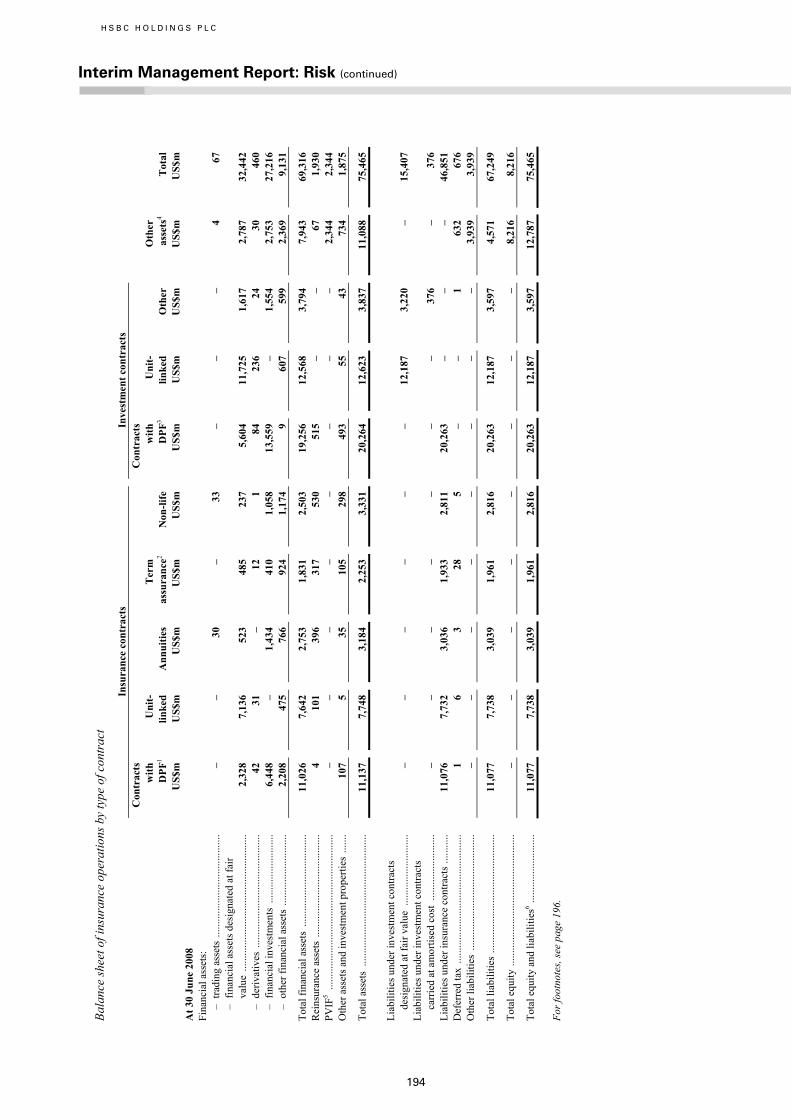
H S B C H O L D I N G S P L C
Interim Management Report: Risk (continued)
194
Bala
nce
shee
t of i
nsur
ance
ope
ratio
ns b
y ty
pe o
f con
trac
t
In
sura
nce
cont
ract
s
Inve
stm
ent c
ontr
acts
C
ontr
acts
w
ith
DPF
1
Uni
t-
linke
d
A
nnui
ties
Ter
m
assu
ranc
e2
Non
-life
Con
trac
ts
with
D
PF3
Uni
t-
linke
d
Oth
er
O
ther
as
sets
4
T
otal
US$
m
US$
m
US$
m
US$
m
US$
m
US$
m
US$
m
US$
m
US$
m
US$
m
At 3
0 Ju
ne 2
008
Fina
ncia
l ass
ets:
–
trad
ing
asse
ts ..
......
......
......
......
......
......
. –
– 30
–
33
– –
– 4
67
– fi
nanc
ial a
sset
s des
igna
ted
at fa
ir
valu
e ...
......
......
......
......
......
......
......
......
. 2,
328
7,13
6 52
3 48
5 23
7
5,60
4 11
,725
1,
617
2,78
7 32
,442
–
der
ivat
ives
.....
......
......
......
......
......
......
..
42
31
– 12
1
84
23
6 24
30
46
0 –
fina
ncia
l inv
estm
ents
....
......
......
......
....
6,44
8 –
1,43
4 41
0 1,
058
13
,559
–
1,55
4 2,
753
27,2
16
– o
ther
fina
ncia
l ass
ets
......
......
......
......
...
2,20
8 47
5 76
6 92
4 1,
174
9
607
599
2,36
9 9,
131
Tota
l fin
anci
al a
sset
s ...
......
......
......
......
......
..
11,0
26
7,64
2 2,
753
1,83
1 2,
503
19
,256
12
,568
3,
794
7,94
3 69
,316
R
eins
uran
ce a
sset
s ...
......
......
......
......
......
......
4
101
396
317
530
51
5 –
– 67
1,
930
PVIF
5 ....
......
......
......
......
......
......
......
......
......
. –
– –
– –
– –
– 2,
344
2,34
4 O
ther
ass
ets a
nd in
vest
men
t pro
perti
es ..
.....
10
7 5
35
105
298
49
3 55
43
73
4 1,
875
Tota
l ass
ets
......
......
......
......
......
......
......
......
..
11,1
37
7,74
8 3,
184
2,25
3 3,
331
20
,264
12
,623
3,
837
11,0
88
75,4
65
Li
abili
ties u
nder
inve
stm
ent c
ontra
cts
desi
gnat
ed a
t fai
r val
ue .
......
......
......
......
..
– –
– –
– –
12,1
87
3,22
0 –
15,4
07
Liab
ilitie
s und
er in
vest
men
t con
tract
s ca
rrie
d at
am
ortis
ed c
ost
......
......
......
......
. –
– –
– –
– –
376
– 37
6 Li
abili
ties u
nder
insu
ranc
e co
ntra
cts
......
.....
11
,076
7,
732
3,03
6 1,
933
2,81
1
20,2
63
– –
– 46
,851
D
efer
red
tax
......
......
......
......
......
......
......
......
. 1
6 3
28
5
– –
1 63
2 67
6 O
ther
liab
ilitie
s ...
......
......
......
......
......
......
.....
–
– –
– –
– –
– 3,
939
3,93
9
Tota
l lia
bilit
ies
......
......
......
......
......
......
......
...
11,0
77
7,73
8 3,
039
1,96
1 2,
816
20
,263
12
,187
3,
597
4,57
1 67
,249
Tota
l equ
ity ..
......
......
......
......
......
......
......
......
–
– –
– –
– –
– 8,
216
8,21
6
Tota
l equ
ity a
nd li
abili
ties6
......
......
......
......
..
11,0
77
7,73
8 3,
039
1,96
1 2,
816
20
,263
12
,187
3,
597
12,7
87
75,4
65
For f
ootn
otes
, see
pag
e 19
6.

195
In
sura
nce
cont
ract
s
Inve
stm
ent c
ontra
cts
C
ontra
cts
w
ith
D
PF1
Uni
t-
linke
d
A
nnui
ties
Term
assu
ranc
e2
Non
-life
Con
tract
s
with
DPF
3
Uni
t-
linke
d
Oth
er
O
ther
asse
ts4
To
tal
U
S$m
U
S$m
U
S$m
U
S$m
U
S$m
U
S$m
U
S$m
U
S$m
U
S$m
U
S$m
A
t 30
June
200
7
Fi
nanc
ial a
sset
s:
– tr
adin
g as
sets
.....
......
......
......
......
......
....
– –
46
– 41
–
– –
33
120
– fi
nanc
ial a
sset
s des
igna
ted
at fa
ir
valu
e ...
......
......
......
......
......
......
......
......
. 1,
851
4,13
8 55
9 69
3 44
6,
792
11,0
94
1,61
0 2,
686
29,4
67
– d
eriv
ativ
es ..
......
......
......
......
......
......
.....
–
349
– –
1 56
35
2 3
– 76
1 –
fina
ncia
l inv
estm
ents
....
......
......
......
....
4,94
9 –
1,25
3 38
8 1,
294
10,0
76
– 1,
412
2,71
2 22
,084
–
oth
er fi
nanc
ial a
sset
s ...
......
......
......
......
1,
504
304
419
197
704
616
409
633
1,23
6 6,
022
Tota
l fin
anci
al a
sset
s ...
......
......
......
......
......
..
8,30
4 4,
791
2,27
7 1,
278
2,08
4 17
,540
11
,855
3,
658
6,66
7 58
,454
R
eins
uran
ce a
sset
s ...
......
......
......
......
......
......
1
62
314
260
628
– –
– 54
1,
319
PVIF
5 ....
......
......
......
......
......
......
......
......
......
. –
– –
– –
– –
– 1,
909
1,90
9 O
ther
ass
ets a
nd in
vest
men
t pro
perti
es ..
.....
37
6
574
124
174
97
68
– 1,
357
2,43
7
Tota
l ass
ets
......
......
......
......
......
......
......
......
..
8,34
2 4,
859
3,16
5 1,
662
2,88
6 17
,637
11
,923
3,
658
9,98
7 64
,119
Liab
ilitie
s und
er in
vest
men
t con
tract
s de
sign
ated
at f
air v
alue
....
......
......
......
.....
–
– –
– –
– 11
,132
3,
389
– 14
,521
Li
abili
ties u
nder
inve
stm
ent c
ontra
cts
carr
ied
at a
mor
tised
cos
t ...
......
......
......
....
– –
– –
– –
– 26
8 –
268
Liab
ilitie
s und
er in
sura
nce
cont
ract
s ...
......
..
8,21
8 4,
854
3,02
6 98
9 2,
720
17,1
22
– –
– 36
,929
D
efer
red
tax
......
......
......
......
......
......
......
......
. –
– –
– –
– –
– 60
3 60
3 O
ther
liab
ilitie
s ...
......
......
......
......
......
......
.....
–
– –
– –
– –
– 4,
442
4,44
2
Tota
l lia
bilit
ies
......
......
......
......
......
......
......
...
8,21
8 4,
854
3,02
6 98
9 2,
720
17,1
22
11,1
32
3,65
7 5,
045
56,7
63
Tota
l equ
ity ..
......
......
......
......
......
......
......
......
–
– –
– –
– –
– 7,
356
7,35
6
Tota
l equ
ity a
nd li
abili
ties6
......
......
......
......
..
8,21
8 4,
854
3,02
6 98
9 2,
720
17,1
22
11,1
32
3,65
7 12
,401
64
,119
For f
ootn
otes
, see
pag
e 19
6.
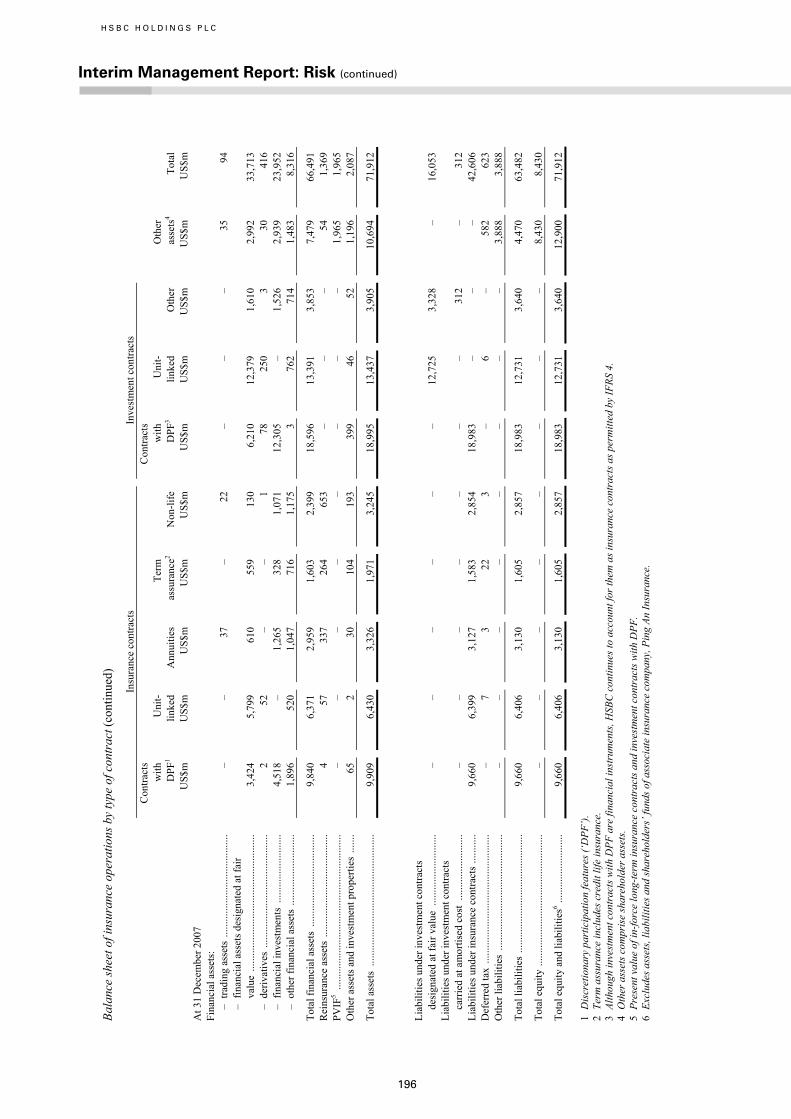
H S B C H O L D I N G S P L C
Interim Management Report: Risk (continued)
196
Bala
nce
shee
t of i
nsur
ance
ope
ratio
ns b
y ty
pe o
f con
trac
t (co
ntin
ued)
In
sura
nce
cont
ract
s
Inve
stm
ent c
ontra
cts
C
ontra
cts
w
ith
D
PF1
Uni
t-
linke
d
A
nnui
ties
Term
assu
ranc
e2
Non
-life
Con
tract
s
with
DPF
3
Uni
t-
linke
d
Oth
er
O
ther
asse
ts4
To
tal
U
S$m
U
S$m
U
S$m
U
S$m
U
S$m
U
S$m
U
S$m
U
S$m
U
S$m
U
S$m
A
t 31
Dec
embe
r 200
7
Fi
nanc
ial a
sset
s:
– tr
adin
g as
sets
.....
......
......
......
......
......
....
– –
37
– 22
–
– –
35
94
– fi
nanc
ial a
sset
s des
igna
ted
at fa
ir
valu
e ...
......
......
......
......
......
......
......
......
. 3,
424
5,79
9 61
0 55
9 13
0
6,21
0 12
,379
1,
610
2,99
2 33
,713
–
der
ivat
ives
.....
......
......
......
......
......
......
..
2 5
2 –
– 1
78
25
0 3
30
416
– fi
nanc
ial i
nves
tmen
ts .
......
......
......
......
. 4,
518
– 1,
265
328
1,07
1
12,3
05
– 1,
526
2,93
9 23
,952
–
oth
er fi
nanc
ial a
sset
s ...
......
......
......
......
1,
896
520
1,04
7 71
6 1,
175
3
762
714
1,48
3 8,
316
Tota
l fin
anci
al a
sset
s ...
......
......
......
......
......
..
9,84
0 6,
371
2,95
9 1,
603
2,39
9
18,5
96
13,3
91
3,85
3 7,
479
66,4
91
Rei
nsur
ance
ass
ets
......
......
......
......
......
......
...
4 57
33
7 26
4 65
3
– –
– 54
1,
369
PVIF
5 ....
......
......
......
......
......
......
......
......
......
. –
– –
– –
– –
– 1,
965
1,96
5 O
ther
ass
ets a
nd in
vest
men
t pro
perti
es ..
.....
65
2
30
104
193
39
9 46
52
1,
196
2,08
7
Tota
l ass
ets
......
......
......
......
......
......
......
......
..
9,90
9 6,
430
3,32
6 1,
971
3,24
5
18,9
95
13,4
37
3,90
5 10
,694
71
,912
Liab
ilitie
s und
er in
vest
men
t con
tract
s de
sign
ated
at f
air v
alue
....
......
......
......
.....
–
– –
– –
– 12
,725
3,
328
– 16
,053
Li
abili
ties u
nder
inve
stm
ent c
ontra
cts
carr
ied
at a
mor
tised
cos
t ...
......
......
......
....
– –
– –
– –
– 31
2 –
312
Liab
ilitie
s und
er in
sura
nce
cont
ract
s ...
......
..
9,66
0 6,
399
3,12
7 1,
583
2,85
4
18,9
83
– –
– 42
,606
D
efer
red
tax
......
......
......
......
......
......
......
......
. –
7 3
22
3
– 6
– 58
2 62
3 O
ther
liab
ilitie
s ...
......
......
......
......
......
......
.....
–
– –
– –
– –
– 3,
888
3,88
8
Tota
l lia
bilit
ies
......
......
......
......
......
......
......
...
9,66
0 6,
406
3,13
0 1,
605
2,85
7
18,9
83
12,7
31
3,64
0 4,
470
63,4
82
Tota
l equ
ity ..
......
......
......
......
......
......
......
......
–
– –
– –
– –
– 8,
430
8,43
0
Tota
l equ
ity a
nd li
abili
ties6 ..
......
......
......
......
9,
660
6,40
6 3,
130
1,60
5 2,
857
18
,983
12
,731
3,
640
12,9
00
71,9
12
1 D
iscr
etio
nary
par
ticip
atio
n fe
atur
es (‘
DPF
’).
2 Te
rm a
ssur
ance
incl
udes
cre
dit l
ife in
sura
nce.
3
Alth
ough
inve
stm
ent c
ontr
acts
with
DPF
are
fina
ncia
l ins
trum
ents
, HSB
C c
ontin
ues t
o ac
coun
t for
them
as i
nsur
ance
con
trac
ts a
s per
mitt
ed b
y IF
RS 4
. 4
Oth
er a
sset
s com
pris
e sh
areh
olde
r ass
ets.
5 Pr
esen
t val
ue o
f in-
forc
e lo
ng-te
rm in
sura
nce
cont
ract
s and
inve
stm
ent c
ontr
acts
with
DPF
. 6
Excl
udes
ass
ets,
liabi
litie
s and
shar
ehol
ders
’ fun
ds o
f ass
ocia
te in
sura
nce
com
pany
, Pin
g An
Insu
ranc
e.
197
Capital management and allocation
Capital management
HSBC’s capital management approach is driven by its strategy and organisational requirements, taking into account the regulatory and commercial environment in which it operates. The Group’s strategy underpins HSBC’s Capital Management Framework which has been approved by the Group Management Board. It is HSBC’s policy to maintain a strong capital base to support the development of its business and to meet regulatory capital requirements at all times. HSBC also maintains a strong discipline over its investment decisions and where it allocates its capital, seeking to ensure that returns on investment are appropriate after taking account of capital costs. In addition, the level of capital held by HSBC Holdings and certain subsidiaries, particularly HSBC Finance, is determined by rating targets.
HSBC’s strategy is to allocate capital to businesses based on their economic profit generation and, within this process, regulatory and economic capital requirements and the cost of capital are key factors. The responsibility for global capital allocation principles and decisions rests with the Group Management Board. Stress testing is used as an important mechanism in understanding the sensitivities of the core assumptions in the capital plans to the adverse impact of extreme, but plausible, events. Stress testing allows senior management to formulate management action in advance of conditions starting to reflect the stress scenarios identified. The Group has identified the following as being the material risks faced and managed through the Capital Management Framework; credit, market, operational, asset and liability management, pension, and insurance risks.
In June 2006, the Basel Committee on Banking Supervision (‘the Basel Committee’) published the final comprehensive version of ‘International Convergence of Capital Measurement and Capital Standards’ (‘Basel II’) which replaced Basel I. In 2008, as the Group operates under Basel II, it targets a tier 1 capital ratio within the range 7.5 to 9.0 per cent for the purposes of its long-term capital planning. In 2007, under the Basel I approach, HSBC managed its capital against a tier 1 ratio of 8.25 per cent.
HSBC recognises the effect on shareholder returns of the level of equity capital employed within the Group and seeks to maintain a prudent balance between the advantages and flexibility afforded by a strong capital position and the higher returns on equity that are possible with greater leverage.
The Capital Management Framework covers the different capital measures within which HSBC manages its capital in a consistent and aligned manner. These include the market capitalisation, invested capital, economic capital and regulatory capital. HSBC defines invested capital as the equity capital invested in HSBC by its shareholders. Economic capital is the capital requirement calculated internally by HSBC to support the risks to which it is exposed and is set at a confidence level consistent with a target credit rating of AA. Regulatory capital is the capital which HSBC is required to hold as determined by the rules established by the FSA for the consolidated Group and by HSBC’s local regulators for individual Group companies.
An annual Group capital plan is prepared and approved by the Board with the objective of maintaining both the optimal amount of capital and the mix between the different components of capital. The Group’s policy is to hold capital in a range of different forms and from diverse sources and all capital raising is agreed with major subsidiaries as part of their individual and the Group’s capital management processes. HSBC Holdings and its major subsidiaries raise non-equity tier 1 capital and subordinated debt in accordance with the Group’s guidelines on market and investor concentration, cost, market conditions, timing, effect on composition and maturity profile. During the recent market turmoil, HSBC’s access to the debt markets for such capital issuance has continued. The subordinated debt requirements of other HSBC companies are met internally.
Each subsidiary manages its own capital required to support planned business growth and meet local regulatory requirements within the context of the approved annual Group capital plan. As part of HSBC’s Capital Management Framework, capital generated in excess of planned requirements is returned to HSBC Holdings, normally by way of dividends.
HSBC Holdings is primarily a provider of equity capital to its subsidiaries. These investments are substantially funded by HSBC Holdings’ own capital issuance and profit retentions. HSBC Holdings seeks to maintain a prudent balance between the composition of its capital and that of its investment in subsidiaries.
Capital measurement and allocation
The FSA supervises HSBC on a consolidated basis and, as such, receives information on the capital adequacy of, and sets capital requirements for,

H S B C H O L D I N G S P L C
Interim Management Report: Risk (continued)
198
HSBC as a whole. Individual banking subsidiaries are directly regulated by their local banking supervisors, who set and monitor their capital adequacy requirements. Although HSBC calculates capital at a Group level using the Basel II framework, local regulators are at different stages of implementation and local rules may still be on a Basel I basis, notably in the US. In most jurisdictions, non-banking financial subsidiaries are also subject to the supervision and capital requirements of local regulatory authorities.
Further details regarding the calculation of capital adequacy under Basel I, including the constituent components of HSBC’s capital base, the various regulatory limits which apply to them and the categorisation of banking operations as trading or banking book for determining risk-weighted assets, are detailed in the Annual Report and Accounts 2007.
Basel II
The supervisory objectives of Basel II are to promote safety and soundness in the financial system and maintain at least the current overall level of capital in the system, enhance competitive equality, constitute a more comprehensive approach to addressing risks, and focus on internationally active banks. Basel II is structured around three ‘pillars’: minimum capital requirements, supervisory review process and market discipline. The Capital Requirements Directive (‘CRD’) implements Basel II in the EU and the FSA then gives effect to the CRD by including the requirements of the CRD in its own rulebooks.
Basel II provides three approaches of increasing sophistication to the calculation of pillar 1 credit risk capital requirements. The most basic, the standardised approach, requires banks to use external credit ratings to determine the risk weightings applied to rated counterparties, and groups other counterparties into broad categories and applies standardised risk weightings to these categories. The next level, the internal ratings-based (‘IRB’) foundation approach, allows banks to calculate their credit risk capital requirements on the basis of their internal assessment of the probability that a counterparty will default (‘PD’), but with quantification of exposure at default (‘EAD’) and loss given default estimates (‘LGD’) being subject to standard supervisory parameters. Finally, the IRB advanced approach allows banks to use their own internal assessment of not only PD but also the quantification of EAD and LGD. Expected losses are calculated by multiplying EAD by PD and LGD. The capital resources requirement under the IRB
approaches is intended to cover unexpected losses and is derived from a formula specified in the regulatory rules, which incorporates these factors and other variables such as maturity and correlation.
For credit risk, with FSA approval, HSBC has adopted the IRB advanced approach to Basel II for the majority of its business with effect from 1 January 2008, with the remainder on either IRB foundation or standardised approaches. A rollout plan is in place to extend coverage of the advanced approach over the next three years, leaving a small residue of exposures on the standardised approach.
Basel II also introduces capital requirements for operational risk and, again, contains three levels of sophistication. The capital required under the basic indicator approach is a simple percentage of gross revenues, whereas under the standardised approach it is one of three different percentages of gross revenues allocated to each of eight defined business lines. Finally, the advanced measurement approach uses banks’ own statistical analysis and modelling of operational risk data to determine capital requirements. HSBC has adopted the standardised approach to the determination of Group operational risk capital requirements.
The basis of calculating capital changed with effect from 1 January 2008 and the effect on both tier 1 capital and total capital is shown in the table below, ‘Capital Structure’. The Group’s capital base is reduced compared with Basel I by the extent to which expected losses exceed the total of individual and collective impairment allowances on IRB portfolios. These collective impairment allowances are no longer eligible for inclusion in tier 2 capital.
For disclosure purposes, this excess of expected losses over total impairment allowances in IRB portfolios is deducted 50 per cent from tier 1 and 50 per cent from tier 2 capital. In addition, a tax credit adjustment is made to tier 1 capital to reflect the tax consequences insofar as they affect the availability of tier 1 capital to cover risks or losses.
Expected losses derived under Basel II rules, represent losses that would be expected in the scenario of a severe downturn over a 12-month period. This definition differs from loan impairment allowances, which only address losses incurred within lending portfolios at the balance sheet date and are not permitted to recognise the additional level of conservatism that the regulatory measure requires through reflecting a downturn scenario. For rapidly revolving consumer credit portfolios such as credit cards, therefore, impairment allowances only capture some of the expected losses predicted over the next 12 months. These portfolios turn over three

199
to four times per year, and therefore a large proportion of expected losses relate to credit advances not made at the measurement date.
The effect of deducting the difference between expected losses and total impairment allowances is to equate the total effect on capital with the regulatory definition of expected losses. Because expected losses are based on long-term estimates and incorporate through-the-cycle considerations, it is not anticipated that they will be very volatile. The impact of this deduction, however, may vary from time to time as the accounting measure of impairment moves closer to or further away from the regulatory measure of expected losses.
The FSA’s rules permit the inclusion of profits in tier 1 capital to the extent that they have been verified in accordance with the FSA’s General Prudential Sourcebook by the external auditors. Verification procedures covering interim profits for the half year to 30 June 2008 were completed by the external auditor on 4 August 2008 and therefore these interim profits have been included in the Group’s 30 June 2008 tier 1 capital. Technically, from 1 January 2008, the FSA’s regulatory reporting forms defer the recognition of these profits in tier 1 capital until the conclusion of the external auditor’s procedures.
The second pillar of Basel II (Supervisory Review and Evaluation Process – ‘SREP’) involves both firms and regulators taking a view on whether a firm should hold additional capital against risks not covered in pillar 1. Part of the pillar 2 process is the
Internal Capital Adequacy Assessment Process (‘ICAAP’) which is the firm’s self assessment of risks not captured by pillar 1. The pillar 2 process culminates with the FSA providing firms with Individual Capital Guidance (‘ICG’). The ICG replaces the trigger ratio and is set as a capital resources requirement higher than that required under pillar 1, generally by a specified percentage.
Pillar 3 of Basel II is related to market discipline and aims to make firms more transparent by requiring them to publish specific, prescribed details of their risks, capital and risk management under the Basel II framework. HSBC will publish qualitative pillar 3 disclosures on its investor relations internet site later in 2008, with the first full set of pillar 3 disclosures, including quantitative tables, being made for 31 December 2008 during the first half of 2009.
For individual banking subsidiaries, the timing and manner of implementing Basel II varies by jurisdiction according to requirements set by local banking supervisors. Applying Basel II across HSBC’s geographically diverse businesses, which operate in a large number of different regulatory environments, presents a significant logistical and technological challenge, involving an extensive programme of implementation. Basel II allows local regulators to exercise discretion in a number of areas. The extent to which their requirements diverge, coupled with how the FSA and the local regulators in the other countries in which HSBC operates interact, are key factors in completing implementation of Basel II locally.
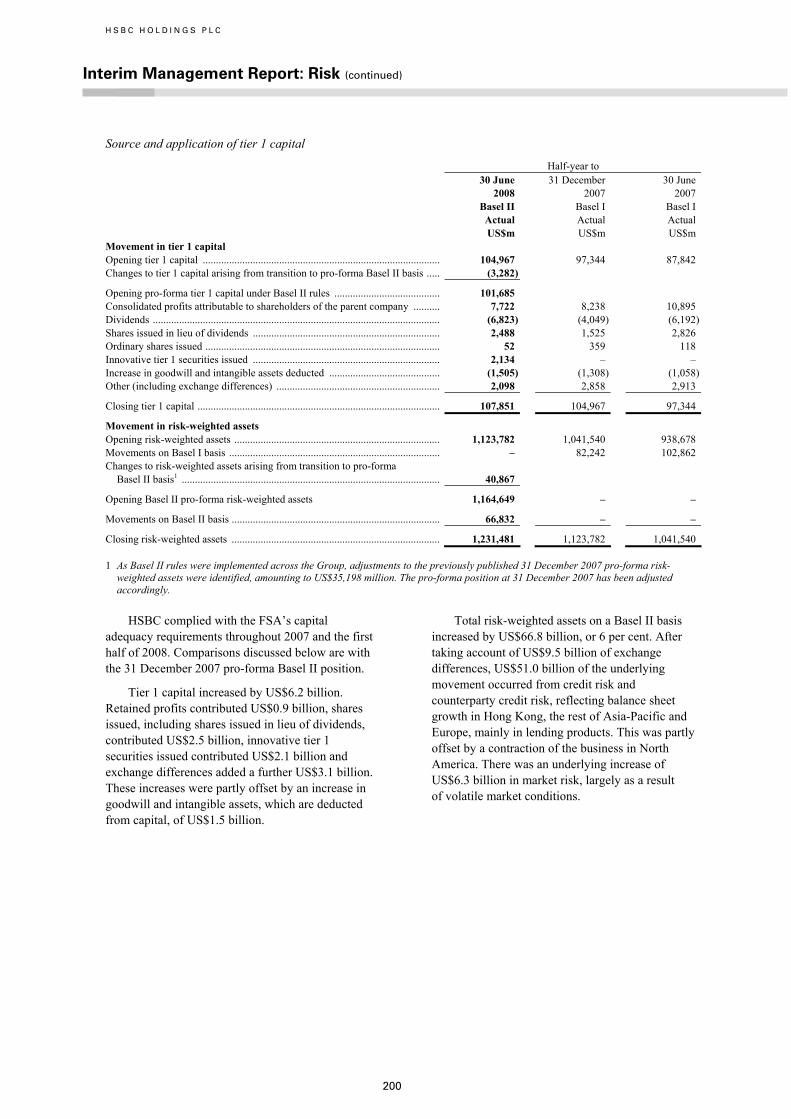
H S B C H O L D I N G S P L C
Interim Management Report: Risk (continued)
200
Source and application of tier 1 capital
Half-year to 30 June 2008
31 December 2007
30 June 2007
Basel II Basel I Basel I Actual Actual Actual US$m US$m US$m
Movement in tier 1 capital Opening tier 1 capital .......................................................................................... 104,967 97,344 87,842 Changes to tier 1 capital arising from transition to pro-forma Basel II basis ..... (3,282)
Opening pro-forma tier 1 capital under Basel II rules ........................................ 101,685 Consolidated profits attributable to shareholders of the parent company .......... 7,722 8,238 10,895 Dividends ............................................................................................................. (6,823) (4,049) (6,192)Shares issued in lieu of dividends ....................................................................... 2,488 1,525 2,826 Ordinary shares issued ......................................................................................... 52 359 118 Innovative tier 1 securities issued ....................................................................... 2,134 – – Increase in goodwill and intangible assets deducted .......................................... (1,505) (1,308) (1,058)Other (including exchange differences) .............................................................. 2,098 2,858 2,913
Closing tier 1 capital ............................................................................................ 107,851 104,967 97,344
Movement in risk-weighted assets Opening risk-weighted assets .............................................................................. 1,123,782 1,041,540 938,678 Movements on Basel I basis ................................................................................ – 82,242 102,862 Changes to risk-weighted assets arising from transition to pro-forma
Basel II basis1 .................................................................................................. 40,867
Opening Basel II pro-forma risk-weighted assets 1,164,649 – –
Movements on Basel II basis ............................................................................... 66,832 – –
Closing risk-weighted assets ............................................................................... 1,231,481 1,123,782 1,041,540
1 As Basel II rules were implemented across the Group, adjustments to the previously published 31 December 2007 pro-forma risk-weighted assets were identified, amounting to US$35,198 million. The pro-forma position at 31 December 2007 has been adjusted accordingly.
HSBC complied with the FSA’s capital adequacy requirements throughout 2007 and the first half of 2008. Comparisons discussed below are with the 31 December 2007 pro-forma Basel II position.
Tier 1 capital increased by US$6.2 billion. Retained profits contributed US$0.9 billion, shares issued, including shares issued in lieu of dividends, contributed US$2.5 billion, innovative tier 1 securities issued contributed US$2.1 billion and exchange differences added a further US$3.1 billion. These increases were partly offset by an increase in goodwill and intangible assets, which are deducted from capital, of US$1.5 billion.
Total risk-weighted assets on a Basel II basis increased by US$66.8 billion, or 6 per cent. After taking account of US$9.5 billion of exchange differences, US$51.0 billion of the underlying movement occurred from credit risk and counterparty credit risk, reflecting balance sheet growth in Hong Kong, the rest of Asia-Pacific and Europe, mainly in lending products. This was partly offset by a contraction of the business in North America. There was an underlying increase of US$6.3 billion in market risk, largely as a result of volatile market conditions.

201
Capital structure
30 June 2008
31 December 2007
31 December 2007
30 June 2007
Basel II Basel II Basel I Basel I Actual Pro-forma1 Actual Actual US$m US$m US$m US$m
Composition of regulatory capital Tier 1 capital
Shareholders’ equity2 ............................................... 126,785 128,160 128,160 119,780 Minority interests ..................................................... 4,076 4,059 4,059 3,542 Preference shares ..................................................... 2,170 2,181 2,181 2,126 Adjustment for: Goodwill capitalised and intangible assets .............. (40,360) (38,855) (38,855) (37,547)Unrealised losses on available-for-sale debt
securities3 ............................................................. 9,075 2,445 2,445 265 Other regulatory adjustments4,5 ................................ (3,086) (2,309) (3,535) (696)Excess of expected losses over impairment
allowances ............................................................ (3,490) (4,508) – –
Core tier 1 capital ..................................................... 95,170 91,173 94,455 87,470
Innovative tier 1 securities ....................................... 12,681 10,512 10,512 9,874
Total tier 1 capital .................................................... 107,851 101,685 104,967 97,344
Tier 2 capital Reserves arising from revaluation of property and
unrealised gains on available-for-sale equities .... 2,768 4,393 4,393 3,653 Collective impairment allowances6 .......................... 3,564 2,176 14,047 11,735 Perpetual subordinated debt ..................................... 3,113 3,114 3,114 3,387 Term subordinated debt ............................................ 44,036 37,658 37,658 30,901 Minority and other interests in tier 2 capital ............ 300 300 300 425
Total qualifying tier 2 capital before deductions ..... 53,781 47,641 59,512 50,101
Unconsolidated investments7 ................................... (11,183) (11,092) (11,092) (9,883)Excess of expected losses over impairment
allowances ............................................................ (3,490) (4,508) – – Other deductions ...................................................... (9) (747) (747) (520)
Total deductions other than from tier 1 capital ........ (14,682) (16,347) (11,839) (10,403)
Total regulatory capital ................................................. 146,950 132,979 152,640 137,042
Risk-weighted assets Credit and counterparty risk ......................................... 1,071,482 1,011,343 – – Market risk .................................................................... 52,533 45,840 – – Operational risk ............................................................ 107,466 107,466 – – Banking book ................................................................ – – 1,020,747 949,958 Trading book ................................................................. – – 103,035 91,582
Total .............................................................................. 1,231,481 1,164,649 1,123,782 1,041,540 % % % % Capital ratios Core tier 1 ratio ............................................................. 7.7 7.8 8.4 8.4 Tier 1 ratio .................................................................... 8.8 8.7 9.3 9.3 Total capital ratio .......................................................... 11.9 11.4 13.6 13.2
1 As Basel II rules were implemented across the Group, adjustments to the previously published 31 December 2007 pro-forma risk-weighted assets were identified, amounting to US$35,198 million. The pro-forma position at 31 December 2007 has been adjusted accordingly.
2 Includes externally verified profits for the half year to 30 June 2008. 3 Under FSA rules, unrealised gains/losses on debt securities net of deferred tax must be excluded from capital resources. 4 Includes removal of the fair value gains and losses, net of deferred tax, arising from the credit spreads on debt issued by HSBC Holdings
and its subsidiaries and designated at fair value. 5 Includes a tax credit adjustment in respect of the excess of expected losses over impairment allowances. 6 Under Basel II, only collective impairment allowances on loan portfolios on the standardised approach are included in tier 2 capital. 7 Mainly comprise investments in insurance entities.

H S B C H O L D I N G S P L C
Interim Management Report: Risk (continued)
202
Risk-weighted assets by principal subsidiary
The table below shows the contribution to Group total risk-weighted assets arising from each principal
subsidiary on an FSA basis and excluding intra-HSBC items.
Risk-weighted assets by principal subsidiary
30 June 2008
31 December 2007
30 June 2007
Basel II Basel I Basel I Actual Actual Actual US$m US$m US$m
Risk-weighted assets The Hongkong and Shanghai Banking Corporation ............................................... 263,127 256,761 249,394 Hang Seng Bank ...................................................................................................... 48,199 55,043 60,263
The Hongkong and Shanghai Banking Corporation and other subsidiaries ...... 214,928 201,718 189,131
HSBC Bank ............................................................................................................. 441,186 423,941 380,870 HSBC Private Banking Holdings (Suisse) .......................................................... 25,501 32,942 30,616HSBC France ....................................................................................................... 80,571 76,188 65,054HSBC Bank and other subsidiaries ..................................................................... 335,114 314,811 285,200
HSBC North America .............................................................................................. 374,017 336,998 326,248 HSBC Finance ..................................................................................................... 187,762 135,757 140,859HSBC Bank Canada ............................................................................................ 34,950 50,659 43,617HSBC Bank USA and other subsidiaries ............................................................ 151,305 150,582 141,772
HSBC Mexico .......................................................................................................... 22,615 18,513 16,770 HSBC Bank Middle East ......................................................................................... 34,681 25,226 21,097 HSBC Bank Malaysia .............................................................................................. 11,745 8,601 7,764 HSBC Brazil ............................................................................................................ 35,301 27,365 22,009 HSBC Bank Panama ................................................................................................ 10,178 7,824 6,696 Bank of Bermuda ..................................................................................................... 4,230 4,133 4,611 Other ........................................................................................................................ 34,401 14,420 6,081
1,231,481 1,123,782 1,041,540
H S B C H O L D I N G S P L C
Board of Directors and Senior Management
203
Directors
S K Green, Group Chairman
Age 59. An executive Director since 1998; Group Chief Executive from 2003 to 2006. Joined HSBC in 1982. Chairman of HSBC Bank plc, HSBC North America Holdings Inc. and HSBC Private Banking Holdings (Suisse) SA. A Director of HSBC France and The Hongkong and Shanghai Banking Corporation Limited. Group Treasurer from 1992 to 1998. Executive Director, Corporate, Investment Banking and Markets from 1998 to 2003. Chairman of The British Bankers’ Association.
M F Geoghegan, CBE, Group Chief Executive
Age 54. An executive Director since 2004. Joined HSBC in 1973. Chairman of the Group Management Board. Chairman of HSBC Bank USA, N.A., HSBC Bank Canada, HSBC Latin America Holdings (UK) Limited and HSBC USA Inc. Deputy Chairman of HSBC Bank plc. A Director of The Hongkong and Shanghai Banking Corporation Limited, HSBC National Bank USA and HSBC North America Holdings Inc. President of HSBC Bank Brasil S.A.-Banco Múltiplo from 1997 to 2003 and responsible for all of HSBC’s business throughout South America from 2000 to 2003. Chief Executive of HSBC Bank plc from 2004 to 2006. A non-executive Director and Chairman of Young Enterprise.
† S A Catz
Age 46. President and Chief Financial Officer of Oracle Corporation. A non-executive Director since 1 May 2008. Managing Director of Donaldson, Lufkin & Jenrette from 1997 to 1999. Joined Oracle in 1999 and appointed to the Board of Directors in 2001.
V H C Cheng, OBE
Age 60. Chairman of The Hongkong and Shanghai Banking Corporation Limited. An executive Director since 1 February 2008. Chairman of HSBC Bank (China) Company Limited and HSBC Global Asset Management (Hong Kong) Limited and a Director of HSBC Bank Australia Limited. Joined HSBC in 1978. Appointed a Group General Manager in 1995 and a Group Managing Director in 2005. A Director of Great Eagle Holdings Limited and a Member of the Exchange Fund Advisory Committee of the Hong Kong Monetary Authority. Vice Chairman of the China Banking Association from 10 December 2007. Appointed a member of the National Committee of the 11th Chinese People’s Political
Consultative Conference (‘CPPCC’), and a senior adviser to the 11th Beijing Municipal Committee of the CPPCC. Deputy Chairman and Chief Executive Officer of Hang Seng Bank Limited from 1998 to 2005. A Director of Swire Pacific Limited from 2005 to January 2008.
† J D Coombe Age 63. Non-executive Chairman of Hogg Robinson Group plc. A non-executive Director since 2005. A member of the Group Audit Committee and of the Remuneration Committee. A non-executive Director of Home Retail Group plc. A trustee of the Royal Academy Trust. Former executive Director and Chief Financial Officer of GlaxoSmithKline plc and a former member of the Supervisory Board of Siemens AG. A former Chairman of The Hundred Group of Finance Directors and a former member of the Accounting Standards Board.
† J L Durán Age 43. Chief Executive of Carrefour SA and Chairman of its Management Board of Directors. A non-executive Director since 1 January 2008. Joined Carrefour SA in 1991. Chief Financial Officer and Managing Director, Organisation and Systems of Carrefour SA from 2001 to 2005.
† R A Fairhead
Age 46. Chief Executive Officer and Director of Financial Times Group Limited and a Director of Pearson plc. Chairman of Interactive Data Corporation. A non-executive Director since 2004. Chairman of the Group Audit Committee and a member of the Nomination Committee. A non-executive Director of The Economist Newspaper Limited. Finance Director of Pearson plc from 2002 to 2006. Former Executive Vice President, Strategy and Group Control of Imperial Chemical Industries plc.
D J Flint, CBE, Group Finance Director
Age 53. Joined HSBC as an executive Director in 1995. Chairman of HSBC Finance Corporation and a Director of HSBC North America Holdings Inc. A non-executive Director of BP p.l.c. and a member of the Consultative Committee of the Large Business Advisory Board of HM Revenue & Customs and the Business Government Forum on Tax and Globalisation. Co-Chairman of the Counterparty Risk Management Policy Group III. Chaired the Financial Reporting Council’s review of the Turnbull Guidance on Internal Control. Served on

H S B C H O L D I N G S P L C
Board of Directors and Senior Management (continued)
204
the Accounting Standards Board and the Standards Advisory Council of the International Accounting Standards Board from 2001 to 2004. A former partner in KPMG.
A A Flockhart, CBE Age 56. Chief Executive Officer of The Hongkong and Shanghai Banking Corporation Limited and Global Head of Commercial Banking. An executive Director since 1 May 2008. Joined HSBC in 1974. A Director of Hang Seng Bank Limited, HSBC Bank Australia Limited and HSBC Bank (China) Company Limited and Chairman of HSBC Bank Malaysia Berhad. Managing Director of The Saudi British Bank from 1997 to 1999 and Senior Executive Vice-President, Commercial Banking, HSBC Bank USA, N.A. from 1999 to 2002. Chief Executive Officer, Mexico from 2002 to 2006. President and Group Managing Director Latin America and the Caribbean from 2006 to July 2007. Appointed a Group General Manager in 2002 and a Group Managing Director in 2006.
* W K L Fung, OBE
Age 59. Group Managing Director of Li & Fung Limited. A non-executive Director since 1998. Chairman of the Corporate Sustainability Committee. Deputy Chairman of The Hongkong and Shanghai Banking Corporation Limited. A non-executive Director of Integrated Distribution Services Group Limited, Convenience Retail Asia Limited and an independent non-executive Director of Shui On Land Limited and VTech Holdings Limited. A former non-executive Director of Bank of Communications Co. Ltd. Former Chairman of the Hong Kong General Chamber of Commerce, the Hong Kong Exporters’ Association and the Hong Kong Committee for the Pacific Economic Co-operation Council.
S T Gulliver
Age 49. Chief Executive of Global Banking and Markets and HSBC Global Asset Management. An executive Director since 1 May 2008. Joined HSBC in 1980. A Director of HSBC Bank plc, HSBC North America Holdings Inc., HSBC Private Banking Holdings (Suisse) SA and The Hongkong and Shanghai Banking Corporation Limited. Deputy Chairman and member of the Supervisory Board of HSBC Trinkaus & Burkhardt AG. Head of Treasury and Capital Markets in Asia-Pacific from 1996 to 2002. Head of Global Markets from 2002 to 2003 and Co-Head of Global Banking and Markets from 2003 to 2006. Appointed a Group General Manager in 2000 and a Group Managing Director in 2004.
† J W J Hughes-Hallett
Age 58. Chairman of John Swire & Sons Limited. A non-executive Director since 2005. A member of the Group Audit Committee and of the Nomination Committee. A non-executive Director of The Hongkong and Shanghai Banking Corporation Limited from 1999 to 2004. A non-executive Director and formerly Chairman of Cathay Pacific Airways Limited and Swire Pacific Limited. A director of China Festival 2008. A trustee of the Dulwich Picture Gallery and the Esmée Fairbairn Foundation. A member of The Hong Kong Association and of the Governing Body of the School of Oriental and African Studies, University of London and of the Governing Board of the Courtauld Institute of Art.
† W S H Laidlaw
Age 52. Chief Executive Officer of Centrica plc. A non-executive Director since 1 January 2008. A member of the Remuneration Committee. President and Chief Operating Officer of Amerada Hess Corporation from 1995 to 2001. Chief Executive Officer of Enterprise Oil plc from 2001 to 2002. Executive Vice President of Chevron Corporation from 2003 to 2006, and a former independent non-executive Director of Hanson PLC.
† Sir Mark Moody-Stuart, KCMG
Age 67. Chairman of Anglo American plc. A non-executive Director since 2001. Chairman of the Remuneration Committee and a member of the Corporate Sustainability Committee. A non-executive Director of Accenture Limited and Saudi Aramco. President of the Liverpool School of Tropical Medicine. Chairman of the Global Business Coalition on HIV/AIDS and the Global Compact Foundation. A former Director and Chairman of The ‘Shell’ Transport and Trading Company, plc and former Chairman of the Committee of Managing Directors of the Royal Dutch/Shell Group of Companies. A former Governor of Nuffield Hospitals.
† G Morgan
Age 62. Non-executive chairman of SNC-Lavalin Group Inc. A non-executive Director since 2006. A member of the Remuneration Committee. A member of the Board of Trustees of The Fraser Institute and the Energy Advisory Board of Accenture Limited. A non-executive Director of HSBC Bank Canada from 1996 to 2006. Former Founding President, Chief Executive Officer and Vice Chairman of EnCana Corporation. A former Director of Alcan Inc.

205
† N R N Murthy, CBE
Age 61. Chairman and Chief Mentor and former Chief Executive Officer of Infosys Technologies Limited. A non-executive Director since 1 May 2008. An independent non-executive Director of Unilever plc and New Delhi Television Limited and a Director of the United Nations Foundation. A former independent non-executive Director of DBS Group Holdings Limited and DBS Bank Limited.
† S W Newton
Age 66. Chairman of The Real Return Group Limited. A non-executive Director since 2002. A member of the Group Audit Committee. A member of the Investment Committee of The Wellcome Trust and the Investment Board of Cambridge University. A Council Member of Imperial College, London, and Chairman of the committee advising the Council on the College Fund. An adviser to the Investment Committee of the Royal Marsden NHS Foundation Trust.
† S M Robertson, Senior Independent Non-Executive Director
Age 67. Non-executive Chairman of Rolls-Royce Group plc and the founder member of Simon Robertson Associates LLP. A non-executive Director since 2006 and senior independent non-executive Director since May 2007. A member of the Nomination Committee. A non-executive Director of Berry Bros. & Rudd Limited, The Economist Newspaper Limited and Royal Opera House, Covent Garden Limited. Chairman of Trustees of the Ernest Kleinwort Charitable Trust. A trustee of the Eden Project Trust and of the Royal Opera House Endowment Fund. A former Managing Director of Goldman Sachs International. Former Chairman of Dresdner Kleinwort Benson and a former non-executive Director of Inchcape plc, Invensys plc and the London Stock Exchange plc.
† Sir Brian Williamson, CBE Age 63. Chairman of Electra Private Equity plc. A non-executive Director since 2002. Chairman of the Nomination Committee. A Director of NYSE Euronext and Climate Exchange plc. A senior adviser to Fleming Family and Partners. Former Chairman of London International Financial Futures and Options Exchange, Gerrard Group plc and Resolution Life Group Limited. A former non-executive Director of Resolution plc, the Financial Services Authority and the Court of The Bank of Ireland.
Adviser to the Board
D J Shaw
Age 62. An Adviser to the Board since 1998. Solicitor. A partner in Norton Rose from 1973 to 1998. A Director of The Bank of Bermuda Limited and HSBC Private Banking Holdings (Suisse) SA. A non-executive Director of Kowloon Development Company Limited and Shui On Land Limited.
Secretary
R G Barber
Age 57. Group Company Secretary. Appointed a Group General Manager in 2006. Joined HSBC in 1980. Company Secretary of HSBC Holdings plc since 1990. Chairman of the Disclosure Committee. A member of the Listing Authority Advisory Committee of the Financial Services Authority and of the Primary Markets Group of the London Stock Exchange. Corporation Secretary of The Hongkong and Shanghai Banking Corporation Limited from 1986 to 1992 and Company Secretary of HSBC Bank plc from 1994 to 1996.
* Non-executive Director † Independent non-executive Director
Group Managing Directors
A Almeida
Age 52. Group Head of Human Resources. A Group Managing Director since 25 February 2008. Joined HSBC in 1992. Appointed a Group General Manager in June 2007. Global Head of Human Resources for Global Banking and Markets, Group Private Banking, Global Transaction Banking and HSBC Amanah, from 1996 to June 2007.
E Alonso
Age 53. Group Managing Director and Head of HSBC Latin America and the Caribbean. A Group Managing Director since 1 May 2008. Joined HSBC in 1997. Appointed a Group General Manager in 2006. Chairman Grupo Financiero HSBC, S.A. de C.V. and HSBC México, S.A., Institución de Banca Múltiple, Grupo Financiero HSBC. Deputy Chief Executive of HSBC Investment Bank Brasil S.A. Banco de Investimento. Director of HSBC Argentina Holdings S.A. and HSBC Bank Brasil S.A.-Banco Múltiplo. Managing Director of HSBC (Brasil) Administradora de Consorcio Ltda and HSBC Serviços e Participaçoes Ltda. President of the Board of Directors of HSBC Bank (Panamá) S.A.
H S B C H O L D I N G S P L C
Board of Directors and Senior Management (continued)
206
C C R Bannister
Age 49. Group Managing Director, Insurance. A Group Managing Director since 2006. Joined HSBC in 1994. Appointed a Group General Manager in 2001. Chairman of HSBC Insurance Holdings Limited. Deputy Chief Executive Officer, HSBC Securities (USA) Inc. from 1996 to 1997 and Chief Executive Officer, Group Private Banking from 1998 to 2006.
D H Hodgkinson
Age 57. Group Chief Operating Officer. A Group Managing Director since 2006. Chairman of HSBC Bank Middle East Limited and HSBC Bank A.S. Director of HSBC Bank Egypt S.A.E., The Bank of Bermuda Limited and a member of the Supervisory Board of HSBC Trinkaus & Burkhardt AG. A Director of The Saudi British Bank Limited. Joined HSBC in 1969. Appointed a Group General Manager in 2003. Managing Director of The Saudi British Bank Limited from 1999 to 2003. Deputy Chairman and Chief Executive of HSBC Bank Middle East Limited from 2003 to 2006.
A C Hungate
Age 41. Global Head of Personal Financial Services and Marketing. Joined HSBC as a Group Managing Director in September 2007. Formerly Managing Director, Asia Pacific at Reuters. Worldwide Chief Marketing Officer of Reuters between 2002 and 2005.
D D J John
Age 58. Deputy Chairman and Chief Executive, HSBC Bank plc. A Group Managing Director since 2006. Joined HSBC Bank plc in 1971. Appointed a Group General Manager in 2000. Deputy Chairman and Chief Executive Officer, HSBC Bank Malaysia Berhad from 1999 to 2002. Chief Operating Officer of HSBC Bank plc from 2003 to 2005 and Deputy Chief Executive from 2005 to 2006.
B P McDonagh
Age 50. Chief Executive Officer, HSBC North America Holdings Inc. A Group Managing Director since 21 February 2008. Joined HSBC in 1979. Appointed a Group General Manager in 2005. Director of HSBC Bank Canada, HSBC Finance Corporation, HSBC Latin America Holdings (UK) Limited and HSBC North America Holdings Inc. Chief Executive Officer, HSBC Finance Corporation and Chief Operating Officer, HSBC North America Holdings Inc. from 2007 to 21 February 2008. Chief Operating Officer, HSBC Bank USA from 2004 to 2006.
Y A Nasr
Age 53. Group Managing Director, Strategic Investments. Deputy Chairman and Chief Executive of HSBC Bank Middle East Limited. A Group Managing Director since 2004. Joined HSBC in 1976. Deputy Chairman of HSBC Bank Egypt S.A.E. and a Director of HSBC Private Banking Holdings (Suisse) SA. Appointed a Group General Manager in 1998. President and Chief Executive Officer of HSBC Bank Canada from 1997 to 1999. President and Chief Executive Officer of HSBC USA Inc. and HSBC Bank USA from 1999 to 2003. President, HSBC Bank Brasil S.A.-Banco Múltiplo from 2003 to 2006.
B Robertson
Age 54. Group Chief Risk Officer. A Group Managing Director since 25 February 2008. Joined HSBC in 1975. Appointed a Group General Manager in 2003. Head of Global Banking and Markets for North America from 2003 to 2005. Group General Manager, Group Credit and Risk from 2005 to September 2007.
P A Thurston
Age 54. Managing Director, UK Banking. A Group Managing Director since 1 May 2008. Joined HSBC in 1975. Appointed a Group General Manager in 2003. A Director of HSBC Bank plc since 1 June 2008. Chairman of Grupo Financiero HSBC, S.A. de C.V. and of HSBC México, S.A., Institución de Banca Múltiple, Grupo Financiero HSBC from July 2007 to 22 April 2008.
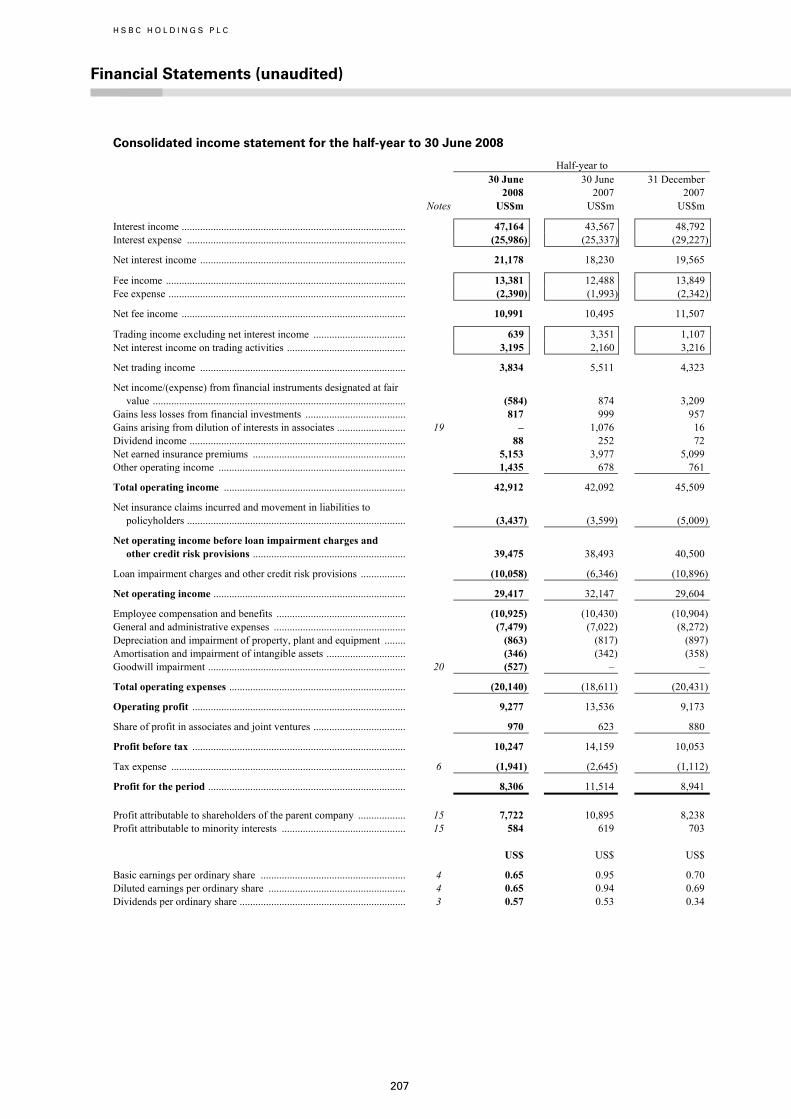
H S B C H O L D I N G S P L C
Financial Statements (unaudited)
207
Consolidated income statement for the half-year to 30 June 2008
Half-year to
30 June 2008
30 June 2007
31 December 2007
Notes US$m US$m US$m
Interest income ..................................................................................... 47,164 43,567 48,792Interest expense ................................................................................... (25,986) (25,337) (29,227)
Net interest income .............................................................................. 21,178 18,230 19,565
Fee income ........................................................................................... 13,381 12,488 13,849Fee expense .......................................................................................... (2,390) (1,993) (2,342)
Net fee income ..................................................................................... 10,991 10,495 11,507
Trading income excluding net interest income ................................... 639 3,351 1,107Net interest income on trading activities ............................................. 3,195 2,160 3,216
Net trading income .............................................................................. 3,834 5,511 4,323
Net income/(expense) from financial instruments designated at fair value ................................................................................................ (584) 874 3,209
Gains less losses from financial investments ...................................... 817 999 957 Gains arising from dilution of interests in associates .......................... 19 – 1,076 16 Dividend income .................................................................................. 88 252 72 Net earned insurance premiums .......................................................... 5,153 3,977 5,099 Other operating income ....................................................................... 1,435 678 761
Total operating income ..................................................................... 42,912 42,092 45,509
Net insurance claims incurred and movement in liabilities to policyholders ................................................................................... (3,437) (3,599) (5,009)
Net operating income before loan impairment charges and other credit risk provisions .......................................................... 39,475 38,493 40,500
Loan impairment charges and other credit risk provisions ................. (10,058) (6,346) (10,896)
Net operating income ......................................................................... 29,417 32,147 29,604
Employee compensation and benefits ................................................. (10,925) (10,430) (10,904)General and administrative expenses .................................................. (7,479) (7,022) (8,272)Depreciation and impairment of property, plant and equipment ........ (863) (817) (897)Amortisation and impairment of intangible assets .............................. (346) (342) (358)Goodwill impairment ........................................................................... 20 (527) – –
Total operating expenses ................................................................... (20,140) (18,611) (20,431)
Operating profit ................................................................................. 9,277 13,536 9,173
Share of profit in associates and joint ventures ................................... 970 623 880
Profit before tax ................................................................................. 10,247 14,159 10,053
Tax expense ......................................................................................... 6 (1,941) (2,645) (1,112)
Profit for the period ........................................................................... 8,306 11,514 8,941 Profit attributable to shareholders of the parent company .................. 15 7,722 10,895 8,238 Profit attributable to minority interests ............................................... 15 584 619 703 US$ US$ US$
Basic earnings per ordinary share ....................................................... 4 0.65 0.95 0.70 Diluted earnings per ordinary share .................................................... 4 0.65 0.94 0.69 Dividends per ordinary share ............................................................... 3 0.57 0.53 0.34

H S B C H O L D I N G S P L C
Financial Statements (unaudited) (continued)
208
Consolidated balance sheet at 30 June 2008
At 30 June
At 30 June
At 31 December
2008 2007 2007 Notes US$m US$m US$m ASSETS Cash and balances at central banks ..................................................... 13,473 16,651 21,765 Items in the course of collection from other banks ............................. 16,719 23,152 9,777 Hong Kong Government certificates of indebtedness ........................ 14,378 12,947 13,893 Trading assets ...................................................................................... 7 473,537 424,645 445,968 Financial assets designated at fair value ............................................. 8 40,786 34,849 41,564 Derivatives ........................................................................................... 9 260,664 149,181 187,854 Loans and advances to banks .............................................................. 256,981 214,645 237,366 Loans and advances to customers ....................................................... 1,049,200 928,101 981,548 Financial investments ......................................................................... 10 274,750 233,001 283,000 Interests in associates and joint ventures ............................................. 11,259 8,583 10,384 Goodwill and intangible assets ............................................................ 40,814 38,445 39,689 Property, plant and equipment ............................................................. 15,713 14,982 15,694 Other assets .......................................................................................... 11 52,670 30,164 39,493 Current tax asset .................................................................................. 1,443 675 896 Deferred tax asset ................................................................................ 6,490 3,327 5,284 Prepayments and accrued income ....................................................... 17,801 17,093 20,091
Total assets ........................................................................................... 2,546,678 2,150,441 2,354,266 LIABILITIES AND EQUITY Liabilities Hong Kong currency notes in circulation ........................................... 14,378 12,947 13,893 Deposits by banks ................................................................................ 154,152 128,773 132,181 Customer accounts ............................................................................... 1,161,923 980,832 1,096,140 Items in the course of transmission to other banks ............................. 15,329 20,339 8,672 Trading liabilities ................................................................................. 12 340,611 313,193 314,580 Financial liabilities designated at fair value ........................................ 13 89,758 75,966 89,939 Derivatives ........................................................................................... 9 251,357 144,284 183,393 Debt securities in issue ........................................................................ 230,267 229,239 246,579 Retirement benefit liabilities ............................................................... 3,619 2,984 2,893 Other liabilities .................................................................................... 48,435 31,937 35,013 Current tax liability .............................................................................. 3,082 2,563 2,559 Liabilities under insurance contracts ................................................... 46,851 36,929 42,606 Accruals and deferred income ............................................................. 17,592 16,857 21,766 Provisions ............................................................................................. 1,872 1,603 1,958 Deferred tax liability ............................................................................ 1,924 2,000 1,859 Subordinated liabilities ........................................................................ 31,517 23,504 24,819
Total liabilities ..................................................................................... 2,412,667 2,023,950 2,218,850 Equity Called up share capital ......................................................................... 6,003 5,857 5,915 Share premium account ....................................................................... 8,097 7,834 8,134 Other equity instruments ..................................................................... 2,134 – – Other reserves ...................................................................................... 27,561 31,838 33,014 Retained earnings ................................................................................. 82,990 74,251 81,097
Total shareholders’ equity ................................................................... 126,785 119,780 128,160 Minority interests ................................................................................. 7,226 6,711 7,256
Total equity .......................................................................................... 15 134,011 126,491 135,416
Total equity and liabilities ................................................................... 2,546,678 2,150,441 2,354,266
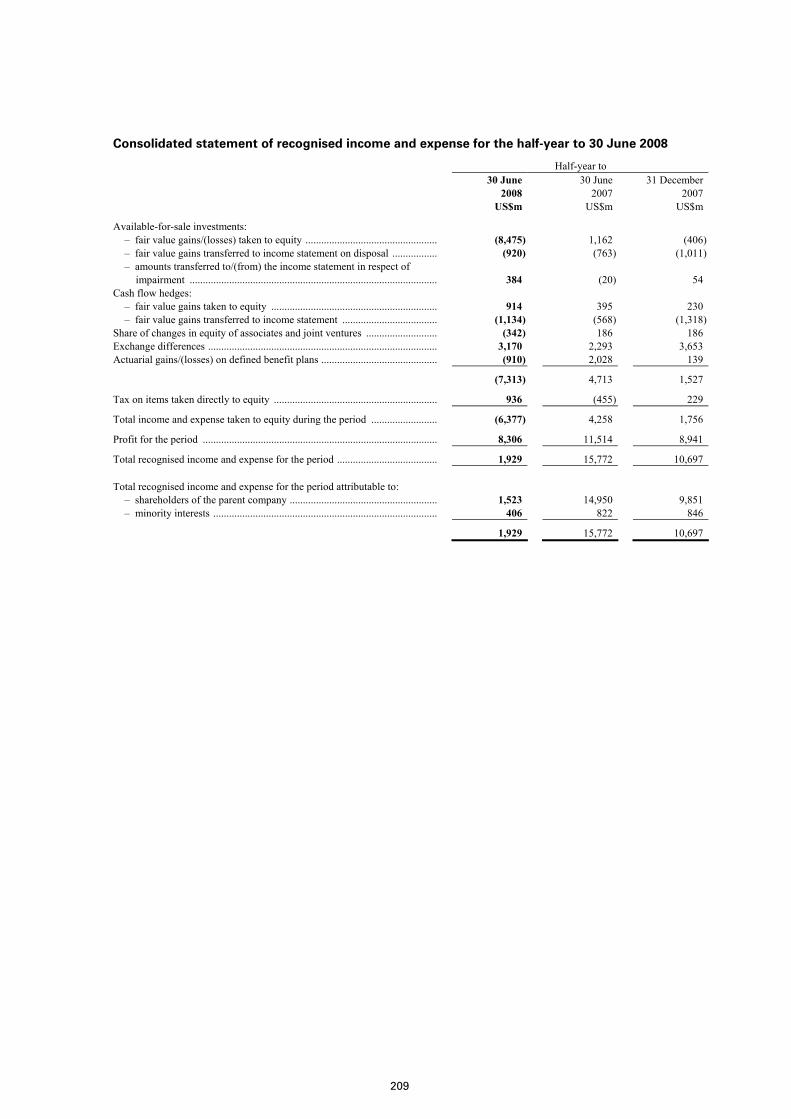
209
Consolidated statement of recognised income and expense for the half-year to 30 June 2008
Half-year to 30 June 30 June 31 December 2008 2007 2007
US$m US$m US$m
Available-for-sale investments: – fair value gains/(losses) taken to equity .................................................. (8,475) 1,162 (406)– fair value gains transferred to income statement on disposal ................. (920) (763) (1,011)– amounts transferred to/(from) the income statement in respect of
impairment .............................................................................................. 384 (20) 54 Cash flow hedges:
– fair value gains taken to equity ............................................................... 914 395 230 – fair value gains transferred to income statement .................................... (1,134) (568) (1,318)
Share of changes in equity of associates and joint ventures ........................... (342) 186 186 Exchange differences ....................................................................................... 3,170 2,293 3,653 Actuarial gains/(losses) on defined benefit plans ............................................ (910) 2,028 139
(7,313) 4,713 1,527
Tax on items taken directly to equity .............................................................. 936 (455) 229
Total income and expense taken to equity during the period ......................... (6,377) 4,258 1,756
Profit for the period ......................................................................................... 8,306 11,514 8,941
Total recognised income and expense for the period ...................................... 1,929 15,772 10,697 Total recognised income and expense for the period attributable to:
– shareholders of the parent company ........................................................ 1,523 14,950 9,851 – minority interests ..................................................................................... 406 822 846
1,929 15,772 10,697
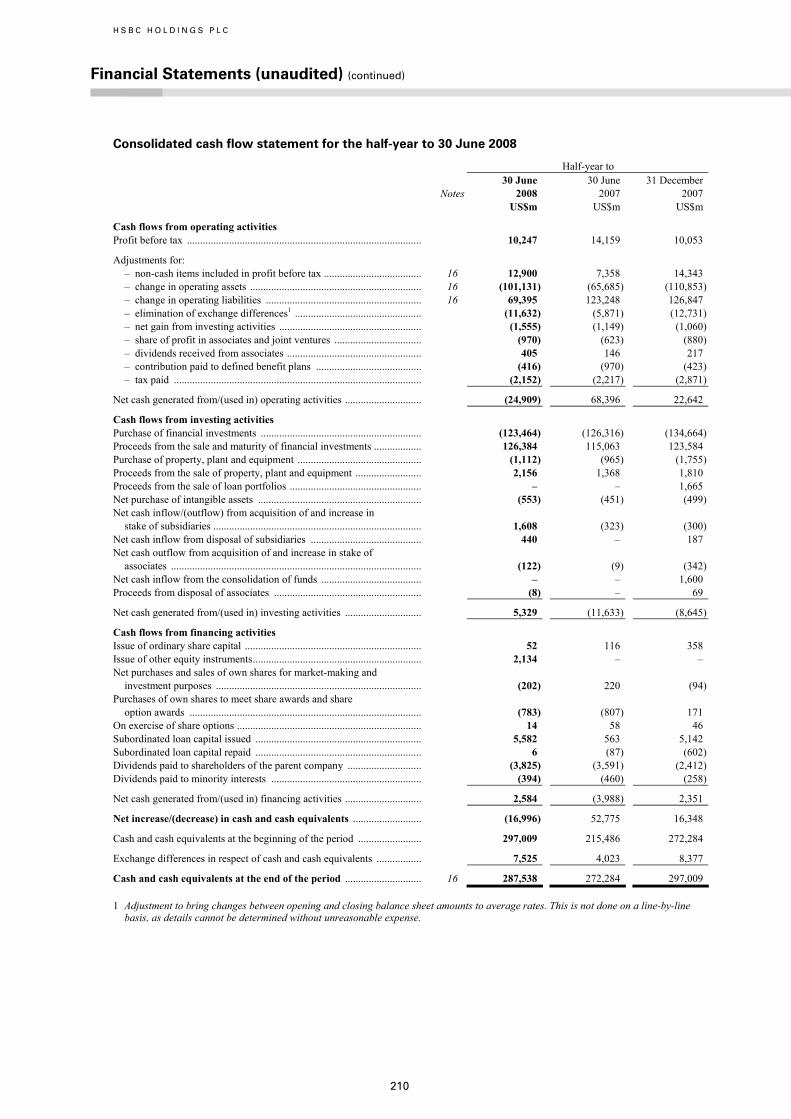
H S B C H O L D I N G S P L C
Financial Statements (unaudited) (continued)
210
Consolidated cash flow statement for the half-year to 30 June 2008
Half-year to
Notes 30 June 2008
30 June 2007
31 December 2007
US$m US$m US$m
Cash flows from operating activities Profit before tax ......................................................................................... 10,247 14,159 10,053
Adjustments for: – non-cash items included in profit before tax ..................................... 16 12,900 7,358 14,343 – change in operating assets ................................................................. 16 (101,131) (65,685) (110,853)– change in operating liabilities ........................................................... 16 69,395 123,248 126,847 – elimination of exchange differences1 ................................................ (11,632) (5,871) (12,731)– net gain from investing activities ...................................................... (1,555) (1,149) (1,060)– share of profit in associates and joint ventures ................................. (970) (623) (880)– dividends received from associates ................................................... 405 146 217 – contribution paid to defined benefit plans ........................................ (416) (970) (423)– tax paid .............................................................................................. (2,152) (2,217) (2,871)
Net cash generated from/(used in) operating activities ............................. (24,909) 68,396 22,642
Cash flows from investing activities Purchase of financial investments ............................................................. (123,464) (126,316) (134,664)Proceeds from the sale and maturity of financial investments .................. 126,384 115,063 123,584 Purchase of property, plant and equipment ............................................... (1,112) (965) (1,755)Proceeds from the sale of property, plant and equipment ......................... 2,156 1,368 1,810 Proceeds from the sale of loan portfolios .................................................. – – 1,665 Net purchase of intangible assets .............................................................. (553) (451) (499)Net cash inflow/(outflow) from acquisition of and increase in
stake of subsidiaries ............................................................................... 1,608 (323) (300)Net cash inflow from disposal of subsidiaries .......................................... 440 – 187 Net cash outflow from acquisition of and increase in stake of
associates ............................................................................................... (122) (9) (342)Net cash inflow from the consolidation of funds ...................................... – – 1,600 Proceeds from disposal of associates ........................................................ (8) – 69
Net cash generated from/(used in) investing activities ............................. 5,329 (11,633) (8,645)
Cash flows from financing activities Issue of ordinary share capital ................................................................... 52 116 358 Issue of other equity instruments................................................................ 2,134 – – Net purchases and sales of own shares for market-making and
investment purposes .............................................................................. (202) 220 (94)Purchases of own shares to meet share awards and share
option awards ........................................................................................ (783) (807) 171 On exercise of share options ...................................................................... 14 58 46 Subordinated loan capital issued ............................................................... 5,582 563 5,142 Subordinated loan capital repaid ............................................................... 6 (87) (602)Dividends paid to shareholders of the parent company ............................ (3,825) (3,591) (2,412)Dividends paid to minority interests ......................................................... (394) (460) (258)
Net cash generated from/(used in) financing activities ............................. 2,584 (3,988) 2,351
Net increase/(decrease) in cash and cash equivalents .......................... (16,996) 52,775 16,348
Cash and cash equivalents at the beginning of the period ........................ 297,009 215,486 272,284
Exchange differences in respect of cash and cash equivalents ................. 7,525 4,023 8,377
Cash and cash equivalents at the end of the period ............................. 16 287,538 272,284 297,009
1 Adjustment to bring changes between opening and closing balance sheet amounts to average rates. This is not done on a line-by-line basis, as details cannot be determined without unreasonable expense.
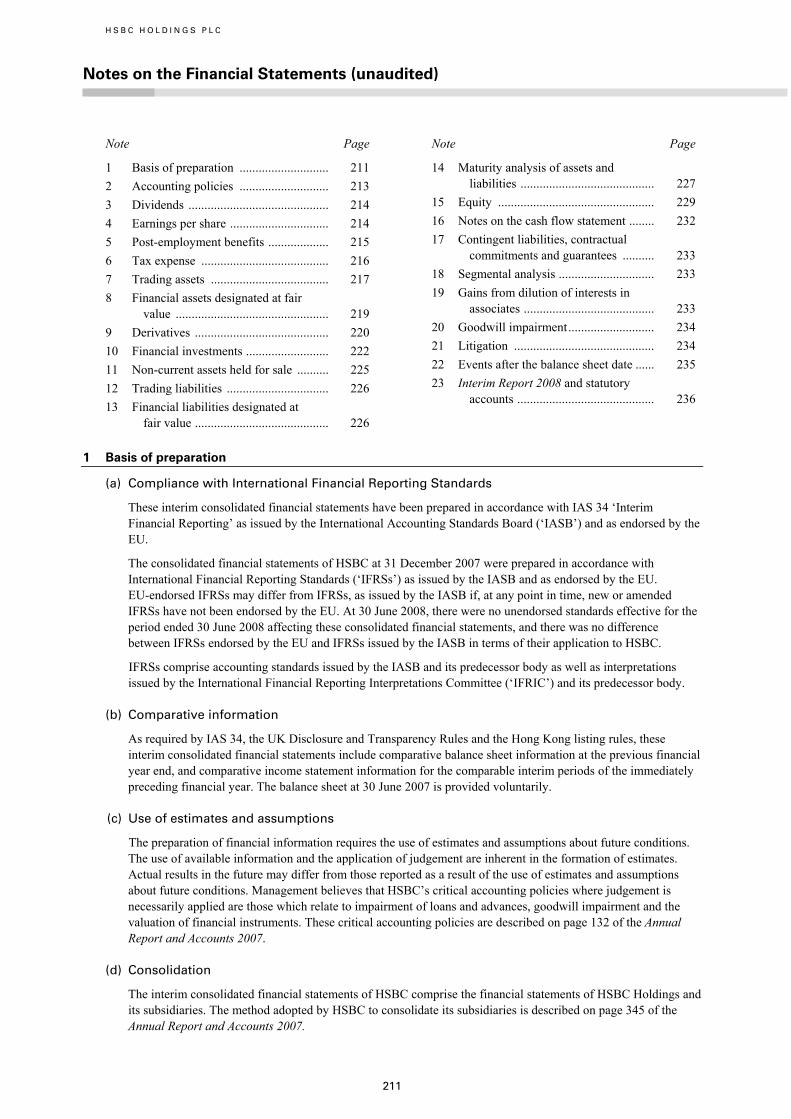
H S B C H O L D I N G S P L C
Notes on the Financial Statements (unaudited)
211
Note Page
1 Basis of preparation ............................ 2112 Accounting policies ............................ 2133 Dividends ............................................ 2144 Earnings per share ............................... 2145 Post-employment benefits ................... 2156 Tax expense ........................................ 2167 Trading assets ..................................... 2178 Financial assets designated at fair
value ................................................ 2199 Derivatives .......................................... 22010 Financial investments .......................... 22211 Non-current assets held for sale .......... 22512 Trading liabilities ................................ 22613 Financial liabilities designated at
fair value .......................................... 226
Note Page
14 Maturity analysis of assets and liabilities .......................................... 227
15 Equity ................................................. 22916 Notes on the cash flow statement ........ 23217 Contingent liabilities, contractual
commitments and guarantees .......... 23318 Segmental analysis .............................. 23319 Gains from dilution of interests in
associates ......................................... 23320 Goodwill impairment........................... 23421 Litigation ............................................ 23422 Events after the balance sheet date ...... 23523 Interim Report 2008 and statutory
accounts ........................................... 236
1 Basis of preparation
(a) Compliance with International Financial Reporting Standards
These interim consolidated financial statements have been prepared in accordance with IAS 34 ‘Interim Financial Reporting’ as issued by the International Accounting Standards Board (‘IASB’) and as endorsed by the EU.
The consolidated financial statements of HSBC at 31 December 2007 were prepared in accordance with International Financial Reporting Standards (‘IFRSs’) as issued by the IASB and as endorsed by the EU. EU-endorsed IFRSs may differ from IFRSs, as issued by the IASB if, at any point in time, new or amended IFRSs have not been endorsed by the EU. At 30 June 2008, there were no unendorsed standards effective for the period ended 30 June 2008 affecting these consolidated financial statements, and there was no difference between IFRSs endorsed by the EU and IFRSs issued by the IASB in terms of their application to HSBC.
IFRSs comprise accounting standards issued by the IASB and its predecessor body as well as interpretations issued by the International Financial Reporting Interpretations Committee (‘IFRIC’) and its predecessor body.
(b) Comparative information
As required by IAS 34, the UK Disclosure and Transparency Rules and the Hong Kong listing rules, these interim consolidated financial statements include comparative balance sheet information at the previous financial year end, and comparative income statement information for the comparable interim periods of the immediately preceding financial year. The balance sheet at 30 June 2007 is provided voluntarily.
(c) Use of estimates and assumptions
The preparation of financial information requires the use of estimates and assumptions about future conditions. The use of available information and the application of judgement are inherent in the formation of estimates. Actual results in the future may differ from those reported as a result of the use of estimates and assumptions about future conditions. Management believes that HSBC’s critical accounting policies where judgement is necessarily applied are those which relate to impairment of loans and advances, goodwill impairment and the valuation of financial instruments. These critical accounting policies are described on page 132 of the Annual Report and Accounts 2007.
(d) Consolidation
The interim consolidated financial statements of HSBC comprise the financial statements of HSBC Holdings and its subsidiaries. The method adopted by HSBC to consolidate its subsidiaries is described on page 345 of the Annual Report and Accounts 2007.
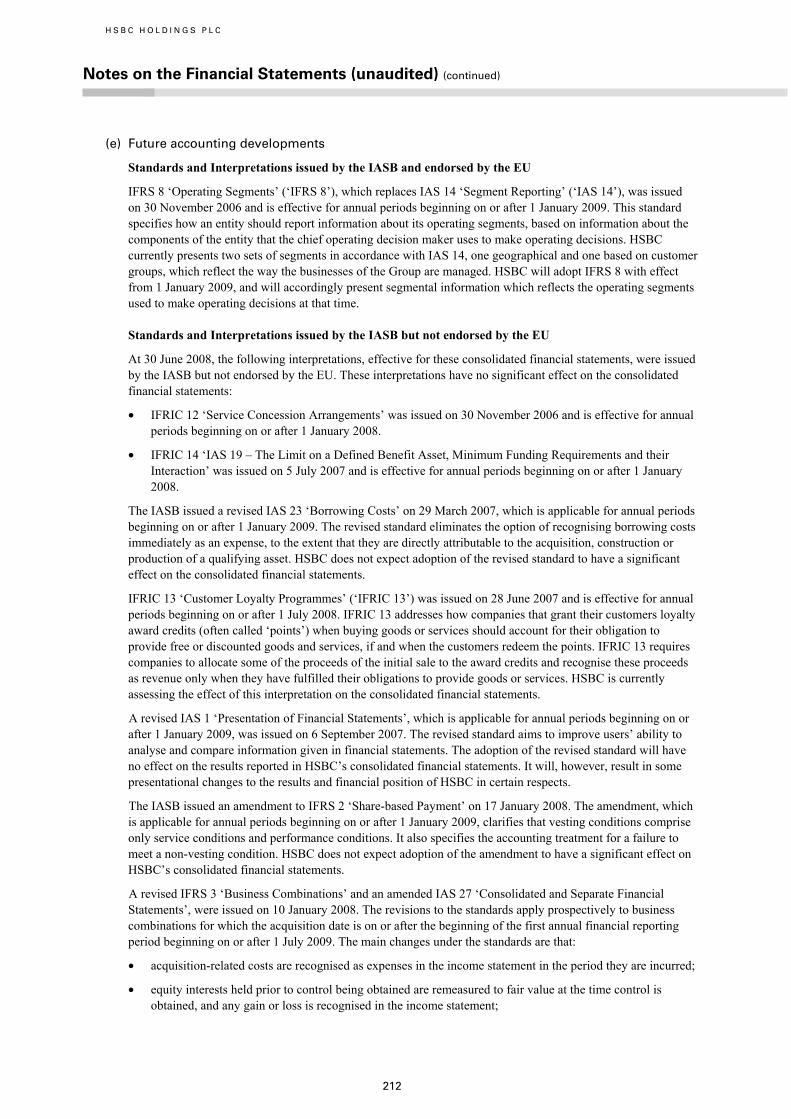
H S B C H O L D I N G S P L C
Notes on the Financial Statements (unaudited) (continued)
212
(e) Future accounting developments
Standards and Interpretations issued by the IASB and endorsed by the EU
IFRS 8 ‘Operating Segments’ (‘IFRS 8’), which replaces IAS 14 ‘Segment Reporting’ (‘IAS 14’), was issued on 30 November 2006 and is effective for annual periods beginning on or after 1 January 2009. This standard specifies how an entity should report information about its operating segments, based on information about the components of the entity that the chief operating decision maker uses to make operating decisions. HSBC currently presents two sets of segments in accordance with IAS 14, one geographical and one based on customer groups, which reflect the way the businesses of the Group are managed. HSBC will adopt IFRS 8 with effect from 1 January 2009, and will accordingly present segmental information which reflects the operating segments used to make operating decisions at that time.
Standards and Interpretations issued by the IASB but not endorsed by the EU
At 30 June 2008, the following interpretations, effective for these consolidated financial statements, were issued by the IASB but not endorsed by the EU. These interpretations have no significant effect on the consolidated financial statements:
• IFRIC 12 ‘Service Concession Arrangements’ was issued on 30 November 2006 and is effective for annual periods beginning on or after 1 January 2008.
• IFRIC 14 ‘IAS 19 – The Limit on a Defined Benefit Asset, Minimum Funding Requirements and their Interaction’ was issued on 5 July 2007 and is effective for annual periods beginning on or after 1 January 2008.
The IASB issued a revised IAS 23 ‘Borrowing Costs’ on 29 March 2007, which is applicable for annual periods beginning on or after 1 January 2009. The revised standard eliminates the option of recognising borrowing costs immediately as an expense, to the extent that they are directly attributable to the acquisition, construction or production of a qualifying asset. HSBC does not expect adoption of the revised standard to have a significant effect on the consolidated financial statements.
IFRIC 13 ‘Customer Loyalty Programmes’ (‘IFRIC 13’) was issued on 28 June 2007 and is effective for annual periods beginning on or after 1 July 2008. IFRIC 13 addresses how companies that grant their customers loyalty award credits (often called ‘points’) when buying goods or services should account for their obligation to provide free or discounted goods and services, if and when the customers redeem the points. IFRIC 13 requires companies to allocate some of the proceeds of the initial sale to the award credits and recognise these proceeds as revenue only when they have fulfilled their obligations to provide goods or services. HSBC is currently assessing the effect of this interpretation on the consolidated financial statements.
A revised IAS 1 ‘Presentation of Financial Statements’, which is applicable for annual periods beginning on or after 1 January 2009, was issued on 6 September 2007. The revised standard aims to improve users’ ability to analyse and compare information given in financial statements. The adoption of the revised standard will have no effect on the results reported in HSBC’s consolidated financial statements. It will, however, result in some presentational changes to the results and financial position of HSBC in certain respects.
The IASB issued an amendment to IFRS 2 ‘Share-based Payment’ on 17 January 2008. The amendment, which is applicable for annual periods beginning on or after 1 January 2009, clarifies that vesting conditions comprise only service conditions and performance conditions. It also specifies the accounting treatment for a failure to meet a non-vesting condition. HSBC does not expect adoption of the amendment to have a significant effect on HSBC’s consolidated financial statements.
A revised IFRS 3 ‘Business Combinations’ and an amended IAS 27 ‘Consolidated and Separate Financial Statements’, were issued on 10 January 2008. The revisions to the standards apply prospectively to business combinations for which the acquisition date is on or after the beginning of the first annual financial reporting period beginning on or after 1 July 2009. The main changes under the standards are that:
• acquisition-related costs are recognised as expenses in the income statement in the period they are incurred;
• equity interests held prior to control being obtained are remeasured to fair value at the time control is obtained, and any gain or loss is recognised in the income statement;

213
• changes in a parent’s ownership interest in a subsidiary that do not result in a change of control are treated as transactions between equity holders and reported in equity; and
• an option is available, on a transaction-by-transaction basis, to measure any non-controlling interests (previously referred to as minority interests) in the entity acquired either at fair value, or at the non-controlling interest’s proportionate share of the net identifiable assets of the entity acquired.
The effect that the changes will have on the results and financial position of HSBC will depend on the incidence and timing of business combinations occurring on or after 1 January 2010.
The IASB issued amendments to IAS 32 ‘Financial Instruments: Presentation’ and IAS 1 ‘Presentation of Financial Statements’ – ‘Puttable Financial Instruments and Obligations Arising on Liquidation’, on 14 February 2008. The amendments are applicable for annual periods beginning on or after 1 January 2009. HSBC is currently assessing the effect of the amendments on the consolidated financial statements.
The IASB issued ‘Improvements to IFRSs’ on 22 May 2008, which comprises a collection of necessary, but not urgent, amendments to IFRSs. The amendments are primarily effective for annual periods beginning on or after 1 January 2009, with earlier application permitted. HSBC does not expect adoption of the amendments to have a significant effect on the consolidated financial statements.
The IASB issued amendments to IFRS 1 ‘First-time Adoption of International Financial Reporting Standards’ and IAS 27 ‘Consolidated and Separate Financial Statements’ – ‘Determining the cost of an Investment in the Separate Financial Statements’, on 22 May 2008. The main amendments relevant to HSBC are to remove the definition of the ‘cost method’ from IAS 27 and require an entity to present dividends as income in the separate financial statements of the investor. The amendment to IAS 27 will have no effect on the consolidated financial statements.
IFRIC 15 ‘Agreements for the Construction of Real Estate’ (‘IFRIC 15’) was issued on 3 July 2008 and is effective for annual periods beginning on or after 1 January 2009. IFRIC 15 provides guidance on the recognition of revenue among real estate developers for sales of units. HSBC does not expect adoption of IFRIC 15 to have a significant effect on HSBC’s consolidated financial statements.
IFRIC 16 ‘Hedges of a Net Investment in a Foreign Operation’ (‘IFRIC 16’) was issued on 3 July 2008 and is effective for annual periods beginning on or after 1 October 2008. IFRIC 16 provides guidance on accounting for the hedge of a net investment in a foreign operation in an entity’s consolidated financial statements. The main change introduced by IFRIC 16 is to eliminate the possibility of an entity applying hedge accounting for a hedge of foreign exchange differences between the functional currency of a foreign operation and the presentation currency of the parent’s consolidated financial statements. The adoption of IFRIC 16 will have no effect on HSBC’s consolidated financial statements.
The IASB issued an amendment to IAS 39 ‘Financial Instruments: Recognition and Measurement’ – ‘Eligible Hedged Items’, which is applicable for annual periods beginning on or after 1 July 2009, on 31 July 2008. The amendment clarifies how the existing principles underlying hedge accounting should be applied. HSBC is currently assessing the effect of the amendment on the consolidated financial statements.
(f) Changes in composition of the Group
Acquisition of the assets, liabilities and operations of The Chinese Bank Co., Ltd (‘The Chinese Bank’)
The acquisition of assets, liabilities, and operations of The Chinese Bank in Taiwan was completed on 29 March 2008. This resulted in HSBC receiving a payment from the Taiwan Government’s Central Deposit Insurance Corporation to deliver an agreed net asset position. In addition, HSBC will provide additional capital of US$400 million to ensure that its enlarged operations maintain appropriate financial ratios.
2 Accounting policies
The accounting policies adopted by HSBC for these interim consolidated financial statements are consistent with those described on page 347 of the Annual Report and Accounts 2007.
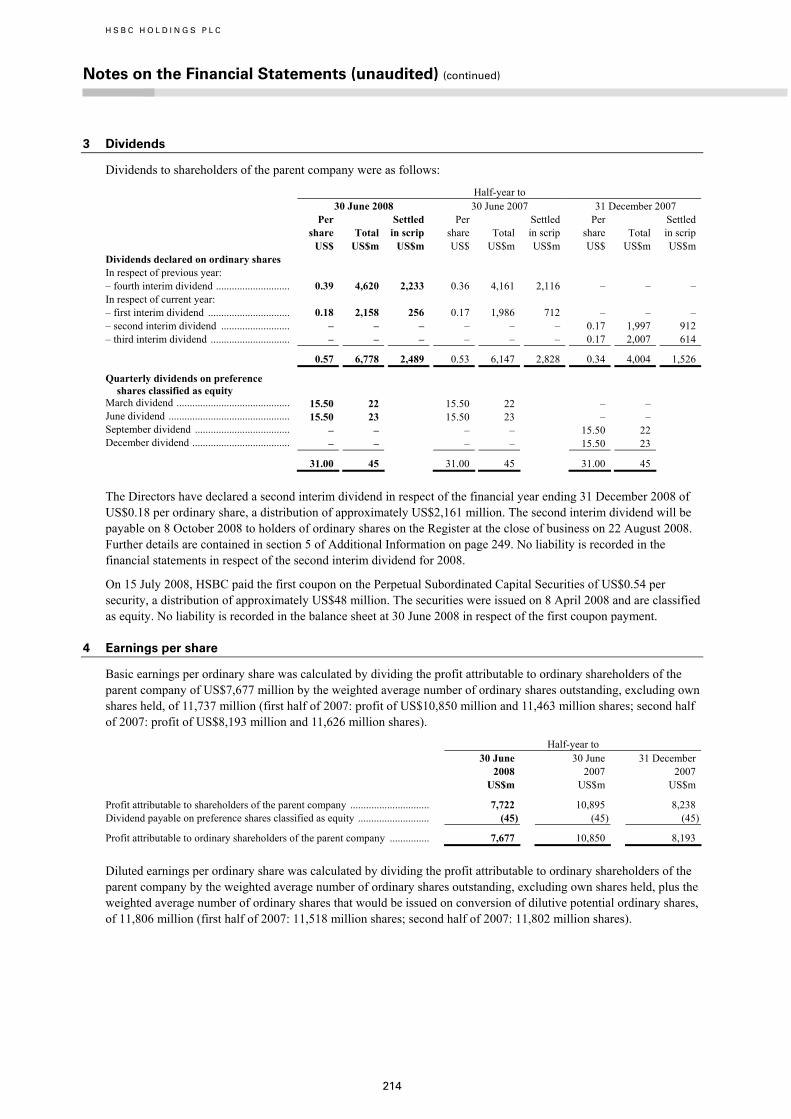
H S B C H O L D I N G S P L C
Notes on the Financial Statements (unaudited) (continued)
214
3 Dividends
Dividends to shareholders of the parent company were as follows:
Half-year to 30 June 2008 30 June 2007 31 December 2007
Per share US$
Total US$m
Settled in scrip US$m
Per share US$
Total US$m
Settled in scrip US$m
Per share US$
Total US$m
Settled in scrip US$m
Dividends declared on ordinary shares In respect of previous year: – fourth interim dividend ............................ 0.39 4,620 2,233 0.36 4,161 2,116 – – – In respect of current year: – first interim dividend ............................... 0.18 2,158 256 0.17 1,986 712 – – – – second interim dividend .......................... – – – – – – 0.17 1,997 912 – third interim dividend .............................. – – – – – – 0.17 2,007 614
0.57 6,778 2,489 0.53 6,147 2,828 0.34 4,004 1,526
Quarterly dividends on preference shares classified as equity
March dividend ........................................... 15.50 22 15.50 22 – – June dividend .............................................. 15.50 23 15.50 23 – – September dividend .................................... – – – – 15.50 22 December dividend ..................................... – – – – 15.50 23
31.00 45 31.00 45 31.00 45
The Directors have declared a second interim dividend in respect of the financial year ending 31 December 2008 of US$0.18 per ordinary share, a distribution of approximately US$2,161 million. The second interim dividend will be payable on 8 October 2008 to holders of ordinary shares on the Register at the close of business on 22 August 2008. Further details are contained in section 5 of Additional Information on page 249. No liability is recorded in the financial statements in respect of the second interim dividend for 2008.
On 15 July 2008, HSBC paid the first coupon on the Perpetual Subordinated Capital Securities of US$0.54 per security, a distribution of approximately US$48 million. The securities were issued on 8 April 2008 and are classified as equity. No liability is recorded in the balance sheet at 30 June 2008 in respect of the first coupon payment.
4 Earnings per share
Basic earnings per ordinary share was calculated by dividing the profit attributable to ordinary shareholders of the parent company of US$7,677 million by the weighted average number of ordinary shares outstanding, excluding own shares held, of 11,737 million (first half of 2007: profit of US$10,850 million and 11,463 million shares; second half of 2007: profit of US$8,193 million and 11,626 million shares).
Half-year to 30 June 30 June 31 December 2008 2007 2007 US$m US$m US$m
Profit attributable to shareholders of the parent company .............................. 7,722 10,895 8,238 Dividend payable on preference shares classified as equity ........................... (45) (45) (45)
Profit attributable to ordinary shareholders of the parent company ............... 7,677 10,850 8,193
Diluted earnings per ordinary share was calculated by dividing the profit attributable to ordinary shareholders of the parent company by the weighted average number of ordinary shares outstanding, excluding own shares held, plus the weighted average number of ordinary shares that would be issued on conversion of dilutive potential ordinary shares, of 11,806 million (first half of 2007: 11,518 million shares; second half of 2007: 11,802 million shares).

215
5 Post-employment benefits
Included within ‘Employee compensation and benefits’ are components of net periodic benefit cost related to HSBC’s defined benefit pension plans and other post-employment benefits, as follows:
Half-year to 30 June
2008 30 June
2007 31 December
2007 US$m US$m US$m
Current service cost ......................................................................................... 404 403 423 Interest cost ...................................................................................................... 928 843 869 Expected return on plan assets ........................................................................ (1,012) (840) (870)Past service cost ............................................................................................... 3 1 2 Gains on curtailments ...................................................................................... (16) (65) (40)(Gains)/losses on settlements .......................................................................... (73) – 1
Net defined benefit cost ................................................................................... 234 342 385
HSBC revalues its defined benefit post-employment plans each year at 31 December, in consultation with the plans’ local actuaries. The assumptions underlying the calculations are used to determine the expected income statement charge for the year going forward.
At 30 June each year, HSBC revalues all plan assets to current market prices. HSBC also reviews the assumptions used to calculate the defined benefit obligations (the liabilities of the plans) and updates the carrying amount of the obligations if there have been significant changes as a consequence of changes in assumptions.
Rises in the average yields of high quality (AA rated or equivalent) debt instruments in certain countries in the first half of 2008, together with a rise in inflation above expectations in certain countries, resulted in significant changes in the valuation of the defined benefit obligations. As a result, HSBC revalued certain plan obligations where the impact was significant. This resulted in a net decrease in the defined benefit obligation for the HSBC Bank (UK) Pension Scheme of US$208 million and for other plans of US$243 million. All differences from expected changes were recognised directly in equity as actuarial gains.
The US$16 million curtailment gain reported in the above table results primarily from the reduction in the number of employees covered by three defined benefit plans as a result of restructuring.
The US$73 million settlement gain reported in the table above is as a result of HSBC entering into transactions to transfer the legal obligation of the benefits provided under two post-employment benefit plans to third parties.
The discount rates used to calculate HSBC’s obligations under its defined benefit pension and post-employment healthcare plans were as follows:
At 30 June 2008
At 30 June 2007
At 31 December 2007
% % %
UK .................................................................................................................... 6.60 5.80 5.80 Hong Kong ...................................................................................................... 3.45 4.78 3.45 US .................................................................................................................... 7.05 6.30 6.55 Jersey ............................................................................................................... 6.50 5.80 5.80 Mexico ............................................................................................................. 8.50 8.00 7.88 Brazil ................................................................................................................ 10.75 10.75 10.75 France .............................................................................................................. 6.25 5.00 5.50 Canada ............................................................................................................. 6.00 5.50 5.43 Switzerland ...................................................................................................... 3.30 3.00 3.30 Germany .......................................................................................................... 6.25 5.10 5.50
The inflation rate used to calculate the HSBC Bank (UK) Pension Scheme obligation at 30 June 2008 was 4.0 per cent (30 June 2007: 3.2 per cent; 31 December 2007: 3.3 per cent). Rates of pay increase were adjusted in line with this inflation assumption. There were no changes to other assumptions.

H S B C H O L D I N G S P L C
Notes on the Financial Statements (unaudited) (continued)
216
Actuarial gains and losses
Half-year to 30 June
2008 30 June
2007 31 December
2007 US$m US$m US$m
Experience gains/(losses) on plan liabilities ................................................... (231) 399 (802)Experience gains/(losses) on plan assets ......................................................... (1,361) (658) 838 Gains from changes in actuarial assumptions ................................................. 682 2,300 132Other movements1 ........................................................................................... – (13) (29)
Total net actuarial gains/(losses) ..................................................................... (910) 2,028 139
1 Other movements include changes in the effect of the limit on plan surpluses and exchange differences recognised within actuarial gains and losses in equity.
Actuarial gains and losses comprise experience adjustments on plan assets and liabilities as well as adjustments arising from changes in actuarial assumptions. The experience gains and losses on plan assets arise as a result of the difference between the expected returns on the plan assets and the actual movement in the value of the plan assets during the period. The changes in actuarial assumptions arise as result of changes in the plan assumptions, primarily discount rates and inflation rates, as previously described.
Total cumulative net actuarial losses recognised in equity at 30 June 2008 were US$362 million cumulative losses (31 December 2007: US$548 million cumulative gains; 30 June 2007: US$409 million cumulative gains).
As disclosed in ‘Related party transactions’ in the Annual Report and Accounts 2007, HSBC Bank (UK) Pension Scheme entered into collateralised swap transactions with HSBC to manage the inflation and interest rate sensitivity of the Scheme’s pension obligations. At 30 June 2008, the swaps had a positive fair value of US$979 million to the scheme (31 December 2007: US$248 million positive to the scheme; 30 June 2007: US$774 million negative to the scheme). All swaps were executed at prevailing market rates and within standard market bid-offer spreads.
6 Tax expense
Half-year to 30 June 30 June 31 December 2008 2007 2007 US$m US$m US$m Current tax UK corporation tax charge .............................................................................. 991 476 850 Overseas tax ..................................................................................................... 1,306 1,937 1,942
2,297 2,413 2,792 Deferred tax Origination and reversal of temporary differences ......................................... (356) 232 (1,680)
Tax expense ..................................................................................................... 1,941 2,645 1,112
Effective tax rate .............................................................................................. 18.9% 18.7% 11.1%
The UK corporation tax rate applying to HSBC changed from 30 per cent to 28 per cent with effect from 1 April 2008 (2007: 30 per cent). Overseas tax included Hong Kong profits tax of US$529 million (first half of 2007: US$495 million; second half of 2007: US$642 million). Subsidiaries in Hong Kong provided for Hong Kong profits tax at the rate of 16.5 per cent (2007: 17.5 per cent) on the profits for the period assessable in Hong Kong. Other overseas subsidiaries and overseas branches provided for taxation at the appropriate rates in the countries in which they operate. The following table reconciles the overall tax expense which would apply if all profits had been taxed at the UK corporation tax rate:

217
Half-year to 30 June 2008 30 June 2007 31 December 2007
US$m % US$m % US$m % Analysis of overall tax expense1 Taxation at UK corporation tax rate of
28.5 per cent (2007: 30 per cent)2 ............... 2,920 28.5 4,248 30.0 3,016 30.0 Effect of taxing overseas profits in principal
locations at different rates ........................... (560) (5.5) (459) (3.2) (1,001) (10.0)Tax-free gains .................................................. (267) (2.6) (157) (1.1) (139) (1.4)Adjustments in respect of prior period
liabilities ...................................................... 2 – (152) (1.1) (157) (1.6)Low income housing tax credits3 .................... (51) (0.5) (52) (0.4) (55) (0.5)Effect of profit in associates and joint
ventures ....................................................... (263) (2.6) (185) (1.3) (265) (2.6)Effect of previously unrecognised temporary
differences4 .................................................. (80) (0.8) (211) (1.5) (274) (2.7)Release of deferred tax consequent on
restructuring of Group’s interests ............... –
– – – (359) (3.6)Impact of gains arising from dilution of
interests in associates5 ................................. –
– (250) (1.8) (3) – Other items ...................................................... 240 2.4 (137) (0.9) 349 3.5
Overall tax expense ......................................... 1,941 18.9 2,645 18.7 1,112 11.1
1 Interim period income tax expense is accrued using the estimated average annual effective income tax rates that would be applicable to expected total annual earnings.
2 The change in the UK corporation tax rate from 30 per cent to 28 per cent with effect from 1 April 2008 gave rise to a blended tax rate for 2008 of 28.5 per cent.
3 Low income housing tax credits are designed to encourage the provision of rental housing for low income households in the US. 4 The effect of previously unrecognised temporary differences principally relates to the recognition of capital losses. 5 The gains arising from the dilution of HSBC’s interests in associates are not subject to tax, and as such there is a reconciling item which
reduces the effective tax rate. See Note 19.
For the period ended 30 June 2008, HSBC’s share of associates tax on profit was US$298 million (30 June 2007: US$155 million; 31 December 2007: US$451 million), which is included within share of profit in associates and joint ventures in the income statement.
7 Trading assets
At 30 June 2008
At 30 June 2007
At 31 December 2007
US$m US$m US$m Trading assets:
– not subject to repledge or resale by counterparties ................................ 319,672 319,424 308,286 – which may be repledged or resold by counterparties ............................. 153,865 105,221 137,682
473,537 424,645 445,968
At
30 June 2008
At 30 June 2007
At 31 December 2007
US$m US$m US$m
Treasury and other eligible bills ...................................................................... 7,417 10,407 16,439 Debt securities ................................................................................................. 191,482 176,636 178,834 Equity securities .............................................................................................. 42,608 35,487 51,476
241,507 222,530 246,749
Loans and advances to banks .......................................................................... 95,359 95,710 100,440 Loans and advances to customers ................................................................... 136,671 106,405 98,779
473,537 424,645 445,968

H S B C H O L D I N G S P L C
Notes on the Financial Statements (unaudited) (continued)
218
Trading securities valued at fair value
At 30 June 2008
At 30 June 2007
At 31 December 2007
US$m US$m US$m
US Treasury and US Government agencies .................................................... 17,851 17,687 17,335 UK Government .............................................................................................. 7,620 8,980 11,607 Hong Kong Government ................................................................................. 5,001 5,773 5,517 Other government ............................................................................................ 92,452 67,739 80,268 Asset-backed securities ................................................................................... 19,122 13,801 21,502 Corporate debt and other securities ................................................................. 56,853 73,063 59,044 Equity securities .............................................................................................. 42,608 35,487 51,476
241,507 222,530 246,749
Included within the above figures are debt securities issued by banks and other financial institutions of US$61,528 million (30 June 2007: US$36,012 million; 31 December 2007: US$69,818 million).
Trading securities listed on a recognised exchange and unlisted
Treasury and other eligible bills
Debt securities
Equity securities
Total
US$m US$m US$m US$m Fair value at 30 June 2008 Listed on a recognised exchange1 ................................ 120 111,143 41,433 152,696 Unlisted ......................................................................... 7,297 80,339 1,175 88,811
7,417 191,482 42,608 241,507
Fair value at 30 June 2007 Listed on a recognised exchange1 ................................ 39 124,064 33,727 157,830 Unlisted ......................................................................... 10,368 52,572 1,760 64,700
10,407 176,636 35,487 222,530
Fair value at 31 December 2007 Listed on a recognised exchange1 ................................ 34 115,593 50,092 165,719 Unlisted ......................................................................... 16,405 63,241 1,384 81,030
16,439 178,834 51,476 246,749
1 Included within listed securities are investments listed in Hong Kong of US$4,217 million (30 June 2007: US$4,375 million; 31 December 2007: US$6,977 million).
Loans and advances to banks held for trading
At 30 June 2008
At 30 June 2007
At 31 December 2007
US$m US$m US$m
Reverse repos ................................................................................................... 76,487 71,253 80,476 Settlement accounts ......................................................................................... 11,547 12,513 8,227 Stock borrowing .............................................................................................. 3,400 9,721 8,259 Other ................................................................................................................ 3,925 2,223 3,478
95,359 95,710 100,440
Loans and advances to customers held for trading
At 30 June 2008
At 30 June 2007
At 31 December 2007
US$m US$m US$m
Reverse repos ................................................................................................... 59,083 48,682 51,543 Settlement accounts ......................................................................................... 36,137 21,429 6,216 Stock borrowing .............................................................................................. 25,829 25,635 24,254 Other ................................................................................................................ 15,622 10,659 16,766
136,671 106,405 98,779

219
8 Financial assets designated at fair value
At 30 June 2008
At 30 June 2007
At 31 December 2007
US$m US$m US$m
Treasury and other eligible bills ...................................................................... 240 206 181 Debt securities ................................................................................................. 23,356 15,832 21,150 Equity securities .............................................................................................. 16,768 18,319 20,047
Securities designated at fair value ................................................................... 40,364 34,357 41,378
Loans and advances to banks .......................................................................... 421 356 178 Loans and advances to customers ................................................................... 1 136 8
40,786 34,849 41,564
Securities designated at fair value
At 30 June 2008
At 30 June 2007
At 31 December 2007
US$m US$m US$m
US Treasury and US Government agencies .................................................... 334 116 252 UK Government .............................................................................................. 683 901 788 Hong Kong Government ................................................................................. 353 210 314 Other government ............................................................................................ 4,507 2,910 4,427 Asset-backed securities ................................................................................... 7,478 3,486 8,132 Corporate debt and other securities ................................................................. 10,241 8,415 7,418 Equity securities .............................................................................................. 16,768 18,319 20,047
40,364 34,357 41,378
Included within the above figures are debt securities issued by banks and other financial institutions of US$14,255 million (30 June 2007: US$8,378 million; 31 December 2007: US$14,401 million).
Treasury and other eligible bills
Debt securities
Equity securities
Total US$m US$m US$m US$m Fair value at 30 June 2008 Listed on a recognised exchange1 ................................ 85 4,877 12,492 17,454 Unlisted ......................................................................... 155 18,479 4,276 22,910
240 23,356 16,768 40,364 Fair value at 30 June 2007 Listed on a recognised exchange1 ................................ 83 7,213 14,307 21,603 Unlisted ......................................................................... 123 8,619 4,012 12,754
206 15,832 18,319 34,357 Fair value at 31 December 2007 Listed on a recognised exchange1 ................................ 50 8,659 15,449 24,158 Unlisted ......................................................................... 131 12,491 4,598 17,220
181 21,150 20,047 41,378
1 Included within listed investments are US$1,201 million of investments listed in Hong Kong (30 June 2007: US$1,184 million; 31 December 2007: US$1,502 million).

H S B C H O L D I N G S P L C
Notes on the Financial Statements (unaudited) (continued)
220
9 Derivatives
Fair values of derivatives by product contract type
Assets Liabilities Trading Hedging Total Trading Hedging Total US$m US$m US$m US$m US$m US$m At 30 June 2008 Foreign exchange ..................... 67,045 4,161 71,206 62,982 288 63,270 Interest rate ............................... 117,874 2,466 120,340 116,985 2,656 119,641 Equities ..................................... 19,999 – 19,999 19,385 – 19,385 Credit derivatives...................... 46,090 – 46,090 45,687 – 45,687 Commodity and other .............. 3,029 – 3,029 3,374 – 3,374
Gross total fair values .............. 254,037 6,627 260,664 248,413 2,944 251,357 Netting ..................................... – –
Total ......................................... 260,664 251,357
At 30 June 2007 Foreign exchange ..................... 35,704 2,742 38,446 33,254 300 33,554 Interest rate .............................. 81,689 1,956 83,645 81,455 1,254 82,709 Equities .................................... 17,017 – 17,017 16,795 – 16,795 Credit derivatives ..................... 9,902 – 9,902 10,826 – 10,826 Commodity and other .............. 1,028 – 1,028 1,257 – 1,257
Gross total fair values .............. 145,340 4,698 150,038 143,587 1,554 145,141 Netting ..................................... (857) (857)
Total ......................................... 149,181 144,284
At 31 December 2007 Foreign exchange ..................... 52,018 3,490 55,508 50,608 371 50,979 Interest rate .............................. 83,982 1,759 85,741 83,374 2,013 85,387 Equities .................................... 20,229 1 20,230 19,458 – 19,458 Credit derivatives ..................... 25,268 – 25,268 26,247 – 26,247 Commodity and other .............. 1,107 – 1,107 1,322 – 1,322
Gross total fair values .............. 182,604 5,250 187,854 181,009 2,384 183,393 Netting ..................................... – –
Total ......................................... 187,854 183,393
A description of HSBC’s determination of the fair values of financial instruments, including derivatives, is provided on pages 129 to 134.
Trading derivatives
Notional contract amounts of derivatives held for trading purposes by product type
The notional contract amounts of these instruments indicate the nominal value of transactions outstanding at the balance sheet date; they do not represent amounts at risk.
At 30 June 2008
At 30 June 2007
At 31 December 2007
US$m US$m US$m
Foreign exchange ............................................................................................. 3,704,399 2,842,549 3,243,738 Interest rate ...................................................................................................... 13,143,237 10,528,816 10,672,971 Equities ............................................................................................................ 343,343 270,619 286,927 Credit derivatives ............................................................................................. 2,075,700 1,473,509 1,893,802 Commodity and other ...................................................................................... 96,985 35,826 33,188
19,363,664 15,151,319 16,130,626
Credit derivatives
The contract amount of credit derivatives of US$2,076 billion (30 June 2007: US$1,474 billion; 31 December 2007: US$1,894 billion) consisted of protection bought of US$1,020 billion (30 June 2007: US$719 billion; 31 December 2007: US$927 billion) and protection sold of US$1,056 billion (30 June 2007: US$755 billion; 31 December 2007: US$967 billion).

221
The difference between the notional amounts bought and sold is attributable to HSBC selling protection on large, diversified, predominantly investment-grade portfolios (including the most senior tranches) and then offsetting risk on these positions by buying protection on the more subordinated tranches of the same portfolios. In addition, HSBC uses securities to mitigate risks on certain derivative positions and credit derivative contracts to reduce counterparty exposures. Consequently, while there is a mismatch in notional amounts of credit derivatives bought and sold, this should not be interpreted as representing the open risk position. The credit derivative business operates within the market risk management framework described on page 183.
Derivatives valued using models with unobservable inputs
The difference between the fair value at initial recognition (the transaction price) and the value that would have been derived had valuation techniques used for subsequent measurement been applied at initial recognition, less subsequent releases, is as follows. This amount is yet to be recognised in the consolidated income statement.
At 30 June 2008
At 30 June 2007
At 31 December 2007
US$m US$m US$m
Unamortised balance at beginning of period .................................................. 306 214 204 Deferral on new transactions ........................................................................... 239 119 265 Recognised in the income statement during the period:
– amortisation ............................................................................................. (117) (25) (60)– subsequent to unobservable inputs becoming observable ...................... (85) (64) (19)– maturity or termination, or offsetting derivative .................................... (68) (41) (80)
Exchange differences ....................................................................................... 5 1 3 Risk hedged ..................................................................................................... (2) – (7)
Unamortised balance at end of period ............................................................. 278 204 306
Hedging instruments
The notional contract amounts of these instruments indicate the nominal value of transactions outstanding at the balance sheet date: they do not represent amounts at risk.
Notional contract amounts of derivatives held for hedging purposes by product type
At 30 June 2008
At 30 June 2007
At 31 December 2007
US$m US$m US$m Cash flow hedges Foreign exchange ............................................................................................. 16,518 21,034 21,641 Interest rate ...................................................................................................... 288,721 213,889 248,134
305,239 234,923 269,775
Fair value hedges Foreign exchange ............................................................................................. 3,190 2,998 3,116 Interest rate ...................................................................................................... 29,736 27,956 34,897 Equities ............................................................................................................ 41 – 24
32,967 30,954 38,037
Fair value hedges
Fair value of derivatives designated as fair value hedges
At 30 June 2008 At 30 June 2007 At 31 December 2007 Assets Liabilities Assets Liabilities Assets Liabilities US$m US$m US$m US$m US$m US$m
Foreign exchange ......................................... 274 53 12 158 163 65 Interest rate .................................................. 338 346 330 192 171 338 Equities ........................................................ – – – – 1 –
612 399 342 350 335 403

H S B C H O L D I N G S P L C
Notes on the Financial Statements (unaudited) (continued)
222
Gains or losses arising from fair value hedges
Half-year to
30 June 2008
30 June 2007
31 December 2007
US$m US$m US$m
Gains/(losses): – on hedging instruments ........................................................................... 113 124 (310)– on the hedged items attributable to the hedged risk ............................... (133) (103) 308
(20) 21 (2)
Cash flow hedges
Fair value of derivatives designated as cash flow hedges
At 30 June 2008 At 30 June 2007 At 31 December 2007 Assets Liabilities Assets Liabilities Assets Liabilities US$m US$m US$m US$m US$m US$m
Foreign exchange ......................................... 3,887 235 2,730 142 3,327 306 Interest rate .................................................. 2,128 2,310 1,626 1,062 1,588 1,675
6,015 2,545 4,356 1,204 4,915 1,981
The gains and losses on ineffective portions of such derivatives are recognised immediately in ‘Net trading income’. During the period to 30 June 2008, a loss of US$15 million was recognised due to hedge ineffectiveness (first half of 2007: loss of US$49 million; second half of 2007: loss of US$28 million).
Hedges of net investments in foreign operations
At 30 June 2008, the fair values of outstanding financial instruments designated as hedges of net investments in foreign operations were liabilities of US$238 million (30 June 2007: liabilities of US$306 million; 31 December 2007: liabilities of US$450 million), and contract notional values of US$238 million (30 June 2007: US$161 million; 31 December 2007: US$1,204 million).
10 Financial investments
At 30 June 2008
At 30 June 2007
At 31 December 2007
US$m US$m US$m Financial investments:
– not subject to repledge or resale by counterparties ................................ 270,098 223,762 271,126 – which may be repledged or resold by counterparties ............................. 4,652 9,239 11,874
274,750 233,001 283,000
At 30 June 2008 At 30 June 2007 At 31 December 2007 Carrying
amount
Fair value Carrying
amount
Fair value Carrying
amount
Fair value US$m US$m US$m US$m US$m US$m
Treasury and other eligible bills . – available-for-sale ................ 27,928 27,928 26,077 26,077 30,104 30,104
Debt securities ............................ 237,341 237,477 197,621 197,563 240,302 240,688
– available-for-sale ................ 226,318 226,318 187,929 187,929 230,534 230,534– held-to-maturity ................. 11,023 11,159 9,692 9,634 9,768 10,154
Equity securities
– available-for-sale ................ 9,481 9,481 9,303 9,303 12,594 12,594
Total financial investments ........ 274,750 274,886 233,001 232,943 283,000 283,386

223
Financial investments at amortised cost and fair value
Amortised cost
Fair value
US$m US$m
At 30 June 2008 US Treasury ....................................................................................................................................... 7,197 7,195 US Government agencies .................................................................................................................. 6,646 6,630 US Government sponsored entities ................................................................................................... 17,340 17,072 UK Government ................................................................................................................................ 142 140 Hong Kong Government ................................................................................................................... 3,260 3,262 Other government .............................................................................................................................. 60,806 60,485 Asset-backed securities ..................................................................................................................... 61,321 52,695 Corporate debt and other securities ................................................................................................... 119,355 117,926 Equities .............................................................................................................................................. 7,048 9,481
283,115 274,886 At 30 June 2007 US Treasury ....................................................................................................................................... 8,204 8,173 US Government agencies .................................................................................................................. 5,635 5,515 US Government sponsored entities ................................................................................................... 14,331 13,828 UK Government ................................................................................................................................ 1,508 1,507 Hong Kong Government ................................................................................................................... 2,750 2,738 Other government .............................................................................................................................. 48,241 48,538 Asset-backed securities ..................................................................................................................... 31,466 31,458 Corporate debt and other securities ................................................................................................... 112,504 111,883 Equities .............................................................................................................................................. 6,318 9,303
230,957 232,943 At 31 December 2007 US Treasury ....................................................................................................................................... 6,799 6,831 US Government agencies .................................................................................................................. 5,709 5,732 US Government sponsored entities ................................................................................................... 14,732 14,533 UK Government ................................................................................................................................ 757 749 Hong Kong Government ................................................................................................................... 3,941 3,942 Other government .............................................................................................................................. 60,109 60,320 Asset-backed securities ..................................................................................................................... 68,316 68,106 Corporate debt and other securities ................................................................................................... 110,825 110,579 Equities .............................................................................................................................................. 8,405 12,594
279,593 283,386
Included within the above figures are debt securities issued by banks and other financial institutions of US$157,272 million (30 June 2007: US$109,523 million; 31 December 2007: US$142,863 million). Their fair value at 30 June 2008 was US$135,477 million (30 June 2007: US$109,302 million; 31 December 2007: US$143,023 million).
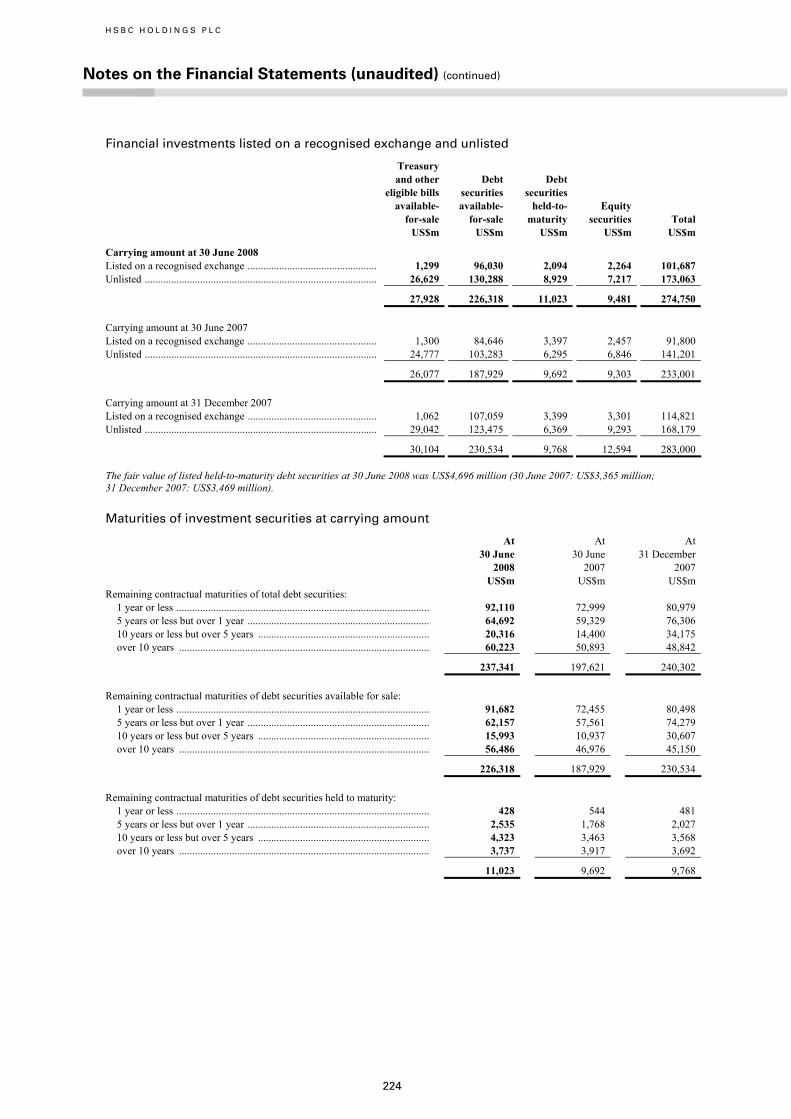
H S B C H O L D I N G S P L C
Notes on the Financial Statements (unaudited) (continued)
224
Financial investments listed on a recognised exchange and unlisted
Treasury and other eligible bills available- for-sale
Debt securities available- for-sale
Debt securities held-to- maturity
Equity securities
Total US$m US$m US$m US$m US$m
Carrying amount at 30 June 2008 Listed on a recognised exchange ................................................. 1,299 96,030 2,094 2,264 101,687 Unlisted ........................................................................................ 26,629 130,288 8,929 7,217 173,063
27,928 226,318 11,023 9,481 274,750 Carrying amount at 30 June 2007 Listed on a recognised exchange ................................................. 1,300 84,646 3,397 2,457 91,800 Unlisted ........................................................................................ 24,777 103,283 6,295 6,846 141,201
26,077 187,929 9,692 9,303 233,001 Carrying amount at 31 December 2007 Listed on a recognised exchange ................................................. 1,062 107,059 3,399 3,301 114,821 Unlisted ........................................................................................ 29,042 123,475 6,369 9,293 168,179
30,104 230,534 9,768 12,594 283,000
The fair value of listed held-to-maturity debt securities at 30 June 2008 was US$4,696 million (30 June 2007: US$3,365 million; 31 December 2007: US$3,469 million).
Maturities of investment securities at carrying amount
At 30 June 2008
At 30 June 2007
At 31 December 2007
US$m US$m US$m Remaining contractual maturities of total debt securities:
1 year or less ................................................................................................ 92,110 72,999 80,979 5 years or less but over 1 year ..................................................................... 64,692 59,329 76,306 10 years or less but over 5 years ................................................................. 20,316 14,400 34,175 over 10 years ............................................................................................... 60,223 50,893 48,842
237,341 197,621 240,302 Remaining contractual maturities of debt securities available for sale:
1 year or less ................................................................................................ 91,682 72,455 80,498 5 years or less but over 1 year ..................................................................... 62,157 57,561 74,279 10 years or less but over 5 years ................................................................. 15,993 10,937 30,607 over 10 years ............................................................................................... 56,486 46,976 45,150
226,318 187,929 230,534 Remaining contractual maturities of debt securities held to maturity:
1 year or less ................................................................................................ 428 544 481 5 years or less but over 1 year ..................................................................... 2,535 1,768 2,027 10 years or less but over 5 years ................................................................. 4,323 3,463 3,568 over 10 years ............................................................................................... 3,737 3,917 3,692
11,023 9,692 9,768

225
11 Non-current assets held for sale
30 June 2008
30 June 2007
31 December 2007
US$m US$m US$m
Interest in associates ........................................................................................ 2 – 2 Property, plant and equipment ......................................................................... 2,599 2,278 2,502 Investment properties ...................................................................................... 118 80 111 Financial assets ................................................................................................ 11,454 2,079 185 Other ................................................................................................................ 990 5 4
Total assets classified as held for sale ............................................................. 15,163 4,442 2,804
Disposal group
On 29 February 2008, HSBC France, a wholly owned subsidiary of HSBC, received a firm cash offer from Banque Fédérale des Banques Populaires of €2.1 billion (US$3.2 billion) for seven of its French regional banking subsidiaries, which operate in the Personal Financial Services and Commercial Banking customer groups in Europe. The sale was completed on 2 July 2008, and the Group’s pre-tax profit on sale of US$2.1 billion will be recognised in the second half of 2008.
Included within the balances in the above table are the following assets in respect of the disposal group classified as held for sale:
30 June 2008
US$m
Cash ..................................................................................................................................................................................... 413 Loans and advances to banks and customers ...................................................................................................................... 9,097 Other assets .......................................................................................................................................................................... 1,126
Total assets 10,636
Included in Other liabilities are the following liabilities in respect of the disposal group:
30 June 2008
US$m
Deposits by banks ................................................................................................................................................................ 158 Customer accounts ............................................................................................................................................................... 10,285 Other liabilities .................................................................................................................................................................... 308
Total liabilities 10,751
Property, plant and equipment
The property, plant and equipment classified as held for sale comprises two principal categories. The first is as a result of the repossession of property that had been pledged as collateral by customers. These assets are expected to be disposed of within 12 months of acquisition. Neither a gain nor a loss was recognised on reclassifying these assets as held for sale. The majority arose within the geographical segment, North America.
Secondly, as disclosed in the Annual Report and Accounts 2007, on 31 May 2007, HSBC entered into a contract for the sale and leaseback of the property and long leasehold land comprising 8 Canada Square, London to Metrovacesa, S.A. (‘Metrovacesa’) for £1,090 million (US$2,154 million). Under the terms of this arrangement, HSBC leased the building back from Metrovacesa for a period of 20 years at an annual rent of £43.5 million (US$87 million), with annual upward-only rent reviews linked to the RPI (all items) and subject to an annual maximum and minimum increase of 6 per cent and 2.5 per cent, respectively. In the normal course of business, HSBC provided finance to Metrovacesa in respect of the debt element of this transaction at arm’s length market rates in the form of a bridging loan of £810 million (US$1,061 million), secured by a charge on the property. The bridging loan had an original maturity date of 30 November 2007 and was extended with a new facility provided by HSBC with a maturity date of 30 November 2008. The equity portion of £280 million (US$553 million) was settled in cash by Metrovacesa on 31 May 2007.

H S B C H O L D I N G S P L C
Notes on the Financial Statements (unaudited) (continued)
226
The sale has not been recognised in the financial statements at 30 June 2008 because HSBC has retained a significant interest by virtue of the loan provided to part-finance the purchase of the building. Accordingly, 8 Canada Square is presented within ‘Non-current assets held for sale’ with a carrying value of US$861 million. The equity portion received from Metrovacesa is presented in the balance sheet as deferred income with a value at 30 June 2008 of US$548 million.
Financial assets
Included in financial assets classified as held for sale was US$1.8 billion of performing prime and non-prime Canadian vehicle finance receivables for which an agreement for sale was entered into in May 2008. Neither a gain nor a loss was recognised on reclassifying these assets as held for sale. These assets are presented in the geographical segment, North America. The sale was completed on 29 July 2008.
12 Trading liabilities
At 30 June 2008
At 30 June 2007
At 31 December 2007
US$m US$m US$m
Deposits by banks ............................................................................................ 45,091 53,006 58,940 Customer accounts ........................................................................................... 147,000 123,674 102,710 Other debt securities in issue ........................................................................... 44,363 40,953 44,684 Other liabilities – net short positions ............................................................... 104,157 95,560 108,246
340,611 313,193 314,580
13 Financial liabilities designated at fair value
At 30 June 2008
At 30 June 2007
At 31 December 2007
US$m US$m US$m
Deposits by banks and customer accounts ...................................................... 7,306 771 7,724 Liabilities to customers under investment contracts ....................................... 15,407 14,521 16,053 Debt securities in issue .................................................................................... 39,704 37,498 38,587 Subordinated liabilities .................................................................................... 22,706 18,575 22,831 Preference shares ............................................................................................. 4,635 4,601 4,744
89,758 75,966 89,939
At 30 June 2008, the cumulative amount of the change in fair value attributable to changes in credit risk was a gain of US$2,443 million (30 June 2007: loss of US$1,354 million; 31 December 2007: gain of US$1,619 million), and the carrying amount of financial liabilities designated at fair value was US$2,397 million less (30 June 2007: US$11 million less; 31 December 2007: US$648 million less) than the contractual amount at maturity.

227
14 Maturity analysis of assets and liabilities
The following is an analysis, by remaining contractual maturities at the balance sheet date, of asset and liability line items that represent amounts expected to be recovered or settled within one year, and after one year.
Trading assets and liabilities are excluded because they are not held for collection or settlement over the period of contractual maturity.
At 30 June 2008 Due within
one year Due after one year Total
US$m US$m US$m Assets Financial assets designated at fair value ......................................................... 8,590 32,196 40,786 Loans and advances to banks1 ......................................................................... 245,718 11,263 256,981 Loans and advances to customers ................................................................... 495,856 553,344 1,049,200 Financial investments ...................................................................................... 99,446 175,304 274,750 Other financial assets ....................................................................................... 28,723 6,436 35,159
878,333 778,543 1,656,876
Liabilities Deposits by banks ............................................................................................ 145,597 8,555 154,152 Customer accounts ........................................................................................... 1,128,991 32,932 1,161,923 Financial liabilities designated at fair value .................................................... 6,350 83,408 89,758 Debt securities in issue .................................................................................... 134,198 96,069 230,267 Other financial liabilities ................................................................................. 35,301 5,039 40,340 Subordinated liabilities .................................................................................... 1,333 30,184 31,517
1,451,770 256,187 1,707,957 At 30 June 2007 Due within
one year Due after one year Total
US$m US$m US$m Assets Financial assets designated at fair value ......................................................... 4,374 30,475 34,849 Loans and advances to banks1 ......................................................................... 208,552 6,093 214,645 Loans and advances to customers ................................................................... 411,359 516,742 928,101 Financial investments ...................................................................................... 97,538 135,463 233,001 Other financial assets ....................................................................................... 21,221 5,490 26,711
743,044 694,263 1,437,307
Liabilities Deposits by banks ............................................................................................ 117,183 11,590 128,773 Customer accounts ........................................................................................... 950,665 30,167 980,832 Financial liabilities designated at fair value .................................................... 810 75,156 75,966 Debt securities in issue .................................................................................... 117,530 111,709 229,239 Other financial liabilities ................................................................................. 29,951 8,322 38,273 Subordinated liabilities .................................................................................... 95 23,409 23,504
1,216,234 260,353 1,476,587

H S B C H O L D I N G S P L C
Notes on the Financial Statements (unaudited) (continued)
228
At 31 December 2007 Due within
one year Due after one year Total
US$m US$m US$m Assets Financial assets designated at fair value ......................................................... 5,752 35,812 41,564 Loans and advances to banks1 ......................................................................... 222,674 14,692 237,366 Loans and advances to customers ................................................................... 438,246 543,302 981,548 Financial investments ...................................................................................... 103,492 179,508 283,000 Other financial assets ....................................................................................... 24,087 6,390 30,477
794,251 779,704 1,573,955
Liabilities Deposits by banks ............................................................................................ 124,475 7,706 132,181 Customer accounts ........................................................................................... 1,066,148 29,992 1,096,140 Financial liabilities designated at fair value .................................................... 6,217 83,722 89,939 Debt securities in issue .................................................................................... 143,651 102,928 246,579 Other financial liabilities ................................................................................. 33,056 4,352 37,408 Subordinated liabilities .................................................................................... 341 24,478 24,819
1,373,888 253,178 1,627,066
1 ‘Loans and advances to banks’ includes US$210,301 million (30 June 2007: US$176,594 million; 31 December 2007: US$189,081 million) which is repayable on demand or at short notice.
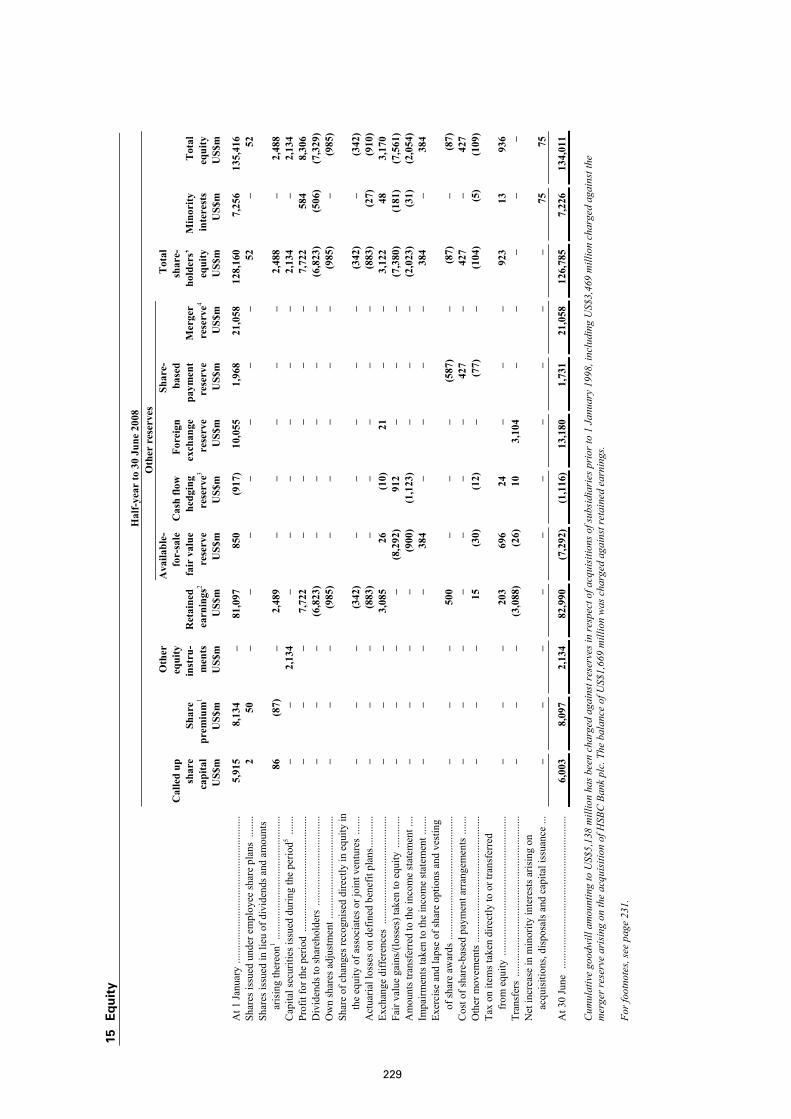
229
15
Eq
uit
y
H
alf-y
ear
to 3
0 Ju
ne 2
008
O
ther
res
erve
s
Cal
led
up
sh
are
ca
pita
l
Shar
e p
rem
ium
1
O
ther
equi
ty
in
stru
-
men
ts
Ret
aine
d
earn
ings
2
Ava
ilabl
e-
fo
r-sa
le
fai
r va
lue
re
serv
e
Cas
h flo
w
he
dgin
g
rese
rve3
Fore
ign
exc
hang
e
rese
rve
Sh
are-
ba
sed
pa
ymen
t
rese
rve
M
erge
r
rese
rve4
T
otal
shar
e-
hold
ers’
equi
ty
Min
ority
inte
rest
s
Tot
al
eq
uity
US$
m
US$
m
US$
m
US$
m
US$
m
US$
m
US$
m
US$
m
US$
m
US$
m
US$
m
US$
m
At 1
Janu
ary
......
......
......
......
......
......
......
......
......
..
5,91
5 8,
134
– 81
,097
85
0 (9
17)
10,0
55
1,96
8 21
,058
12
8,16
0 7,
256
135,
416
Sh
ares
issu
ed u
nder
em
ploy
ee sh
are
plan
s ...
.....
2
50
– –
– –
– –
– 52
–
52
Shar
es is
sued
in li
eu o
f div
iden
ds a
nd a
mou
nts
aris
ing
ther
eon1 ..
......
......
......
......
......
......
......
...
86
(87)
– 2,
489
– –
– –
– 2,
488
– 2,
488
C
apita
l sec
uriti
es is
sued
dur
ing
the
perio
d5 ....
...
– –
2,13
4 –
– –
– –
– 2,
134
– 2,
134
Pr
ofit
for t
he p
erio
d ...
......
......
......
......
......
......
.....
–
– –
7,72
2 –
– –
– –
7,72
2 58
4 8,
306
D
ivid
ends
to sh
areh
olde
rs ..
......
......
......
......
......
..
– –
– (6
,823
)–
– –
– –
(6,8
23)
(506
)(7
,329
) O
wn
shar
es a
djus
tmen
t ....
......
......
......
......
......
.....
–
– –
(985
)–
– –
– –
(985
)–
(985
) Sh
are
of c
hang
es re
cogn
ised
dire
ctly
in e
quity
in
the
equi
ty o
f ass
ocia
tes o
r joi
nt v
entu
res
......
. –
– –
(342
)–
– –
– –
(342
)–
(342
) A
ctua
rial l
osse
s on
defin
ed b
enef
it pl
ans.
......
.....
–
– –
(883
)–
– –
– –
(883
)(2
7)(9
10)
Exch
ange
diff
eren
ces
......
......
......
......
......
......
.....
–
– –
3,08
5 26
(1
0)
21
– –
3,12
2 48
3,
170
Fa
ir va
lue
gain
s/(lo
sses
) tak
en to
equ
ity ..
......
....
– –
– –
(8,2
92)
912
– –
– (7
,380
)(1
81)
(7,5
61)
Am
ount
s tra
nsfe
rred
to th
e in
com
e st
atem
ent .
...
– –
– –
(900
)(1
,123
) –
– –
(2,0
23)
(31)
(2,0
54)
Impa
irmen
ts ta
ken
to th
e in
com
e st
atem
ent .
......
–
– –
– 38
4 –
– –
– 38
4 –
384
Exer
cise
and
laps
e of
shar
e op
tions
and
ves
ting
of sh
are
awar
ds ..
......
......
......
......
......
......
......
...
– –
– 50
0 –
– –
(587
)–
(87)
– (8
7)
Cos
t of s
hare
-bas
ed p
aym
ent a
rran
gem
ents
.....
..
– –
– –
– –
– 42
7 –
427
– 42
7 O
ther
mov
emen
ts ..
......
......
......
......
......
......
......
....
– –
– 15
(3
0)(1
2)
– (7
7)–
(104
)(5
)(1
09)
Tax
on it
ems t
aken
dire
ctly
to o
r tra
nsfe
rred
fr
om e
quity
.....
......
......
......
......
......
......
......
......
–
– –
203
696
24
– –
– 92
3 13
93
6
Tran
sfer
s ...
......
......
......
......
......
......
......
......
......
....
– –
– (3
,088
)(2
6)10
3,
104
– –
– –
– N
et in
crea
se in
min
ority
inte
rest
s aris
ing
on
acqu
isiti
ons,
disp
osal
s and
cap
ital i
ssua
nce
...
– –
– –
– –
– –
– –
75
75
At 3
0 Ju
ne ...
......
......
......
......
......
......
......
......
......
. 6,
003
8,09
7 2,
134
82,9
90
(7,2
92)
(1,1
16)
13,1
80
1,73
1 21
,058
12
6,78
5 7,
226
134,
011
Cum
ulat
ive
good
will
am
ount
ing
to U
S$5,
138
mill
ion
has b
een
char
ged
agai
nst r
eser
ves i
n re
spec
t of a
cqui
sitio
ns o
f sub
sidi
arie
s pri
or to
1 J
anua
ry 1
998,
incl
udin
g U
S$3,
469
mill
ion
char
ged
agai
nst t
he
mer
ger r
eser
ve a
risi
ng o
n th
e ac
quis
ition
of H
SBC
Ban
k pl
c. T
he b
alan
ce o
f US$
1,66
9 m
illio
n w
as c
harg
ed a
gain
st re
tain
ed e
arni
ngs.
For f
ootn
otes
, see
pag
e 23
1.
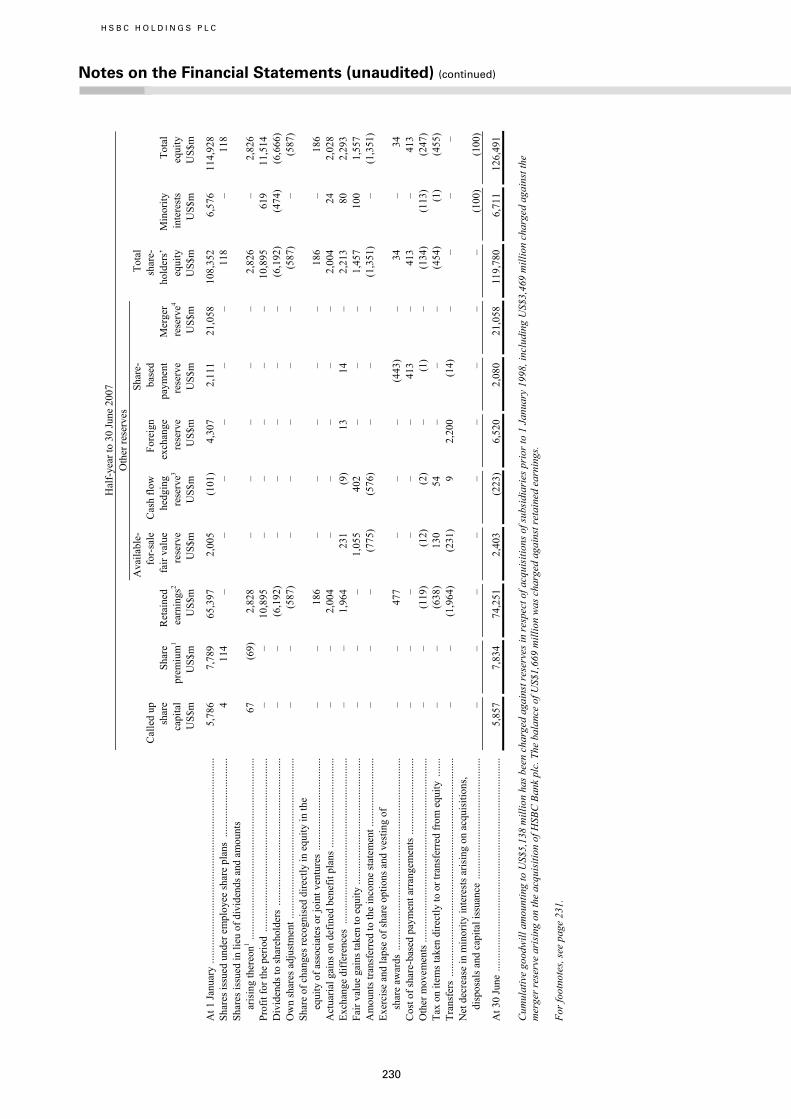
230
H S B C H O L D I N G S P L C
Notes on the Financial Statements (unaudited) (continued)
Hal
f-ye
ar to
30
June
200
7
Oth
er re
serv
es
Cal
led
up
sh
are
ca
pita
l
Shar
e
prem
ium
1
Ret
aine
d
earn
ings
2
Ava
ilabl
e-
fo
r-sa
le
fai
r val
ue
re
serv
e
Cas
h flo
w
he
dgin
g
rese
rve3
Fore
ign
exc
hang
e
rese
rve
Sh
are-
base
d
paym
ent
re
serv
e
Mer
ger
re
serv
e4
To
tal
sh
are-
ho
lder
s’
eq
uity
Min
ority
inte
rest
s
Tota
l
equi
ty
US$
m
US$
m
US$
m
US$
m
US$
m
US$
m
US$
m
US$
m
US$
m
US$
m
US$
m
At 1
Janu
ary
......
......
......
......
......
......
......
......
......
......
......
......
......
5,
786
7,78
9 65
,397
2,
005
(101
) 4,
307
2,11
1 21
,058
10
8,35
2 6,
576
114,
928
Sh
ares
issu
ed u
nder
em
ploy
ee sh
are
plan
s ...
......
......
......
......
...
4 11
4 –
– –
– –
– 11
8 –
118
Sh
ares
issu
ed in
lieu
of d
ivid
ends
and
am
ount
s ar
isin
g th
ereo
n1 .....
......
......
......
......
......
......
......
......
......
......
....
67
(69)
2,82
8 –
– –
– –
2,82
6 –
2,82
6
Prof
it fo
r the
per
iod
......
......
......
......
......
......
......
......
......
......
......
–
– 10
,895
–
– –
– –
10,8
95
619
11,5
14
Div
iden
ds to
shar
ehol
ders
.....
......
......
......
......
......
......
......
......
...
– –
(6,1
92)
– –
– –
– (6
,192
)(4
74)
(6,6
66)
Ow
n sh
ares
adj
ustm
ent .
......
......
......
......
......
......
......
......
......
......
–
– (5
87)
– –
– –
– (5
87)
– (5
87)
Shar
e of
cha
nges
reco
gnis
ed d
irect
ly in
equ
ity in
the
eq
uity
of a
ssoc
iate
s or j
oint
ven
ture
s ...
......
......
......
......
......
.. –
– 18
6 –
– –
– –
186
– 18
6 A
ctua
rial g
ains
on
defin
ed b
enef
it pl
ans
......
......
......
......
......
....
– –
2,00
4 –
– –
– –
2,00
4 24
2,
028
Ex
chan
ge d
iffer
ence
s ...
......
......
......
......
......
......
......
......
......
......
–
– 1,
964
231
(9)
13
14
– 2,
213
80
2,29
3
Fair
valu
e ga
ins t
aken
to e
quity
.....
......
......
......
......
......
......
......
. –
– –
1,05
5 40
2
– –
– 1,
457
100
1,55
7
Am
ount
s tra
nsfe
rred
to th
e in
com
e st
atem
ent .
......
......
......
......
. –
– –
(775
)(5
76)
– –
– (1
,351
)–
(1,3
51)
Exer
cise
and
laps
e of
shar
e op
tions
and
ves
ting
of
shar
e aw
ards
.....
......
......
......
......
......
......
......
......
......
......
......
.. –
– 47
7 –
– –
(443
)–
34
– 34
C
ost o
f sha
re-b
ased
pay
men
t arr
ange
men
ts ..
......
......
......
......
...
– –
– –
– –
413
– 41
3 –
413
O
ther
mov
emen
ts ..
......
......
......
......
......
......
......
......
......
......
......
.. –
– (1
19)
(12)
(2)
– (1
)–
(134
)(1
13)
(247
) Ta
x on
item
s tak
en d
irect
ly to
or t
rans
ferr
ed fr
om e
quity
....
...
– –
(638
)13
0 54
–
– –
(454
)(1
)(4
55)
Tran
sfer
s ...
......
......
......
......
......
......
......
......
......
......
......
......
......
.. –
– (1
,964
)(2
31)
9
2,20
0 (1
4)–
– –
– N
et d
ecre
ase
in m
inor
ity in
tere
sts a
risin
g on
acq
uisi
tions
, di
spos
als a
nd c
apita
l iss
uanc
e ...
......
......
......
......
......
......
......
. –
– –
– –
– –
– –
(100
)(1
00)
At 3
0 Ju
ne ..
......
......
......
......
......
......
......
......
......
......
......
......
......
. 5,
857
7,83
4 74
,251
2,
403
(223
) 6,
520
2,08
0 21
,058
11
9,78
0 6,
711
126,
491
Cum
ulat
ive
good
will
am
ount
ing
to U
S$5,
138
mill
ion
has b
een
char
ged
agai
nst r
eser
ves i
n re
spec
t of a
cqui
sitio
ns o
f sub
sidi
arie
s pri
or to
1 J
anua
ry 1
998,
incl
udin
g U
S$3,
469
mill
ion
char
ged
agai
nst t
he
mer
ger r
eser
ve a
risi
ng o
n th
e ac
quis
ition
of H
SBC
Ban
k pl
c. T
he b
alan
ce o
f US$
1,66
9 m
illio
n w
as c
harg
ed a
gain
st re
tain
ed e
arni
ngs.
For f
ootn
otes
, see
pag
e 23
1.

231
Hal
f-ye
ar to
31
Dec
embe
r 200
7
Oth
er re
serv
es
Cal
led
up
sh
are
ca
pita
l
Shar
e
prem
ium
1
Ret
aine
d
earn
ings
2
Ava
ilabl
e-
fo
r-sa
le
fai
r val
ue
re
serv
e
Cas
h flo
w
he
dgin
g
rese
rve3
Fore
ign
exc
hang
e
rese
rve
Sh
are-
base
d
paym
ent
re
serv
e
Mer
ger
re
serv
e4
To
tal
sh
are-
ho
lder
s’
eq
uity
Min
ority
inte
rest
s
Tota
l
equi
ty
US$
m
US$
m
US$
m
US$
m
US$
m
US$
m
US$
m
US$
m
US$
m
US$
m
US$
m
At 1
July
.....
......
......
......
......
......
......
......
......
......
......
......
......
......
. 5,
857
7,83
4 74
,251
2,
403
(223
) 6,
520
2,08
0 21
,058
11
9,78
0 6,
711
126,
491
Sh
ares
issu
ed u
nder
em
ploy
ee sh
are
plan
s ...
......
......
......
......
...
13
346
– –
– –
– –
359
– 35
9 Sh
ares
issu
ed in
lieu
of d
ivid
ends
and
am
ount
s ar
isin
g th
ereo
n1 .....
......
......
......
......
......
......
......
......
......
......
....
45
(46)
1,52
6 –
– –
– –
1,52
5 –
1,52
5 Pr
ofit
for t
he p
erio
d ...
......
......
......
......
......
......
......
......
......
......
...
– –
8,23
8 –
– –
– –
8,23
8 70
3 8,
941
Div
iden
ds to
shar
ehol
ders
.....
......
......
......
......
......
......
......
......
...
– –
(4,0
49)
– –
– –
– (4
,049
)(3
14)
(4,3
63)
Ow
n sh
ares
adj
ustm
ent .
......
......
......
......
......
......
......
......
......
......
–
– 77
–
– –
– –
77
– 77
Sh
are
of c
hang
es re
cogn
ised
dire
ctly
in e
quity
in th
e
equi
ty o
f ass
ocia
tes o
r joi
nt v
entu
res
......
......
......
......
......
.....
– –
186
– –
– –
– 18
6 –
186
Act
uaria
l gai
ns/(l
osse
s) o
n de
fined
ben
efit
plan
s ...
......
......
.....
– –
230
– –
– –
– 23
0 (9
1)13
9 Ex
chan
ge d
iffer
ence
s ...
......
......
......
......
......
......
......
......
......
......
–
– 3,
495
60
(19)
13
(1
4)–
3,53
5 11
8 3,
653
Fair
valu
e ga
ins/
(loss
es) t
aken
to e
quity
.....
......
......
......
......
.....
– –
– (5
29)
214
– –
– (3
15)
139
(176
) A
mou
nts t
rans
ferr
ed to
the
inco
me
stat
emen
t ....
......
......
......
....
– –
– (9
38)
(1,3
23)
– –
– (2
,261
)(1
4)(2
,275
) Ex
erci
se a
nd la
pse
of sh
are
optio
ns a
nd v
estin
g of
sh
are
awar
ds ..
......
......
......
......
......
......
......
......
......
......
......
.....
– –
281
– –
– (3
08)
– (2
7)–
(27)
C
ost o
f sha
re-b
ased
pay
men
t arr
ange
men
ts ..
......
......
......
......
...
– –
– –
– –
457
– 45
7 –
457
Oth
er m
ovem
ents
.....
......
......
......
......
......
......
......
......
......
......
.....
– –
439
13
(4)
– (2
61)
– 18
7 22
20
9 Ta
x on
item
s tak
en d
irect
ly to
or t
rans
ferr
ed fr
om e
quity
....
...
– –
(82)
(99)
419
– –
– 23
8 (9
)22
9 Tr
ansf
ers
......
......
......
......
......
......
......
......
......
......
......
......
......
.....
– –
(3,4
95)
(60)
19
3,52
2 14
–
– –
– N
et d
ecre
ase
in m
inor
ity in
tere
sts a
risin
g on
acq
uisi
tions
, di
spos
als a
nd c
apita
l iss
uanc
e ...
......
......
......
......
......
......
......
. –
– –
– –
– –
– –
(9)
(9)
At 3
1 D
ecem
ber .
......
......
......
......
......
......
......
......
......
......
......
.....
5,91
5 8,
134
81,0
97
850
(917
) 10
,055
1,
968
21,0
58
128,
160
7,25
6 13
5,41
6
Cum
ulat
ive
good
will
am
ount
ing
to U
S$5,
138
mill
ion
has b
een
char
ged
agai
nst r
eser
ves i
n re
spec
t of a
cqui
sitio
ns o
f sub
sidi
arie
s pri
or to
1 J
anua
ry 1
998,
incl
udin
g U
S$3,
469
mill
ion
char
ged
agai
nst t
he
mer
ger r
eser
ve a
risi
ng o
n th
e ac
quis
ition
of H
SBC
Ban
k pl
c. T
he b
alan
ce o
f US$
1,66
9 m
illio
n w
as c
harg
ed a
gain
st re
tain
ed e
arni
ngs.
1 Sh
are
prem
ium
incl
udes
the
dedu
ctio
n of
US$
1 m
illio
n (3
0 Ju
ne 2
007:
US$
2 m
illio
n; 3
1 D
ecem
ber 2
007;
US$
1 m
illio
n) in
resp
ect o
f iss
ue c
osts
incu
rred
dur
ing
the
peri
od.
2 Re
tain
ed e
arni
ngs i
nclu
de 1
87,0
83,7
46 (U
S$3,
235
mill
ion)
of o
wn
shar
es h
eld
with
in H
SBC
’s in
sura
nce
busi
ness
, ret
irem
ent f
unds
for t
he b
enef
it of
pol
icyh
olde
rs o
r ben
efic
iari
es w
ithin
em
ploy
ee tr
usts
fo
r the
settl
emen
t of s
hare
s exp
ecte
d to
be
deliv
ered
und
er e
mpl
oyee
shar
e sc
hem
es o
r bon
us p
lans
, and
the
mar
ket-m
akin
g ac
tiviti
es in
Glo
bal M
arke
ts (3
0 Ju
ne 2
007;
165
,269
,416
(US$
2,69
2 m
illio
n):
31 D
ecem
ber 2
007;
158
,706
,463
(US$
2,64
9 m
illio
n)).
30 J
une
2007
num
bers
hav
e be
en re
stat
ed to
con
form
with
the
curr
ent p
erio
d’s p
rese
ntat
ion.
3
Amou
nts t
rans
ferr
ed to
the
inco
me
stat
emen
t in
resp
ect o
f cas
h flo
w h
edge
s inc
lude
US$
172
mill
ion
inco
me
(30
June
200
7; U
S$11
2 m
illio
n in
com
e: 3
1 D
ecem
ber 2
007;
US$
55 m
illio
n lo
ss) t
aken
to ‘N
et
inte
rest
inco
me’
and
US$
962
mill
ion
(30
June
200
7; U
S$45
6 m
illio
n: 3
1 D
ecem
ber 2
007;
US$
1,37
3 m
illio
n) ta
ken
to ‘N
et tr
adin
g in
com
e’.
4 St
atut
ory
shar
e pr
emiu
m re
lief u
nder
Sec
tion
131
of th
e C
ompa
nies
Act
198
5 w
as ta
ken
in re
spec
t of t
he a
cqui
sitio
n of
HSB
C B
ank
plc
in 1
992,
HSB
C F
ranc
e in
200
0 an
d H
SBC
Fin
ance
Cor
pora
tion
in
2003
and
the
shar
es is
sued
wer
e re
cord
ed a
t the
ir n
omin
al v
alue
onl
y. In
HSB
C’s
con
solid
ated
acc
ount
s the
fair
val
ue d
iffer
ence
s of U
S$8,
290
mill
ion
in re
spec
t of H
SBC
Fra
nce
and
US$
12,7
68 m
illio
n in
re
spec
t of H
SBC
Fin
ance
Cor
pora
tion
com
pris
e th
e m
erge
r res
erve
. 5
Dur
ing
Apri
l 200
8, H
SBC
Hol
ding
s iss
ued
US$
2,20
0 m
illio
n of
Per
petu
al S
ubor
dina
ted
Cap
ital S
ecur
ities
(‘C
apita
l Sec
uriti
es’)
of w
hich
ther
e w
ere
US$
66 m
illio
n of
issu
ance
cos
ts, w
hich
are
cla
ssifi
ed
as e
quity
und
er IF
RSs.
The
Cap
ital S
ecur
ities
are
exc
hang
eabl
e at
HSB
C H
oldi
ngs’
opt
ion
into
non
-cum
ulat
ive
dolla
r pre
fere
nce
shar
es o
n an
y co
upon
pay
men
t dat
e. In
tere
st o
n th
e C
apita
l Sec
uriti
es is
pa
id q
uart
erly
and
may
be
defe
rred
at t
he d
iscr
etio
n of
HSB
C H
oldi
ngs.
The
Cap
ital S
ecur
ities
may
onl
y be
rede
emed
at t
he o
ptio
n of
HSB
C H
oldi
ngs.

H S B C H O L D I N G S P L C
Notes on the Financial Statements (unaudited) (continued)
232
16 Notes on the cash flow statement
Half-year to 30 June
2008 30 June
2007 31 December
2007 US$m US$m US$m Non-cash items included in profit before tax
Depreciation, amortisation and impairment ................................................ 1,766 1,184 1,338 Gains arising from dilution of interests in associates ................................. – (1,076) (16)Revaluations on investment property .......................................................... (27) (48) (104)Share-based payment expense .................................................................... 427 413 457 Loan impairment losses gross of recoveries ............................................... 10,436 6,635 11,547 Provisions for liabilities and charges .......................................................... 107 282 707 Impairment of financial investments .......................................................... 418 18 86 Charge for defined benefit plans ................................................................. 234 342 385 Accretion of discounts and amortisation of premiums ............................... (461) (392) (57)
12,900 7,358 14,343 Change in operating assets
Change in prepayments and accrued income .............................................. 2,294 (2,280) (2,789)Change in net trading securities and net derivatives .................................. (29,675) 10,487 (15,459)Change in loans and advances to banks ...................................................... 1,605 (357) (8,565)Change in loans and advances to customers ............................................... (76,452) (66,739) (65,147)Change in financial assets designated at fair value .................................... 2,923 (5,872) (7,488)Change in other assets ................................................................................. (1,826) (924) (11,405)
(101,131) (65,685) (110,853) Change in operating liabilities
Change in accruals and deferred income .................................................... (4,219) 547 4,572 Change in deposits by banks ....................................................................... 20,947 29,661 2,933 Change in customer accounts ...................................................................... 63,277 84,496 115,310 Change in debt securities in issue ............................................................... (16,522) (1,086) (11,403)Change in financial liabilities designated at fair value ............................... (181) 5,755 6,549 Change in other liabilities ........................................................................... 6,093 3,875 8,886
69,395 123,248 126,847 Cash and cash equivalents comprise
Cash and balances at central banks ............................................................. 13,473 16,651 21,765 Items in the course of collection from other banks...................................... 16,719 23,152 9,777 Loans and advances to banks of one month or less .................................... 244,608 220,136 232,320 Treasury bills, other bills and certificates of deposit
less than three months ............................................................................. 28,067 32,684 41,819 Less: items in the course of transmission to other banks ........................... (15,329) (20,339) (8,672)
287,538 272,284 297,009 Interest and dividends
Interest paid ................................................................................................. (31,752) (31,002) (32,624)Interest received .......................................................................................... 53,945 47,423 55,970 Dividends received ...................................................................................... 1,339 1,426 407
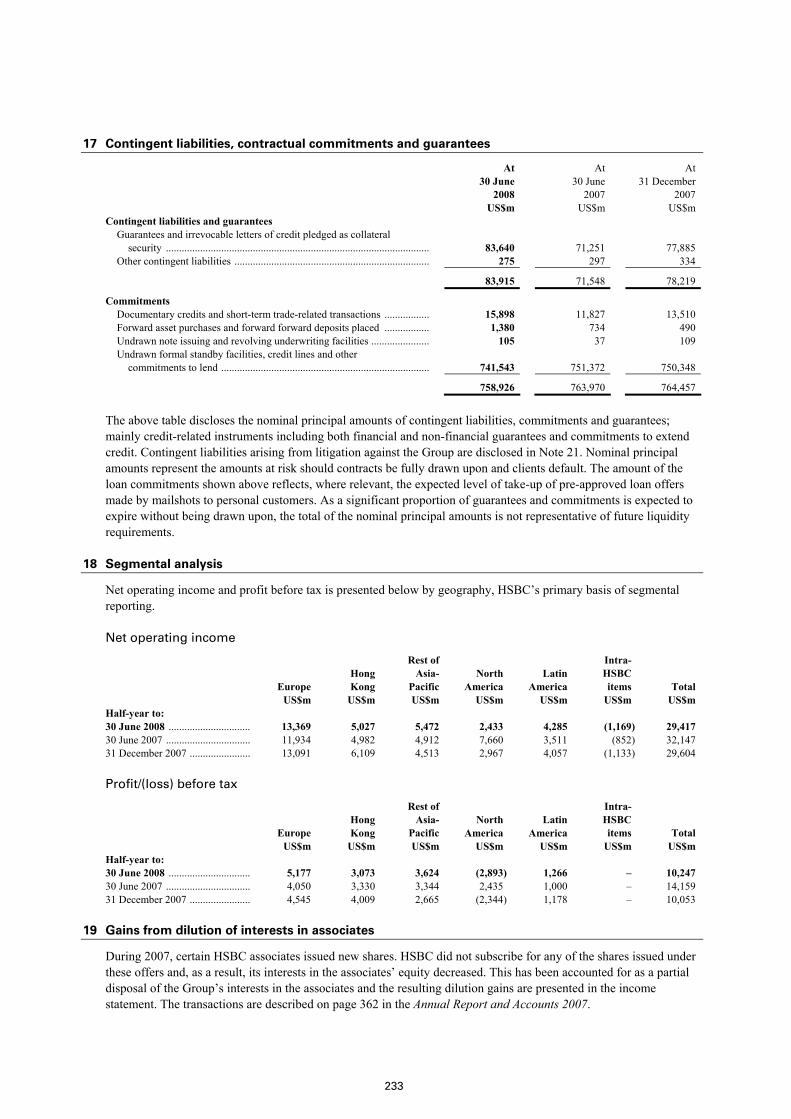
233
17 Contingent liabilities, contractual commitments and guarantees
At 30 June 2008
At 30 June 2007
At 31 December 2007
US$m US$m US$m Contingent liabilities and guarantees
Guarantees and irrevocable letters of credit pledged as collateral security .................................................................................................... 83,640 71,251 77,885
Other contingent liabilities .......................................................................... 275 297 334
83,915 71,548 78,219
Commitments Documentary credits and short-term trade-related transactions ................. 15,898 11,827 13,510 Forward asset purchases and forward forward deposits placed ................. 1,380 734 490 Undrawn note issuing and revolving underwriting facilities ...................... 105 37 109 Undrawn formal standby facilities, credit lines and other
commitments to lend ............................................................................... 741,543 751,372 750,348
758,926 763,970 764,457
The above table discloses the nominal principal amounts of contingent liabilities, commitments and guarantees; mainly credit-related instruments including both financial and non-financial guarantees and commitments to extend credit. Contingent liabilities arising from litigation against the Group are disclosed in Note 21. Nominal principal amounts represent the amounts at risk should contracts be fully drawn upon and clients default. The amount of the loan commitments shown above reflects, where relevant, the expected level of take-up of pre-approved loan offers made by mailshots to personal customers. As a significant proportion of guarantees and commitments is expected to expire without being drawn upon, the total of the nominal principal amounts is not representative of future liquidity requirements.
18 Segmental analysis
Net operating income and profit before tax is presented below by geography, HSBC’s primary basis of segmental reporting.
Net operating income
Europe Hong Kong
Rest of Asia- Pacific
North America
Latin America
Intra- HSBC items
Total US$m US$m US$m US$m US$m US$m US$m Half-year to: 30 June 2008 ............................... 13,369 5,027 5,472 2,433 4,285 (1,169) 29,417 30 June 2007 ................................ 11,934 4,982 4,912 7,660 3,511 (852) 32,147 31 December 2007 ....................... 13,091 6,109 4,513 2,967 4,057 (1,133) 29,604
Profit/(loss) before tax
Europe Hong Kong
Rest of Asia- Pacific
North America
Latin America
Intra- HSBC items
Total US$m US$m US$m US$m US$m US$m US$m Half-year to: 30 June 2008 ............................... 5,177 3,073 3,624 (2,893) 1,266 – 10,247 30 June 2007 ................................ 4,050 3,330 3,344 2,435 1,000 – 14,159 31 December 2007 ....................... 4,545 4,009 2,665 (2,344) 1,178 – 10,053
19 Gains from dilution of interests in associates
During 2007, certain HSBC associates issued new shares. HSBC did not subscribe for any of the shares issued under these offers and, as a result, its interests in the associates’ equity decreased. This has been accounted for as a partial disposal of the Group’s interests in the associates and the resulting dilution gains are presented in the income statement. The transactions are described on page 362 in the Annual Report and Accounts 2007.

H S B C H O L D I N G S P L C
Notes on the Financial Statements (unaudited) (continued)
234
20 Goodwill impairment
It is HSBC’s policy to test goodwill for impairment annually, and to perform an impairment test more frequently for cash generating units (‘CGUs’) when there are indications that conditions have changed for those CGUs since the last goodwill impairment test that would result in a different outcome.
As a result of the continued deterioration in economic and credit conditions in North America, and the resulting further restructuring in the Personal Financial Services – North America CGU, an impairment test was performed on this CGU at 30 June 2008. This involved comparing the recoverable amount of the CGU to its carrying value including goodwill. Recoverable amount is estimated using a value in use calculation based on future cash flow estimates discounted to present value. Cash flow estimates are based on management’s cash flow projections, extrapolated in perpetuity using a nominal long-term growth rate based on current market assessment of GDP and inflation for the countries within which the CGU operates. Cash flows are extrapolated in perpetuity due to the long-term perspective within the Group of the business units making up its CGUs. The discount rate used reflects the cost of capital HSBC allocates to investments in North America, as well as the cost of capital for each type of business within the CGU. The test confirmed that goodwill for the CGU was impaired and an impairment charge of US$527 million was recognised as goodwill impairment in the income statement. There was no prior impairment recognised on this CGU.
The process of identifying and evaluating goodwill impairment is inherently uncertain because it requires significant management judgement in making a series of estimations, the results of which are highly sensitive to the assumptions used. The review of goodwill impairment represents management’s best estimate of the factors discussed in detail on page 133 in the Annual Report and Accounts 2007.
The goodwill impairment testing performed for the Personal Financial Services – North America CGU is highly sensitive to the assumptions and estimates used, and it is possible that the outcomes within the second half of 2008 could be different from the assumptions and estimates made as at 30 June 2008. In the event of further significant deterioration in the economic and credit conditions beyond the levels already reflected by management in the cash flow forecasts for the CGU, a further special review would be made. If this review indicated that a further deterioration in economic and credit conditions and future outlook was sufficiently severe, this could result in a further material impairment to the carrying amount of goodwill.
Two key assumptions upon which management has based its determination of the recoverable amount of the Personal Financial Services - North America CGU are the discount rate and the long-term growth rate. The blended discount rate and the blended long-term growth rate used in the impairment testing at 30 June 2008 were 12.9 per cent and 4.0 per cent respectively (31 December 2007: 12.3 per cent and 4.0 per cent respectively). A 50 basis point increase in the discount rate, assuming no effects on other variables, would decrease the recoverable amount of goodwill by US$2 billion. A 50 basis point decrease in the long-term growth rate, assuming no effects on other variables, would decrease the recoverable amount of goodwill by US$1.1 billion.
21 Litigation
HSBC is party to legal actions in a number of jurisdictions including the UK, Hong Kong and the US, arising out of its normal business operations. HSBC considers that none of the actions is material, and none is expected to result in a significant adverse effect on the financial position of HSBC, either individually or in the aggregate. Management believes that adequate provisions have been made in respect of such litigation. HSBC has not disclosed any contingent liability associated with these legal actions because it is not practicable to do so, except as set out below.
On 27 July 2007, the UK Office of Fair Trading issued High Court legal proceedings against a number of UK financial institutions, including HSBC Bank plc, to determine the legal status and enforceability of certain of the charges applied to their personal customers in relation to unauthorised overdrafts (the ‘charges’).
Certain preliminary issues in these proceedings were heard in a trial in the Commercial Division of the High Court on 17th January 2008 and judgement was given on 24 April 2008. This confirmed that HSBC Bank plc’s current charges are capable of being tested for fairness but are not capable of being penalties. HSBC Bank plc is appealing the finding that the charges are capable of being tested for fairness. A further hearing took place on 7 to 9 July 2008, at which the Court considered certain further preliminary issues relating to HSBC Bank plc’s historic charges. Judgement on such preliminary issues is awaited.
The proceedings remain at an early stage and may, allowing for appeals on the preliminary issues (and/or subsequently on substantive issues), take a number of years to conclude. A wide range of outcomes is possible,
235
depending, initially, upon the outcome of the preliminary issues in the Commercial Division and/or Court of Appeal and, to the extent applicable, upon the Court’s subsequent assessment of each charge across the period under review. Since July 2001, there have been a variety of charges applied by HSBC Bank plc across different charging periods under the then existing contractual arrangements. HSBC Bank plc considers the charges to be and to have been valid and enforceable, and intends strongly to defend its position.
If, contrary to HSBC Bank plc’s current assessment, the Court should ultimately (after appeals) reach a decision adverse to HSBC Bank plc that results in a liability for it, a large number of different outcomes is possible, each of which would have a different financial impact. Based on the facts currently available, and a number of assumptions, HSBC Bank plc estimates that the financial impact could be approximately US$700 million. To make an estimate of the potential financial impact at this stage with any precision is extremely difficult, owing to (among other things) the complexity of the issues, the number of permutations of possible outcomes, and the early stage of the proceedings. In addition, the assumptions made by HSBC Bank plc may prove to be incorrect.
22 Events after the balance sheet date
Korea Exchange Bank
On 3 September, HSBC announced that its indirect, wholly-owned subsidiary, HSBC Asia Pacific Holdings (UK) Limited (‘HSBC Asia’) had entered into a conditional agreement to acquire 51.02 per cent of the issued share capital of Korea Exchange Bank (‘KEB’) from LSF-KEB Holdings SCA (‘Lone Star’). The acquisition agreement provides that the acquisition is subject to a number of conditions, including the receipt of applicable governmental and regulatory approvals, in particular approval from Korea’s Financial Services Commission (‘FSC Approval’).
On 29 April 2008, HSBC Asia and Lone Star agreed to extend the deadline for completion of this transaction (the ‘Long-stop Date’) from 30 April 2008 to 31 July 2008. The parties also agreed that if FSC Approval is obtained during the currency of the acquisition agreement, the Long-stop Date will automatically be re-fixed as the date which is two months after the date of the FSC Approval. The acquisition agreement provides that either HSBC Asia or Lone Star may terminate the acquisition agreement if completion has not occurred on or before the Long-stop Date.
The regulatory filing in respect of the proposed acquisition was submitted to the Korean Financial Services Commission in December 2007 but, as at 1 August 2008, FSC Approval had not been granted. Accordingly, from 31 July 2008, the existing acquisition agreement may be terminated at any time by either party up until such time as FSC Approval is granted.
At the date of these financial statements, HSBC Asia had not terminated the acquisition agreement nor had it received a notice of termination from Lone Star. HSBC Asia and Lone Star are discussing how this transaction may be taken forward.
Other events after the balance sheet date
On 2 July 2008, HSBC completed the sale of seven regional banks to Banque Fédérale des Banques Populaires for €2.1 billion (US$3.2 billion). At 30 June 2008, the aggregate third party total assets attributable to the French regional banking subsidiaries were €6,741 million (US$10,636 million), and they generated net profits after tax of €62 million (US$95 million) for the six months ended 30 June 2008. The Group’s pre-tax profit on sale was US$2.1 billion.
In July 2008, HSBC decided to cease originating new business in the North American vehicle finance business of HSBC Finance and place the business in run-off. Total assets attributable to the HSBC Finance vehicle finance business at 30 June 2008 amounted to US$12.5 billion and, in the six months ended 30 June 2008, the business made profit before tax of US$27 million (year ended 31 December 2007:US$229 million). HSBC management estimate that some 80 per cent of the portfolio will be run off in the normal course of business in the next three years, with the remaining balance reducing thereafter.

H S B C H O L D I N G S P L C
Notes on the Financial Statements (unaudited) (continued)
236
23 Interim Report 2008 and statutory accounts
The information in this Interim Report 2008 is unaudited and does not constitute statutory accounts within the meaning of section 240 of the Companies Act 1985 (‘the Act’). The Interim Report 2008 was approved by the Board of Directors on 4 August 2008. The statutory accounts for the year ended 31 December 2007 have been delivered to the Registrar of Companies in England and Wales in accordance with section 242 of the Act. The auditor has reported on those accounts. Its report was (i) unqualified, (ii) did not include reference to any matters which the auditors drew attention by way of emphasis without qualifying their report, and (iii) did not contain a statement under section 237(2) or (3) of the Act.

H S B C H O L D I N G S P L C
Responsibility Statement
237
We confirm that to the best of our knowledge:
• the condensed set of financial statements has been prepared in accordance with IAS 34 Interim Financial Reporting as adopted by the EU;
• the Interim Management Report includes a fair review of the information required by:
(a) DTR 4.2.7R of the Disclosure Rules and Transparency Rules, being an indication of important events that have occurred during the first six months of the financial year ending 31 December 2008 and their impact on the condensed set of financial statements; and a description of the principal risks and uncertainties for the remaining six months of the financial year; and
(b) DTR 4.2.8R of the Disclosure Rules and Transparency Rules, being related parties transactions that have taken place in the first six months of the financial year ending 31 December 2008 and that have materially affected the financial position or performance of HSBC during that period; and any changes in the related parties transactions described in the Annual Report 2007 that could do so.
S K Green (Group Chairman), M F Geoghegan (Group Chief Executive), S A Catz†, V H C Cheng (Chairman of The Hongkong and Shanghai Banking Corporation Limited), J D Coombe†, J L Durán†, R A Fairhead†, D J Flint (Group Finance Director), A A Flockhart (Chief Executive Officer of The Hongkong and Shanghai Banking Corporation Limited and Global Head of Commercial Banking), W K L Fung*, S T Gulliver (Head of Global Banking and Markets and HSBC Global Asset Management), J W J Hughes-Hallett†, W S H Laidlaw†, Sir Mark Moody-Stuart†, G Morgan†, N R N Murthy†, S W Newton†, S M Robertson† and Sir Brian Williamson†.
* Non-executive Director † Independent non-executive Director
4 August 2008

H S B C H O L D I N G S P L C
Independent Review Report by KPMG Audit Plc to HSBC Holdings plc
238
Introduction
We have been engaged by HSBC Holdings plc (‘the Company’) to review the financial information for the six months ended 30 June 2008 set out on pages 207 to 236 which comprises the consolidated income statement, consolidated balance sheet, consolidated statement of recognised income and expense, consolidated cash flow statement and related notes. We have read the other information contained in the Interim Report 2008 and considered whether it contains any apparent misstatements or material inconsistencies with the information in the financial information.
This report is made solely to the Company in accordance with the terms of our engagement to assist the Company in meeting the requirements of the Disclosure and Transparency Rules (‘the DTR’) of the UK’s Financial Services Authority (‘the UK FSA’). Our review has been undertaken so that we might state to the Company those matters we are required to state to it in this report and for no other purpose. To the fullest extent permitted by law, we do not accept or assume responsibility to anyone other than the Company for our review work, for this report, or for the conclusions we have reached.
Directors’ responsibilities
The Interim Report 2008 is the responsibility of, and has been approved by, the Directors. The Directors are responsible for preparing the Interim Report 2008 in accordance with the DTR of the UK FSA. As disclosed in Note 1, the annual financial statements of the Company are prepared in accordance with IFRSs as adopted by the EU. The financial information included in this half-yearly financial report has been prepared in accordance with IAS 34 Interim Financial Reporting as adopted by the EU.
Our responsibility
Our responsibility is to express to the Company a conclusion on the financial information in the Interim Report 2008 based on our review.
Scope of review
We conducted our review in accordance with International Standard on Review Engagements (UK and Ireland) 2410 Review of Interim Financial Information Performed by the Independent Auditor of the Entity issued by the Auditing Practices Board for use in the UK. A review of interim financial information consists of making enquiries, primarily of persons responsible for financial and accounting matters, and applying analytical and other review procedures. A review is substantially less in scope than an audit conducted in accordance with International Standards on Auditing (UK and Ireland) and consequently does not enable us to obtain assurance that we would become aware of all significant matters that might be identified in an audit. Accordingly, we do not express an audit opinion.
Conclusion
Based on our review, nothing has come to our attention that causes us to believe that the financial information in the Interim Report 2008 for the six months ended 30 June 2008 is not prepared, in all material respects, in accordance with IAS 34 as adopted by the EU and the DTR of the UK FSA.
KPMG Audit Plc Chartered Accountants London 4 August 2008
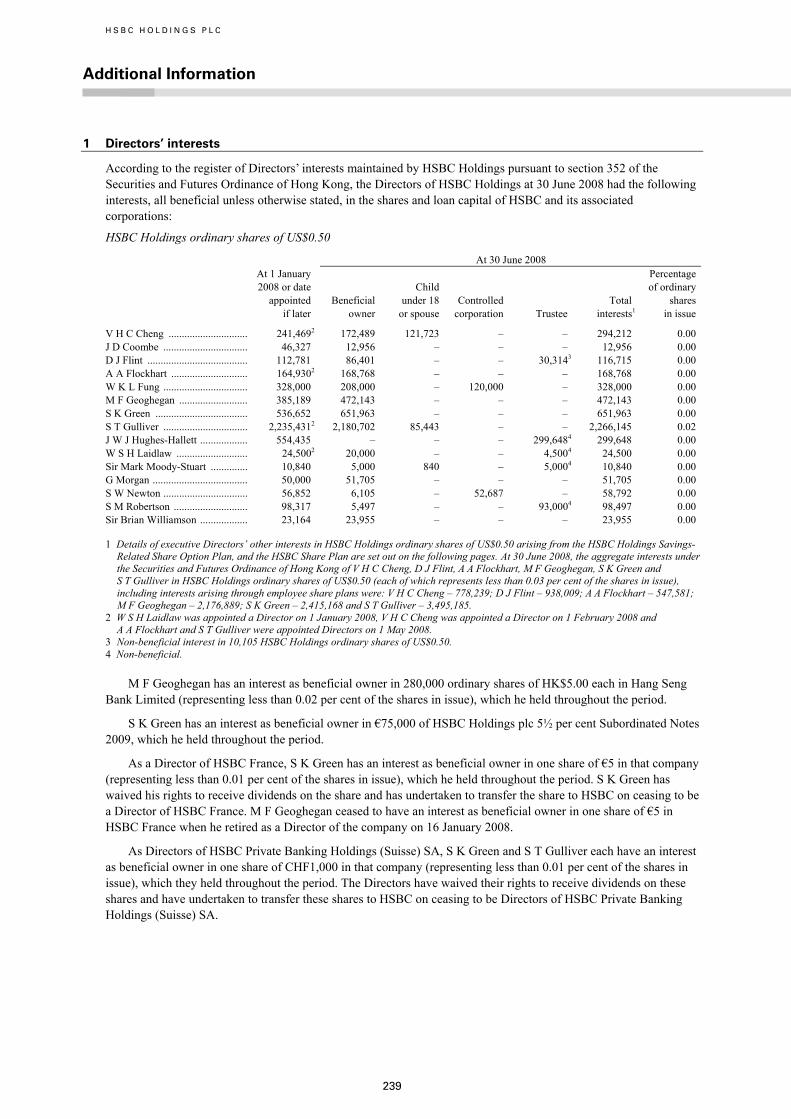
H S B C H O L D I N G S P L C
Additional Information
239
1 Directors’ interests
According to the register of Directors’ interests maintained by HSBC Holdings pursuant to section 352 of the Securities and Futures Ordinance of Hong Kong, the Directors of HSBC Holdings at 30 June 2008 had the following interests, all beneficial unless otherwise stated, in the shares and loan capital of HSBC and its associated corporations:
HSBC Holdings ordinary shares of US$0.50
At 30 June 2008 At 1 January
2008 or date appointed if later
Beneficial owner
Child under 18 or spouse
Controlled corporation
Trustee
Total interests1
Percentage of ordinary shares in issue
V H C Cheng .............................. 241,4692 172,489 121,723 – – 294,212 0.00 J D Coombe ................................ 46,327 12,956 – – – 12,956 0.00 D J Flint ...................................... 112,781 86,401 – – 30,3143 116,715 0.00 A A Flockhart ............................. 164,9302 168,768 – – – 168,768 0.00 W K L Fung ................................ 328,000 208,000 – 120,000 – 328,000 0.00 M F Geoghegan .......................... 385,189 472,143 – – – 472,143 0.00 S K Green ................................... 536,652 651,963 – – – 651,963 0.00 S T Gulliver ................................ 2,235,4312 2,180,702 85,443 – – 2,266,145 0.02 J W J Hughes-Hallett .................. 554,435 – – – 299,6484 299,648 0.00 W S H Laidlaw ........................... 24,5002 20,000 – – 4,5004 24,500 0.00 Sir Mark Moody-Stuart .............. 10,840 5,000 840 – 5,0004 10,840 0.00 G Morgan .................................... 50,000 51,705 – – – 51,705 0.00 S W Newton ................................ 56,852 6,105 – 52,687 – 58,792 0.00 S M Robertson ............................ 98,317 5,497 – – 93,0004 98,497 0.00 Sir Brian Williamson .................. 23,164 23,955 – – – 23,955 0.00
1 Details of executive Directors’ other interests in HSBC Holdings ordinary shares of US$0.50 arising from the HSBC Holdings Savings-Related Share Option Plan, and the HSBC Share Plan are set out on the following pages. At 30 June 2008, the aggregate interests under the Securities and Futures Ordinance of Hong Kong of V H C Cheng, D J Flint, A A Flockhart, M F Geoghegan, S K Green and S T Gulliver in HSBC Holdings ordinary shares of US$0.50 (each of which represents less than 0.03 per cent of the shares in issue), including interests arising through employee share plans were: V H C Cheng – 778,239; D J Flint – 938,009; A A Flockhart – 547,581; M F Geoghegan – 2,176,889; S K Green – 2,415,168 and S T Gulliver – 3,495,185.
2 W S H Laidlaw was appointed a Director on 1 January 2008, V H C Cheng was appointed a Director on 1 February 2008 and A A Flockhart and S T Gulliver were appointed Directors on 1 May 2008.
3 Non-beneficial interest in 10,105 HSBC Holdings ordinary shares of US$0.50. 4 Non-beneficial.
M F Geoghegan has an interest as beneficial owner in 280,000 ordinary shares of HK$5.00 each in Hang Seng Bank Limited (representing less than 0.02 per cent of the shares in issue), which he held throughout the period.
S K Green has an interest as beneficial owner in €75,000 of HSBC Holdings plc 5½ per cent Subordinated Notes 2009, which he held throughout the period.
As a Director of HSBC France, S K Green has an interest as beneficial owner in one share of €5 in that company (representing less than 0.01 per cent of the shares in issue), which he held throughout the period. S K Green has waived his rights to receive dividends on the share and has undertaken to transfer the share to HSBC on ceasing to be a Director of HSBC France. M F Geoghegan ceased to have an interest as beneficial owner in one share of €5 in HSBC France when he retired as a Director of the company on 16 January 2008.
As Directors of HSBC Private Banking Holdings (Suisse) SA, S K Green and S T Gulliver each have an interest as beneficial owner in one share of CHF1,000 in that company (representing less than 0.01 per cent of the shares in issue), which they held throughout the period. The Directors have waived their rights to receive dividends on these shares and have undertaken to transfer these shares to HSBC on ceasing to be Directors of HSBC Private Banking Holdings (Suisse) SA.

H S B C H O L D I N G S P L C
Additional Information (continued)
240
HSBC Holdings Savings-Related Share Option Plan HSBC Holdings ordinary shares of US$0.50
Date of award
Exercise price (£)
Exercisable from1
Exercisable until
Options held at 1 January 2008 or date appointed if later
Options awarded during period
Options held at 30 June 2008
V H C Cheng ................... 23 Apr 2003 5.3496 1 Aug 2008 31 Jan 2009 3,0702 – 3,070
D J Flint ........................... 25 Apr 2007 7.0872 1 Aug 2012 31 Jan 2013 2,310 – 2,310
A A Flockhart .................. 25 Apr 2007 7.0872 1 Aug 2010 31 Jan 2011 1,3323 – 1,332
S K Green ........................ 23 Apr 2003 5.3496 1 Aug 2008 31 Jan 2009 3,070 – 3,070
The options were awarded for nil consideration and are exercisable at a 20 per cent discount to the average market value of the ordinary shares on the five business days immediately preceding the invitation date. The market value of the ordinary shares at 30 June 2008 was £7.7575. The highest and lowest market values during the period were £8.97 and £7.12. Market value is the mid-market price derived from the London Stock Exchange Daily Official List on the relevant date. Under the Securities and Futures Ordinance of Hong Kong, the options are categorised as unlisted physically settled equity derivatives.
1 May be advanced to an earlier date in certain circumstances, e.g. retirement. 2 Appointed a Director on 1 February 2008. 3 Appointed a Director on 1 May 2008. HSBC Holdings Restricted Share Plan 2000 HSBC Holdings ordinary shares of US$0.50
Date of award
Year in which awards may vest
Awards held at 1 January 2008 or date appointed if later
Awards held at 30 June 20081
V H C Cheng ......................................................................... 5 Mar 2003 2008 55,0282 –
D J Flint ................................................................................. 5 Mar 2003 2008 136,192 –
M F Geoghegan ..................................................................... 5 Mar 2003 2008 63,558 –
S K Green .............................................................................. 5 Mar 2003 2008 136,192 –
Vesting of these awards was subject to the achievement of corporate performance conditions. Under the Securities and Futures Ordinance of Hong Kong, interests held through the HSBC Holdings Restricted Share Plan 2000 were categorised as the interests of a beneficiary of a trust.
1 The corporate performance conditions were not met and, under the rules of the Plan, the awards (including additional shares arising from scrip dividends) held by: V H C Cheng, 55,028 shares; D J Flint, 137,568 shares; M F Geoghegan, 64,200 shares; and S K Green, 137,568 shares, were forfeited on 4 April 2008. The awards held by A A Flockhart, 27,514 shares; and S T Gulliver, 55,028 shares, who were appointed as Directors on 1 May 2008, were also forfeited on 4 April 2008. As a consequence, the fourth interim dividend for 2007 was not received on these forfeited share awards.
2 Appointed a Director on 1 February 2008.
HSBC Share Plan HSBC Holdings ordinary shares of US$0.50 Awards of Performance Shares
Year in which
Awards held at 1 January 2008 or date
Awards made during period1
Awards vested during period Awards held
Date of award
awards may vest
appointed if later Number
Monetary value Number
Monetary value
at 30 June 20082
£000 £000
V H C Cheng3 .. 27 May 20054,5 2008 91,824 – – 47,002 405 – 6 Mar 2006 2009 88,534 – – – – 90,639 5 Mar 2007 2010 172,636 – – – – 176,741 3 Jun 2008 2011 – 129,325 1,103 – – 129,325
D J Flint ........... 27 May 20054,5 2008 194,796 – – 100,721 868 – 6 Mar 2006 2009 175,296 – – – – 181,278 5 Mar 2007 2010 256,029 – – – – 264,766 3 Jun 2008 2011 – 372,940 3,181 – – 372,940

241
Year in which
Awards held at 1 January 2008 or date
Awards made during period1
Awards vested during period Awards held
Date of award
awards may vest
appointed if later Number
Monetary value Number
Monetary value
at 30 June 20082
£000 £000
A A Flockhart6 . 27 May 20057 2008 779 – – 779 7 – 6 Mar 2006 2009 66,401 – – – – 67,980 5 Mar 2007 2010 114,998 – – – – 117,732 3 Jun 2008 2011 – 127,174 1,085 – – 127,174
M F Geoghegan 27 May 20054,5 2008 259,728 – – 134,295 1,157 – 6 Mar 2006 2009 219,121 – – – – 226,598 5 Mar 2007 2010 581,884 – – – – 601,740 3 Jun 2008 2011 – 876,408 7,476 – – 876,408
S K Green ........ 27 May 20054,5 2008 324,659 – – 167,868 1,446 – 6 Mar 2006 2009 273,900 – – – – 283,246 5 Mar 2007 2010 436,413 – – – – 451,305 3 Jun 2008 2011 – 1,025,584 8,748 – – 1,025,584
S T Gulliver6 .... 27 May 20057 2008 1,559 – – 1,559 14 – 6 Mar 2006 2009 110,667 – – – – 113,299 5 Mar 2007 2010 127,730 – – – – 130,767 3 Jun 2008 2011 – 55,409 473 – – 55,409
Vesting of Performance Share awards is subject to the achievement of corporate performance conditions. Under the Securities and Futures Ordinance of Hong Kong, interests held through the HSBC Share Plan are categorised as the interests of a beneficiary of a trust.
1 At the date of the award, 3 June 2008, the market value per share was £8.56. The shares acquired by the Trustee of the Plan were purchased at an average price of £8.53173.
2 Includes additional shares arising from scrip dividends. 3 Appointed a Director on 1 February 2008. 4 The Earnings Per Share element of the performance conditions was met and that element of the Performance Share awards vested on
1 April 2008, when the market value per share was £8.61, as follows: V H C Cheng, 45,911 shares; D J Flint, 98,382 shares; M F Geoghegan, 131,176 shares; and S K Green, 163,970 shares. Awards representing the fourth interim dividend for 2007 vested on 7 May 2008, when the market value per share was £8.875, as follows: V H C Cheng, 1,091 shares; D J Flint, 2,339 shares; M F Geoghegan, 3,119 shares; and S K Green, 3,898 shares.
5 The Total Shareholder Return element of the performance conditions was not met and, under the terms of the Plan, that element of the Performance Share awards held by: V H C Cheng, 45,913 shares; D J Flint, 98,383 shares; M F Geoghegan, 131,177 shares; and S K Green, 163,971 shares was forfeited on 2 April 2008. As a consequence, the fourth interim dividend for 2007 was not received on the forfeited shares.
6 Appointed a Director on 1 May 2008. 7 The Earnings Per Share element of the performance conditions was met and awards representing the fourth interim dividend for 2007
on that element of the 2005 Performance Share Awards vested on 7 May 2008, when the market value per share was £8.875, as follows: A A Flockhart, 779 shares; and S T Gulliver, 1,559 shares. Prior to their appointment as Directors, the Earnings Per Share element of the 2005 Performance Share awards vested on 1 April 2008, when the market value per share was £8.61, as follows: A A Flockhart, 32,794 shares; and S T Gulliver, 65,587 shares. The Total Shareholder Return element of the performance conditions was not met and, under the terms of the Plan, that element of the Performance Share awards was forfeited on 2 April 2008, as follows: A A Flockhart, 32,795 shares; and S T Gulliver, 65,587 shares. As a consequence, the fourth interim dividend for 2007 was not received on the forfeited share awards.
Awards of Restricted Shares
Years in which
Awards held
Awards made from date appointed to 30 June 20081
Awards vested from date appointed to 30 June 2008 Awards held
Date of award
awards may vest
on date appointed Number
Monetary value Number
Monetary value
at 30 June 20082
£000 £000
V H C Cheng3 ... 3 Mar 2008 2011 – 82,295 646 – – 84,252
A A Flockhart4 . 31 Oct 2007 2010 51,167 – – – – 52,383 3 Mar 2008 2010 11,929 – – – – 12,212
S T Gulliver4 .... 6 Mar 2006 20095 143,677 – – – – 147,093 5 Mar 2007 2009-20105 305,591 – – – – 312,857 3 Mar 2008 2009-20115 458,708 – – – – 469,615
Vesting of Restricted Share awards is normally subject to the Director remaining an employee on the vesting date. The vesting date may be advanced to an earlier date in certain circumstances, e.g. death. Under the Securities and Futures Ordinance of Hong Kong, interests held through the HSBC Share Plan are categorised as the interests of a beneficiary of a trust.

H S B C H O L D I N G S P L C
Additional Information (continued)
242
1 At the date of the award, 3 March 2008, the market value per share was £7.90. The shares acquired by the Trustee of the Plan were purchased at an average price of £7.848143.
2 Includes additional shares arising from scrip dividends. 3 Appointed a Director on 1 February 2008. 4 Appointed a Director on 1 May 2008. 5 33 per cent of the award vests on each of the first and second anniversaries of the date of the award, with the balance vesting on the
third anniversary of the date of the award.
No Directors held any short position as defined in the Securities and Futures Ordinance of Hong Kong in the shares and loan capital of HSBC and its associated corporations. Save as stated above, none of the Directors had an interest in any shares or debentures of HSBC or any associated corporation at the beginning or at the end of the period, and none of the Directors or members of their immediate family was awarded or exercised any right to subscribe for any shares or debentures in any HSBC corporation during the period. Since the end of the period, the interests of each of the following Directors have increased by the number of HSBC Holdings ordinary shares shown against their name:
Beneficial owner
Child under 18 or spouse
Controlled corporation Trustee
Beneficiary of a trust
V H C Cheng ........................................................................ – – – – 3,7591
J D Coombe .......................................................................... 1392 – – – – D J Flint ................................................................................ 9433 – – 3242 4,7661
M F Geoghegan .................................................................... 2,5002 – – – 8,8531
S K Green ............................................................................. 5,2824 – – – 7,8511
S T Gulliver .......................................................................... 13,7052 52 – – 12,5451
G Morgan .............................................................................. 5522 – – – – S W Newton .......................................................................... 652 – 5622 – – S M Robertson ...................................................................... 582 – – – – Sir Brian Williamson ............................................................ 2562 – – – –
1 Scrip dividend on awards held under the HSBC Share Plan. 2 Scrip dividend. 3 Comprises scrip dividend on shares held as beneficial owner (852 shares), the automatic reinvestment of dividend income by an
Individual Savings Account or Personal Equity Plan manager (59 shares), the acquisition of shares in the HSBC Holdings UK Share Ownership Plan through regular monthly contributions (16 shares) and the automatic reinvestment of dividend income on shares held in the plan (16 shares).
4 Comprises scrip dividend on shares held as beneficial owner (5,250 shares), the acquisition of shares in the HSBC Holdings UK Share Ownership Plan through regular monthly contributions (16 shares) and the automatic reinvestment of dividend income on shares held in the plan (16 shares).
2 Employee share plans
To help align the interests of employees with those of shareholders, share options are granted under all-employee share plans and discretionary awards of Performance Shares and Restricted Shares made under the HSBC Share Plan. There have been no awards of discretionary options since 30 September 2005. The following are particulars of outstanding employee share options, including those held by employees working under employment contracts that are regarded as ‘continuous contracts’ for the purposes of the Hong Kong Employment Ordinance. The options were granted at nil consideration. No options have been granted to substantial shareholders, suppliers of goods or services, or in excess of the individual limit for each share plan. No options were cancelled during the period. The options which were awarded, exercised or lapsed during the period are detailed in the tables below. Particulars of options held by Directors of HSBC Holdings are set out on page 239.
All-employee share plans
The exercise period of the options awarded under all-employee share plans may be advanced to an earlier date in certain circumstances, for example on retirement, or on the death of a participant, options may be exercised up to six months beyond the normal exercise period. The closing price per HSBC Holdings ordinary share on 29 April 2008, the day before options were awarded in 2008, was £8.71. The options are exercisable at a 20 per cent discount to the average market value of the ordinary shares on the five business days immediately preceding the invitation date, unless otherwise indicated.

243
HSBC Holdings Savings-Related Share Option Plan HSBC Holdings ordinary shares of US$0.50
Date of award
Exercise price (£)
Exercisable from
Exercisable until
Options at 1 January 2008
Options awarded during period
Options exercised during period1
Options lapsed during period
Options at 30 June 2008
2 May 2002 6.3224 1 Aug 2007 31 Jan 2008 86,920 – 62,288 22,281 2,351 23 Apr 2003 5.3496 1 Aug 2008 31 Jan 2009 10,402,796 – 87,149 94,153 10,221,494 21 Apr 2004 6.4720 1 Aug 2007 31 Jan 2008 132,967 – 90,779 38,874 3,314 21 Apr 2004 6.4720 1 Aug 2009 31 Jan 2010 4,941,092 – 31,391 117,909 4,791,792 24 May 2005 6.6792 1 Aug 2008 31 Jan 2009 3,522,870 – 25,678 111,612 3,385,580 24 May 2005 6.6792 1 Aug 2010 31 Jan 2011 4,938,431 – 26,178 170,782 4,741,471 26 Apr 2006 7.6736 1 Aug 2009 31 Jan 2010 3,817,398 – 12,672 406,141 3,398,585 26 Apr 2006 7.6736 1 Aug 2011 31 Jan 2012 3,062,172 – 6,390 292,130 2,763,652 25 Apr 2007 7.0872 1 Aug 2010 31 Jan 2011 5,767,372 – 4,611 610,474 5,152,287 25 Apr 2007 7.0872 1 Aug 2012 31 Jan 2013 4,075,471 – 1,574 325,115 3,748,782 30 Apr 2008 6.8160 1 Aug 2011 31 Jan 2012 – 7,169,605 – 17,343 7,152,262 30 Apr 2008 6.8160 1 Aug 2013 31 Jan 2014 – 6,142,429 – 9,718 6,132,711
1 The weighted average closing price of the shares immediately before the dates on which options were exercised was £8.00.
The fair value of options granted in the period under the Plan was £29 million.
HSBC Holdings Savings-Related Share Option Plan: International HSBC Holdings ordinary shares of US$0.50
Date of award
Exercise price
Exercisable from
Exercisable until
Options at 1 January 2008
Options awarded during period
Options exercised during period1
Options lapsed during period
Options at 30 June 2008
(£) 2 May 2002 6.3224 1 Aug 2007 31 Jan 2008 39,172 – 11,080 5,735 22,357 23 Apr 2003 5.3496 1 Aug 2008 31 Jan 2009 10,488 – – 7,866 2,622 8 May 2003 5.3496 1 Aug 2008 31 Jan 2009 5,068,502 – 73,406 78,679 4,916,417 21 Apr 2004 6.4720 1 Aug 2007 31 Jan 2008 31,145 – – – 31,145 21 Apr 2004 6.4720 1 Aug 2009 31 Jan 2010 12,365 – – 4,909 7,456 10 May 2004 6.4720 1 Aug 2007 31 Jan 2008 250,528 – 115,753 34,137 100,638 10 May 2004 6.4720 1 Aug 2009 31 Jan 2010 2,554,187 – 38,265 81,585 2,434,337 24 May 2005 6.6792 1 Aug 2008 31 Jan 2009 9,435,222 – 97,001 415,094 8,923,127 24 May 2005 6.6792 1 Aug 2010 31 Jan 2011 3,403,578 – 34,512 149,425 3,219,641 26 Apr 2006 7.6736 1 Aug 2007 31 Oct 2007 31,658 – – 31,658 – 26 Apr 2006 7.6736 1 Aug 2009 31 Jan 2010 1,804,327 – 2,733 179,839 1,621,755 26 Apr 2006 7.6736 1 Aug 2011 31 Jan 2012 406,743 – 423 45,055 361,265 25 Apr 2007 7.0872 1 Aug 2008 31 Oct 2008 1,543,966 – 3,689 96,258 1,444,019 25 Apr 2007 7.0872 1 Aug 2010 31 Jan 2011 3,436,093 – 872 383,197 3,052,024 25 Apr 2007 7.0872 1 Aug 2012 31 Jan 2013 975,763 – 203 131,574 843,986 30 Apr 2008 6.8160 1 Aug 2009 31 Oct 2009 – 1,988,482 – 1,720 1,986,762 30 Apr 2008 6.8160 1 Aug 2011 31 Jan 2012 – 3,467,432 – 3,600 3,463,832 30 Apr 2008 6.8160 1 Aug 2013 31 Jan 2014 – 1,253,627 – – 1,253,627
(US$) 26 Apr 2006 13.3290 1 Aug 2007 31 Oct 2007 5,273 – – 5,273 – 26 Apr 2006 13.3290 1 Aug 2009 31 Jan 2010 1,475,871 – 16,398 182,532 1,276,941 26 Apr 2006 13.3290 1 Aug 2011 31 Jan 2012 385,965 – 3,424 48,024 334,517 25 Apr 2007 14.74782 1 Aug 2008 31 Oct 2008 671,449 – 88 147,631 523,730 25 Apr 2007 13.8803 1 Aug 2008 31 Oct 2008 337,780 – – 24,548 313,232 25 Apr 2007 13.8803 1 Aug 2010 31 Jan 2011 2,687,923 – 4,761 344,250 2,338,912 25 Apr 2007 13.8803 1 Aug 2012 31 Jan 2013 760,659 – 956 91,717 667,986 30 Apr 2008 14.48762 1 Aug 2009 31 Oct 2009 – 615,822 – 86 615,736 30 Apr 2008 13.6354 1 Aug 2009 31 Oct 2009 – 425,697 – 481 425,216 30 Apr 2008 13.6354 1 Aug 2011 31 Jan 2012 – 1,979,660 – 1,438 1,978,222 30 Apr 2008 13.6354 1 Aug 2013 31 Jan 2014 – 537,563 – – 537,563
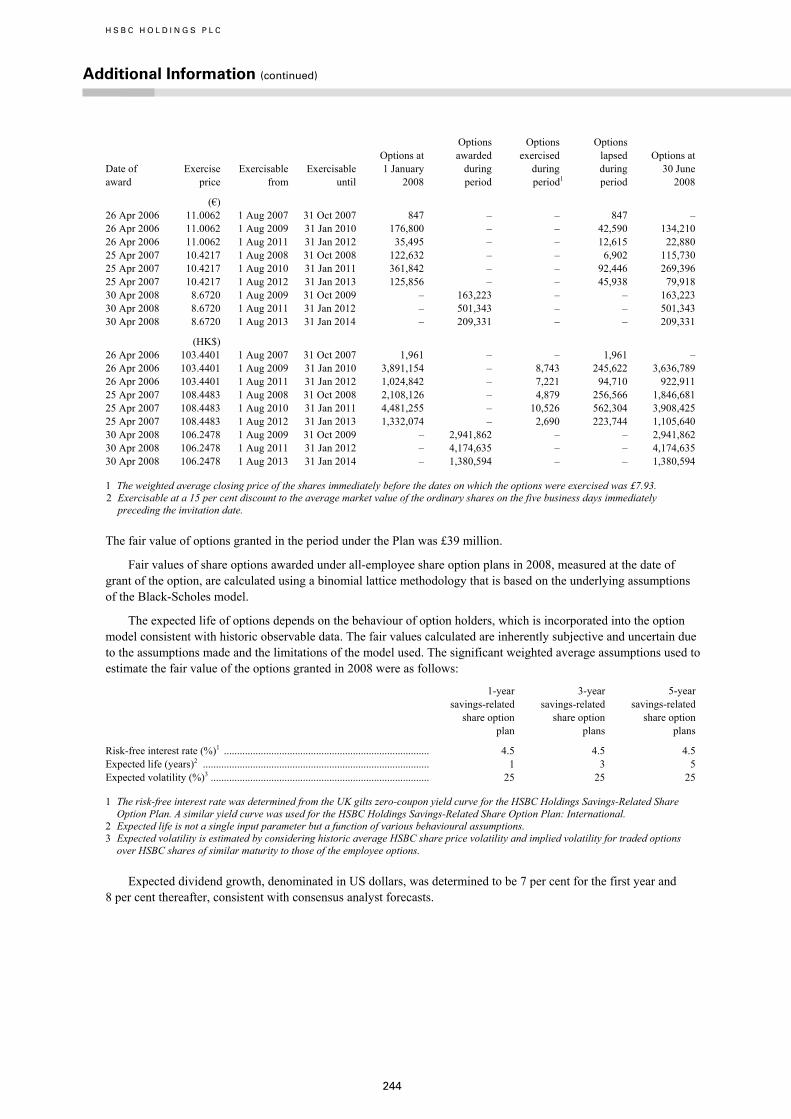
H S B C H O L D I N G S P L C
Additional Information (continued)
244
Date of award
Exercise price
Exercisable from
Exercisable until
Options at 1 January 2008
Options awarded during period
Options exercised during period1
Options lapsed during period
Options at 30 June 2008
(€) 26 Apr 2006 11.0062 1 Aug 2007 31 Oct 2007 847 – – 847 – 26 Apr 2006 11.0062 1 Aug 2009 31 Jan 2010 176,800 – – 42,590 134,210 26 Apr 2006 11.0062 1 Aug 2011 31 Jan 2012 35,495 – – 12,615 22,880 25 Apr 2007 10.4217 1 Aug 2008 31 Oct 2008 122,632 – – 6,902 115,730 25 Apr 2007 10.4217 1 Aug 2010 31 Jan 2011 361,842 – – 92,446 269,396 25 Apr 2007 10.4217 1 Aug 2012 31 Jan 2013 125,856 – – 45,938 79,918 30 Apr 2008 8.6720 1 Aug 2009 31 Oct 2009 – 163,223 – – 163,223 30 Apr 2008 8.6720 1 Aug 2011 31 Jan 2012 – 501,343 – – 501,343 30 Apr 2008 8.6720 1 Aug 2013 31 Jan 2014 – 209,331 – – 209,331
(HK$) 26 Apr 2006 103.4401 1 Aug 2007 31 Oct 2007 1,961 – – 1,961 – 26 Apr 2006 103.4401 1 Aug 2009 31 Jan 2010 3,891,154 – 8,743 245,622 3,636,789 26 Apr 2006 103.4401 1 Aug 2011 31 Jan 2012 1,024,842 – 7,221 94,710 922,911 25 Apr 2007 108.4483 1 Aug 2008 31 Oct 2008 2,108,126 – 4,879 256,566 1,846,681 25 Apr 2007 108.4483 1 Aug 2010 31 Jan 2011 4,481,255 – 10,526 562,304 3,908,425 25 Apr 2007 108.4483 1 Aug 2012 31 Jan 2013 1,332,074 – 2,690 223,744 1,105,640 30 Apr 2008 106.2478 1 Aug 2009 31 Oct 2009 – 2,941,862 – – 2,941,862 30 Apr 2008 106.2478 1 Aug 2011 31 Jan 2012 – 4,174,635 – – 4,174,635 30 Apr 2008 106.2478 1 Aug 2013 31 Jan 2014 – 1,380,594 – – 1,380,594
1 The weighted average closing price of the shares immediately before the dates on which the options were exercised was £7.93. 2 Exercisable at a 15 per cent discount to the average market value of the ordinary shares on the five business days immediately
preceding the invitation date.
The fair value of options granted in the period under the Plan was £39 million.
Fair values of share options awarded under all-employee share option plans in 2008, measured at the date of grant of the option, are calculated using a binomial lattice methodology that is based on the underlying assumptions of the Black-Scholes model.
The expected life of options depends on the behaviour of option holders, which is incorporated into the option model consistent with historic observable data. The fair values calculated are inherently subjective and uncertain due to the assumptions made and the limitations of the model used. The significant weighted average assumptions used to estimate the fair value of the options granted in 2008 were as follows:
1-year savings-related share option plan
3-year savings-related share option plans
5-year savings-related share option plans
Risk-free interest rate (%)1 .............................................................................. 4.5 4.5 4.5 Expected life (years)2 ...................................................................................... 1 3 5 Expected volatility (%)3 ................................................................................... 25 25 25
1 The risk-free interest rate was determined from the UK gilts zero-coupon yield curve for the HSBC Holdings Savings-Related Share Option Plan. A similar yield curve was used for the HSBC Holdings Savings-Related Share Option Plan: International.
2 Expected life is not a single input parameter but a function of various behavioural assumptions. 3 Expected volatility is estimated by considering historic average HSBC share price volatility and implied volatility for traded options
over HSBC shares of similar maturity to those of the employee options.
Expected dividend growth, denominated in US dollars, was determined to be 7 per cent for the first year and 8 per cent thereafter, consistent with consensus analyst forecasts.
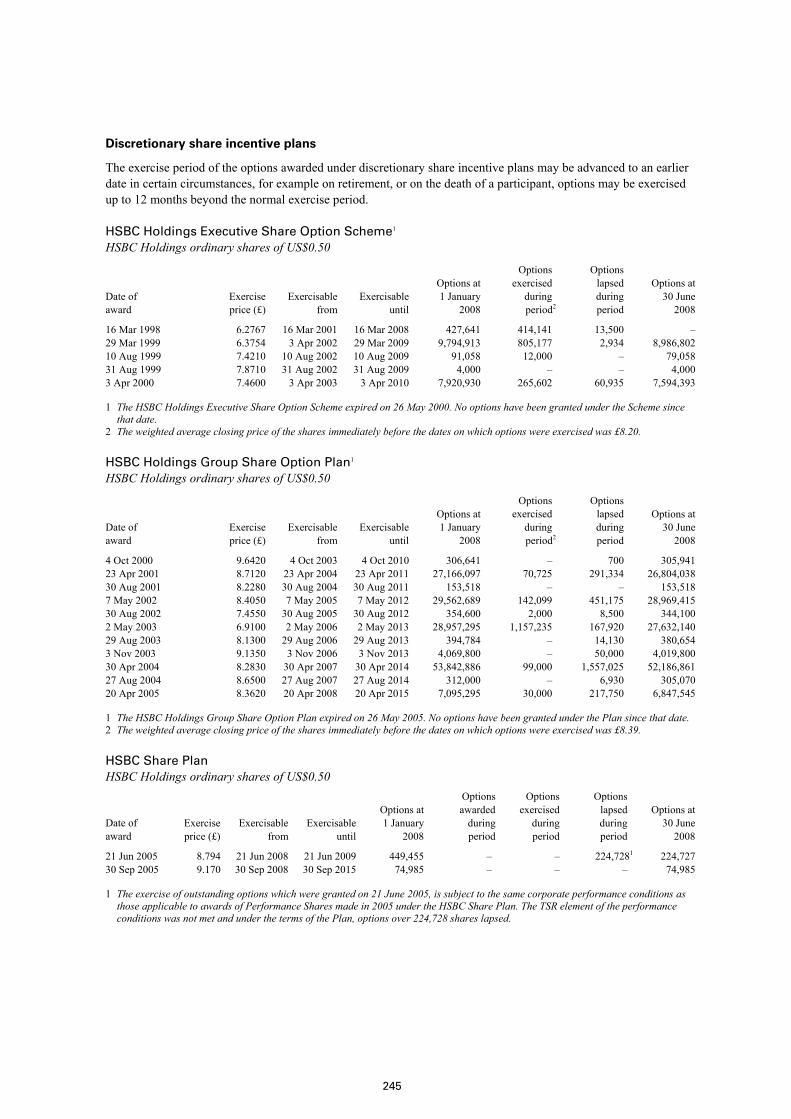
245
Discretionary share incentive plans
The exercise period of the options awarded under discretionary share incentive plans may be advanced to an earlier date in certain circumstances, for example on retirement, or on the death of a participant, options may be exercised up to 12 months beyond the normal exercise period.
HSBC Holdings Executive Share Option Scheme1 HSBC Holdings ordinary shares of US$0.50
Date of award
Exercise price (£)
Exercisable from
Exercisable until
Options at 1 January 2008
Options exercised during period2
Options lapsed during period
Options at 30 June 2008
16 Mar 1998 6.2767 16 Mar 2001 16 Mar 2008 427,641 414,141 13,500 – 29 Mar 1999 6.3754 3 Apr 2002 29 Mar 2009 9,794,913 805,177 2,934 8,986,802 10 Aug 1999 7.4210 10 Aug 2002 10 Aug 2009 91,058 12,000 – 79,058 31 Aug 1999 7.8710 31 Aug 2002 31 Aug 2009 4,000 – – 4,000 3 Apr 2000 7.4600 3 Apr 2003 3 Apr 2010 7,920,930 265,602 60,935 7,594,393
1 The HSBC Holdings Executive Share Option Scheme expired on 26 May 2000. No options have been granted under the Scheme since that date.
2 The weighted average closing price of the shares immediately before the dates on which options were exercised was £8.20.
HSBC Holdings Group Share Option Plan1 HSBC Holdings ordinary shares of US$0.50
Date of award
Exercise price (£)
Exercisable from
Exercisable until
Options at 1 January 2008
Options exercised during period2
Options lapsed during period
Options at 30 June 2008
4 Oct 2000 9.6420 4 Oct 2003 4 Oct 2010 306,641 – 700 305,941 23 Apr 2001 8.7120 23 Apr 2004 23 Apr 2011 27,166,097 70,725 291,334 26,804,038 30 Aug 2001 8.2280 30 Aug 2004 30 Aug 2011 153,518 – – 153,518 7 May 2002 8.4050 7 May 2005 7 May 2012 29,562,689 142,099 451,175 28,969,415 30 Aug 2002 7.4550 30 Aug 2005 30 Aug 2012 354,600 2,000 8,500 344,100 2 May 2003 6.9100 2 May 2006 2 May 2013 28,957,295 1,157,235 167,920 27,632,140 29 Aug 2003 8.1300 29 Aug 2006 29 Aug 2013 394,784 – 14,130 380,654 3 Nov 2003 9.1350 3 Nov 2006 3 Nov 2013 4,069,800 – 50,000 4,019,800 30 Apr 2004 8.2830 30 Apr 2007 30 Apr 2014 53,842,886 99,000 1,557,025 52,186,861 27 Aug 2004 8.6500 27 Aug 2007 27 Aug 2014 312,000 – 6,930 305,070 20 Apr 2005 8.3620 20 Apr 2008 20 Apr 2015 7,095,295 30,000 217,750 6,847,545
1 The HSBC Holdings Group Share Option Plan expired on 26 May 2005. No options have been granted under the Plan since that date. 2 The weighted average closing price of the shares immediately before the dates on which options were exercised was £8.39.
HSBC Share Plan HSBC Holdings ordinary shares of US$0.50
Date of award
Exercise price (£)
Exercisable from
Exercisable until
Options at 1 January 2008
Options awarded during period
Options exercised during period
Options lapsed during period
Options at 30 June 2008
21 Jun 2005 8.794 21 Jun 2008 21 Jun 2009 449,455 – – 224,7281 224,727 30 Sep 2005 9.170 30 Sep 2008 30 Sep 2015 74,985 – – – 74,985
1 The exercise of outstanding options which were granted on 21 June 2005, is subject to the same corporate performance conditions as those applicable to awards of Performance Shares made in 2005 under the HSBC Share Plan. The TSR element of the performance conditions was not met and under the terms of the Plan, options over 224,728 shares lapsed.

H S B C H O L D I N G S P L C
Additional Information (continued)
246
Subsidiary company share plans
HSBC France and HSBC Private Bank France
When it was acquired in 2000, HSBC France and one of its subsidiary companies, HSBC Private Bank France, operated employee share option plans under which options could be granted over their respective shares. No further options will be granted under either of these companies’ plans. The following are details of options to acquire shares in HSBC France and HSBC Private Bank France.
HSBC France shares of €5
Date of award
Exercise price (€)
Exercisable from
Exercisable until
Options at 1 January 2008
Options exercised during period1
Options lapsed during period
Options at 30 June 20081
29 Apr 1998 73.48 7 Jun 2000 29 Apr 2008 100,379 100,379 – – 7 Apr 1999 81.71 7 Jun 2000 7 Apr 2009 304,402 9,250 – 295,152 12 Apr 2000 142.50 1 Jan 2002 12 Apr 2010 602,250 – – 602,250
1 Following exercise of the options, the HSBC France shares will be exchanged for HSBC Holdings ordinary shares in the same ratio as for the acquisition of HSBC France (13 HSBC Holdings ordinary shares for each HSBC France share). At 30 June 2008, The HSBC Holdings Employee Benefit Trust 2001 (No. 1) held 10,240,101 HSBC Holdings ordinary shares which may be exchanged for HSBC France shares arising from the exercise of these options.
HSBC Private Bank France shares of €2
Date of award
Exercise price (€)
Exercisable from
Exercisable until
Options at 1 January 2008
Options exercised during period1
Options lapsed during period
Options at 30 June 20081
21 Dec 1999 10.84 21 Dec 2000 21 Dec 2009 33,250 3,000 – 30,250 9 Mar 2000 12.44 27 Jun 2004 31 Dec 2010 20,626 – – 20,626 15 May 2001 20.80 15 May 2002 15 May 2011 141,525 – – 141,525 1 Oct 2002 22.22 2 Oct 2005 1 Oct 2012 145,575 – – 145,575
1 Following exercise of the options, the HSBC Private Bank France shares will be exchanged for HSBC Holdings ordinary shares in the ratio of 1.83 HSBC Holdings ordinary shares for each HSBC Private Bank France share. At 30 June 2008, The CCF Employee Benefit Trust 2001 held 950,462 HSBC Holdings ordinary shares which may be exchanged for HSBC Private Bank France shares arising from the exercise of these options.
HSBC Finance and its subsidiaries
Following the acquisition of HSBC Finance in 2003, all outstanding options and equity-based awards over HSBC Finance common shares were converted into rights to receive HSBC Holdings ordinary shares in the same ratio as the share exchange offer for the acquisition of HSBC Finance (2.675 HSBC Holdings ordinary shares for each HSBC Finance common share) and the exercise prices per share were adjusted accordingly. No further options will be granted under any of these plans.
The following are details of options and equity-based awards to acquire shares in HSBC Holdings. At 30 June 2008, the HSBC (Household) Employee Benefit Trust 2003 held 1,804,629 HSBC Holdings ordinary shares and 196,455 American Depositary Shares, each of which represents five HSBC Holdings ordinary shares, which may be used to satisfy the exercise of employee share options.

247
HSBC Finance: 1996 Long-Term Executive Incentive Compensation Plan HSBC Holdings ordinary shares of US$0.50
Date of award
Exercise price (US$)
Exercisable from
Exercisable until
Options at 1 January 2008
Options exercised during period1
Options lapsed during period
Options at 30 June 2008
1 Jul 1998 19.21 1 Jul 1999 1 Jul 2008 80,250 – – 80,250 9 Nov 1998 13.71 9 Nov 1999 9 Nov 2008 841,566 63,825 – 777,741 17 May 1999 16.99 17 May 2000 17 May 2009 334,375 – – 334,375 31 Aug 1999 13.96 31 Aug 2000 31 Aug 2009 300,938 – – 300,938 8 Nov 1999 16.96 8 Nov 2000 8 Nov 2009 4,250,577 – – 4,250,577 30 Jun 2000 15.70 30 Jun 2001 30 Jun 2010 26,846 – – 26,846 8 Feb 2000 13.26 8 Feb 2001 8 Feb 2010 66,875 – – 66,875 13 Nov 2000 18.40 13 Nov 2001 13 Nov 2010 5,728,514 – – 5,728,514 12 Nov 2001 21.37 12 Nov 2002 12 Nov 2011 7,571,322 – – 7,571,322 20 Nov 2002 10.66 20 Nov 2003 20 Nov 2012 2,454,298 12,038 40,125 2,402,135
1 The weighted average closing price of the shares immediately before the dates on which options were exercised was £8.13.
HSBC Finance: 1996 Long-Term Executive Incentive Compensation Plan1 HSBC Holdings ordinary shares of US$0.50
Date of award
Vesting from
Vesting until2
Rights at 1 January 2008
Rights vested during period3
Rights lapsed during period
Rights at 30 June 2008
2 Dec 2002 2 Dec 2005 2 Dec 2007 1,784 1,784 – – 2 Jan 2003 2 Jan 2006 2 Jan 2008 447 447 – – 15 Jan 2003 15 Jan 2006 15 Jan 2008 10,480 10,480 – – 3 Feb 2003 3 Feb 2006 3 Feb 2008 2,906 2,906 – – 14 Feb 2003 14 Feb 2006 14 Feb 2008 49,134 49,134 – – 3 Mar 2003 3 Mar 2006 3 Mar 2008 447 447 – –
1 Awards of Restricted Stock Rights which represent a right to receive shares for nil consideration if the employee remains in the employment of HSBC Finance at the date of vesting.
2 In certain circumstances, for example on the death of a participant, shares may vest and be delivered beyond the normal vesting period. 3 The weighted average closing price of the shares immediately before the dates on which rights vested was £7.58.
Renaissance Holdings, Inc: Amended and Restated 1997 Stock Incentive Plan HSBC Holdings ordinary shares of US$0.50
Date of award
Exercise price (US$)
Exercisable from
Exercisable until
Options at 1 January 2008
Options exercised during period
Options lapsed during period
Options at 30 June 2008
1 Jan 1998 1.25 1 Jan 1999 1 Jan 2008 1,424 – 1,424 – 1 Oct 1998 1.74 1 Oct 1999 1 Oct 2008 803 – – 803 1 Jan 1999 2.24 1 Jan 2000 1 Jan 2009 5,024 – – 5,024
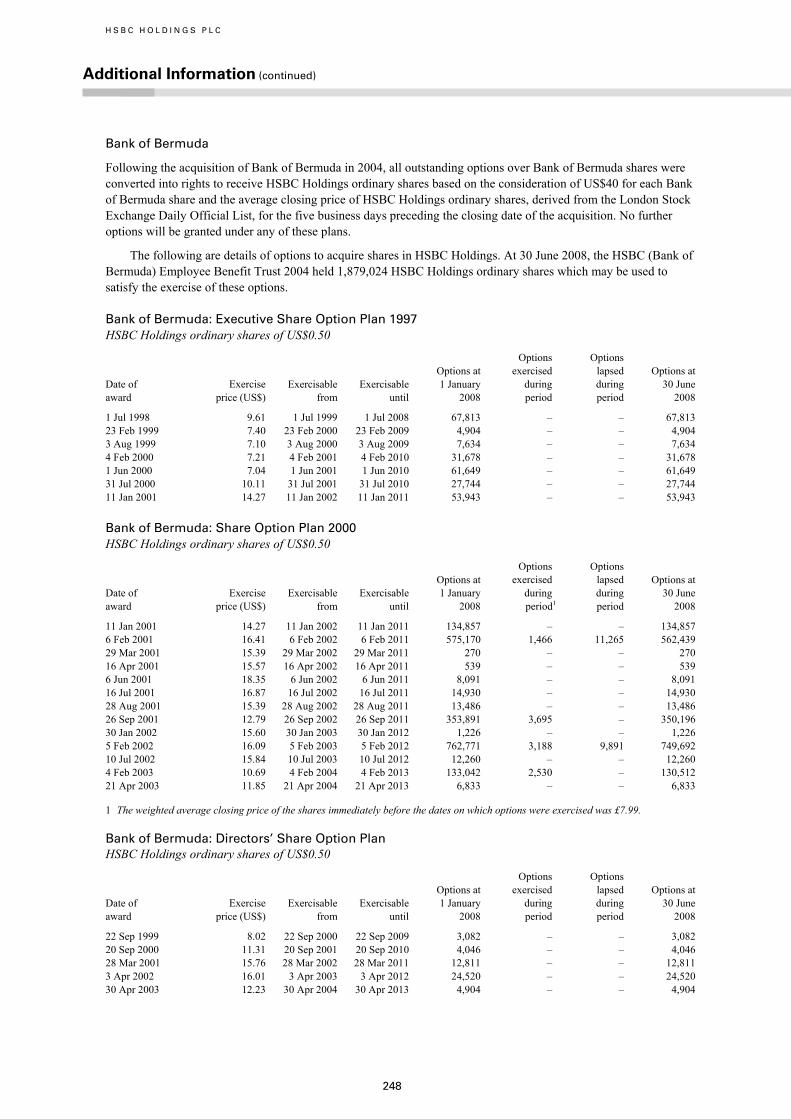
H S B C H O L D I N G S P L C
Additional Information (continued)
248
Bank of Bermuda
Following the acquisition of Bank of Bermuda in 2004, all outstanding options over Bank of Bermuda shares were converted into rights to receive HSBC Holdings ordinary shares based on the consideration of US$40 for each Bank of Bermuda share and the average closing price of HSBC Holdings ordinary shares, derived from the London Stock Exchange Daily Official List, for the five business days preceding the closing date of the acquisition. No further options will be granted under any of these plans.
The following are details of options to acquire shares in HSBC Holdings. At 30 June 2008, the HSBC (Bank of Bermuda) Employee Benefit Trust 2004 held 1,879,024 HSBC Holdings ordinary shares which may be used to satisfy the exercise of these options.
Bank of Bermuda: Executive Share Option Plan 1997 HSBC Holdings ordinary shares of US$0.50
Date of award
Exercise price (US$)
Exercisable from
Exercisable until
Options at 1 January 2008
Options exercised during period
Options lapsed during period
Options at 30 June 2008
1 Jul 1998 9.61 1 Jul 1999 1 Jul 2008 67,813 – – 67,813 23 Feb 1999 7.40 23 Feb 2000 23 Feb 2009 4,904 – – 4,904 3 Aug 1999 7.10 3 Aug 2000 3 Aug 2009 7,634 – – 7,634 4 Feb 2000 7.21 4 Feb 2001 4 Feb 2010 31,678 – – 31,678 1 Jun 2000 7.04 1 Jun 2001 1 Jun 2010 61,649 – – 61,649 31 Jul 2000 10.11 31 Jul 2001 31 Jul 2010 27,744 – – 27,744 11 Jan 2001 14.27 11 Jan 2002 11 Jan 2011 53,943 – – 53,943
Bank of Bermuda: Share Option Plan 2000 HSBC Holdings ordinary shares of US$0.50
Date of award
Exercise price (US$)
Exercisable from
Exercisable until
Options at 1 January 2008
Options exercised
during period1
Options lapsed during period
Options at 30 June 2008
11 Jan 2001 14.27 11 Jan 2002 11 Jan 2011 134,857 – – 134,857 6 Feb 2001 16.41 6 Feb 2002 6 Feb 2011 575,170 1,466 11,265 562,439 29 Mar 2001 15.39 29 Mar 2002 29 Mar 2011 270 – – 270 16 Apr 2001 15.57 16 Apr 2002 16 Apr 2011 539 – – 539 6 Jun 2001 18.35 6 Jun 2002 6 Jun 2011 8,091 – – 8,091 16 Jul 2001 16.87 16 Jul 2002 16 Jul 2011 14,930 – – 14,930 28 Aug 2001 15.39 28 Aug 2002 28 Aug 2011 13,486 – – 13,486 26 Sep 2001 12.79 26 Sep 2002 26 Sep 2011 353,891 3,695 – 350,196 30 Jan 2002 15.60 30 Jan 2003 30 Jan 2012 1,226 – – 1,226 5 Feb 2002 16.09 5 Feb 2003 5 Feb 2012 762,771 3,188 9,891 749,692 10 Jul 2002 15.84 10 Jul 2003 10 Jul 2012 12,260 – – 12,260 4 Feb 2003 10.69 4 Feb 2004 4 Feb 2013 133,042 2,530 – 130,512 21 Apr 2003 11.85 21 Apr 2004 21 Apr 2013 6,833 – – 6,833
1 The weighted average closing price of the shares immediately before the dates on which options were exercised was £7.99.
Bank of Bermuda: Directors’ Share Option Plan HSBC Holdings ordinary shares of US$0.50
Date of award
Exercise price (US$)
Exercisable from
Exercisable until
Options at 1 January 2008
Options exercised during period
Options lapsed during period
Options at 30 June 2008
22 Sep 1999 8.02 22 Sep 2000 22 Sep 2009 3,082 – – 3,082 20 Sep 2000 11.31 20 Sep 2001 20 Sep 2010 4,046 – – 4,046 28 Mar 2001 15.76 28 Mar 2002 28 Mar 2011 12,811 – – 12,811 3 Apr 2002 16.01 3 Apr 2003 3 Apr 2012 24,520 – – 24,520 30 Apr 2003 12.23 30 Apr 2004 30 Apr 2013 4,904 – – 4,904

249
3 Notifiable interests in share capital
The following disclosures of major holdings of voting rights have been made to the Company pursuant to the requirements of the Financial Services Authority Disclosure and Transparency Rule 5:
• Legal and General Group plc gave notice on 18 April 2008 that it had a holding on 16 April 2008 of 593,425,216 HSBC Holdings ordinary shares, representing 5.00 per cent of the ordinary shares in issue at that date, and gave notice on 21 April 2008 that on 18 April 2008 its holding of HSBC ordinary shares fell below 5.00 per cent of the ordinary shares in issue at that date;
• Singularis Holdings Limited; AWAL Trust Company Limited; and Maan Abdulwahed Al-Sanea gave notice on 16 April 2007 that it had an indirect interest on 16 April 2007 in 360,055,575 HSBC Holdings ordinary shares, representing 3.11 per cent of the ordinary shares in issue at that date; and
• Barclays plc gave notice on 17 April 2007 that it had an indirect interest on 16 April 2007 of 518,233,657 HSBC Holdings ordinary shares, representing 4.47 per cent of the ordinary shares in issue at that date.
As at 30 June 2008, according to the register maintained by HSBC Holdings pursuant to section 336 of the Securities and Futures Ordinance of Hong Kong, The Royal Bank of Scotland Group plc had a long position of 624,613,473 HSBC Holdings ordinary shares on 25 June 2008, representing 5.20 per cent of the ordinary shares in issue at that date and a short position of 484,464,682 HSBC Holdings ordinary shares on 25 June 2008, representing 4.04 per cent of the ordinary shares in issue at that date. After the balance sheet date, The Royal Bank of Scotland Group plc advised that it had a long position of 691,998,426 HSBC Holdings ordinary shares on 23 July 2008, representing 5.76 per cent of the ordinary shares in issue at that date and a short position of 602,496,968 HSBC Holdings ordinary shares on 23 July 2008, representing 5.01 per cent of the ordinary shares in issue at that date.
4 Dealings in HSBC Holdings shares
Except for dealings as intermediaries by HSBC Bank, HSBC Financial Products (France) and The Hongkong and Shanghai Banking Corporation, which are members of a European Economic Area exchange, neither HSBC Holdings nor any subsidiary undertaking has bought, sold or redeemed any securities of HSBC Holdings during the six months to 30 June 2008.
5 Second interim dividend for 2008
The Directors have declared a second interim dividend for 2008 of US$0.18 per ordinary share. The second interim dividend will be payable on 8 October 2008 to holders of ordinary shares on the Register at the close of business on 22 August 2008. The dividend will be payable in cash, in US dollars, sterling or Hong Kong dollars, or a combination of these currencies, at the exchange rates quoted by HSBC Bank plc in London at or about 11.00 am on 29 September 2008, and with a scrip dividend alternative. Particulars of these arrangements will be mailed to shareholders on or about 3 September 2008 and elections must be received by 24 September 2008.
The dividend will be payable on shares held through Euroclear France, the settlement and central depositary system for Euronext Paris, on 8 October 2008 to the holders of record on 22 August 2008. The dividend will be payable in cash in euros at the exchange rate on 29 September 2008, and with a scrip dividend alternative. Particulars of these arrangements will be announced through Euronext Paris on 20 August and 28 August 2008.
The dividend will be payable on American Depositary Shares (‘ADSs’), each of which represents five ordinary shares, on 8 October 2008 to holders of record on 22 August 2008. The dividend of US$0.90 per ADS will be payable in cash, in US dollars and with a scrip dividend alternative of new ADSs. Particulars of these arrangements will be mailed to holders on or about 2 September 2008. Elections must be received by the depositary on or before 18 September 2008. Alternatively, the cash dividend may be invested in additional ADSs for participants in the dividend reinvestment plan operated by the depositary.
HSBC Holdings ordinary shares will be quoted ex-dividend in London, Hong Kong, Paris and Bermuda on 20 August 2008. The ADSs will be quoted ex-dividend in New York on 20 August 2008.
The Overseas Branch Register of shareholders in Hong Kong will be closed for one day, on Friday 22 August 2008. Any person who has acquired shares registered on the Hong Kong Branch Register but who has not lodged the share transfer with the Hong Kong Branch Registrar should do so before 4.00 pm on Thursday 21 August 2008 in order to receive the second interim dividend for 2008, which will be payable on 8 October 2008. Transfers may not be made to or from the Hong Kong Overseas Branch Register while that Branch Register is closed.
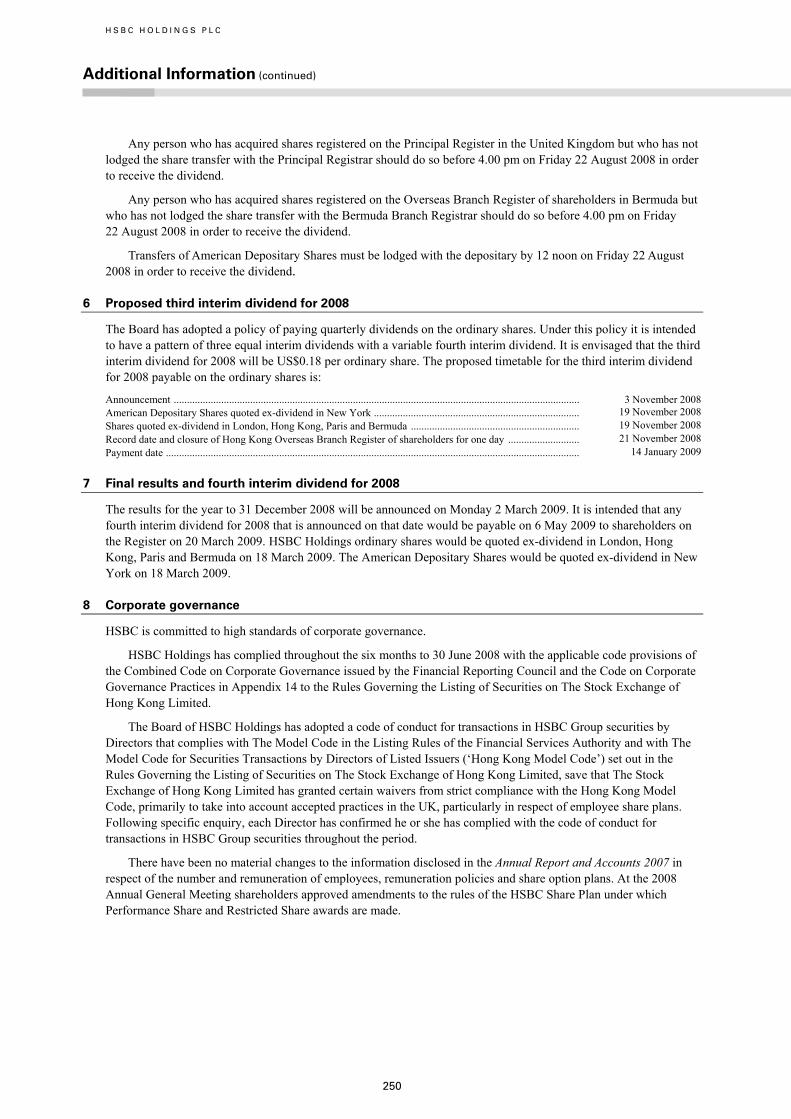
H S B C H O L D I N G S P L C
Additional Information (continued)
250
Any person who has acquired shares registered on the Principal Register in the United Kingdom but who has not lodged the share transfer with the Principal Registrar should do so before 4.00 pm on Friday 22 August 2008 in order to receive the dividend.
Any person who has acquired shares registered on the Overseas Branch Register of shareholders in Bermuda but who has not lodged the share transfer with the Bermuda Branch Registrar should do so before 4.00 pm on Friday 22 August 2008 in order to receive the dividend.
Transfers of American Depositary Shares must be lodged with the depositary by 12 noon on Friday 22 August 2008 in order to receive the dividend.
6 Proposed third interim dividend for 2008
The Board has adopted a policy of paying quarterly dividends on the ordinary shares. Under this policy it is intended to have a pattern of three equal interim dividends with a variable fourth interim dividend. It is envisaged that the third interim dividend for 2008 will be US$0.18 per ordinary share. The proposed timetable for the third interim dividend for 2008 payable on the ordinary shares is:
Announcement .......................................................................................................................................................... 3 November 2008American Depositary Shares quoted ex-dividend in New York .............................................................................. 19 November 2008Shares quoted ex-dividend in London, Hong Kong, Paris and Bermuda ................................................................ 19 November 2008Record date and closure of Hong Kong Overseas Branch Register of shareholders for one day ........................... 21 November 2008Payment date ............................................................................................................................................................. 14 January 2009
7 Final results and fourth interim dividend for 2008
The results for the year to 31 December 2008 will be announced on Monday 2 March 2009. It is intended that any fourth interim dividend for 2008 that is announced on that date would be payable on 6 May 2009 to shareholders on the Register on 20 March 2009. HSBC Holdings ordinary shares would be quoted ex-dividend in London, Hong Kong, Paris and Bermuda on 18 March 2009. The American Depositary Shares would be quoted ex-dividend in New York on 18 March 2009.
8 Corporate governance
HSBC is committed to high standards of corporate governance.
HSBC Holdings has complied throughout the six months to 30 June 2008 with the applicable code provisions of the Combined Code on Corporate Governance issued by the Financial Reporting Council and the Code on Corporate Governance Practices in Appendix 14 to the Rules Governing the Listing of Securities on The Stock Exchange of Hong Kong Limited.
The Board of HSBC Holdings has adopted a code of conduct for transactions in HSBC Group securities by Directors that complies with The Model Code in the Listing Rules of the Financial Services Authority and with The Model Code for Securities Transactions by Directors of Listed Issuers (‘Hong Kong Model Code’) set out in the Rules Governing the Listing of Securities on The Stock Exchange of Hong Kong Limited, save that The Stock Exchange of Hong Kong Limited has granted certain waivers from strict compliance with the Hong Kong Model Code, primarily to take into account accepted practices in the UK, particularly in respect of employee share plans. Following specific enquiry, each Director has confirmed he or she has complied with the code of conduct for transactions in HSBC Group securities throughout the period.
There have been no material changes to the information disclosed in the Annual Report and Accounts 2007 in respect of the number and remuneration of employees, remuneration policies and share option plans. At the 2008 Annual General Meeting shareholders approved amendments to the rules of the HSBC Share Plan under which Performance Share and Restricted Share awards are made.
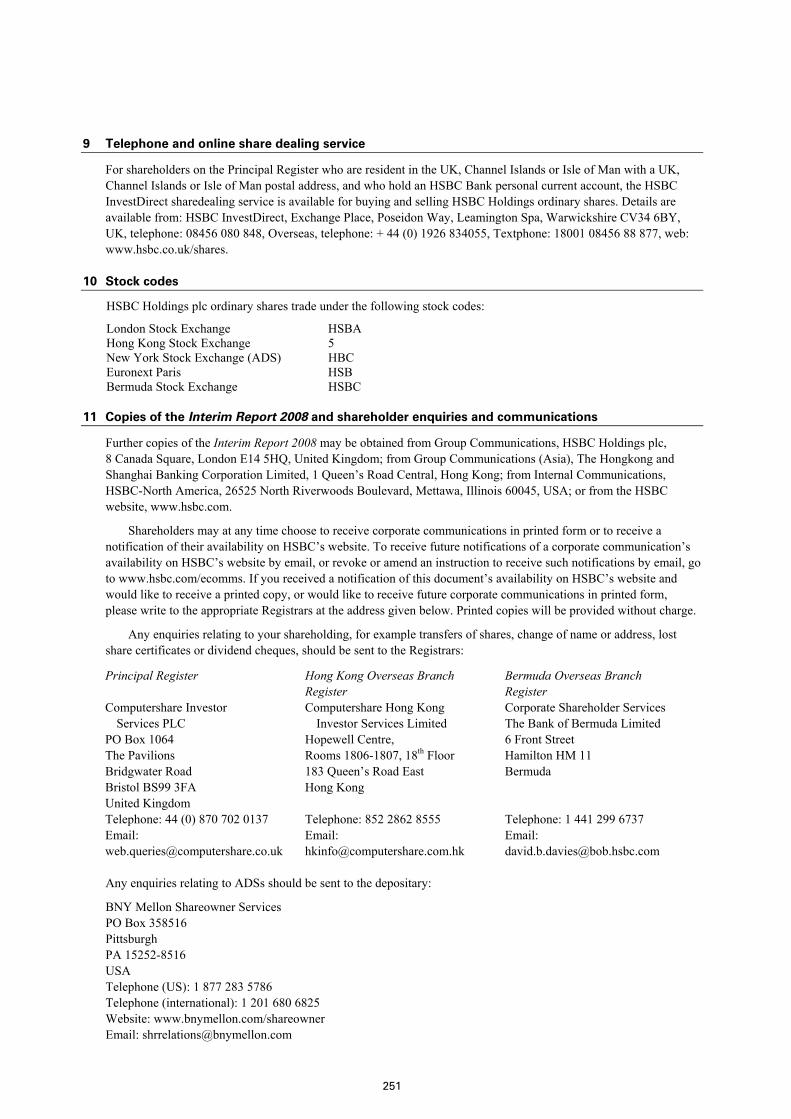
251
9 Telephone and online share dealing service
For shareholders on the Principal Register who are resident in the UK, Channel Islands or Isle of Man with a UK, Channel Islands or Isle of Man postal address, and who hold an HSBC Bank personal current account, the HSBC InvestDirect sharedealing service is available for buying and selling HSBC Holdings ordinary shares. Details are available from: HSBC InvestDirect, Exchange Place, Poseidon Way, Leamington Spa, W arwickshire CV34 6BY, UK, telephone : 08456 080 848, Overseas, telephone: + 44 (0) 1926 834055, Textphone: 18001 08456 88 877, web: www.hsbc.co.uk/shares.
10 Stock codes
HSBC Holdings plc ordinary shares trade under the following stock codes:
London Stock Exchange HSBA Hong Kong Stock Exchange 5 New York Stock Exchange (ADS) HBC Euronext Paris HSB Bermuda Stock Exchange HSBC
11 Copies of the Interim Report 2008 and shareholder enquiries and communications
Further copies of the Interim Report 2008 may be obtained from Group Communications, HSBC Holdings plc, 8 Canada Square, London E14 5HQ, United Kingdom; from Group Communications (Asia), The Hongkong and Shanghai Banking Corporation Limited, 1 Queen’s Road Central, Hong Kong; from Internal Communications, HSBC-North America, 26525 North Riverwoods Boulevard, Mettawa, Illinois 60045, USA; or from the HSBC website, www.hsbc.com.
Shareholders may at any time choose to receive corporate communications in printed form or to receive a notification of their availability on HSBC’s website. To receive future notifications of a corporate communication’s availability on HSBC’s website by email, or revoke or amend an instruction to receive such notifications by email, go to www.hsbc.com/ecomms. If you received a notification of this document’s availability on HSBC’s website and would like to receive a printed copy, or would like to receive future corporate communications in printed form, please write to the appropriate Registrars at the address given below. Printed copies will be provided without charge.
Any enquiries relating to your shareholding, for example transfers of shares, change of name or address, lost share certificates or dividend cheques, should be sent to the Registrars:
Principal Register Hong Kong Overseas Branch
Register Bermuda Overseas Branch Register
Computershare Investor Services PLC
PO Box 1064 The Pavilions Bridgwater Road Bristol BS99 3FA United Kingdom Telephone: 44 (0) 870 702 0137 Email: [email protected]
Computershare Hong Kong Investor Services Limited
Hopewell Centre, Rooms 1806-1807, 18th Floor 183 Queen’s Road East Hong Kong Telephone: 852 2862 8555 Email: [email protected]
Corporate Shareholder Services The Bank of Bermuda Limited 6 Front Street Hamilton HM 11 Bermuda Telephone: 1 441 299 6737 Email: [email protected]
Any enquiries relating to ADSs should be sent to the depositary:
BNY Mellon Shareowner Services PO Box 358516 Pittsburgh PA 15252-8516 USA Telephone (US): 1 877 283 5786 Telephone (international): 1 201 680 6825 Website: www.bnymellon.com/shareowner Email: [email protected]
H S B C H O L D I N G S P L C
Additional Information (continued)
252
Any enquiries relating to shares held through Euroclear France, the settlement and central depositary system for Euronext Paris, should be sent to the paying agent:
HSBC France 103, avenue des Champs Elysées 75419 Paris Cedex 08 France Telephone: 33 1 40 70 22 56
A Chinese translation of this and future documents may be obtained on request from the Registrars. Please also contact the Registrars if you have received a Chinese translation of this document and do not wish to receive such translations in the future.
Persons whose shares are held on their behalf by another person may have been nominated to receive communications from HSBC in accordance with section 146 of the UK Companies Act 2006 (‘nominated persons’). The main point of contact for nominated persons remains the registered shareholder (for example your stockbroker, investment manager, custodian or other person who manages the investment on your behalf). Any changes or queries relating to nominated persons’ personal details and holding (including any administration thereof) must continue to be directed to the registered shareholder and not HSBC’s Registrars. The only exception is where HSBC, in exercising one of its powers under the UK Companies Act 2006, writes to nominated persons directly for a response.

H S B C H O L D I N G S P L C
Glossary of Terms
253
Terms used Brief description
ABSs Asset-backed securities ADS American depositary share AIEA Average interest-earning assets ALCO Asset and Liability Management Committee ARMs Adjustable-rate mortgages Asscher Asscher Finance Ltd, a structured investment vehicle managed by HSBC ATM Automated teller machine Bank of Bermuda The Bank of Bermuda Limited Bank of Communications Bank of Communications Limited, mainland China’s fifth largest bank,
owned 19.01 per cent by HSBC Barion Barion Funding Limited, a term funding vehicle Basel I The 1988 Basel Capital Accord Basel II Final Accord of the Basel Committee on proposals for a new capital
adequacy framework CDO Collateralised debt obligation CP Commercial paper CRD Capital Requirements Directive of the EU Cullinan Cullinan Finance Ltd, a structured investment vehicle managed by HSBC Decision One Decision One Mortgage Company, HSBC Finance’s subsidiary which
originates loans referred by mortgage brokers DPF Discretionary participation feature of insurance and investment contracts EU European Union Fannie Mae Federal National Mortgage Association Freddie Mac Federal Home Loan Mortgage Corporation FSA Financial Services Authority (UK) GAAP Generally Accepted Accounting Principles GDP Gross domestic product Global Markets HSBC’s treasury and capital markets services in Global Banking and
Markets Group HSBC Holdings together with its subsidiary undertakings GSC Group Service Centre Hong Kong Hong Kong Special Administrative Region of the People’s Republic of
China HSBC HSBC Holdings together with its subsidiary undertakings HSBC Bank HSBC Bank plc, formerly Midland Bank plc HSBC Direct HSBC’s online banking and savings proposition HSBC Finance HSBC Finance Corporation, the US consumer finance company acquired
in 2003 (formerly Household International, Inc.) HSBC France HSBC’s French banking subsidiary (formerly CCF S.A.) HSBC Holdings HSBC Holdings plc IAS International Accounting Standard IASB International Accounting Standards Board IFRIC International Financial Reporting Interpretations Committee IFRSs International Financial Reporting Standards Industrial Bank Industrial Bank Co. Limited, a national joint-stock bank in mainland
China of which Hang Seng Bank Limited owns 12.78 per cent IPO Initial public offering Mainland China People’s Republic of China excluding Hong Kong Malachite Malachite Funding Limited, a term funding vehicle MasterCard MasterCard Inc. Mazarin Mazarin Funding Limited, an asset-backed CP conduit MBSs US mortgage-backed securities Monolines Monoline insurance companies
H S B C H O L D I N G S P L C
Glossary of Terms (continued)
254
Terms used Brief description
Ping An Insurance Ping An Insurance (Group) Company of China, Limited Premier HSBC Premier, HSBC’s global banking service for affluent customers PVIF Present value of in-force long-term insurance business Repos Sale and repurchase transactions Reverse repos Securities purchased under commitments to sell Seasoning The emergence of loss patterns in a credit portfolio over time SICs Securities investment conduits SIV Structured investment vehicles Solitaire Solitaire Funding Limited, a special purpose entity managed by HSBC SPE Special purpose entity The Chinese Bank The Chinese Bank Co., Ltd, in Taiwan, whose assets, liabilities and
operations HSBC acquired in March 2008 TSR Total shareholder return UK United Kingdom US United States of America VAR Value at risk Visa Visa Inc.
Index
Accounting policies 115, 213 Areas of special interest 161 Assets
by customer group 13, 25 by geographical region 28 deployment 108 financial assets designated at fair value 219 held in custody and under administration 110 maturity analysis 227 non-current assets held for sale 225 trading 109, 217
Auditor’s review report 237 Balance sheet
consolidated 208 data 3, 14, 16, 19, 21, 23, 25, 30, 39, 42,
48, 54, 61, 65, 74, 78, 86 Basel II 198 Basis of preparation 13, 211 Business highlights 14, 16, 18, 21 Business performance review
Europe 31 Hong Kong 43 Rest of Asia-Pacific 55 North America 66 Latin America 79
Capital management 197 measurement and allocation 197 structure 201
Cash flow consolidated statement 210 notes 232
Cautionary statement regarding forward-looking statements 2
Commercial Banking business highlights 16 performance in Europe 34 performance in Hong Kong 45 performance in Rest of Asia-Pacific 57 performance in North America 70 performance in Latin America 82
Constant currency 4 Contents 1 Contingent liabilities, contractual commitments and
financial guarantee contracts 151, 233 Copies of the Interim Report 2008 251 Corporate governance 250 Credit quality 169 Credit risk 187
maximum exposure 153 Customer accounts 29, 42, 53 Customer groups and global businesses 13, 25 Daily distribution of trading revenues 185 Dealings in HSBC Holdings shares 249 Defined terms – Inside front cover Derivatives
by product contract type 220 hedging instruments 221 trading 220
Directors biographies 203 interests 239
Dividends 2, 214, 249, 250 Earned insurance premiums (net) 100 Earnings per share 2, 214 Economic briefing
Europe 29 Hong Kong 43
255
Rest of Asia-Pacific 53 North America 65 Latin America 78
Economic profit 110 Equity 229 Europe
Balance sheet data 30, 39 business performance review 31 customer accounts 29 economic briefing 29 loans and advances (net) 29 profit before tax 28, 30, 39
Events after the balance sheet date 235 Fair values of financial instruments 129 Fee income (net) 94 Financial assets
designated at fair value 219 Financial highlights 2 Financial investments 222 Financial liabilities designated at fair value 226 Funds under management 109 Future accounting developments 212 Gains from dilution of interests
in associates 233 Gains less losses from financial
investments 99 Geographical regions 28 Global Banking and Markets
business highlights 18 performance in Europe 36 performance in Hong Kong 46 performance in Rest of Asia-Pacific 59 performance in North America 71 performance in Latin America 83
Goodwill impairment 234 Group Chairman’s Statement 5 Group Chief Executive’s Review 7 Group Managing Directors 205 Hong Kong
balance sheet data 42, 48 business performance review 43 economic briefing 43 profit before tax 42, 48
Impairment allowances and charges 103, 173, 176, available-for-sale securities 116, 134 by geographical region 170 distribution 169
Income from financial instruments designated at fair value (net) 97
Income statement (consolidated) 90, 207 Insurance
balance sheet by type of contract 195 claims incurred and movement in liabilities to
policyholders (net) 102 net earned premiums 100
liabilities under contracts issued 192 risk management 191
Interest income (net) 92 sensitivity 189
Interim Report 2008 236, 251 Latin America
balance sheet data 78, 86 business performance review 79 customer accounts 77 economic briefing 78 loans and advances (net) 77 profit before tax 77, 78, 86
Legal risk 191 Leveraged finance transactions 127 Liabilities
financial liabilities designated at fair value 226
maturity analysis 227 trading 226
Liquidity and funding 179 contingent liquidity risk 181
Litigation 234 Loans and advances
by country/region 29, 42, 52, 64 by credit quality 170 by industry sector 155,158 delinquency in the US 167 exposure 152 past due but not impaired 170, 178 personal lending 161, (US) 165 potential problem loans 178 renegotiated to banks/customers 172 to banks/customers by geographical region
158, 171 unimpaired loans contractually past due 90
days or more 177 within Rest of Asia-Pacific and
Latin America 160 Loan impairment charges and other credit risk
provisions 2, 103 Market risk management 183 Market turmoil
accounting policies 115 business model 115 disclosure policy 112 exposures 112, 117 impact on market risk 184 special purpose entities 115 structured investment vehicles 114 residential mortgage-backed securities 114
Monoline insurers 126 Mortgage lending
products 164, HSBC Finance 165 in the UK 163, (US) 163
Non-trading portfolios 187 North America

H S B C H O L D I N G S P L C
lndex (continued)
256
balance sheet data 65, 74 business performance review 66 customer accounts 64 economic briefing 65 loans and advances (net) 64 profit before tax 64, 65, 74
Notifiable interests in share capital 249 Off-balance sheet arrangements 151 Operating expenses 105 Operating income (net) 233, (other) 101 Operational risk 190 ‘Other’ customer group
performance in Europe 37 performance in Hong Kong 47 performance in Rest of Asia-Pacific 60 performance in North America 72 performance in Latin America 84
notes 23 Pension scheme 188 Personal Financial Services
business highlights 14 performance in Europe 31 performance in Hong Kong 43 performance in Rest of Asia-Pacific 55 performance in North America 67 performance in Latin America 80
Post-employment benefits 215 Potential problem loans 177 Principal activities 11 Private Banking
business highlights 21 performance in Europe 37 performance in Hong Kong 46 performance in Rest of Asia-Pacific 60 performance in North America 72 performance in Latin America 84
Profit before tax 90 by country 28, 42, 51, 64, 77 by customer group 13, 14, 16, 18, 21, 23, 25 by geographical region 28, 30, 39, 42, 48, 61,
65, 74, 78, 86, 233 consolidated 207 data 3 underlying/reported reconciliations 11, 15, 17,
20, 22, 24, 31, 38, 43, 47, 55, 60, 66, 73, 79, 85
Ratios advances to deposits 179 capital 3, 201 Cost efficiency 107 credit coverage 3 earnings to combined fixed charges 111 efficiency and revenue mix 3 financial 3 net liquid assets to customer liabilities 180 performance 3
Related parties 110 Reputational risk 191 Responsibility statement 237 Rest of Asia-Pacific
balance sheet data 54, 61 business performance review 55 customer accounts 53 economic briefing 53 loans and advances (net) 52 profit before tax 51, 54, 61
Risk elements, analysis of 177 Risk elements in the loan portfolio 177 Risk management 152
credit 152, (credit spread) 187 gap 187 insurance operations 191 liquidity and funding 179 market 183, (turmoil) 115 operational 190 pension 188 reputational 191
Risk-weighted assets by principal subsidiary 202
Segmental analysis 233 Sensitivity
projected net interest income 189 Share capital
notifiable interests 249 Share dealing service 251 Share information 4 Share of profit in associates and joint ventures 107 Share option plans 239
all-employee share plans 242 Bank of Bermuda plans 248
discretionary share incentive plans 245 HSBC Finance plans 246 HSBC France plans 246
Special purpose entities 115, 137 Staff numbers 105 Statement of recognised income and expense
(consolidated) 209 Stock codes 251 Strategic direction 11 Structural foreign exchange exposures 190 Tax expense 216 Telephone and online share dealing service 251 Total shareholder return 4 Trading
assets and financial investments and derivatives 109
assets 217 liabilities 226 portfolios 186
Trading income (net) 96 Troubled debt restructurings 177 Value at risk 183

This document comprises the Interim Report 2008 to shareholders and information contained herein is being filed on Form 6-K with the US Securities and Exchange Commission (‘SEC’), for HSBC Holdings plc and its subsidiary and associated undertakings. HSBC HOLDINGS PLC Incorporated in England with limited liability. Registered in England: number 617987 REGISTERED OFFICE AND GROUP HEAD OFFICE 8 Canada Square, London E14 5HQ, United Kingdom Web: www.hsbc.com © Copyright HSBC Holdings plc 2008 All rights reserved No part of this publication may be reproduced, stored in a retrieval system, or transmitted, in any form or by any means, electronic, mechanical, photocopying, recording, or otherwise, without the prior written permission of HSBC Holdings plc. Published by Group Finance, HSBC Holdings plc, London Cover designed by Addison Corporate Marketing Limited, London; text pages designed by Group Communications (Asia), The Hongkong and Shanghai Banking Corporation Limited, Hong Kong Printed by Park Communications Limited, London, on Revive 100 Offset paper using vegetable oil-based inks. Made in France, the paper comprises 100% de-inked post-consumer waste. Pulps used are elemental chlorine-free. The FSC logo identifies products which contain wood from well-managed forests and recycled fibre certified in accordance with the rules of the Forest Stewardship Council.
Stock number 98956-9

2008Interim ReportHSBC Holdings plc
HSBC Holdings plc8 Canada Square, London E14 5HQ, United KingdomTelephone: 44 020 7991 8888 Facsimile: 44 020 7992 4880www.hsbc.com
HSBC
Holdings plc
Interim Report 2008