
HSBC Bank Canada Third Quarter 2014 Interim Report - English · HSBC BANK CANADA. Third Quarter...
48
HSBC Bank Canada Third Quarter 2014 Interim Report
-
Upload
dangnguyet -
Category
Documents
-
view
220 -
download
2
Transcript of HSBC Bank Canada Third Quarter 2014 Interim Report - English · HSBC BANK CANADA. Third Quarter...

HSBC Bank CanadaThird Quarter 2014 Interim Report
E02025883 HSBC Canada Interim Report Q3 Cover.indd 1 04/11/2014 20:25

H S B C B A N K C A N A D A
Third Quarter 2014 Interim Report
Corporate profile
HSBC Bank Canada, a subsidiary of HSBC Holdings plc, is the leading international bank in Canada. The HSBC Groupserves customers worldwide from over 6,200 offices in over 74 countries and territories in Europe, Asia, North and LatinAmerica, and the Middle East and North Africa. With assets of US$2,729 at 30 September 2014, the HSBC Group is one ofthe world’s largest banking and financial services organizations.
Headlines
Profit before income tax expense for the quarter ended30 September 2014 was $231m, a decrease of 8.0%compared with the same period in 2013. Profit beforeincome tax expense was $706m for the nine monthsended 30 September 2014, an increase of 0.6%compared with the same period in 2013.
Profit attributable to the common shareholder was$163m for the quarter ended 30 September 2014, adecrease of 3.0% compared with the same period in2013. Profit attributable to the common shareholderwas $495m for the nine months ended 30 September2014, an increase of 9.5% compared with the sameperiod in 2013.
Return on average common equity was 14.5% and15.0% for the quarter and nine months ended 30
September 2014 respectively compared with 16.0%and 14.3% respectively for the same periods in 2013.
The cost efficiency ratio was 52.3% and 51.8% for thequarter and nine-months ended 30 September 2014respectively compared with 51.9% and 48.9%respectively for the same periods in 2013.
Total assets were $84.7bn at 30 September 2014compared with $84.3bn at 31 December 2013.
Common equity tier 1 capital ratio was 10.8%, tier 1ratio 12.1% and total capital ratio 13.7% at 30September 2014 compared with 11.1%, 14.1% and16.0% respectively at 30 September 2013.
Contents
Management’s Discussion and Analysis ............................................................................................................................. 1
Financial summary ................................................ 1Basis of preparation of financial information........ 2Use of non-IFRS financial measures ..................... 2Financial performance........................................... 3Movement in financial position............................. 7Global lines of business......................................... 8Summary quarterly performance........................... 13Accounting matters ............................................... 13
Off-balance sheet arrangements............................. 14Related party transactions...................................... 14Disclosure controls and procedures and internal
control over financial reporting ....................... 14Risk management .................................................. 14Factors that may affect future results..................... 21Capital ................................................................... 21Outstanding shares and securities .......................... 22
Financial Statements (unaudited) ............................................................................................................................................... 23
Notes on the Financial Statements (unaudited) ........................................................................................................................ 28
Shareholder Information ............................................................................................................................................................. 43
E02025883 HSBC Canada Q3 Inside Pages Nov14.indd 1 04/11/2014 23:20

H S B C B A N K C A N A D A
Management’s Discussion and Analysis
1
Financial summary
(in $ millions, except where otherwise stated) Quarter ended Nine months ended30 September
201430 September
201330 June
201430 September
201430 September
2013Financial performance for the period
Total operating income ............................................... 520 522 539 1,591 1,637Profit before income tax expense ................................ 231 251 242 706 702Profit attributable to the common shareholder ............ 163 168 172 495 452Basic earnings per common share ($).......................... 0.32 0.34 0.35 0.99 0.91
Financial position at period-endLoans and advances to customers1 .............................. 41,534 41,102 41,549Customer accounts1..................................................... 49,698 47,668 49,329Ratio of customer advances to customer accounts (%)2 83.6 86.2 84.2Shareholders’ equity ................................................... 4,836 5,187 4,791Average total shareholders’ equity to average total
assets (%)2............................................................ 5.8 6.0 5.8
Capital measuresCommon equity tier 1 capital ratio (%) ....................... 10.8 11.1 11.0Tier 1 ratio (%) ........................................................... 12.1 14.1 12.4Total capital ratio (%) ................................................. 13.7 16.0 14.0Assets-to-capital multiple............................................ 16.8 14.5 16.0Risk-weighted assets ($m) .......................................... 40,129 36,281 38,629
Performance ratios (%)2
Credit coverage ratios (%)Loan impairment charges to total operating
income........................................................... 3.4 1.7 5.0 4.4 9.1Loan impairment charges to average gross
customer advances3 ....................................... 0.2 0.1 0.3 0.2 0.4Total impairment allowances to impaired loans
at period-end3 ................................................ 70.8 61.2 67.7 70.8 61.2
Return ratios (%)Return on average common shareholder’s
equity ............................................................ 14.5 16.0 15.6 15.0 14.3Post-tax return on average total assets.................. 0.77 0.78 0.81 0.78 0.71Pre-tax return on average risk-weighted assets3 ... 2.3 1.8 2.5 2.4 1.7
Efficiency and revenue mix ratios (%)Cost efficiency ratio ............................................. 52.3 51.9 51.1 51.8 48.9Adjusted cost efficiency ratio............................... 52.2 51.9 51.0 51.7 48.8
Net interest income to total operating income ...... 58.3 61.1 57.0 57.6 60.8Net fee income to total operating income............. 30.9 29.1 29.7 29.9 27.6Net trading income to total operating income ...... 6.8 8.0 6.2 6.8 8.8
1 From 1 January 2014, non-trading reverse repurchase and repurchase agreements are presented as separate lines in the balance sheet.Previously, non-trading reverse repurchase agreements were included within ‘Loans and advances to banks’ and ‘Loans and advances tocustomers’ and non-trading repurchase agreements were included within ‘Deposits by banks’ and ‘Customer accounts’. Comparative data havebeen restated accordingly. Refer to the ‘Accounting matters' section of this document for further information on this change in presentation.
2 Refer to the ‘Use of non-IFRS financial measures’ section of this document for a discussion of non-IFRS financial measures.3 The measure has been aligned with that in use by the HSBC Group and comparative information has been restated. Refer to the ‘Use of non-
IFRS financial measures’ section of this document for a description of the method in use to calculate the measure.
E02025883 HSBC Canada Q3 Inside Pages Nov14.indd 3 04/11/2014 23:20

H S B C B A N K C A N A D A
Management’s Discussion and Analysis (continued)
2
Basis of preparation of financial information
HSBC Bank Canada (‘the bank’, ‘we’, ‘our’) is anindirectly wholly-owned subsidiary of HSBC Holdingsplc (‘HSBC Holdings’). Throughout Management’sDiscussion and Analysis (‘MD&A’), the HSBC HoldingsGroup is defined as the ‘HSBC Group’ or the ‘Group’.The MD&A is dated 29 October 2014, the date that ourunaudited consolidated financial statements and MD&Afor the third quarter of 2014 were approved by the Auditand Risk Committee of our Board of Directors.
We prepare our unaudited consolidated financialstatements in accordance with International FinancialReporting Standards (‘IFRS’). The information in thisMD&A is derived from our unaudited consolidated
financial statements or from the information used toprepare them. The abbreviations ‘$m’ and ‘$bn’ representmillions and billions of Canadian dollars, respectively. Alltabular amounts are in millions of dollars except whereotherwise stated.
The references to ‘notes’ throughout this MD&A referto notes on the unaudited consolidated financialstatements for the third quarter ended 30 September 2014.
The bank’s continuous disclosure materials, includinginterim and annual filings, are available on the bank’swebsite and on the Canadian Securities Administrators’web site at www.sedar.com.
Use of non-IFRS financial measures
In measuring our performance, the financial measures thatwe use include those which have been derived from ourreported results. However, these are not presented withinthe Financial Statements and are not defined under IFRS.These are considered non-IFRS financial measures andare unlikely to be comparable to similar measurespresented by other companies. The following non-IFRSfinancial measures are used throughout this document andtheir purposes and definitions are discussed below:
Financial position at period-end
These measures are indicators of the stability of thebank’s balance sheet and the degree funds are deployed tofund assets.
Ratio of customer advances to customer accounts iscalculated by dividing loans and advances to customers bycustomer accounts using period-end balances.
Average total shareholders’ equity to average totalassets is calculated by dividing average total shareholders’equity (determined using month-end balances during theperiod) with average total assets (determined usingmonth-end balances during the period).
Credit coverage ratios
Credit coverage ratios are useful to management as ameasure of the extent of incurred loan impairment chargesrelative to the bank’s performance and size of its customerloan portfolio during the period.
Loan impairment charges to total operating incomeis calculated as loan impairment charges and other creditprovisions, as a percentage of total operating income forthe period.
Loan impairment charges to average gross customeradvances is calculated as annualized loan impairmentcharges and other credit provisions for the period, as a
percentage of average gross customer advances andacceptances (determined using month-end balances duringthe period).
Total impairment allowances to impaired loans atperiod-end are useful to management to evaluate thecoverage of impairment allowances relative to impairedloans using period-end balances.
Return ratios
Return ratios are useful for management to evaluateprofitability on equity, assets and risk-weighted assets.
Return on average common equity is calculated asannualized profit attributable to the common shareholderfor the period, divided by average common equity(determined using month-end balances during the period).
Post-tax return on average total assets is calculatedas annualized profit attributable to the commonshareholder for the period, divided by average assets(determined using average month-end balances during theperiod).
Pre-tax return on average risk-weighted assets iscalculated as annualized profit attributable to the commonshareholder for the period, divided by average risk-weighted assets (determined using quarter-end balancesduring the period).
Efficiency ratios
Efficiency ratios are measures of the bank’s efficiency inmanaging its operating expense to generate revenue.
Cost efficiency ratio is calculated as total operatingexpenses for the period as a percentage of total operatingincome for the period.
E02025883 HSBC Canada Q3 Inside Pages Nov14.indd 4 04/11/2014 23:20

H S B C B A N K C A N A D A
3
Adjusted cost efficiency ratio is calculated similar tothe cost efficiency ratio; however, total operating incomefor the period excludes gains and losses from financialinstruments designated at fair value, as the movement invalue of the bank’s own subordinated debt issues areprimarily driven by changes in market rates and are notunder the control of management.
Revenue mix ratio
This measure demonstrates the contribution of each of theprimary revenue streams to total operating income.
Net interest income, net fee income and net tradingincome to total operating income is calculated as netinterest income, net fee income and net trading income forthe period divided by total operating income for theperiod.
Financial performance
Condensed consolidated income statement
Quarter ended Nine months ended30 September
2014$m
30 September2013
$m
30 June2014
$m
30 September2014
$m
30 September2013
$m
Net interest income .......................................................... 303 319 307 917 995Net fee income................................................................. 161 152 160 476 452Net trading income........................................................... 35 42 33 107 144Net expense from financial instruments designated at
fair value...................................................................... (1) – (1) (4) (3)Gains less losses from financial investments.................... 7 2 27 53 52Other operating income / (expense) ................................. 15 7 13 42 (3)
Total operating income .................................................... 520 522 539 1,591 1,637Loan impairment charges and other credit risk
provisions .................................................................... (17) (9) (27) (70) (149)
Net operating income....................................................... 503 513 512 1,521 1,488Total operating expenses.................................................. (272) (271) (276) (824) (800)
Operating profit................................................................ 231 242 236 697 688Share of profit in associates ............................................. – 9 6 9 14
Profit before income tax expense ..................................... 231 251 242 706 702Income tax expense.......................................................... (61) (65) (60) (182) (197)
Profit for the period.......................................................... 170 186 182 524 505
Overview
HSBC Bank Canada reported a profit before income taxexpense of $231m for the third quarter of 2014, adecrease of $20m, or 8%, compared with the third quarterof 2013 and a decrease of $11m or 5% compared with thesecond quarter of 2014. Profit before income tax expensefor the nine months ended 30 September 2014 was$706m, an increase of $4m, or 1% compared with thesame period in 2013.
The decrease in profit before income tax expense for thethird quarter of 2014 compared with the same period lastyear was primarily due to lower net interest income fromthe continued planned run-off of the consumer financeportfolio, lower net trading income from foreignexchange products, lower income from associates andhigher loan impairment charges, arising from a release ofspecific provisions in the comparative period. This waspartially offset by increased fees from credit and wealthproducts and an increase in other income arising from areduction in the fair value of investment property held forsale recorded in the third quarter of 2013. The increase in
profit before income tax expense for the nine monthsended 30 September 2014 compared with the same periodlast year was primarily due to increased fees from creditand wealth products, lower loan impairment charges as aresult of lower specific allowances for commercialcustomers and an increase in other income arising from areduction in the fair value of investment property held forsale recorded in 2013. This was partially offset by lowernet interest income from the continued planned run-off ofthe consumer finance portfolio, lower net trading incomefrom foreign exchange products and increased operatingexpenses as we invest in HSBC Group’s global standardsas well as risk and compliance activities.
Commenting on the results, Paulo Maia, President andChief Executive Officer of HSBC Bank Canada, said:“Consistent with the HSBC Group we continue to makeprogress towards our three strategic priorities: growingour business, making it more efficient and implementingglobal standards within Canada. We continued to makeinvestments to grow all three of our business lines in
E02025883 HSBC Canada Q3 Inside Pages Nov14.indd 5 04/11/2014 23:20

H S B C B A N K C A N A D A
Management’s Discussion and Analysis (continued)
4
Canada, enhancing our Payments and Cash Managementand Project Export Finance offerings, and introducingnew mobile capabilities for retail customers.
“As a result of increased residential mortgage business,the ongoing Retail Banking and Wealth Managementbusiness recorded strong growth in profit before tax over
both the same quarter last year and the immediatelypreceding quarter. However, this was offset somewhat byincreased investments in HSBC Groups's globalstandards as well as risk and compliance activities whichcontinue to impact results.”
Performance by income and expense item
Net interest incomeNet interest income for the third quarter of 2014 was$303m, a decrease of $16m, or 5%, compared with thethird quarter of 2013 and marginally decreased comparedwith the second quarter of 2014. Net interest income forthe nine months ended 30 September 2014 was $917m, a
decrease of $78m, or 8%, compared with the same periodin 2013. The decrease from the comparative periods in2013 was primarily due to declining loan balances fromthe continued planned run-off of the consumer financeportfolio.
Net fee incomeQuarter ended Nine months ended
30 September2014
$m
30 September2013
$m
30 June2014
$m
30 September2014
$m
30 September2013
$m
Credit facilities................................................................. 68 64 70 206 190Funds under management ................................................ 43 35 41 121 103Account services .............................................................. 18 20 21 58 62Credit cards...................................................................... 16 16 16 46 46Remittances...................................................................... 8 8 8 24 24Corporate finance............................................................. 10 8 10 28 24Immigrant Investor Program ............................................ 3 9 6 13 29Brokerage commissions ................................................... 3 4 3 9 12Insurance.......................................................................... 3 3 3 9 11Trade finance import/export............................................. 3 3 3 8 9Trustee fees ...................................................................... 2 1 1 4 3Other ................................................................................ 4 3 1 10 8Fee income....................................................................... 181 174 183 536 521Less: fee expense ............................................................. (20) (22) (23) (60) (69)Net fee income................................................................. 161 152 160 476 452
Net fee income for the third quarter of 2014 was $161m,an increase of $9m, or 6%, compared with the thirdquarter of 2013 and marginally increased from the secondquarter of 2014. Net fee income for the nine month periodended 30 September 2014 was $476m, an increase of$24m, or 5%, compared with the same period in 2013.The increase in net fee income from the same periods last
year was primarily due to higher fees from credit productssuch as standby lines of credit and banker’s acceptances,as well as increased fees from wealth related products andfrom higher funds under management. This was partiallyoffset by a reduction in fees due to the cancellation of theCanadian Federal Government’s Immigrant InvestorProgram.
Net trading incomeQuarter ended Nine months ended
30 September2014
$m
30 September2013
$m
30 June2014
$m
30 September2014
$m
30 September2013
$m
Trading activities ............................................................. 35 27 32 100 104Net interest income on trading activities .......................... 3 11 1 7 33Hedge ineffectiveness ...................................................... (3) 4 – – 7Net trading income........................................................... 35 42 33 107 144
Net trading income for the third quarter of 2014 was$35m, a decrease of $7m, or 17% compared with the thirdquarter of 2013, and an increase of $2m, or 6%, compared
with the second quarter of 2014. Net trading income fornine months ended 30 September 2014 was $107m, adecrease of $37m, or 26%, compared with the same
E02025883 HSBC Canada Q3 Inside Pages Nov14.indd 6 04/11/2014 23:20

H S B C B A N K C A N A D A
5
period in 2013. The decrease in net trading incomecompared with the same periods last year was mainly dueto lower spreads on foreign exchange products and theimpact of debit valuation adjustments on derivativecontracts due to the narrowing of our own credit spreads.
The increase in net trading income compared with thesecond quarter of 2014 mainly resulted from the impact ofdebit valuation adjustments on derivatives recorded in thesecond quarter.
Other items of incomeQuarter ended Nine months ended
30 September2014
$m
30 September2013
$m
30 June2014
$m
30 September2014
$m
30 September2013
$mNet expense from financial instruments designated at fair
value ............................................................................ (1) – (1) (4) (3)Gains less losses from financial investments.................... 7 2 27 53 52Other operating income / (expense) ................................ 15 7 13 42 (3)Other items of income ..................................................... 21 9 39 91 46
Net expense from financial instruments designated at fairvalue for the third quarter and nine months ended 30September 2014 was $1m and $4m, little changed fromthe comparative periods in 2013.
Gains less losses from financial investments for the thirdquarter of 2014 were $7m, an increase of $5m, or 250%,compared with the third quarter of 2013 and a decrease of$20m, or 74%, compared with the second quarter of 2014.Gains less losses from financial investments for the ninemonths ended 30 September 2014 was $53m, marginallyincreased from the same period in 2013. The bank realizesgains and losses from financial investments fromdisposals of available-for-sale financial investmentsdriven by balance sheet management activities. The
variances from comparative periods are primarily as aresult of the bank’s continuous balance sheet managementactivities.
Other operating income for the third quarter of 2014 was$15m, $8m or 114% higher compared with the thirdquarter of 2013, and marginally increased from the secondquarter of 2014. Other operating income for the ninemonths ended 30 September 2014 was $42m, an increaseof $45m compared with the same period in 2013. Theincrease in other operating income compared with thecomparative periods in 2013 reflected the reduction in thefair value of an investment property held for sale that wasrecorded in the second and third quarters of 2013.
Loan impairment charges and other credit risk provisionsQuarter ended Nine months ended
30 September2014
$m
30 September2013
$m
30 June2014
$m
30 September2014
$m
30 September2013
$m
Individually assessed allowances ..................................... 11 (3) 21 47 107Collectively assessed allowances ..................................... 5 14 3 14 54Loan impairment charges................................................. 16 11 24 61 161Other credit risk provisions/(reversal of provisions) ........ 1 (2) 3 9 (12)Loan impairment charges and other credit risk provisions 17 9 27 70 149
Loan impairment charges and other credit risk provisionsfor the third quarter of 2014 were $17m, an increase of$8m or 89% compared with the third quarter of 2013 anda decrease of $10m or 37% compared with the secondquarter of 2014. Loan impairment charges and other creditrisk provisions for the nine months ended 30 September2014 were $70m, a decrease of $79m or 53% comparedwith the same period in 2013. The increase in loanimpairment charges and other credit risk provisions
compared with the third quarter of 2013 was mainly dueto a release of certain specific provisions in the sameperiod in 2013. The decrease in loan impairment chargesand other credit risk provisions for the nine months ended30 September 2014 compared with the same period in theprior year is primarily as a result of lower specificallowances for commercial customers and the impact ofreduced impairment charges resulting from the plannedcontinued run-off of the consumer finance portfolio.
E02025883 HSBC Canada Q3 Inside Pages Nov14.indd 7 04/11/2014 23:20
H S B C B A N K C A N A D A
Management’s Discussion and Analysis (continued)
6
Total operating expensesQuarter ended Nine months ended
30 September2014
$m
30 September2013
$m
30 June2014
$m
30 September2014
$m
30 September2013
$m
Employee compensation and benefits .............................. 156 154 152 467 468General and administrative expenses ............................... 105 105 111 320 296Depreciation of property, plant and equipment ................ 8 8 9 25 25Amortization and impairment of intangible assets ........... 3 4 4 12 11
Total operating expenses.................................................. 272 271 276 824 800
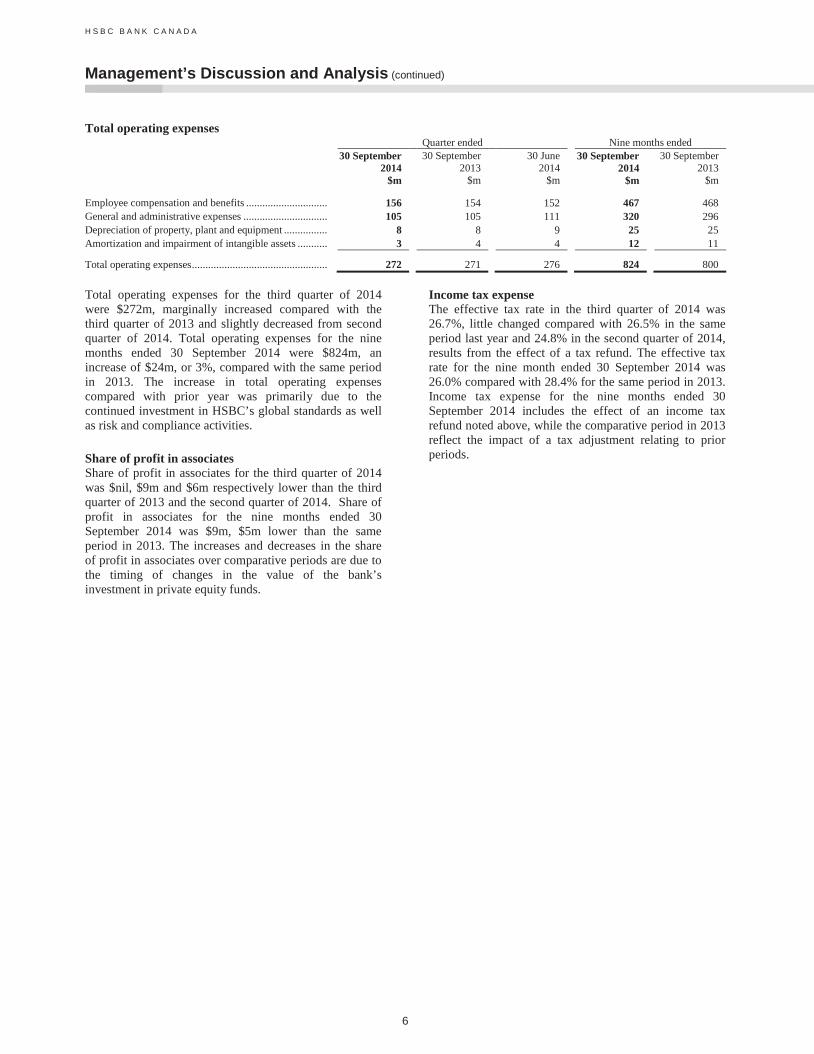
Total operating expenses for the third quarter of 2014were $272m, marginally increased compared with thethird quarter of 2013 and slightly decreased from secondquarter of 2014. Total operating expenses for the ninemonths ended 30 September 2014 were $824m, anincrease of $24m, or 3%, compared with the same periodin 2013. The increase in total operating expensescompared with prior year was primarily due to thecontinued investment in HSBC’s global standards as wellas risk and compliance activities.
Share of profit in associatesShare of profit in associates for the third quarter of 2014was $nil, $9m and $6m respectively lower than the thirdquarter of 2013 and the second quarter of 2014. Share ofprofit in associates for the nine months ended 30September 2014 was $9m, $5m lower than the sameperiod in 2013. The increases and decreases in the shareof profit in associates over comparative periods are due tothe timing of changes in the value of the bank’sinvestment in private equity funds.
Income tax expenseThe effective tax rate in the third quarter of 2014 was26.7%, little changed compared with 26.5% in the sameperiod last year and 24.8% in the second quarter of 2014,results from the effect of a tax refund. The effective taxrate for the nine month ended 30 September 2014 was26.0% compared with 28.4% for the same period in 2013.Income tax expense for the nine months ended 30September 2014 includes the effect of an income taxrefund noted above, while the comparative period in 2013reflect the impact of a tax adjustment relating to priorperiods.
E02025883 HSBC Canada Q3 Inside Pages Nov14.indd 8 04/11/2014 23:20

H S B C B A N K C A N A D A
7
Movement in financial position
Condensed consolidated balance sheet
At 30September
2014$m
At 30September
2013$m
At 31December
2013$m
ASSETSTrading assets ...................................................................................................................... 7,707 7,446 6,728Derivatives........................................................................................................................... 2,953 1,616 2,112Loans and advances to banks ............................................................................................... 603 564 1,149Loans and advances to customers ........................................................................................ 41,534 41,102 40,524Reverse repurchase agreements – non-trading ..................................................................... 5,979 7,637 6,161Financial investments........................................................................................................... 19,786 21,178 21,814Customer’s liability under acceptances ................................................................................ 5,222 5,007 4,757Other assets ......................................................................................................................... 932 1,044 1,015
Total assets........................................................................................................................... 84,716 85,594 84,260
LIABILITIES AND EQUITY
LiabilitiesDeposits by banks ................................................................................................................ 808 1,277 635Customer accounts ............................................................................................................... 49,698 47,688 50,926Repurchase agreements – non-trading.................................................................................. 2,272 4,214 1,487Trading liabilities ................................................................................................................. 3,912 4,420 4,396Derivatives........................................................................................................................... 2,770 1,306 1,746Debt securities in issue......................................................................................................... 11,292 12,387 11,348Acceptances ......................................................................................................................... 5,222 5,007 4,757Other liabilities .................................................................................................................... 3,706 3,878 3,880
Total liabilities ..................................................................................................................... 79,680 80,177 79,175
EquityShare capital and other reserves ........................................................................................... 1,688 2,284 1,959Retained earnings................................................................................................................. 3,148 2,903 2,926Non-controlling interests...................................................................................................... 200 230 200
Total equity.......................................................................................................................... 5,036 5,417 5,085
Total equity and liabilities.................................................................................................... 84,716 85,594 84,260
AssetsTotal assets at 30 September 2014 were $84.7bn, up$0.5bn from 31 December 2013. Increases in commercialcustomer lending and residential mortgages resulted in a$1.0bn growth in loans and advances to customers as wellas $0.5bn in customers’ liability under acceptances. Therewas also an increase of $1.0bn in trading assets due topending settlements of trading positions in governmentand agency bonds as well as an increase in derivatives of$0.8bn due to changes in interest and particularly foreignexchange rates. These increases were offset by declines of$2.0bn in financial investments and $0.5bn in loans andadvances to banks resulting from disposals, maturities andother balance sheet management activities.
LiabilitiesTotal liabilities at 30 September 2014 were $79.7bn, up$0.5bn from 31 December 2013. There were increases inderivatives of $1.0bn due to changes in interest andparticularly foreign exchange rates, non-tradingrepurchase agreements of $0.8bn resulting from balancesheet management activities and an increase inacceptances of $0.5bn driven by customer demand. Thesewere partially offset by decreases in customer accounts of$1.2bn, primarily as a result of lower commercial accountbalances, and trading liabilities of $0.5bn, primarily due tolower balances from pending trade settlements and shortposition securities.
E02025883 HSBC Canada Q3 Inside Pages Nov14.indd 9 04/11/2014 23:20

H S B C B A N K C A N A D A
Management’s Discussion and Analysis (continued)
8
Global lines of business
Commercial Banking
Commercial Banking offers a full range of commercial financial services and tailored solutions to customers ranging fromsmall and medium-sized enterprises (‘SMEs’) to publicly quoted companies.
Review of financial performanceQuarter ended Nine months ended
30 September2014
$m
30 September2013
$m
30 June2014
$m
30 September2014
$m
30 September2013
$m
Net interest income .......................................................... 164 169 165 497 502Net fee income................................................................. 79 78 81 239 235Net trading income........................................................... 6 7 7 19 22Gains less losses from financial investments.................... – – 16 16 –Other operating income / (expense) ................................. 5 (5) 3 14 (37)Total operating income .................................................... 254 249 272 785 722
Loan impairment (charges)/releases and other credit riskprovisions ................................................................... (11) 5 (18) (41) (95)
Net operating income....................................................... 243 254 254 744 627Total operating expenses.................................................. (100) (96) (104) (305) (278)Operating profit................................................................ 143 158 150 439 349Share of profit in associates ............................................. – 9 6 9 14
Profit before income tax expense ..................................... 143 167 156 448 363
Overview
Profit before income tax expense was $143m for the thirdquarter of 2014, a decrease of $24m, or 14%, comparedwith the third quarter of 2013 and a decrease of $13m or8% compared with the second quarter of 2014. Profitbefore income tax expense for the nine months ended 30September 2014 was $448m, an increase of $85m, or 23%compared with the same period in 2013.
The decrease in profit before income tax expensecompared with the same quarter in the previous year wasmainly due to higher loan impairment charges and lowershare of profits from associates. The decrease in profitbefore income tax expense compared with second quarterof 2014 resulted primarily from lower gains fromfinancial investments and lower share of profits from
associates, partially offset by lower specific loanimpairment charges.
The increase in profit before income tax expense for thenine months ended 30 September 2014 compared with thesame period last year was primarily due to an increase inother income reflecting the reduction in the fair value ofan investment property held for sale that was recorded in2013, lower specific loan impairment charges and gainsfrom financial investments. This was partially offset byhigher operating expenses primarily from increasedinvestments in HSBC’s global standards, risk andcompliance activities, increases in underlying business aswell as the impact of adoption of a revised methodologyadopted by HSBC Group for allocating functional supportcosts to the global lines of business.
Financial performance by income and expense item
Net interest income for the third quarter of 2014 was$164m, a decrease of $5m, or 3%, compared with thethird quarter of 2013 and marginally decreased comparedwith the second quarter of 2014. Net interest income forthe nine months ended 30 September 2014 was $497m, adecrease of $5m, or 1%, compared with the same periodin 2013. The decrease in net interest income comparedwith the same periods last year was primarily due torepositioning of the portfolio and recovery of interestincome on impaired loans recorded in 2013.
Net fee income for the third quarter of 2014 was $79m,little changed compared with the third quarter of 2013 andmarginally decreased from the second quarter of 2014.
Net fee income for the nine months ended 30 September2014 was $239m an increase of $4m or 2% comparedwith the same period in 2013. The increases in net feeincome over comparative figures mainly arises fromhigher banker’s acceptances.
E02025883 HSBC Canada Q3 Inside Pages Nov14.indd 10 04/11/2014 23:20

H S B C B A N K C A N A D A
9
Net trading income for the third quarter of 2014 was $6m,little changed from both the third quarter of 2013 and thesecond quarter of 2014. Net trading income for the ninemonths ended 30 September 2014 was $19m, a decreaseof $3m, or 14%, compared with the same period in 2013,primarily resulting from lower foreign exchange revenues.
Other operating income for the third quarter of 2014 was$5m, an increase of $10m, compared with the thirdquarter of 2013 and $2m higher than the second quarter of2014. Other operating income for the nine months ended30 September 2014 was $14m, an increase of $51m,compared with the same period in 2013. The increase inother operating income from the comparative periods in2013 reflected the reduction in the fair value of aninvestment property held for sale that was recorded in2013.
Loan impairment charges and other credit riskprovisions for the third quarter of 2014 was $11m, anincrease of $16m compared with the third quarter of 2013and a decrease of $7m, or 39%, compared with the secondquarter of 2014. Loan impairment charges for the ninemonths ended 30 September 2014 were $41m, a decreaseof $54m, or 57%, compared with the same period in 2013.The increase in loan impairment charges and other creditrisk provisions for the third quarter compared with thesame period last year resulted from a release of specificprovisions recorded in the prior year. The decrease inprovisions for the nine months ended 30 September 2014compared with the prior period was mainly as a result oflower specific loan impairment charges in 2014.
Gains less losses from financial investments for the ninemonths ended 30 September 2014 compared with thesame period in 2013 included gains of $16m which wererecorded on the disposal of certain available-for-salesecurities in the second quarter of 2014, which was notrepeated in the third quarter of 2014.
Total operating expenses for the third quarter of 2014was $100m, an increase of $4m, or 4%, compared withthe third quarter of 2013 and $4m, or 4%, lower than thesecond quarter of 2014. Total operating expenses for thenine months ended 30 September 2014 was $305m, anincrease of $27m, or 10%, compared with the same periodin 2013. The increase in total operating expensescompared with 2013 was primarily from increasedinvestments in HSBC’s global standards as well as riskand compliance activities, increases in underlyingbusinesses as well as the impact of the adoption of arevised methodology by HSBC Group for allocation offunctional support costs to the global lines of business.
Share of profit in associates for the third quarter of 2014was $nil, $9m lower than the third quarter of 2013 and$6m lower than the second quarter of 2014. Share in profitin associates for the nine months ended 30 September2014 was $9m, a decrease of $5m, compared with thesame period in 2013. The increases and decreases in theshare of profit in associates over comparative periods aredue to the timing of changes in the value of the bank’sinvestment in private equity funds.
Global Banking and Markets
Global Banking and Markets provides tailored financial solutions to major government, corporate and institutionalclients worldwide.
Review of financial performance
Quarter ended Nine months ended30 September
2014$m
30 September2013
$m
30 June2014
$m
30 September2014
$m
30 September2013
$m
Net interest income ........................................................... 45 37 46 135 119Net fee income.................................................................. 26 22 22 72 60Net trading income............................................................ 16 24 15 52 86Gains less losses from financial investments .................... 7 2 11 37 48Other operating income..................................................... – – 1 1 –Total operating income ..................................................... 94 85 95 297 313
Loan impairment charges and other credit risk provisions – (1) (2) (3) (1)Net operating income........................................................ 94 84 93 294 312Total operating expenses................................................... (30) (28) (29) (89) (86)
Profit before income tax expense ...................................... 64 56 64 205 226
E02025883 HSBC Canada Q3 Inside Pages Nov14.indd 11 04/11/2014 23:20

H S B C B A N K C A N A D A
Management’s Discussion and Analysis (continued)
10
OverviewProfit before income tax expense was $64m for the thirdquarter of 2014, an increase of $8m, or 14%, comparedwith the third quarter of 2013 and unchanged from thesecond quarter of 2014. Profit before income tax expensewas $205m for the nine months ended 30 September2014, a decrease of $21m, or 9% compared with the sameperiod in 2013. The increase in profit before income taxexpense for the third quarter of 2014 compared with thesame period in 2013 was primarily driven by increased feeincome arising from an increase in standby fees and
increased realized gains on disposals of financialinstruments. The decrease in profit before income taxexpense for the nine months ended 30 September 2014compared with the same period in 2013 was due to lowertrading income arising from lower spreads on foreignexchange products and lower gains on disposal from re-balancing of the financial investments portfolio. This waspartially offset by increased net interest income andincreased net fee income arising from higher standby anddebt capital market fees.
Financial performance by income and expense item
Net interest income for the third quarter of 2014 was$45m, an increase of $8m, or 22%, compared with thethird quarter of 2013 and marginally lower than thesecond quarter of 2014. Net interest income for the ninemonths ended 30 September 2014 was $135m, an increaseof $16m, or 13%, compared with the same period in 2013.The increase in net interest income compared with thesame periods last year was primarily due to higherinvestments in reverse repurchase agreements from higherlevel of short positions to facilitate customer transactions.
Net fee income for the third quarter of 2014 was $26m, anincrease of $4m, or 18%, compared with both the thirdquarter of 2013 and the second quarter of 2014. Net feeincome for the nine months ended 30 September 2014 was$72m, an increase of $12m, or 20%, compared with thesame period in 2013. The increase in net fee incomecompared with the same periods last year was primarilydue to higher standby fees.
Net trading income for the third quarter of 2014 was$16m, a decrease of $8m, or 33%, compared with thethird quarter of 2013 and marginally increased comparedwith the second quarter of 2014. Net trading income forthe nine months ended 30 September 2014 was $52m, adecrease of $34m, or 40%, compared with the sameperiod in 2013. The decrease in net trading incomecompared with the same periods last year was mainly dueto lower spreads related to foreign exchange products andthe impact from debit valuation adjustments on derivative
contracts due to the narrowing of our own credit spreads.The increase in net trading income compared with thesecond quarter of 2014 was mainly due to the impact fromdebit valuation adjustments on derivative contractsrecorded in the second quarter.
Gains less losses from financial investments for the thirdquarter of 2014 was $7m, an increase of $5m, or 250%,compared with the third quarter of 2013 and a decrease of$4m, or 36%, compared with the second quarter of 2014.Gains less losses from financial investments for the ninemonths ended 30 September 2014 was $37m, a decreaseof $11m, or 23%, compared with the same period in 2013.The bank realizes gains and losses from financialinvestments from disposals of available-for-sale financialinvestments driven by balance sheet managementactivities. The variances from comparative periods areprimarily as a result of the bank’s continuous balancesheet management activities.
Total operating expenses for the third quarter of 2014was $30m, an increase of $2m or 7% compared with thesame period in 2013 and marginally increased comparedwith the second quarter of 2014. Total operating expensesfor the nine months ended 30 September 2014 was $89m,an increase of $3m or 3% compared with the same periodin 2013. The increases over the comparative periods areprimarily due to increased investments in HSBC’s globalstandards, risk and compliance activities.
E02025883 HSBC Canada Q3 Inside Pages Nov14.indd 12 04/11/2014 23:20
H S B C B A N K C A N A D A
11
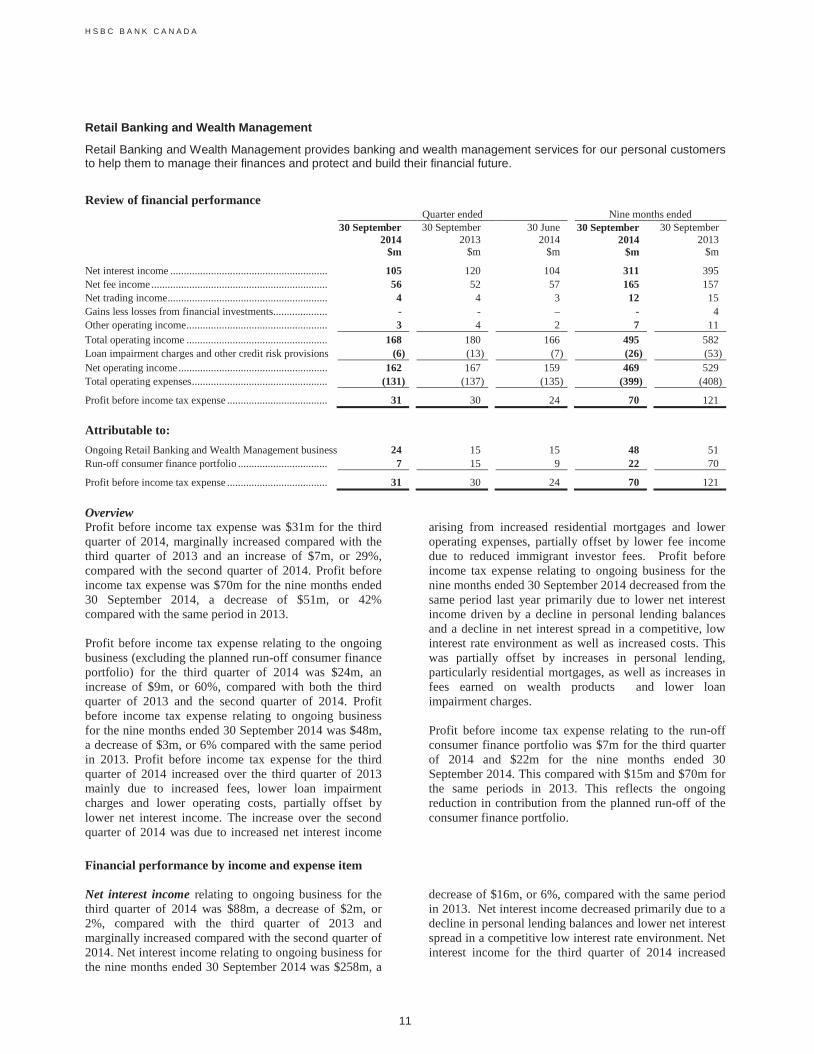
Retail Banking and Wealth Management
Retail Banking and Wealth Management provides banking and wealth management services for our personal customersto help them to manage their finances and protect and build their financial future.
Review of financial performanceQuarter ended Nine months ended
30 September2014
$m
30 September2013
$m
30 June2014
$m
30 September2014
$m
30 September2013
$m
Net interest income .......................................................... 105 120 104 311 395Net fee income................................................................. 56 52 57 165 157Net trading income........................................................... 4 4 3 12 15Gains less losses from financial investments.................... - - – - 4Other operating income.................................................... 3 4 2 7 11Total operating income .................................................... 168 180 166 495 582Loan impairment charges and other credit risk provisions (6) (13) (7) (26) (53)Net operating income....................................................... 162 167 159 469 529Total operating expenses.................................................. (131) (137) (135) (399) (408)
Profit before income tax expense ..................................... 31 30 24 70 121
Attributable to:Ongoing Retail Banking and Wealth Management business 24 15 15 48 51Run-off consumer finance portfolio ................................. 7 15 9 22 70
Profit before income tax expense ..................................... 31 30 24 70 121
OverviewProfit before income tax expense was $31m for the thirdquarter of 2014, marginally increased compared with thethird quarter of 2013 and an increase of $7m, or 29%,compared with the second quarter of 2014. Profit beforeincome tax expense was $70m for the nine months ended30 September 2014, a decrease of $51m, or 42%compared with the same period in 2013.
Profit before income tax expense relating to the ongoingbusiness (excluding the planned run-off consumer financeportfolio) for the third quarter of 2014 was $24m, anincrease of $9m, or 60%, compared with both the thirdquarter of 2013 and the second quarter of 2014. Profitbefore income tax expense relating to ongoing businessfor the nine months ended 30 September 2014 was $48m,a decrease of $3m, or 6% compared with the same periodin 2013. Profit before income tax expense for the thirdquarter of 2014 increased over the third quarter of 2013mainly due to increased fees, lower loan impairmentcharges and lower operating costs, partially offset bylower net interest income. The increase over the secondquarter of 2014 was due to increased net interest income
arising from increased residential mortgages and loweroperating expenses, partially offset by lower fee incomedue to reduced immigrant investor fees. Profit beforeincome tax expense relating to ongoing business for thenine months ended 30 September 2014 decreased from thesame period last year primarily due to lower net interestincome driven by a decline in personal lending balancesand a decline in net interest spread in a competitive, lowinterest rate environment as well as increased costs. Thiswas partially offset by increases in personal lending,particularly residential mortgages, as well as increases infees earned on wealth products and lower loanimpairment charges.
Profit before income tax expense relating to the run-offconsumer finance portfolio was $7m for the third quarterof 2014 and $22m for the nine months ended 30September 2014. This compared with $15m and $70m forthe same periods in 2013. This reflects the ongoingreduction in contribution from the planned run-off of theconsumer finance portfolio.
Financial performance by income and expense item
Net interest income relating to ongoing business for thethird quarter of 2014 was $88m, a decrease of $2m, or2%, compared with the third quarter of 2013 andmarginally increased compared with the second quarter of2014. Net interest income relating to ongoing business forthe nine months ended 30 September 2014 was $258m, a
decrease of $16m, or 6%, compared with the same periodin 2013. Net interest income decreased primarily due to adecline in personal lending balances and lower net interestspread in a competitive low interest rate environment. Netinterest income for the third quarter of 2014 increased
E02025883 HSBC Canada Q3 Inside Pages Nov14.indd 13 04/11/2014 23:20

H S B C B A N K C A N A D A
Management’s Discussion and Analysis (continued)
12
over the second quarter of 2014 mainly due to increases inresidential mortgages.
Net fee income relating to ongoing business for the thirdquarter of 2014 was $55m, an increase of $3m, or 8%,compared with the third quarter of 2013 and marginallylower than the second quarter of 2014. Net fee incomerelating to ongoing business for the nine months ended 30September 2014 was $162m, an increase of $10m, or 6%,compared with the same period in 2013. The increases infee revenues mainly resulted from increases in sales inwealth management products. However, fee incomedecreased compared to the second quarter of 2014 due tothe cancellation of the Federal Immigrant InvestorProgram.
Net trading income relating to ongoing business for thethird quarter of 2014 was $4m, little changed comparedwith the third quarter of 2013 and the second quarter of2014. Net trading income relating to ongoing business forthe nine months ended 30 September 2014 was $12m, adecrease of $3m, or 20%, compared with the same periodin 2013, mainly arising from lower foreign exchangetrading income.
Loan impairment charges and other credit riskprovisions relating to ongoing business for the third
quarter of 2014 was $4m, a decrease of $3m, or 43%,compared with the third quarter of 2013 and unchangedcompared with the second quarter of 2014. Loanimpairment charges and other credit risk provisionsrelating to ongoing business for the nine months ended 30September 2014 was $15m, a decrease of $12m, or 44%,compared with the same period in 2013. The decrease inloan impairment charges and other credit risk provisionsis due to a reduction in collectively assessed provisionsfollowing lower loan balances.
Total operating expenses relating to ongoing business forthe third quarter of 2014 was $123m, a reduction of $2m,or 2%, compared with the third quarter of 2013 and adecrease of $5m, or 5%, compared with the secondquarter of 2014. Total operating expenses relating toongoing business for the nine months ended 30 September2014 was $377m, an increase of $6m, or 2%, comparedwith the same period in 2013. The variances wereprimarily from higher staff costs, marketing expensesrelating to Premier campaigns and higher customerprinting expenses as well as the bank’s continuedinvestment in HSBC’s global standards as well as risk andcompliance activities, partially offset by a reduction ofallocated support costs, particularly in the third quarter of2014.
Other
‘Other’ contains the results of movements in fair value of own debt, income and expenses related to informationtechnology services provided to HSBC Group companies on an arm’s length basis and other transactions which do notdirectly relate to our global lines of business.
Review of financial performanceQuarter ended Nine months ended
30 September2014
$m
30 September2013
$m
30 June2014
$m
30 September2014
$m
30 September2013
$m
Net interest expense ......................................................... (11) (7) (8) (26) (21)Net trading income........................................................... 9 7 8 24 21Net expense from financial instruments designated at fair
value ............................................................................ (1) – (1) (4) (3)Other operating income.................................................... 7 8 7 20 23Total operating income .................................................... 4 8 6 14 20Total operating expenses.................................................. (11) (10) (8) (31) (28)
Loss before income tax expense....................................... (7) (2) (2) (17) (8)
E02025883 HSBC Canada Q3 Inside Pages Nov14.indd 14 04/11/2014 23:20

H S B C B A N K C A N A D A
13
Summary quarterly performance
Refer to the ‘Summary quarterly performance’ section of our Annual Report and Accounts 2013 for more informationregarding quarterly trends in performance for 2013 and 2012.Summary consolidated income statement
Quarter endedSept 30
2014$m
June 302014
$m
Mar 312014
$m
Dec 312013
$m
Sept 302013
$m
June 302013
$m
Mar 312013
$m
Dec 312012
$m
Total operating income ................................................................ 520 539 532 524 522 531 584 526Profit for the period...................................................................... 170 182 172 182 186 130 189 154Profit attributable to the common shareholder ............................. 163 172 160 164 168 113 171 136Profit attributable to preferred shareholders ................................. 4 8 9 16 15 15 15 16Profit attributable to non-controlling interests.............................. 3 2 3 2 3 2 3 2Basic earnings per common share ................................................ 0.32 0.35 0.32 0.33 0.34 0.23 0.34 0.27
Accounting matters
Critical accounting policies
The results of the bank are sensitive to the accountingpolicies, assumptions and estimates that underlie thepreparation of our consolidated financial statements. Asummary of our significant accounting policies areprovided in note 2.
Refer to the ‘Critical accounting policies’ section of ourAnnual Report and Accounts 2013 for accounting policiesthat are deemed critical to our results and financialposition, in terms of materiality of the items which thepolicy is applied and the high degree of judgementinvolved, including the use of assumptions and estimation.
Changes in presentation
In the first quarter of 2014, the bank changed itspresentation of reverse repurchase and repurchaseagreements. Previously, these amounts were eitherincluded in loans and advances to banks as well as loansand advances to customers or deposits by banks as well ascustomer accounts respectively. These amounts are nowpresented in their own separate categories on the face ofthe bank’s consolidated balance sheet, which is a moreappropriate disclosure for these instruments which are notrepresentative of typical loans and deposits. Prior periodpresentation was changed accordingly. There is no changein total assets and liabilities, nor is there any impact oninterest income and expense. Refer to note 1 for furtherinformation relating to the change.
Changes in accounting policy
OffsettingOn 1 January 2014, the bank adopted amendments to IAS32 ‘Offsetting Financial Assets and Financial Liabilities’.The amendments clarify the requirements for offsettingfinancial instruments and address inconsistencies inpractice when applying the offsetting criteria in IAS 32‘Financial Instruments: Presentation’. The adoption didnot have a material effect on the bank’s consolidatedfinancial statements and as a result comparativeinformation was not restated.
Future accounting developmentsRevenueIn May 2014, the International Accounting and StandardsBoard’s (‘IASB’) issued IFRS 15 ‘Revenue fromContracts with Customers’. The standard is effective forannual periods beginning on or after 1 January 2017 withearly adoption permitted
Financial instrumentsIn July 2014, the IASB issued IFRS 9 ‘FinancialInstruments’, which is the comprehensive standard toreplace IAS 39 ‘Financial Instruments: Recognition andMeasurement’, and includes requirements forclassification and measurement of financial assets andliabilities, impairment of financial assets and hedgeaccounting. The standard is effective for annual periodsbeginning on or after 1 January 2018 with early adoptionpermitted.
Reference should be made to note 1(e) on the consolidatedfinancial statements (‘Future accounting developments’)for more information regarding the application of both ofthese new standards and their impact on the bank.
E02025883 HSBC Canada Q3 Inside Pages Nov14.indd 15 04/11/2014 23:20
H S B C B A N K C A N A D A
Management’s Discussion and Analysis (continued)
14
Off-balance sheet arrangements
As part of our banking operations, we enter into a numberof off-balance sheet financial transactions that have afinancial impact, but may not be recognized in ourfinancial statements. These types of arrangements arecontingent and may not necessarily, but in certaincircumstances could, involve us incurring a liability in
excess of amounts recorded in our consolidated balancesheet. These arrangements include: guarantees, letters ofcredit, and derivatives and are described in the ‘Off-balance sheet arrangements’ section of our Annual Reportand Accounts 2013. Further information is disclosed innote 11.
Related Party Transactions
We enter into transactions with other HSBC affiliates aspart of the normal course of business, such as banking andoperational services. In particular, as a member of one ofthe world’s largest financial services organizations, weshare in the expertise and economies of scale provided bythe HSBC Group. We provide and receive services orenter into transactions with a number of HSBC Groupcompanies, including sharing in the cost of development
for technology platforms used around the world andbenefit from worldwide contracts for advertising,marketing research, training and other operational areas.
These related party transactions are on terms similar tothose offered to non-related parties and are subject toformal approval procedures that have been approved bythe bank’s Conduct Review Committee.
Disclosure controls and procedures and internal control over financial reporting
The Chief Executive Officer and Chief Financial Officerhave signed certifications relating to the appropriatenessof the financial disclosures in interim filings with theCanadian Securities Administrators, including thisMD&A and the accompanying unaudited interimconsolidated financial statements for the quarter ended 30September 2014, and their responsibility for the designand maintenance of disclosure controls and procedures
and internal controls over financial reporting to providereasonable assurance regarding the reliability of financialreporting in accordance with IFRS.
There have been no changes in internal controls overfinancial reporting during the quarter ended 30 September2014 that have materially affected or are reasonably likelyto affect internal control over financial reporting.
Risk Management
Refer to the ‘Risk management’ section of our Annual Report and Accounts 2013 for a discussion of how the bank managesrisk on an enterprise wide level, as well as the management of reputational and operational risk.
Credit risk
Credit risk is the risk of financial loss if a customer orcounterparty fails to an obligation under contract. Itarises principally from direct lending, trade finance andthe leasing business, but also from other products suchas guarantees and credit derivatives and from holdingassets in the form of debt securities.
The bank’s principal objectives of credit risk managementare: to maintain a strong culture of responsible lending,
supported by a robust risk policy and controlframework;
to both partner with and challenge businesses indefining and implementing and continually re-evaluating our risk appetite under actual and scenarioconditions; and
to ensure there is independent, expert scrutiny ofcredit risks, their costs and their mitigation.
Refer to the ‘Risk management’ section of our AnnualReport and Accounts 2013 for a discussion of how thebank manages credit risk, collateral and other credit riskenhancements, as well as a more in depth explanation ofour credit risk measures.
Diversification of credit riskConcentration of credit risk may arise when the ability ofa number of borrowers or counterparties to meet theircontractual obligations are similarly affected by externalfactors. Diversification of credit risk is a key concept bywhich we are guided.In assessing and monitoring for credit risk concentration,we aggregate exposures by product type, industry and
geographic area. Exposures are measured at exposure atdefault (‘EAD’), which reflects drawn balances as well asan allowance for undrawn amounts of commitments andcontingent exposures, and therefore would not agree to thefinancial statements.
E02025883 HSBC Canada Q3 Inside Pages Nov14.indd 16 04/11/2014 23:20

H S B C B A N K C A N A D A
15
Wholesale and retail credit risk exposures by product typeEAD
At 30 September2014
$m
EADAt 31 December
2013$m
Wholesale credit risk exposuresSovereign
Drawn exposures.............................................................................................................................. 20,530 22,696Derivatives ....................................................................................................................................... 25 278Undrawn commitments .................................................................................................................... 222 17Other off-balance sheet exposures.................................................................................................... 73 –
20,850 22,991Banks
Drawn exposures.............................................................................................................................. 2,685 3,275Derivatives ....................................................................................................................................... 3 2,409Repurchase type transactions ........................................................................................................... 3,322 16Other off-balance sheet exposures.................................................................................................... 554 469
6,564 6,169Corporate
Drawn exposures.............................................................................................................................. 28,291 26,511Undrawn commitments .................................................................................................................... 11,243 11,703Derivatives ....................................................................................................................................... 21 1,278Repurchase type transactions ........................................................................................................... 1,629 133Other off-balance sheet exposures.................................................................................................... 3,521 2,950
44,705 42,575
Total wholesale credit risk exposures............................................................................................................. 72,119 71,735
Retail credit risk exposuresResidential mortgages ............................................................................................................................. 17,992 17,347Home equity lines of credit ..................................................................................................................... 3,047 4,916Other personal loan facilities................................................................................................................... 537 2,600Credit cards............................................................................................................................................. 2,165 1,075Personal unsecured revolving loan facilities ........................................................................................... 602 1,060Run-off consumer finance loan portfolio ................................................................................................ 478 670Other small to medium enterprises loan facilities.................................................................................... 1,223 624
Total retail credit risk exposures .................................................................................................................... 26,044 28,292
Total wholesale and retail credit risk exposures............................................................................................. 98,163 100,027
Credit Quality of Financial Assets
The overall credit quality at 30 September 2014 wasstrong, primarily driven by the underlying quality of thewholesale portfolio and the bank’s high qualityrelationships. The credit quality in our retail portfolio is
also strong, in part resulting from the planned run-off ofthe consumer finance portfolio.
E02025883 HSBC Canada Q3 Inside Pages Nov14.indd 17 04/11/2014 23:20

H S B C B A N K C A N A D A
Management’s Discussion and Analysis (continued)
16
Impairment allowances and provision for credit lossesImpairment allowances
At 30September
2014$m
At 31December
2013$m
Gross loans and advances to customersIndividually assessed impaired loans and advances (A)....................................................................................... 480 445
Collectively assessed loans and advances (B) ...................................................................................................... 41,394 40,442- impaired loans and advances ..................................................................................................................... 99 101- non-impaired loans and advances .............................................................................................................. 41,295 40,341
Total gross loans and advances to customers (C) ................................................................................................. 41,874 40,887
Less: impairment allowances (c).......................................................................................................................... (340) (363)- individually assessed (a) ............................................................................................................................ (138) (157)- collectively assessed (b) ............................................................................................................................ (202) (206)
Net loans and advances to customers ................................................................................................................... 41,534 40,524
Individually assessed impaired loans and advances coverage - (a) as a percentage of (A) ................................... 28.75% 35.3%Collectively assessed loans and advances coverage - (b) as a percentage of (B).................................................. 0.5% 0.5%Total loans and advances coverage - (c) as a percentage of (C) ........................................................................... 0.8% 0.9%
Movement in impairment allowances and provision for credit lossesNine months ended 30 September 2014
Customersindividually
assessed$m
Customerscollectively
assessed$m
Provisionfor credit
losses$m
Total$m
Opening balance at the beginning of the period ......................................................... 157 206 61 424Movement
Loans and advances written off net of recoveries of previously written offamounts........................................................................................................ (60) (18) – (78)
Charge to income statement ................................................................................ 47 14 9 70Interest recognized on impaired loans and advances ........................................... (6) – – (6)
Closing balance at the end of the period..................................................................... 138 202 70 410
Movement in impairment allowances and provision for credit lossesNine months ended 30 September 2013
Customersindividually
assessed$m
Customerscollectively
assessed$m
Provisionfor credit
losses$m
Total$m
Opening balance at the beginning of the period ......................................................... 202 217 80 499Movement
Loans and advances written off net of recoveries of previously written offamounts........................................................................................................ (109) (71) – (180)
Charge/(release) to income statement.................................................................. 107 54 (12) 149Interest recognized on impaired loans and advances ........................................... (12) – – (12)
Closing balance at the end of the period..................................................................... 188 200 68 456
E02025883 HSBC Canada Q3 Inside Pages Nov14.indd 18 04/11/2014 23:20

H S B C B A N K C A N A D A
17
Liquidity and funding risk
Liquidity risk is the risk that the bank does not havesufficient financial resources to meet its obligationsas they fall due, or will have to do so at an excessivecost. This risk arises from mismatches in the timingof cash flows.
There have been no material changes to our liquidity andfunding management strategy as described in the ‘Riskmanagement’ section of our Annual Report and Accounts2013. We continue to monitor liquidity and funding riskwithin our stated risk appetite and managementframework.
Advances to core funding ratioThe bank emphasizes the importance of core currentaccounts and savings accounts as a source of stablefunding to finance lending to customers, and discouragesreliance on short-term professional funding.
The advances to core funding ratio describes loans andadvances to customers as a percentage of the total of corecustomer current and savings accounts and term fundingwith a remaining term to maturity in excess of one year.
The distinction between core and non-core depositsgenerally means that the bank’s measure of advances tocore funding is more restrictive than that which could beinferred from the published financial statements.
The table below shows the extent to which loans andadvances to customers were financed by reliable andstable sources of funding.
Advances to core funding ratio
Nine-monthsended
30 September2014
%
Yearended
31 December2013
%
End of period ............................................................................................................................................................ 100% 93%Highest...................................................................................................................................................................... 101% 100%Lowest ...................................................................................................................................................................... 93% 93%Average..................................................................................................................................................................... 99% 96%
Liquid Assets
The table below shows the estimated liquidity value(before assumed haircuts) of assets categorized as liquidused for the purpose of liquidity stress testing as set out inour internal liquidity and funding managementframework.
Any unencumbered asset held as a consequence of areverse repurchase transaction with a residual contractualmaturity within the relevant stress testing horizon andunsecured interbank loans maturing within three monthsare not included in liquid assets, as these assets arereflected as contractual cash inflows.
Estimated liquidity valueAt 30
September2014
$m
At 31December
2013$m
Level 11................................................................................................................................................................ 16,419 17,955
Level 2 2............................................................................................................................................................... 4,036 3,960
20,455 21,915
1 Includes debt securities of central governments, central banks, supranationals and multilateral development banks.2 Includes debt securities of local and regional governments, public sector entities and secured covered bonds.
Net contractual cash flows
The following table quantifies the contractual cash flowsfrom interbank and intra-Group loans and deposits, andreverse repurchase transactions, repurchase transactions
(including intergroup transactions) and short positions.These contractual cash inflows and outflows should beconsidered alongside the level of liquid assets and aretreated as such in our internal liquidity stress testing.
E02025883 HSBC Canada Q3 Inside Pages Nov14.indd 19 04/11/2014 23:20

H S B C B A N K C A N A D A
Management’s Discussion and Analysis (continued)
18
Cash flows within three monthsAt 30
September2014
$m
At 31December
2013$m
Interbank and intra-Group loans and deposits ...................................................................................................... 919 855Reverse repurchase transactions, repurchase transactions and outright short positions (including intra-
Group)........................................................................................................................................................... 7 1,057
Contingent liquidity risk arising from committed lending facilities
The bank provides commitments to various counterparts.In terms of liquidity risk, the most significant risk relatesto committed lending facilities which, whilst undrawn,give rise to contingent liquidity risk, as these could bedrawn during a period of liquidity stress. Commitmentsare given to customers and committed liquidity facilities
are provided to conduits, established to enable clients toaccess a flexible market-based source of finance.
The table below shows the level of undrawn commitmentsoutstanding to conduits and customers for the five largestsingle facilities and the largest market sector.
The bank’s contractual undrawn exposures monitored under the contingent liquidity risk structure
At 30September
2014$m
At 31December
2013$m
Commitments to conduitsTotal lines ..................................................................................................................................................... 245 1,035Largest individual lines ................................................................................................................................. 194 765
Commitments to customersFive largest.................................................................................................................................................... 1,701 1,553Largest market sector .................................................................................................................................... 3,760 3,644
Sources of fundingCurrent accounts and deposits, payable on demand or onshort notice, form a significant part of our funding. Weplace considerable importance on maintaining the stabilityand growth of these deposits, which provide a diversifiedpool of funds.
We also access professional markets in order to maintain apresence in local money markets and to optimize thefunding of asset maturities not naturally matched by coredeposit funding. As part of our wholesale fundingarrangements, we have a number of programs for
fundraising activities, so that undue reliance is not placedon any one source of funding.
No reliance is placed on unsecured money marketwholesale funding as a source of core funding. Onlywholesale funding with a residual term to maturity of oneyear or greater is counted towards the core funding base.In addition, our stress testing assumptions require anequivalent amount of liquid assets to be held againstwholesale funding maturing within the relevant stresstesting horizon.
Encumbered assetsIn the normal course of business, the bank will pledge orotherwise encumber assets. The pledging of assets willoccur to meet the bank’s payments and settlement systemobligations, as security in a repurchase transaction, tosupport secured debt instruments or as marginingrequirements. Limits are in place to control such pledging.
The bank actively monitors its pledging positions.Encumbered assets are not counted towards the bank’sliquid assets used for internal stress testing scenarios. Wefurther estimate the impact of credit rating downgradetriggers, and exclude the estimated impact from liquidassets within the bank’s liquidity stress testing scenarios.
E02025883 HSBC Canada Q3 Inside Pages Nov14.indd 20 04/11/2014 23:20

H S B C B A N K C A N A D A
19
Market riskMarket risk is the risk that movements in market riskfactors, including foreign exchange rates andcommodity prices, interest rates, credit spreads andequity prices, will reduce our income or the value ofour portfolios
The objective of market risk management is to identify,measure and control market risk exposures in order tooptimize return on risk and to remain within the bank’srisk appetite.
Refer to the ‘Risk management’ section of our AnnualReport and Accounts 2013 for a discussion of how the
bank manages market risk as well as a more in depthexplanation of our market risk measures.
Value at Risk (‘VaR’)
VaR is a technique that estimates the potential losses thatcould occur on risk positions as a result of movements inmarket rates and prices over a specified time horizon andto a given level of confidence.
VaR disclosed in the table and graph below is the bank’stotal VaR for both trading and non-trading books andremained within the bank’s limits.
VAR by risk type for trading activities1
Foreign exchangeand commodity
$mInterest rate
$mEquity
$mCredit Spread
$m
Portfoliodiversification 2
$mTotal3
$ml
January – September 2014At period end 0.8 0.6 0.0 0.8 (1.0) 1.3Average 0.2 0.4 0.0 1.0 (0.5) 1.1Minimum 0.0 0.0 0.1 0.5 0.6Maximum 1.0 1.2 0.1 2.5 2.5
January – September 2013At period end 0.0 0.7 0.1 2.2 (0.7) 2.3Average 0.1 1.0 0.0 1.8 (0.8) 2.1Minimum 0.0 0.4 0.0 0.8 1.1Maximum 0.5 1.9 0.2 4.2 4.2
Notes1 Trading portfolios comprise positions arising from the market-making and warehousing of customer derived positions2 Portfolio diversification is the market risk dispersion effect of holding a portfolio containing different risk types. It represents the reduction inunsystematic market risk that occurs when combining a number of different risk types, for example, interest rate, equity and foreign exchange,together in one portfolio. It is measured as the difference between the sum of the VAR by individual risk type and the combined total VAR. A negativenumber represents the benefit of portfolio diversification. As the maximum and minimum occur on different days for different risk types, it is notmeaningful to calculate a portfolio diversification benefit for these measures.3 The total VAR is non-additive across risk types due to diversification effects.
Nine months ended30 September
Non-trading value at risk2014
$m2013
$m
At period end ....................................................................................................................................................... 12.3 11.9Average................................................................................................................................................................ 11.6 13.2Minimum ............................................................................................................................................................. 6.6 10.0Maximum............................................................................................................................................................. 16.7 17.8
E02025883 HSBC Canada Q3 Inside Pages Nov14.indd 21 04/11/2014 23:20

H S B C B A N K C A N A D A
Management’s Discussion and Analysis (continued)
20
Daily Total VaR
Interest rate risk
Interest rate risk arises primarily out of differences in theterm to maturity or repricing of our assets and liabilitiesboth on and off-balance sheet. These interest rate riskexposures, or “gaps”, are monitored against prescribedlimits. We use a variety of cash and derivative instruments,
principally interest rate swaps, to manage our interestrate risk. We use derivatives to modify the interest ratecharacteristics of related balance sheet instrumentsand to hedge anticipated exposures when marketconditions are considered beneficial.
At 30 September 2014Economic value
of equity riskTotal
$m
Net interestincome risk
Total$m
(Decrease)/increase in profit before tax as a result of:100 bps increase in rates ...................................................................................................................................... (103) 43100 bps decrease in rates...................................................................................................................................... 50 (61)
6
9
12
15
18
Q1 2013 Q2 2013 Q3 2013 Q4 2013 Q1 2014 Q2 2014 Q3 2014
$m
E02025883 HSBC Canada Q3 Inside Pages Nov14.indd 22 04/11/2014 23:20

H S B C B A N K C A N A D A
21
Factors that may affect future results
The risk management section in the MD&A describes themost significant risks to which the bank is exposed and ifnot managed appropriately could have a material impacton our future financial results. Refer to the ‘Factors that
may affect future results’ section of our Annual Reportand Accounts 2013 for a description of additional factorswhich may affect future financial results.
Capital
Our objective in the management of capital is tomaintain appropriate levels of capital to support ourbusiness strategy and meet our regulatory requirements.
Refer to the ‘Capital’ section of our Annual Report andAccounts 2013 for a discussion of how the bank managesits capital.
Regulatory capital and capital ratios in the tables below,with the exception of the assets-to-capital multiple, arepresented under a Basel III ‘all-in’ basis, which appliescertain Basel III regulatory adjustments from 1 January
2013 and phases out non-qualifying capital instrumentsover 10 years starting 1 January 2013. The assets-to-capital multiple is presented under a Basel III‘transitional’ basis, which phases in Basel III regulatoryadjustments over 4 years starting 1 January 2014 andphases out non-qualifying capital instruments over 10years starting 1 January 2013.
The bank remained within its required regulatory capitallimits during the nine months ended 30 September 2014.
Regulatory capital ratiosActual regulatory capital ratios and capital limits
30 September2014
31 December2013
Actual regulatory capital ratiosCommon equity tier 1 capital ratio ..................................................................................................................... 10.8% 11.0%Tier 1 capital ratio............................................................................................................................................... 12.1% 13.2%Total capital ratio................................................................................................................................................ 13.7% 15.0%
Actual Assets-to-capital multiple .............................................................................................................................. 16.8x 15.1x
Required regulatory capital limitsMinimum Common equity tier 1 capital ratio..................................................................................................... 7.0% 7.0%Minimum Tier 1 capital ratio1............................................................................................................................. 8.5% 8.5%Minimum Total capital ratio ........................................................................................................................................................................................................................................................................................................... (
10.5% 10.5%1 The minimum Tier 1 capital ratio limit is effective from 1 January 2014.
Regulatory capitalRegulatory capital and risk weighted assets
30 September2014
$m
31 December2013
$mTier 1 capital ............................................................................................................................................................. 4,864 4,857
Common equity tier 1 capital ............................................................................................................................. 4,314 4,057Gross common equity1 ................................................................................................................................ 4,486 4,285Regulatory adjustments............................................................................................................................... (172) (228)
Additional tier 1 eligible capital2........................................................................................................................ 550 800
Tier 2 capital3............................................................................................................................................................ 616 677
Total capital available for regulatory purposes.......................................................................................................... 5,480 5,534
Total risk-weighted assets ......................................................................................................................................... 40,129 36,862
1 Includes common share capital, retained earnings and accumulated other comprehensive income.2 Includes directly issued capital instruments and instruments issued by a subsidiary subject to phase out.3 Includes directly issued capital instruments subject to phase out and collective allowances.
E02025883 HSBC Canada Q3 Inside Pages Nov14.indd 23 04/11/2014 23:20

H S B C B A N K C A N A D A
Management’s Discussion and Analysis (continued)
22
Outstanding Shares and Securities
Outstanding shares and securitiesAt 29 October 2014
Dividendor
distribution1
Number ofissued sharesand securities
Carryingvalue
$ per share orsecurity
Thousands$m
Common shares............................................................................................................................ 498,668 1,225
Preferred SharesClass 1, Series C ................................................................................................................... 0.31875 7,000 175Class 1, Series D ................................................................................................................... 0.3125 7,000 175
350
HSBC HaTS™ - Series 20152...................................................................................................... 25.75 200
1 Cash dividends on preferred shares are non-cumulative and are payable quarterly. Cash distributions on HSBC HaTSTM are non-cumulative andare payable semi-annually.
2 Presented as non-controlling interests in the consolidated balance sheet.
During the third quarter of 2014, the bank declared andpaid $80m in dividends on HSBC Bank Canada commonshares, a decrease of $10m compared with the samequarter last year. The bank declared and paid $240m individends on common shares during the nine monthsended 30 September 2014, a decrease of $30m from thesame period in 2013.
Regular quarterly dividends of 31.875 cents per sharehave been declared on HSBC Bank Canada Class 1Preferred Shares – Series C and 31.25 cents per share onClass 1 Preferred Shares – Series D. Dividends will bepaid on 31 December 2014, to shareholders of record on15 December 2014.
E02025883 HSBC Canada Q3 Inside Pages Nov14.indd 24 04/11/2014 23:20

H S B C B A N K C A N A D A
Financial Statements (unaudited)
23
Consolidated income statementQuarter ended Nine months ended
30 September2014
30 September2013
30 June2014
30 September2014
30 September2013
$m $m $m $m $m
Interest income .......................................................................... 478 511 484 1,445 1,562Interest expense ......................................................................... (175) (192) (177) (528) (567)
Net interest income................................................................ 303 319 307 917 995
Fee income ................................................................................ 181 174 183 536 521Fee expense ............................................................................... (20) (22) (23) (60) (69)
Net fee income........................................................................... 161 152 160 476 452
Trading income excluding net interest income .......................... 32 31 32 100 111Net interest income on trading activities................................ 3 11 1 7 33
Net trading income ................................................................ 35 42 33 107 144
Net expense from financial instruments designated at fairvalue...................................................................................... (1) - (1) (4) (3)
Gains less losses from financial investments ............................. 7 2 27 53 52Other operating income/(expense) ............................................. 15 7 13 42 (3)
Total operating income............................................................ 520 522 539 1,591 1,637
Loan impairment charges and other credit risk provisions......... (17) (9) (27) (70) (149)
Net operating income............................................................... 503 513 512 1,521 1,488
Employee compensation and benefits........................................ (156) (154) (152) (467) (468)General and administrative expenses ......................................... (105) (105) (111) (320) (296)Depreciation of property, plant and equipment.......................... (8) (8) (9) (25) (25)Amortization and impairment of intangible assets..................... (3) (4) (4) (12) (11)
Total operating expenses ......................................................... (272) (271) (276) (824) (800)
Operating profit....................................................................... 231 242 236 697 688
Share of profit in associates ....................................................... - 9 6 9 14
Profit before income tax expense ............................................ 231 251 242 706 702
Income tax expense ................................................................ (61) (65) (60) (182) (197)
Profit for the period................................................................ 170 186 182 524 505
Profit attributable to common shareholder................................ 163 168 172 495 452Profit attributable to preferred shareholders............................... 4 15 8 21 45Profit attributable to shareholders .............................................. 167 183 180 516 497Profit attributable to non-controlling interests ........................... 3 3 2 8 8
Average number of common shares outstanding (000’s) ........... 498,668 498,668 498,668 498,668 498,668Basic earnings per common share.............................................. $ 0.32 $ 0.34 $ 0.35 $ 0.99 $ 0.91
The accompanying notes and the ‘Risk Management’ and ‘Capital’ sections within Management’s Discussion and Analysis form an integral part ofthese financial statements.
E02025883 HSBC Canada Q3 Inside Pages Nov14.indd 25 04/11/2014 23:20
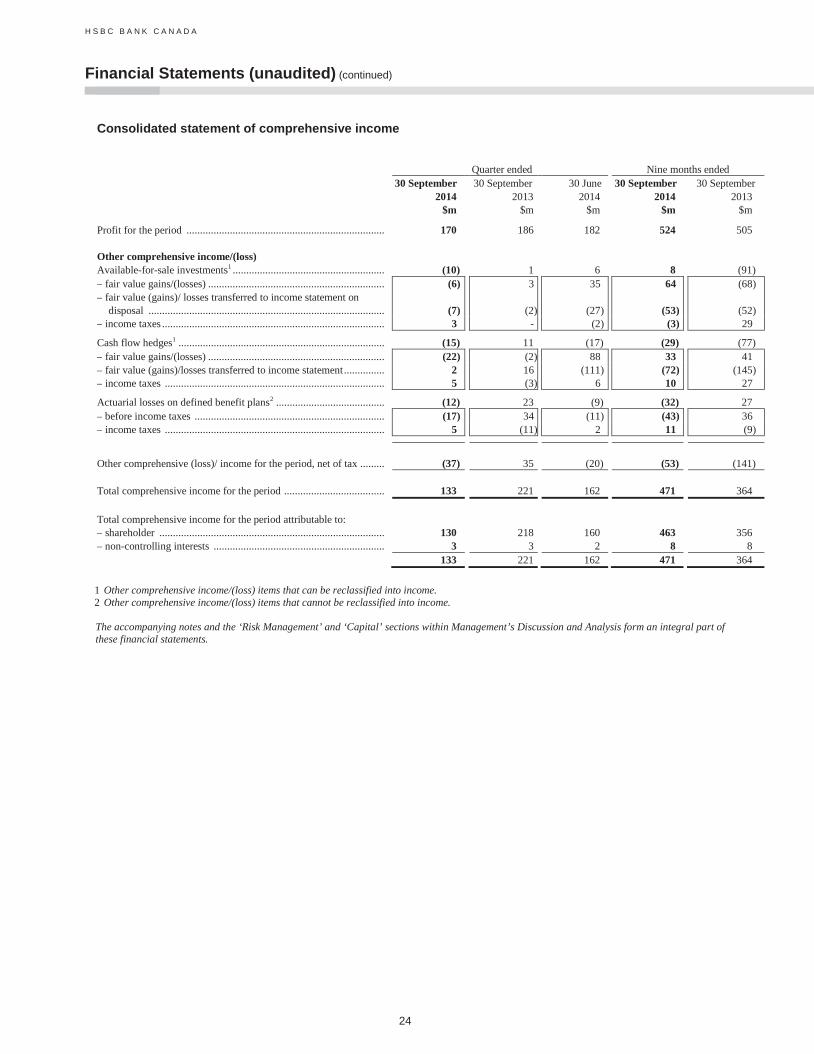
H S B C B A N K C A N A D A
Financial Statements (unaudited) (continued)
24
Consolidated statement of comprehensive income
Quarter ended Nine months ended30 September
201430 September
201330 June
201430 September
201430 September
2013$m $m $m $m $m
Profit for the period ............................................................................ 170 186 182 524 505
Other comprehensive income/(loss)Available-for-sale investments1 ........................................................... (10) 1 6 8 (91)– fair value gains/(losses) .................................................................... (6) 3 35 64 (68)– fair value (gains)/ losses transferred to income statement on
disposal .......................................................................................... (7) (2) (27) (53) (52)– income taxes .................................................................................... 3 - (2) (3) 29
Cash flow hedges1 ............................................................................... (15) 11 (17) (29) (77)– fair value gains/(losses) .................................................................... (22) (2) 88 33 41– fair value (gains)/losses transferred to income statement.................. 2 16 (111) (72) (145)– income taxes .................................................................................... 5 (3) 6 10 27
Actuarial losses on defined benefit plans2 ........................................... (12) 23 (9) (32) 27– before income taxes ......................................................................... (17) 34 (11) (43) 36– income taxes .................................................................................... 5 (11) 2 11 (9)
Other comprehensive (loss)/ income for the period, net of tax ............ (37) 35 (20) (53) (141)
Total comprehensive income for the period ........................................ 133 221 162 471 364
Total comprehensive income for the period attributable to:– shareholder ...................................................................................... 130 218 160 463 356– non-controlling interests ................................................................ 3 3 2 8 8
133 221 162 471 364
1 Other comprehensive income/(loss) items that can be reclassified into income.2 Other comprehensive income/(loss) items that cannot be reclassified into income.
The accompanying notes and the ‘Risk Management’ and ‘Capital’ sections within Management’s Discussion and Analysis form an integral part ofthese financial statements.
E02025883 HSBC Canada Q3 Inside Pages Nov14.indd 26 04/11/2014 23:20

25
Consolidated balance sheet30 September
201430 September
201331 December
2013Notes $m $m $m
ASSETS
Cash and balances at central bank ................................................................................ 59 59 165Items in the course of collection from other banks ...................................................... 89 122 107Trading assets .............................................................................................................. 4 7,707 7,446 6,728Derivatives .................................................................................................................. 5 2,953 1,616 2,112Loans and advances to banks ....................................................................................... 603 564 1,149Loans and advances to customers ................................................................................ 41,534 41,102 40,524Reverse repurchase agreements – non-trading.............................................................. 9 5,979 7,637 6,161Financial investments .................................................................................................. 6 19,786 21,178 21,814Other assets ................................................................................................................. 372 434 332Prepayments and accrued income................................................................................. 223 227 206Customers’ liability under acceptances......................................................................... 5,222 5,007 4,757Property, plant and equipment ...................................................................................... 126 133 137Goodwill and intangible assets 63 69 68
Total assets .................................................................................................................. 84,716 85,594 84,260
LIABILITIES AND EQUITY
LiabilitiesDeposits by banks ........................................................................................................ 808 1,277 635Customer accounts ....................................................................................................... 49,698 47,688 50,926Repurchase agreements – non-trading .......................................................................... 9 2,272 4,214 1,487Items in the course of transmission to other banks ....................................................... 69 86 53Trading liabilities.......................................................................................................... 7 3,912 4,420 4,396Financial liabilities designated at fair value ................................................................. 8 426 427 428Derivatives .................................................................................................................. 5 2,770 1,306 1,746Debt securities in issue ................................................................................................ 11,292 12,387 11,348Other liabilities ............................................................................................................ 2,126 2,251 2,338Acceptances.................................................................................................................. 5,222 5,007 4,757Accruals and deferred income ...................................................................................... 534 529 551Retirement benefit liabilities......................................................................................... 312 258 271Subordinated liabilities ................................................................................................. 239 327 239
Total liabilities ............................................................................................................. 79,680 80,177 79,175
EquityCommon shares ........................................................................................................... 1,225 1,225 1,225Preferred shares ............................................................................................................ 350 946 600Other reserves............................................................................................................... 113 113 134Retained earnings ........................................................................................................ 3,148 2,903 2,926
Total shareholder’s equity ........................................................................................... 4,836 5,187 4,885Non-controlling interests ............................................................................................. 200 230 200
Total equity ................................................................................................................. 5,036 5,417 5,085
Total equity and liabilities ........................................................................................... 84,716 85,594 84,260
The accompanying notes and the ‘Risk Management’ and ‘Capital’ sections within Management’s Discussion and Analysis form an integral part ofthese financial statements.
E02025883 HSBC Canada Q3 Inside Pages Nov14.indd 27 04/11/2014 23:20

H S B C B A N K C A N A D A
Financial Statements (unaudited) (continued)
26
Consolidated statement of cash flows
Quarter ended Nine months ended30 September
201430 September
201330 June
201430 September
201430 September
2013Notes $m $m $m $m $m
Cash flows from operating activitiesProfit before tax ............................................................................ 231 251 242 706 702
Adjustments for:– non-cash items included in profit before tax .............................. 10 35 25 48 130 197– change in operating assets .......................................................... 10 (560) (1,608) (1,088) (2,420) (1,145)– change in operating liabilities .................................................... 10 302 1,451 858 (118) 3,171– tax paid ...................................................................................... (17) (37) (75) (163) (170)
Net cash from/(used in) operating activities ................................ (9) 82 (15) (1,865) 2,755
Cash flows from investing activitiesPurchase of financial investments ................................................. (2,527) (5,114) (3,974) (9,792) (13,878)Proceeds from the sale and maturity of financial investments ...... 2,505 3,778 3,776 11,828 13,020Net cash flows from the sale of held for sale assets - 371 - - 371Purchase of property, plant and equipment ................................... (2) (11) (13) (23) (30)Purchase of intangibles ................................................................ (1) - (1) (5) -
Net cash (used in)/from investing activities ................................ (25) (976) (212) 2,008 (517)
Cash flows from financing activitiesDividends paid to shareholders ..................................................... (85) (105) (88) (262) (315)Distributions to non-controlling interests....................................... (3) (3) (2) (8) (8)Redemption of preferred shares ..................................................... - - (250) (250) -
Net cash used in financing activities ............................................. (88) (108) (340) (520) (323)
Net (decrease)/increase in cash and cash equivalents................ (122) (1,002) (567) (377) 1,915
Cash and cash equivalents at the beginning of the period .............. 1,641 4,670 2,208 1,896 1,753
Cash and cash equivalents at the end of the period ........................ 10 1,519 3,668 1,641 1,519 3,668
The accompanying notes and the ‘Risk Management’ and ‘Capital’ sections within Management’s Discussion and Analysis form an integral part ofthese financial statements.
E02025883 HSBC Canada Q3 Inside Pages Nov14.indd 28 04/11/2014 23:20

27
Consolidated statement of changes in equity for the nine months ended 30 September 2014
Other reserves
Sharecapital
Retainedearnings
Available-for-sale
fair valuereserve
Cashflow
hedgingreserve
Totalother
reserves
Totalshareholder's
equity
Non-controlling
interestsTotal
equity$m $m $m $m $m $m $m $m
At 1 January................................................................1,825 2,926 35 99 134 4,885 200 5,085Profit for the period ............................................................- 516 - - - 516 8 524
Other comprehensive income (net of tax) ..........................- (32) 8 (29) (21) (53) - (53)Available-for-sale investments ................................ - - 8 - 8 8 - 8Cash flow hedges ...............................................................- - - (29) (29) (29) - (29)Actuarial losses on defined benefit plans ...........................- (32) - - - (32) - (32)
Total comprehensive income for theperiod ................................................................ - 484 8 (29) (21) 463 8 471
Redemption on preferred shares................................(250) - - - - (250) - (250)Dividends paid on common shares................................- (240) - - - (240) - (240)Dividends paid on preferred shares ................................- (22) - - - (22) - (22)Distributions to unit holders................................ - - - - - - (8) (8)
At 30 September ................................................................1,575 3,148 43 70 113 4,836 200 5,036
Consolidated statement of changes in equity for the nine months ended 30 September 2013
Other reserves
Sharecapital
Retainedearnings
Available-for-sale
fair valuereserve
Cashflow
hedgingreserve
Totalother
reserves
Totalshareholder’s
equity
Non-controlling
interestsTotal
equity$m $m $m $m $m $m $m $m
At 1 January................................................................2,171 2,694 121 160 281 5,146 230 5,376Profit for the period ............................................................- 497 - - - 497 8 505
Other comprehensive income (net of tax) ..........................- 27 (91) (77) (168) (141) - (141)Available-for-sale investments ................................ - - (91) - (91) (91) - (91)Cash flow hedges ...............................................................- - - (77) (77) (77) - (77)Actuarial losses on defined benefit plans ...........................- 27 - - - 27 - 27
Total comprehensive income for theperiod ................................................................
-524 (91) (77) (168) 356 8 364
Dividends paid on common shares................................- (270) - - - (270) - (270)Dividends paid on preferred shares ................................- (45) - - - (45) - (45)Distributions to unit holders................................ - - - - - - (8) (8)
At 30 September ................................................................2,171 2,903 30 83 113 5,187 230 5,417
The accompanying notes and the ‘Risk Management’ and ‘Capital’ sections within Management’s Discussion and Analysis form an integral part ofthese financial statements.
E02025883 HSBC Canada Q3 Inside Pages Nov14.indd 29 04/11/2014 23:20

H S B C B A N K C A N A D A
Notes on the Financial Statements (unaudited)
28
Note1 Basis of preparation............................................ 282 Summary of significant accounting policies....... 303 Post-employment benefits ................................. 304 Trading assets..................................................... 315 Derivatives ......................................................... 316 Financial investments ......................................... 337 Trading liabilities ............................................... 338 Financial liabilities designated at fair value ...... 33
Note9 Non-trading reverse repurchase and repurchase
agreements .................................................... 3410 Notes on the statement of cash flows.................. 3511 Contingent liabilities, contractual commitments
and guarantees ............................................... 3612 Segment analysis ................................................ 3613 Related party transactions................................... 3914 Fair values of financial instruments..................... 4015 Events after the reporting period ........................ 42
1 Basis of preparation
a Compliance with International Financial Reporting Standards
HSBC Bank Canada (‘the bank’, ‘we’, ‘our’) is an indirectly wholly-owned subsidiary of HSBC Holdings plc(‘HSBC Holdings’). Throughout these interim unaudited consolidated financial statements (‘financial statements’)the HSBC Holdings Group is defined as the ‘HSBC Group’ or the ‘Group’. These financial statements should beread in conjunction with the bank’s 2013 annual consolidated financial statements, which are both prepared inaccordance with International Financial Reporting Standards (‘IFRS’) as issued by the International AccountingStandards Board (‘IASB’) and Section 308 (4) of the Bank Act.
The financial statements are prepared in accordance with International Accounting Standard (‘IAS’) 34 ‘InterimFinancial Reporting’.
b Presentation of information
The financial statements are presented in Canadian dollars which is also the bank’s functional currency. Theabbreviation ‘$m’ represents millions of dollars. All tabular amounts are in millions of dollars except whereotherwise noted. Certain prior period amounts have been restated to conform with the current period presentation.
From 1 January 2014, HSBC has chosen to present non-trading reverse repurchase and repurchase agreementsseparately on the face of the balance sheet. Previously they were presented on an aggregate basis together within‘Loans and advances to banks’, ‘Loans and advances to customers’, ‘Deposits by banks’, and ‘Customer accounts’.The separate presentation aligns disclosure of reverse repurchase and repurchase agreements with market practiceand provides more meaningful information in relation to loans and advances. Further explanation is provided in Note9 on the financial statements. Comparative periods have been presented accordingly. There is no other effect of thischange in presentation.
For the third quarter of 2014, HSBC has decided to present an intersegment category on the statement of financialposition in Note 12 Segment Analysis. Previously the bank has presented the assets and liabilities on a net basis fortransactions between global lines of business. To enhance the segment disclosure, we have chosen to present assetsand liabilities on a gross basis to reflect the dedicated balances of each global line of business. Comparative periodshave been presented accordingly. There is no other effect of this change in presentation.
c Use of estimates and assumptions
The preparation of financial information requires the use of estimates and assumptions about future conditions. Theuse of available information and the application of judgment are inherent in the formation of estimates. Actualresults in the future may differ from estimates upon which financial information is prepared. Management believesthat the bank’s critical accounting policies where judgment is necessarily applied are those which relate toimpairment of loans and advances, and the valuation of financial instruments as described in Note 2 on theconsolidated financial statements of the bank’s Annual Report and Accounts 2013.
E02025883 HSBC Canada Q3 Inside Pages Nov14.indd 30 04/11/2014 23:20
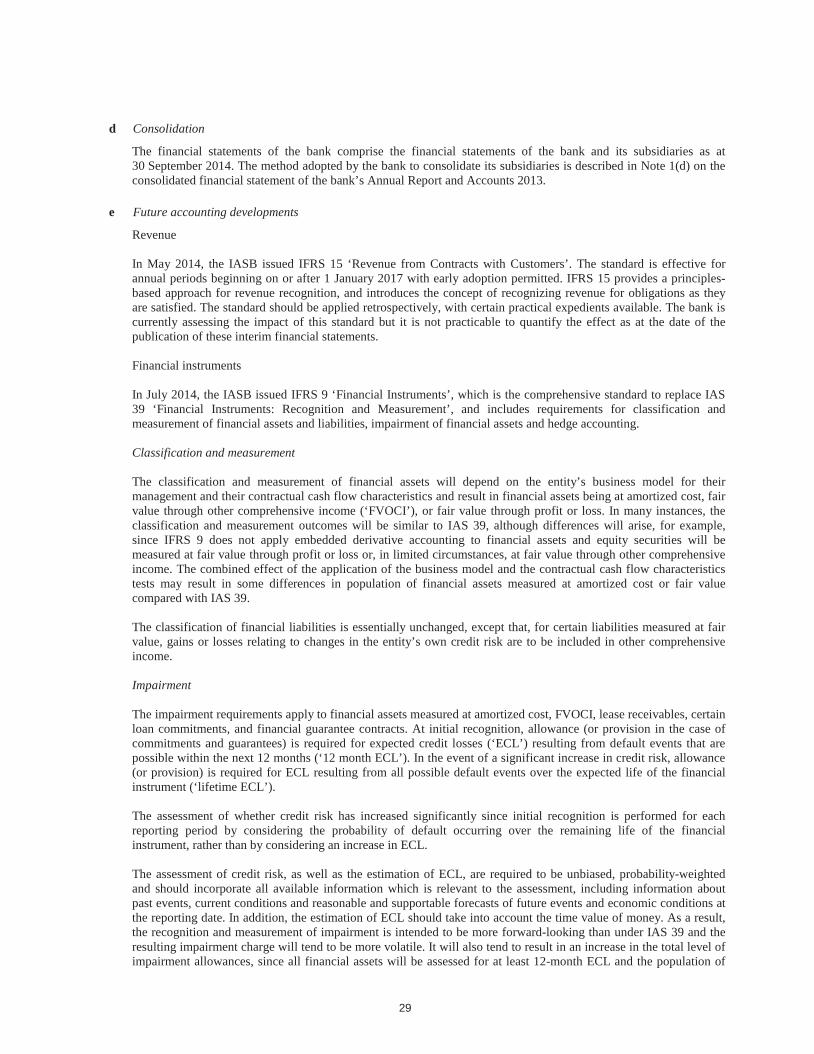
29
d Consolidation
The financial statements of the bank comprise the financial statements of the bank and its subsidiaries as at30 September 2014. The method adopted by the bank to consolidate its subsidiaries is described in Note 1(d) on theconsolidated financial statement of the bank’s Annual Report and Accounts 2013.
e Future accounting developments
Revenue
In May 2014, the IASB issued IFRS 15 ‘Revenue from Contracts with Customers’. The standard is effective forannual periods beginning on or after 1 January 2017 with early adoption permitted. IFRS 15 provides a principles-based approach for revenue recognition, and introduces the concept of recognizing revenue for obligations as theyare satisfied. The standard should be applied retrospectively, with certain practical expedients available. The bank iscurrently assessing the impact of this standard but it is not practicable to quantify the effect as at the date of thepublication of these interim financial statements.
Financial instruments
In July 2014, the IASB issued IFRS 9 ‘Financial Instruments’, which is the comprehensive standard to replace IAS39 ‘Financial Instruments: Recognition and Measurement’, and includes requirements for classification andmeasurement of financial assets and liabilities, impairment of financial assets and hedge accounting.
Classification and measurement
The classification and measurement of financial assets will depend on the entity’s business model for theirmanagement and their contractual cash flow characteristics and result in financial assets being at amortized cost, fairvalue through other comprehensive income (‘FVOCI’), or fair value through profit or loss. In many instances, theclassification and measurement outcomes will be similar to IAS 39, although differences will arise, for example,since IFRS 9 does not apply embedded derivative accounting to financial assets and equity securities will bemeasured at fair value through profit or loss or, in limited circumstances, at fair value through other comprehensiveincome. The combined effect of the application of the business model and the contractual cash flow characteristicstests may result in some differences in population of financial assets measured at amortized cost or fair valuecompared with IAS 39.
The classification of financial liabilities is essentially unchanged, except that, for certain liabilities measured at fairvalue, gains or losses relating to changes in the entity’s own credit risk are to be included in other comprehensiveincome.
Impairment
The impairment requirements apply to financial assets measured at amortized cost, FVOCI, lease receivables, certainloan commitments, and financial guarantee contracts. At initial recognition, allowance (or provision in the case ofcommitments and guarantees) is required for expected credit losses (‘ECL’) resulting from default events that arepossible within the next 12 months (‘12 month ECL’). In the event of a significant increase in credit risk, allowance(or provision) is required for ECL resulting from all possible default events over the expected life of the financialinstrument (‘lifetime ECL’).
The assessment of whether credit risk has increased significantly since initial recognition is performed for eachreporting period by considering the probability of default occurring over the remaining life of the financialinstrument, rather than by considering an increase in ECL.
The assessment of credit risk, as well as the estimation of ECL, are required to be unbiased, probability-weightedand should incorporate all available information which is relevant to the assessment, including information aboutpast events, current conditions and reasonable and supportable forecasts of future events and economic conditions atthe reporting date. In addition, the estimation of ECL should take into account the time value of money. As a result,the recognition and measurement of impairment is intended to be more forward-looking than under IAS 39 and theresulting impairment charge will tend to be more volatile. It will also tend to result in an increase in the total level ofimpairment allowances, since all financial assets will be assessed for at least 12-month ECL and the population of
E02025883 HSBC Canada Q3 Inside Pages Nov14.indd 31 04/11/2014 23:20
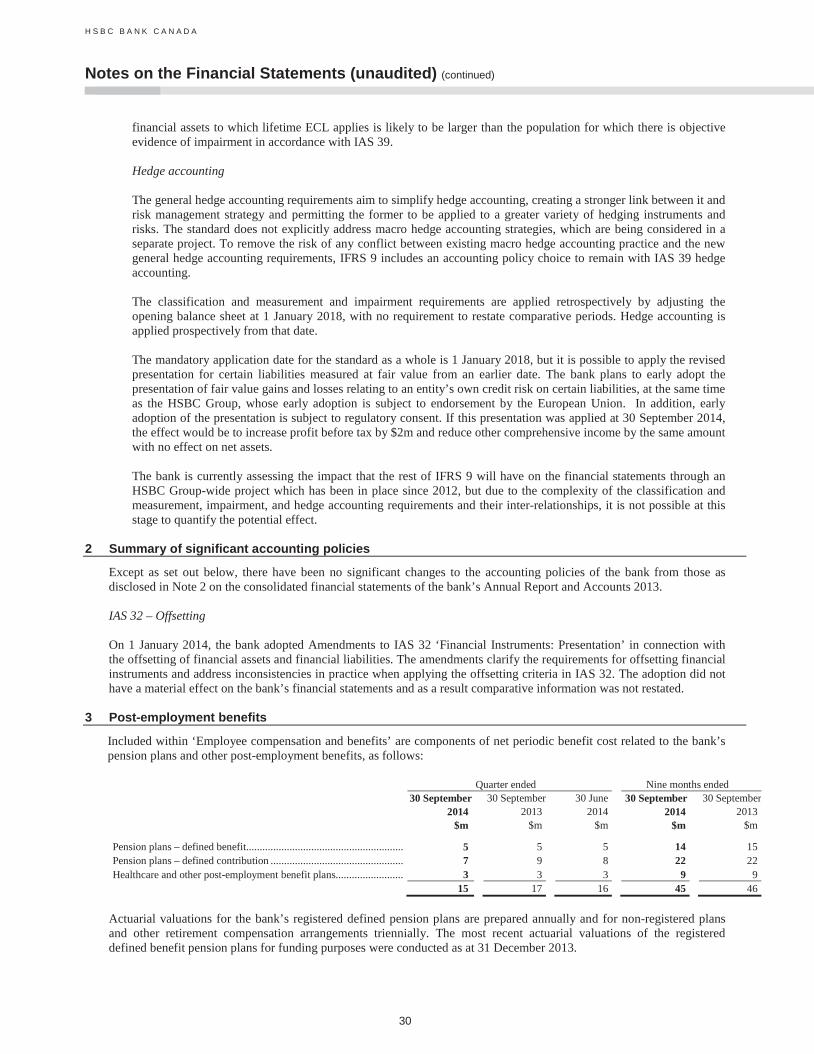
H S B C B A N K C A N A D A
Notes on the Financial Statements (unaudited) (continued)
30
financial assets to which lifetime ECL applies is likely to be larger than the population for which there is objectiveevidence of impairment in accordance with IAS 39.
Hedge accounting
The general hedge accounting requirements aim to simplify hedge accounting, creating a stronger link between it andrisk management strategy and permitting the former to be applied to a greater variety of hedging instruments andrisks. The standard does not explicitly address macro hedge accounting strategies, which are being considered in aseparate project. To remove the risk of any conflict between existing macro hedge accounting practice and the newgeneral hedge accounting requirements, IFRS 9 includes an accounting policy choice to remain with IAS 39 hedgeaccounting.
The classification and measurement and impairment requirements are applied retrospectively by adjusting theopening balance sheet at 1 January 2018, with no requirement to restate comparative periods. Hedge accounting isapplied prospectively from that date.
The mandatory application date for the standard as a whole is 1 January 2018, but it is possible to apply the revisedpresentation for certain liabilities measured at fair value from an earlier date. The bank plans to early adopt thepresentation of fair value gains and losses relating to an entity’s own credit risk on certain liabilities, at the same timeas the HSBC Group, whose early adoption is subject to endorsement by the European Union. In addition, earlyadoption of the presentation is subject to regulatory consent. If this presentation was applied at 30 September 2014,the effect would be to increase profit before tax by $2m and reduce other comprehensive income by the same amountwith no effect on net assets.
The bank is currently assessing the impact that the rest of IFRS 9 will have on the financial statements through anHSBC Group-wide project which has been in place since 2012, but due to the complexity of the classification andmeasurement, impairment, and hedge accounting requirements and their inter-relationships, it is not possible at thisstage to quantify the potential effect.
2 Summary of significant accounting policies
Except as set out below, there have been no significant changes to the accounting policies of the bank from those asdisclosed in Note 2 on the consolidated financial statements of the bank’s Annual Report and Accounts 2013.
IAS 32 – Offsetting
On 1 January 2014, the bank adopted Amendments to IAS 32 ‘Financial Instruments: Presentation’ in connection withthe offsetting of financial assets and financial liabilities. The amendments clarify the requirements for offsetting financialinstruments and address inconsistencies in practice when applying the offsetting criteria in IAS 32. The adoption did nothave a material effect on the bank’s financial statements and as a result comparative information was not restated.
3 Post-employment benefits
Included within ‘Employee compensation and benefits’ are components of net periodic benefit cost related to the bank’spension plans and other post-employment benefits, as follows:
Quarter ended Nine months ended30 September 30 September 30 June 30 September 30 September
2014 2013 2014 2014 2013$m $m $m $m $m
Pension plans – defined benefit.......................................................... 5 5 5 14 15Pension plans – defined contribution ................................................. 7 9 8 22 22Healthcare and other post-employment benefit plans......................... 3 3 3 9 9
15 17 16 45 46
Actuarial valuations for the bank’s registered defined pension plans are prepared annually and for non-registered plansand other retirement compensation arrangements triennially. The most recent actuarial valuations of the registereddefined benefit pension plans for funding purposes were conducted as at 31 December 2013.
E02025883 HSBC Canada Q3 Inside Pages Nov14.indd 32 04/11/2014 23:20

31
4 Trading assets
At 30 September2014
At 30 September2013
At 31 December2013
$m $m $m
Trading assets:- Not subject to repledge or resale by counterparties ................................................. 7,224 6,196 6,294- Which may be repledged or resold by counterparties .............................................. 483 1,250 434
7,707 7,446 6,728
Canadian and provincial government bonds1 ................................................................ 1,802 2,872 2,086Debt securities ............................................................................................................. 743 513 442Total debt securities ..................................................................................................... 2,545 3,385 2,528
Bankers acceptances ..................................................................................................... 2,975 2,576 2,848Customer trading assets ................................................................................................ 1,580 1,058 876Treasury and other eligible bills.................................................................................... 529 422 467Trading assets from other banks ................................................................................... 54 - 9Equity securities ........................................................................................................... 24 5 -
7,707 7,446 6,728
1 Includes government guaranteed bonds.
5 Derivatives
For a detailed description of the type and use of derivatives by the bank, please refer to the bank’s accounting policiesdisclosed in Note 2 and Note 11 of the bank’s Annual Report and Accounts 2013.
Fair values of derivatives by product contract type held
At 30 September 2014Assets Liabilities
Trading Hedging Total Trading Hedging Total$m $m $m $m $m $m
Foreign exchange ............................. 2,022 278 2,300 2,036 106 2,142Interest rate ...................................... 508 122 630 457 148 605Commodity....................................... 23 - 23 23 - 23Gross total fair values ...................... 2,553 400 2,953 2,516 254 2,770
At 30 September 2013Assets Liabilities
Trading Hedging Total Trading Hedging Total$m $m $m $m $m $m
Foreign exchange ............................. 738 239 977 720 36 756Interest rate ...................................... 408 191 599 356 154 510Commodity ...................................... 40 - 40 40 - 40Gross total fair values ...................... 1,186 430 1,616 1,116 190 1,306
At 31 December 2013Assets Liabilities
Trading Hedging Total Trading Hedging Total$m $m $m $m $m $m
Foreign exchange ............................. 1,077 288 1,365 1,030 93 1,123Interest rate ...................................... 492 220 712 453 135 588Commodity ...................................... 35 - 35 35 - 35Gross total fair values ...................... 1,604 508 2,112 1,518 228 1,746
E02025883 HSBC Canada Q3 Inside Pages Nov14.indd 33 04/11/2014 23:20

H S B C B A N K C A N A D A
Notes on the Financial Statements (unaudited) (continued)
32
Trading derivatives
Notional contract amounts of derivatives held for trading purposes by product type
At 30 September2014
At 30 September2013
At 31 December2013
$m $m $m
Foreign exchange ………………………………………………………………… 128,608 75,059 87,334Interest rate ………………………………………………………………………. 57,327 33,069 37,745Commodity……………………………………………………………………….. 316 412 567
Total derivatives ………………………………………………………………….. 186,251 108,540 125,646
The notional or contractual amounts of these instruments indicate the nominal value of transactions outstanding at thereporting date; they do not represent amounts at risk.
Hedging instruments
Notional contract amounts of derivatives held for hedging purposes by product type
At 30 September 2014 At 30 September 2013 At 31 December 2013Cash flow
hedgeFair value
hedgeCash flow
hedgeFair value
hedgeCash flow
hedgeFair value
hedge
$m $m $m $m $m $m
Interest rate ........................... 20,487 12,182 20,854 7,089 17,477 9,035Foreign exchange.................. 3,317 - 2,794 - 3,116 -
Total derivatives ................... 23,804 12,182 23,648 7,089 20,593 9,035
Fair value of derivatives designated as fair value hedges
At 30 September 2014 At 30 September 2013 At 31 December 2013Assets
$mLiabilities
$mAssets
$mLiabilities
$mAssets
$mLiabilities
$m
Interest rate .............................................................. 23 94 33 71 60 69
Gains or losses arising from the change in fair value of fair value hedges
Quarter ended Nine months ended
30 September 30 September 30 June 30 September 30 September2014 2013 2014 2014 2013
$m $m $m $m $m
Gains/(losses)On hedging instruments ........................................................ 9 (11) (50) (79) 49On hedged items attributable to the hedged risk .................... (10) 11 50 77 (50)
The gains and losses on ineffective portions of fair value hedges are recognized immediately in ‘Net trading income’.
Fair value of derivatives designated as cash flow hedges
At 30 September 2014 At 30 September 2013 At 31 December 2013Assets
$mLiabilities
$mAssets
$mLiabilities
$mAssets
$mLiabilities
$m
Foreign exchange............................................................................ 278 106 239 36 288 93Interest rate .................................................................................... 99 54 158 83 160 66
E02025883 HSBC Canada Q3 Inside Pages Nov14.indd 34 04/11/2014 23:21

33
6 Financial investments
At 30 September2014
At 30 September2013
At 31 December2013
$m $m $m
Financial investments- Not subject to repledge or resale by counterparties ..................................................... 18,234 18,919 20,468- Which may be subject to repledge or resale by counterparties .................................... 1,552 2,259 1,346
19,786 21,178 21,814
Available-for-saleCanadian and Provincial Government bonds1............................................................. 14,610 15,423 16,534International Government bonds1 .............................................................................. 2,700 2,766 3,248Debt securities issued by banks and other financial institutions ................................. 1,900 1,267 1,224Treasury bills and other eligible bills.......................................................................... 572 1,722 799Other securities .......................................................................................................... 4 - 9
19,786 21,178 21,8141 Includes government guaranteed bonds
7 Trading liabilities
8 Financial liabilities designated at fair value
The carrying amount at 30 September 2014 of financial liabilities designated at fair value was $26m higher(30 September 2013: $27m higher; 31 December 2013: $28m higher) than the contractual amount at maturity. At30 September 2014, the cumulative amount of change in fair value attributable to changes in credit risk was a $2m gain(30 September 2013: $4m gain; 31 December 2013: $2m gain).
At 30 September2014
At 30 September2013
At 31 December2013
$m $m $m
Other liabilities – net short positions ............................................................................ 3,343 2,527 3,617Customer trading liabilities ........................................................................................... 462 1,517 442Trading liabilities due to other banks ............................................................................ 89 343 300Other debt securities in issue ........................................................................................ 18 33 37
3,912 4,420 4,396
At 30 September2014
At 30 September2013
At 31 December2013
$m $m $m
Subordinated debentures ............................................................................................... 426 427 428
E02025883 HSBC Canada Q3 Inside Pages Nov14.indd 35 04/11/2014 23:21

H S B C B A N K C A N A D A
Notes on the Financial Statements (unaudited) (continued)
34
9 Non-trading reverse repurchase and repurchase agreements
Non-trading reverse repurchase agreements and repurchase agreements which are measured at amortised cost, arepresented as separate lines in the balance sheet. This separate presentation has been adopted effective 1 January 2014 andcomparatives restated accordingly. Previously, non-trading reverse repurchase agreements were included within ‘Loansand advances to banks’ and ‘Loans and advances to customers’ and non-trading repurchase agreements were includedwithin ‘Deposits by banks’ and ‘Customer accounts’. The extent to which reverse repos and repos represents loansto/from customers and banks is set out below.
At 30 September2014
At 30 September2013
At 31 December2013
$m $m $m
AssetsBanks .............................................................................................................................. 524 2,016 333Customers ....................................................................................................................... 5,455 5,620 5,828Reverse repurchase agreements - non-trading ................................................................. 5,979 7,636 6,161
LiabilitiesBanks .............................................................................................................................. 553 675 569Customers ....................................................................................................................... 1,719 3,539 918Repurchase agreements - non-trading ............................................................................. 2,272 4,214 1,487
E02025883 HSBC Canada Q3 Inside Pages Nov14.indd 36 04/11/2014 23:21

35
10 Notes on the statement of cash flows
Quarter ended Nine months ended30 September
201430 September
201330 June
201430 September
201430 September
2013$m $m $m $m $m
Non-cash items included in profit before tax
Depreciation and amortization .................................................... 11 8 13 37 25Share based payment expense ..................................................... 2 3 3 8 8Loan impairment charges and other credit risk provisions .......... 17 9 27 70 149Charge for defined benefit pension plans .................................... 5 5 5 15 15
35 25 48 130 197
Change in operating assets
Change in prepayment and accrued income ................................ (34) (9) 24 (17) (62)Change in net trading securities and net derivatives.................... (665) 320 (2,438) (1,191) 378Change in loans and advances to customers................................ (2) 45 (368) (1,080) 1,206Change in reverse repurchase agreements - non-trading ............. (269) (1,830) 1,752 373 (2,505)Change in other assets................................................................. 410 (134) (58) (505) (162)
(560) (1,608) (1,088) (2,420) (1,145)
Change in operating liabilities
Change in accruals and deferred income..................................... 35 42 (17) (17) 1Change in deposits by banks ....................................................... (104) 549 267 173 121Change in customer accounts...................................................... 369 (107) (127) (1,228) 1,395Change in repurchase agreements - non-trading.......................... 26 1,653 209 785 1,186Change in debt securities in issue................................................ 463 (853) 509 (56) 407Change in financial liabilities designated at fair value ................ (3) (1) (1) (2) (9)Change in other liabilities ........................................................... (484) 168 18 227 70
302 1,451 858 (118) 3,171
Interest
Interest paid ............................................................................... 174 175 212 547 524Interest received ......................................................................... 468 498 512 1,459 1,508
At 30 September2014
At 30 September2013
At 30 June2014
$m $m $m
Cash and cash equivalents
Cash and balances at central bank........................................................................................ 59 59 66Items in the course of transmission to other banks, net ........................................................ 20 36 (132)Loans and advances to banks of one month or less .............................................................. 603 564 438Reserve repurchase agreements with banks of one month or less ........................................ 524 2,017 992T-Bills and certificates of deposits - three months or less .................................................... 313 992 277
1,519 3,668 1,641
E02025883 HSBC Canada Q3 Inside Pages Nov14.indd 37 04/11/2014 23:21

H S B C B A N K C A N A D A
Notes on the Financial Statements (unaudited) (continued)
36
11 Contingent liabilities, contractual commitments and guarantees
At 30 September2014
At 30 September2013
At 31 December2013
$m $m $m
Guarantees and other contingent liabilitiesGuarantees and irrevocable letters of credit pledged as collateral security .................... 4,910 3,590 3,940
CommitmentsUndrawn formal standby facilities, credit lines and other commitments to lend1............ 36,651 33,541 34,588Documentary credits and short-term trade-related transaction........................................ 551 502 540
37,202 34,043 35,128
1 Based on original contractual maturity.
Legal and regulatory proceedings
We are subject to a number of legal proceedings arising in the normal course of our business. We do not expect theoutcome of any of these proceedings, in aggregate, to have a material effect on our consolidated balance sheet or ourresults of operations.
12 Segment analysis
We manage and report our operations according to our main global lines of business. Information on each business line isincluded in the Management’s Discussion and Analysis and the Annual Report and Accounts 2013. Various estimate andallocation methodologies are used in the preparation of the global lines of business’ financial information. We allocateexpenses directly related to earning revenues to the groups that earned the related revenue. Expenses not directly relatedto earning revenue, such as overhead expenses, are allocated to global lines of business using appropriate allocationformulas. Global lines of business net interest income reflects internal funding charges and credits on the global lines ofbusiness’ assets, liabilities and capital, at market rates, taking into account relevant terms and currency considerations.The offset of the net impact of these charges and credits is reflected in Global Banking and Markets.
Quarter ended Nine months ended30 September 30 September 30 June 30 September 30 September
2014 2013 2014 2014 2013$m $m $m $m $m
Commercial BankingNet interest income ............................................................ 164 169 165 497 502Net fee income ................................................................ 79 78 81 239 235Net trading income ............................................................. 6 7 7 19 22Gain less losses from financial investments ....................... - - 16 16 -Other operating income/(expense) ................................ 5 (5) 3 14 (37)Total operating income ....................................................... 254 249 272 785 722Loan impairment (charges)/releases and other
credit risk provisions ..................................................... (11) 5 (18) (41) (95)Net operating income ......................................................... 243 254 254 744 627Total operating expenses .................................................... (100) (96) (104) (305) (278)Operating profit ................................................................ 143 158 150 439 349Share of profit in associates ............................................... - 9 6 9 14
Profit before income tax expense ................................ 143 167 156 448 363
E02025883 HSBC Canada Q3 Inside Pages Nov14.indd 38 04/11/2014 23:21

37
Quarter ended Nine months ended30 September 30 September 30 June 30 September 30 September
2014 2013 2014 2014 2013$m $m $m $m $m
Global Banking and MarketsNet interest income .................................................... 45 37 46 135 119Net fee income........................................................... 26 22 22 72 60Net trading income .................................................... 16 24 15 52 86Gain less losses from financial investments............... 7 2 11 37 48Other operating income.............................................. - - 1 1 -Total operating income .............................................. 94 85 95 297 313Loan impairment charges and other credit risk
provisions .............................................................. - (1) (2) (3) (1)Net operating income................................................. 94 84 93 294 312Total operating expenses............................................ (30) (28) (29) (89) (86)
Profit before income tax expense .............................. 64 56 64 205 226
Retail Banking and Wealth ManagementNet interest income .................................................... 105 120 104 311 395Net fee income........................................................... 56 52 57 165 157Net trading income .................................................... 4 4 3 12 15Gains less losses from financial investment - - - - 4Other operating income.............................................. 3 4 2 7 11Total operating income .............................................. 168 180 166 495 582Loan impairment charges and other credit risk
provisions .............................................................. (6) (13) (7) (26) (53)Net operating income................................................. 162 167 159 469 529Total operating expenses............................................ (131) (137) (135) (399) (408)Profit before income tax expense............................... 31 30 24 70 121
OtherNet interest expense ................................................... (11) (7) (8) (26) (21)Net trading income .................................................... 9 7 8 24 21Net expense from financial instruments designated at
fair value ............................................................... (1) - (1) (4) (3)Other operating income.............................................. 7 8 7 20 23Net operating income................................................. 4 8 6 14 20Total operating expenses............................................ (11) (10) (8) (31) (28)
Loss before income tax expense ............................... (7) (2) (2) (17) (8)
E02025883 HSBC Canada Q3 Inside Pages Nov14.indd 39 04/11/2014 23:21

H S B C B A N K C A N A D A
Notes on the Financial Statements (unaudited) (continued)
38
Other information about the profit/(loss) for the quarter
CommercialBanking
GlobalBanking and
Markets
RetailBanking and
WealthManagement Other Total
$m $m $m $m $m
Quarter ended 30 September 2014Net operating income: 243 94 162 4 503
External ................................................................232 80 187 4 503Inter-segment ................................................................11 14 (25) - -
Quarter ended 30 September 2013Net operating income: 254 84 167 8 513
External ................................................................251 64 190 8 513Inter-segment ................................................................3 20 (23) - -
Quarter ended 30 June 2014Net operating income: 254 93 159 6 512
External ................................................................245 76 185 6 512Inter-segment ................................................................9 17 (26) - -
Nine months ended 30 September 2014Net operating income: 744 294 469 14 1,521
External ................................................................711 254 542 14 1,521Inter-segment ................................................................33 40 (73) - -
Nine months ended 30 September 2013Net operating income: 627 312 529 20 1,488
External ................................................................618 241 609 20 1,488Inter-segment ................................................................9 71 (80) - -
E02025883 HSBC Canada Q3 Inside Pages Nov14.indd 40 04/11/2014 23:21

39
Statement of financial position information
CommercialGlobal
Banking and
RetailBanking and
WealthBanking Markets Management Other Intersegment Total
$m $m $m $m $m $m
At 30 September 2014Loans and advances to customers ………. 16,460 1,521 23,553 - - 41,534Customers’ liability under acceptances…. 4,291 931 - - - 5,222Total assets……………………………....... 28,774 38,698 26,811 423 (9,990) 84,716Customer accounts………………………... 21,209 4,967 23,522 - - 49,698Acceptances……………………………….. 4,291 931 - - - 5,222Total liabilities…………………………….. 25,924 37,361 25,962 423 (9,990) 79,680
At 30 September 2013Loans and advances to customers …………. 16,250 1,100 23,752 - - 41,102Customers’ liability under acceptances….… 4,162 845 - - - 5,007Total assets ………………………………... 27,886 39,781 25,935 405 (8,413) 85,594Customer accounts ………………………… 20,195 5,886 21,607 - - 47,688Acceptances ……………………………….. 4,162 845 - - - 5,007Total liabilities……………………………... 24,812 38,593 24,780 405 (8,413) 80,177
At 31 December 2013Loans and advances to customers.………… 15,881 1,203 23,440 - - 40,524Customers’ liability under acceptances……. 3,941 816 - - - 4,757Total assets ………………………………... 29,283 39,230 26,467 400 (11,120) 84,260Customer accounts ………………………… 21,986 6,185 22,755 - - 50,926Acceptances ……………………………….. 3,941 816 - - - 4,757Total liabilities …………………………….. 26,426 38,051 25,418 400 (11,120) 79,175
13 Related party transactions
The amounts detailed below include transactions between the bank and HSBC Holdings plc including other companies inthe HSBC Group. The transactions below were made in the ordinary course of business and on substantially the sameterms, including interest rates and security, as for comparable transactions with third party counterparties.
Transactions between the bank and HSBC Holdings including other companies in the HSBC Holdings Group
Quarter ended Nine months ended30 September 30 September 30 June 30 September 30 September
2014 2013 2014 2014 2013$m $m $m $m $m
Income StatementInterest income ................................................................ 11 15 11 34 45Interest expense ................................................................ (2) (18) (3) (7) (35)Fee income................................................................ 3 3 3 10 10Fee expense ................................................................ (1) (1) (1) (3) (5)Other operating income ...................................................... 11 11 11 32 35General and administrative expenses ................................ (29) (28) (28) (84) (77)
E02025883 HSBC Canada Q3 Inside Pages Nov14.indd 41 04/11/2014 23:21
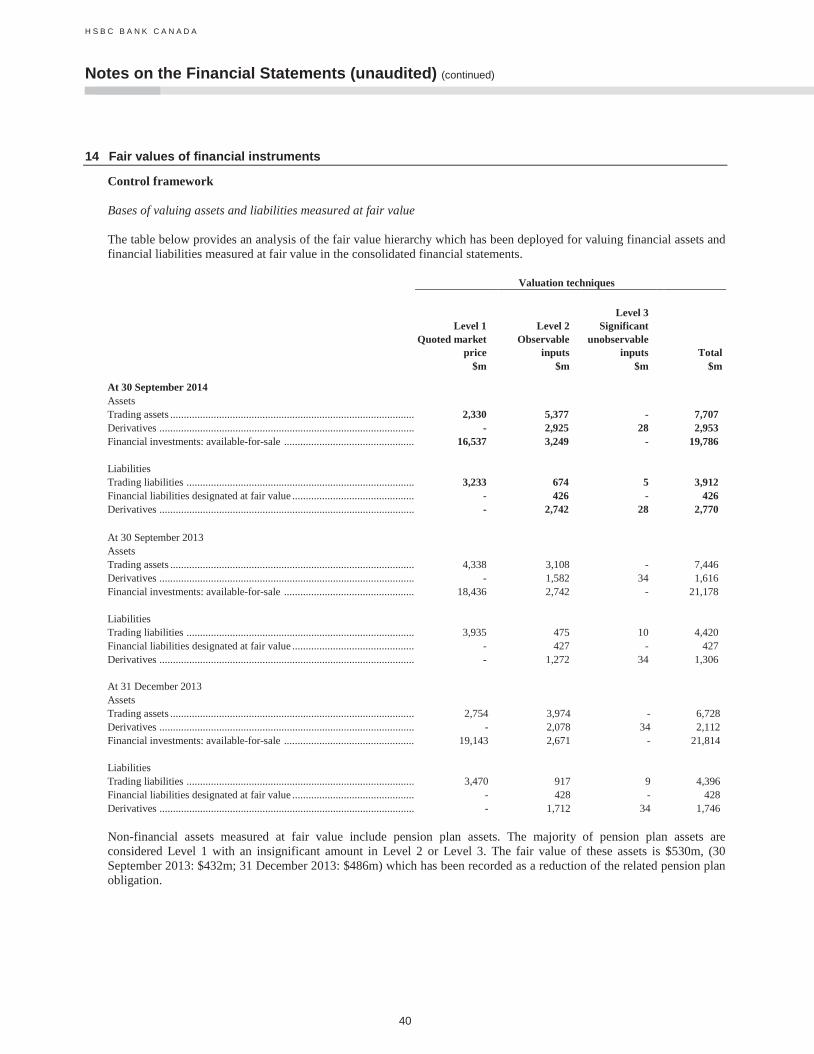
H S B C B A N K C A N A D A
Notes on the Financial Statements (unaudited) (continued)
40
14 Fair values of financial instruments
Control framework
Bases of valuing assets and liabilities measured at fair value
The table below provides an analysis of the fair value hierarchy which has been deployed for valuing financial assets andfinancial liabilities measured at fair value in the consolidated financial statements.
Valuation techniques
Level 1Quoted market
price
Level 2Observable
inputs
Level 3Significant
unobservableinputs Total
$m $m $m $m
At 30 September 2014AssetsTrading assets .......................................................................................... 2,330 5,377 - 7,707Derivatives .............................................................................................. - 2,925 28 2,953Financial investments: available-for-sale ................................................ 16,537 3,249 - 19,786
LiabilitiesTrading liabilities .................................................................................... 3,233 674 5 3,912Financial liabilities designated at fair value ............................................. - 426 - 426Derivatives .............................................................................................. - 2,742 28 2,770
At 30 September 2013AssetsTrading assets .......................................................................................... 4,338 3,108 - 7,446Derivatives .............................................................................................. - 1,582 34 1,616Financial investments: available-for-sale ................................................ 18,436 2,742 - 21,178
LiabilitiesTrading liabilities .................................................................................... 3,935 475 10 4,420Financial liabilities designated at fair value ............................................. - 427 - 427Derivatives .............................................................................................. - 1,272 34 1,306
At 31 December 2013AssetsTrading assets .......................................................................................... 2,754 3,974 - 6,728Derivatives .............................................................................................. - 2,078 34 2,112Financial investments: available-for-sale ................................................ 19,143 2,671 - 21,814
LiabilitiesTrading liabilities .................................................................................... 3,470 917 9 4,396Financial liabilities designated at fair value ............................................. - 428 - 428Derivatives .............................................................................................. - 1,712 34 1,746
Non-financial assets measured at fair value include pension plan assets. The majority of pension plan assets areconsidered Level 1 with an insignificant amount in Level 2 or Level 3. The fair value of these assets is $530m, (30September 2013: $432m; 31 December 2013: $486m) which has been recorded as a reduction of the related pension planobligation.
E02025883 HSBC Canada Q3 Inside Pages Nov14.indd 42 04/11/2014 23:21

41
Reconciliation of fair value measurements in Level 3 of the fair value hierarchy
Assets LiabilitiesAvailable-
for-sale DerivativesHeld
for trading Derivatives$m $m $m $m
At 1 January 2014........................................................................................ - 34 9 34
Total gains or losses recognized in profit or loss ........................................ - 4 - 4
Settlements .................................................................................................. - - (1) -Transfer out ................................................................................................ - (10) (3) (10)
At 30 September 2014................................................................................ - 28 5 28Total gains or losses recognized in profit or loss relating to those assets
and liabilities held at the end of the reporting period .............................. - 4 - 4
Available-for-sale Derivatives
Heldfor trading Derivatives
$m $m $m $m
At 1 January 2013........................................................................................ 9 5 49 7
Total gains or losses recognized in profit or loss ........................................ 1 33 1 31Issues .......................................................................................................... - - 15 -Settlements .................................................................................................. (9) - - -Transfer out ................................................................................................. - (4) (55) (4)Other............................................................................................................ (1) - - -
At 30 September 2013 ................................................................................. - 34 10 34Total gains or losses recognized in profit or loss relating to those assets
and liabilities held at the end of the reporting period .............................. - 32 - 32
During the third quarter in 2014 and 2013, there were no significant transfers between Level 1 and 2.
For a detailed description of fair value and the classification of financial instruments by the bank, please refer to thebank's accounting policies disclosed in Note 2 and Note 24 of the bank's Annual Report and Accounts 2013.
Fair values of financial instruments which are not carried at fair value on the balance sheet
At 30 September 2014 At 30 September 2013 At 31 December 2013
Carryingamount Fair value
Carryingamount Fair value
Carryingamount Fair value
$m $m $m $m $m $m
AssetsLoans and advances to banks .................. 603 603 564 564 1,149 1,149Loans and advances to customers ........... 41,534 41,621 41,102 41,102 40,524 40,592Reverse repurchase agreements .............. 5,979 5,979 7,637 7,637 6,161 6,161
LiabilitiesDeposits by banks ................................... 808 808 1,277 1,277 635 635Customer accounts.................................. 49,698 49,723 47,688 47,688 50,926 51,001Repurchase agreements........................... 2,272 2,272 4,214 4,214 1,487 1,487Debt securities in issue............................ 11,292 11,439 12,387 12,522 11,348 11,498Subordinated liabilities ........................... 239 237 327 304 239 236
Further discussion of the bank’s liquidity and funding management can be found in the audited sections of ‘Riskmanagement’ within Management’s Discussion and Analysis of the Annual Report and Accounts 2013.
E02025883 HSBC Canada Q3 Inside Pages Nov14.indd 43 04/11/2014 23:21

H S B C B A N K C A N A D A
Notes on the Financial Statements (unaudited) (continued)
42
15 Events after the reporting period
There have been no material events after the reporting period which would require disclosure or adjustment to the30 September 2014 financial statements.
These consolidated financial statements were approved by the Audit and Risk Committee on 29 October 2014 andauthorized for issue.
E02025883 HSBC Canada Q3 Inside Pages Nov14.indd 44 04/11/2014 23:21

H S B C B A N K C A N A D A
Shareholder Information
43
PRINCIPAL ADDRESSES:
Vancouver:HSBC Bank Canada885 West Georgia StreetVancouver, British ColumbiaCanada V6C 3E9Tel: (604) 685-1000Fax: (604) 641-3098
Toronto:HSBC Bank Canada70 York StreetToronto, OntarioCanada M5J 1S9Tel: (416) 868-8000Fax: (416) 868-3800
MEDIA ENQUIRIES:Sharon Wilks (416) 868-3878Aurora Bonin (604) 641-1905
WEBSITE:www.hsbc.ca
OTHER AVAILABLE INFORMATION:The bank’s continuous disclosure materials,including interim and annual filings, areavailable on the bank’s website and on theCanadian Securities Administrators’ web site atwww.sedar.com.
HSBC BANK CANADA SECURITIES ARELISTED ON THE TORONTO STOCKEXCHANGE:
HSBC Bank CanadaClass 1 Preferred Shares – Series C (HSB.PR.C)Class 1 Preferred Shares – Series D (HSB.PR.D)
SHAREHOLDER CONTACT:
For change of address, shareholders arerequested to write to the bank’s transfer agent,Computershare Investor Services Inc., at theirmailing address.
Other shareholder inquiries may be directed toShareholder Relations by writing to:
HSBC Bank CanadaShareholder Relations – Finance Department4th Floor2910 Virtual WayVancouver, British ColumbiaCanada V5M 0B2Email: [email protected]
Shareholder Relations:Chris Young (604) 642-4389Harry Krentz (604) 641-1013
TRANSFER AGENT AND REGISTRAR:
Computershare Investor Services Inc.Shareholder Service Department9th Floor, 100 University AvenueToronto, OntarioCanada M5J 2Y1
Tel: 1 (800) 564-6253
DIVIDENDS DATES:Dividend record and payable dates for thebank’s preferred shares, subject to approval bythe Board, are:
2014Record Date Payable Date15 December 31 December
2015Record Date Payable Date13 March 31 March15 June 30 June15 September 30 September
Distribution dates on our HSBC HaTS are 30June and 31 December.
E02025883 HSBC Canada Q3 Inside Pages Nov14.indd 45 04/11/2014 23:21

(This page intentionally left blank)
E02025883 HSBC Canada Q3 Inside Pages Nov14.indd 46 04/11/2014 23:21

© Copyright HSBC Bank Canada 2014
All rights reserved
No part of this publication may be reproduced, stored in aretrieval system, or transmitted, in any form or by anymeans, electronic, mechanical, photocopying, recording, orotherwise, without the prior written permission of HSBCBank Canada.
Published by HSBC Bank Canada, Vancouver, BC.
Printed by McCallum Printing Group Inc., Edmonton, AB.
E02025883 HSBC Canada Q3 Inside Pages Nov14.indd 04/11/2014 23:21

HSBC Bank Canada885 West Georgia Street Vancouver, BCCanada V6C 3E9 Telephone: (604) 685-1000 www.hsbc.ca
E02025883 HSBC Canada Interim Report Q3 Cover.indd 2 04/11/2014 20:25