HSBC Finance Corporation
15
Q3 2008 Results HSBC Finance Corporation IFRS Management Basis
-
Upload
quarterlyearningsreports2 -
Category
Economy & Finance
-
view
672 -
download
0
Transcript of HSBC Finance Corporation

Q3 2008 ResultsHSBC Finance Corporation IFRS Management Basis
2
This presentation, including the accompanying slides and subsequent discussion, contains certain forward-looking information with respect to the financial condition, results of operations and business of HSBC Holdings plc and HSBC Finance Corporation. This information represents expectations or beliefs concerning future events and is subject to unknown risks and uncertainties. This information speaks only as of the date on which it is provided. Additional detailed information concerning important factors that could cause actual results to differ materially is available in the HSBC Holdings plc Annual Report, and the HSBC Finance Corporation Annual Report on Form 10-K, each for the year ended 31 December 2007. Please further be advised that Regulation FD prohibits HSBC representatives from answering certain, specific questions during the Q&A session. You may get copies of the HSBC Finance Corporation document referred to above free by visiting EDGAR on the SEC Web site at www.sec.gov. These materials do not constitute an offer to sell, or the solicitation of an offer to buy, any security of HSBC Finance Corporation or any other issuer.HSBC Holdings plc reports financial results in accordance with International Financial Reporting Standards (“IFRSs”) as endorsed by the EU. EU endorsed IFRSs may differ temporarily from IFRSs, as published by the IASB, if a new or amended IFRS has not been endorsed by the EU by the period end. There were no unendorsed standards affecting this document. As at September 30, 2008, there is no difference between IFRSs as endorsed by the EU and IFRSs as issued by the IASB in terms of their application to HSBC.IFRSs comprise accounting standards issued by the International Accounting Standards Board and its predecessor body and interpretations issued by the International Financial Reporting Interpretations Committee and its predecessor body. All amounts, unless otherwise stated, represents IFRS Management Basis of accounting.IFRS Management Basis assumes that the mortgages and private label customer loans transferred to HSBC’s US banking subsidiary, HSBC Bank USA, N.A. (“HSBC Bank USA”), have not been sold and remain on our balance sheet. Such customer loans continue to be managed and serviced by HSBC Finance Corporation without regard to ownership. IFRS Management Basis also assumes that all purchase accounting fair value adjustments relating to the acquisition of HSBC Finance Corporation by HSBC Holdings plc have been “pushed down” to HSBC Finance Corporation. Certain reclassifications have been made to prior period amounts to conform to the current period presentation.
Disclosure statement

3
Key developments
• Continued focus on positioning businesses for the future – Consumer and Mortgage Lending (“CML”)
– A nation-wide rollout of the previously disclosed program to sell real estate secured customer loans to the Federal Home Loan Mortgage Corporation (“Freddie Mac”) was completed in the third quarter. The program leverages the real estate secured lending capability of the Consumer Lending (“CL”) business and collaboration with HSBC Bank USA, an affiliate.
– Integration of management of the CML businesses with HSBC Mortgage Corporation is in progress. A project is underway to establish a common servicing platform and loan system for all real estate secured loans and is targeted to be completed in 2010
– Card and Retail Services (“CRS”)– As part of our ongoing efforts to improve efficiency, we completed the closure of servicing facilities in Florida and Maryland during the third
quarter. Redeployed services to other facilities and continued other cost reduction initiatives.– Anticipate selling our $6.4 billion GM MasterCard (“GM’) customer loan portfolio to HSBC Bank USA in Q4 2008, subject to obtaining the
necessary regulatory approvals– Anticipate selling our $6.2 billion AFL-CIO Union Plus (“UP”) MasterCard/Visa portfolio to HSBC Bank USA to maximize funding synergies
(IFRS management basis results will assume the GM and UP assets remain on the balance sheet), subject to obtaining the necessary regulatory approvals
– Motor Vehicle Finance– Decision made in July 2008 to discontinue new motor vehicle loan originations from the dealer and direct-to-consumer channels. We will continue
to offer motor vehicle loans in our Consumer Lending branch offices until a third party provider is arranged. – Decision made in September 2008 to sell approximately $3 billion of motor vehicle finance loans to HSBC Bank USA to maximize funding
synergies, subject to obtaining regulatory approval (IFRS management basis results will assume these assets remain on the balance sheet)– Canadian Business
– Sold the motor vehicle finance portfolio to a third party in July 2008 following decision to exit this business– Sale of the Canadian business to HSBC Bank Canada, is expected to close in the fourth quarter. As a result, the Canadian business results and those
of the U.K. business which was sold to an affiliate in Q2 2008, are now presented as discontinued operations.– Taxpayer Financial Services
– De-risking and simplification initiatives will continue for the remainder of 2008 and impact 2009 and beyond– All relationships have been exited, except H&R Block
– Insurance Services– Continued strong customer acceptance and performance from the Card and Retail Services debt cancellation product

4
Key developments, continued
• Delinquency dollars and ratios continued to increase on a continuing operations basis across all products as a result of the continued weakening in the U.S. economy including significantly higher unemployment rates, increased levels of personal bankruptcy filings, a continued decline in house prices in certain markets, reduced refinance opportunities and the elimination of the favorable customer payment experience associated with the federal consumer stimulus package– Delinquency dollar increases largely attributable to CL first lien real estate secured loans– Gross delinquency dollars in the Mortgage Services (“MS”) portfolio have been stable over the last four quarters– Increases in delinquency across all products may have been partially offset by improvements in our domestic collection activities as a result of increased
collection capacity
• Continued focus on managing risks and reducing capital and liquidity requirements– Closely monitoring the economic situation. We are prepared to implement additional risk mitigation actions such as further credit tightening and
elevated collection capacity and intensity if unemployment continues to rise and/or the housing contagion continues to worsen.– Continued execution of the Private Label “Up or Out” merchant review initiative which is expected to generate an annual increase in revenues of up to
$120 million – Reduced the size of the overall customer loans and advances portfolio
– Originations in the CL business decreased approximately 26 percent from Q2 2008 and have decreased approximately 78 percent from Q3 2007 as a result of the reduced CL branch network, tightened underwriting standards and decreased consumer demand.
– Continued liquidation of the MS portfolio, down approximately 8 percent from Q2 2008 to $29 billion– CML sold $1.1 billion of real estate secured customer loans to third parties ($0.5 billion MS related) during Q3 2008– CRS reduced open-to-buy $39 billion since Q3 2007
– Continued focus on cost containment and improving our cost efficiency ratio
• Continued outreach and assistance to our mortgage customers with the goal to keep more customers in their homes– Modified 2,274 loans with an aggregate balance of $413 million in the first nine months of 2008 through our Proactive ARM Modification Program
– Modified approximately 12,600 loans ahead of ARM resets with an aggregate balance of $2.1 billion since October 2006. 63 percent of outstanding loans and advances granted a modification under this program are current, 11 percent of these loan balances modified have paid in full and 12 percent have charged off, been foreclosed or sold.
– Increased our use of foreclosure avoidance/account modification programs to qualify more customers with longer term need of assistance due to the weak housing market and U.S. economy for payment relief modifications (generally either two or five years) with potentially lower interest rates. Modified approximately 59,000 accounts with an aggregate balance of $8.2 billion year to date through these programs.
– Supported a variety of national and local efforts in homeownership preservation and foreclosure avoidance
• Actions taken highlight HSBC’s commitment to our stakeholders and businesses– Capital infusion of $1.3 billion from HSBC Holdings plc in Q3 2008
5
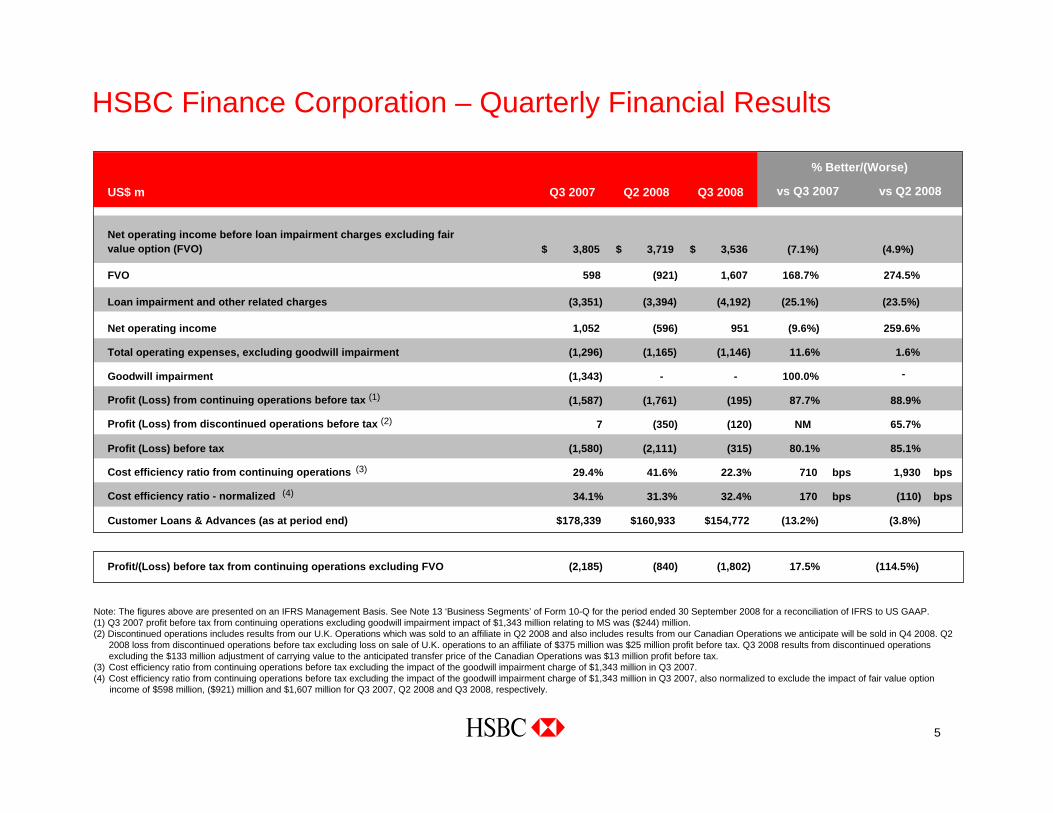
HSBC Finance Corporation – Quarterly Financial Results
Note: The figures above are presented on an IFRS Management Basis. See Note 13 ‘Business Segments’ of Form 10-Q for the period ended 30 September 2008 for a reconciliation of IFRS to US GAAP.(1) Q3 2007 profit before tax from continuing operations excluding goodwill impairment impact of $1,343 million relating to MS was ($244) million.(2) Discontinued operations includes results from our U.K. Operations which was sold to an affiliate in Q2 2008 and also includes results from our Canadian Operations we anticipate will be sold in Q4 2008. Q2
2008 loss from discontinued operations before tax excluding loss on sale of U.K. operations to an affiliate of $375 million was $25 million profit before tax. Q3 2008 results from discontinued operations excluding the $133 million adjustment of carrying value to the anticipated transfer price of the Canadian Operations was $13 million profit before tax.
(3) Cost efficiency ratio from continuing operations before tax excluding the impact of the goodwill impairment charge of $1,343 million in Q3 2007.(4) Cost efficiency ratio from continuing operations before tax excluding the impact of the goodwill impairment charge of $1,343 million in Q3 2007, also normalized to exclude the impact of fair value option
income of $598 million, ($921) million and $1,607 million for Q3 2007, Q2 2008 and Q3 2008, respectively.
US$ m Q3 2007 Q2 2008 Q3 2008
Net operating income before loan impairment charges excluding fair value option (FVO) 3,805$ 3,719$ 3,536$ (7.1%) (4.9%)
FVO 598 (921) 1,607 168.7% 274.5%
Loan impairment and other related charges (3,351) (3,394) (4,192) (25.1%) (23.5%)
Net operating income 1,052 (596) 951 (9.6%) 259.6%
Total operating expenses, excluding goodwill impairment (1,296) (1,165) (1,146) 11.6% 1.6%
Goodwill impairment (1,343) - - 100.0%
Profit (Loss) from continuing operations before tax (1) (1,587) (1,761) (195) 87.7% 88.9%
Profit (Loss) from discontinued operations before tax (2) 7 (350) (120) NM 65.7%
Profit (Loss) before tax (1,580) (2,111) (315) 80.1% 85.1%
Cost efficiency ratio from continuing operations (3) 29.4% 41.6% 22.3% 710 bps 1,930 bps
Cost efficiency ratio - normalized (4) 34.1% 31.3% 32.4% 170 bps (110) bps
Customer Loans & Advances (as at period end) $178,339 $160,933 $154,772 (13.2%) (3.8%)
Profit/(Loss) before tax from continuing operations excluding FVO (2,185) (840) (1,802) 17.5% (114.5%)
% Better/(Worse)
vs Q3 2007 vs Q2 2008
-
6
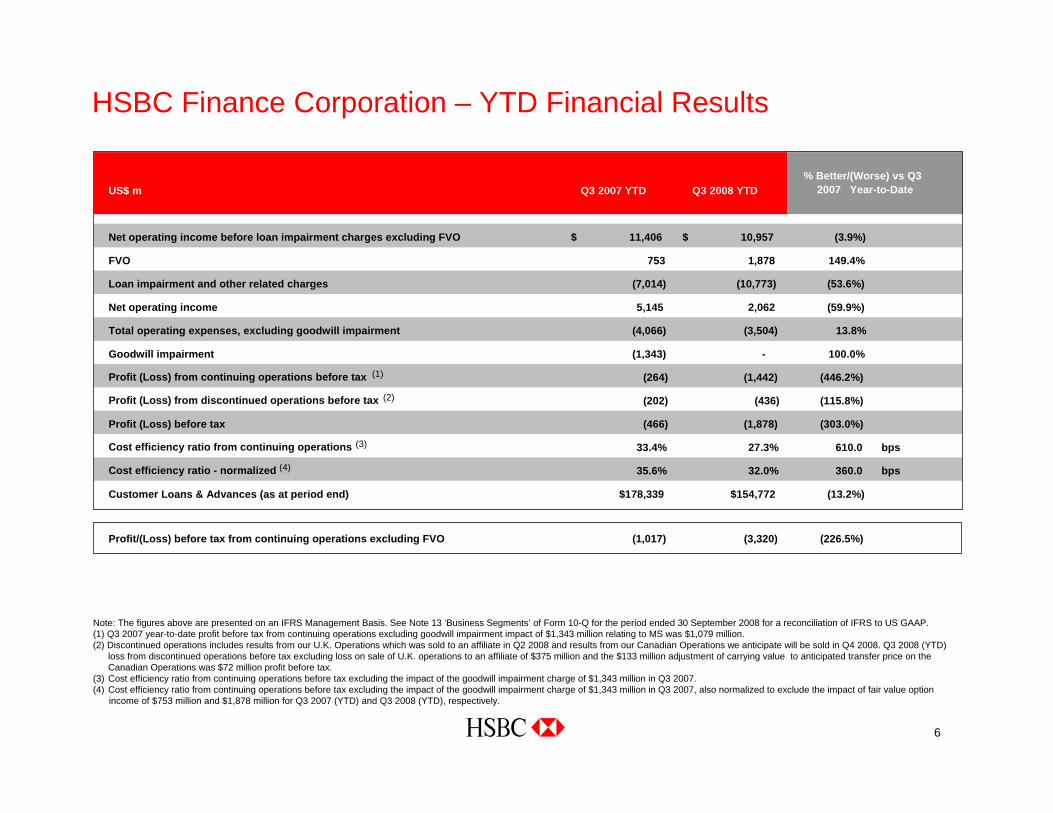
Note: The figures above are presented on an IFRS Management Basis. See Note 13 ‘Business Segments’ of Form 10-Q for the period ended 30 September 2008 for a reconciliation of IFRS to US GAAP.(1) Q3 2007 year-to-date profit before tax from continuing operations excluding goodwill impairment impact of $1,343 million relating to MS was $1,079 million.(2) Discontinued operations includes results from our U.K. Operations which was sold to an affiliate in Q2 2008 and results from our Canadian Operations we anticipate will be sold in Q4 2008. Q3 2008 (YTD)
loss from discontinued operations before tax excluding loss on sale of U.K. operations to an affiliate of $375 million and the $133 million adjustment of carrying value to anticipated transfer price on the Canadian Operations was $72 million profit before tax.
(3) Cost efficiency ratio from continuing operations before tax excluding the impact of the goodwill impairment charge of $1,343 million in Q3 2007.(4) Cost efficiency ratio from continuing operations before tax excluding the impact of the goodwill impairment charge of $1,343 million in Q3 2007, also normalized to exclude the impact of fair value option
income of $753 million and $1,878 million for Q3 2007 (YTD) and Q3 2008 (YTD), respectively.
HSBC Finance Corporation – YTD Financial Results
US$ m Q3 2007 YTD Q3 2008 YTD
Net operating income before loan impairment charges excluding FVO 11,406$ 10,957$ (3.9%)
FVO 753 1,878 149.4%
Loan impairment and other related charges (7,014) (10,773) (53.6%)
Net operating income 5,145 2,062 (59.9%)
Total operating expenses, excluding goodwill impairment (4,066) (3,504) 13.8%
Goodwill impairment (1,343) - 100.0%
Profit (Loss) from continuing operations before tax (1) (264) (1,442) (446.2%)
Profit (Loss) from discontinued operations before tax (2) (202) (436) (115.8%)
Profit (Loss) before tax (466) (1,878) (303.0%)
Cost efficiency ratio from continuing operations (3) 33.4% 27.3% 610.0 bps
Cost efficiency ratio - normalized (4) 35.6% 32.0% 360.0 bps
Customer Loans & Advances (as at period end) $178,339 $154,772 (13.2%)
Profit/(Loss) before tax from continuing operations excluding FVO (1,017) (3,320) (226.5%)
% Better/(Worse) vs Q3 2007 Year-to-Date

7
• Q3 2008 loss before tax from continuing operations of $195 million was $1,566 million better than prior quarter primarily due tohigher fair value option income on debt market valuation of $2,528 million partially offset by higher loan impairment charges ($798 million)
• Net operating income before loan impairment charges from continuing operations excluding FVO decreased 5 percent compared to the prior quarter as overall lower borrowing costs and higher fee income was more than offset by lower revenues from the CL business– CL revenues decreased as a result of lower yields due to lower average customer loans and a deterioration in credit quality, including an increase in
nonperforming customer loans– MS revenues decreased primarily due to higher losses on loan sales to third parties and lower interest income primarily due to lower average customer
loans offset by lower funding expense – Card and Retail Services revenues increased due to higher enhancement services and other income
• Q3 2008 loan impairment charges from continuing operations increased $798 million (or 24%) from Q2 2008 largely driven by impairment increases in our real estate secured ($0.6 billion) and credit card and private label ($0.3 billion) portfolios partly offset by a decrease in the personal non-credit card ($0.1 billion) portfolio – Loan impairment charges increased within the CL business as the U.S. residential market prices continued to deteriorate and credit conditions continued to
tighten for a broad segment of customers, removing refinancing alternatives. In addition, slower loans and advances run-off, portfolio seasoning, rising unemployment rates and continued weakening of the U.S. economy have had an impact.
– MS loan impairment charges have been relatively stable over the last three quarters– Card and Retail Services business experienced higher loan impairment charges as a result of portfolio seasoning, an increase in bankruptcy filings and the
effect of a weakening U.S. economy including rising unemployment rates– Motor Vehicle Finance business was impacted by higher severity due to deterioration in used vehicle prices particularly SUVs and trucks. Rising
unemployment rates and continued weakening of the U.S. economy also contributed to the increase.– Personal non-credit card loan impairment charges decreased from the prior quarter due to stabilization in delinquency levels and lower outstanding
balances
• Q3 2008 operating expenses from continuing operations were broadly consistent with Q2 2008 and 4% better including discontinued operations– Continued focus on cost containment including lower card originations marketing expense, off-shoring initiatives and reductions in workforce
HSBC Finance Corporation – Financial Results Summary

8
• Increase in total 2+ delinquency (130 basis points over Q2 2008) reflects the continued weakening of the housing and mortgage industry and rising unemployment rates as well as the impact of a broader weakening in the U.S. economy
• First and second lien real estate secured 2+ delinquency ratios were also negatively impacted by decreased principal balances from the continued liquidation of our MS portfolio and lower outstanding balances in our CL business from product offering changes, tightened underwriting standards and the reduced branch network – Real estate secured customer loans originated by our CL business in 2006 and the first half of 2007 deteriorated markedly in the third quarter of 2008 primarily in the first lien portions of the
portfolio in the geographic regions most impacted by the housing market downturn and rising unemployment rates
• 2+ delinquency in our credit card and private label portfolios increased due to continued deterioration in the marketplace and weakened economic conditions, portfolio seasoning and for our credit card portfolio lower loan balances following actions implemented since the fourth quarter of 2007 to slow loan and account growth
• The increase in the 2+ delinquency ratio in our motor vehicle finance portfolio reflects deterioration of marketplace and broader economic conditions, including increased unemployment rates. The rise in delinquency ratio was also a result of portfolio seasoning related to both the elimination of new originations and the slow down of run-off.
• Personal non-credit card 2+ delinquency ratio increased as a result of portfolio seasoning and deterioration due to marketplace and broader economic conditions. Lower receivable levels due to our risk mitigation efforts also contributed to the increase.
• For all products, the increases in delinquencies may have been partially offset by improvements in our domestic collection activities as a result of increased collection capacity and an increase in the volume of receivables modified and/or re-aged
Note: See ‘Credit Quality’ in the MD&A of Form 10-Q for the period ended 30 September 2008 for delinquency information reported on a US GAAP basis.Delinquency data above has been restated to include certain delinquent mortgage loans that were previously excluded due to system coding within the MS loan servicing platform which had the effect of excluding certain delinquent mortgage loans from the calculation of delinquency ratios. This change impacted first and second lien and total delinquency percentages above. The impact to our previously reported delinquencies was not material.
HSBC Finance Corporation2+ delinquency ratio
5.1%
10.1%8.1%8.3%
12.5%13.6%
5.7% 6.3%5.2% 3.6%
3.7%3.2% 3.5%
4.3%3.5%
16.8%15.4%
11.9%
5.3%4.8%5.8%
9.1%7.8%5.8%
0.0%2.0%4.0%6.0%8.0%
10.0%12.0%14.0%16.0%18.0%
Q1 07 Q2 07 Q3 07 Q4 07 Q1 08 Q2 08 Q3 08
R/E Secured - 1st Lien R/E Secured - 2nd Lien Credit Card Private Label
Motor Vehicle Finance Personal Non-Credit Card Discontinued Operations Total HBIO
9
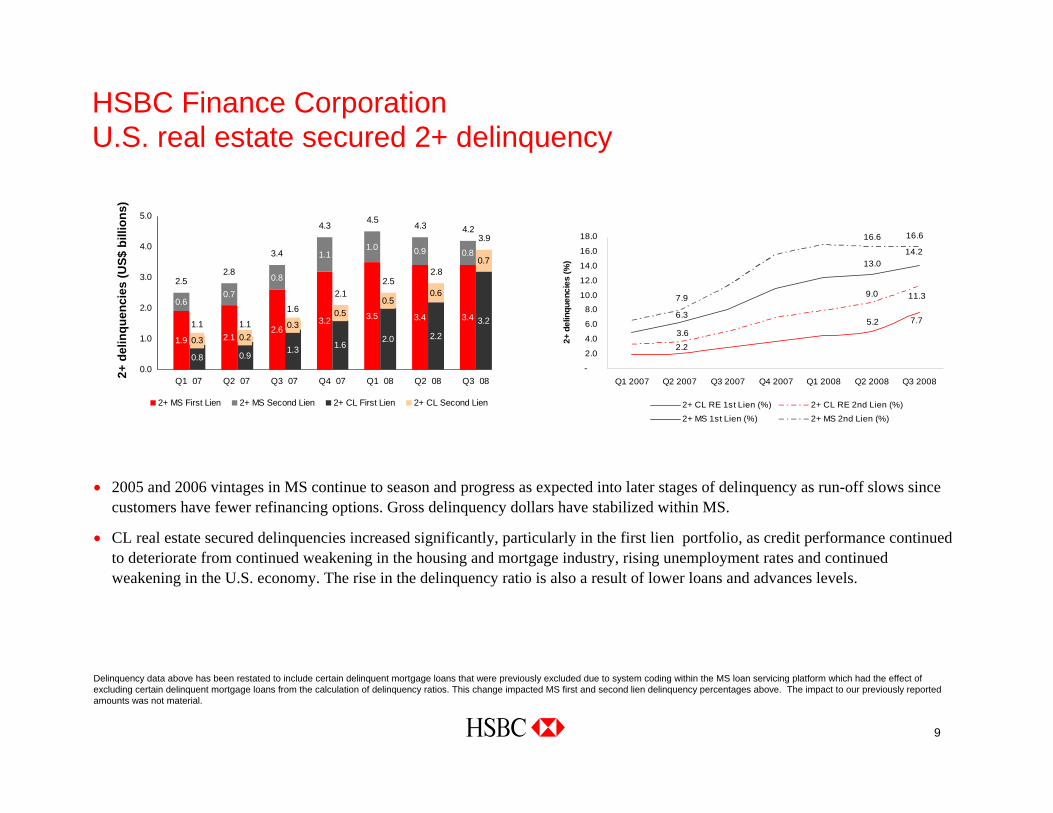
HSBC Finance CorporationU.S. real estate secured 2+ delinquency
• 2005 and 2006 vintages in MS continue to season and progress as expected into later stages of delinquency as run-off slows since customers have fewer refinancing options. Gross delinquency dollars have stabilized within MS.
• CL real estate secured delinquencies increased significantly, particularly in the first lien portfolio, as credit performance continued to deteriorate from continued weakening in the housing and mortgage industry, rising unemployment rates and continued weakening in the U.S. economy. The rise in the delinquency ratio is also a result of lower loans and advances levels.
1.9 2.12.6
3.2 3.5 3.4 3.4
0.7
0.8
1.11.0 0.9 0.8
0.8 0.91.3 1.6
2.0 2.2
3.2
0.7
0.6
0.2
0.60.5
0.50.3
0.3
4.23.9
1.1
2.5
3.4
1.6
4.3
2.1
4.5
2.5
4.3
2.8
1.1
2.8
0.0
1.0
2.0
3.0
4.0
5.0
Q1 07 Q2 07 Q3 07 Q4 07 Q1 08 Q2 08 Q3 08
2+ MS First Lien 2+ MS Second Lien 2+ CL First Lien 2+ CL Second Lien
2+ d
elin
quen
cies
(US$
bill
ions
)
7.75.2
2.2
9.0 11.3
3.6
14.213.0
6.3
16.616.6
7.9
-
2.0
4.0
6.0
8.0
10.0
12.0
14.0
16.0
18.0
Q1 2007 Q2 2007 Q3 2007 Q4 2007 Q1 2008 Q2 2008 Q3 2008
2+ d
elin
quen
cies
(%)
2+ CL RE 1st Lien (%) 2+ CL RE 2nd Lien (%)2+ MS 1st Lien (%) 2+ MS 2nd Lien (%)
Delinquency data above has been restated to include certain delinquent mortgage loans that were previously excluded due to system coding within the MS loan servicing platform which had the effect of excluding certain delinquent mortgage loans from the calculation of delinquency ratios. This change impacted MS first and second lien delinquency percentages above. The impact to our previously reported amounts was not material.

10
US$ m
Note: C/O = Net Charge-offs (amounts written off)LIC = Loan Impairment Charge
HSBC Finance CorporationImpairment allowance – MS and CL real estate secured
• MS charge-offs and delinquency dollars have stabilized however, risk remains due to the continued depreciation in home values, rising unemployment rates and the overall condition of the U.S. economy
• Credit loss estimates in the CL portfolio increased markedly from Q2 2008 primarily in the first lien portfolio driven by accelerated deterioration of portions of that portfolio which began in the second half of 2007 as housing prices continued to fall, unemployment continued to rise and the overall condition of the U.S. economy worsened
3,825
2,360
(468)
1,634
(722)
969
(876)
912
(869)
937
(52)
0
5001,000
1,500
2,000
2,500
3,000
3,5004,000
4,500
Sept-2007
Q4 C/O Q4 LIC Q1 C/O Q1 LIC Q2 C/O Q2 LIC Q3 C/O Q3 LIC Other Sept-2008
$m
Mortgage Services Consumer Lending Real Estate Secured
1,028
2,404992
(2)
(337)
440
(311)
478
(259)
561
(186)
0
500
1,000
1,500
2,000
2,500
3,000
Sept-2007
Q4 C/O Q4 LIC Q1 C/O Q1 LIC Q2 C/O Q2 LIC Q3 C/O Q3 LIC Other Sept-2008
$m

11
HSBC Finance CorporationImpairment allowance – Card and Retail Services
• CRS reserves increased from prior year as a result of higher delinquency and loss estimates from portfolio seasoning, higher levels of personal bankruptcy filings and continued weakening in the U.S. economy particularly in the geographic regions most impacted by the housing market downturn and rising unemployment rates
2,790
4,070
(15)
1,491
(1,026)
1,236
(1,042)
1,024
(969)
1,379
(798)
0
5001,000
1,500
2,000
2,500
3,000
3,5004,000
4,500
Sept-2007
Q4 C/O Q4 LIC Q1 C/O Q1 LIC Q2 C/O Q2 LIC Q3 C/O Q3 LIC Other Sept-2008
$m
US$ m
Card and Retail Services
Note: C/O = Net Charge-offs (amounts written off)LIC = Loan Impairment Charge

12
29.031.533.936.238.941.546.7
47.349.049.950.249.948.847.6
29.329.431.029.929.327.8 17.517.417.418.717.717.417.3 11.812.512.812.912.912.712.6 16.216.917.618.318.618.618.6 4.39.910.410.49.99.5
29.0
4.0154.8160.9
170.9177.7178.3178.2180.1
0.0
40.0
80.0
120.0
160.0
200.0
Q3 2008Q2 2008Q1 2008Q4 2007Q3 2007Q2 2007Q1 2007
Mortgage Services CL Real Estate Secured Credit Cards Private Label Cards Motor Vehicle Finance Other Discontinued Operations
US$ bn
• The continued decrease in customer loans and advances in Q3 2008 reflects our strategy to reduce the size of our balance sheet and lower our risk profile. The decrease in average consumer receivables during the third quarter of 2008 also reflect lower origination volumes resulting from continuing risk mitigation efforts and changes in product offerings which began in mid-2007.
• Reductions in the MS and CL real estate secured portfolios were partially offset by a decline in loan prepayments which has continued during Q3 2008 • Decrease in credit card loans and advances compared to Q2 2008 was due to strategic initiatives to slow receivable growth• Loans and advances from our Canadian operations, scheduled to be sold to an affiliate in Q4 2008 are classified as discontinued operations along with the
loans and advances from our U.K. operations which was sold in Q2 2008. On a US GAAP basis, a total of $11.0 billion was classified as loans held for sale in Q3 08 including a planned transfer of the GM credit card portfolio to HSBC USA Inc. of $6.2 billion, $1.6 billion related to the Core and Metris credit card portfolios, $2.8 billion of motor vehicle finance loans and $0.4 billion of real estate secured loans. We will maintain reporting the GM credit card and motor vehicle finance portfolios on a management basis as HSBC Finance Corporation will continue to manage and service the portfolios after the transfer.
HSBC Finance CorporationCustomer loans and advances
13
Vintages (US$ bn)
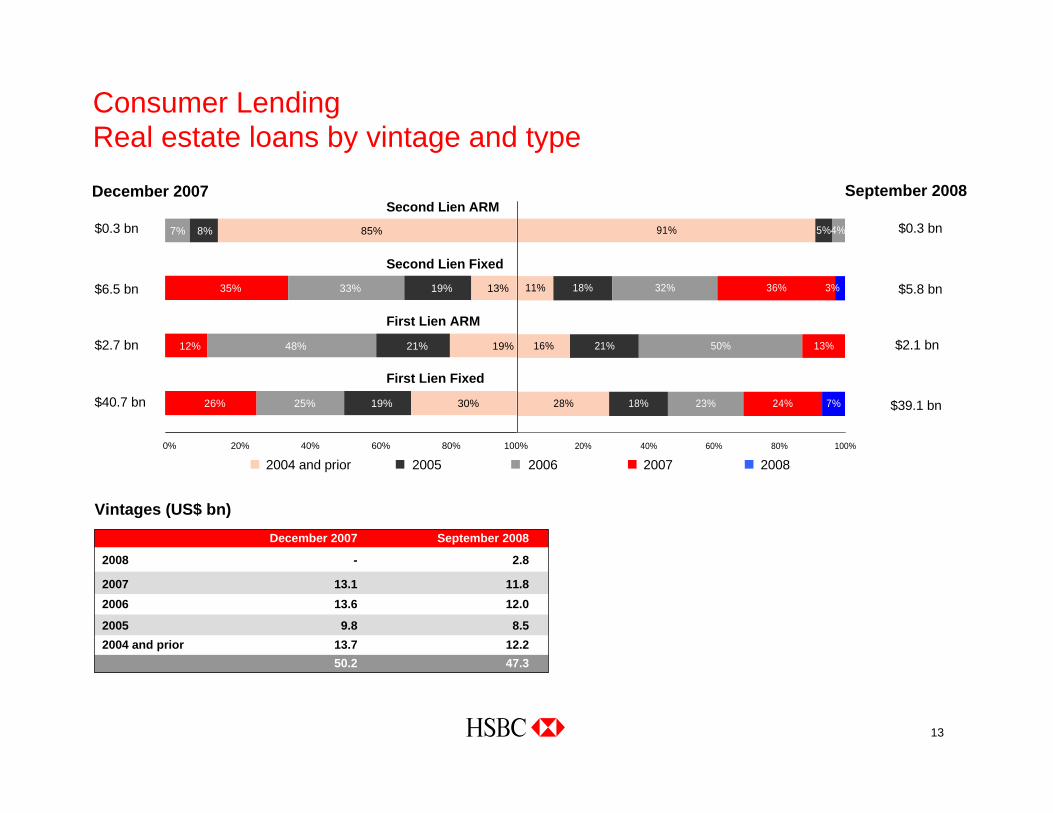
Consumer LendingReal estate loans by vintage and type
$39.1 bn28%
16%
11%
91%
18%
21%
5%
23%
50%
32%
4%
24%
13%
36%
7%
18% 3%
0% 20% 40% 60% 80% 100%
$40.7 bn
$2.7 bn
$6.5 bn
$0.3 bn
December 2007 September 2008
First Lien Fixed
First Lien ARM
Second Lien Fixed
Second Lien ARM$0.3 bn
$2.1 bn
$5.8 bn
2004 and prior 2005 2006 2007 2008
26%
12%
35%
25%
48%
33%
7%
19%
21%
19%
8%
30%
13%
19%
85%
0% 20% 40% 60% 80% 100%
December 2007 September 2008
2008 - 2.8
2007 13.1 11.82006 13.6 12.0
2005 9.8 8.52004 and prior 13.7 12.2
50.2 47.3

14
15%
7%
6%
10%
26%
10%
5%
20%
44%
51%
35%
29%
39%
37%
50%
10%
5% 1%
0% 20% 40% 60% 80% 100%
December 2007
9% 29%
36%
36%
20%
46%
54%
36%
27%
11%
4%
5%
15%
7%
5%1%
51% 8%
0% 20% 40% 60% 80% 100%
$1.8 bn
$4.9 bn
$14.3 bn
$15.2 bn
September 2008
First Lien Fixed
First Lien ARM
Second Lien Fixed
Second Lien ARM$1.3 bn
$10.8 bn
$13.4 bn
$3.5 bn
Pre-2004 2004 2005 2006 2007
Mortgage ServicesReal estate loans by vintage and type
Vintages (US$ bn)December 2007 September 2008
2007 1.5 1.4
2006 12.2 10.0
2005 12.9 9.72004 5.9 4.8
Pre-2004 3.7 3.136.2 29.0

15
• Continue to recreate the value of our core CL business and reposition for long-term success
• Deliver high brand values and strong customer value proposition in our products and services
• Formed new Global Card team to recommend and oversee the development of strategic initiatives to support HSBC’s global Premier credit card proposition
• Manage collection resources and evolve collection strategies, including wider range of modification programs to help our customers
• Achieve a balance sheet size consistent with our desired risk profile and the current funding environment– Maintain desired capital ratios and liquidity
• Continue liquidation of MS and Motor Vehicle Finance portfolios
• Continue cost reduction and streamline operations across the organization, right-sizing in markets experiencing fundamental change– Anticipate continuing branch optimization– One HSBC initiatives underway to align processes and systems globally under a common platform
HSBC Finance CorporationOngoing areas of focus