HSBC Finance Corporation results presentation (8-K form)
19
UNITED STATES SECURITIES AND EXCHANGE COMMISSION Washington, D.C. 20549 ____________________________ FORM 8-K CURRENT REPORT Pursuant to Section 13 or 15(d) of The Securities Exchange Act of 1934 Date of Report: November 14, 2007 ____________________________ Commission file number 1-8198 HSBC Finance Corporation (Exact name of registrant as specified in its charter) Delaware 86-1052062 (State or other jurisdiction of incorporation) (I.R.S. Employer Identification No.) 2700 Sanders Road, Prospect Heights, Illinois 60070 (Address of principal executive offices) (Zip Code) (847) 564-5000 Registrant’s telephone number, including area code Check the appropriate box below if the Form 8-K filing is intended to simultaneously satisfy the filing obligation of the registrant under any of the following provisions (see General Instruction A.2.below): [ ] Written communications pursuant to Rule 425 under the Securities Act (17 CFR 230.425) [ ] Solicitation material pursuant to Rule 14a-12 under the Exchange Act (17 CFR 240.14a-12) [ ] Pre-commencement communications pursuant to Rule 14d-2(b) under the Exchange Act (17 CFR 40.14d-2(b)) [ ] Pre-commencement communications pursuant to Rule 13e-4(c) under the Exchange Act (17 CFR 240.13e-4(c))
-
Upload
quarterlyearningsreports2 -
Category
Economy & Finance
-
view
318 -
download
2
Transcript of HSBC Finance Corporation results presentation (8-K form)

UNITED STATES SECURITIES AND EXCHANGE COMMISSION
Washington, D.C. 20549 ____________________________
FORM 8-K
CURRENT REPORT Pursuant to Section 13 or 15(d) of
The Securities Exchange Act of 1934
Date of Report: November 14, 2007 ____________________________
Commission file number 1-8198
HSBC Finance Corporation (Exact name of registrant as specified in its charter)
Delaware 86-1052062 (State or other jurisdiction
of incorporation)
(I.R.S. Employer Identification No.)
2700 Sanders Road, Prospect Heights, Illinois
60070
(Address of principal executive offices)
(Zip Code)
(847) 564-5000
Registrant’s telephone number, including area code
Check the appropriate box below if the Form 8-K filing is intended to simultaneously satisfy the filing obligation of the registrant under any of the following provisions (see General Instruction A.2.below): [ ] Written communications pursuant to Rule 425 under the Securities Act (17 CFR 230.425) [ ] Solicitation material pursuant to Rule 14a-12 under the Exchange Act (17 CFR 240.14a-12) [ ] Pre-commencement communications pursuant to Rule 14d-2(b) under the Exchange Act (17 CFR 40.14d-2(b)) [ ] Pre-commencement communications pursuant to Rule 13e-4(c) under the Exchange Act (17 CFR 240.13e-4(c))

2
Item 7.01. Regulation FD Disclosure.
This Form 8-K contains slides in Exhibit 99.1 pertaining to the financial results of HSBC Finance Corporation for the nine months ended September 30, 2007. The information included in the slides with respect to HSBC Finance Corporation is presented on an International Financial Reporting Standards (“IFRSs”) Management Basis. IFRS is comprised of accounting standards issued by the International Accounting Standards Board and its predecessor body and interpretations issued by the International Financial Reporting Interpretations Committee and its predecessor body. IFRS Management Basis results are IFRS results that assume that mortgage and private label receivables transferred to HSBC Bank USA, N.A., an affiliate of HSBC Finance Corporation, have not been sold and remain on the HSBC Finance Corporation balance sheet. HSBC Finance Corporation has filed its Quarterly Report on Form 10-Q for the period ended September 30, 2007 contemporaneously with this Form 8-K. The Form 10-Q is prepared on a U.S. GAAP basis with segment results prepared on an IFRS Management Basis Item 9.01. Financial Statements and Exhibits.
(a) Financial Statements of Businesses Acquired. Not applicable.
(b) Pro Forma Financial Information.
Not applicable.
(c) Shell Company Transactions.
Not applicable. (d) Exhibits. Exhibit No. Description 99.1 HSBC Finance Corporation IFRS Management Basis 3Q 2007 results.

3
SIGNATURES
Pursuant to the requirements of the Securities Exchange Act of 1934, the registrant has duly caused this report to be signed on its behalf by the undersigned hereunto duly authorized. HSBC FINANCE CORPORATION
(Registrant)
By: /s/ Patrick D. Schwartz Name:
Title: Patrick D. Schwartz Vice President and Deputy General Counsel – Corporate
Dated: November 14, 2007
EXHIBIT INDEX
Exhibit No. Description 99.1 HSBC Finance Corporation IFRS Management Basis 3Q 2007 results.

Q3 2007 ResultsHSBC Finance Corporation IFRS Management Basis

Disclosure statement
2
This presentation, including the accompanying slides and subsequent discussion, contains certain forward-looking information with respect to the financial condition, results of operations and business of HSBC Holdings plc and HSBC Finance Corporation. This information represents expectations or beliefs concerning future events and is subject to unknown risks and uncertainties. This information speaks only as of the date on which it is provided. Additional detailed information concerning important factors that could cause actual results to differ materially is available in the HSBC Holdings plc Annual Report, and the HSBC Finance Corporation Annual Report on Form 10-K, each for the year ended 31 December 2006. Please further be advised that Regulation FD prohibits HSBC representatives from answering certain, specific questions during the Q&A session. You may get copies of the HSBC Finance Corporation document referred to above free by visiting EDGAR on the SEC Web site at www.sec.gov.
These materials do not constitute an offer to sell, or the solicitation of an offer to buy, any security of HSBC Finance Corporation or any other issuer.
HSBC Holdings plc reports financial results in accordance with International Financial Reporting Standards (“IFRSs”) as endorsed by the EU. EU endorsed IFRSs may differ temporarily from IFRSs, as published by the IASB, if a new or amended IFRS has not been endorsed by the EU by the period end. There were no unendorsed standards affecting this document. As at September 30, 2007, there is no difference between IFRSs as endorsed by the EU and IFRSs as issued by the IASB in terms of their application to HSBC.
IFRSs comprise accounting standards issued by the International Accounting Standards Board and its predecessor body and interpretations issued by the International Financial Reporting Interpretations Committee and its predecessor body.
All amounts, unless otherwise stated, represents IFRS Management Basis of accounting.
IFRS Management Basis assumes that the mortgages and private label customer loans transferred to HSBC’s US banking subsidiary, HSBC Bank USA, N.A. (“HSBC Bank USA”), have not been sold and remain on our balance sheet. Such customer loans continue to be managed and serviced by HSBC Finance Corporation without regard to ownership.

Key developments
3
• Deteriorating mortgage industry trends, including continuing housing price decline, have contributed to a marked increase in delinquencies in the Retail Branch business– Q3 2007 experienced unprecedented turmoil in the mortgage industry evidenced by significantly reduced refinance opportunities to borrowers and an anticipated
deeper and much longer slowdown in the housing market
– Incremental $0.5 billion loan impairment allowances as at September 30, 2007 compared with June 30, 2007 for US Retail Branch real estate secured business
– Incremental $0.4 billion loan impairment allowances as at September 30, 2007 compared with June 30, 2007 for unsecured loans within US Retail Branch business
• Continued decisive actions to right-size and recalibrate our businesses– Proactively reducing risk through refined product offerings in Retail Branch business
– Reducing branch network to align with forecasted demand and reduced credit risk appetite
Already closing or consolidating 100 branches during 2007 as a result of an earlier branch network optimization strategy
Decided in November 2007 to close or consolidate up to 260 additional branches prior to December 31, 2007
– Closed wholesale broker mortgage origination business in Q3 2007
– Ceased correspondent mortgage originations during H1 2007
– Reducing Mortgage Services (MS) portfolio ($2.6 billion reduction since Q2 2007, $10.7 billion YTD )
• Continued outreach and assistance to our mortgage customers– Contacted 31,770 customers and modified more than 8,000 loans ahead of ARM resets (since October 06)
– Refinanced 2,275 ARM customers into fixed rate mortgages through our branches (since October 06)
– Restructured loan volume up significantly as we continue to work with our customers who, in our judgment, evidence continued payment probability
• Continued effort to enhance customer value, service and experience– In the fourth quarter of 2007, the Credit Card business will be initiating certain changes related to fee and finance charge billings as a result of continuing reviews to
ensure our practices reflect our brand principles
• Actions taken highlight HSBC’s commitment to our stakeholders and businesses– Maintained strong liquidity during recent market conditions
– $750 million Capital infusion from HSBC Holdings plc on November 8
• Continued focus on strengthening businesses for the future

HSBC Finance Corporation – Quarterly financial results
4
USD m % Better/(Worse)
Q3 2006 Q2 2007 Q3 2007 versus Q3 2006 versus Q2 2007
Goodwill impairment - - (1,343) n/a n/a
Cost efficiency ratio (3) 39.6% 38.7% 30.6% 900bps 810bps
Cost efficiency ratio – normalized (4) 39.0% 38.3% 35.2% 380bps 310bps
Profit (Loss) before tax (2) $706 $214 $(1,580) (323.8%) (838.3%)
Net operating income before loanimpairment charges (1)
$3,758 $3,914 $4,672 24.3% 19.4%
Loan impairment andother related charges
(1,564) (2,185) (3,478) (122.4%) (59.2%)
Net operating income 2,194 1,729 1,194 (45.6%) (30.9%)
Total operating expenses excluding goodwill impairment
(1,488) (1,515) (1,431) 3.8% 5.5%
Customer Loans & Advances (as at period end) $177,610 $178,222 $178,339 0.4% 0.1%
Note: The figures above are presented on an International Financial Reporting Standards (“IFRS”) Management Basis. See Note 11 “Business Segments” of Form 10-Q for the period ended 30 September 2007 for a reconciliation of IFRS to US GAAP.
(1) Includes fair value option income/(loss) of $(53) million, $(44) million, and $606 million for Q3 2006, Q2 2007, and Q3 2007, respectively.(2) Q3 2007 loss before tax excluding goodwill impairment impact ($1,343 million relating to Mortgage Services, including Decision One business) is $(237) million. (3) Cost efficiency ratio excluding the impact of the goodwill impairment charge of $1,343 million in Q3 2007.(4) Cost efficiency ratio excluding the impact of the goodwill impairment charge of $1,343 million in Q3 2007, also normalized to exclude the impact of fair value option
income/(loss) of $(53) million, $(44) million, and $606 million for Q3 2006, Q2 2007, and Q3 2007, respectively.

HSBC Finance Corporation – YTD financial results
5
USD m % Better/(Worse)
Q3 2006
Year-to-Date
Q3 2007
Year-to-Date
versus Q3 2006
Year-to-Date
Goodwill impairment - (1,343) n/a
Cost efficiency ratio (3) 37.6% 34.7% 290bps
Profit (Loss) before tax (2) $3,507 $(466) (113.3%)
Net operating income before loan impairment charges (1) $11,728 $12,899 10.0%
Loan impairment and other related charges (3,814) (7,551) (98.0%)
Net operating income 7,914 5,348 (32.4%)
Total operating expenses, excluding goodwill impairment (4,407) (4,471) (1.5%)
Cost efficiency ratio – normalized (4) 37.5% 36.8% 70bps
Customer Loans & Advances (as at period end) $177,610 $178,339 0.4%
(1) Includes fair value option income/(loss) of $(25) million and $766 million for Q3 2006 (YTD) and Q3 2007 (YTD), respectively.(2) Q3 2007 year-to-date profit before tax excluding the goodwill impairment impact ($1,343 million relating to Mortgage Services, including Decision One business) is $877 million. (3) Cost efficiency ratio excluding the impact of the goodwill impairment charge of $1,343 million in Q3 2007.(4) Cost efficiency ratio excluding the impact of the goodwill impairment charge of $1,343 million in Q3 2007, also normalized to exclude the impact of fair value option income/(loss) of
$(25) million and $766 million for Q3 2006 (YTD) and Q3 2007 (YTD), respectively.

HSBC Finance Corporation Financial results summary
6
• Q3 2007 loss before tax of $1.6 billion was $1.8 billion below prior quarter due to goodwill impairment of $1.3 billion and higher loan impairment charges, partially offset by fair value option income on debt market valuation. Excluding the impact of the goodwill impairment, the Q3 2007 loss before tax of $237 million was $451 million below prior quarter.
• Higher net operating income before loan impairment charges primarily driven by income from fair value option of debt issued as the third quarter was impacted by widening of credit spreads ($606 million) and higher revenues from Credit Card business ($232 million), partly offset by lower Mortgage Services revenues
• Q3 2007 loan impairment charges increased $1.3 billion (or 59%) from prior quarter largely driven by our US Retail Branch business ($0.8 billion) and Mortgage Services portfolio ($0.3 billion)– A marked increase in delinquency within the Retail Branch business as the US residential market further deteriorates and credit conditions
continue to tighten for a broad segment of customers, removing refinancing alternatives
– Mortgage Services continues to experience higher loan impairment charges and delinquencies as portions of this portfolio purchased in 2005 and 2006 continue to season. In addition, this portfolio has also been impacted by worsening industry trends and slower receivable run-off, particularly in the second lien portfolio.
– It is now generally believed that the deterioration in the housing market will be deeper in terms of its impact on housing prices and the duration will be much longer than originally anticipated
– Credit Card business has experienced higher charges ($0.1 billion) from higher delinquencies due to receivable growth, mix changes, portfolio seasoning and an increase in bankruptcy filings

HSBC Finance Corporation Financial results summary
7
• Operating expenses, excluding the impact of goodwill impairment, decreased $84 million (or 5.5%) compared to prior quarter primarily as a result of lower marketing expenses ($57 million), lower compensation expense ($18 million) resulting from the termination of correspondent channel acquisitions and the impact of entity wide initiatives to reduce costs
• Goodwill impairment charge of $1.3 billion was recognized in Q3 2007 as a result of the closure of the Decision One business combined with the earlier decision to cease correspondent mortgage originations. This does not impact the results of HSBC Holdings plc.

• Q3 2007 loan impairment charges excluding Mortgage Services increased 56% ($1 billion) over Q2 2007 to $2.8 billion – Q3 2007 market driven deterioration impacted US Retail Branch real estate secured portfolios ($0.5 billion)– Increase in loan impairment charges related to US Retail Branch unsecured portfolios ($0.4 billion) due to seasoning, deterioration of
2006 direct mail vintages in certain geographic regions and increased bankruptcy filings as compared to exceptionally low filings in 2006 following bankruptcy legislation change in October 2005
– Increase in loan impairment charges in Cards and Other portfolios ($0.1 billion) as a result of growth, mix changes, seasoning and increased bankruptcy filings
• Loan impairment charges in the Mortgage Services portfolio included expected portfolio seasoning and the impact of worsening mortgage industry trends
HSBC Finance CorporationLoan impairment charges
1.6
3.2
1.92.2
3.5
1.41.6 1.5
1.8
0.2
1.6
2.8
0.70.40.4
0.0
0.5
1.0
1.5
2.0
2.5
3.0
3.5
Q3 2006 Q4 2006 Q1 2007 Q2 2007 Q3 2007
Total Excluding M ortgage Services M ortgage Services
$ bn
8

HSBC Finance Corporation2+ delinquency ratio
• 2+ delinquencies excluding Mortgage Services increased during Q3 2007 due to higher delinquencies in Retail Branch business as a result of industry-wide worsening of credit environment and continuing broad based deterioration in the US residential property market. The delinquencies were also impacted by seasoning of Credit Card portfolios and the impact of a higher mix of near prime and non-prime balances.
• Magnitude of the ratio increase (32% over Q2 2007) in Mortgage Services delinquencies reflects seasoning of the portfolio and the impact of a declining portfolio balance
8.17%
6.18%
4.91%4.64%
4.20%
5.70%
4.73%4.35%4.40%
3.67%
5.01%
4.29%4.16%4.31%4.05%
0%
1%
2%
3%
4%
5%
6%
7%
8%
9%
Q3 2007Q2 2007Q1 2007Q4 2006Q3 2006
Mortgage Services Excluding Mortgage Services Total
Note: See “Credit Quality” in the MD&A of Form 10-Q for the period ended 30 September 2007 for delinquency information reported on a US GAAP basis.
9

HSBC Finance CorporationReal estate secured 2+ delinquency
2.21.92.9
3.94.8
3.4
5.8
3.7
7.5
3.6
7.9
11.2
0
2
4
6
8
10
12
Q1 2006 Q2 2006 Q3 2006 Q4 2006 Q1 2007 Q2 2007 Q3 2007
2+ Branch RE 1st Lien (%) 2+ Branch RE 2nd Lien (%)
2+ M S 1st Lien (%) 2+ M S 2nd Lien (%)
1.1 1.21.5 1.7 1.7 1.9
2.40.20.3
0.40.6 0.6
0.7
0.8
0.6 0.6 0.7 0.8 0.8 0.91.30.3 0.3 0.3
0.4 0.4 0.4
0.51.3
0.9
1.5
0.9
1.9
1.0
2.3
1.2
2.3
1.2
2.6
1.3
3.2
1.8
0.0
1.0
2.0
3.0
4.0
5.0
Q1 2006 Q2 2006 Q3 2006 Q4 2006 Q1 2007 Q2 2007 Q3 2007
2+ MS First Lien 2+ MS Second Lien 2+ Branch First Lien 2+ Branch Second Lien
2+ d
elin
quen
cies
(USD
bill
ions
)
• 2005 and 2006 vintages in Mortgage Services continue to season. Portfolio sales and the cessation of correspondent acquisitions have a marked impact on the delinquency ratio. As the portfolio declines, the delinquency ratio will continue to increase.
• Increase in 2+ delinquencies for Retail Branch real estate secured due to industry-wide worsening of credit environment and broad based deterioration of the US residential property market during Q3 2007
2+ D
elin
quen
cies
(%)
10

HSBC Finance CorporationImpairment allowance – Real estate portfolios
Mortgage Services US Retail Branch Real Estate Secured
$295
$1,028$659
($140)
$201
($148)
$276
($115)
-
200
400
600
800
1,000
1,200
Dec-2006 Q1 C/O Q1 LIC Q2 C/O Q2 LIC Q3 C/O Q3 LIC Sept-2007
$2,360
$2,043 ( $27)
$670
( $406)
$392
( $367)
$368
( $313)
-
500
1,000
1,500
2,000
2,500
Dec-2006
Q1 C/O Q1 LIC Q2 C/O Q2 LIC Q3 C/O Q3 LIC Other Sept-2007
$ m $ m
• A marked increase in loss estimates in Q3 2007 for the real estate secured portfolios
– US Retail Branch experienced a faster deterioration in portions of the portfolio due to market conditions
– Mortgage Services second lien portfolio was impacted by the slowdown in loan run-off and market conditions
Note: C/O = Net Charge-offsLIC = Loan Impairment Charge
11

HSBC Finance CorporationCustomer loans and advances
38.941.546.749.651.651.549.344.3
54.352.951.549.746.244.443.1
41.3
30.229.628.028.326.325.724.725.8
20.319.819.520.619.3
18.419.7
13.213.012.712.1
11.9
21.421.421.421.621.521.3
20.920.8
19.0
12.412.912.8
0.0
40.0
80.0
120.0
160.0
200.0
Q3 2007Q2 2007Q1 2007Q4 2006Q3 2006Q2 2006Q1 2006Q4 2005
Mortgage Services Branch Real Estate Secured Credit Cards Private Label Cards Motor Vehicle Finance Other
163.8 168.5 174.3 177.6 182.6
$ bn
180.0 178.2 178.3
• Strategic reduction in Mortgage Services loan portfolios has slowed in Q3 2007 due to market led factors
• Although growth experienced in all other portfolios during Q3 2007, changes in product offerings and business strategies, including reduction in branch offices and tightening in underwriting standards will result in reduced volumes in the Branch Real Estate Secured and Other loan portfolios in future periods
12
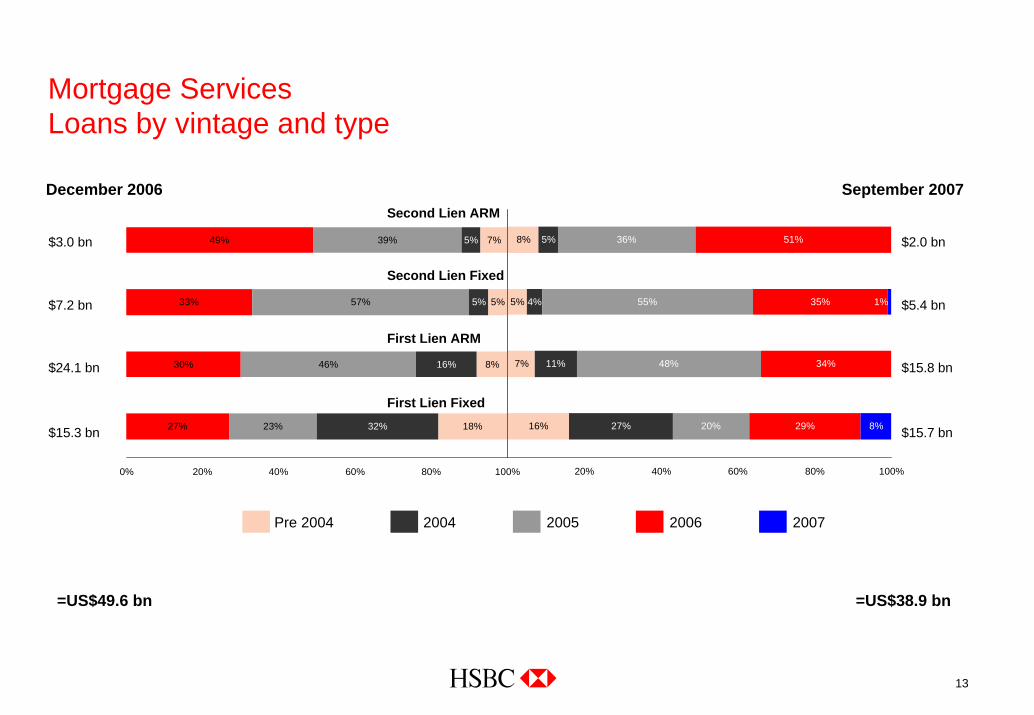
Mortgage ServicesLoans by vintage and type
16%
7%
5%
8%
27%
11%
5%
20%
48%
55%
36%
29%
34%
35%
51%
8%
4% 1%
0% 20% 40% 60% 80% 100%
December 2006
27%
30%
33%
49%
23%
46%
57%
32%
16%
5%
5%
18%
8%
5%
7%39%
0% 20% 40% 60% 80% 100%
$3.0 bn
$7.2 bn
$24.1 bn
$15.3 bn
$2.0 bn
$5.4 bn
$15.8 bn
$15.7 bn
September 2007
First Lien Fixed
First Lien ARM
Second Lien Fixed
Second Lien ARM
Pre 2004 2004 2005 2006 2007
=US$49.6 bn =US$38.9 bn
13

HSBC Finance CorporationMortgage Services loans – Vintages
Vintages ($ bn)
14
December 2006 March 2007 June 2007 September 2007
2007 0.6 1.4 1.5
12.9
14.2
6.3
4.0
38.9
2006 15.2 15.0 13.5
2005 19.9 18.0 15.6
2004 9.3 8.3 6.7
Pre 2004 5.2 4.8 4.3
49.6 46.7 41.5
• Continued progress in reduction of 2005 and 2006 vintage balances
• Decreased market demand for subprime mortgages due to unprecedented turmoil in the industry resulted in a significant reduction in secondary market demand in Q3 2007, which contributed to slower portfolio attrition

HSBC Finance CorporationAdjustable rate mortgages – ARM resets
$ bn
• Proactively contacting customers nearing the first interest rate reset that will be most impacted by a rate adjustment
– As appropriate and in accordance with defined policy, loans are modified
– More than 8,000 loans totaling $1.2 billion have been modified to date
5.8
4.03.0
4.1
5.1
10.7
2.9
5.3
2.83.0
3.8
9.9
1.10.5
0.2
1.11.30.8
0.0
2.0
4.0
6.0
8.0
10.0
12.0
2007 2008 H2 2007 2008 Q4 2007 2008
Total HBIO Mortgage Services Retail Branch RE
Q3 2007Q4 2006 Q2 2007
Note: The reset volumes above do not reflect modifications. Unless customers who have benefited from a loan modification are able to obtain other financings, these loans will also be subject to an interest rate reset at the end of the modification period.
15

HSBC Finance CorporationOngoing areas of focus
16
In unpredictable, turbulent markets, focused on what we can control:
• Continued liquidation of Mortgage Services portfolio
• Continued tightening of underwriting standards and intensified risk management
• Reducing Retail Branch network to align with level of forecast demand and reduced credit risk appetite
• Continued cost reduction across the organization, right-sizing in markets experiencing fundamental change
• Delivering high brand values and strong customer value proposition in our products and service
• Continued focus on risk management programs – increased within Retail Branch, Cards and Retail Services businesses
• Continued review of all businesses not meeting optimal returns over the economic cycle
• Progression of the role of the US Credit Card business in developing the global cards business