HS2 Technical Study R12922T101A 4.6 APPENDICES 4.6.1 ... · 4.6.1 Apppendix A - Methodology for...
113
HS2 Technical Study Site 18/Canterbury Works Site R12922T101A Pell Frischmann Page 37 4.6 APPENDICES 4.6.1 Apppendix A - Methodology for Townscape and Visual Impact Assessment 4.6.1.1 The methodology for this assessment is based on the ‘Guidelines for Landscape and Visual Impact Assessment’, 3rd edition, 2014 (Landscape Institute and the Institute of Environmental Management and Assessment) (GLVIA3). The aim of these guidelines is to set high standards for the scope and contents of landscape and visual assessments and to establish certain principles that will help to achieve consistency, credibility and effectiveness in landscape and visual assessment. Guidance is contained in this publication on some approaches and techniques which have been found to be effective and useful in practice by townscape professionals. However, the guidelines are not intended as a prescriptive set of rules, nor as an exhaustive manual of techniques. 4.6.1.2 The assessment criteria have been adapted to be relevant to assessment of the townscape setting of these proposals. Townscape is defined within the GLVIA3 as: ‘...areas where the built environment is dominant. Villages, towns and cities often make important contributions as elements in wider open landscape but townscape means the landscape within the built-up area, including buildings, the relationships between them, the different types of urban spaces, including green spaces, and the relationship between buildings and open spaces’ 4.6.1.3 The assessment of townscape and visual effects has certain defining features that distinguish it from the methodologies used in the assessment of landscape and visual effects. Townscape and visual assessments may also be different from other specialist studies because they are generally undertaken by professionals who are also involved in the design of the townscape and the preparation of subsequent management proposals. 4.6.1.4 A townscape assessment includes a combination of objective and subjective judgements, and it is therefore important that a structured and consistent approach is used. It is necessary to differentiate between judgements that involve a degree of subjective opinion (as in the assessment of townscape values) from those that are normally more objective and quantifiable (as in the determination of magnitude of change). Townscape and Visual Effects 4.6.1.5 Townscape and visual effects are assessed separately. 4.6.1.6 Townscape and visual assessments in this report are dealt with as separate, although linked, procedures. The townscape baseline, its analysis and the assessment of townscape effects all contribute to the baseline for visual assessment studies. The assessment of the potential effect on the townscape is
Transcript of HS2 Technical Study R12922T101A 4.6 APPENDICES 4.6.1 ... · 4.6.1 Apppendix A - Methodology for...

HS2 Technical Study Site 18/Canterbury Works Site R12922T101A
Pell Frischmann Page 37
4.6 APPENDICES
4.6.1 Apppendix A - Methodology for Townscape and Visual Impact Assessment
4.6.1.1 The methodology for this assessment is based on the ‘Guidelines for Landscape
and Visual Impact Assessment’, 3rd edition, 2014 (Landscape Institute and the
Institute of Environmental Management and Assessment) (GLVIA3). The aim of
these guidelines is to set high standards for the scope and contents of landscape
and visual assessments and to establish certain principles that will help to achieve
consistency, credibility and effectiveness in landscape and visual assessment.
Guidance is contained in this publication on some approaches and techniques
which have been found to be effective and useful in practice by townscape
professionals. However, the guidelines are not intended as a prescriptive set of
rules, nor as an exhaustive manual of techniques.
4.6.1.2 The assessment criteria have been adapted to be relevant to assessment of the
townscape setting of these proposals. Townscape is defined within the GLVIA3
as:
‘...areas where the built environment is dominant. Villages, towns and cities
often make important contributions as elements in wider open landscape
but townscape means the landscape within the built-up area, including
buildings, the relationships between them, the different types of urban
spaces, including green spaces, and the relationship between buildings and
open spaces’
4.6.1.3 The assessment of townscape and visual effects has certain defining features that
distinguish it from the methodologies used in the assessment of landscape and
visual effects. Townscape and visual assessments may also be different from
other specialist studies because they are generally undertaken by professionals
who are also involved in the design of the townscape and the preparation of
subsequent management proposals.
4.6.1.4 A townscape assessment includes a combination of objective and subjective
judgements, and it is therefore important that a structured and consistent
approach is used. It is necessary to differentiate between judgements that involve
a degree of subjective opinion (as in the assessment of townscape values) from
those that are normally more objective and quantifiable (as in the determination of
magnitude of change).
Townscape and Visual Effects 4.6.1.5 Townscape and visual effects are assessed separately.
4.6.1.6 Townscape and visual assessments in this report are dealt with as separate,
although linked, procedures. The townscape baseline, its analysis and the
assessment of townscape effects all contribute to the baseline for visual
assessment studies. The assessment of the potential effect on the townscape is

HS2 Technical Study Site 18/Canterbury Works Site R12922T101A
Pell Frischmann Page 38
carried out as an effect on an environmental resource, i.e. the townscape. Visual
effects are assessed as one of the interrelated effects on population.
4.6.1.7 Townscape effects derive from changes in the physical townscape, which may
give rise to changes in its character and how this is experienced. This may in turn
affect the perceived value assigned to the townscape. The description and
analysis of effects on the townscape as a resource relies on the adoption of
certain basic principles about the positive (or beneficial) and negative (or adverse)
effects of change in the townscape.
4.6.1.8 Visual effects relate to the changes that arise in the composition of available views
as a result of changes to the townscape, to people’s responses to the changes,
and to the overall effects with respect to visual amenity.
4.6.1.9 The assessment of effects aims to:
Systematically identify the likely effects of a development;
Indicate the measures proposed to avoid, reduce, remedy or compensate
for those effects (mitigation measures);
Estimate the magnitude of the effects;
Provide an assessment of the nature and significance of these effects in a
logical and well-reasoned fashion.
4.6.1.10 Effects may be positive (beneficial), negative (adverse) or direct or indirect, and
can be secondary or cumulative, permanent or temporary (short, medium or long
term). They can also arise at different scales (local, regional or national) and have
different levels of significance.
Baseline Studies
4.6.1.11 The initial step in any townscape or visual assessment is to review the existing
townscape and visual resource in the vicinity of the development site– that is the
baseline townscape and visual conditions. The data collected will form the basis
from which the current estimation of magnitude and significance of the townscape
and visual effects of the development may be identified and assessed. The
purpose of baseline studies is to record and analyse the existing townscape
features, characteristics, the way the townscape is experienced, and the value or
importance of the townscape and visual resources in the vicinity of the proposed
development. This requires research, classification and analysis of the townscape
and visual resources as follows:
Research/survey involving both desk and field studies to assemble basic
information;
Classification of townscape into units or groups of distinct and
recognisable type and character (Character Area);
Analysis of the townscape in order to understand how it is experienced
and the relative townscape and visual importance of the constituent parts.
4.6.1.12 The desktop study explores patterns and scale of landform, land cover and built
development which gives guidance on the overall townscape character of the
surrounding area. Any special values that may apply, such as designated

HS2 Technical Study Site 18/Canterbury Works Site R12922T101A
Pell Frischmann Page 39
townscapes or buildings, and specific potential receptors of townscape and visual
impact including important components of the townscape, as well as residents,
visitors, travellers through the area and other groups of viewers have also been
noted.
4.6.1.13 The desk study provides a sound basis for subsequent field survey work including
the identification of townscape character areas around the development site, the
likely zone of visual influence and principal viewpoints. The field survey has
identifies and records specific sensitive receptors.
4.6.1.14 Townscape character assessment, and particularly the stage of characterisation,
is the basic tool for understanding the townscape and is the starting point for
baseline surveys. There is a well established methodology developed in the UK by
the Countryside Agency and Scottish Natural Heritage. The baseline studies
provide a concise description of the existing character of the site and its
surrounding townscape, and the classification of the townscape into distinct
character areas or types, which share common features and characteristics. The
condition of the townscape, i.e. the state of an individual area of townscape,
should be described as factually as possible, and a judgement also needs to be
made on the value or importance to society of the affected townscape. The
assessment of townscape importance includes reference to policy or designations
as an indicator of recognised value, including specific features, or characteristics
that justify the designation of the area. This information is needed as part of the
baseline to establish why the townscape is considered to be of value at a national,
regional or local level.
4.6.1.15 The area of study for the visual assessment may extend to the whole of the area
from which the development is visible (the visual envelope).
4.6.1.16 The approximate visibility of a site as existing should be determined through
survey work and the actual extent of visibility checked in the field because of the
localised screening effect of topography, intervening vegetation and built form.
Principal viewpoints within the area surrounding the site are also identified, and
the viewpoints used for photographs selected to demonstrate the relative visibility
of the site (and existing development on it) and its relationship with the
surrounding townscape and built forms. The selection of the key viewpoints
should be based on the following criteria:
The requirement to provide an even spread of representative viewpoints
within the visual envelope, and around all sides of the site.
From locations which represent a range of near, middle and long distance
views.
Whilst private views are relevant, public viewpoints, i.e. from roads and
public rights of way and other areas of open public access, were selected
since they are the most significant in terms of the number of receptors
affected.
Views from sensitive receptors within designated townscapes.
HS2 Technical Study Site 18/Canterbury Works Site R12922T101A
Pell Frischmann Page 40
4.6.1.17 A study was carried out encompassing groups of properties, roads, public rights of
way and public open space that lie within the visual envelope of a site. The term
"properties" includes dwellings, community facilities and places of employment.
The extent of visibility of the site is based on a grading of degrees of visibility, from
a visual inspection of the site and surrounding area. There is, in any visual
assessment, a continuity of degree of visibility ranging from no view of the site to
full open views. To indicate the degree of visibility of the site from any location,
including from roads, railway lines, public rights of way, public open space and
properties, four categories have been used:
No View: truncated / curtailed / no view of the site or the site is difficult to
perceive;
Partial View: a view of part of the site, or a filtered view of the site, or a
distant view where the site is perceived as a small part of the view;
Transient/Glimpsed View: a quickly passing view of part of the site, or a
fleeting view of the site when passing the site at speed, either from vehicle,
public transport, or when walking/cycling; and
Open View: a clear view of a significant proportion of the site within the
wider townscape.
4.6.1.18 The final stage in the field survey was to identify and address specific sensitive
receptors including townscape elements and features that may be directly affected
by the development, as well as residents, visitors and other groups of viewers. In
the case of townscape receptors, the field survey included the recording of
topographic, geological and drainage features, woodland, tree and hedgerow
cover, land use, field boundaries and artefacts, access and rights of way. In the
case of visual receptors, the types of views affected an estimate of their numbers
and whether there were few or many, duration of viewing, and potential seasonal
screening effects was noted.
4.6.1.19 The next stage in the process was the analysis stage which resulted in the
classification of the townscape into distinctive character areas or types, based on
variations in landform and land cover. The classification took into account the
National townscape character assessments. At the same time as carrying out the
townscape character analysis, conclusions were drawn as to the overall sensitivity
of the townscape and visual environment to the type of development envisaged.
The sensitivity of the townscape to change is reflected in the degree to which the
townscape is able to accommodate change (due to a particular development or
land use change) without adverse effects on its character. This may be influenced
by the extent of existing or new landform and/or existing vegetation or new
planting. These and other factors determine the visibility of the proposed
development and therefore influence the extent of its effect on the perceived
character and visual amenity of the surrounding townscape
4.6.1.20 Following a field survey, the extent to which a site is visible from the surrounding
area is graphically represented with reference to a Visual Appraisal Plan which
illustrates the views into / towards the Site and identifies specific elements such as
landform, buildings or vegetation which interrupt, filter or otherwise influence

HS2 Technical Study Site 18/Canterbury Works Site R12922T101A
Pell Frischmann Page 41
views. The locations of principal viewpoints were also mapped and these existing
views are illustrated by annotated photographs (Site Context Photographs). By the
end of this stage of the study, it is possible to advise, in townscape and visual
terms, on a development’s acceptability in principle, and its preferred siting, layout
and design.
Identification and Assessment of Townscape and Visual Effects
4.6.1.21 The assessment of effects aims to:
Identify systematically the likely townscape and visual effects of the
development
Indicate the measures proposed to avoid, reduce, remedy or compensate
for these effects (mitigation measures)
Estimate the magnitude of the effects as accurately as possible;
Provide an assessment of the nature and significance of these effects in a
logical and well-reasoned fashion.
4.6.1.22 Consideration is given to the effects on completion of development at Year 1, and
when the soft townscape proposals are at maturity, so that the residual effects of
the development after mitigation are identified.
Townscape Effects
4.6.1.23 These include the direct and indirect effects of a development on individual
townscape elements and features as well as the effect upon the general
townscape character and quality of the surrounding area. Townscape effects have
been described clearly and objectively, and the extent and duration of any
adverse/beneficial effects quantified, using four categories of effects, indicating a
graduation from high to low (high, medium, low and neutral i.e. no change). Some
effects have been quantified, i.e. how many mature trees are to be lost as a result
of the development proposals, etc. and this type of factual data has the advantage
of helping to put in context the degree of change that will occur.
4.6.1.24 Wider effects on townscape character and quality are less easy to predict
objectively and interpretation and professional judgement will need to be applied.
A clear picture of likely effects is presented by referring back to the baseline
townscape character assessment, and describing how the development may alter
existing patterns of townscape elements and features.
Visual Effects
4.6.1.25 The assessment of visual effects describes:
The changes in the character of the available views resulting from the
development;
The changes in the visual amenity of the visual receptors.
HS2 Technical Study Site 18/Canterbury Works Site R12922T101A
Pell Frischmann Page 42
4.6.1.26 The visual effect of a development on a view will depend upon a number of
factors. These can be summarised as:
the nature of the proposal;
its siting in the townscape;
its size;
its detailed design; and
the position from which it is viewed.
4.6.1.27 The position from which the development is viewed (factor (e) above) has two
components, namely distance and location. Distance is the easier of the two
factors to deal with. In general terms, the greater the distance, the less the effect
will be. This arises from two factors. Firstly, doubling the distance between viewer
and object means it’s perceived effect will be reduced not by a half but by a
quarter. Secondly, in any conditions other than clear visibility, increasing the
distance between object and observer will introduce obscuration from rain, haze,
mist or similar atmospheric effects, thereby further reducing the effect of the
object.
4.6.1.28 The net effect of these factors is that the visual impact of an object will begin to fall
away rapidly with increasing distance. Visibility will reduce substantially beyond
1.5 km (1 mile), and beyond 5 km (3 miles). Binoculars of some other aid to
visibility would probably be necessary in order to perceive any detail of the
proposed development.
4.6.1.29 A visual appraisal systematically identifies all the visual receptors (i.e. all
properties or groups of properties, and users of roads and public rights of way)
that are likely to affected by a development, i.e. within the visual envelope of the
development. The term "properties" includes dwellings, public buildings, places of
employment and recreational facilities. The method seeks to assess the impact of
the development in terms of the degree of change in the view experienced by the
observer. This is not a wholly objective methodology, however the results are
presented in a systematic form allowing an informed judgement to be made of the
impact of the development proposals. In the assessment of views there is likely to
be a continuum in the degree of visibility of a development from Open View to No
View, and in order to assist in the description and comparison of the effect on
views, simplified categories were used which considered:
The extent of the view that would be occupied by the development (degree
of visual intrusion): Full, Partial, Glimpse etc;
The proportion of the development or particular features that would be
visible: Full, Most, Small Amount, None;
The distance of the viewpoint from the development and whether the
viewpoint would focus on the development due to proximity, or the
development would form one element in a panoramic view;
Whether the view is transient or one of a sequence of views, as from a
moving vehicle or footpath.

HS2 Technical Study Site 18/Canterbury Works Site R12922T101A
Pell Frischmann Page 43
4.6.1.30 Changes in visual amenity may arise from both built or engineered forms, and soft
townscape elements of the development. Consideration should also be given to
the seasonal differences in effects arising from the degree of vegetative screening
and/or filtering of views that would apply in summer and winter. Thus assessment
may be provided for "average" and "worst case" situations (the latter being the
season with least leaf cover and therefore minimal vegetative screening).
Sensitivity of Receptors
4.6.1.31 The sensitivity of visual receptors in views will be dependent on:
The location and context of the viewpoint;
The expectations and occupation or activity of the receptor;
The importance of the view (which may be determined with respect to its
popularity or numbers of people affected, its appearance in guide books,
on tourist maps, and in the facilities provided for its enjoyment and
reference to it in literature or art).
4.6.1.32 The most sensitive receptors may include:
Users of all outdoor recreation facilities, including public rights of way,
whose attention or interest may be focused on the townscape;
Communities where the development results in changes in the townscape
setting or value of views enjoyed by the community;
Occupiers of residential properties with views affected by the development
proposals.
4.6.1.33 Other receptors include people engaged in outdoor sport and recreation, people
travelling through or past the affected townscape in cars, on trains or other
transport routes, and people at their place of work. The least sensitive receptors
are likely to be people at their place of work, or engaged in similar activities whose
attention may be focused on their work or activity, and who therefore may be
potentially less susceptible to changes in the view.
Magnitude of Change
4.6.1.34 In the evaluation of the effects on views and the visual amenity of the identified
receptors, the magnitude of scale or visual change is described by reference to:
The scale of change in the view with respect to the loss or addition of
features in the view and changes in its composition;
The degree of contrast or integration of any new features or changes in the
townscape with the existing or remaining townscape elements;
The duration and nature of the effect, whether temporary or permanent,
intermittent or continuous;
The angle of view in relation to the main activity of the receptor;
The distance of the viewpoint from the proposed development;
The extent of the area over which the changes would be visible.

HS2 Technical Study Site 18/Canterbury Works Site R12922T101A
Pell Frischmann Page 44
4.6.1.35 The magnitude of change in the view is assessed in degrees of impact as defined
below:
High: Where the scheme would cause a significant change in the existing
view.
Medium: Where the scheme would cause a noticeable change in the
existing view.
Low: Where the scheme would cause a barely perceptible change in the
existing view.
Neutral: Where the scheme would cause no change in the existing view.
Significance of Effects
4.6.1.36 The two principal criteria determining the significance of effects are the scale or
magnitude of effect, and the environmental sensitivity of the location or receptor. A
higher level of significance is generally attached to large scale effects and effects
on sensitive or high value receptors; thus the small effects on highly sensitive
sites can be more important than large effects on less sensitive sites. It is
therefore important that a balanced and well reasoned judgment of these two
criteria is achieved.
4.6.1.37 In order to develop thresholds of significance, both the sensitivity of receptors and
the magnitude of change must be classified for both townscape receptors and
visual receptors as follows:
Townscape Receptors
Sensitivity Significance Magnitude
Important townscape
components susceptible to small
changes
High Notable change in character over
large area or intensive change
over limited area
Moderately valued townscape
tolerant of change
Medium Moderate change in localised
area
A relatively unimportant
townscape tolerant of change
Low Imperceptible change in
townscape components
Visual Receptors
Sensitivity
Significance Magnitude
Residential Properties, Public
rights of way
High Major change in view for many
viewers

HS2 Technical Study Site 18/Canterbury Works Site R12922T101A
Pell Frischmann Page 45
Sports and Recreational
Facilities
Medium Many viewers but moderate
change. Major change but fewer
viewers
Industry/Work places Low Few viewers affected. Minor
change in view
Significance Thresholds
4.6.1.38 These thresholds will be determined by combining sensitivity and magnitude as
set out below. Numerical scoring is not recommended in the “Guidelines for
Townscape and Visual Impact Assessment”. The main factor in deciding
magnitude will be distance from a development site.
Sensitivity Value of
Receptor
Magnitude of Change
High Medium Low
High Major Major/ Moderate Moderate
Medium Major/
Moderate
Moderate Moderate/
Minor
Low Moderate Moderate/ Minor Minor

HS2 Technical Study Site 18/Canterbury Works Site R12922T101A
Pell Frischmann Page 46
Effects During Construction
4.6.1.39 It is recognised that project characteristics and hence sources of effects, will vary
through time. The construction, operation, decommissioning and restoration
phases of a development are characterised by quite different physical elements
and activities. In the construction phase, sources of townscape and visual effects
include:
Site access and haulage routes
Materials stockpiles and construction compounds.
Construction equipment and plant
Utilities, including lighting
Protection of existing features
Mitigation
4.6.1.40 The purpose of mitigation is to avoid, reduce and where possible remedy or offset,
any significant, negative (adverse) effects on the environment arising from
development proposals. Mitigation is thus not solely concerned with "damage
limitation", but may also consider measures that could compensate for
unavoidable residual effects. Mitigation measures may be considered under two
categories:
Primary measures that intrinsically comprise part of the development
design through an iterative process;
Secondary measures designed to specifically address the remaining
(residual) negative (adverse) effects of the final development proposals.
4.6.1.41 Strategies to address likely negative (adverse) effects include:
Avoid impact by changing form of development;
Reduce impact by changing form of development;
Remediation of impact, (e.g.) by planting to ‘soften’, absorb and assimilate
development into the townscape;
Compensation of impact, (e.g.) by replacing felled trees with new trees,
and
Enhancement, e.g. creation of new townscape or habitat.
4.6.1.42 Guidelines for Mitigation:
All negative (adverse) townscape and visual effects that are likely to occur
throughout the project life cycle should be considered for mitigation,
although the statutory requirement is limited to significant effects;
Consultation with local community and special interest groups on the
proposed mitigation measures is important;
Townscape mitigation measures should be designed to suit the existing
townscape character and needs of the locality, respecting and building on

HS2 Technical Study Site 18/Canterbury Works Site R12922T101A
Pell Frischmann Page 47
local townscape distinctiveness and helping to address any relevant
existing issues in the townscape.
It must be recognised that many mitigation measures, especially planting,
are not immediately effective. Where planting is intended to provide
‘softening’ and assist in ‘visually absorbing’ the development, it may also
be appropriate to assess residual effects for different periods of time, such
as day of opening, Year 1, and at maturity.
The developer should demonstrate a commitment to the implementation of
mitigation measures to agreed programme and budget.
The proposed mitigation measures should address specific issues and
performance standards should be identified for the establishment,
management, maintenance and monitoring of new townscape features.
A programme of appropriate monitoring may be agreed with the regulatory
authority, so that compliance and effectiveness can be readily monitored
and evaluated.
4.6.1.43 Common Mitigation Measures include:
Sensitive location and siting;
Site layout;
Choice of Site level;
Appropriate form, materials and design of buildings. It is not always
practical or desirable to screen buildings. In these cases the scale, design,
colour and texture of building should be carefully considered;
Lighting;
Ground Modelling: for immediate screening effect but may in itself be an
adverse impact unless carefully matched to existing landform;
Planting: Structural planting can help to integrate and soften development
as well as being of potential value as a wildlife habitat; and
Use of camouflage or disguise.
4.6.1.44 Effect of Mitigation on Assessment
4.6.1.45 Where proposed mitigation has the potential to reduce or offset any significant,
negative (adverse) effects on the environment arising from development
proposals this is considered in the assessment and the potential impact after
mitigation explained. The final impact may change over time, for example as
planting becomes established and screen particular views of the site.
Conclusions
4.6.1.46 The conclusion will summarise the Townscape and Visual Impact Assessment
and set out the overall outcome of the assessment, taking into account potential
changes to the site’s context or mitigation.

HS2 Technical Study Site 18/Canterbury Works Site R12922T101A
Pell Frischmann Page 48
4.6.2 Appendix B - Townscape Character Areas

PROJECT
Townscape & Visual Assessment - HS2 Proposals for Brent
TITLE
Character Appraisal Plan - Site 18 & Canterbury Works Site
PROJECT No. DRAWING No. REV SCALE
LHC14033 14033_TVIA_01 - 1:2500 @ A3
DATE AUTHOR / CHECKED
10/06/14 JH PO
CHARACTER APPRAISAL KEY
- Site 18/ Canterbury Works Site Boundaries
- Kilburn Lane & Carlton Vale
- West Kilburn
- Queen’s Park
- Paddington Cemetary
APPENDIX B
Kilburn Lane & Carlton Vale
West Kilburn
Queen’s Park
Paddington Cemetary
Site 18
Canterbury Works Site

HS2 Technical Study Site 18/Canterbury Works Site R12922T101A
Pell Frischmann Page 50
4.6.3 Appendix C – Visual Appraisal Plan – Site 18

PROJECT
Townscape & Visual Assessment - HS2 Proposals for Brent
TITLE
Visual Appraisal Plan - Site 18
PROJECT No. DRAWING No. REV SCALE
LHC14033 14033_TVIA_S01 - 1:2500 @ A3
DATE AUTHOR / CHECKED
10/06/14 JH PO
Recently Completed Development
Site 11b (Under Construction)
Queen’s Park
Railway Station
Potential Location ofHeadhouse Building
VISUAL APPRAISAL KEY
- Site 18 Boundary
- Approximate Location/Size of Ventshaft Building
- Recently Completed Development / Site with Planning Consent for Development
- Key Building
- Listed Building
- Conservation Area
- South Kilburn Regeneration Area (Local Plan Policy CP9)
- Active / Retail Frontage
- Key Trees
- Public views of the Site
- Glimpsed views of the Site
- Transient views of the Site
- Views of the site from Residential Properties
- Existing Buildings which Visually Enclose Site
APPENDIX C

HS2 Technical Study Site 18/Canterbury Works Site R12922T101A
Pell Frischmann Page 52
4.6.4 Appendix D – Photographic Record – Site 18

1
2 SITE 18
PROJECT
Townscape & Visual Assessment - HS2 Proposals for Brent
TITLE
Site 18 - Photographic Viewpoints 1 & 2
PROJECT No. DRAWING No. REV SCALE
LHC14033 14033_TVIA_S02 - N/A
DATE AUTHOR / CHECKED
10/06/14 JH PO
TECHNICAL INFORMATION
DATE TAKEN CAMERA 15th May 2014 Nikon D3100FOCAL LENGTH 35mm (Equivalent to 50mm with 1.5x sensor magnification)
VIEWING DISTANCES
These photographs should be viewed at approx 300mm to visually represent the view seen on site.
VIEWPOINT INFORMATION
1. - Photographic Viewpoint 1 – Claremont RoadThis view is from the eastern end of Claremont Road looking east directly at the site, approximately 20m from the site boundary.
2. - Photographic Viewpoint 2 – Claremont RoadThis photograph has been taken from a point halfway down Claremont Road looking east towards the site, approximately 80m from the site boundary.
Key Plan - (1:5000 Scale)
1
2
APPENDIX D

SITE 18
SITE 18
PROJECT
Townscape & Visual Assessment - HS2 Proposals for Brent
TITLE
Site 18 - Photographic Viewpoints 3 & 4
PROJECT No. DRAWING No. REV SCALE
LHC14033 14033_TVIA_S03 - N/A
DATE AUTHOR / CHECKED
10/06/14 JH PO
TECHNICAL INFORMATION
DATE TAKEN CAMERA 15th May 2014 Nikon D3100FOCAL LENGTH 35mm (Equivalent to 50mm with 1.5x sensor magnification)
VIEWING DISTANCES
These photographs should be viewed at approx 300mm to visually represent the view seen on site.
VIEWPOINT INFORMATION
3. - Photographic Viewpoint 3 – Kilburn LaneLooking eastwards towards the site this view has been taken from Kilburn Lane halfway along the row of local shops, approximately 40m from the site boundary.
4. - Photographic Viewpoint 4 – Portnall RoadLocated at the junction of Portnall Road and Kilburn Road looking north towards the site, approximately 20m from the site boundary.
3
4
Key Plan - (1:5000 Scale)
34
APPENDIX D

SITE 18
SITE 18Key Plan - (1:5000 Scale) 5
6
PROJECT
Townscape & Visual Assessment - HS2 Proposals for Brent
TITLE
Site 18 - Photographic Viewpoints 5 & 6
PROJECT No. DRAWING No. REV SCALE
LHC14033 14033_TVIA_S04 - N/A
DATE AUTHOR / CHECKED
10/06/14 JH PO
TECHNICAL INFORMATION
DATE TAKEN CAMERA 15th May 2014 Nikon D3100FOCAL LENGTH 35mm (Equivalent to 50mm with 1.5x sensor magnification)
VIEWING DISTANCES
These photographs should be viewed at approx 300mm to visually represent the view seen on site.
VIEWPOINT INFORMATION
5. - Photographic Viewpoint 5 – Portnall RoadThe photograph shows the view from the pavement adjacent to 224 Portnall Road looking north towards the site, approximately 80m from the site boundary.
6. - Photographic Viewpoint 6 – St Luke’s Church Centre, Kilburn LaneThis view is taken from the pavement adjacent to St Luke’s Church Centre and looks northwest towards the site, approximately 80m from the site boundary.
5
6
APPENDIX D

SITE 18
SITE 18 SITE 187
8
Key Plan - (1:5000 Scale)
PROJECT
Townscape & Visual Assessment - HS2 Proposals for Brent
TITLE
Site 18 - Photographic Viewpoints 7 & 8
PROJECT No. DRAWING No. REV SCALE
LHC14033 14033_TVIA_S05 - N/A
DATE AUTHOR / CHECKED
10/06/14 JH PO
TECHNICAL INFORMATION
DATE TAKEN CAMERA 15th May 2014 Nikon D3100FOCAL LENGTH 35mm (Equivalent to 50mm with 1.5x sensor magnification)
VIEWING DISTANCES
These photographs should be viewed at approx 300mm to visually represent the view seen on site.
VIEWPOINT INFORMATION
7. - Photographic Viewpoint 7 - Fernhead RoadThe view shows The Falcon public house from the end of Fernhead Road looks north-west along Salusbury Road and Kilburn Lane, approximately 110m from the site boundary
8. - Photographic Viewpoint 8 – Western Court, Salusbury RoadThis photograph has been taken from the centre of the terrace known as Western Court and looks north-westwards along Salusbury Road towards The Falcon PH and the site, approximately 180m from the site boundary.
7
8
APPENDIX D

SITE 18
SITE 189
10
PROJECT
Townscape & Visual Assessment - HS2 Proposals for Brent
TITLE
Site 18 - Photographic Viewpoints 9 & 10
PROJECT No. DRAWING No. REV SCALE
LHC14033 14033_TVIA_S06 - N/A
DATE AUTHOR / CHECKED
10/06/14 JH PO
TECHNICAL INFORMATION
DATE TAKEN CAMERA 15th May 2014 Nikon D3100FOCAL LENGTH 35mm (Equivalent to 50mm with 1.5x sensor magnification)
VIEWING DISTANCES
These photographs should be viewed at approx 300mm to visually represent the view seen on site.
VIEWPOINT INFORMATION
9. - Photographic Viewpoint 9 –Malvern Road/Carlton ValeThe photograph has been taken from the junction of Malvern Road and Carlton Vale (extending from Salusbury Road), approximately 270m from the site boundary.
10. - Photographic Viewpoint 10 - Salusbury RoadPhotograph 10 is located at the railway bridge on Salusbury Road opposite to the entrance to Queens Park Station looking south-west towards the site, approximately 30m from the site boundary
Key Plan - (1:5000 Scale)
9
10
APPENDIX D

SITE 18
SITE 18
11
12
TECHNICAL INFORMATION
DATE TAKEN CAMERA 15th May 2014 Nikon D3100FOCAL LENGTH 35mm (Equivalent to 50mm with 1.5x sensor magnification)
VIEWING DISTANCES
These photographs should be viewed at approx 300mm to visually represent the view seen on site.
VIEWPOINT INFORMATION
11. - Photographic Viewpoint 11 – Salusbury Road/Albert RoadPhotograph 11 is located at the junction of Albert Road and Salusbury Road looking west towards the site, approximately 30m from the site boundary.
12. - Photographic Viewpoint 12 – Salusbury Road/Albert RoadPhotograph 12 is located at the junction of Albert Road and Salusbury Road looking west towards the site, approximately 50m from the site boundary.
PROJECT
Townscape & Visual Assessment - HS2 Proposals for Brent
TITLE
Site 18 - Photographic Viewpoints 11 & 12
PROJECT No. DRAWING No. REV SCALE
LHC14033 14033_TVIA_S07 - N/A
DATE AUTHOR / CHECKED
10/06/14 JH PO
Key Plan - (1:5000 Scale)
11
12
APPENDIX D
SITE 18
SITE 1813
14
Key Plan - (1:5000 Scale)
TECHNICAL INFORMATION
DATE TAKEN CAMERA 15th May 2014 Nikon D3100FOCAL LENGTH 35mm (Equivalent to 50mm with 1.5x sensor magnification)
VIEWING DISTANCES
These photographs should be viewed at approx 300mm to visually represent the view seen on site.
VIEWPOINT INFORMATION
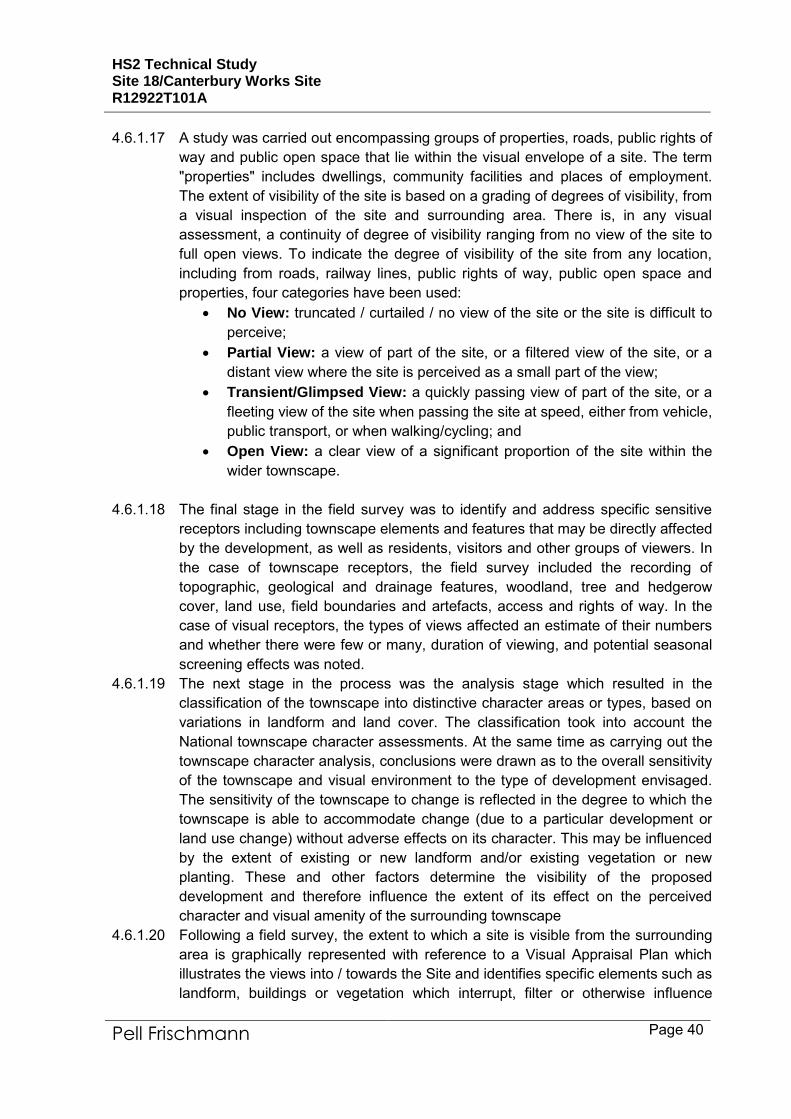
13. - Photographic Viewpoint 13 – Salusbury RoadThis view shows the views from north of Queens Park railway station looking south along Salusbury Road, approximately 170m from the site boundary
14. - Photographic Viewpoint 14 – Queen’s Park StationThe photograph shows the view from the Queen’s Park railway station looking south towards the site.
PROJECT
Townscape & Visual Assessment - HS2 Proposals for Brent
TITLE
Site 18 - Photographic Viewpoints 13 & 14
PROJECT No. DRAWING No. REV SCALE
LHC14033 14033_TVIA_S08 - N/A
DATE AUTHOR / CHECKED
10/06/14 JH PO
13
14
APPENDIX D

HS2 Technical Study Site 18/Canterbury Works Site R12922T101A
Pell Frischmann Page 60
4.6.5 Appendix E – Visual Appraisal Plan – Canterbury Works Site

PROJECT
Townscape & Visual Assessment - HS2 Proposals for Brent
TITLE
Visual Appraisal Plan - Canterbury Works Site
PROJECT No. DRAWING No. REV SCALE
LHC14033 14033_TVIA_C01 - 1:2500 @ A3
DATE AUTHOR / CHECKED
10/06/14 JH PO
St. Mary’s RC
Primary School
Sorting Office
Canterbury Houseencloses the Sitefrom the South
Potential viewsfrom upper storeys
Kilburn Park Station
Carlton Housescreens views from
the west
Potential Location ofHeadhouse Building
APPENDIX E
VISUAL APPRAISAL KEY
- Canterbury Works Boundary
- Approximate Location/Size of Ventshaft Building
- Recently Completed Development / Site with Planning Consent for Development
- Key Building
- Listed Building
- Conservation Area
- South Kilburn Regeneration Area (Local Plan Policy CP9)
- Active / Retail Frontage
- Key Trees
- Public views of the Site
- Glimpsed views of the Site
- Transient views of the Site
- Views of the site from Residential Properties
- Existing Buildings which Visually Enclose Site

HS2 Technical Study Site 18/Canterbury Works Site R12922T101A
Pell Frischmann Page 62
4.6.6 Appendix F - Photographic Record – Canterbury Works Site
CANTERBURY WORKS SITE
15
16
Key Plan - (1:5000 Scale)
TECHNICAL INFORMATION
DATE TAKEN CAMERA 15th May 2014 Nikon D3100FOCAL LENGTH 35mm (Equivalent to 50mm with 1.5x sensor magnification)
VIEWING DISTANCES
These photographs should be viewed at approx 300mm to visually represent the view seen on site.
VIEWPOINT INFORMATION
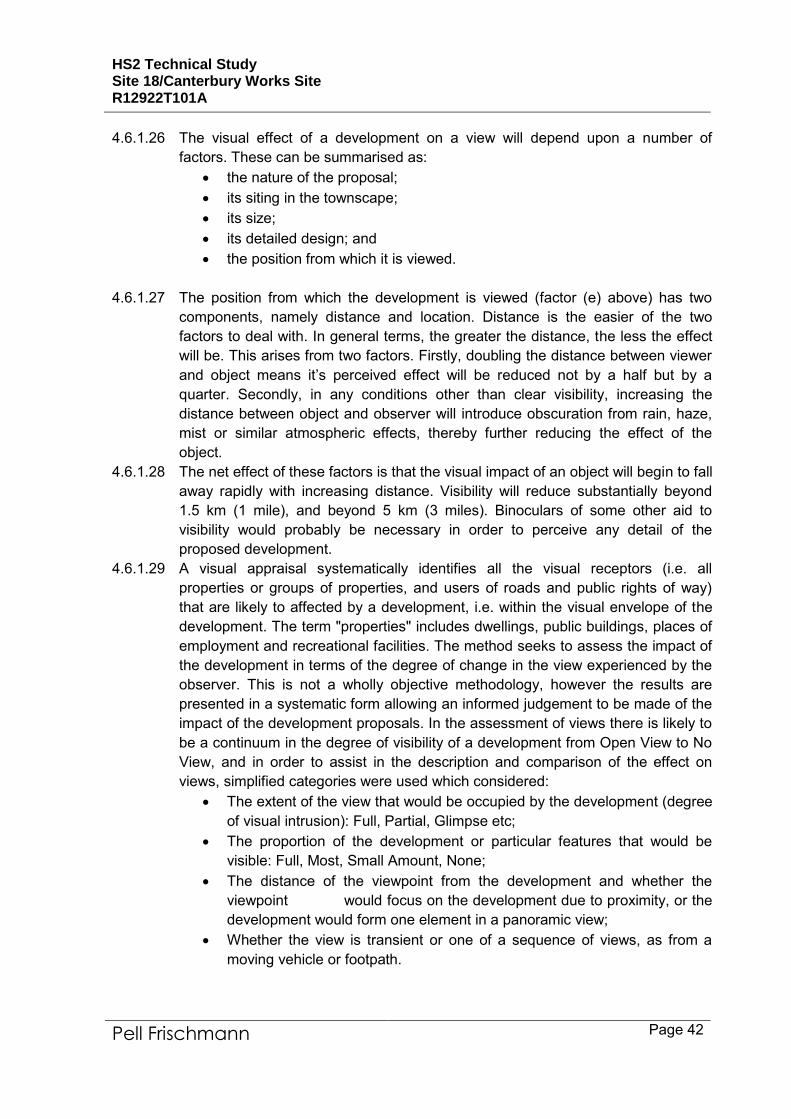
15. - Photographic Viewpoint 15 – Albert RoadThis view is from Albert Road looking east towards the site, approximately 175m from the site boundary.
16. - Photographic Viewpoint 16 – Denmark RoadThis view is from Denmark Road looking east directly towards the site, approximately 115m from the site boundary.
PROJECT
Townscape & Visual Assessment - HS2 Proposals for Brent
TITLE
Canterbury Works Site - Photographic Viewpoints 15 & 16
PROJECT No. DRAWING No. REV SCALE
LHC14033 14033_TVIA_C02 - N/A
DATE AUTHOR / CHECKED
10/06/14 JH PO
15
16
APPENDIX F

CANTERBURY WORKS SITE
17
18
Key Plan - (1:5000 Scale)
TECHNICAL INFORMATION
DATE TAKEN CAMERA 15th May 2014 Nikon D3100FOCAL LENGTH 35mm (Equivalent to 50mm with 1.5x sensor magnification)
VIEWING DISTANCES
These photographs should be viewed at approx 300mm to visually represent the view seen on site.
VIEWPOINT INFORMATION
17. - Photographic Viewpoint 17 – Canterbury RoadThis view is from the junction of Canterbury Road and Canterbury Terrace, looking northeast along Canterbury Road, approximately 20m from the site boundary.
18. - Photographic Viewpoint 18 – Chichester RoadThis view is from western end of Chichester Road, at the junction with Canterbury Road, looking northwards towards Canterbury House and the site, approximately 25m from the site boundary.
PROJECT
Townscape & Visual Assessment - HS2 Proposals for Brent
TITLE
Canterbury Works Site - Photographic Viewpoints 17 & 18
PROJECT No. DRAWING No. REV SCALE
LHC14033 14033_TVIA_C03 - N/A
DATE AUTHOR / CHECKED
10/06/14 JH PO
17 18
APPENDIX F

CANTERBURY WORKS SITE19
20
Key Plan - (1:5000 Scale)
TECHNICAL INFORMATION
DATE TAKEN CAMERA 15th May 2014 Nikon D3100FOCAL LENGTH 35mm (Equivalent to 50mm with 1.5x sensor magnification)
VIEWING DISTANCES
These photographs should be viewed at approx 300mm to visually represent the view seen on site.
VIEWPOINT INFORMATION
19. - Photographic Viewpoint 19 – Canterbury RoadThis view is from Canterbury Road looking directly north towards the site, approximately 10m from the site boundary
20. - Photographic Viewpoint 20 – Cathedral Walk, between Canterbury Road and Coventry Close
This view is from Cathedral Walk, an existing pedestrian route running between Canterbury Road and Coventry Close, approximately 60m from the site boundary looking west towards the site.
PROJECT
Townscape & Visual Assessment - HS2 Proposals for Brent
TITLE
Canterbury Works Site - Photographic Viewpoints 19 & 20
PROJECT No. DRAWING No. REV SCALE
LHC14033 14033_TVIA_C04 - N/A
DATE AUTHOR / CHECKED
10/06/14 JH PO
19
20
APPENDIX F

CANTERBURY WORKS SITE CANTERBURY WORKS SITE
CANTERBURY WORKS SITE
CANTERBURY WORKS SITE
Key Plan - (1:5000 Scale) 21
22 23
TECHNICAL INFORMATION
DATE TAKEN CAMERA 15th May 2014 Nikon D3100FOCAL LENGTH 35mm (Equivalent to 50mm with 1.5x sensor magnification)
VIEWING DISTANCES
These photographs should be viewed at approx 300mm to visually represent the view seen on site.
VIEWPOINT INFORMATION
21. - Photographic Viewpoint 21 – Coventry Close / Junction with Kilburn High RoadThis view is from the junction between Coventry Close and Kilburn High Road, looking west approximately 410m from the site boundary.
22, 23. - Photographic Viewpoint 22 and 23 – Brondesbury VillasThis view is looking southeast from Brondesbury villas close to Fiona Court residential flats, approximately 120m from the site boundary. View 23 illustrates the effect of the railway.
PROJECT
Townscape & Visual Assessment - HS2 Proposals for Brent
TITLE
Canterbury Works Site - Photographic Viewpoints 21, 22 & 23
PROJECT No. DRAWING No. REV SCALE
LHC14033 14033_TVIA_C05 - N/A
DATE AUTHOR / CHECKED
10/06/14 JH PO
22/23
21
APPENDIX F

HS2 Technical Study
Site 18/Canterbury Works Section 5: Air Quality
August 2014
R12922T101-A Submitted by Pell Frischmann

HS2 Technical Study – Section 5: Air Quality Site 18/Canterbury Works Site R12922T101A
Pell Frischmann Page 2
This report is to be regarded as confidential to our Client and it is intended for their use only
and may not be assigned. Consequently and in accordance with current practice, any
liability to any third party in respect of the whole or any part of its contents is hereby
expressly excluded. Before the report or any part of it is reproduced or referred to in any
document, circular or statement and before its contents or the contents of any part of it are
disclosed orally to any third party, our written approval as to the form and context of such a
publication or disclosure must be obtained
Prepared for:
Prepared by:
London Borough of Brent
Brent Civic Centre
Engineers Way
Wembley
HA 0FJ
Pell Frischmann
5 Manchester Square
London
W1U 3PD
REVISION RECORD Report Ref: R12922T101A
Rev Description Date Originator Checked Approved
A First Issue 26th August 2014 L Caird P Outen A Twyford

HS2 Technical Study – Section 5: Air Quality Site 18/Canterbury Works Site R12922T101A
Pell Frischmann Page 3
CONTENTS
5. AIR QUALITY ................................................................................................................ 4 5.1 INTRODUCTION ................................................................................................. 4
5.1.1 Introduction ................................................................................................ 4 5.2 HS2 TECHNICAL REVIEW ................................................................................. 5
5.2.1 Introduction ................................................................................................ 5 5.2.2 Technical Review ....................................................................................... 5
5.3 AIR QUALITY ASSESSMENT ............................................................................. 9 5.3.1 Introduction ................................................................................................ 9 5.3.2 Policy Context and Assessment Criteria .................................................. 12 5.3.3 Assessment Approach ............................................................................. 15 5.3.4 Baseline Conditions ................................................................................. 20 5.3.5 Impact Assessment – Site 18 ................................................................... 29 5.3.6 Impact Assessment – Canterbury Works ................................................. 40 5.3.7 Mitigation .................................................................................................. 51 5.3.8 Conclusions.............................................................................................. 52
5.4 REFERENCES .................................................................................................. 53 5.5 GLOSSARY ....................................................................................................... 55 5.6 APPENDICES ................................................................................................... 57
5.6.1 APPENDIX A - Construction Dust Assessment Procedure ...................... 57 5.6.2 APPENDIX B - Impact Descriptors and Assessment of Significance ...... 65 5.6.3 APPENDIC C - Professional Experience ................................................. 68 5.6.4 APPENDIC D - Modelling Methodology ................................................... 69 5.6.5 APPENDIX E – Construction Mitigation ................................................... 79

HS2 Technical Study – Section 5: Air Quality Site 18/Canterbury Works Site R12922T101A
Pell Frischmann Page 4
5. AIR QUALITY
5.1 INTRODUCTION
5.1.1 Introduction
5.1.1.1 The purpose of this report is to examine the suitability of two prospective locations in
Brent as sites for a High Speed Two (HS2) railway tunnel ventilation and emergency
access shaft, with respect to air quality.
5.1.1.2 The proposed HS2 route involves the construction of a number of sections of tunnel
including a 7.4 km tunnel from Euston, into west London through Brent. The tunnels
require ventilation shafts approximately every 3 km along their length. It is proposed to
install three ventilation shafts along the 7.4 km Euston tunnel section, including one
shaft in Brent. This shaft will also be used for access to the tunnels and as an
evacuation route in the case of emergencies.
5.1.1.3 The HS2 proposals have identified a site for a ventilation shaft and transformer station
(known as “Site 18”) at Salusbury Road, to the South of Queens Park station.
However, Site 18 has existing detailed planning consent for a mixed-use
redevelopment as part of the South Kilburn Regeneration Programme, which Brent
Council consider to be highly important to the regeneration of one of London’s most
deprived areas. Brent Council therefore has objections to the location of a ventilation
shaft and transformer station at Site 18 on socio-economic grounds, and has identified
an alternative site for the ventilation shaft at Canterbury Works site, which lies to the
north of Canterbury Road, approximately 500 m to the east of Queens Park station.
5.1.1.4 Aside from the potential socio-economic benefits of locating the ventilation shaft and
transformer station at Canterbury Works rather than Site 18, it is important to consider
the potential environmental impacts of the construction and operation of the ventilation
shaft at either site. The environmental impacts of the use of Site 18 as a ventilation
shaft, transformer station and construction compound have been considered as part of
the environmental assessment work carried out by the HS2 project team. There is a
need, however, to assess the environmental impacts of the Canterbury Works site, and
provide a comparison against the impacts associated with using Site 18.
5.1.1.5 In terms of air quality, the construction of the shaft will involve the excavation of a large
volume of material which has the potential to lead to dust impacts in the surrounding
area. The construction period, which is anticipated to last for 7 years, will also lead to
an increase in heavy goods vehicle movements on local roads, which may lead to air
quality impacts from increased emissions. The operational air quality impacts of the
ventilation shaft are expected to be insignificant as the shaft will not cause any
emissions to air and will not generate a significant volume of road traffic; only a very
small number of movements for service and maintenance.
5.1.1.6 This report provides a technical review of the air quality assessment work undertaken
in production of the HS2 Environmental Impact Assessment (EIA) to determine
whether the potential air quality impacts of construction of a ventilation shaft at Site 18
have been appropriately assessed. The report then describes the methodology and
findings of an independent air quality assessment for Site 18 and Canterbury Works in
order to identify which site is best suited in terms of air quality as a site for an HS2
ventilation and access shaft.

HS2 Technical Study – Section 5: Air Quality Site 18/Canterbury Works Site R12922T101A
Pell Frischmann Page 5
5.2 HS2 TECHNICAL REVIEW
5.2.1 Introduction
5.2.1.1 This section of the report provides a brief summary and review of the air quality
assessment work completed as part of the HS2 Environmental Impact Assessment
(EIA), which relates to the construction and operation of the ventilation shaft and
transformer at Site 18. The review covers the following key documents and
correspondence:
LB Brent formal response to HS2 Environmental Statement;
HS2 ES Scope and Methodology Report;
HS2 Information Paper D8: Tunnel Shafts and Portals;
HS2 ES Community Forum Area Report; and
HS2 ES Air Quality Data Appendix.
5.2.2 Technical Review
5.2.2.1 LB Brent Response to HS2 Environmental Statement
5.2.2.2 As part of the review of the HS2 ES, Brent Council provided a formal consultation
response which raised a number of queries relating to the treatment of Site 18 within
the ES.
5.2.2.3 Brent Council’s response to the ES describes how Site 18 lies within South Kilburn,
which is among the 10 most deprived areas of the UK. The area is undergoing
significant regeneration under the South Kilburn Regeneration Programme, and as part
of this, detailed planning consent has been granted for a residential-led mixed-use
development at Site 18, which includes 137 apartments, 1,270 sqm of commercial
space (A1/A3/A4) and 959 sqm of office space (for TfL). This redevelopment is seen
as highly important to the regeneration of the area, and as such, Brent Council
expressed its concerns at the lack of consideration of alternatives to Site 18 for an HS2
vent shaft and transformer station.
5.2.2.4 Brent Council considers the assessment of likely significant effects of Site 18
presented within the HS2 ES to be inadequate and incomplete and does not sufficiently
consider alternative sites or mitigation measures.
5.2.2.5 London to West Midlands ES Volume 5 Scope and Methodology Report
5.2.2.6 The London to West Midlands ES Volume 5 Scope and Methodology Report provides
a brief outline of the adopted assessment methodology for each of the HS2 ES chapter
topics, including air quality.
5.2.2.7 The methodology report covers the whole London to Birmingham Phase 1 route and is
therefore fairly high-level. In terms of the assessment of Site 18, the key elements of
the assessment relating to air quality are emissions from construction traffic on site and
on local roads and emissions of dust from construction activities such as vent shaft
excavation. The methodology report makes it clear that emissions from construction
traffic will only be assessed where the volume of traffic movements generated will
exceed 200 movements per day for HGVs and/or an increase in total traffic flows of
more than 1,000 movements per day. This is consistent with DMRB screening criteria

HS2 Technical Study – Section 5: Air Quality Site 18/Canterbury Works Site R12922T101A
Pell Frischmann Page 6
published by the Highways Agency. It is understood that the predicted construction
traffic generation from Site 18 does not exceed these criteria, and therefore the
assessment of significant effects in the HS2 ES does not specifically include the impact
of Site 18 in terms of air quality from construction traffic emissions.
5.2.2.8 In terms of the emissions from construction activities, the methodology report describes
that these activities will be assessed using a risk-assessment methodology published
in guidance by the Institute of Air Quality Management (IAQM). The assessment
provided later in this report follows a recently updated version of the IAQM approach.
5.2.2.9 HS2 Information Paper D8: Tunnel Shafts and Portals
5.2.2.10 The HS2 Information Paper D8: Tunnel Shafts and Portals contains descriptions and
illustrations of the proposed ventilation shafts, their purpose and their design. This
section includes a summary of the pertinent details contained within the D8 information
paper.
5.2.2.11 There will be three tunnel sections on the London to West Midlands HS2 route. These
include a 7.4 km tunnel section from west London through Brent to Euston. The
tunnels require sufficient ventilation, which is to be provided by vent shafts which will
allow: a conduit to enable smoke to escape from the tunnels in the event of fire;
emergency access; and sufficient air flow to ensure a comfortable environment within
the tunnels.
5.2.2.12 The vent shafts will be located approximately every 3 km along all HS2 tunnel sections,
which is designed to be consistent with the ‘tried and tested’ ventilation system
employed on the HS1 tunnels. The 7.4 km Euston tunnel will have three vent shafts
along its length.
5.2.2.13 The vent shafts will operate via the piston effect, by which air will be forced out of the
vent shaft by an approaching train, and air will be drawn back down through the vent
shaft in the wake of a passing train.
5.2.2.14 London to West Midlands ES Volume 2 Community Forum Area Report
5.2.2.15 Description of Construction Works
5.2.2.16 Within the London to West Midlands Environmental Statement Volume 2 Community
Forum Area report for CFA-4 (Kilburn (Brent) to Old Oak Common) paragraphs 2.4.31
to 2.4.36 discuss the construction works that will be undertaken at Site 18.
5.2.2.17 The report outlines the following principal elements of the works that will be undertaken
at Site 18 between 2018 and 2024:
site clearance and enabling works;
building demolition;
vent shaft construction;
vent shaft internal structures civil engineering and building works;
excavation and construction of short connecting tunnels between the vent shaft
and the tunnels;
headhouse construction;
railway systems installation including installation of an auto transformer station
and fit-out of the vent shaft and headhouse; and
landscaping.

HS2 Technical Study – Section 5: Air Quality Site 18/Canterbury Works Site R12922T101A
Pell Frischmann Page 7
5.2.2.18 Construction work on the ventilation shaft will begin in 2018 and run for two and a half
years, followed by a two-year break in activity at Site 18, followed by a final two and a
half years of civil engineering, mechanical and electrical works at the site.
5.2.2.19 The works outlined above have the potential to generate dust and PM10, the potential
impacts of which are considered in the HS2 ES Volume 5, and are independently
assessed in the Air Quality Assessment section of this report.
5.2.2.20 Air Quality
5.2.2.21 The London to West Midlands Environmental Statement Volume 2 Community Forum
Area report for CFA-4 (Kilburn (Brent) to Old Oak Common) also contains a section on
air quality. The section is a summary of the assessment of operational and
construction period air quality impacts of the entire CFA-4 area, and does not provide
sufficient detail to draw any conclusions on the impacts of the vent shaft at Site 18.
5.2.2.22 London to West Midlands ES Volume 5 Air Quality Data Appendix
5.2.2.23 The London to West Midlands ES Volume 5 Technical Appendices includes a data
appendix for air quality for the CFA-4 Kilburn (Brent) to Old Oak Common area
(document ref: AQ-001-004). The data appendix outlines the results of the operational
and construction period air quality assessment in the CFA-4 area.
5.2.2.24 The data appendix covers construction and operation across the whole CFA-4 area
and there is very little assessment of Site 18 in isolation. In terms of construction and
operational road traffic impacts, the traffic generated by Site 18 is included in predicted
traffic generation from all elements of construction and demolition across the CFA-4
area and therefore it is not possible to disseminate the contribution of Site 18 to
predicted increases in roadside pollutant concentrations.
5.2.2.25 In terms of emissions from operational road traffic generation, the air quality
assessment concludes that the impacts range in magnitude from negligible to
moderate adverse, but these impacts are judged to be insignificant at all locations
other than Old Oak Lane, where the authors judge there to be potentially significant air
quality effects (relating to concentrations of nitrogen dioxide). It is unlikely that this will
be predominantly caused by Site 18 operational traffic.
5.2.2.26 In terms of emissions from construction traffic, the air quality assessment concludes
that there is a potential for significant air quality effects relating to concentrations of
nitrogen dioxide at Shaftesbury Gardens, Victoria Terrace, Wales Farm Road, Old Oak
Lane and Edgeware Road. It is unlikely that these will be predominantly caused by Ste
18 construction traffic, but it may be a contributory factor.
5.2.2.27 In terms of the impacts of dust from construction, a qualitative risk assessment
approach has been undertaken, which includes examination of different construction
compounds, including Site 18, individually. The assessment focusses on four separate
elements of construction, which are: demolition, earthworks, construction and trackout.
The assessment has found the impacts of activities at Site 18 to be negligible in terms
of demolition and slight adverse in terms of earthworks, construction and trackout.
These findings are based on the introduction of a suite of recommended mitigation
measures to reduce dust emissions. Overall, the authors conclude that this does not
represent a significant effect.

HS2 Technical Study – Section 5: Air Quality Site 18/Canterbury Works Site R12922T101A
Pell Frischmann Page 8
5.2.2.28 It should be noted that the assessment of impacts from construction dust utilises a
methodology which has recently been updated and superseded. The independent
construction dust assessments for Site 18 and Canterbury Works included later in this
report have been carried out using the updated IAQM methodology.
5.2.2.29 Overall, the environmental assessment work completed in support of the HS2 London
to West Midlands scheme, did not address the air quality impacts of the construction
and operation of a ventilation shaft and auto transformer at Site 18 in a high level of
detail and therefore it is not possible to identify what the specific air quality impacts
would be. The second part of this report outlines the methodology and results of a
detailed air quality assessment for both Site 18 and the alternative proposed site at
Canterbury Works.
HS2 Technical Study – Section 5: Air Quality Site 18/Canterbury Works Site R12922T101A
Pell Frischmann Page 9
5.3 AIR QUALITY ASSESSMENT
5.3.1 Introduction
5.3.1.1 This report describes the potential air quality impacts associated with the construction
and operation of the proposed HS2 railway ventilation shaft and auto transformer
station at two prospective sites in the London Borough of Brent. The prospective sites
are referred to in this assessment as “Site 18” and “Canterbury Works”. The
assessment has been carried out by Air Quality Consultants Ltd on behalf of London
Borough of Brent.
5.3.1.2 The proposed development will consist of the construction and operation of a shaft to
provide ventilation and emergency access to a 7.6 km section of HS2 railway tunnel
between Old Oak Common in Kilburn, west London, and Euston. The chosen site will
also host an auto transformer station which will provide power to a section of the HS2
railway and it’s infrastructure.
5.3.1.3 There is a potential for air quality impacts associated with:
1) emissions of dust and PM10 from excavation and construction of the ventilation
shaft, construction of the transformer, demolition of existing buildings on the
chosen site, on-site earthworks, and the trackout of dust onto the local road
network by construction vehicles;
2) emissions of nitrogen dioxide, PM10 and PM2.5 from construction traffic
movements on the adjacent road network;
3) emissions of nitrogen dioxide, PM10 and PM2.5 from construction traffic and plant
operating on the construction site;
4) emissions of nitrogen dioxide, PM10 and PM2.5 from operational traffic
movements on the adjacent road network; and
5) emissions from the operation of the tunnel ventilation shaft.
5.3.1.4 In terms of emissions from the operation of the ventilation shaft (item 5); the HS2
railway will be electrified and no diesel-powered locomotives will use the Old Oak
Common to Euston HS2 tunnel. Therefore, there will not be any direct emissions from
the ventilation shaft during operation and the air quality impacts have thus not been
assessed.
5.3.1.5 In terms of operational road traffic (item 4), the ventilation shaft and transformer will not
require a significant level of staffing, and therefore operational road traffic movements
are anticipated to be restricted to a very small number of service and maintenance
movements. The air quality impacts associated with these vehicle movements have
not been included in the assessment as they are judged to be insignificant in terms of
air quality.
5.3.1.6 The operation of construction vehicles and plant on the construction site itself (item 3)
is not clearly defined, and is likely to be limited. The emissions from such plant and
vehicle use has not been included in this assessment; however, some basic mitigation
measures relating to the location and use of on-site plant is included in the assessment
of construction activities. The air quality impacts of on-site plant and construction
vehicles is judged to be insignificant with respect to air quality.

HS2 Technical Study – Section 5: Air Quality Site 18/Canterbury Works Site R12922T101A
Pell Frischmann Page 10
5.3.1.7 The assessment set out in this report therefore only includes an assessment of items 1
and 2, relating to emissions of dust and PM10 during construction, and exhaust
emissions from construction traffic on the adjacent road network.
5.3.1.8 The assessment has been prepared taking into account all relevant local and national
guidance and regulations, and follows a methodology agreed with Brent Council.
5.3.1.9 Site 18
5.3.1.10 Site 18 is located adjacent to Salusbury Road, immediately to the south of Queens
Park station. It is bounded by Queens Park station to the north, Salusbury Road to the
east, Claremont Road to the west and Kilburn Lane to the south. Site 18 currently
consists of an existing TfL office and some light industrial buildings.
5.3.1.11 There is existing detailed planning permission for a residential-led, mixed-use
development at Site 18 as part of the South Kilburn Regeneration Programme. Brent
Council regards this site as of importance with respect to regeneration in Kilburn and
oppose the use of the site for an HS2 ventilation shaft and transformer on the basis of
socio-economic considerations. A map showing the location of Site 18 is presented in
Figure 5.1.
Figure 5.1: Site 18 Location
Contains Ordnance Survey data © Crown copyright and database right [2014]
5.3.1.13 Canterbury Works
5.3.1.14 The Canterbury Works site is located adjacent to St Mary’s Roman Catholic Primary
School at Canterbury Road. It is bounded by the school to the east, by the mainline
railway to London Euston to the north, by Canterbury Road to the south and by

HS2 Technical Study – Section 5: Air Quality Site 18/Canterbury Works Site R12922T101A
Pell Frischmann Page 11
residential apartment buildings to the west. The site is currently occupied by an old
office building and some light industrial and commercial buildings.
5.3.1.15 The Canterbury Works site has existing planning permission for a change of use from
office (B1) to residential (C3), granted in November 2013. No construction work on the
site has started to date. The location of the Canterbury Works site is shown in Figure
5.2.
Figure 5.2: Canterbury Works Location
Contains Ordnance Survey data © Crown copyright and database right [2014]

HS2 Technical Study – Section 5: Air Quality Site 18/Canterbury Works Site R12922T101A
Pell Frischmann Page 12
5.3.2 Policy Context and Assessment Criteria
5.3.2.1 Air Quality Strategy
5.3.2.2 The Air Quality Strategy published by the Department for Environment, Food, and
Rural Affairs (Defra) provides the policy framework (Defra, 2007) for air quality
management and assessment in the UK. It provides air quality standards and
objectives for key air pollutants, which are designed to protect human health and the
environment. It also sets out how the different sectors: industry, transport and local
government, can contribute to achieving the air quality objectives. Local authorities are
seen to play a particularly important role. The strategy describes the Local Air Quality
Management (LAQM) regime that has been established, whereby every authority has
to carry out regular reviews and assessments of air quality in its area to identify
whether the objectives have been, or will be, achieved at relevant locations, by the
applicable date. If this is not the case, the authority must declare an Air Quality
Management Area (AQMA), and prepare an action plan which identifies appropriate
measures that will be introduced in pursuit of the objectives.
5.3.2.3 Planning Policy
5.3.2.4 National Policies
5.3.2.5 The National Planning Policy Framework (NPPF) (2012) sets out planning policy for
England in one place. It places a general presumption in favour of sustainable
development, stressing the importance of local development plans, and states that the
planning system should perform an environmental role to minimise pollution. One of
the twelve core planning principles notes that planning should “contribute to…reducing
pollution”. To prevent unacceptable risks from air pollution, planning decisions should
ensure that new development is appropriate for its location. The NPPF states that the
effects of pollution on health and the sensitivity of the area and the development should
be taken into account.
5.3.2.6 More specifically the NPPF makes clear that: “Planning policies should sustain
compliance with and contribute towards EU limit values or national objectives for
pollutants, taking into account the presence of Air Quality Management Areas and the
cumulative impacts on air quality from individual sites in local areas. Planning
decisions should ensure that any new development in Air Quality Management Areas
is consistent with the local air quality action plan.”.
5.3.2.7 The NPPF is now supported by Planning Practice Guidance (PPG) (DCLG, 2014),
which includes guiding principles on how planning can take account of the impacts of
new development on air quality. The PPG states that “Defra carries out an annual
national assessment of air quality using modelling and monitoring to determine
compliance with EU Limit Values.” and “It is important that the potential impact of new
development on air quality is taken into account … where the national assessment
indicates that relevant limits have been exceeded or are near the limit”. The role of the
local authorities is covered by the LAQM regime, with the PPG stating that local
authority Air Quality Action Plans “identify measures that will be introduced in pursuit of
the objectives”.
5.3.2.8 The PPG states that “Whether or not air quality is relevant to a planning decision will
depend on the proposed development and its location. Concerns could arise if the

HS2 Technical Study – Section 5: Air Quality Site 18/Canterbury Works Site R12922T101A
Pell Frischmann Page 13
development is likely to generate air quality impact in an area where air quality is
known to be poor. They could also arise where the development is likely to adversely
impact upon the implementation of air quality strategies and action plans and/or, in
particular, lead to a breach of EU legislation (including that applicable to wildlife)”.
5.3.2.9 The PPG sets out the information that may be required in an air quality assessment,
making clear that “Assessments should be proportional to the nature and scale of
development proposed and the level of concern about air quality”. It also provides
guidance on options for mitigating air quality impacts, as well as examples of the types
of measures to be considered. It makes clear that “Mitigation options where
necessary, will depend on the proposed development and should be proportionate to
the likely impact”.
5.3.2.10 Air Quality Action Plan
5.3.2.11 The LB of Brent has declared an AQMA for nitrogen dioxide and PM10 that covers the
south of the borough and the major roads in the north. The Council has since
developed an Air Quality Action Plan (LB of Brent, 2005). This sets out a number of
measures to reduce the impact of emissions from vehicles within the borough.
5.3.2.12 Assessment Criteria
5.3.2.13 Health Criteria
5.3.2.14 The Government has established a set of air quality standards and objectives to
protect human health. The ‘standards’ are set as concentrations below which effects
are unlikely even in sensitive population groups, or below which risks to public health
would be exceedingly small. They are based purely upon the scientific and medical
evidence of the effects of an individual pollutant. The ‘objectives’ set out the extent to
which the Government expects the standards to be achieved by a certain date. They
take account of economic efficiency, practicability, technical feasibility and timescale.
The objectives for use by local authorities are prescribed within the Air Quality
(England) Regulations, 2000, Statutory Instrument 928 (2000) and the Air Quality
(England) (Amendment) Regulations 2002, Statutory Instrument 3043 (2002).
5.3.2.15 The objectives for nitrogen dioxide and PM10 were to have been achieved by 2005 and
2004 respectively, and continue to apply in all future years thereafter. The PM2.5
objective is to be achieved by 2020. Measurements across the UK have shown that
the 1-hour nitrogen dioxide objective is unlikely to be exceeded where the annual mean
concentration is below 60 g/m3 (Defra, 2009).
5.3.2.16 The European Union has also set limit values for nitrogen dioxide, PM10 and PM2.5.
Achievement of these values is a national obligation rather than a local one (Directive
2008/50/EC of the European Parliament and of the Council, 2008). The limit values for
nitrogen dioxide are the same levels as the UK objectives, but applied from 2010 (The
Air Quality Standards Regulations (No. 1001), 2010). The limit values for PM10 and
PM2.5 are also the same level as the UK statutory objectives, but applied from 2005 for
PM10 and will apply from 2015 for PM2.5.
5.3.2.17 The relevant air quality criteria for this assessment are provided in Table 5.1.

HS2 Technical Study – Section 5: Air Quality Site 18/Canterbury Works Site R12922T101A
Pell Frischmann Page 14
Table 5.1: Air Quality Criteria for Nitrogen Dioxide, PM10 and PM2.5
Pollutant Time Period Objective
Nitrogen
Dioxide
1-hour Mean 200 g/m3 not to be exceeded more than 18 times a
year
Annual Mean 40 g/m3
Fine
Particles
(PM10)
24-hour Mean 50 g/m3 not to be exceeded more than 35 times a
year
Annual Mean 40 g/m3
Fine
Particles
(PM2.5) a
Annual Mean 25 µg/m3
a The PM2.5 objective, which is to be met by 2020, is not in Regulations and there is no
requirement for local authorities to meet it.
5.3.2.18 Construction Dust Criteria 5.3.2.19 There are no formal assessment criteria for dust. In the absence of formal criteria, the
approach developed by the Institute of Air Quality Management (IAQM) (2014) has been used. Full details of this approach are provided in Appendix A.
5.3.2.20 Descriptors for Air Quality Impacts and Assessment of Significance
5.3.2.21 Construction Dust Significance
5.3.2.22 Guidance from the IAQM (Institute of Air Quality Management, 2014) is that, with
appropriate mitigation in place, the impacts of construction dust will not be significant.
The assessment thus focuses on determining the appropriate level of mitigation so as
to ensure that impacts will normally not be significant.
5.3.2.23 Construction Traffic Significance
5.3.2.24 There is no official guidance in the UK on how to describe air quality impacts, nor how
to assess their significance. The approach developed by the IAQM1 (Institute of Air
Quality Management, 2009), and incorporated in Environmental Protection UK’s
(EPUK’s) guidance document on planning and air quality (Environmental Protection
UK, 2010), has therefore been used. This approach includes elements of professional
judgement. Full details of this approach are provided in Appendix B, with the
professional experience of the consultants preparing the report set out in Appendix C.
1 The IAQM is the professional body for air quality practitioners in the UK.

HS2 Technical Study – Section 5: Air Quality Site 18/Canterbury Works Site R12922T101A
Pell Frischmann Page 15
5.3.3 Assessment Approach
5.3.3.1 Consultation
5.3.3.2 The assessment follows a methodology agreed with Brent Council via a telephone
discussion and email correspondence between Jennifer Barrett (Brent Council) and
Laurence Caird (Air Quality Consultants) held on in June/July 2014.
5.3.3.3 Existing Conditions
5.3.3.4 Existing sources of emissions within the study area have been defined using a number
of approaches. A site visit has been carried out to identify existing sources from a
visual inspection of the area. Industrial and waste management sources that may
affect baseline air quality in the area have been identified using Defra’s Pollutant
Release and Transfer Register (Defra, 2014d) and the Environment Agency’s website
‘what’s in your backyard’ (Environment Agency, 2014). Local sources have also been
identified through examination of the Council’s Air Quality Review and Assessment
reports.
5.3.3.5 Information on existing air quality has been obtained by collating the results of
monitoring carried out by the local authority. The background concentrations across
the study area have been defined using the national pollution maps published by Defra
(2014a). These cover the whole country on a 1x1 km grid.
5.3.3.6 Construction Dust Impacts
5.3.3.7 The assessment of dust and PM10 from construction activities considers the potential
for impacts within 350 m of the site boundary; or within 50 m of roads used by
construction vehicles. The assessment methodology is that provided by the IAQM
(Institute of Air Quality Management, 2014). This is based around a sequence of
steps. Step 1 is a basic screening stage, to determine whether the more detailed
assessment provided in Step 2 is required. Step 2a determines the potential for dust to
be raised from on-site works and by vehicles leaving the site. Step 2b defines the
sensitivity of the area to any dust that may be raised. Step 2c combines the
information from Steps 2a and 2b to determine the risk of dust impacts without
appropriate mitigation. Step 3 uses this information to determine the appropriate level
of mitigation required to ensure that there should be no significant impacts.
5.3.3.8 It should be noted that the IAQM methodology described above is an updated version
of the methodology used by the HS2 consultancy team to assess the impacts of
construction activities across the London to West Midlands HS2 route. Appendix A
explains the approach in more detail.
5.3.3.9 Construction Traffic Impacts
5.3.3.10 The assessment of air quality impacts from construction traffic exhaust emissions
utilises a detailed dispersion modelling methodology, which is described in this section
of the report, with further details provided in Appendix D.
5.3.3.11 Study Area
5.3.3.12 Site 18 and Canterbury Works are both located within 500 m of each other, and as
such the assessment has focussed upon the same study area for both sites.

HS2 Technical Study – Section 5: Air Quality Site 18/Canterbury Works Site R12922T101A
Pell Frischmann Page 16
Construction traffic is anticipated to have the same origin and destination regardless of
which site is chosen for the ventilation shaft, and therefore the same roads are
expected to be affected by changes in traffic. The exception to this is Albert Road,
Canterbury Terrace and Canterbury Road, which will only be affected by construction
traffic if Canterbury Works becomes the chosen site. The assessment study area is
outlined in Figure D.1.
5.3.3.13 Sensitive Locations
5.3.3.14 Concentrations of nitrogen dioxide, PM10 and PM2.5 have been predicted at a number of
locations close to roads that will be used by construction traffic to access the Site 18
and/or Canterbury Works sites. Receptors have been identified to represent worst-case
exposure within these locations. When selecting these receptors, particular attention
has been paid to assessing impacts close to junctions, where traffic may become
congested, and where there is a combined effect of several road links. The receptors
have been located on the façades of the properties closest to the sources.
5.3.3.15 A total of 40 existing residential properties have been identified as receptors for the
assessment. These locations are described in Table 5.2 and shown in Figure 5.3.
5.3.3.16 It has been assumed that all construction traffic will access the sites via either
Salusbury Road or Kilburn Lane (plus Albert Road and Canterbury Road for the
Canterbury Works site). Beyond this, the origin and destination of construction
vehicles is not known and therefore the assessment does not examine a wider study
area.
5.3.3.17 In addition, concentrations have been modelled at the diffusion tube monitoring sites
located at Kilburn Park Road and Chamberlayne Road in order to verify the modelled
results (see Appendix D for verification method).

HS2 Technical Study – Section 5: Air Quality Site 18/Canterbury Works Site R12922T101A
Pell Frischmann Page 17
Table 5.2: Sensitive Receptor Locations a
Receptor Grid Reference
(X,Y)
Description
Receptor 1 525141,183323 St Mary’s Primary School
Receptor 2 525169,183273 Cathedral Walk
Receptor 3 525152,183256 111a Canterbury Road
Receptor 4 525105,183208 103 Canterbury Road
Receptor 5 525096,183229 Carlton House 1-8
Receptor 6 525078,183211 Carlton House 65-72
Receptor 7 525042,183288 Carlton House 25-32
Receptor 8 525035,183256 Carlton House 41-48
Receptor 9 524995,183277 Carlton House 57-64
Receptor 10 524965,183275 Albert Road Apartment
Receptor 11 524908,183246 Albert Road Apartment
Receptor 12 524935,183242 Denmark Road Apartment
Receptor 13 524867,183232 Albert Road Apartment
Receptor 14 524808,183200 Albert Road Apartment
Receptor 15 524772,183167 1 Albert Road
Receptor 16 524722,183142 William Dunbar House
Receptor 17 524724,183119 William Dunbar House
Receptor 18 524648,183075 346A Kilburn Lane
Receptor 19 524533,183092 289 Kilburn Lane
Receptor 20 524441,183059 282 Kilburn Road
Receptor 21 524382,183066 251 Kilburn Lane
Receptor 22 524265,182998 238 Kilburn Lane
Receptor 23 524092,182956 147 Kilburn Lane
Receptor 24 524040,182934 164 Kilburn Lane
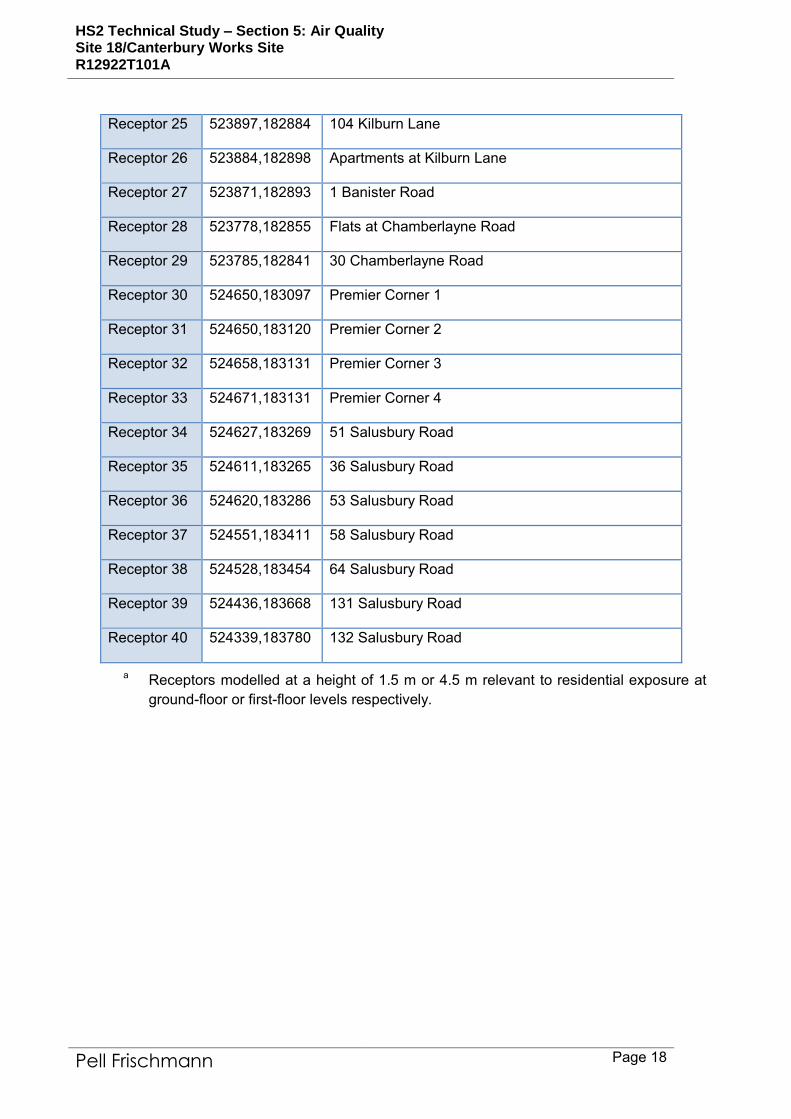
HS2 Technical Study – Section 5: Air Quality Site 18/Canterbury Works Site R12922T101A
Pell Frischmann Page 18
Receptor 25 523897,182884 104 Kilburn Lane
Receptor 26 523884,182898 Apartments at Kilburn Lane
Receptor 27 523871,182893 1 Banister Road
Receptor 28 523778,182855 Flats at Chamberlayne Road
Receptor 29 523785,182841 30 Chamberlayne Road
Receptor 30 524650,183097 Premier Corner 1
Receptor 31 524650,183120 Premier Corner 2
Receptor 32 524658,183131 Premier Corner 3
Receptor 33 524671,183131 Premier Corner 4
Receptor 34 524627,183269 51 Salusbury Road
Receptor 35 524611,183265 36 Salusbury Road
Receptor 36 524620,183286 53 Salusbury Road
Receptor 37 524551,183411 58 Salusbury Road
Receptor 38 524528,183454 64 Salusbury Road
Receptor 39 524436,183668 131 Salusbury Road
Receptor 40 524339,183780 132 Salusbury Road
a Receptors modelled at a height of 1.5 m or 4.5 m relevant to residential exposure at
ground-floor or first-floor levels respectively.

HS2 Technical Study – Section 5: Air Quality Site 18/Canterbury Works Site R12922T101A
Pell Frischmann Page 19
Figure 5.3: Receptor Locations
Contains Ordnance Survey data © Crown copyright and database right [2014]

HS2 Technical Study – Section 5: Air Quality Site 18/Canterbury Works Site R12922T101A
Pell Frischmann Page 20
5.3.3.18 Assessment Scenarios
5.3.3.19 Predictions of nitrogen dioxide, PM10 and PM2.5 concentrations have been carried out
for a base year (2013), and the proposed year of commencement of construction
(2018). For 2018, a sensitivity test has been carried out for nitrogen dioxide that
involves assuming no reduction in emission factors for road traffic from the baseline
year. This is to address the issue identified by Defra (Carslaw, Beevers,
Westmoreland, & Williams, 2011) that road traffic emissions have not been declining
as expected (see later section on uncertainty). Nitrogen dioxide concentrations in 2018
with and without the scheme are thus presented for two scenarios: ‘With Emissions
Reduction’ and ‘Without Emissions Reduction’.
5.3.3.20 It is currently expected that road traffic emissions and background pollutant
concentrations will decrease year on year in the future due to improvements in vehicle
emissions technologies and reductions in pollutant emissions across other sectors
such as industry, shipping and rail. The assessment of the proposed year of
commencement of construction ought to therefore represent a worst-case assessment
and will be used as an indicator for potential air quality impacts in all subsequent years
of construction (the construction period is predicted to last 7 years).
5.3.3.21 Modelling Methodology
5.3.3.22 Concentrations have been predicted using the ADMS-Roads dispersion model. Details
of the model inputs and the model verification are provided in Appendix D, together
with the method used to derive background nitrogen dioxide concentrations.
5.3.4 Baseline Conditions
5.3.4.1 Industrial sources
5.3.4.2 A search of the UK Pollutant Release and Transfer Register (Defra, 2014d) and
Environment Agency’s ‘what’s in your backyard’ (Environment Agency, 2014) websites
did not identify any significant industrial or waste management sources that are likely to
affect the proposed development, in terms of air quality.
5.3.4.3 Site Visit
5.3.4.4 A site visit was carried out on 6th June 2014. Other than road traffic, no significant
sources of air pollution were identified during the site visit.
5.3.4.5 Air Quality Review and Assessment
5.3.4.6 The London Borough of Brent has investigated air quality within its area as part of its
responsibilities under the LAQM regime. In April 2001, the Council declared an Air
Quality Management Area (AQMA) in respect of potential exceedences of the annual
mean objective for nitrogen dioxide and the daily mean objective for PM10. The AQMA
was later extended in 2006, and the boundary now includes the southern half of the
Borough, and corridors to the north along the A404, A4140, A4006 and A5. The Site
18 and Canterbury Works sites are both located within the designated AQMA. The
Updating and Screening Assessment undertaken by the Council in 2012 identified
measured exceedences outside the designated AQMA at Harrow Road and at the

HS2 Technical Study – Section 5: Air Quality Site 18/Canterbury Works Site R12922T101A
Pell Frischmann Page 21
junction of Shaftesbury Avenue and Woodcock Hill and recommended that a detailed
assessment should be undertaken in these locations.
5.3.4.7 Local Air Quality Monitoring
5.3.4.8 The London Borough of Brent operates three automatic monitoring stations within its
area. None of these are in close proximity to Site 18 or the Canterbury Works. The
Council did, however, operate an automatic monitoring station at St Mary’s Primary
School, adjacent to the Canterbury Works site. The St Mary’s Primary School station
was decommissioned at the start of 2011. The Council also operates a number of
nitrogen dioxide monitoring sites using diffusion tubes prepared and analysed by
Gradko International Ltd (using the 50% TEA in acetone method). These include three
tubes deployed near to Site 18 and Canterbury Works, at Kilburn Park Road,
Chamberlayne Road and Kilburn Bridge. Results for the years 2008 to 2013 are
summarised in Table 5.3 and the monitoring locations are shown in Figure 5.4.
Table 5.3:Summary of Nitrogen Dioxide (NO2) Monitoring (2008-2013) a
Site
No.
Site Type Location 2008 2009 2010 2011 2012 2013
Automatic Monitor - Annual Mean (µg/m3)
Urban
Background
St Mary’s
Primary School
34.8 35.8 35.3 - - -
Objective 40
Automatic Monitor - No. of Hours > 200 µg/m3
Urban
Background
St Mary’s
Primary School
0 4 0 - - -
Objective 18
Diffusion Tubes - Annual Mean (µg/m3) b
BRT48 Roadside Kilburn Park Rd
near junction
with Shirland
Rd
82.2 74.0 65.7 69.3 76.6 70.5
BRT56 Roadside Chamberlayne
Road
78.3 70.3 62.5 66.5 75.2 70.1
BRT57 Roadside Kilburn Bridge 119.3 84.2 76.3 81.6 100.8 88.0
Objective 40
a Exceedences of the objectives are shown in bold
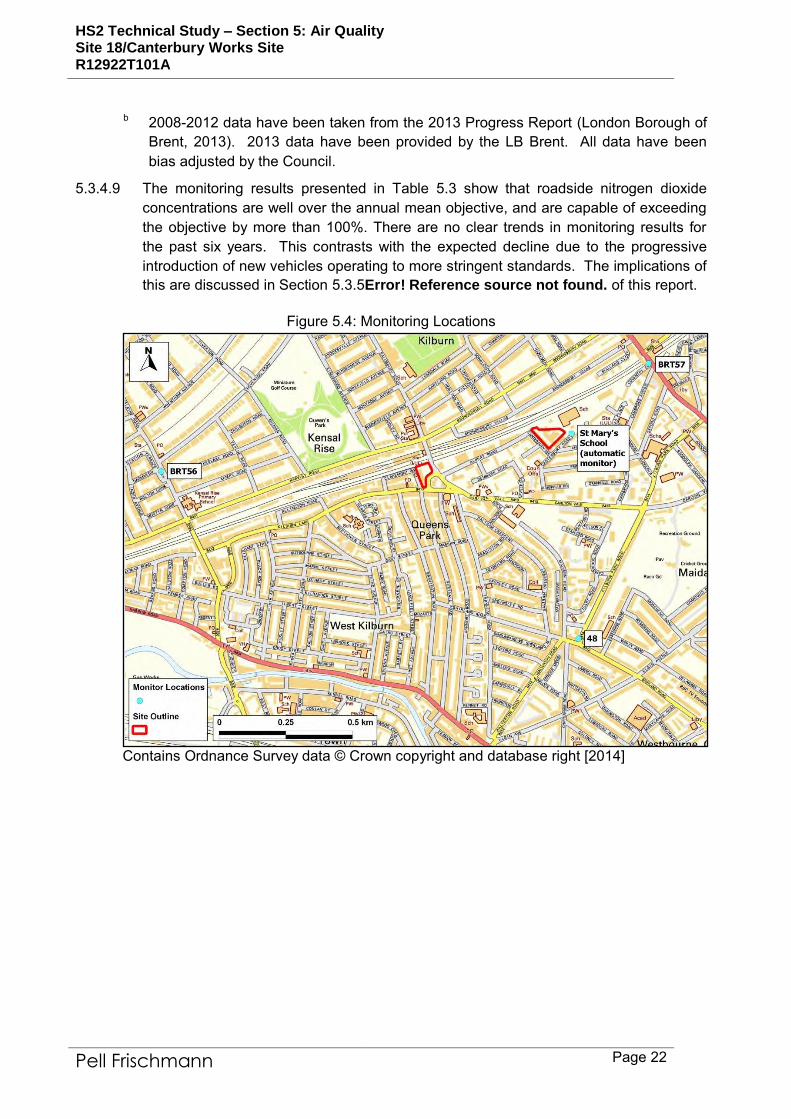
HS2 Technical Study – Section 5: Air Quality Site 18/Canterbury Works Site R12922T101A
Pell Frischmann Page 22
b 2008-2012 data have been taken from the 2013 Progress Report (London Borough of
Brent, 2013). 2013 data have been provided by the LB Brent. All data have been
bias adjusted by the Council.
5.3.4.9 The monitoring results presented in Table 5.3 show that roadside nitrogen dioxide
concentrations are well over the annual mean objective, and are capable of exceeding
the objective by more than 100%. There are no clear trends in monitoring results for
the past six years. This contrasts with the expected decline due to the progressive
introduction of new vehicles operating to more stringent standards. The implications of
this are discussed in Section 5.3.5Error! Reference source not found. of this report.
Figure 5.4: Monitoring Locations
Contains Ordnance Survey data © Crown copyright and database right [2014]
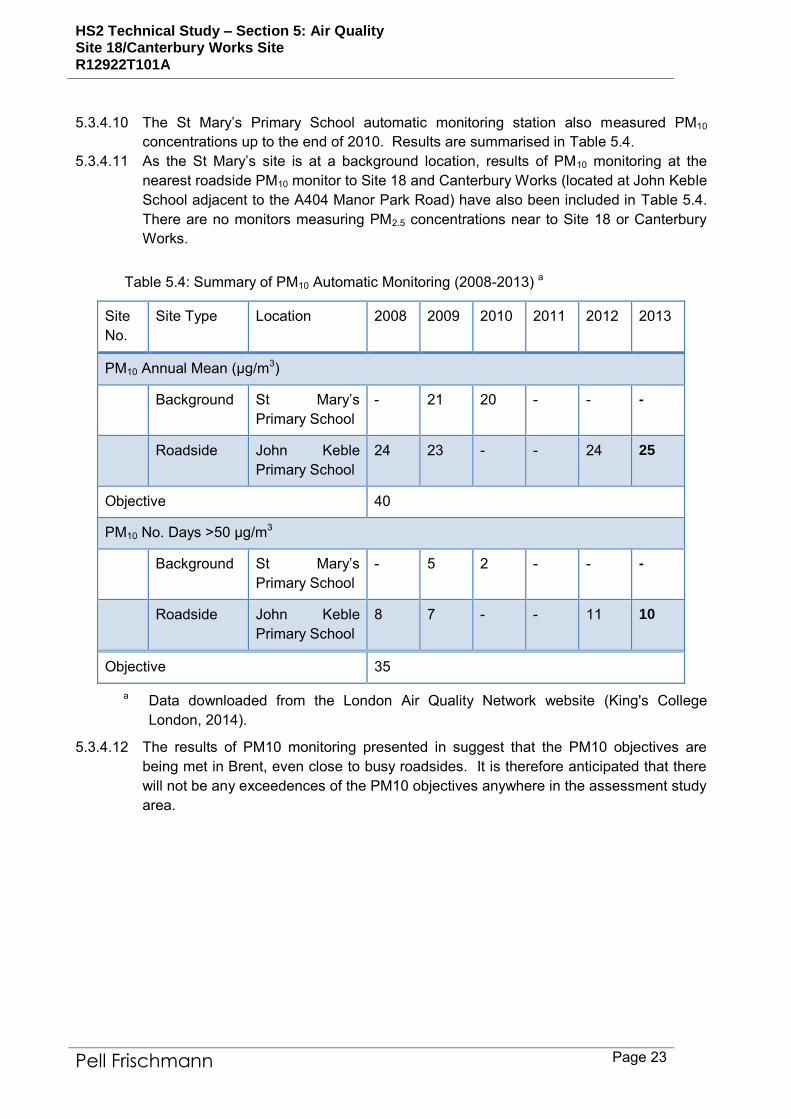
HS2 Technical Study – Section 5: Air Quality Site 18/Canterbury Works Site R12922T101A
Pell Frischmann Page 23
5.3.4.10 The St Mary’s Primary School automatic monitoring station also measured PM10
concentrations up to the end of 2010. Results are summarised in Table 5.4.
5.3.4.11 As the St Mary’s site is at a background location, results of PM10 monitoring at the
nearest roadside PM10 monitor to Site 18 and Canterbury Works (located at John Keble
School adjacent to the A404 Manor Park Road) have also been included in Table 5.4.
There are no monitors measuring PM2.5 concentrations near to Site 18 or Canterbury
Works.
Table 5.4: Summary of PM10 Automatic Monitoring (2008-2013) a
Site
No.
Site Type Location 2008 2009 2010 2011 2012 2013
PM10 Annual Mean (µg/m3)
Background St Mary’s
Primary School
- 21 20 - - -
Roadside John Keble
Primary School
24 23 - - 24 25
Objective 40
PM10 No. Days >50 µg/m3
Background St Mary’s
Primary School
- 5 2 - - -
Roadside John Keble
Primary School
8 7 - - 11 10
Objective 35
a Data downloaded from the London Air Quality Network website (King's College
London, 2014).
5.3.4.12 The results of PM10 monitoring presented in suggest that the PM10 objectives are
being met in Brent, even close to busy roadsides. It is therefore anticipated that there
will not be any exceedences of the PM10 objectives anywhere in the assessment study
area.

HS2 Technical Study – Section 5: Air Quality Site 18/Canterbury Works Site R12922T101A
Pell Frischmann Page 24
5.3.4.13 Background Concentrations
5.3.4.14 National Background Pollution Maps
5.3.4.15 In addition to these locally measured concentrations, estimated background
concentrations in the study area have been determined for 2012 and the opening year
2018 (Table 5.5). In the case of nitrogen oxides and nitrogen dioxide, two sets of
future-year backgrounds are presented to take into account uncertainty in future year
vehicle emission factors. The derivation of background concentrations is described in
Appendix D. The background concentrations are all below the objectives.
5.3.4.16 It should be noted that the mapped background nitrogen dioxide and PM10
concentrations are broadly consistent with the measured concentrations at St Mary’s
Primary School as presented in Table 5.3 and Table 5.4.
Table 5.5: Estimated Annual Mean Background Pollutant Concentrations in 2013 and
2018 (µg/m3)
Year NOx NO2 PM10 PM2.5
2013 a 64.0 –
70.7
34.9 –
37.7
19.8 –
20.7
14.0 –
14.5
2018 – Without Reductions in
Traffic Emissions b
59.9 –
66.6
33.3 –
36.1
n/a n/a
2018 – With Reductions in Traffic
Emissions c
51.6 –
56.3
29.4 –
31.5
18.8 –
19.6
12.9 –
13.4
Objectives - 40 40 25
n/a = not applicable
a This assumes that road vehicle emission factors in 2013 remain the same as in 2010
(See Appendix D).
b This assumes that road vehicle emission factors in 2018 remain the same as in 2010.
c This assumes that road vehicle emission factors reduce between 2013 and 2018 at
the current ‘official’ rates.
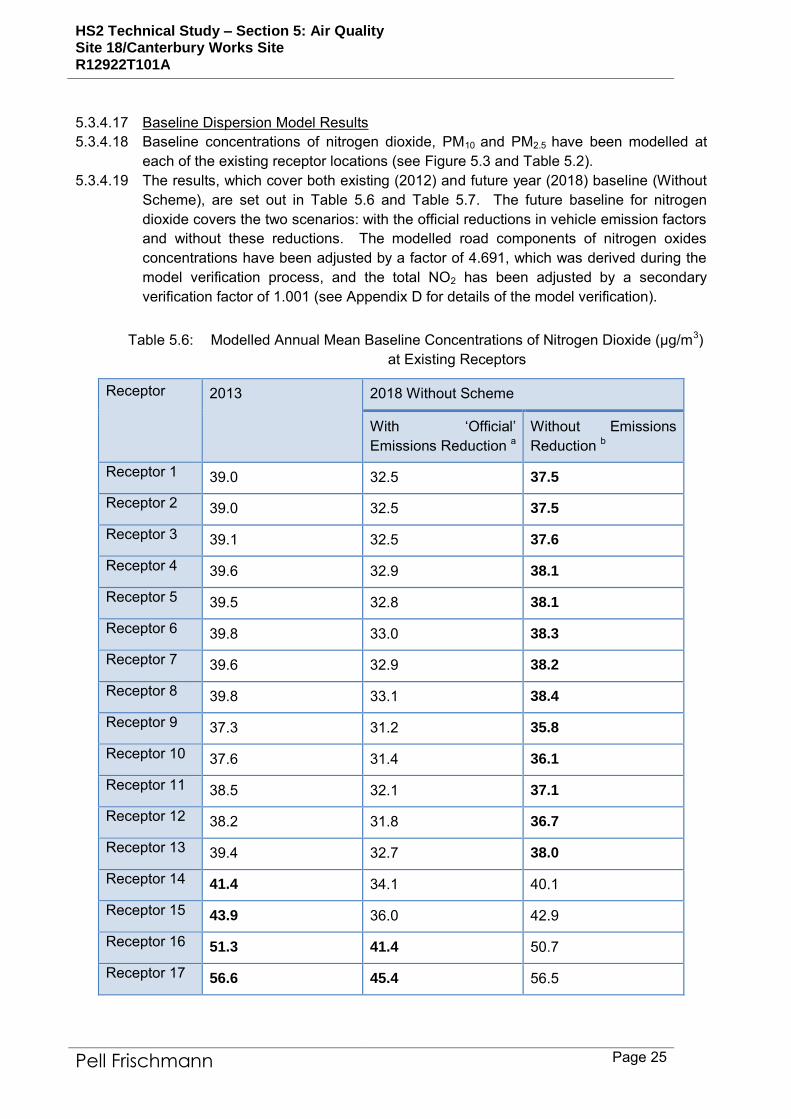
HS2 Technical Study – Section 5: Air Quality Site 18/Canterbury Works Site R12922T101A
Pell Frischmann Page 25
5.3.4.17 Baseline Dispersion Model Results
5.3.4.18 Baseline concentrations of nitrogen dioxide, PM10 and PM2.5 have been modelled at
each of the existing receptor locations (see Figure 5.3 and Table 5.2).
5.3.4.19 The results, which cover both existing (2012) and future year (2018) baseline (Without
Scheme), are set out in Table 5.6 and Table 5.7. The future baseline for nitrogen
dioxide covers the two scenarios: with the official reductions in vehicle emission factors
and without these reductions. The modelled road components of nitrogen oxides
concentrations have been adjusted by a factor of 4.691, which was derived during the
model verification process, and the total NO2 has been adjusted by a secondary
verification factor of 1.001 (see Appendix D for details of the model verification).
Table 5.6: Modelled Annual Mean Baseline Concentrations of Nitrogen Dioxide (µg/m3)
at Existing Receptors
Receptor 2013 2018 Without Scheme
With ‘Official’
Emissions Reduction a
Without Emissions
Reduction b
Receptor 1 39.0 32.5 37.5
Receptor 2 39.0 32.5 37.5
Receptor 3 39.1 32.5 37.6
Receptor 4 39.6 32.9 38.1
Receptor 5 39.5 32.8 38.1
Receptor 6 39.8 33.0 38.3
Receptor 7 39.6 32.9 38.2
Receptor 8 39.8 33.1 38.4
Receptor 9 37.3 31.2 35.8
Receptor 10 37.6 31.4 36.1
Receptor 11 38.5 32.1 37.1
Receptor 12 38.2 31.8 36.7
Receptor 13 39.4 32.7 38.0
Receptor 14 41.4 34.1 40.1
Receptor 15 43.9 36.0 42.9
Receptor 16 51.3 41.4 50.7
Receptor 17 56.6 45.4 56.5

HS2 Technical Study – Section 5: Air Quality Site 18/Canterbury Works Site R12922T101A
Pell Frischmann Page 26
Receptor 18 61.2 48.6 61.7
Receptor 19 43.4 35.5 42.5
Receptor 20 41.4 34.0 40.3
Receptor 21 58.0 45.6 58.5
Receptor 22 61.5 48.0 62.0
Receptor 23 58.9 45.8 59.2
Receptor 24 77.6 59.7 79.4
Receptor 25 68.5 54.0 69.5
Receptor 26 52.4 41.9 52.2
Receptor 27 58.1 46.1 58.5
Receptor 28 84.7 66.7 86.6
Receptor 29 53.3 43.0 53.1
Receptor 30 75.6 59.3 77.1
Receptor 31 71.4 56.6 72.4
Receptor 32 78.8 62.7 79.7
Receptor 33 77.4 61.5 78.3
Receptor 34 68.9 56.2 68.3
Receptor 35 65.1 53.1 64.4
Receptor 36 75.1 61.2 74.7
Receptor 37 65.0 53.1 64.4
Receptor 38 58.3 47.6 57.5
Receptor 39 51.6 42.1 50.6
Receptor 40 49.5 40.4 48.5
Objective 40
a This assumes that road vehicle emission factors reduce between 2013 and 2018 at
the current ‘official’ rates.
b This assumes that road vehicle emission factors in 2018 remain the same as in 2013.

HS2 Technical Study – Section 5: Air Quality Site 18/Canterbury Works Site R12922T101A
Pell Frischmann Page 27
Table 5.7: Modelled Baseline Concentrations of PM10 and PM2.5 at Existing Receptors
Receptor PM10 a PM2.5
Annual Mean (g/m3) No. Days >50 µg/m3 Annual Mean (g/m3)
2013 2018
Without
Scheme
2013 2018
Without
Scheme
2013 2018
Without
Scheme
Receptor 1 20.9 19.8 5 3 14.7 13.5
Receptor 2 20.9 19.8 5 3 14.7 13.5
Receptor 3 20.9 19.8 5 3 14.7 13.5
Receptor 4 21.0 19.9 5 3 14.7 13.6
Receptor 5 21.0 19.9 5 3 14.7 13.6
Receptor 6 21.0 19.9 5 3 14.7 13.6
Receptor 7 21.0 19.9 5 3 14.7 13.6
Receptor 8 21.0 19.9 5 3 14.7 13.6
Receptor 9 20.1 19.0 4 2 14.2 13.1
Receptor 10 20.2 19.1 4 2 14.2 13.1
Receptor 11 20.3 19.2 4 2 14.3 13.2
Receptor 12 20.2 19.1 4 2 14.3 13.1
Receptor 13 20.4 19.2 4 3 14.3 13.2
Receptor 14 20.6 19.4 4 3 14.5 13.3
Receptor 15 20.9 19.7 5 3 14.7 13.5
Receptor 16 21.8 20.5 6 4 15.3 13.9
Receptor 17 22.5 21.0 7 5 15.7 14.3
Receptor 18 22.5 21.0 7 5 15.7 14.3
Receptor 19 20.7 19.5 4 3 14.6 13.4
Receptor 20 20.5 19.4 4 3 14.4 13.3
Receptor 21 22.5 21.0 7 5 15.7 14.2
Receptor 22 23.3 21.7 9 6 16.1 14.6
Receptor 23 23.2 21.7 8 6 16.0 14.6

HS2 Technical Study – Section 5: Air Quality Site 18/Canterbury Works Site R12922T101A
Pell Frischmann Page 28
Receptor 24 26.1 24.1 15 10 17.9 16.0
Receptor 25 23.8 22.1 10 6 16.4 14.8
Receptor 26 21.6 20.3 6 4 15.0 13.8
Receptor 27 22.3 20.9 7 5 15.5 14.1
Receptor 28 25.0 23.1 12 8 17.3 15.4
Receptor 29 21.7 20.4 6 4 15.1 13.8
Receptor 30 24.1 22.3 10 7 16.8 15.1
Receptor 31 24.0 22.2 10 7 16.7 15.0
Receptor 32 25.5 23.5 14 9 17.7 15.8
Receptor 33 25.6 23.7 14 9 17.7 15.8
Receptor 34 24.7 23.0 12 8 17.2 15.4
Receptor 35 24.1 22.5 10 7 16.8 15.1
Receptor 36 25.5 23.6 14 9 17.7 15.8
Receptor 37 23.9 22.3 10 7 16.7 15.0
Receptor 38 23.0 21.5 8 6 16.1 14.6
Receptor 39 22.3 21.0 7 5 15.6 14.2
Receptor 40 22.1 20.8 6 4 15.4 14.1
Objective 40 40 35 35 25 25
a The numbers of days with PM10 concentrations greater than 50 g/m3 have been
estimated from the relationship with the annual mean concentration described in
LAQM.TG(09) (Defra, 2009).
5.3.4.20 2013 Baseline
5.3.4.21 The predicted annual mean concentrations of nitrogen dioxide exceed the objective at
most receptor locations within the study area in 2013. The maximum predicted
baseline nitrogen dioxide concentration is 84.7 µg/m3 at Receptor 28 at the junction of
Chamberlayne Road and Banister Road. Although this concentration is over twice the
annual mean objective for nitrogen dioxide, it is broadly in line with the roadside
monitored nitrogen dioxide concentrations presented in Table 5.3.
5.3.4.22 Those receptors where the annual mean objective is predicted to be met are all along
Albert Road, and Canterbury Road. These roads have no available baseline traffic
data, and therefore these concentrations may be slightly underestimated. This is taken
into consideration in the conclusions of this assessment.

HS2 Technical Study – Section 5: Air Quality Site 18/Canterbury Works Site R12922T101A
Pell Frischmann Page 29
5.3.4.23 The baseline PM10 and PM2.5 in 2013 are all well below the objectives. This is
consistent with PM10 monitoring in Brent, which does not identify any exceedences of
the PM10 objectives, even close to busy roadsides (Table 5.4).
5.3.4.24 2018 Baseline With ‘Official’ Emission Reduction
5.3.4.25 The predicted annual mean concentrations of nitrogen dioxide remain above the
objective at the majority of receptor locations in 2018 assuming that vehicle emissions
reduce in line with Defra predictions.
5.3.4.26 All of the predictions for PM10 and PM2.5 are well below the objectives.
5.3.4.27 2018 Baseline Without Emission Reduction
5.3.4.28 The predicted annual mean concentrations of nitrogen dioxide remain above the
objective at the majority of receptor locations in 2018 assuming that vehicle emissions
stay constant between 2013 and 2018.
5.3.4.29 These results are consistent with the conclusions of Brent Council in the outcome of its
air quality review and assessment work.
5.3.5 Impact Assessment – Site 18
5.3.5.1 The following section of the report examines the potetnail air quality impacts
associated with the construction and operation of the HS2 ventilation shaft and
automatic transformer at Site 18. Section 5.3.6 covers the potential air quality impacts
of construction and operation of the shaft and transformer at Canterbury Works.
5.3.5.2 Construction Traffic Impacts
5.3.5.3 Predicted annual mean concentrations of nitrogen dioxide, PM10 and PM2.5, as well as
days with PM10 >50 µg/m3, are set out in Table 5.8, Table 5.9 and Table 5.10 for both
the “Without Scheme” and “With Scheme” scenarios. These tables also describe the
impacts at each receptor using the impact descriptors given in Appendix B. For
nitrogen dioxide, results are presented for two scenarios to reflect current uncertainty in
Defra’s future-year vehicle emission factors.
5.3.5.4 Nitrogen Dioxide With ‘Official’ Emissions Reduction
5.3.5.5 Assuming vehicle emissions decrease in line with Defra predictions between 2013 and
2018, there remain widespread exceedences of the annual mean nitrogen dioxide
objective throughout the study area. Emissions from construction traffic generated by
the scheme are predicted to increase annual mean nitrogen dioxide concentrations by
an imperceptible amount, and therefore based on the criteria set out in Appendix B, the
air quality impacts at all receptors are negligible.
5.3.5.6 Nitrogen Dioxide Without Emissions Reduction
5.3.5.7 Assuming no reduction in emissions, the annual mean nitrogen dioxide concentrations
are above the objective at the majority of receptors. . Emissions from construction
traffic generated by the scheme are predicted to increase annual mean nitrogen
dioxide concentrations by an imperceptible amount, and therefore based on the criteria
set out in Appendix B, the air quality impacts at all receptors are negligible.

HS2 Technical Study – Section 5: Air Quality Site 18/Canterbury Works Site R12922T101A
Pell Frischmann Page 30
5.3.5.8 PM10 and PM2.5
5.3.5.9 The annual mean PM10 and PM2.5 concentrations are well below the objectives at all
receptors, with or without the scheme, as are the numbers of days with PM10
concentrations above 50 µg/m3.
5.3.5.10 The magnitudes of change are imperceptible at all receptors. Coupled with the
concentrations all being well below the objective, the impacts are thus described as
negligible.
Table 5.8: Predicted Impacts on Annual Mean Nitrogen Dioxide Concentrations in 2018
(µg/m3)
Receptor With ‘Official’ Emissions
Reduction a
Without Emissions Reduction b
Without
Schem
e
With
Schem
e
Impact
Descriptor
Without
Scheme
With
Scheme
Impact
Descriptor
Receptor 1 32.5 32.5 Negligible 37.5 37.5 Negligible
Receptor 2 32.5 32.5 Negligible 37.5 37.5 Negligible
Receptor 3 32.5 32.5 Negligible 37.6 37.6 Negligible
Receptor 4 32.9 32.9 Negligible 38.1 38.1 Negligible
Receptor 5 32.8 32.8 Negligible 38.1 38.1 Negligible
Receptor 6 33.0 33.0 Negligible 38.3 38.3 Negligible
Receptor 7 32.9 32.9 Negligible 38.2 38.2 Negligible
Receptor 8 33.1 33.1 Negligible 38.4 38.4 Negligible
Receptor 9 31.2 31.2 Negligible 35.8 35.8 Negligible
Receptor 10 31.4 31.4 Negligible 36.1 36.2 Negligible
Receptor 11 32.1 32.1 Negligible 37.1 37.1 Negligible
Receptor 12 31.8 31.8 Negligible 36.7 36.7 Negligible
Receptor 13 32.7 32.7 Negligible 38.0 38.0 Negligible
Receptor 14 34.1 34.2 Negligible 40.1 40.1 Negligible
Receptor 15 36.0 36.0 Negligible 42.9 42.9 Negligible
Receptor 16 41.4 41.4 Negligible 50.7 50.7 Negligible
Receptor 17 45.4 45.4 Negligible 56.5 56.5 Negligible

HS2 Technical Study – Section 5: Air Quality Site 18/Canterbury Works Site R12922T101A
Pell Frischmann Page 31
Receptor 18 48.6 48.7 Negligible 61.7 61.7 Negligible
Receptor 19 35.5 35.5 Negligible 42.5 42.5 Negligible
Receptor 20 34.0 34.0 Negligible 40.3 40.3 Negligible
Receptor 21 45.6 45.7 Negligible 58.5 58.5 Negligible
Receptor 22 48.0 48.1 Negligible 62.0 62.0 Negligible
Receptor 23 45.8 45.9 Negligible 59.2 59.2 Negligible
Receptor 24 59.7 59.8 Negligible 79.4 79.5 Negligible
Receptor 25 54.0 54.1 Negligible 69.5 69.6 Negligible
Receptor 26 41.9 42.0 Negligible 52.2 52.2 Negligible
Receptor 27 46.1 46.1 Negligible 58.5 58.5 Negligible
Receptor 28 66.7 66.8 Negligible 86.6 86.7 Negligible
Receptor 29 43.0 43.0 Negligible 53.1 53.1 Negligible
Receptor 30 59.3 59.4 Negligible 77.1 77.2 Negligible
Receptor 31 56.6 56.6 Negligible 72.4 72.5 Negligible
Receptor 32 62.7 62.8 Negligible 79.7 79.9 Negligible
Receptor 33 61.5 61.6 Negligible 78.3 78.4 Negligible
Receptor 34 56.2 56.2 Negligible 68.3 68.3 Negligible
Receptor 35 53.1 53.1 Negligible 64.4 64.5 Negligible
Receptor 36 61.2 61.2 Negligible 74.7 74.8 Negligible
Receptor 37 53.1 53.1 Negligible 64.4 64.5 Negligible
Receptor 38 47.6 47.6 Negligible 57.5 57.6 Negligible
Receptor 39 42.1 42.1 Negligible 50.6 50.7 Negligible
Receptor 40 40.4 40.4 Negligible 48.5 48.5 Negligible
Objective 40 - 40 -
a This assumes that road vehicle emission factors reduce between 2013 and 2018 at
the current ‘official’ rates.
b This assumes that road vehicle emission factors in 2018 remain the same as in 2013.

HS2 Technical Study – Section 5: Air Quality Site 18/Canterbury Works Site R12922T101A
Pell Frischmann Page 32
Table 5.9: Predicted PM10 Impacts in 2018 (µg/m3)
Receptor Annual Mean (µg/m3) Days with PM10 > 50 g/m3 a
Without
Schem
e
With
Scheme
Impact
Descriptor
Without
Scheme
With
Scheme
Impact
Descriptor
Receptor 1 19.8 19.8 Negligible 3 3 Negligible
Receptor 2 19.8 19.8 Negligible 3 3 Negligible
Receptor 3 19.8 19.8 Negligible 3 3 Negligible
Receptor 4 19.9 19.9 Negligible 3 3 Negligible
Receptor 5 19.9 19.9 Negligible 3 3 Negligible
Receptor 6 19.9 19.9 Negligible 3 3 Negligible
Receptor 7 19.9 19.9 Negligible 3 3 Negligible
Receptor 8 19.9 19.9 Negligible 3 3 Negligible
Receptor 9 19.0 19.0 Negligible 2 2 Negligible
Receptor 10 19.1 19.1 Negligible 2 2 Negligible
Receptor 11 19.2 19.2 Negligible 2 2 Negligible
Receptor 12 19.1 19.1 Negligible 2 2 Negligible
Receptor 13 19.2 19.2 Negligible 3 3 Negligible
Receptor 14 19.4 19.4 Negligible 3 3 Negligible
Receptor 15 19.7 19.7 Negligible 3 3 Negligible
Receptor 16 20.5 20.5 Negligible 4 4 Negligible
Receptor 17 21.0 21.0 Negligible 5 5 Negligible
Receptor 18 21.0 21.0 Negligible 5 5 Negligible
Receptor 19 19.5 19.5 Negligible 3 3 Negligible
Receptor 20 19.4 19.4 Negligible 3 3 Negligible
Receptor 21 21.0 21.0 Negligible 5 5 Negligible
Receptor 22 21.7 21.7 Negligible 6 6 Negligible
Receptor 23 21.7 21.7 Negligible 6 6 Negligible
Receptor 24 24.1 24.1 Negligible 10 10 Negligible

HS2 Technical Study – Section 5: Air Quality Site 18/Canterbury Works Site R12922T101A
Pell Frischmann Page 33
Receptor 25 22.1 22.1 Negligible 6 6 Negligible
Receptor 26 20.3 20.3 Negligible 4 4 Negligible
Receptor 27 20.9 20.9 Negligible 5 5 Negligible
Receptor 28 23.1 23.1 Negligible 8 8 Negligible
Receptor 29 20.4 20.4 Negligible 4 4 Negligible
Receptor 30 22.3 22.3 Negligible 7 7 Negligible
Receptor 31 22.2 22.2 Negligible 7 7 Negligible
Receptor 32 23.5 23.5 Negligible 9 9 Negligible
Receptor 33 23.7 23.7 Negligible 9 9 Negligible
Receptor 34 23.0 23.0 Negligible 8 8 Negligible
Receptor 35 22.5 22.5 Negligible 7 7 Negligible
Receptor 36 23.6 23.6 Negligible 9 9 Negligible
Receptor 37 22.3 22.3 Negligible 7 7 Negligible
Receptor 38 21.5 21.6 Negligible 6 6 Negligible
Receptor 39 21.0 21.0 Negligible 5 5 Negligible
Receptor 40 20.8 20.8 Negligible 4 4 Negligible
Objective 40 - 35 -
a The numbers of days with PM10 concentrations greater than 50 g/m3 have been
estimated from the relationship with the annual mean concentration described in
LAQM.TG(09) (Defra, 2009).
Table 5.10: Predicted PM2.5 Impacts in 2018 (µg/m3)
Receptor Annual Mean (µg/m3)
Without Scheme With Scheme Impact Descriptor
Receptor 1 13.5 13.5 Negligible
Receptor 2 13.5 13.5 Negligible
Receptor 3 13.5 13.5 Negligible
Receptor 4 13.6 13.6 Negligible
Receptor 5 13.6 13.6 Negligible

HS2 Technical Study – Section 5: Air Quality Site 18/Canterbury Works Site R12922T101A
Pell Frischmann Page 34
Receptor 6 13.6 13.6 Negligible
Receptor 7 13.6 13.6 Negligible
Receptor 8 13.6 13.6 Negligible
Receptor 9 13.1 13.1 Negligible
Receptor 10 13.1 13.1 Negligible
Receptor 11 13.2 13.2 Negligible
Receptor 12 13.1 13.1 Negligible
Receptor 13 13.2 13.2 Negligible
Receptor 14 13.3 13.3 Negligible
Receptor 15 13.5 13.5 Negligible
Receptor 16 13.9 13.9 Negligible
Receptor 17 14.3 14.3 Negligible
Receptor 18 14.3 14.3 Negligible
Receptor 19 13.4 13.4 Negligible
Receptor 20 13.3 13.3 Negligible
Receptor 21 14.2 14.2 Negligible
Receptor 22 14.6 14.6 Negligible
Receptor 23 14.6 14.6 Negligible
Receptor 24 16.0 16.0 Negligible
Receptor 25 14.8 14.8 Negligible
Receptor 26 13.8 13.8 Negligible
Receptor 27 14.1 14.1 Negligible
Receptor 28 15.4 15.4 Negligible
Receptor 29 13.8 13.8 Negligible
Receptor 30 15.1 15.1 Negligible
Receptor 31 15.0 15.0 Negligible
Receptor 32 15.8 15.8 Negligible
Receptor 33 15.8 15.8 Negligible

HS2 Technical Study – Section 5: Air Quality Site 18/Canterbury Works Site R12922T101A
Pell Frischmann Page 35
Receptor 34 15.4 15.4 Negligible
Receptor 35 15.1 15.1 Negligible
Receptor 36 15.8 15.8 Negligible
Receptor 37 15.0 15.0 Negligible
Receptor 38 14.6 14.6 Negligible
Receptor 39 14.2 14.2 Negligible
Receptor 40 14.1 14.1 Negligible
Objective 25 -
5.3.5.11 Construction Dust Impacts
5.3.5.12 The construction works will give rise to a risk of dust impacts during demolition,
earthworks and construction, as well as from trackout of dust and dirt by vehicles onto
the public highway. It should be noted that in this assessment of dust impacts during
construction works, the construction activities only involve the erection of structures,
site surfacing and site fit-out. Other activities undertaken during the construction
period such as vent shaft excavation are classed as either earthworks or demolition.
5.3.5.13 The construction will take place over a 7-year period, although this will involve a 2-year
break in works following the excavation of the vent shaft.
5.3.5.14 Potential Dust Emission Magnitude
5.3.5.15 There site preparation for Site 18 will involve the demolition of a number of buildings
and structures at the site, including the existing 3-storey TfL depot and the former
Keniston Press printer’s buildings. Based on the example definitions set out in Table
A.1, the dust emission class for demolition is considered to be medium.
5.3.5.16 Using the National Environment Research Council’s Soil Portal website (National
Environment Research Council, 2014), the characteristics of the soil at the
development site have been defined. These are detailed in Table 5.11. Overall, it is
considered that, when dry, this soil has the potential to be moderately dusty.
Table 5.11: Summary of Soil Characteristics
Category Record
Soil layer thickness Deep
Grain Size (and Soil Parent Material) Argillaceousa
European Soil Bureau Description Prequaternary Marine/Estuarine Sand and Silt
Soil Group Medium to Light (Silty) to Heavy
Soil Texture Clay to Silt

HS2 Technical Study – Section 5: Air Quality Site 18/Canterbury Works Site R12922T101A
Pell Frischmann Page 36
a clay-like.
5.3.5.17 Earthworks at the site will form a considerable part of the construction period. The
principal earthwork activity involves the excavation of the vent shaft, which is to
measure approximately 43 m by 19 m in size. The base of the shaft will extend to a
depth below ground level of 41 m, with the foundations extending to 51 m below
ground. This incorporates as long period of excavation, with removal of very large
volumes of subsoil, which will be removed from site by road. The excavation of the
vent shaft represents a significant potential to generate dust, especially during dry
conditions. The subsoil characteristics at Site 18 have been identified in paragraph
5.3.5.16 as having the potential to be moderately dusty. Based on the example
definitions set out in Table A.1, the dust emission class for earthworks is considered to
be large.
5.3.5.18 The construction activities at Site 18 will involve the construction of the vent shaft head
house, which will be a predominantly concrete structure measuring 43 m by 19 m and
will be 9.5 m high. There will also be an auto transformer station constructed on the
site, with dimensions of approximately 33 m long, 16 m wide and 5 m high. The
remainder of the site will be hard standing to allow for access and egress from the
tunnel. Dust will arise during construction activities from vehicles travelling over
unpaved ground, the handling and storage of dusty materials, and from the cutting of
concrete. Based on the example definitions set out in Table A.1, the dust emission
class for construction is considered to be medium.
5.3.5.19 The number of vehicles accessing the site, which may track out dust and dirt will vary
considerably throughout the construction period. As stated in Section 2, during typical
peak activities, there will be approximately 108 vehicle trips per day (54 arrivals, 54
departures), of which 38 will be HGVs. During the concrete pour for the vent shaft
foundations, it is estimated that there may be as many as 388 vehicle trips in any one
day, including 328 HGV movements (164 arrivals and departures). Based on the
example definitions set out in Table A.1, the dust emission class for trackout is
considered to be large.
5.3.5.20 Table 5.12 summarises the dust emission magnitude for the proposed development.
Table 5.12: Summary of Dust Emission Magnitude
Source Dust Emission Magnitude
Demolition Medium
Earthworks Large
Construction Medium
Trackout Large
5.3.5.21 Sensitivity of the Area
5.3.5.22 This assessment step combines the sensitivity of individual receptors to dust effects,
with the number of receptors in the area and their proximity to the site. It also

HS2 Technical Study – Section 5: Air Quality Site 18/Canterbury Works Site R12922T101A
Pell Frischmann Page 37
considers additional site-specific factors such as topography and screening, and in the
case of sensitivity to human health effects, baseline PM10 concentrations.
5.3.5.23 Sensitivity of the Area to Effects from Dust Soiling
5.3.5.24 The IAQM guidance explains that residential properties are ‘high’ sensitivity receptors
to dust soiling, while the shops and commercial premises are considered is ‘medium’
sensitivity receptors (Table A.2). There are between 10 and 100 residential dwellings
(apartment buildings and flats are judged to classify as >1 dwelling) within 20 m of the
Site 18 boundary, as well as a number of shops and small business premises. Using
the matrix set out in Table B.3, the area surrounding the onsite works is of ‘high’
sensitivity to dust soiling. Table 5.12 shows that dust emission magnitude for trackout
is ‘large’ and Table A.3 thus explains that there is a risk of material being tracked
500 m from the site exit. There are between 10 and 100 residential dwellings within 20
m of the roads along which material could be tracked, and Table A.3 thus indicates that
the area is of ‘high’ sensitivity to dust soiling due to trackout. Taking these points into
account, it is judged that the area surrounding the onsite works is of ‘high’ sensitivity to
dust soiling, and the area surrounding roads along which material may be tracked from
the site is also of ‘high’ sensitivity (Table 5.13).
5.3.5.25 Sensitivity of the Area to any Human Health Effects
5.3.5.26 Residential properties are also classified as being of ‘high’ sensitivity to human health
effects. The IAQM matrix in Table A.4 requires information on the baseline annual
mean PM10 concentration in the area. Receptors 30 – 33 are all at Premier Corner,
adjacent to Site 18 (Figure 5.1). The maximum predicted baseline PM10 concentration
at these receptors is 25.6 µg/m3 (Table 5.7), and this value has been used. Using the
matrix in Table A.4, the area surrounding the onsite works is of ‘high’ sensitivity to
human health effects, as is the area surrounding roads along which material may be
tracked from the site (Table 5.13).
Table 5.13: Summary of the Area Sensitivity
Effects Associated With: Sensitivity of the Surrounding Area
On-site Works Trackout
Dust Soiling High Sensitivity High Sensitivity
Human Health High Sensitivity High Sensitivity
5.3.5.27 Risk and Significance
5.3.5.28 The dust emission magnitudes in Table 5.12 have been combined with the sensitivities
of the area in Table 5.13 using the matrix in Table A.6 in Appendix A, in order to assign
a risk category to each activity. The resulting risk categories for the four construction
activities, without mitigation, are set out in Table 5.14. These risk categories have been
used to determine the appropriate level of mitigation as set out in Section 5.3.7.

HS2 Technical Study – Section 5: Air Quality Site 18/Canterbury Works Site R12922T101A
Pell Frischmann Page 38
Table 5.14: Summary of Risk of Impacts Without Mitigation
Source Dust Soiling Human Health
Demolition Medium Risk High Risk
Earthworks High Risk High Risk
Construction Medium Risk High Risk
Trackout High Risk High Risk
5.3.5.29 The IAQM does not provide a method for assessing the significance of effects before
mitigation, and advises that pre-mitigation significance should not be determined. With
appropriate mitigation in place, the IAQM guidance is clear that the residual effect will
normally not be significant (Institute of Air Quality Management, 2014).
5.3.5.30 The IAQM guidance recognises that, even with a rigorous dust management plan in
place, it is not possible to guarantee that the dust mitigation measures will be effective
all of the time, for instance under adverse weather conditions. The local community
may therefore experience occasional, short-term dust annoyance. The scale of this
would not normally be considered sufficient to change the conclusion that the effects
will not be significant.
5.3.5.31 Uncertainty in Road Traffic Modelling Predictions
5.3.5.32 There are many components that contribute to the uncertainty of modelling predictions.
The model used in this assessment is dependent upon the traffic data that have been
input, which will have inherent uncertainties associated with them. There are then
additional uncertainties, as the model is required to simplify real-world conditions into a
series of algorithms. An important stage in the process is model verification, which
involves comparing the model output with measured concentrations (see Appendix D).
Because the model has been verified and adjusted, there can be reasonable
confidence in the prediction of current year (2013) concentrations.
5.3.5.33 Predicting pollutant concentrations in a future year will always be subject to greater
uncertainty. For obvious reasons, the model cannot be verified in the future, and it is
necessary to rely on a series of projections provided by DfT and Defra as to what will
happen to traffic volumes, background pollutant concentrations, and vehicle emissions.
A disparity between the road transport emission projections and measured annual
mean concentrations of nitrogen oxides and nitrogen dioxide has been identified by
Defra (Carslaw, Beevers, Westmoreland, & Williams, 2011). This is evident across the
UK, although the effect appears to be greatest in inner London; there is also
considerable inter-site variation. Whilst the emission projections suggested that both
annual mean nitrogen oxides and nitrogen dioxide concentrations should have fallen
by around 15-25% over the past 6 to 8 years, at many monitoring sites levels have
remained relatively stable, or have even shown a slight increase. This pattern is
mirrored in the monitoring data assembled for this study, as set out in Table 5.3.
5.3.5.34 The reason for the disparity is thought to relate to the on-road performance of modern
diesel vehicles. New vehicles registered in the UK have to meet progressively tighter

HS2 Technical Study – Section 5: Air Quality Site 18/Canterbury Works Site R12922T101A
Pell Frischmann Page 39
European type approval emissions categories, referred to as "Euro" standards. While
the nitrogen oxides emissions from newer vehicles should be lower than those from
equivalent older vehicles, the on-road performance of some modern diesel vehicles is
often no better than that of earlier models (Carslaw, Beevers, Westmoreland, &
Williams, 2011). The best current evidence is that, where previous standards have had
limited on-road success, the ‘Euro VI’ and ‘Euro 6’ standards that new vehicles will
have to comply with from 2013/152 will achieve the expected on-road improvements,
as, for the first time, they will require compliance with the World Harmonized Test
Cycle, which better represents real-world driving conditions3 and includes a separate
slow-speed cycle for heavy duty vehicles.
5.3.5.35 As noted above, the new forecast reductions in nitrogen oxides emissions may still be
optimistic in the near-term. To account for this uncertainty, a sensitivity test has been
conducted assuming that the future (2018) road traffic emissions per vehicle are
unchanged from 2013 values. The predictions within this sensitivity test are likely to be
over-pessimistic, as new, lower-emission Euro VI and Euro 6 vehicles will be on the
road from 2013/15; according to Defra’s Emission Factors Toolkit (Defra, 2014a), by
2018 it is forecast that there will be a roughly 50-70% penetration of Euro VI HDVs and
a roughly 35-40% penetration of Euro 6 LDVs. These new vehicles are expected to
deliver real on-road reductions in nitrogen oxides emissions.
5.3.5.36 Significance of Operational Air Quality Impacts
5.3.5.37 The operational air quality impacts are judged to be insignificant. This professional
judgement is made in accordance with the methodology set out in Paragraph 5.6.2.5
(Appendix B), taking into account the factors set out in Table B.3, and also taking into
account the uncertainty over future projections of traffic-related nitrogen dioxide
concentrations, which may not decline as rapidly as expected.
5.3.5.38 More specifically, the judgement that the air quality impacts will be insignificant takes
account of the assessment that emissions from the development-related construction
traffic will lead to imperceptible changes in roadside pollutant concentrations and all of
the predicted air quality impacts are negligible.
Table 5.15: Factors Taken into Account in Determining the Overall Significance of the
Scheme on Local Air Quality
Factors Outcome of Assessment
Number of people affected by increases
and/or decreases in concentrations and a
judgement on the overall balance.
Construction traffic emissions will to
imperceptible changes in pollutant
concentrations at all relevant receptor
locations.
The magnitude of the changes and the Emissions from construction traffic are
2 Euro VI refers to heavy duty vehicles, while Euro 6 refers to light duty vehicles. The timings for meeting the
standards vary with vehicle type and whether the vehicle is a new model or existing model. 3
The test cycle for real-world emissions for Euro 6 vehicles will not be implemented until about 2017. However, there is still expected to be a
substantial improvement in NOx emissions from Euro 6 vehicles (as compared with Euro 5) from 2015 onwards.

HS2 Technical Study – Section 5: Air Quality Site 18/Canterbury Works Site R12922T101A
Pell Frischmann Page 40
descriptions of the impacts at the
receptors.
predicted to lead to negligible air quality
impacts at all receptor locations.
Whether or not an exceedence of an
objective is predicted to arise in the study
area where none existed before or an
exceedence area is substantially
increased.
No new areas of exceedence of the
objective are predicted.
Uncertainty, including the extent to which
worst-case assumptions have been
made.
The inclusion of the two scenarios for
nitrogen dioxide covers the uncertainty over
vehicle emission factors.
Whether or not the study area exceeds
an objective and this exceedence is
removed or the exceedence area is
reduced.
Baseline nitrogen dioxide concentrations
exceed the annual mean objective by a
substantial margin throughout the study
area, regardless of whether or not Defra’s
predicted reductions in road traffic
emissions materialise by 2018 or not. No
exceedences will be removed as a result of
Site 18 construction traffic.
5.3.6 Impact Assessment – Canterbury Works
5.3.6.1 Road Traffic Impacts
5.3.6.2 Predicted annual mean concentrations of nitrogen dioxide, PM10 and PM2.5, as well as
days with PM10 >50 µg/m3, are set out in Table 5.16, Table 5.17 and Table 5.18 for
both the “Without Scheme” and “With Scheme” scenarios. These tables also describe
the impacts at each receptor using the impact descriptors given in Appendix B. For
nitrogen dioxide, results are presented for two scenarios to reflect current uncertainty in
Defra’s future-year vehicle emission factors.
5.3.6.3 Nitrogen Dioxide With ‘Official’ Emissions Reduction
5.3.6.4 Assuming vehicle emissions decrease in line with Defra predictions between 2013 and
2018, there remain widespread exceedences of the annual mean nitrogen dioxide
objective throughout the study area. Emissions from construction traffic generated by
the scheme are predicted to increase annual mean nitrogen dioxide concentrations by
an imperceptible amount, and therefore based on the criteria set out in Appendix B, the
air quality impacts at all receptors are negligible.
5.3.6.5 Nitrogen Dioxide Without Emissions Reduction
5.3.6.6 Assuming no reduction in emissions, the annual mean nitrogen dioxide concentrations
are above the objective at the majority of receptors. Emissions from construction traffic
generated by the scheme are predicted to increase annual mean nitrogen dioxide
concentrations by an imperceptible amount at all but one receptor (Receptor 10) where
a small increase in nitrogen dioxide concentrations is predicted. Based on the criteria

HS2 Technical Study – Section 5: Air Quality Site 18/Canterbury Works Site R12922T101A
Pell Frischmann Page 41
set out in Appendix B, the air quality impacts at all receptors are negligible, apart from
Receptor 10, which is predicted to experience a slight adverse impact.
5.3.6.7 Receptor 10 is located close to the kerbside of Albert Road, where it will experience
the greatest influence of emissions from Canterbury Works construction traffic; other
receptors adjacent to Albert Road and Canterbury Road are set sufficiently far back
from the road to ensure dispersion is adequate to lead to imperceptible changes in
nitrogen dioxide concentrations. Despite the predicted slight adverse impact, the
annual mean nitrogen dioxide objective is predicted to be met at this receptor with or
without the Canterbury Works site in use for vent shaft construction.
5.3.6.8 PM10 and PM2.5
5.3.6.9 The annual mean PM10 and PM2.5 concentrations are well below the objectives at all
receptors, with or without the scheme, as are the numbers of days with PM10
concentrations above 50 µg/m3.
5.3.6.10 The magnitudes of change are imperceptible at all receptors. Coupled with the
concentrations all being well below the objective, the impacts are thus described as
negligible.
Table 5.16: Predicted Impacts on Annual Mean Nitrogen Dioxide Concentrations in 2018
(µg/m3)
Receptor With ‘Official’ Emissions Reductiona Without Emissions Reductionb
Without
Schem
e
With
Schem
e
Impact
Descriptor
Without
Scheme
With
Scheme
Impact
Descriptor
Receptor 1 32.5 32.5 Negligible 37.5 37.5 Negligible
Receptor 2 32.5 32.6 Negligible 37.5 37.7 Negligible
Receptor 3 32.5 32.7 Negligible 37.6 37.9 Negligible
Receptor 4 32.9 33.1 Negligible 38.1 38.4 Negligible
Receptor 5 32.8 33.1 Negligible 38.1 38.4 Negligible
Receptor 6 33.0 33.2 Negligible 38.3 38.5 Negligible
Receptor 7 32.9 33.0 Negligible 38.2 38.3 Negligible
Receptor 8 33.1 33.2 Negligible 38.4 38.6 Negligible
Receptor 9 31.2 31.4 Negligible 35.8 36.1 Negligible
Receptor 10 31.4 31.6 Negligible 36.1 36.5 Slight Adverse
Receptor 11 32.1 32.2 Negligible 37.1 37.4 Negligible
Receptor 12 31.8 32.0 Negligible 36.7 37.0 Negligible
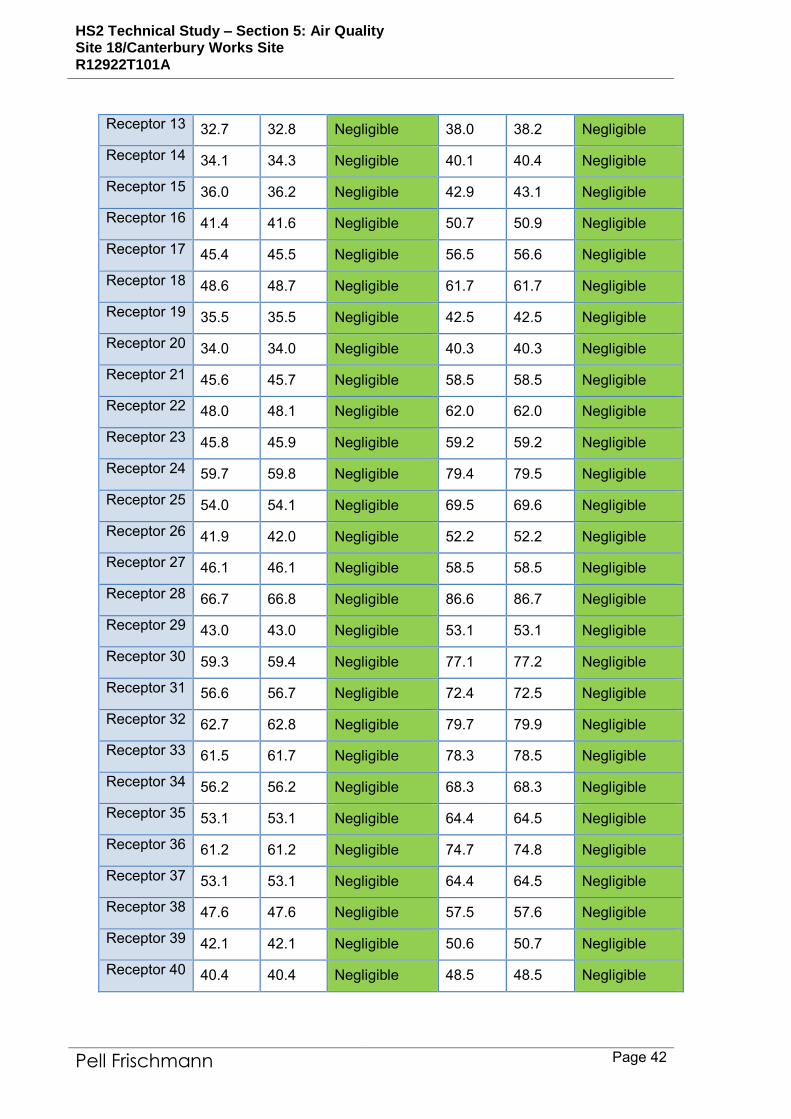
HS2 Technical Study – Section 5: Air Quality Site 18/Canterbury Works Site R12922T101A
Pell Frischmann Page 42
Receptor 13 32.7 32.8 Negligible 38.0 38.2 Negligible
Receptor 14 34.1 34.3 Negligible 40.1 40.4 Negligible
Receptor 15 36.0 36.2 Negligible 42.9 43.1 Negligible
Receptor 16 41.4 41.6 Negligible 50.7 50.9 Negligible
Receptor 17 45.4 45.5 Negligible 56.5 56.6 Negligible
Receptor 18 48.6 48.7 Negligible 61.7 61.7 Negligible
Receptor 19 35.5 35.5 Negligible 42.5 42.5 Negligible
Receptor 20 34.0 34.0 Negligible 40.3 40.3 Negligible
Receptor 21 45.6 45.7 Negligible 58.5 58.5 Negligible
Receptor 22 48.0 48.1 Negligible 62.0 62.0 Negligible
Receptor 23 45.8 45.9 Negligible 59.2 59.2 Negligible
Receptor 24 59.7 59.8 Negligible 79.4 79.5 Negligible
Receptor 25 54.0 54.1 Negligible 69.5 69.6 Negligible
Receptor 26 41.9 42.0 Negligible 52.2 52.2 Negligible
Receptor 27 46.1 46.1 Negligible 58.5 58.5 Negligible
Receptor 28 66.7 66.8 Negligible 86.6 86.7 Negligible
Receptor 29 43.0 43.0 Negligible 53.1 53.1 Negligible
Receptor 30 59.3 59.4 Negligible 77.1 77.2 Negligible
Receptor 31 56.6 56.7 Negligible 72.4 72.5 Negligible
Receptor 32 62.7 62.8 Negligible 79.7 79.9 Negligible
Receptor 33 61.5 61.7 Negligible 78.3 78.5 Negligible
Receptor 34 56.2 56.2 Negligible 68.3 68.3 Negligible
Receptor 35 53.1 53.1 Negligible 64.4 64.5 Negligible
Receptor 36 61.2 61.2 Negligible 74.7 74.8 Negligible
Receptor 37 53.1 53.1 Negligible 64.4 64.5 Negligible
Receptor 38 47.6 47.6 Negligible 57.5 57.6 Negligible
Receptor 39 42.1 42.1 Negligible 50.6 50.7 Negligible
Receptor 40 40.4 40.4 Negligible 48.5 48.5 Negligible

HS2 Technical Study – Section 5: Air Quality Site 18/Canterbury Works Site R12922T101A
Pell Frischmann Page 43
Objective 40 - 40 -
a This assumes that road vehicle emission factors reduce between 2013 and 2018 at
the current ‘official’ rates.
b This assumes that road vehicle emission factors in 2018 remain the same as in 2013.
Table 5.17: Predicted PM10 Impacts in 2018 (µg/m3)
Receptor Annual Mean (µg/m3) Days with PM10 > 50 g/m3 a
Without
Scheme
With
Scheme
Impact
Descriptor
Without
Scheme
With
Scheme
Impact
Descriptor
Receptor 1 19.8 19.8 Negligible 3 3 Negligible
Receptor 2 19.8 19.8 Negligible 3 3 Negligible
Receptor 3 19.8 19.8 Negligible 3 3 Negligible
Receptor 4 19.9 19.9 Negligible 3 3 Negligible
Receptor 5 19.9 19.9 Negligible 3 3 Negligible
Receptor 6 19.9 19.9 Negligible 3 3 Negligible
Receptor 7 19.9 19.9 Negligible 3 3 Negligible
Receptor 8 19.9 19.9 Negligible 3 3 Negligible
Receptor 9 19.1 19.1 Negligible 2 2 Negligible
Receptor 10 19.1 19.1 Negligible 2 2 Negligible
Receptor 11 19.2 19.2 Negligible 2 2 Negligible
Receptor 12 19.1 19.1 Negligible 2 2 Negligible
Receptor 13 19.3 19.3 Negligible 3 3 Negligible
Receptor 14 19.5 19.5 Negligible 3 3 Negligible
Receptor 15 19.7 19.7 Negligible 3 3 Negligible
Receptor 16 20.5 20.5 Negligible 4 4 Negligible
Receptor 17 21.0 21.0 Negligible 5 5 Negligible
Receptor 18 21.0 21.0 Negligible 5 5 Negligible
Receptor 19 19.5 19.5 Negligible 3 3 Negligible
Receptor 20 19.4 19.4 Negligible 3 3 Negligible

HS2 Technical Study – Section 5: Air Quality Site 18/Canterbury Works Site R12922T101A
Pell Frischmann Page 44
Receptor 21 21.0 21.0 Negligible 5 5 Negligible
Receptor 22 21.7 21.7 Negligible 6 6 Negligible
Receptor 23 21.7 21.7 Negligible 6 6 Negligible
Receptor 24 24.1 24.1 Negligible 10 10 Negligible
Receptor 25 22.1 22.1 Negligible 6 6 Negligible
Receptor 26 20.3 20.3 Negligible 4 4 Negligible
Receptor 27 20.9 20.9 Negligible 5 5 Negligible
Receptor 28 23.1 23.1 Negligible 8 8 Negligible
Receptor 29 20.4 20.4 Negligible 4 4 Negligible
Receptor 30 22.3 22.3 Negligible 7 7 Negligible
Receptor 31 22.2 22.2 Negligible 7 7 Negligible
Receptor 32 23.5 23.5 Negligible 9 9 Negligible
Receptor 33 23.7 23.7 Negligible 9 9 Negligible
Receptor 34 23.0 23.0 Negligible 8 8 Negligible
Receptor 35 22.5 22.5 Negligible 7 7 Negligible
Receptor 36 23.6 23.6 Negligible 9 9 Negligible
Receptor 37 22.3 22.3 Negligible 7 7 Negligible
Receptor 38 21.6 21.6 Negligible 6 6 Negligible
Receptor 39 21.0 21.0 Negligible 5 5 Negligible
Receptor 40 20.8 20.8 Negligible 4 4 Negligible
Objective 40 - 35 -
a The numbers of days with PM10 concentrations greater than 50 g/m3 have been
estimated from the relationship with the annual mean concentration described in
LAQM.TG(09) (Defra, 2009).
Table 5.18: Predicted PM2.5 Impacts in 2018 (µg/m3)
Receptor Annual Mean (µg/m3)
Without Scheme With Scheme Impact Descriptor
Receptor 1 13.5 13.5 Negligible

HS2 Technical Study – Section 5: Air Quality Site 18/Canterbury Works Site R12922T101A
Pell Frischmann Page 45
Receptor 2 13.5 13.5 Negligible
Receptor 3 13.5 13.5 Negligible
Receptor 4 13.6 13.6 Negligible
Receptor 5 13.6 13.6 Negligible
Receptor 6 13.6 13.6 Negligible
Receptor 7 13.6 13.6 Negligible
Receptor 8 13.6 13.6 Negligible
Receptor 9 13.1 13.1 Negligible
Receptor 10 13.1 13.1 Negligible
Receptor 11 13.2 13.2 Negligible
Receptor 12 13.1 13.1 Negligible
Receptor 13 13.2 13.2 Negligible
Receptor 14 13.3 13.3 Negligible
Receptor 15 13.5 13.5 Negligible
Receptor 16 13.9 13.9 Negligible
Receptor 17 14.3 14.3 Negligible
Receptor 18 14.3 14.3 Negligible
Receptor 19 13.4 13.4 Negligible
Receptor 20 13.3 13.3 Negligible
Receptor 21 14.2 14.2 Negligible
Receptor 22 14.6 14.6 Negligible
Receptor 23 14.6 14.6 Negligible
Receptor 24 16.0 16.0 Negligible
Receptor 25 14.8 14.8 Negligible
Receptor 26 13.8 13.8 Negligible
Receptor 27 14.1 14.1 Negligible
Receptor 28 15.4 15.4 Negligible
Receptor 29 13.8 13.8 Negligible

HS2 Technical Study – Section 5: Air Quality Site 18/Canterbury Works Site R12922T101A
Pell Frischmann Page 46
Receptor 30 15.1 15.1 Negligible
Receptor 31 15.0 15.0 Negligible
Receptor 32 15.8 15.8 Negligible
Receptor 33 15.8 15.8 Negligible
Receptor 34 15.4 15.4 Negligible
Receptor 35 15.1 15.1 Negligible
Receptor 36 15.8 15.8 Negligible
Receptor 37 15.0 15.0 Negligible
Receptor 38 14.6 14.6 Negligible
Receptor 39 14.2 14.2 Negligible
Receptor 40 14.1 14.1 Negligible
Objective 25 -
5.3.6.11 Construction Phase Impacts
5.3.6.12 The construction works will give rise to a risk of dust impacts during demolition,
earthworks and construction, as well as from trackout of dust and dirt by vehicles onto
the public highway. The construction works carried out at Canterbury Works will be the
same as those described at Site 18.
5.3.6.13 Potential Dust Emission Magnitude
5.3.6.14 The site preparation for the Canterbury Works site will involve the demolition of some
small, single-storey structures located to the rear of Canterbury House. Canterbury
House itself will not be demolished. Based on the example definitions set out in Table
A.1, the dust emission class for demolition is considered to be small.
5.3.6.15 Using the National Environment Research Council’s Soil Portal website (National
Environment Research Council, 2014), the characteristics of the soil at the
development site have been defined. These are detailed in Table 5.19. Overall, it is
considered that, when dry, this soil has the potential to be moderately dusty.
Table 5.19: Summary of Soil Characteristics
Category Record
Soil layer thickness Deep
Grain Size (and Soil Parent Material) Argillaceousa
European Soil Bureau Description Prequaternary Marine/Estuarine Sand and Silt

HS2 Technical Study – Section 5: Air Quality Site 18/Canterbury Works Site R12922T101A
Pell Frischmann Page 47
Soil Group Medium to Light (Silty) to Heavy
Soil Texture Clay to Silt
a clay-like.
5.3.6.16 Earthworks at the site will form a considerable part of the construction period, as
discussed in paragraph 5.3.5.17. The subsoil characteristics at the Canterbury Works
have been identified in Table 5.19 as having the potential to be moderately dusty.
Based on the example definitions set out in Table A.1, the dust emission class for
earthworks is considered to be large.
5.3.6.17 Construction activities at the Canterbury Works site will involve the construction of the
vent shaft head house and auto-transformer station and areas of hard standing (see
paragraph 5.3.5.18). Dust will arise during construction activities from vehicles
travelling over unpaved ground, the handling and storage of dusty materials, and from
the cutting of concrete. Based on the example definitions set out in Table A.1, the dust
emission class for construction is considered to be medium.
5.3.6.18 The number of vehicles accessing the site, which may track out dust and dirt will vary
considerably throughout the construction period. During typical peak activities, there
will be approximately 108 vehicle trips per day (54 arrivals, 54 departures), of which 38
will be HGVs. During the concrete pour for the vent shaft foundations, it is estimated
that there may be as many as 388 vehicle trips in any one day, including 328 HGV
movements (164 arrivals and departures). Based on the example definitions set out in
Table A.1, the dust emission class for trackout is considered to be large.
5.3.6.19 Table 5.20 summarises the dust emission magnitude for the proposed development.
Table 5.20: Summary of Dust Emission Magnitude
Source Dust Emission Magnitude
Demolition Small
Earthworks Large
Construction Medium
Trackout Large
5.3.6.20 Sensitivity of the Area
5.3.6.21 This assessment step combines the sensitivity of individual receptors to dust effects,
with the number of receptors in the area and their proximity to the site. It also
considers additional site-specific factors such as topography and screening, and in the
case of sensitivity to human health effects, baseline PM10 concentrations
5.3.6.22 Sensitivity of the Area to Effects from Dust Soiling
5.3.6.23 The IAQM guidance explains that residential properties and schools are ‘high’
sensitivity receptors to dust soiling (Table A.2). There are over 100 sensitive receptors
within 20 m of the Canterbury Works site boundary, including residential dwellings and

HS2 Technical Study – Section 5: Air Quality Site 18/Canterbury Works Site R12922T101A
Pell Frischmann Page 48
St Mary’s Catholic Primary School, which is located immediately to the east of the
Canterbury Works site. It should be noted that the guidance advises that apartment
blocks and schools are judged to classify as multiple sensitive receptors depending on
the likely number of occupants. Using the matrix set out in Table A.3, the area
surrounding the onsite works is of ‘high’ sensitivity to dust soiling. Table 5.20 shows
that dust emission magnitude for trackout is ‘large’ and Table A.3 thus explains that
there is a risk of material being tracked 500 m from the site exit. There are over 100
residential dwellings within 20 m of the roads along which material could be tracked
(principally along Canterbury Terrace and Albert Road), and Table A.3 thus indicates
that the area is of ‘high’ sensitivity to dust soiling due to trackout. Taking these points
into account, it is judged that the area surrounding the onsite works is of ‘high’
sensitivity to dust soiling, and the area surrounding roads along which material may be
tracked from the site is also of ‘high’ sensitivity (Table 5.21).
5.3.6.24 Sensitivity of the Area to any Human Health Effects
5.3.6.25 Residential properties are also classified as being of ‘high’ sensitivity to human health
effects. The IAQM matrix in Table A.4 requires information on the baseline annual
mean PM10 concentration in the area. Receptors 1 – 10 are in close proximity to the
Canterbury Works site (Figure 5.2). The maximum predicted baseline PM10
concentration at these receptors is 21.0 µg/m3 (Table 5.7), and this value has been
used. Using the matrix in Table A.4, the area surrounding the onsite works is of
‘medium’ sensitivity to human health effects, as is the area surrounding roads along
which material may be tracked from the site (Table 5.13).
Table 5.21: Summary of the Area Sensitivity
Effects Associated With: Sensitivity of the Surrounding Area
On-site Works Trackout
Dust Soiling High Sensitivity High Sensitivity
Human Health Medium Sensitivity Medium Sensitivity
5.3.6.26 Risk and Significance
5.3.6.27 The dust emission magnitudes in Table 5.20 have been combined with the sensitivities
of the area in Table 5.21 using the matrix in Table A.6 in Appendix A, in order to assign
a risk category to each activity. The resulting risk categories for the four construction
activities, without mitigation, are set out in Table 5.22. These risk categories have been
used to determine the appropriate level of mitigation as set out in Section 5.3.7.
Table 5.22: Summary of Risk of Impacts Without Mitigation
Source Dust Soiling Human Health
Demolition Medium Risk Low Risk

HS2 Technical Study – Section 5: Air Quality Site 18/Canterbury Works Site R12922T101A
Pell Frischmann Page 49
Earthworks High Risk Medium Risk
Construction Medium Risk Medium Risk
Trackout High Risk Medium Risk
5.3.6.28 The IAQM does not provide a method for assessing the significance of effects before
mitigation, and advises that pre-mitigation significance should not be determined. With
appropriate mitigation in place, the IAQM guidance is clear that the residual effect will
normally not be significant (Institute of Air Quality Management, 2014).
5.3.6.29 The IAQM guidance recognises that, even with a rigorous dust management plan in
place, it is not possible to guarantee that the dust mitigation measures will be effective
all of the time, for instance under adverse weather conditions. The local community
may therefore experience occasional, short-term dust annoyance. The scale of this
would not normally be considered sufficient to change the conclusion that the effects
will not be significant.
5.3.6.30 Uncertainty in Road Traffic Modelling Predictions
5.3.6.31 As discussed in paragraph 5.3.5.32, there are inherent uncertainties associated with
dispersion modelling of road traffic emissions. The level of uncertainty for the
assessment of Canterbury Works is the same as that for Site 18 and therefore the
results of the modelling are directly comparable, irrespective of any residual uncertainty
following model verification and future year sensitivity testing.
5.3.6.32 Significance of Operational Air Quality Impacts
5.3.6.33 The operational air quality impacts are judged to be insignificant. This professional
judgement is made in accordance with the methodology set out in Paragraph 5.6.2.5
(Appendix B), taking into account the factors set out in Table B.2, and also taking into
account the uncertainty over future projections of traffic-related nitrogen dioxide
concentrations, which may not decline as rapidly as expected.
5.3.6.34 More specifically, the judgement that the air quality impacts will be insignificant takes
account of the assessment that the predicted air quality impacts are negligible at all
receptor locations, with the exception of Receptor 10 at Albert Road, where slight
adverse impacts are predicted in the ‘without emissions reduction’ scenario. Given the
conservative nature of this scenario and the fact that the annual mean objective is not
predicted to be exceeded at this receptor, with or without Canterbury Works under
construction, it is judged that the impact at this receptor is not significant.
Table 5. 23: Factors Taken into Account in Determining the Overall Significance of the
Scheme on Local Air Quality
Factors Outcome of Assessment
Number of people affected by increases
and/or decreases in concentrations and a
judgement on the overall balance.
Construction traffic emissions will to
imperceptible changes in pollutant
concentrations at all relevant receptor

HS2 Technical Study – Section 5: Air Quality Site 18/Canterbury Works Site R12922T101A
Pell Frischmann Page 50
locations except Receptor 10 in the without
emissions reduction scenario where a small
increase in nitrogen dioxide concentrations
are predicted.
The magnitude of the changes and the
descriptions of the impacts at the
receptors.
Emissions from construction traffic are
predicted to lead to negligible air quality
impacts at all receptor locations except
Receptor 10 in the without emissions
reduction scenario where a slight adverse
impact with respect to nitrogen dioxide
concentrations is predicted.
Whether or not an exceedence of an
objective is predicted to arise in the study
area where none existed before or an
exceedence area is substantially
increased.
No new areas of exceedence of the
objective are predicted.
Uncertainty, including the extent to which
worst-case assumptions have been
made.
The inclusion of the two scenarios for
nitrogen dioxide covers the uncertainty over
vehicle emission factors.
Whether or not the study area exceeds
an objective and this exceedence is
removed or the exceedence area is
reduced.
Baseline nitrogen dioxide concentrations
exceed the annual mean objective by a
substantial margin throughout the study
area, regardless of whether or not Defra’s
predicted reductions in road traffic
emissions materialise by 2018 or not. No
exceedences will be removed as a result of
Canterbury Works construction traffic.

HS2 Technical Study – Section 5: Air Quality Site 18/Canterbury Works Site R12922T101A
Pell Frischmann Page 51
5.3.7 Mitigation
5.3.7.1 Construction Dust Impacts
5.3.7.2 Site 18
5.3.7.3 Measures to mitigate dust emissions will be required during the construction phase of
the development in order to reduce impacts upon nearby sensitive receptors.
5.3.7.4 Site 18 has been identified as a High Risk site as set out in Table 5.14. The GLA Best
Practice Guidance (GLA, 2006) describes best practice measures that should be
employed, as appropriate, to reduce the impact of a high risk site. However, more
comprehensive guidance has been published by IAQM (Institute of Air Quality
Management, 2014), and on monitoring during demolition and construction (Institute of
Air Quality Management, 2012b). This reflects best practice experience and has been
used, together with the professional experience of the consultant and the findings of
the dust impact assessment, to draw up a set of measures that should be incorporated
into the specification for the works. These measures are described in Appendix E.
5.3.7.5 The mitigation measures should be written into a dust management plan (DMP). The
DMP may be integrated into a Code of Construction Practice or the Construction
Environmental Management Plan, and may require monitoring.
5.3.7.6 Where mitigation measures rely on water, it is expected that only sufficient water will
be applied to damp down the material. There should not be any excess to potentially
contaminate local watercourses.
5.3.7.7 Canterbury Works
5.3.7.8 Measures to mitigate dust emissions will be required during the construction phase of
the development in order to reduce impacts upon nearby sensitive receptors.
5.3.7.9 Canterbury Works has been identified as a Medium to High Risk site as set out in
Table 5.22. The level of mitigation required for Canterbury Works is broadly the same,
although slightly less than for Site 18. The measures described in Appendix E are all
highly recommended for Site 18. In the case of Canterbury Works, the measures are
all highly recommended apart from those highlighted in italic type, which are desirable.
5.3.7.10 Construction Traffic Impacts
5.3.7.11 The assessment has demonstrated that the scheme will not cause any exceedences of
the air quality objectives in areas where they are not currently exceeded. Mitigation
measures to reduce pollutant emissions from road traffic are principally being delivered
in the longer term by the introduction of more stringent emissions standards, largely via
European legislation. It is not considered necessary to propose further mitigation
measures for this scheme for either Site 18 or Canterbury Works.

HS2 Technical Study – Section 5: Air Quality Site 18/Canterbury Works Site R12922T101A
Pell Frischmann Page 52
5.3.8 Conclusions
5.3.8.1 The potential air quality impacts associated with the construction and operation of a
HS2 tunnel ventilation shaft and auto transformer station at the proposed Site 18
(Salusbury Road) and Canterbury Works (Canterbury Road) sites have been
assessed.
5.3.8.2 In terms of the operational air quality impacts, these have been scoped out of the
assessment as insignificant, as the ventilation shaft is not anticipated to result in any
emissions to air, and the site will require only limited staff attendance during operation,
and therefore the number of vehicle movements generated by the site will be minimal,
and any air quality impacts from road traffic emissions would be insignificant.
5.3.8.3 The assessment has focussed upon the potential air quality impacts of the construction
period, both in terms of emissions from construction traffic moving to and from the site,
as well as the impacts of dust and PM10 from on-site construction activities.
5.3.8.4 The air quality impacts associated with emissions from construction traffic are judged
to be insignificant, regardless of whether Site 18 or Canterbury Works is used as the
chosen site for the ventilation shaft. The use of Canterbury Works has the potential to
expose a greater number of residential properties to an increase in road traffic
emissions (at properties along Albert Road and Canterbury Road); however, the
increases in pollutant concentrations have been demonstrated to be imperceptible and
the resultant air quality impacts are all negligible.
5.3.8.5 The risk of construction dust and PM10 impacts is slightly higher for Site 18 than
Canterbury Works; however, with best practice mitigation measures in place, the
potential air quality impacts from use of either site would be insignificant.

HS2 Technical Study – Section 5: Air Quality Site 18/Canterbury Works Site R12922T101A
Pell Frischmann Page 53
5.4 REFERENCES
The Air Quality (England) Regulations, 2000, Statutory Instrument 928. (2000). HMSO.
The Air Quality (England) (Amendment) Regulations, 2002, Statutory Instrument 3043.
(2002). HMSO.
Directive 2008/50/EC of the European Parliament and of the Council. (2008).
The Air Quality Standards Regulations (No. 1001). (2010). Stationery Office.
National Planning Policy Framework. (2012). DCLG.
Carslaw, D., Beevers, S., Westmoreland, E., & Williams, M. (2011). Trends in NOx and
NO2 emissions and ambient measurements in the UK. Retrieved from uk-
air.defra.gov.uk/reports/cat05/1108251149_110718_AQ0724_Final_report.pdf
DCLG. (2014). Planning Practice Guidance. Retrieved from
http://planningguidance.planningportal.gov.uk/blog/guidance/
Defra. (2007). The Air Quality Strategy for England, Scotland, Wales and Northern
Ireland. Defra.
Defra. (2009). Review & Assessment: Technical Guidance LAQM.TG(09). Defra.
Defra. (2014a). Defra Air Quality Website. Retrieved from http://laqm.defra.gov.uk/
Defra. (2014d). UK Pollutant Release and Transfer Register. Retrieved from
prtr.defra.gov.uk
DfT. (2011). DfT Automatic traffic Counters Table TRA0305-0307. Retrieved from
http://www.dft.gov.uk/pgr/statistics/datatablespublications/roads/traffic
Environment Agency. (2014). ‘what’s in your backyard’. Retrieved from
http://www.environment-agency.gov.uk/homeandleisure/37793.aspx
Environmental Protection UK. (2010). Development Control: Planning for Air Quality.
EPUK.
GLA. (2006). The Control of Dust and Emissions from Construction and Demolition: Best
Practice Guidance. Retrieved from
www.london.gov.uk/mayor/environment/air_quality/construction-dust.jsp
GLA. (2013). London Atmospheric Emissions Inventory (LAEI) 2010.
Institute of Air Quality Management. (2009, Novemeber). Position on the Description of Air
Quality Impacts and the Assessment of their Significance. IAQM.
Institute of Air Quality Management. (2012b). Guidance on Air Quality Monitoring in the
Vicinity of Demolition and Construction Sites. Retrieved from
www.iaqm.co.uk/guidance.html

HS2 Technical Study – Section 5: Air Quality Site 18/Canterbury Works Site R12922T101A
Pell Frischmann Page 54
Institute of Air Quality Management. (2014). Guidance on the Assessment of Dust from
Demolition and Construction.
King's College London. (2014). London Air.
LB of Brent. (2005). Air Quality Action Plan.
London Borough of Brent. (2013). 2013 Air Quality Progress Report.
National Environment Research Council. (2014). NERC Soil Portal. Retrieved from
http://mapapps2.bgs.ac.uk/soilportal/wmsviewer.html

HS2 Technical Study – Section 5: Air Quality Site 18/Canterbury Works Site R12922T101A
Pell Frischmann Page 55
5.5 GLOSSARY
AADT Annual Average Daily Traffic
ADMS-Roads Atmospheric Dispersion Modelling System
AQMA Air Quality Management Area
DCLG Department for Communities and Local Government
Defra Department for Environment, Food and Rural Affairs
DfT Department for Transport
DMP Dust Management Plan
EFT Emissions Factor Toolkit
EPUK Environmental Protection UK
Exceedence A period of time when the concentration of a pollutant is greater
than the appropriate air quality objective. This applies to specified locations
with relevant exposure
HDV Heavy Duty Vehicles (> 3.5 tonnes)
HGV Heavy Goods Vehicle
IAQM Institute of Air Quality Management
LAEI London Atmospheric Emissions Inventory
LAQM Local Air Quality Management
LB London Borough
LDV Light Duty Vehicles (<3.5 tonnes)
μg/m3 Microgrammes per cubic metre
NO Nitric oxide
NO2 Nitrogen dioxide
NOx Nitrogen oxides (taken to be NO2 + NO)
NPPF National Planning Policy Framework
Objectives A nationally defined set of health-based concentrations for nine pollutants,
seven of which are incorporated in Regulations, setting out the extent to
which the standards should be achieved by a defined date. There are also
vegetation-based objectives for sulphur dioxide and nitrogen oxides
PM10 Small airborne particles, more specifically particulate matter less than 10
micrometres in aerodynamic diameter
PM2.5 Small airborne particles less than 2.5 micrometres in aerodynamic diameter
PPG Planning Practice Guidance

HS2 Technical Study – Section 5: Air Quality Site 18/Canterbury Works Site R12922T101A
Pell Frischmann Page 56
Standards A nationally defined set of concentrations for nine pollutants below which
health effects do not occur or are minimal
TEA Triethanolamine – used to absorb nitrogen dioxide

HS2 Technical Study – Section 5: Air Quality Site 18/Canterbury Works Site R12922T101A
Pell Frischmann Page 57
5.6 APPENDICES
5.6.1 APPENDIX A - Construction Dust Assessment Procedure
5.6.1.1 The criteria developed by IAQM divide the activities on construction sites into four types to reflect their different potential impacts. These are:
demolition;
earthworks;
construction; and
trackout.
5.6.1.2 The assessment procedure includes the four steps summarised below:
5.6.1.3 STEP 1: Screen the Need for a Detailed Assessment
An assessment is required where there is a human receptor within 350 m of the
boundary of the site and/or within 50 m of the route(s) used by construction vehicles on
the public highway, up to 500 m from the site entrance(s), or where there is an
ecological receptor within 50 m of the boundary of the site and/or within 50 m of the
route(s) used by construction vehicles on the public highway, up to 500 m from the site
entrance(s).
Where the need for a more detailed assessment is screened out, it can be concluded
that the level of risk is negligible and that any effects will not be significant. No
mitigation measures beyond those required by legislation will be required.
5.6.1.4 STEP 2: Assess the Risk of Dust Impacts
A site is llocated to a risk category based on two factors: the scale and nature
of the works, which determines the potential dust emission magnitude (Step
2A); and
the sensitivity of the area to dust effects (Step 2B).
These two factors are combined in Step 2C, which is to determine the risk of dust
impacts with no mitigation applied. The risk categories assigned to the site may be
different for each of the four potential sources of dust (demolition, earthworks,
construction and trackout).
5.6.1.5 Step 2A – Define the Potential Dust Emission Magnitude
Dust emission magnitude is defined as either ‘Small’, ‘Medium’, or ‘Large’. The IAQM
explains that this classification should be based on professional judgement, but
provides the examples in Table A.1.
Table A.1: Examples of How the Dust Emission Magnitude Class May be Defined
Class Examples ………….
Demolition

HS2 Technical Study – Section 5: Air Quality Site 18/Canterbury Works Site R12922T101A
Pell Frischmann Page 58
Large Total building volume >50,000 m3, potentially dusty construction material (e.g.
concrete), on site crushing and screening, demolition activities >20 m above
ground level
Mediu
m
Total building volume 20,000 m3 – 50,000 m3, potentially dusty construction
material, demolition activities 10-20 m above ground level
Small Total building volume <20,000 m3, construction material with low potential for
dust release (e.g. metal cladding or timber), demolition activities <10 m above
ground, demolition during wetter months
Earthworks
Large Total site area >10,000 m2, potentially dusty soil type (e.g. clay, which will be
prone to suspension when dry to due small particle size), >10 heavy earth
moving vehicles active at any one time, formation of bunds >8 m in height,
total material moved >100,000 tonnes
Mediu
m
Total site area 2,500 m2 – 10,000 m2, moderately dusty soil type (e.g. silt), 5-
10 heavy earth moving vehicles active at any one time, formation of bunds 4 m
– 8 m in height, total material moved 20,000 tonnes – 100,000 tonnes
Small Total site area <2,500 m2, soil type with large grain size (e.g. sand), <5 heavy
earth moving vehicles active at any one time, formation of bunds <4 m in
height, total material moved <10,000 tonnes, earthworks during wetter months
Construction
Large Total building volume >100,000 m3, piling, on site concrete batching;
sandblasting
Mediu
m
Total building volume 25,000 m3 – 100,000 m3, potentially dusty construction
material (e.g. concrete), piling, on site concrete batching
Small Total building volume <25,000 m3, construction material with low potential for
dust release (e.g. metal cladding or timber)
Trackout a
Large >50 HDV (>3.5t) outward movements in any one day, potentially dusty surface
material (e.g. high clay content), unpaved road length >100 m
Mediu
m
10-50 HDV (>3.5t) outward movements in any one day, moderately dusty
surface material (e.g. high clay content), unpaved road length 50 m – 100 m
Small <10 HDV (>3.5t) outward movements in any one day, surface material with
low potential for dust release, unpaved road length <50 m
a These numbers are for vehicles that leave the site after moving over unpaved ground.

HS2 Technical Study – Section 5: Air Quality Site 18/Canterbury Works Site R12922T101A
Pell Frischmann Page 59
5.6.1.6 Step 2B – Define the Sensitivity of the Area
5.6.1.7 The sensitivity of the area is defined taking account of a number of factors:
the specific sensitivities of receptors in the area;
the proximity and number of those receptors;
in the case of PM10, the local background concentration; and
site-specific factors, such as whether there are natural shelters to reduce the
risk of wind-blown dust.
5.6.1.8 The first requirement is to determine the specific sensitivities of local receptors. The
IAQM recommends that this should be based on professional judgment, taking account
of the principles in Table A.2. These receptor sensitivities are then used in the matrices
set out in Table A.3, Table A.4, and Table A.5 to determine the sensitivity of the area.
Finally, the sensitivity of the area is considered in relation to any other site-specific
factors, such as the presence of natural shelters etc., and any required adjustments to
the defined sensitivities are made.
5.6.1.9 Step 2C – Define the Risk of Impacts
5.6.1.10 The dust emission magnitude determined at Step 2A is combined with the sensitivity of
the area determined at Step 2B to determine the risk of impacts with no mitigation
applied. The IAQM provides the matrix in Table A.6 as a method of assigning the level
of risk for each activity.
5.6.1.11 STEP 3: Determine Site-specific Mitigation Requirements
5.6.1.12 The IAQM provides a suite of recommended and desirable mitigation measures which
are organised according to whether the outcome of Step 2 indicates a low, medium, or
high risk. The list provided by the IAQM has been used as the basis for the
requirements set out in Appendix E.
5.6.1.13 STEP 4: Determine Significant Effects
5.6.1.14 The IAQM does not provide a method for assessing the significance of effects before
mitigation, and advises that pre-mitigation significance should not be determined. With
appropriate mitigation in place, the IAQM guidance is clear that the residual effect will
normally not be significant (Institute of Air Quality Management, 2014).
5.6.1.15 The IAQM guidance recognises that, even with a rigorous dust management plan in
place, it is not possible to guarantee that the dust mitigation measures will be effective
all of the time, for instance under adverse weather conditions. The local community
may therefore experience occasional, short-term dust annoyance. The scale of this
would not normally be considered sufficient to change the conclusion that the effects
will not be significant.
Table A.2: Principles to be Used When Defining Receptor Sensitivities
Class Principles Examples
Sensitivities of People to Dust Soiling Effects
High users can reasonably expect enjoyment of a high level of dwellings,

HS2 Technical Study – Section 5: Air Quality Site 18/Canterbury Works Site R12922T101A
Pell Frischmann Page 60
amenity; or
the appearance, aesthetics or value of their property
would be diminished by soiling; and the people or
property would reasonably be expected a to be present
continuously, or at least regularly for extended periods,
as part of the normal pattern of use of the land
museum and other
culturally important
collections,
medium and long
term car parks and
car showrooms
Mediu
m
users would expect to enjoy a reasonable level of
amenity, but would not reasonably expect to enjoy the
same level of amenity as in their home; or
the appearance, aesthetics or value of their property
could be diminished by soiling; or
the people or property wouldn’t reasonably be expected
to be present here continuously or regularly for extended
periods as part of the normal pattern of use of the land
parks and places
of work
Low the enjoyment of amenity would not reasonably be
expected; or
there is property that would not reasonably be expected
to be diminished in appearance, aesthetics or value by
soiling; or
there is transient exposure, where the people or property
would reasonably be expected to be present only for
limited periods of time as part of the normal pattern of
use of the land
playing fields,
farmland (unless
commercially-
sensitive
horticultural),
footpaths, short
term car parks and
roads
Sensitivities of People to the Health Effects of PM10
High locations where members of the public may be exposed
for eight hours or more in a day
residential
properties,
hospitals, schools
and residential
care homes
Mediu
m
locations where the people exposed are workers, and
where individuals may be exposed for eight hours or
more in a day.
may include office
and shop workers,
but will generally
not include
workers
occupationally
exposed to PM10
Low locations where human exposure is transient public footpaths,
playing fields,
parks and
shopping streets
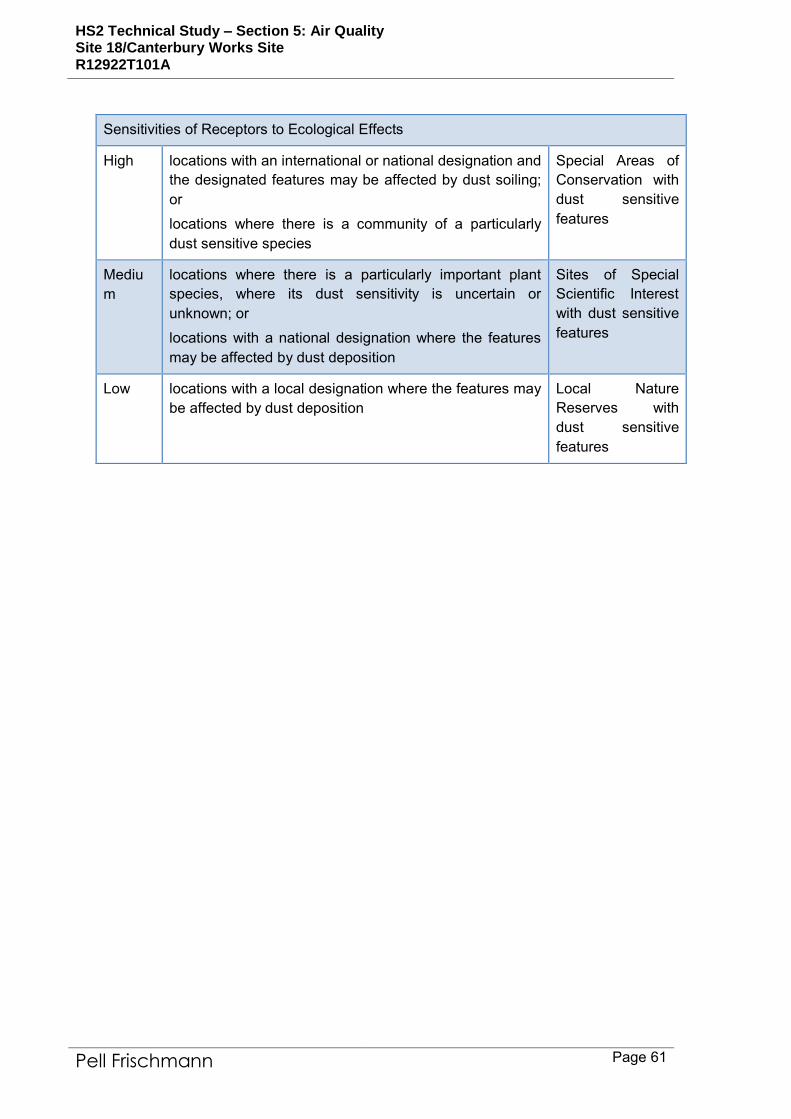
HS2 Technical Study – Section 5: Air Quality Site 18/Canterbury Works Site R12922T101A
Pell Frischmann Page 61
Sensitivities of Receptors to Ecological Effects
High locations with an international or national designation and
the designated features may be affected by dust soiling;
or
locations where there is a community of a particularly
dust sensitive species
Special Areas of
Conservation with
dust sensitive
features
Mediu
m
locations where there is a particularly important plant
species, where its dust sensitivity is uncertain or
unknown; or
locations with a national designation where the features
may be affected by dust deposition
Sites of Special
Scientific Interest
with dust sensitive
features
Low locations with a local designation where the features may
be affected by dust deposition
Local Nature
Reserves with
dust sensitive
features

HS2 Technical Study – Section 5: Air Quality Site 18/Canterbury Works Site R12922T101A
Pell Frischmann Page 62
Table A.3: Sensitivity of the Area to Effects on People and Property from Dust Soiling 4
Receptor
Sensitivity
Number of
Receptors
Distance from the Source (m)
<20 <50 <100 <350
High >100 High High Medium Low
10-100 High Medium Low Low
1-10 Medium Low Low Low
Medium >1 Low Low Low Low
Low >1 Low Low Low Low
Table A.4:Sensitivity of the Area to Human Health Effects Error! Bookmark not defined.
Receptor
Sensitivity
Annual
Mean PM10
Number of
Receptors
Distance from the Source (m)
<20 <50 <100 <200 <350
High >32 µg/m3 >100 High High High Mediu
m
Low
10-100 High High Mediu
m
Low Low
1-10 High Mediu
m
Low Low Low
28-32 µg/m3 >100 High High Mediu
m
Low Low
10-100 High Mediu
m
Low Low Low
1-10 High Mediu
m
Low Low Low
24-28 µg/m3 >100 High Mediu
m
Low Low Low
10-100 High Mediu
m
Low Low Low
1-10 Mediu Low Low Low Low
4 For demolition, earthworks and construction, distances are taken either from the dust source or from the boundary
of the site. For trackout, distances are measured from the sides of roads used by construction traffic. Without mitigation, trackout may occur from roads up to 500 m from large sites, 200 m from medium sites and 50 m from small sites, as measured from the site exit. The impact declines with distance from the site, and it is only necessary to consider trackout impacts up to 50 m from the edge of the road.

HS2 Technical Study – Section 5: Air Quality Site 18/Canterbury Works Site R12922T101A
Pell Frischmann Page 63
m
<24 µg/m3 >100 Mediu
m
Low Low Low Low
10-100 Low Low Low Low Low
1-10 Low Low Low Low Low
Medium - >10 High Mediu
m
Low Low Low
- 1-10 Mediu
m
Low Low Low Low
Low - >1 Low Low Low Low Low
Table A.5: Sensitivity of the Area to Ecological Effects Error! Bookmark not defined.
Receptor
Sensitivity
Distance from the Source (m)
<20 <50
High High Medium
Medium Medium Low
Low Low Low

HS2 Technical Study – Section 5: Air Quality Site 18/Canterbury Works Site R12922T101A
Pell Frischmann Page 64
Table A.6: Defining the Risk of Dust Impacts
Sensitivity of
the Area
Dust Emission Magnitude
Large Medium Small
Demolition
High High Risk Medium Risk Medium Risk
Medium High Risk Medium Risk Low Risk
Low Medium Risk Low Risk Negligible
Earthworks
High High Risk Medium Risk Low Risk
Medium Medium Risk Medium Risk Low Risk
Low Low Risk Low Risk Negligible
Construction
High High Risk Medium Risk Low Risk
Medium Medium Risk Medium Risk Low Risk
Low Low Risk Low Risk Negligible
Trackout
High High Risk Medium Risk Low Risk
Medium Medium Risk Low Risk Negligible
Low Low Risk Low Risk Negligible
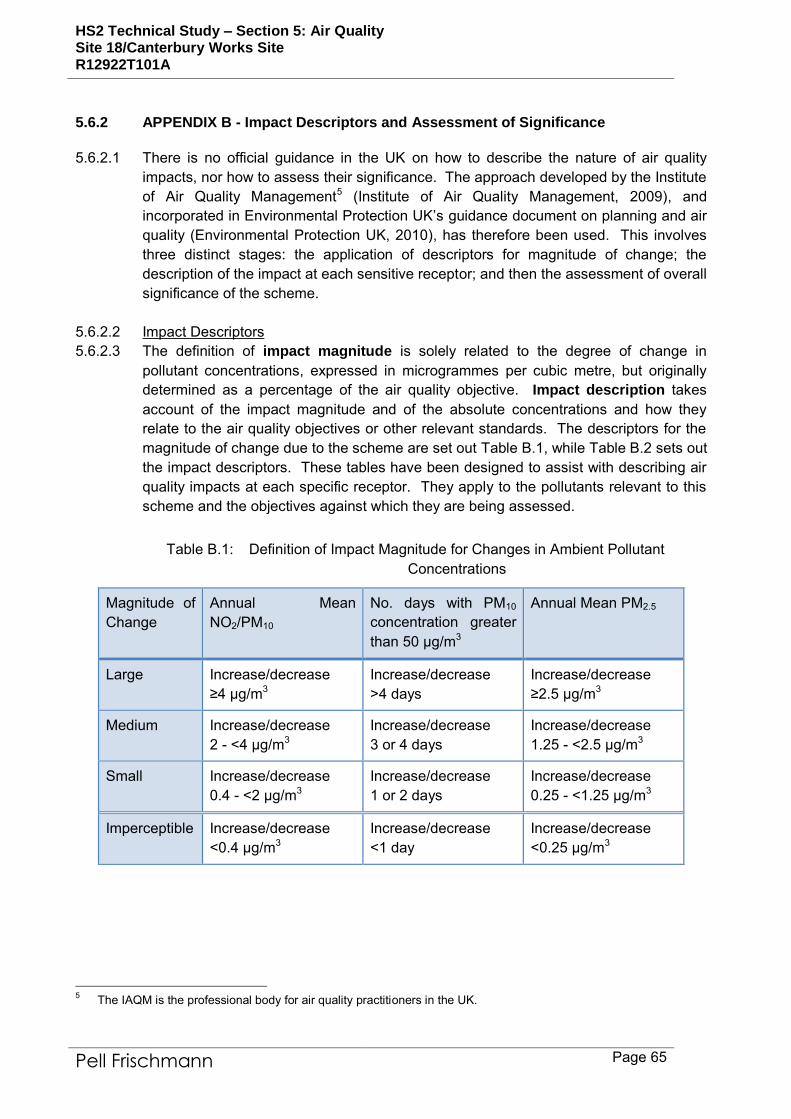
HS2 Technical Study – Section 5: Air Quality Site 18/Canterbury Works Site R12922T101A
Pell Frischmann Page 65
5.6.2 APPENDIX B - Impact Descriptors and Assessment of Significance
5.6.2.1 There is no official guidance in the UK on how to describe the nature of air quality
impacts, nor how to assess their significance. The approach developed by the Institute
of Air Quality Management5 (Institute of Air Quality Management, 2009), and
incorporated in Environmental Protection UK’s guidance document on planning and air
quality (Environmental Protection UK, 2010), has therefore been used. This involves
three distinct stages: the application of descriptors for magnitude of change; the
description of the impact at each sensitive receptor; and then the assessment of overall
significance of the scheme.
5.6.2.2 Impact Descriptors
5.6.2.3 The definition of impact magnitude is solely related to the degree of change in
pollutant concentrations, expressed in microgrammes per cubic metre, but originally
determined as a percentage of the air quality objective. Impact description takes
account of the impact magnitude and of the absolute concentrations and how they
relate to the air quality objectives or other relevant standards. The descriptors for the
magnitude of change due to the scheme are set out Table B.1, while Table B.2 sets out
the impact descriptors. These tables have been designed to assist with describing air
quality impacts at each specific receptor. They apply to the pollutants relevant to this
scheme and the objectives against which they are being assessed.
Table B.1: Definition of Impact Magnitude for Changes in Ambient Pollutant
Concentrations
Magnitude of
Change
Annual Mean
NO2/PM10
No. days with PM10
concentration greater
than 50 µg/m3
Annual Mean PM2.5
Large Increase/decrease
≥4 µg/m3
Increase/decrease
>4 days
Increase/decrease
≥2.5 µg/m3
Medium Increase/decrease
2 - <4 µg/m3
Increase/decrease
3 or 4 days
Increase/decrease
1.25 - <2.5 µg/m3
Small Increase/decrease
0.4 - <2 µg/m3
Increase/decrease
1 or 2 days
Increase/decrease
0.25 - <1.25 µg/m3
Imperceptible Increase/decrease
<0.4 µg/m3
Increase/decrease
<1 day
Increase/decrease
<0.25 µg/m3
5 The IAQM is the professional body for air quality practitioners in the UK.

HS2 Technical Study – Section 5: Air Quality Site 18/Canterbury Works Site R12922T101A
Pell Frischmann Page 66
Table B.2: Air Quality Impact Descriptors for Changes to Annual Mean Nitrogen
Dioxide, PM10 and PM2.5 Concentrations and Changes to Number of Days with PM10
Concentration Greater than 50 µg/m3 at a Receptor a
Absolute Concentration b in Relation to
Objective
Change in Concentration/day c
Small Medium Large
Above Objective d Slight Moderate Substantial
Just Below Objective e Slight Moderate Moderate
Below Objective f Negligible Slight Slight
Well Below Objective g Negligible Negligible Slight
a Criteria have been adapted from the published criteria to remove overlaps at
transitions.
b The ‘Absolute Concentration’ relates to the ‘With-Scheme’ air quality where there is an
increase in concentrations and to the ‘Without-Scheme’ air quality where there is a
decrease in concentrations.
c Where the Impact Magnitude is Imperceptible, then the Impact Description is
Negligible.
d ‘Above’: >40 µg/m3 annual mean NO2 or PM10, >25 µg/m3 annual mean PM2.5, or >35
days with PM10 > 50 µg/m3.
e ‘Just below’: >36 – ≤40 µg/m3 of annual mean NO2 or PM10, >22.5 - ≤25 µg/m3 annual
mean PM2.5, or >32 – ≤35 days with PM10 >50 µg/m3.
f ‘Below’: >30 – ≤36 µg/m3 of annual mean NO2 or PM10, >18.75 - ≤22.5 µg/m3 annual
mean PM2.5, or >26 – ≤32 days with PM10 >50 µg/m3.
g ‘Well below’: ≤30 µg/m3 annual mean NO2 or PM10, ≤18.75 µg/m3 annual mean PM2.5,
or ≤26 days with PM10 >50 µg/m3.

HS2 Technical Study – Section 5: Air Quality Site 18/Canterbury Works Site R12922T101A
Pell Frischmann Page 67
5.6.2.4 Assessment of Significance 5.6.2.5 The IAQM guidance (Institute of Air Quality Management, 2009) is that the
assessment of significance should be based on professional judgement, with the overall air quality impact of the scheme described as either, insignificant, minor, moderate or major. In drawing these conclusions, the factors set out in Table B.3 should be taken into account. A summary of the professional experience of staff contributing to this assessment is provided in Appendix C.
Table B.3: Factors Taken into Account in Determining Air Quality Significance
Factors
Number of people affected by increases and/or decreases in concentrations and a
judgement on the overall balance.
The magnitude of the changes and the descriptions of the impacts at the receptors
using the criteria set out in Table B.1 and Table B.2.
Whether or not an exceedence of an objective is predicted to arise in the study area
where none existed before or an exceedence area is substantially increased.
Whether or not the study area exceeds an objective and this exceedence is removed or
the exceedence area is reduced.
Uncertainty, including the extent to which worst-case assumptions have been made.
The extent to which an objective is exceeded, e.g. an annual mean NO2 of 41 g/m3
should attract less significance than an annual mean of 51 g/m3.

HS2 Technical Study – Section 5: Air Quality Site 18/Canterbury Works Site R12922T101A
Pell Frischmann Page 68
5.6.3 APPENDIX C - Professional Experience
5.6.3.1 Prof. Duncan Laxen, BSc (Hons) MSc PhD MIEnvSc FIAQM
Prof Laxen is the Managing Director of Air Quality Consultants, a company which he
founded in 1993. He has over forty years’ experience in environmental sciences and
has been a member of Defra’s Air Quality Expert Group and the Department of
Health’s Committee on the Medical Effects of Air Pollution. He has been involved in
major studies of air quality, including nitrogen dioxide, lead, dust, acid rain, PM10, PM2.5
and ozone and was responsible for setting up the UK’s urban air quality monitoring
network. Prof Laxen has been responsible for appraisals of all local authorities’ air
quality Review & Assessment reports and for providing guidance and support to local
authorities carrying out their local air quality management duties. He has carried out
air quality assessments for power stations; road schemes; ports; airports; railways;
mineral and landfill sites; and residential/commercial developments. He has also been
involved in numerous investigations into industrial emissions; ambient air quality;
indoor air quality; nuisance dust and transport emissions. Prof Laxen has prepared
specialist reviews on air quality topics and contributed to the development of air quality
management in the UK. He has been an expert witness at numerous Public Inquiries,
published over 70 scientific papers and given numerous presentations at conferences.
He is a Fellow of the Institute of Air Quality Management.
5.6.3.2 Laurence Caird, MEarthSci CSci MIEnvSc MIAQM
Mr Caird is a Principal Consultant with AQC, with eight years’ experience in the field of
air quality including the detailed assessment of emissions from road traffic, airports,
heating and energy plant, and a wide range of industrial sources including the thermal
treatment of waste. He has experience in ambient air quality monitoring for numerous
pollutants using a wide range of techniques and is also competent in the monitoring
and assessment of nuisance odours and dust. Mr Caird has worked with a variety of
clients to provide expert air quality services and advice, including local authorities,
planners, developers and process operators. He is a Member of the Institute of Air
Quality Management and is a Chartered Scientist.
5.6.3.3 Paul Outen, BSc (Hons)
Mr Outen is a Consultant with AQC, having joined in 2014. He holds a degree in
Environmental Geoscience, having specialised in the study of landfill-related particulate
matter for his final year thesis. Prior to joining AQC he worked as an Air Quality
Consultant at Odournet UK Ltd for 6 years, undertaking a range of air quality and odour
assessments across a number of different industries, as well as managing the
sampling/technical department for the company. He now undertakes air quality
assessments at AQC, utilising the ADMS dispersion models to assess the impacts of a
variety of sources on concentrations of nitrogen dioxide, PM10 and PM2.5.
Full CVs are available at www.aqconsultants.co.uk.

HS2 Technical Study – Section 5: Air Quality Site 18/Canterbury Works Site R12922T101A
Pell Frischmann Page 69
5.6.4 APPENDIC D - Modelling Methodology
5.6.4.1 Background Concentrations
5.6.4.2 The background concentrations across the study area have been defined using the
national pollution maps published by Defra (2014a). These cover the whole country on
a 1x1 km grid and are published for each year from 2010 until 2025. The maps include
the influence of emissions from a range of different sources; one of which is road
traffic. As noted in Paragraph 5.3.3.19, there are some concerns that Defra may have
over-predicted the rate at which road traffic emissions of nitrogen oxides will fall in the
future. The maps currently in use were verified against measurements made during
2010 at a large number of automatic monitoring stations and so there can be
reasonable confidence that the maps are representative of conditions during 2010.
Similarly, there is reasonable confidence that the reductions which Defra predicts from
other sectors (e.g. rail) will be achieved.
5.6.4.3 In order to calculate background nitrogen dioxide and nitrogen oxides concentrations in
2013, it is assumed that there was no reduction in the road traffic component of
backgrounds between 20106 and 2013. This has been done using the source-specific
background nitrogen oxides maps provided by Defra (2014a). For each grid square,
the road traffic component has been held constant at 2010 levels, while 2013 values
have been taken for the other components. Nitrogen dioxide concentrations have then
been calculated using the background nitrogen dioxide calculator which Defra (2014a)
publishes to accompany the maps. The result is a set of ‘adjusted 2013 background’
concentrations.
5.6.4.4 Two separate sets of 2018 background nitrogen dioxide and nitrogen oxides
concentrations have been used for the future-year assessment. The 2018 background
‘without emissions reduction’ has been calculated using the same approach as
described for the 2013 data: the road traffic component of background nitrogen oxides
has been held constant at 2010 values, while 2018 data are taken for the other
components. Nitrogen dioxide has then been calculated using Defra’s background
nitrogen dioxide calculator. The 2018 background ‘with emissions reduction’ assumes
that Defra’s predicted reductions occur from 2013 onward. This dataset has been
derived first by calculating the ratio of the unadjusted mapped value for 2018 to the
unadjusted mapped value for 2013. This ratio has then been applied to the ‘adjusted
2013 background’ value (as derived in Paragraph 5.6.4.3).
5.6.4.5 For PM10 and PM2.5, there is no strong evidence that Defra’s predictions are unrealistic
and so the year-specific mapped concentrations have been used in this assessment.
5.6.4.6 Model Inputs
6 This approach assumes that has been no reduction in emissions per vehicle but also that traffic volumes have
remained constant. This is not the same as the assumption made for dispersion modelling, in which emissions per vehicle are held constant while traffic volumes are assumed to change year on year. Overall, this discrepancy is unlikely to influence the overall conclusions of the assessment.

HS2 Technical Study – Section 5: Air Quality Site 18/Canterbury Works Site R12922T101A
Pell Frischmann Page 70
5.6.4.7 Roads
5.6.4.8 Predictions have been carried out using the ADMS-Roads dispersion model (v3.2).
The model requires the user to provide various input data, including emissions from
each section of road, and the road characteristics (including road width and street
canyon height, where applicable). Vehicle emissions have been calculated based on
vehicle flow, composition and speed data using the Emission Factor Toolkit (Version
6.0.1) published by Defra (2014a). For nitrogen dioxide, future-year concentrations
have been predicted once using year-specific emission factors from the EFT, and once
using emission factors for 20137, which is the year for which the model has been
verified.
5.6.4.9 The model has been run using the full year of meteorological data that corresponds to
the most recent set of nitrogen dioxide monitoring data (2013). The meteorological data
has been taken from the monitoring station located at Heathrow Airport, which is
considered suitable for this area.
5.6.4.10 Traffic data for the assessment study area have been taken from the London
Atmospheric Emissions Inventory (LAEI) (GLA, 2013). Traffic speeds have been
based on those presented in the LAEI, with some having been adjusted based on
professional judgement, taking account of the road layout, speed limits and the
proximity to a junction. The traffic data used in this assessment are summarised in
Table D.1.
5.6.4.11 The route of development traffic to and from the sites is not known, and therefore the
development traffic has been distributed across the road network by assuming 50:50
splits at each major road junction – i.e. for Site 18, 50% use Salusbury Road and 50%
uses Kilburn High Road and then where Kilburn High Road meets Chamberlayne
Road, 50% moves north and 50% moves south.
5.6.4.12 In terms of the Canterbury Works, it is advised that the development traffic may access
the site from Albert Road, and exit the site onto Canterbury Road. As this is not
definitely determined, the worst-case assumption has been made that all development
traffic will access and exit the site from Canterbury Road.
7 i.e. combining current-year emission factors with future-year traffic data.

HS2 Technical Study – Section 5: Air Quality Site 18/Canterbury Works Site R12922T101A
Pell Frischmann Page 71
Table D.1: Summary of Traffic Data used in the Assessment (AADT) a
Road Link 2013 2018 (Without
Scheme)
2018 (With
Site 18)
2018 (With
Canterbury
Works)
AADT %HD
V
AADT %HD
V
AADT %HD
V
AADT %HD
V
Salusbury Road
(North of
Brondesbury
Road)
14,60
4
5.1 14,86
6
5.1 14,89
1
5.2 14,89
1
5.2
Salusbury Road
(South of
Brondesbury
Road)
30,55
7
4.6 31,10
6
4.6 31,13
1
4.6 31,13
1
4.6
Salusbury
(Premier Corner
RB entrance)
15,27
9
4.6 15,55
3
4.6 15,56
5
4.6 15,56
5
4.6
Salusbury
(Premier Corner
RB)
5,070 16.0 5,162 16.0 5,187 16.1 5,187 16.1
Salusbury
(Premier Corner
RB exit)
8,089 5.6 8,235 5.6 8,235 5.6 8,235 5.6
Harvist Road 9,938 5.4 10,11
7
5.4 10,11
7
5.4 10,11
7
5.4
Brondesbury Road 14,81
1
6.7 15,07
6
6.7 15,07
6
6.7 15,07
6
6.7
Premier Corner
(North)
15,27
9
4.6 15,55
3
4.6 15,56
5
4.6 15,56
5
4.6
Premier Corner
(South)
5,070 16.0 5,162 16.0 5,174 16.0 5,174 16.0
Kilburn Lane
(Premier Corner
RB east)
8,089 5.6 8,235 5.6 8,235 5.6 8,235 5.6
Kilburn Lane
(Premier Corner
RB)
5,070 16.0 5,162 16.0 5,187 16.1 5,187 16.1

HS2 Technical Study – Section 5: Air Quality Site 18/Canterbury Works Site R12922T101A
Pell Frischmann Page 72
Kilburn Lane (west
of RB)
10,14
1
16.0 10,32
3
16.0 10,34
8
16.0 10,34
8
16.0
Fernhead Road 18,56
9
5.1 18,90
2
5.1 18,90
2
5.1 18,90
2
5.1
Banister Road 10,14
1
16.0 10,32
3
16.0 10,34
8
16.0 10,34
8
16.0
Chamberlayne
(North of Kilburn
Lane)
12,65
4
11.3 12,88
2
11.3 12,89
4
11.3 12,89
4
11.3
Chamberlayne
(South of Kilburn
Lane)
12,10
6
7.6 12,32
3
7.6 12,33
6
7.7 12,33
6
7.7
Carlton Vale 16,17
9
5.6 16,47
0
5.6 16,47
0
5.6 16,47
0
5.6
Albert Road b 0 0.0 0 0.0 0 0.0 50 30.0
Canterbury Roadb 0 0.0 0 0.0 0 0.0 50 30.0
a This is just a summary of the data entered into the model, which have been input as
hourly average flows of motorcycles, cars, buses, Light Goods Vehicles and Heavy
Goods Vehicles, as well as diurnal flow profiles for these vehicles.
b There is no baseline traffic data for Albert Road or Canterbury Road and therefore
only development traffic is presented.

HS2 Technical Study – Section 5: Air Quality Site 18/Canterbury Works Site R12922T101A
Pell Frischmann Page 73
5.6.4.13 Diurnal flow profiles for the traffic have been derived from the national diurnal profiles
published by DfT (DfT, 2011). Figure D.1 shows the road network included within the
model and defines the study area.
Figure D.1:Modelled Road Network
Contains Ordnance Survey data © Crown copyright and database right [2014]

HS2 Technical Study – Section 5: Air Quality Site 18/Canterbury Works Site R12922T101A
Pell Frischmann Page 74
5.6.4.14 Model Verification
In order to ensure that ADMS-Roads accurately predicts local concentrations, it is
necessary to verify the model against local measurements. The verification
methodology is described below.
5.6.4.15 Background Concentrations
5.6.4.16 Background concentrations of nitrogen dioxide have been taken from the national
maps of background concentrations available from the Defra LAQM Support website
(Defra, 2014a). The background concentrations for each of the diffusion tube locations
are presented in Table D.2.
Table D.2: Background Concentrations used in the Verification for 2013
Diffusion Tube Grid square NOx NO2
BRT48 - Kilburn Park Road 525202,182526 66.5 36.8
BRT56 – Chamberlayne
Road
523635,183153 59.7 33.1
5.6.4.17 Traffic Data
5.6.4.18 Traffic data for the roads adjacent to the verification sites have been taken from the
London Atmospheric Emissions Inventory (LAEI) (GLA, 2013). A summary of the
traffic data used in the model verification are presented in Table D.3.
Table D.3: AADT Traffic Data used in the Model Verification
Road Link AADT %HDV
Chamberlayne Road 10,157 12.5
Kilburn Park Road 5,391 27.1
Shirland Road East of
Kilburn Park Road
3,253 19.0
Shirland Road West of
Kilburn Park Road
6,684 18.9
Shirland Road West of
Walterton Road
8,913 7.8
5.6.4.19 Nitrogen Dioxide
5.6.4.20 Most nitrogen dioxide (NO2) is produced in the atmosphere by reaction of nitric oxide
(NO) with ozone. It is therefore most appropriate to verify the model in terms of
primary pollutant emissions of nitrogen oxides (NOx = NO + NO2). The model has
been run to predict the annual mean NOx concentrations during 2013 at the Kilburn

HS2 Technical Study – Section 5: Air Quality Site 18/Canterbury Works Site R12922T101A
Pell Frischmann Page 75
Park Road and Chamberlayne Road diffusion tube monitoring sites. Concentrations
have been modelled at 2.5 m, the height of the monitors.
5.6.4.21 The model output of road-NOx (i.e. the component of total NOx coming from road
traffic) has been compared with the ‘measured’ road-NOx. Measured road-NOx has
been calculated from the measured NO2 concentrations and the predicted background
NO2 concentration using the NOx from NO2 calculator available on the Defra LAQM
Support website (Defra, 2014a).
5.6.4.22 A primary adjustment factor has been determined as the slope of the best-fit line
between the ‘measured’ road contribution and the model derived road contribution,
forced through zero (Figure D.2). This factor has then been applied to the modelled
road-NOx concentration for each receptor to provide adjusted modelled road-NOx
concentrations. The total nitrogen dioxide concentrations have then been determined
by combining the adjusted modelled road-NOx concentrations with the predicted
background NO2 concentration within the NOx from NO2 calculator. A secondary
adjustment factor has finally been calculated as the slope of the best-fit line applied to
the adjusted data and forced through zero (Figure D.3).
5.6.4.23 The following primary and secondary adjustment factors have been applied to all
modelled nitrogen dioxide data:
Primary adjustment factor : 4.691
Secondary adjustment factor: 1.001
5.6.4.24 The results imply that the model has under predicted the road-NOx contribution. This
is a common experience with this and most other models. The final NO2 adjustment is
minor.
5.6.4.25 Figure D.4 compares final adjusted modelled total NO2 at each of the monitoring sites,
to measured total NO2, and shows a 1:1 relationship.

HS2 Technical Study – Section 5: Air Quality Site 18/Canterbury Works Site R12922T101A
Pell Frischmann Page 76
Figure D.1: Comparison of Measured Road NOx to Unadjusted Modelled Road NOx
Concentrations. The dashed lines show ± 25%.
Figure D.2: Comparison of Measured Total NO2 to Primary Adjusted Modelled Total NO2
Concentrations. The dashed lines show ± 25%.
y = 4.6908x
0
10
20
30
40
50
60
70
80
90
100
110
120
0 10 20 30 40 50 60 70 80 90 100 110 120
Measu
red
Ro
ad
-NO
x (
µg
/m3)
Unadjusted Modelled Road-NOx (µg/m3)
1:1 Line
y = 1.0013x
0
10
20
30
40
50
60
70
80
0 10 20 30 40 50 60 70 80
Measu
red
NO
2 (
µg
/m3)
Adjusted Modelled NO2 (µg/m3)
1:1 Line 1:1 Line

HS2 Technical Study – Section 5: Air Quality Site 18/Canterbury Works Site R12922T101A
Pell Frischmann Page 77
Figure D.3: Comparison of Measured Total NO2 to Final Adjusted Modelled Total NO2
Concentrations. The dashed lines show ± 25%.
5.6.4.26 PM10 and PM2.5
5.6.4.27 There are no nearby PM10 or PM2.5 monitors. It has therefore not been possible to
verify the model for PM10 or PM2.5. The model outputs of road-PM10 and road-PM2.5
have therefore been adjusted by applying the primary adjustment factor calculated for
road NOx.
5.6.4.28 Model Post-processing
5.6.4.29 Nitrogen oxides and nitrogen dioxide
5.6.4.30 The model predicts road-NOx concentrations at each receptor location. These
concentrations have then been adjusted using the primary adjustment factor, which,
along with the background NO2, is processed through the NOx from NO2 calculator
available on the Defra LAQM Support website (Defra, 2014a). The traffic mix within
the calculator has been set to “All London traffic”, which is considered suitable for the
study area. The calculator predicts the component of NO2 based on the adjusted road-
NOx and the background NO2. This is then adjusted by the secondary adjustment
factor to provide the final predicted concentrations.
0
10
20
30
40
50
60
70
80
0 10 20 30 40 50 60 70 80
Measu
red
NO
2 (
µg
/m3)
Adjusted Modelled NO2 (µg/m3)
1:1 Line 1:1 Line

HS2 Technical Study – Section 5: Air Quality Site 18/Canterbury Works Site R12922T101A
Pell Frischmann Page 78
5.6.4.31 PM10 and PM2.5
5.6.4.32 The number of exceedences of 50 μg/m3 as a 24-hour mean PM10 concentration has
been calculated from the adjusted-modelled total annual mean concentration following
the relationship advised by (Defra, 2009):
A = -18.5 + 0.00145 B3 + 206/B
where A is the number of exceedences of 50 μg/m3 as a 24-hour mean PM10
concentration and B is the annual mean PM10 concentration. The relationship is only
applied to annual mean concentrations greater than 16.5 μg/m3. Below this
concentration, the number of 24-hour exceedences is assumed to be zero.

HS2 Technical Study – Section 5: Air Quality Site 18/Canterbury Works Site R12922T101A
Pell Frischmann Page 79
5.6.5 APPENDIX E – Construction Mitigation
5.6.5.1 The following is a set of measures that should be incorporated into the
specification for the works. All measures are highly recommended for Site 18.
Those measures is normal type font are highly recommended for Canterbury
Works, and those measures highlighted in italics are only desirable measures for
Canterbury Works, reflecting the lower sensitivity of the site:
5.6.5.2 Communications
develop and implement a stakeholder communications plan that includes
community engagement before and during work on site;
display the name and contact details of person(s) accountable for air
quality and dust issues on the site boundary. This may be the
environmental manager/engineer or the site manager; and
display the head or regional office contact information.
5.6.5.3 Dust Management Plan
Develop and implement a Dust Management Plan (DMP) approved by the
Local Authority which documents the mitigation measures to be applied,
and the procedures for their implementation and management.
5.6.5.4 Site Management
Record all dust and air quality complaints, identify cause(s), take
appropriate measures to reduce emissions in a timely manner, and record
the measures taken;
make the complaints log available to the local authority when asked;
record any exceptional incidents that cause dust and/or air emissions,
either on- or off- site, and the action taken to resolve the situation in the log
book; and
hold regular liaison meetings with other high risk construction sites within
500 m of the site boundary, to ensure plans are co-ordinated and dust and
particulate matter emissions are minimised. It is important to understand
the interactions of the off-site transport/deliveries which might be using the
same strategic road network routes.
5.6.5.5 Monitoring
Undertake daily on-site and off-site inspections where receptors (including
roads) are nearby, to monitor dust, record inspection results, and make the
log available to the Local Authority when asked. This should include
regular dust soiling checks of surfaces such as street furniture, cars and
HS2 Technical Study – Section 5: Air Quality Site 18/Canterbury Works Site R12922T101A
Pell Frischmann Page 80
window sills within 100 m of the site boundary, with cleaning to be
provided if necessary;
carry out regular site inspections to monitor compliance with the DMP,
record inspection results, and make an inspection log available to the
Local Authority when asked;
increase the frequency of site inspections by the person accountable for
air quality and dust issues on site when activities with a high potential to
produce dust are being carried out and during prolonged dry or windy
conditions; and
agree dust deposition, dust flux, or real-time PM10 continuous monitoring
locations with the Local Authority. Where possible commence baseline
monitoring at least three months before work commences on site or, if it is
a large site, before work on a phase commences. Further guidance is
provided by IAQM on monitoring during demolition, earthworks and
construction (Institute of Air Quality Management, 2012b)
5.6.5.6 Preparing and Maintaining the Site
Plan the site layout so that machinery and dust-causing activities are
located away from receptors, as far as is possible;
erect solid screens or barriers around dusty activities or the site boundary
that are at least as high as any stockpiles on site;
fully enclose site or specific operations where there is a high potential for
dust production and the site is active for an extensive period;
avoid site runoff of water or mud;
keep site fencing, barriers and scaffolding clean using wet methods;
remove materials that have a potential to produce dust from site as soon
as possible, unless being re-used on site. If they are being re-used on-site
cover as described below; and
cover, seed, or fence stockpiles to prevent wind whipping.
5.6.5.7 Operating Vehicle/Machinery and Sustainable Travel
Ensure all on-road vehicles comply with the requirements of the London
Low Emission Zone, and the London Non-road Mobile Machinery
standards, where applicable;
ensure all vehicles switch off their engines when stationary – no idling
vehicles;

HS2 Technical Study – Section 5: Air Quality Site 18/Canterbury Works Site R12922T101A
Pell Frischmann Page 81
avoid the use of diesel- or petrol-powered generators and use mains
electricity or battery-powered equipment where practicable;
impose and signpost a maximum-speed-limit of 15 mph on surfaced and
10 mph on un-surfaced haul roads and work areas (if long haul routes are
required these speeds may be increased with suitable additional control
measures provided, subject to the approval of the nominated undertaker
and with the agreement of the local authority, where appropriate);
produce a Construction Logistics Plan to manage the sustainable delivery
of goods and materials; and
implement a Travel Plan that supports and encourages sustainable staff
travel (public transport, cycling, walking, and car-sharing).
5.6.5.8 Operations
Only use cutting, grinding or sawing equipment fitted or in conjunction with
suitable dust suppression techniques such as water sprays or local
extraction, e.g. suitable local exhaust ventilation systems;
ensure an adequate water supply on the site for effective dust/particulate
matter suppression/mitigation, using non-potable water where possible
and appropriate;
use enclosed chutes, conveyors and covered skips;
minimise drop heights from conveyors, loading shovels, hoppers and other
loading or handling equipment and use fine water sprays on such
equipment wherever appropriate; and
ensure equipment is readily available on site to clean any dry spillages,
and clean up spillages as soon as reasonably practicable after the event
using wet cleaning methods.
5.6.5.9 Waste Management
Avoid bonfires and burning of waste materials.
5.6.5.10 Measures Specific to Demolition
Soft strip inside buildings before demolition (retaining walls and windows in
the rest of the building where possible, to provide a screen against dust);
ensure effective water suppression is used during demolition operations.
Hand held sprays are more effective than hoses attached to equipment as
the water can be directed to where it is needed. In addition high volume

HS2 Technical Study – Section 5: Air Quality Site 18/Canterbury Works Site R12922T101A
Pell Frischmann Page 82
water suppression systems, manually controlled, can produce fine water
droplets that effectively bring the dust particles to the ground;
avoid explosive blasting, using appropriate manual or mechanical
alternatives; and
bag and remove any biological debris or damp down such material before
demolition.
5.6.5.11 Measures Specific to Earthworks
Re-vegetate earthworks and exposed areas/soil stockpiles to stabilise
surfaces as soon as practicable; and
use Hessian, mulches or trackifiers where it is not possible to re-vegetate
or cover with topsoil, as soon as practicable.
5.6.5.12 Measures Specific to Construction
Avoid scabbling (roughening of concrete surfaces), if possible;
ensure sand and other aggregates are stored in bunded areas and are not
allowed to dry out, unless this is required for a particular process, in which
case ensure that appropriate additional control measures are in place; and
ensure bulk cement and other fine powder materials are delivered in
enclosedtankers and stored in silos with suitable emission control systems
to prevent escape of material and overfilling during delivery.
5.6.5.13 Measures Specific to Trackout
Use water-assisted dust sweeper(s) on the access and local roads, to
remove, as necessary, any material tracked out of the site. This may
require the sweeper being continuously in use;
avoid dry sweeping of large areas;
ensure vehicles entering and leaving sites are covered to prevent escape
of materials during transport;
inspect on-site haul routes for integrity and instigate necessary repairs to
the surface as soon as reasonably practicable;
install hard surfaced haul routes/areas of hard standing, which are
regularly damped down with fixed or mobile sprinkler systems or mobile
water bowsers, and regularly cleaned;

HS2 Technical Study – Section 5: Air Quality Site 18/Canterbury Works Site R12922T101A
Pell Frischmann Page 83
implement a wheel washing system (with rumble grids to dislodge
accumulated dust and mud prior to leaving the site where reasonably
practicable);
ensure there is an adequate area of hard surfaced road between the wheel
wash facility and the site exit, wherever site size and layout permits; and
access gates should be located at least 10 m from receptors, where
possible.