How U.S. exports are faring in the world wheat market U.S. exports are faring in the world wheat...
15
How U .S . exports are faring in the world wheat market Foreign exporters chipped away at the U .S . share of the international market between 1980 and 1984 ; noncompetitive U .S . prices and the strong dollar were factors in the erosion, although Federal agricultural policies and aggressive marketing by competitors abroad also played a part TODD DARR AND GERRY GRIBBONS In January 1985, a major U.S . grain merchant announced plans to import foreign wheat for processing in the Mid- west .' Prices for this wheat were below those quoted by any U.S . supplier . While the unprecedented plan was can- celed due to strong protests from agricultural interest groups, it provides an extreme example of what many in the U .S . agricultural community claim is a growing problem-the erosion of the U.S . share of the world wheat market . The likelihood of similar incidents in the near future has caused a great deal of concern among export-dependent U .S . wheat farmers, currently burdened with huge excess stocks, and policymakers in the process of preparing the 1985 farm bill . Although U.S . wheat exports were more than $6 billion in marketing year 1983/84, making up one-sixth of the total value of the Nation's agricultural exports, they had declined over the last 3 years, according to U .S . Department of Agriculture figures . From a peak of 48 .8 million metric tons in 1981, wheat exports fell 22 percent to 38 .1 metric tons in the 1983/84 marketing year . Much of this decline has been attributed to U .S . export prices, which are above those of other major exporting countries . Significantly, the decline in exports occurred even though U.S . export prices for the five major classes2 of exported wheat trended downward over the 1980-84 period .3 (See chart 1 .) Todd Darr and Gerry Gribbons are economists in the Division of Inter- national Prices, Bureau of Labor Statistics . The United States relies heavily on exports to maintain the vitality of its wheat industry . Therefore, this article attempts to ascertain the trend of U .S . wheat prices relative to the price trends of other major participants in the world wheat market . Recent international developments are re- viewed in terms of the activities of each of the major par- ticipants in the world wheat trade-the United States, Argentina, Canada, Australia, and the European Commu- nity-with special emphasis on the last 5 years . A simple linear regression model is employed to determine whether a particular country's prices declined relative to U .S . prices at a statistically significant level between 1980 and 1984, and the degree of the decline if present . The world wheat situation Of all internationally traded grains, wheat accounts for the largest land area ; almost 22 percent of the world's crop- lands are devoted to its production .' Output of wheat world- wide in the 1983/84 marketing year was 490 million metric tons, surpassing records set in the previous 3 years, and amounting to a 40-percent increase since 1975 . The People's Republic of China, the Soviet Union, the United States, the European Community,5 and India, in that order, have led the world in production over the last several years . China, for instance, boosted its production capabilities by over 26 million metric tons between 1980 and 1984 . In China and elsewhere, much of the increase in production may be at- 10
Transcript of How U.S. exports are faring in the world wheat market U.S. exports are faring in the world wheat...
How U.S . exports are faring in the world wheat market Foreign exporters chipped away at the U.S . share of the international market between 1980 and 1984; noncompetitive U.S. prices and the strong dollar were factors in the erosion, although Federal agricultural policies and aggressive marketing by competitors abroad also played a part
TODD DARR AND GERRY GRIBBONS
In January 1985, a major U.S . grain merchant announced plans to import foreign wheat for processing in the Mid-west .' Prices for this wheat were below those quoted by any U.S . supplier . While the unprecedented plan was can-celed due to strong protests from agricultural interest groups, it provides an extreme example of what many in the U.S . agricultural community claim is a growing problem-the erosion of the U.S . share of the world wheat market . The likelihood of similar incidents in the near future has caused a great deal of concern among export-dependent U.S . wheat farmers, currently burdened with huge excess stocks, and policymakers in the process of preparing the 1985 farm bill .
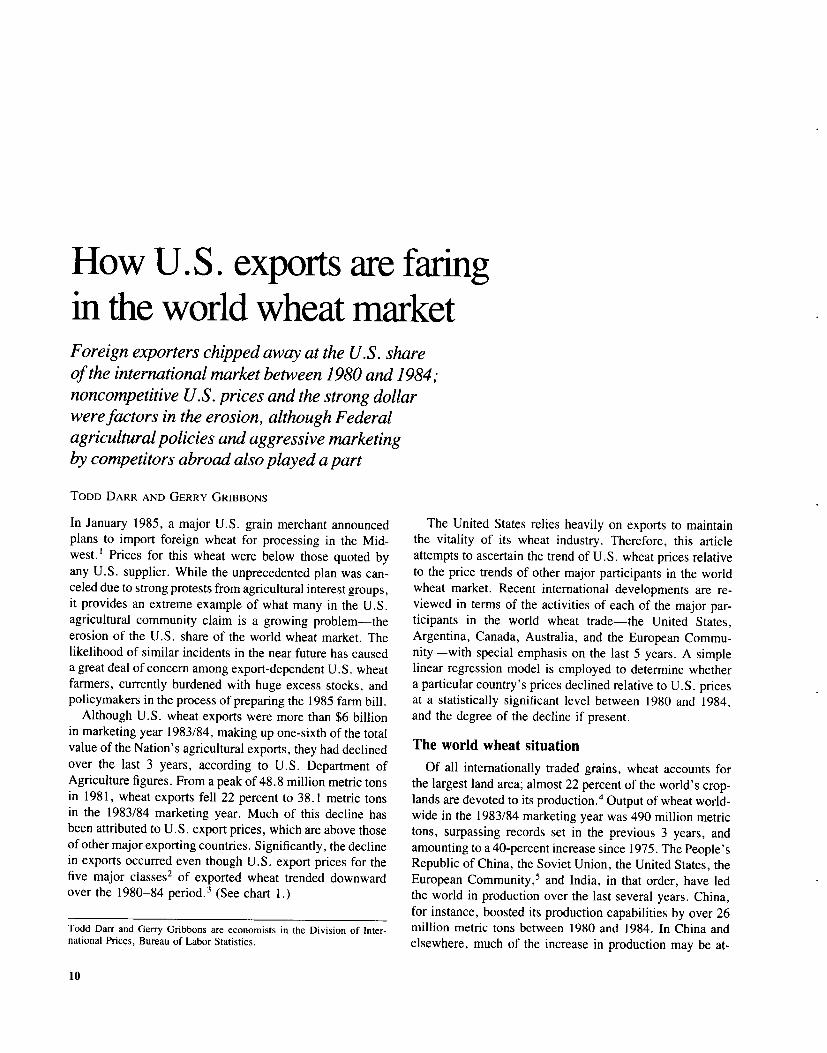
Although U.S . wheat exports were more than $6 billion in marketing year 1983/84, making up one-sixth of the total value of the Nation's agricultural exports, they had declined over the last 3 years, according to U.S . Department of Agriculture figures. From a peak of 48 .8 million metric tons in 1981, wheat exports fell 22 percent to 38.1 metric tons in the 1983/84 marketing year . Much of this decline has been attributed to U.S . export prices, which are above those of other major exporting countries . Significantly, the decline in exports occurred even though U.S . export prices for the five major classes2 of exported wheat trended downward over the 1980-84 period .3 (See chart 1 .)
Todd Darr and Gerry Gribbons are economists in the Division of Inter-national Prices, Bureau of Labor Statistics .
The United States relies heavily on exports to maintain the vitality of its wheat industry . Therefore, this article attempts to ascertain the trend of U.S . wheat prices relative to the price trends of other major participants in the world wheat market . Recent international developments are re-viewed in terms of the activities of each of the major par-ticipants in the world wheat trade-the United States, Argentina, Canada, Australia, and the European Commu-nity-with special emphasis on the last 5 years . A simple linear regression model is employed to determine whether a particular country's prices declined relative to U.S . prices at a statistically significant level between 1980 and 1984, and the degree of the decline if present .
The world wheat situation Of all internationally traded grains, wheat accounts for
the largest land area ; almost 22 percent of the world's crop-lands are devoted to its production .' Output of wheat world-wide in the 1983/84 marketing year was 490 million metric tons, surpassing records set in the previous 3 years, and amounting to a 40-percent increase since 1975 . The People's Republic of China, the Soviet Union, the United States, the European Community,5 and India, in that order, have led the world in production over the last several years . China, for instance, boosted its production capabilities by over 26 million metric tons between 1980 and 1984 . In China and elsewhere, much of the increase in production may be at-
10

Chart 1 . U .S . wheat export price index, weighted quarterly averages, 1980-84
(March 1980 = 1001 115 .
110
105
100
5
90
I' 1980 1981 1982 1983 1984
tributed to improved production practices and the active role taken by some governments to improve the international competitiveness of their agricultural sectors.
These efforts to increase production have been met by increased world demand for wheat, with the result that world trade in the commodity has more than doubled since 1960 . From slightly over 40 million metric tons in the 1960/61 marketing year, international trade has increased steadily over the last two decades ; in 1981/82, more than 100 million metric tons crossed national borders for the first time in history .
Demographic and economic factors mainly account for the significant rise in demand for wheat . For example, there has been rapid growth in both population and disposable income in many importing countries, particularly the petro-leum-exporting and middle-income developing countries. Simultaneously, there has been a massive population shift in many of these countries from rural areas to cities . These phenomena have resulted in a greater sophistication about foods and increased demand for staple foods, like bread.
Climatic conditions have also fueled demand for wheat . Over the last 20 years, the nations of central Africa, at one time largely self-sufficient, have faced severe droughts which curbed domestic production and forced them to look beyond their borders for grain to feed their rapidly increasing pop-ulations . Weather conditions in the 1970's forced the Soviet Union to import wheat, which significantly increased activ-ity on the world market . Another factor boosting world demand has been the special efforts of several countries, including the United States, over the last 10 years to en-courage developing nations to import wheat through food aid programs . For example, the United States, through its Food for Peace program (Public Law 480), provides wheat and other agricultural commodities to developing countries under loan terms considerably more favorable than those
prevailing in the commercial market . Additionally, Egypt and Brazil have programs which subsidize imported wheat for consumers .
Another interesting trend in the world wheat market in recent years is the decline in import activity of developed countries and the simultaneous increase in imports by cen-trally planned economies . European Community (EC) im-ports dropped by about 44 percent from the early 1970's to the early 1980'x, as this group of nations steadily worked toward self-sufficiency . This decline is most marked for marketing years 1979/80 to 1983/84, during which EC im-ports of wheat fell almost 25 percent. On the other hand, imports by most of the centrally planned economies of East-ern Europe have risen steadily over the last several years . In particular, the Soviet Union increased imports dramati-cally in the last 5 years, from 12 .1 million metric tons to 20.0 million metric tons, or 65 percent . This development was precipitated by poor harvests and the Soviet decision to import grain rather than modify domestic consumption patterns . The import decisions led to trade agreements with
the United States and a number of other grain exporting
countries . In addition, China entered the world wheat market
in the last 5 years as a significant buyer. Imports by that
nation increased from 2.2 to 10.0 million metric tons, or
by 350 percent, over the last decade, largely because of the normalization of relations with the West.'
Another major importer of wheat is Japan . Annual pur-chases averaged 5 .7 million metric tons, 6 percent of the total volume of world wheat imports, for the last 5 years . The rise in Japanese imports was most dramatic in the early 1970's, as income levels in Japan grew and the Japanese began to consume more western-type foods such as bread and noodles. However, imports leveled off over the period 1980-84, rising incomes evidently no longer spurring the demand for wheat .
Export markets for wheat are much more concentrated than import markets . While the four major importers-Ja-pan, China, the Soviet Union, and the European Commu-nity-accounted for only 40 percent of all imports in 1984, export markets are almost totally dominated by five pro-ducers : The United States, Canada, the European Com-munity, Australia, and Argentina produced 95 percent of all wheat exported in the 1980-84 period .
Over this same 5-year span, two of the three traditional leaders in world wheat exports experienced considerable declines in market share . U .S . exports fell from 43 .2 to 37 .6 percent of total wheat exports and Australia's share declined from 17.3 to 11 .8 percent, while Canada raised its share from 17.4 to 20.2 percent. Meanwhile, Argentina and the European Community, whose exports were considered negligible in the world wheat market before the late 1970'x,
boosted their market shares from 5 .6 percent to 9.3 percent
and from 12 .0 percent to 15 .8 percent, respectively . For
marketing year 1984/85, the decline in U.S . market share
is forecast to cost the Nation an estimated $900 million in
11
MONTHLY LABOR REVIEW October 1985 a U.S . Wheat Exports, 1980-84
export revenues, and Australia, an estimated $880 million . On the other hand, Canada will gain $450 million, Argen-tina, $596 million, and the European Community, $613 million in increased revenues .
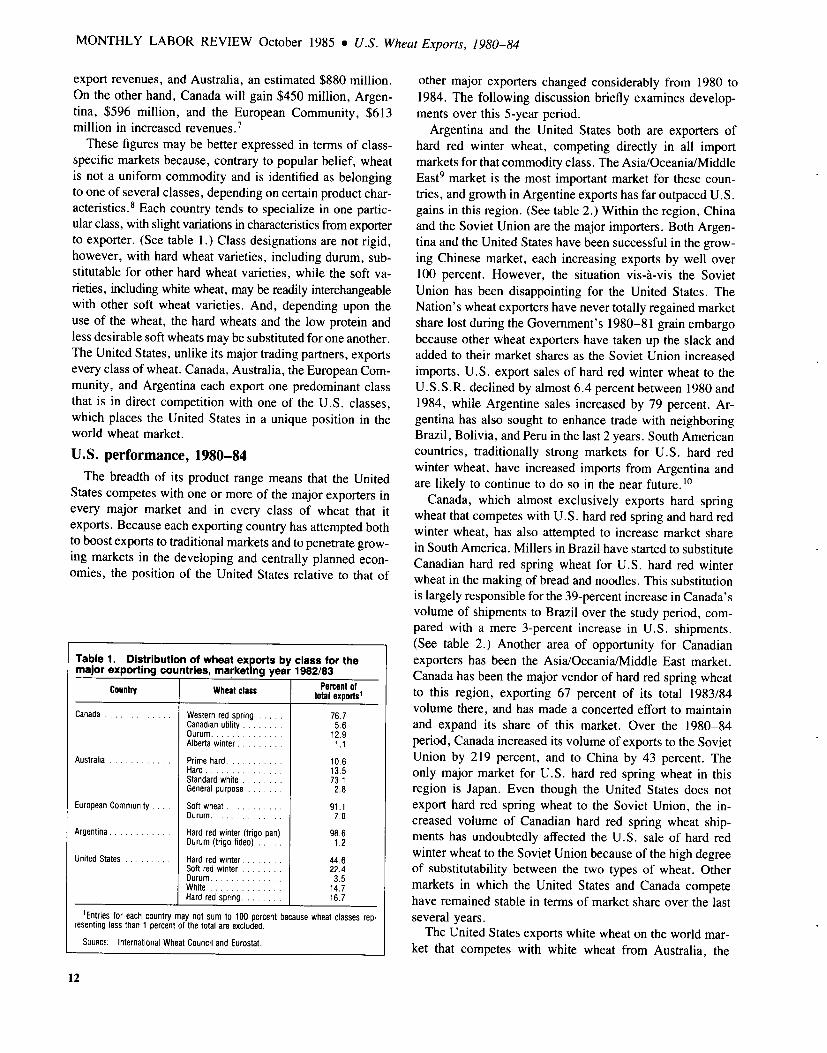
These figures may be better expressed in terms of class-specific markets because, contrary to popular belief, wheat is not a uniform commodity and is identified as belonging to one of several classes, depending on certain product char-acteristics.' Each country tends to specialize in one partic-ular class, with slight variations in characteristics from exporter to exporter . (See table 1 .) Class designations are not rigid, however, with hard wheat varieties, including durum, sub-stitutable for other hard wheat varieties, while the soft va-rieties, including white wheat, may be readily interchangeable with other soft wheat varieties. And, depending upon the use of the wheat, the hard wheats and the low protein and less desirable soft wheats may be substituted for one another. The United States, unlike its major trading partners, exports every class of wheat. Canada, Australia, the European Com-munity, and Argentina each export one predominant class that is in direct competition with one of the U.S . classes, which places the United States in a unique position in the world wheat market .
U.S . performance, 1980-84 The breadth of its product range means that the United
States competes with one or more of the major exporters in every major market and in every class of wheat that it exports. Because each exporting country has attempted both to boost exports to traditional markets and to penetrate grow-ing markets in the developing and centrally planned econ-omies, the position of the United States relative to that of
Table 1 . Distribution of wheat exports by class for the major exporting countries, marketing year 1982/83
Country Wheat class Percent of total exports'
Canada . . . . . . . . . . . . . Western red spring . . . . . 76 .7 Canadian utility . . . . . . . . 5 .6 Durum . . . . . . . . . . . . . . 12 .9 Alberta winter . . . . . . . . . 1 .1
Australia . . . . . . . . . . . . Prime hard . . . . . . . . . . . 10 .6 Hard . . . . . . . . . . . . . . . 13 .5 Standard white . . . . . . . . 73 .1 General purpose . . . . . . . 2.8
European Community . . . . Soft wheat . . . . . . . . . . . 91 .1 Durum . . . . . . . . . . . . . . 7 .0
Argentina . . . . . . . . . . . . Hard red winter (trigo pan) 98 .6 Durum (trigo fideo) . . . . . 1 .2
United States . . . . . . . . . Hard red winter . . . . . . . . 44 .6 Soft red winter . . . . . . . . 22 .4 Durum. . . . . . . . . . . . . . 3 .5 White . . . . . . . . . . . . . . 14 .7 Hard red spring . . . . . . . . 16 .7
'Entries for each country may not sum to 100 percent because wheat classes rep- resenting less than 1 percent of the total are excluded .
SOURCE : International Wheat Council and Eurostat .
other major exporters changed considerably from 1980 to 1984 . The following discussion briefly examines develop-ments over this 5-year period .
Argentina and the United States both are exporters of hard red winter wheat, competing directly in all import markets for that commodity class. The Asia/Oceania/Middle East9 market is the most important market for these coun-tries, and growth in Argentine exports has far outpaced U.S . gains in this region . (See table 2 .) Within the region, China and the Soviet Union are the major importers . Both Argen-tina and the United States have been successful in the grow-ing Chinese market, each increasing exports by well over 100 percent. However, the situation vis-a-vis the Soviet Union has been disappointing for the United States . The Nation's wheat exporters have never totally regained market share lost during the Government's 1980-81 grain embargo because other wheat exporters have taken up the slack and added to their market shares as the Soviet Union increased imports. U.S . export sales of hard red winter wheat to the U.S .S .R . declined by almost 6.4 percent between 1980 and 1984, while Argentine sales increased by 79 percent. Ar-gentina has also sought to enhance trade with neighboring Brazil, Bolivia, and Peru in the last 2 years. South American countries, traditionally strong markets for U.S . hard red winter wheat, have increased imports from Argentina and are likely to continue to do so in the near future.'o Canada, which almost exclusively exports hard spring
wheat that competes with U.S . hard red spring and hard red winter wheat, has also attempted to increase market share in South America . Millers in Brazil have started to substitute Canadian hard red spring wheat for U.S . hard red winter wheat in the making of bread and noodles. This substitution is largely responsible for the 39-percent increase in Canada's volume of shipments to Brazil over the study period, com-pared with a mere 3-percent increase in U.S . shipments. (See table 2.) Another area of opportunity for Canadian exporters has been the Asia/Oceania/Middle East market . Canada has been the major vendor of hard red spring wheat to this region, exporting 67 percent of its total 1983/84 volume there, and has made a concerted effort to maintain and expand its share of this market . Over the 1980-84 period, Canada increased its volume of exports to the Soviet Union by 219 percent, and to China by 43 percent . The only major market for U.S . hard red spring wheat in this region is Japan. Even though the United States does not export hard red spring wheat to the Soviet Union, the in-creased volume of Canadian hard red spring wheat ship-ments has undoubtedly affected the U.S . sale of hard red winter wheat to the Soviet Union because of the high degree of substitutability between the two types of wheat. Other markets in which the United States and Canada compete have remained stable in terms of market share over the last several years . The United States exports white wheat on the world mar-
ket that competes with white wheat from Australia, the
12

Table 2. Annual volume of wheat exports for major exporting countries, by product class and destination, marketing years 1979/80-1983/84 (In thousands of metric tons)
Product class, exporting country, and marketing year
Hard red winter wheat Trade region
Argentina United States
1979/80 1980/81 1981/82 1982/83 1983/84 1979/80 1980/81 1981/82 1982/83 1983/84
Total . . . . . . . . . . . . . . . . . . . . . . . 4,748 3,932 4,281 7,471 9,592 18,591 17,653 19,637 17,134 17,127
West Europe . . . . . . . . . . . . . . . . . . . . . . . 51 116 22 52 223 873 917 894 346 798 East Europe . . . . . . . . . . . . . . . . . . . . . . . . - - - - 206 1,573 255 22 - - Asia/Oceania/Middle East . . . . . . . . . . . . . . . 2,574 3,392 3,597 6,846 7,071 8,494 8,775 10,672 10,974 10,176 U.S .S .R . . . . . . . . . . . . . . . . . . . . . . . . . 2,021 2,975 3,104 4,218 3,614 4,422 3,000 6,539 3,374 4,141 China . . . . . . . . . . . . . . . . . . . . . . . . . . 465 200 199 1,956 1,010 415 1,693 115 386 1,368
Africa . . . . . . . . . . . . . . . . . . . . . . . . . . . . 36 - 109 36 142 2,018 1,875 1,719 1,529 1,749 Western Hemisphere . . . . . . . . . . . . . . . . . . 2,087 424 554 537 1,881 5,633 5,831 6,330 4,285 4,404
South Americas . . . . . . . . . . . . . . . . . . . . 2,072 392 554 497 1,465 2,120 2,157 2,961 2,113 2,181
Hard red spring wheat
Canada United States
Total . . . . . . . . . . . . . . . . . . . . . . . 14,958 17,016 17,751 21,120 20,926 5,539 4,846 5,530 6,260 5,647 West Europe . . . . . . . . . . . . . . . . . . . . . . . 2,503 2,352 2,157 2,164 2,192 1,561 1,458 1,660 1,257 1,250 East Europe . . . . . . . . . . . . . . . . . . . . . . . . 1,637 1,244 1,525 1,036 193 - - - - - Asia/Oceania/Middle East . . . . . . . . . . . . . . . 7,140 9,803 9,987 14,276 14,049 2,649 2,067 2,409 3,202 2,648 U.S .S .R . . . . . . . . . . . . . . . . . . . . . . . . . 1,806 4,464 4,779 6,953 5,761 - - - - - China . . . . . . . . . . . . . . . . . . . . . . . . . . 2,621 2,911 2,991 4,242 3,737 - - - - - Japan . . . . . . . . . . . . . . . . . . . . . . . . . . 1,300 1,463 1,335 1,357 1,403 853 888 831 987 1,010
Africa . . . . . . . . . . . . . . . . . . . . . . . . . . . . 1,006 1,032 1,441 875 1,764 238 167 204 337 272 Western Hemisphere . . . . . . . . . . . . . . . . . . 2,671 2,585 2,635 2,767 2,728 1,059 1,154 1,257 1,464 1,477
Brazil . . . . . . . . . . . . . . . . . . . . . . . . . . 1,034 1,426 1,204 1,481 1,433 - - - - -
White wheat
Australia United States
Total . . . . . . . . . . . . . . . . . . . . . . . 15,364 11,088 11,405 8,530 11,695 4,960 6,708 7,300 5,578 5,541
Western Europe . . . . . . . . . . . . . . . . . . . . . 1 23 - - - 5 9 16 57 16 East Europe . . . . . . . . . . . . . . . . . . . . . . . . 102 - - - 36 13 164 - - - Asia/Oceania/Middle East . . . . . . . . . . . . . . . 13,297 9,017 9,614 6,558 9,757 4,560 4,910 4,625 4,182 4,625
U .S .S .R . . . . . . . . . . . . . . . . . . . . . . . . . 2,741 2,465 2,348 1,004 1,596 - - - - - China . . . . . . . . . . . . . . . . . . . . . . . . . . 3,575 1,397 1,413 1,170 1,758 379 732 5 - - Japan . . . . . . . . . . . . . . . . . . . . . . . . . . 1,068 914 943 934 1,004 1,073 1,225 1,193 1,049 1,126
Africa . . . . . . . . . . . . . . . . 1,964 2,048 1,785 1,939 1,902 290 1,403 2,483 1,331 852 Egypt . . . . . . . . . . . . . . . . . . . . . . . . . . 1,689 1,846 1,587 1,819 1,703 (2) 1,135 2,483 1,331 807
Western Hemisphere . . . . . . . . . . . . . . . . . . - 32 - 92 222 176 8 48
Soft wheat3
European Community United States
Total . . . . . . . . . . . . . . . . . . . . . . . 10,270 12,683 13,990 14,085 13,681 4,098 8,390 12,391 8,360 5,593 Western Europe' . 319 596 511 182 358 364 456 1,274 324 413 East Europe . . . . . . . . . . . . . . . . . . . . . . . . 1,441 2,108 3,158 1,742 1,418 1,188 721 425 122 283 Asia/Oceania/Middle East . . . . . . . . . . . . . . . 3,363 3,364 3,872 6,997 5,414 1,014 6,213 8,901 5,791 1,809 U.S .S .R . . . . . . . . . . . . . . . . . . . . . . . . . 685 717 1,727 3,396 4,072 - - - - - China . . . . . . . . . . . . . . . . . . . . . . . . . . 90 607 116 1,410 127 800 6,158 7,830 4,938 1,549
Africa . . . . . . . . . . . . . . . . . . . . . . . . . . . . 4,930 6,143 5,755 4,396 5,972 1,270 727 1,360 1,564 2,502 Egypt . . . . . . . . . . . . . . . . . . . . . . . . . . 1,619 2,362 1,050 1,063 2,062 - - - - - Algeria . . . . . . . . . . . . . . . . . . . . . . . . . 564 329 725 673 1,397 - - -
Western Hemisphere . . . . . . . . . . . . . . . . . . 198 377 665 748 384 211 273 433 559 580
'Estimates for the United States pertain only to trade with Brazil, and exclude transactions 3Defined as soft winter wheat for the European Community and as soft red winter wheat with other South American countries . for the United States . Does not include white wheat.
2Data not available . 'Excludes intro-EC trade .
world's other major producer of that commodity. No per-ceptible change in U.S . and Australian market shares oc-curred in the 1980-84 period except in Africa, where U.S . exports increased 193 percent. (See table 2 .) The U.S . ex-
ports white wheat primarily to the Asia/Oceania/Middle East region, where no significant changes in the Nation's market share have occurred in recent years. While Australian ex-ports to the region dropped by 27 percent between 1980 and 1984, the displacement came primarily from increased im-ports of European Community soft wheat, a good substitute for white wheat.
The European Community : a unique case
The European Community, a political and economic or-ganization composed of 10 independent European countries,
presents a unique situation in the world wheat market . These countries, while engaging independently in trade in wheat as well as all other products, operate under an agreement called the Common Agricultural Policy, which regulates trade among the member nations as well as with other na-tions . In adhering to this policy, member countries seek to increase their agricultural productivity, ensure a fair Stan-
13
MONTHLY LABOR REVIEW October 1985 9 U.S . Wheat Exports, 1980-84
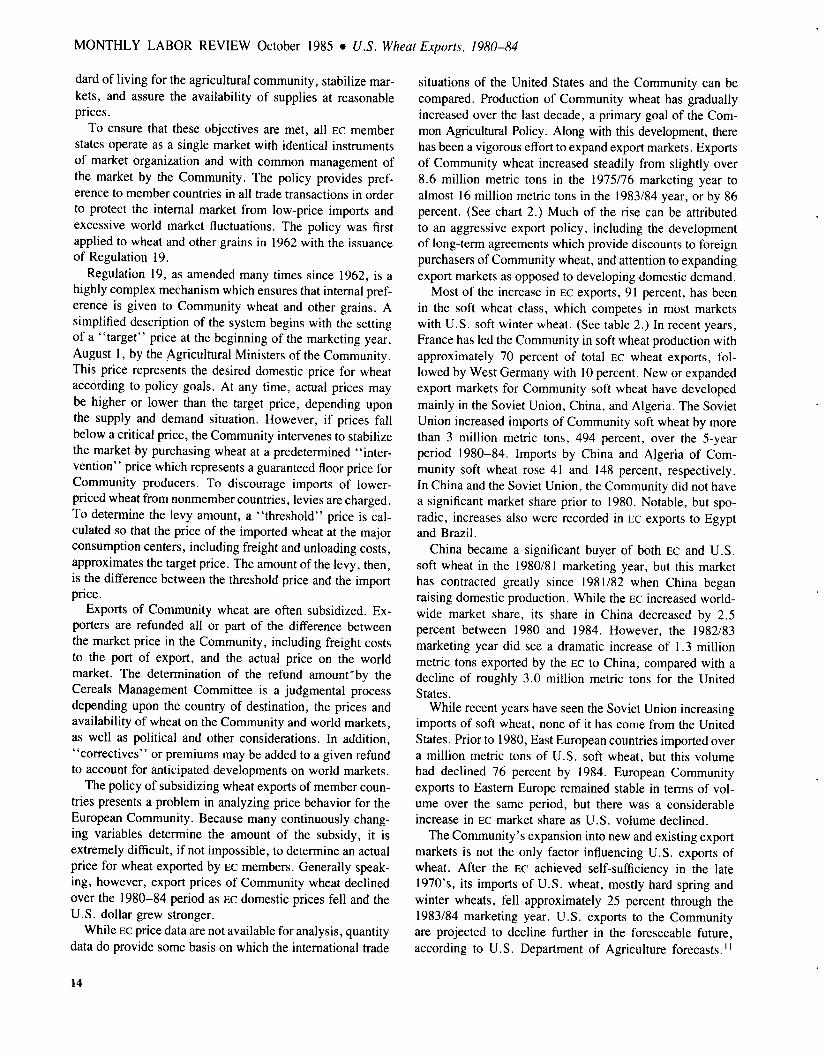
dard of living for the agricultural community, stabilize mar-kets, and assure the availability of supplies at reasonable prices . To ensure that these objectives are met, all EC member
states operate as a single market with identical instruments of market organization and with common management of the market by the Community . The policy provides pref-erence to member countries in all trade transactions in order to protect the internal market from low-price imports and excessive world market fluctuations . The policy was first applied to wheat and other grains in 1962 with the issuance of Regulation 19 .
Regulation 19, as amended many times since 1962, is a highly complex mechanism which ensures that internal pref-erence is given to Community wheat and other grains . A simplified description of the system begins with the setting of a "target" price at the beginning of the marketing year, August 1, by the Agricultural Ministers of the Community . This price represents the desired domestic price for wheat according to policy goals. At any time, actual prices may be higher or lower than the target price, depending upon the supply and demand situation. However, if prices fall below a critical price, the Community intervenes to stabilize the market by purchasing wheat at a predetermined "inter-vention" price which represents a guaranteed floor price for Community producers . To discourage imports of lower-priced wheat from nonmember countries, levies are charged . To determine the levy amount, a "threshold" price is cal-culated so that the price of the imported wheat at the major consumption centers, including freight and unloading costs, approximates the target price. The amount of the levy, then, is the difference between the threshold price and the import price.
Exports of Community wheat are often subsidized . Ex-porters are refunded all or part of the difference between the market price in the Community, including freight costs to the port of export, and the actual price on the world market . The determination of the refund amount'by the Cereals Management Committee is a judgmental process depending upon the country of destination, the prices and availability of wheat on the Community and world markets, as well as political and other considerations . In addition, "correctives" or premiums may be added to a given refund to account for anticipated developments on world markets. The policy of subsidizing wheat exports of member coun-
tries presents a problem in analyzing price behavior for the European Community . Because many continuously chang-ing variables determine the amount of the subsidy, it is extremely difficult, if not impossible, to determine an actual price for wheat exported by EC members. Generally speak-ing, however, export prices of Community wheat declined over the 1980-84 period as Ec domestic prices fell and the U.S . dollar grew stronger .
While EC price data are not available for analysis, quantity data do provide some basis on which the international trade
situations of the United States and the Community can be compared . Production of Community wheat has gradually increased over the last decade, a primary goal of the Com-mon Agricultural Policy . Along with this development, there has been a vigorous effort to expand export markets . Exports of Community wheat increased steadily from slightly over 8 .6 million metric tons in the 1975/76 marketing year to almost 16 million metric tons in the 1983/84 year, or by 86 percent. (See chart 2.) Much of the rise can be attributed to an aggressive export policy, including the development of long-term agreements which provide discounts to foreign purchasers of Community wheat, and attention to expanding export markets as opposed to developing domestic demand .
Most of the increase in Ec exports, 91 percent, has been in the soft wheat class, which competes in most markets with U.S . soft winter wheat. (See table 2.) In recent years, France has led the Community in soft wheat production with approximately 70 percent of total EC wheat exports, fol-lowed by West Germany with 10 percent. New or expanded export markets for Community soft wheat have developed mainly in the Soviet Union, China, and Algeria. The Soviet Union increased imports of Community soft wheat by more than 3 million metric tons, 494 percent, over the 5-year period 1980-84. Imports by China and Algeria of Com-munity soft wheat rose 41 and 148 percent, respectively . In China and the Soviet Union, the Community did not have a significant market share prior to 1980 . Notable, but spo-radic, increases also were recorded in Ec exports to Egypt and Brazil .
China became a significant buyer of both Ec and U.S . soft wheat in the 1980/81 marketing year, but this market has contracted greatly since 1981/82 when China began raising domestic production . While the EC increased world-wide market share, its share in China decreased by 2.5 percent between 1980 and 1984. However, the 1982/83 marketing year did see a dramatic increase of 1 .3 million metric tons exported by the EC to China, compared with a decline of roughly 3 .0 million metric tons for the United States .
While recent years have seen the Soviet Union increasing imports of soft wheat, none of it has come from the United States . Prior to 1980, East European countries imported over a million metric tons of U.S . soft wheat, but this volume had declined 76 percent by 1984 . European Community exports to Eastern Europe remained stable in terms of vol-ume over the same period, but there was a considerable increase in EC market share as U.S . volume declined . The Community's expansion into new and existing export
markets is not the only factor influencing U.S . exports of wheat. After the Ec achieved self-sufficiency in the late 1970's, its imports of U.S . wheat, mostly hard spring and winter wheats, fell approximately 25 percent through the 1983/84 marketing year . U.S . exports to the Community are projected to decline further in the foreseeable future, according to U.S . Department of Agriculture forecasts."
14
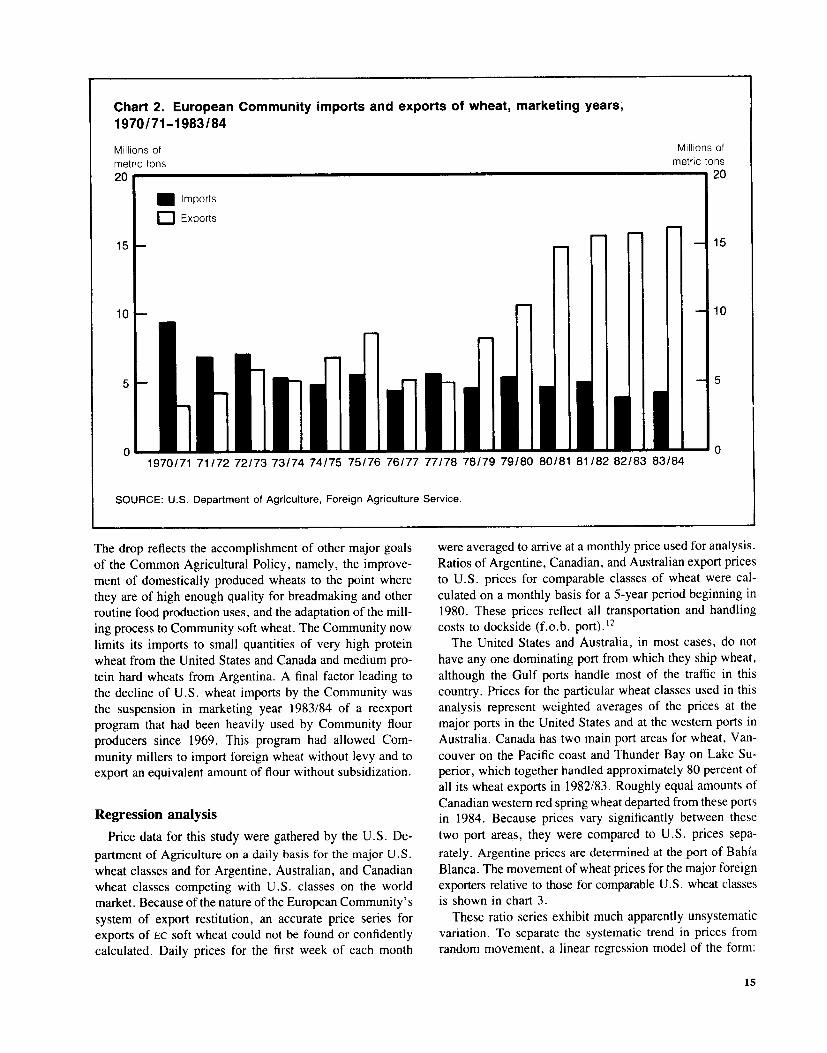
Chart 2. European Community imports and exports of wheat, marketing years, 1970/71-1983/84
Millions of metric tons 20 r-
. Imports
0 Exports
15
10
5
0 1970/71 71/72 72/73 73/74 74/75 75/76 76/77 77/78 78/79 79/80 80/81
SOURCE : U.S . Department of Agriculture, Foreign Agriculture Service.
The drop reflects the accomplishment of other major goals of the Common Agricultural Policy, namely, the improve-ment of domestically produced wheats to the point where they are of high enough quality for breadmaking and other routine food production uses, and the adaptation of the mill-ing process to Community soft wheat. The Community now limits its imports to small quantities of very high protein wheat from the United States and Canada and medium pro-tein hard wheats from Argentina. A final factor leading to the decline of U.S . wheat imports by the Community was the suspension in marketing year 1983/84 of a reexport program that had been heavily used by Community flour producers since 1969 . This program had allowed Com-munity millers to import foreign wheat without levy and to export an equivalent amount of flour without subsidization .
Regression analysis
Price data for this study were gathered by the U.S . De-partment of Agriculture on a daily basis for the major U.S . wheat classes and for Argentine, Australian, and Canadian wheat classes competing with U.S . classes on the world market . Because of the nature of the European Community's system of export restitution, an accurate price series for exports of EC soft wheat could not be found or confidently calculated . Daily prices for the first week of each month
Millions of metric tons ----1 20
81/82 82/83 83/84
15
10
5
0
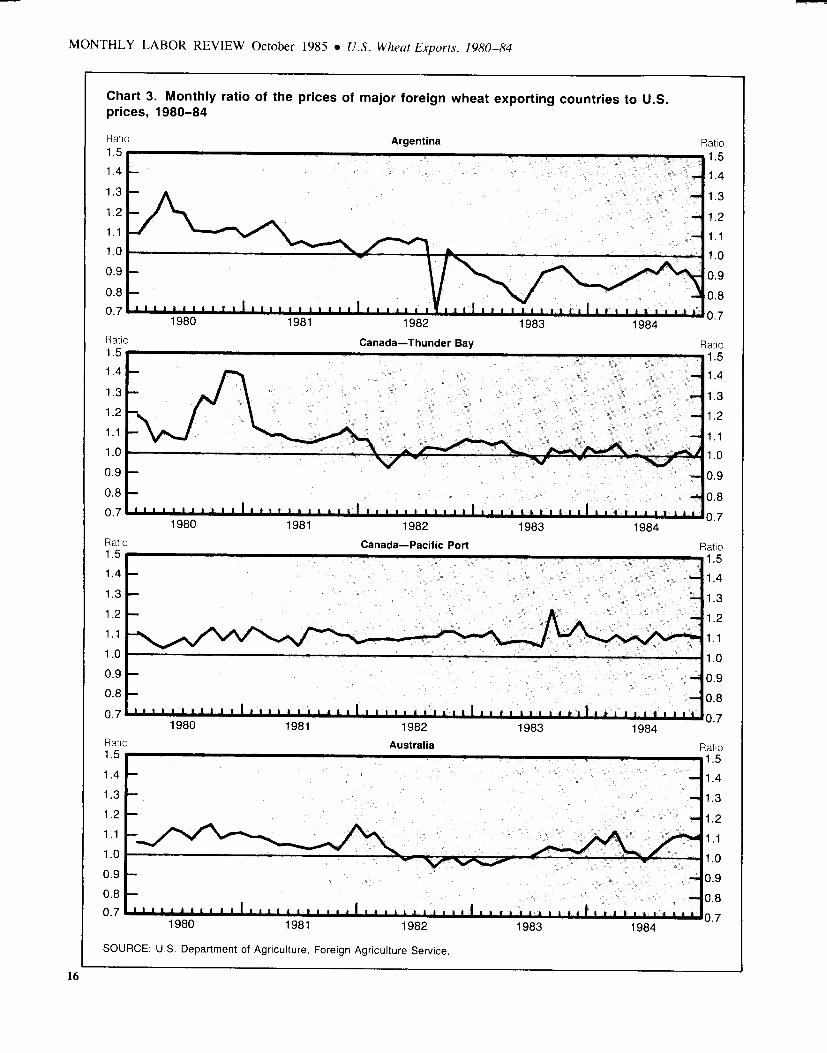
were averaged to arrive at a monthly price used for analysis . Ratios of Argentine, Canadian, and Australian export prices to U.S . prices for comparable classes of wheat were cal-culated on a monthly basis for a 5-year period beginning in 1980 . These prices reflect all transportation and handling costs to dockside (f .o .b . port) ." The United States and Australia, in most cases, do not
have any one dominating port from which they ship wheat, although the Gulf ports handle most of the traffic in this country. Prices for the particular wheat classes used in this analysis represent weighted averages of the prices at the major ports in the United States and at the western ports in Australia. Canada has two main port areas for wheat, Van-couver on the Pacific coast and Thunder Bay on Lake Su-perior, which together handled approximately 80 percent of all its wheat exports in 1982/83. Roughly equal amounts of Canadian western red spring wheat departed from these ports in 1984 . Because prices vary significantly between these two port areas, they were compared to U.S . prices sepa-
rately . Argentine prices are determined at the port of Bahia Blanca. The movement of wheat prices for the major foreign exporters relative to those for comparable U.S . wheat classes is shown in chart 3.
These ratio series exhibit much apparently unsystematic variation . To separate the systematic trend in prices from random movement, a linear regression model of the form :
15
MONTHLY LABOR REVIEW October 1985 a U.S . Wheat Exports, 1980-84
Chart 3 . Monthly ratio of the prices of major foreign wheat exporting countries to U.S. prices, 1980-84
1o Argentina R
F. 1111111111111 11 1 1 1 111111 1 1 1 1 1 11111 _111 1
1980 1981 1982 1983 1984 o Canada-Thunder Bay R
1980 atio 5
1981 1982 1983 Canada-Pacific Port
1984 .
Rati . 1 . ; .4 1 .~ .3 1 .3
1 .2 1 .2 1 .1
v W \w~/ 1 .1 Y
1 0 . 1 .0 0.9 0.9 0.8 0.8 0.7
111111 lift 1 111 1 1 11 1 11 1 1 1 1 111 1 1 11 1 1 11121 1 11111111 - .`1.1 .1 . 1 I I I I I I. L-1 0 7 1980 1981 1982 1983 1984 .
Ratio Australia Ratio 1 5 . 1 .5 1 .4 1 .4 1 .3 1 .3 1 .2 1 .2 1 .1 1 .1 1 0 . 1 .0 0.9 0.9 0.8 0.8 0 .7 1 1 I I I 1 1 l . 1 .1 1 1 0.7 1980 1981 1982 1983 1984
SOURCE : U.S . Department of Agriculture, Foreign Agriculture Service .
16
Yt = 00 + R t + 1-t
was fitted, where Y, is the dependent variable representing the ratio of foreign price to U.S price in month t; t is a particular month; go and /31 are regression parameters, with (31 representing the trend in foreign prices relative to U.S . prices ; and A, represents an error term . When the regression errors were tested for autoregressivity by the Durbin-Wat-son method, all four ratio series exhibited autoregressive behavior at significant levels . The error term lit was assumed to follow a first-order autoregressive process so that :
wt = Et - a l-Lt I
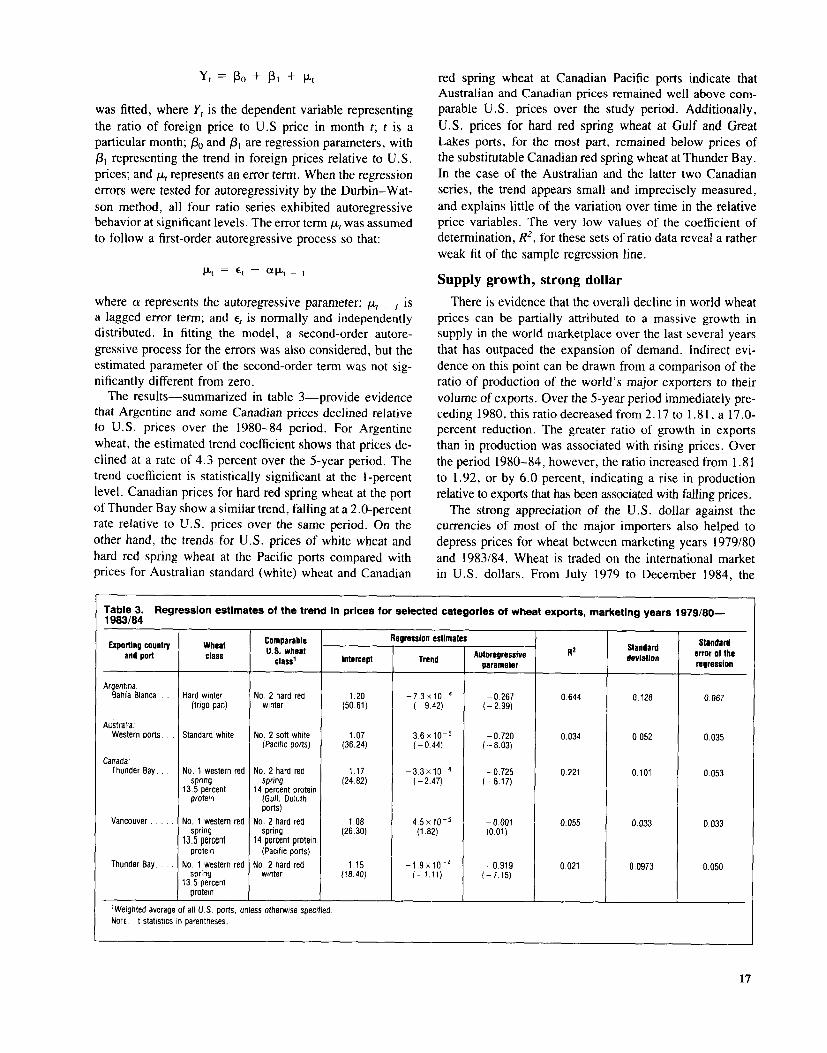
where a represents the autoregressive parameter; i,, - , is a lagged error term; and e, is normally and independently distributed . In fitting the model, a second-order autore-gressive process for the errors was also considered, but the estimated parameter of the second-order term was not sig-nificantly different from zero . The results-summarized in table 3-provide evidence
that Argentine and some Canadian prices declined relative to U.S . prices over the 1980-84 period . For Argentine wheat, the estimated trend coefficient shows that prices de-clined at a rate of 4 .3 percent over the 5-year period . The trend coefficient is statistically significant at the 1-percent level. Canadian prices for hard red spring wheat at the port of Thunder Bay show a similar trend, falling at a 2.0-percent rate relative to U.S . prices over the same period . On the other hand, the trends for U.S . prices of white wheat and hard red spring wheat at the Pacific ports compared with prices for Australian standard (white) wheat and Canadian
red spring wheat at Canadian Pacific ports indicate that Australian and Canadian prices remained well above com-parable U.S . prices over the study period . Additionally, U.S . prices for hard red spring wheat at Gulf and Great Lakes ports, for the most part, remained below prices of the substitutable Canadian red spring wheat at Thunder Bay . In the case of the Australian and the latter two Canadian series, the trend appears small and imprecisely measured, and explains little of the variation over time in the relative price variables . The very low values of the coefficient of determination, R2, for these sets of ratio data reveal a rather weak fit of the sample regression line .
Supply growth, strong dollar
There is evidence that the overall decline in world wheat prices can be partially attributed to a massive growth in supply in the world marketplace over the last several years that has outpaced the expansion of demand . Indirect evi-dence on this point can be drawn from a comparison of the ratio of production of the world's major exporters to their volume of exports . Over the 5-year period immediately pre-ceding 1980, this ratio decreased from 2 .17 to 1 .81, a 17.0-percent reduction . The greater ratio of growth in exports than in production was associated with rising prices . Over the period 1980-84, however, the ratio increased from 1 .81 to 1 .92, or by 6.0 percent, indicating a rise in production relative to exports that has been associated with falling prices . The strong appreciation of the U.S . dollar against the
currencies of most of the major importers also helped to depress prices for wheat between marketing years 1979/80 and 1983/84 . Wheat is traded on the international market in U.S . dollars . From July 1979 to December 1984, the
Table 3 . Regression estimates of the trend in prices for selected categories of wheat exports, marketing years 1979/80- 1983/84
Ex ortin countr Wheat Comparable Regression estimates Standard p g y and port class U.S . wheat
class Intercept Trend Autoregressive z R
Standard deviation error of the
parameter regression
Argentina : Bahia Blanca . . . Hard winter No . 2 hard red 1 .20 -7 .3 x 10-4 -0 .267 0 .644 0 .128 0 .067
(trigo pan) winter (50.61) (-9.42) (-2.99)
Australia : Western ports . . . Standard white No . 2 soft white 1 .07 -3.6x 10⁻⁵ -0 .720 0.034 0.052 0.035
(Pacific ports) (36 .24) (-0 .44) (-8 .03)
Canada: Thunder Bay. . . . No. 1 western red No . 2 hard red 1 .17 -3.3x10⁻⁴ -0 .725 0.221 0.101 0.053
spring spring (24.82) (-2.47) (-8.17) 13 .5 percent 14 percent protein
protein (Gulf, Duluth ports)
Vancouver . . . . . No . 1 western red No . 2 hard red 1.08 4 .5 x 10-5 -0 .001 0.055 0.033 0.033 spring spring (26 .30) (1 .82) (0 .01)
13 .5 percent 14 percent protein protein (Pacific ports)
Thunder Bay. . . . No . 1 western red No . 2 hard red 1.15 -1 .9 x 10-4 -0 .919 0.021 0.0973 0.050 spring winter (18 .40) (-1 .11) (-7 .15)
13 .5 percent protein
'Weighted average of all U .S . ports, unless otherwise specified . NOTE : t statistics in parentheses .
17

MONTHLY LABOR REVIEW October 1985 a U.S . Wheat Exports, 1980-84
trade-weighted value of the dollar increased by 44 percent. (See chart 4 .) The effects of the strong U.S . dollar can be clearly iden-
tified on a market-specific basis. The real cost of wheat to the importer in terms of the local currency will depend on the relationship of the price movement of a given exporter's wheat and the performance of the importer's currency vis-a-vis the dollar . For example, China's yuan depreciated 71 percent against the dollar between March 1981 and Decem-ber 1984 . Over the same period, Argentina experienced a 42-percent decrease in its f.o .b . port price for hard wheat, Canada, a 22-percent decrease, and the United States, a 15-percent decline. These price drops, in combination with the yuan's depreciation, translated into price increases for Chinese buyers of hard wheat of 34 percent from Canada and 46 percent from the United States . Argentina's hard red winter wheat price showed no change .
While world prices for wheat generally trended downward between 1980 and 1984, individual exporters' prices at the port for a metric ton of wheat often varied rather widely at any given time . U.S . prices for hard winter wheat exceeded those of Argentina by almost $40 per metric ton in May 1983, and spreads of $20 to $30 per metric ton were not uncommon in 1983 and 1984 . (See chart 3.) Australian
prices were routinely above U.S . prices with the exception of the period from late 1981 through 1982 when severe weather conditions in Australia produced large quantities of poor quality white wheat which had to be sold at a discount . Canadian prices moved in concert with U .S . prices except in 1980 and 1981, when Canadian prices were much higher, and in 1984, during which Canadian prices (Thunder Bay) tended periodically to fall below U .S . prices for hard spring wheat. The United States has had difficulty in maintaining market share in part because of these trends in its prices relative to those of Argentina and Canada . However, U.S . agricultural policy and other nonprice factors have also played a role .
U.S . policy considerations Because of its historical role as a world leader in inter-
national trade, the United States, through its agricultural policy, has greatly influenced world wheat supplies and, as a result, prices and market shares . The programs of the Commodity Credit Corporation (cec), a Government-owned and operated organization charged with stabilizing, sup-porting, and protecting farm income and prices, serve as the instrument through which U.S . policy is implemented . The primary programs of the ecc affecting the U .S . share
Chart 4 . Wheat export prices for Argentina, Canada, and the United States, and the monthly average exchange rate index for the U .S . dollar, 1980-84
Price per metric ton (U .S dollars) 280
Dollar exchange rate index (1980-82 = 100)
1980 1981 1982 1983 1984
SOURCE : U .S . Department of Agriculture and Morgan Guaranty Trust Co .
150 140 130 120 110 100 90 80 70 60 50 40 30 20 10 0
18
of the international market have been the ccc loan rate and the Farther Owned Reserve (FOR) . These two programs were developed to benefit domestic producers of wheat and other agricultural commodities but have also had a pervasive effect on the U.S . export situation .
Through the loan program, farmers are advanced a portion of the expected proceeds of their wheat crop, with part of the crop used as collateral . Congress determines the loan rate, stated in dollars per bushel, and varies it periodically to help achieve policy objectives such as supporting farm income . Wheat producers have the option of paying back the borrowed funds or forfeiting equivalent quantities of wheat. Farmers will theoretically exercise the latter option when the price of wheat is at or below the loan rate .
In recent years, the loan rate has continually increased even as the domestic market price has declined . Since the 1982/83 marketing year, the annual U.S . domestic price of
wheat has been near or below the loan rate . For example,
in 1983/84 the actual market price was $0 .12 below the loan -rate, or $3 .53 . As a result, wheat has been diverted
from normal market channels into Governmental storage,
creating increasingly large stocks of wheat as producers exercise their right of forfeiture to maximize profits .
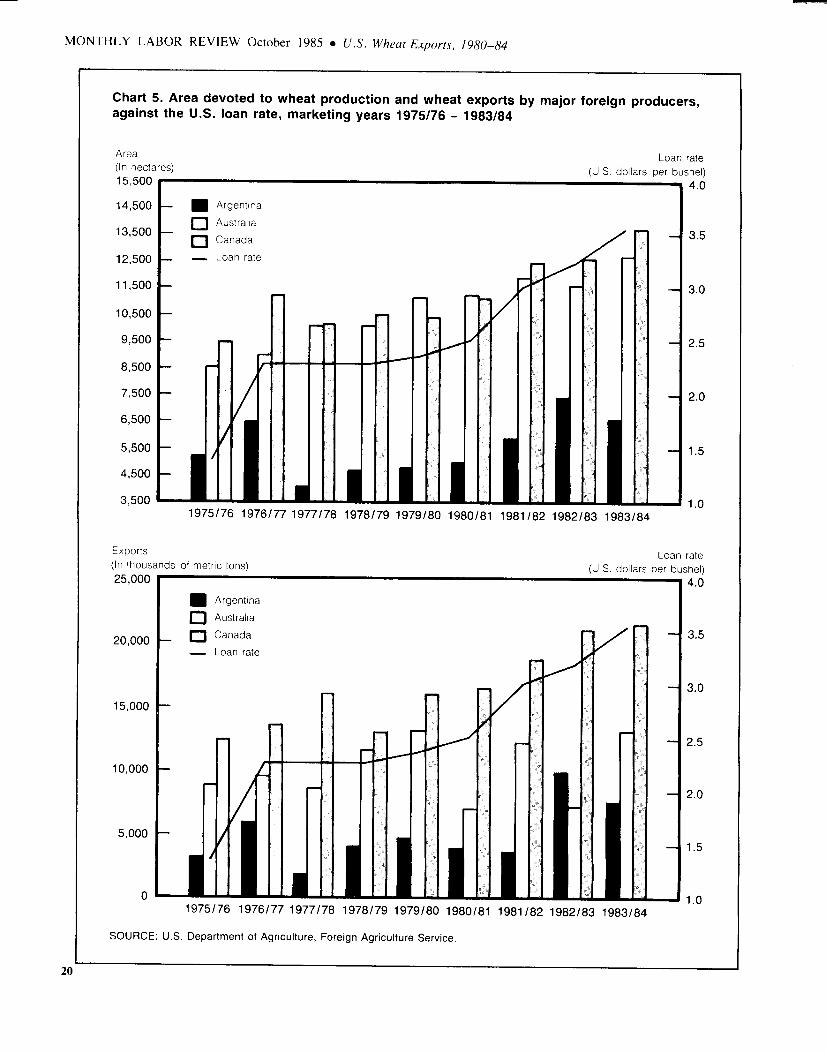
Because it tends to improve a foreign producer's profit-ability on wheat production for export, the loan rate's recent increases-almost $2 since 1975-have coincided with in-creased production by major competitors, making available a greater volume of foreign wheat for export . (See chart 5.) In addition, although wheat is traded on the international market in U.S . dollars, all costs incurred in production are in local currencies . When costs remain stable and the value of the dollar rises, a foreign producer will receive a greater profit in local currency . As the loan rate and the exchange rate of the dollar increased simultaneously, foreign produc-tion has been encouraged . The loan rate also resulted in U.S . wheat being offered
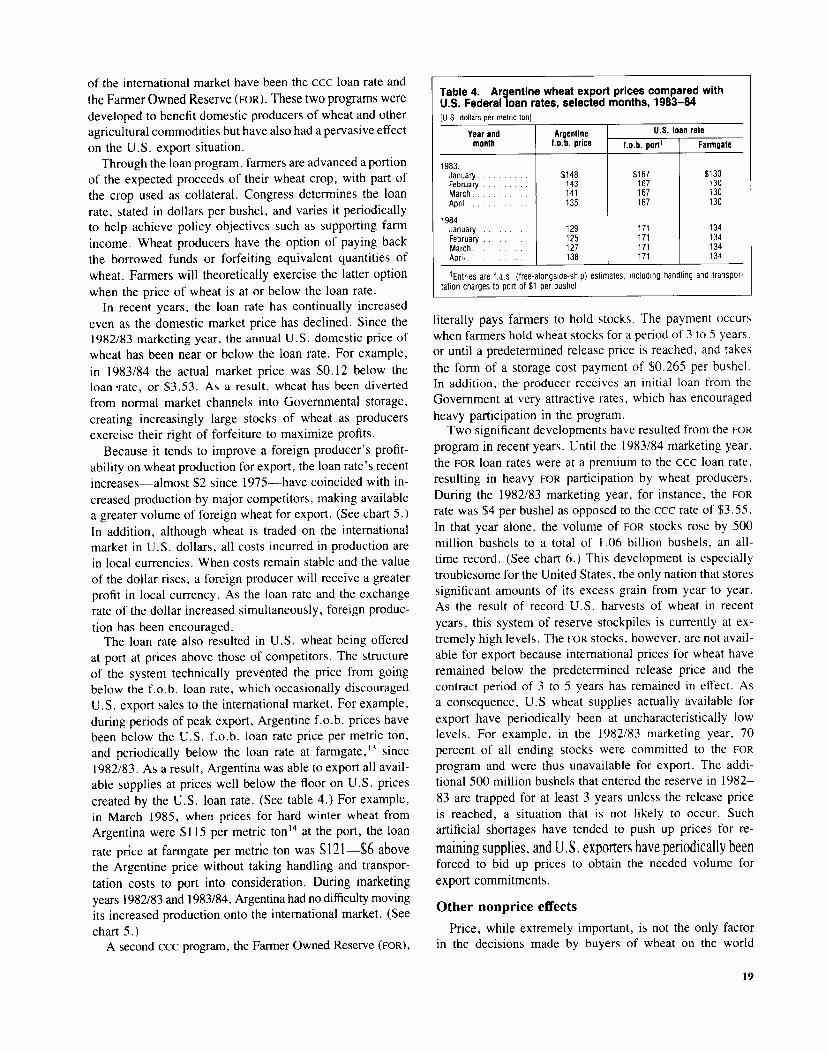
at port at prices above those of competitors . The structure of the system technically prevented the price from going below the f.o .b . loan rate, which occasionally discouraged U .S . export sales to the international market . For example, during periods of peak export, Argentine f.o .b . prices have been below the U.S . f.o .b . loan rate price per metric ton, and periodically below the loan rate at farmgate," since 1982/83 . As a result, Argentina was able to export all avail-able supplies at prices well below the floor on U.S . prices created by the U.S . loan rate . (See table 4 .) For example, in March 1985, when prices for hard winter wheat from Argentina were $115 per metric ton" at the port, the loan
rate price at farmgate per metric ton was 5121-S6 above the Argentine price without taking handling and transpor-tation costs to port into consideration. During marketing years 1982/83 and 1983/84, Argentina had no difficulty moving its increased production onto the international market . (See chart 5.) A second ccc program, the Farmer Owned Reserve (FOR),
Table 4 . Argentine wheat export prices compared with U.S . Federal loan rates, selected months, 1983-84 [U .S . dollars per metric ton]
Year and Argentine u.S . loan rate month f.o .b . price f .o .b . port' Farmgate
1983 : January . . . . . . . . . . $148 $167 $130 February . . . . . . . . . 143 167 130 March . . . . . . . . . . . 141 167 130 April . . . . . . . . . . . . 135 167 130
1984 : January . . . . . . . . . . 129 171 134 February . . . . . . . . . 125 171 134 March . . . . . . . . . . . 127 171 134 April . . . . . . . . . . . . 138 171 134
(Entries are f .a.s . (free-alongside-ship) estimates, including handling and transpor- tation charges to port of $1 per bushel .
literally pays farmers to hold stocks . The payment occurs when farmers hold wheat stocks for a period of 3 to 5 years, or until a predetermined release price is reached, and takes
the form of a storage cost payment of $0.265 per bushel . In addition, the producer receives an initial loan from the Government at very attractive rates, which has encouraged heavy participation in the program . Two significant developments have resulted from the FOR
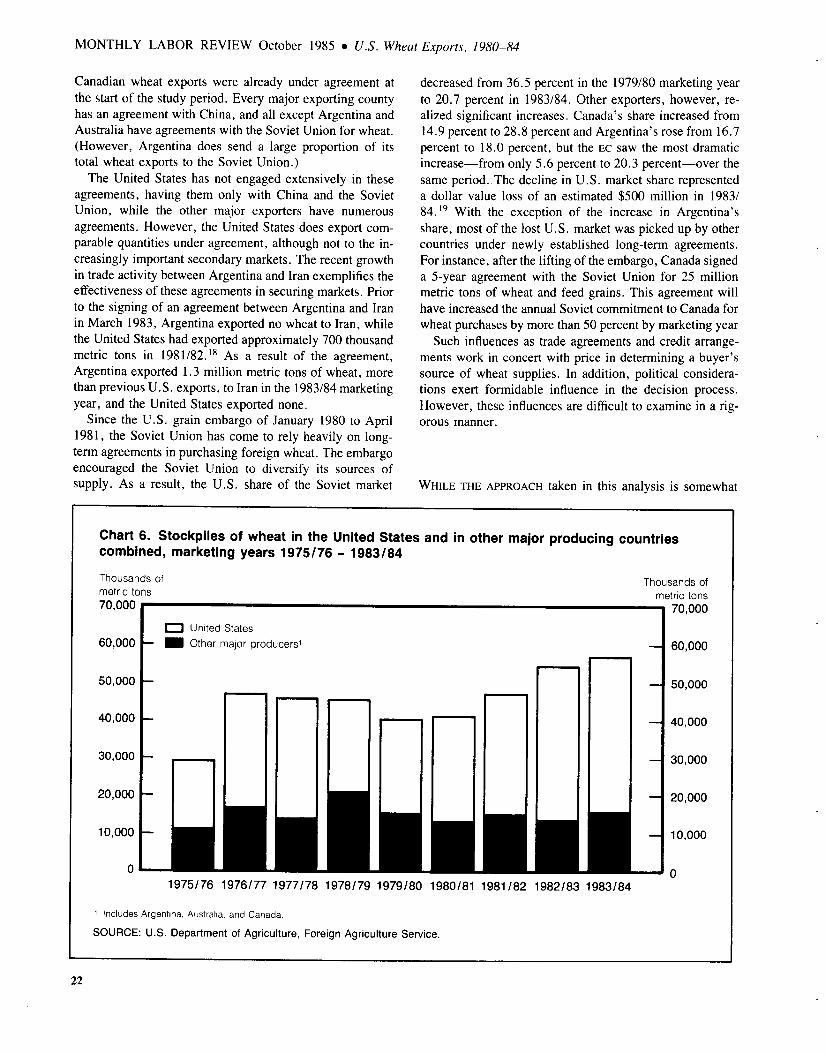
program in recent years. Until the 1983/84 marketing year, the FOR loan rates were at a premium to the ccc loan rate, resulting in heavy FOR participation by wheat producers. During the 1982/83 marketing year, for instance, the FOR rate was $4 per bushel as opposed to the ccc rate of $3 .55 . In that year alone, the volume of FOR stocks rose by 500 million bushels to a total of 1 .06 billion bushels, an all-time record . (See chart 6 .) This development is especially troublesome for the United States, the only nation that stores significant amounts of its excess grain from year to year . As the result of record U.S . harvests of wheat in recent years, this system of reserve stockpiles is currently at ex-tremely high levels . The FOR stocks, however, are not avail-able for export because international prices for wheat have remained below the predetermined release price and the contract period of 3 to 5 years has remained in effect . As a consequence, U.S wheat supplies actually available for export have periodically been at uncharacteristically low levels . For example, in the 1982/83 marketing year, 70 percent of all ending stocks were committed to the FOR program and were thus unavailable for export . The addi-tional 500 million bushels that entered the reserve in 1982-83 are trapped for at least 3 years unless the release price is reached, a situation that is not likely to occur . Such artificial shortages have tended to push up prices for re-
maining supplies, and U .S . exporters have periodically been forced to bid up prices to obtain the needed volume for export commitments .
Other nonprice effects
Price, while extremely important, is not the only factor in the decisions made by buyers of wheat on the world
19
MONTHLY LABOR REVIEW October 1985 0 U.S . Wheat Exports, 1980-84
Chart 5. Area devoted to wheat production and wheat exports by major foreign producers, against the U .S . loan rate, marketing years 1975/76 - 1983/84
Area Loan rate (In hectares) (U .S . dollars per bushel) 15 500 ,
14,500
4.0
. Argentina
Australia O ,500 13,500 3.5 a Canada ~~
12,500
- Loan rate
11,500 3.0
10,500
9,500 2.5
8,500
7,500 2.0
6,500
5,500 1 .5
1 1
4,500
1 3,500 11 11 11-J 1 .0 1975/76 1976/77 1977/78 1978/79 1979/80 1980/81 1981/82 1982/83 1983/84
Exports Loan rate (In thousands of metric tons) (U .S . dollars per bushel) 25,000 4.0
20,000
15,000
10,000
5,000
1975/76 1976/77 1977/78 1978/79 1979/80 1980/81 1981/82 1982/83 1983/84
SOURCE : U .S . Department of Agriculture, Foreign Agriculture Service .
3.5
3.0
2 .5
2.0
1 .5
1 .0
20

market. Because of declining prices and the likelihood that supply will continue to grow faster than demand, countries faced with disposing of unsold wheat have reviewed export strategies developed in the seller's market of the 1970's, and have designed new approaches to meet these challenges . As an integral part of their new strategies to maintain and increase market share, the major exporters promote the su-periority of their wheat over that of other countries, offer special credit arrangements, and establish trade agreements . These nonprice factors are reviewed here because their in-fluence has probably been quite significant in the decision processes of importers over the last several years. They also help to explain why some countries have maintained or increased their share of the international market in the face of fierce competition .
With the exception of the European Community, all of the wheat exporting countries have attempted to secure a niche in the world market by establishing their particular product as superior or equal to comparable wheats produced by other countries . This practice is fairly new to some ex-porters but has become increasingly important in obtaining new customers and maintaining old ones . A country's grad-ing system is the instrument through which it attempts to distinguish its wheat. Particular grades specify wheat of a quality that is best used for certain purposes ; for example, top quality wheats are typically used to make bread . The common grading criteria include test weight (yield of flour), moisture content (dry matter), foreign material, hardness (milling properties), and color.
Although all countries' systems measure similar char-acteristics, they differ in how these measurements determine the actual quality and the adequacy of the system as an
indicator of the end use value-how easily wheat is trans-formed into flour and the quality of the end product . In the
United States, the grading system has evolved from mer-
chandising practices, rather than by application of end use criteria . Wheat grades are used in the United States only as
a descriptive device for bills of lading, certification for ex-port, and similar purposes . Buyers usually purchase U.S . wheat on the basis of actual samples, with little regard to
grade . Canada, Argentina, and Australia, however, have based their grading systems on end use value . These systems
have been structured to facilitate the movement of wheat onto the export market . Canada, for example, has developed separate grade specifications for exports that are much more
stringent than those for domestic grades, and has established the reputation of having the most reliable system and, there-
fore, wheat of a higher quality . Additionally, both Canada
and Argentina clean their wheat prior to sale, thus upgrading the grain to command a premium price . Australia, also using
end use value as its main criterion, has a flexible grading
system which allows wheat of different lots and within cer-tain protein and quality ranges to be mixed to the specifi-cations of a particular buyer .
As grading systems have evolved, most major exporters have fine-tuned their systems in order to gain a competitive advantage on the world market . The United States has lagged behind other major exporters in this respect because of its reluctance to develop qualitative grade specifications that stress end use . In addition, other countries tend to cater to buyers' particular needs and desires through the design of their systems . These aspects of Canadian, Argentine, and Australian grading systems undoubtedly influence import-ers' purchase decisions. However, actual data on trade value gained or lost for this reason are unavailable .
Also entering into buyers' decisions are the several special credit arrangements offered to some extent by every major exporter . These credit arrangements primarily include credit lines, extended payment terms, credit insurance, loan guar-antees, and favorable rates, and are provided separately or in combination depending on the trade relationship between the exporting and importing countries . Argentina and Aus-
tralia, once offering little or no credit, both have developed programs within the last 2 years. Argentina's program en-tails loaning funds through the regular banking system . While
the Australian government does not provide export credit financing for wheat, it does offer export credit insurance which guarantees a portion of the total payment. Canada and the United States have used all of the pre-
viously mentioned forms of credit . However, the methods by which they are administered and their particular em-
phases have changed considerably over the years. The Ca-nadian Government most often promotes direct financing and, to a lesser extent, guarantees, while the United States has tended to use credit guarantees in recent years . Of par-ticular interest is the U .S . blended credit program, designed to aid middle-income developing nations in purchasing U.S . wheat. This program was instrumental in maintaining the U.S . market share in eligible countries while noncredit mar-kets decreased by 30 percent between the 1981/82 and 1983/ 84 marketing years." However, the program was discon-tinued in March 1985, and U.S . exports are projected to decline as a result . '6
Another nonprice factor that has become important in the 1980's is the use of trade agreements . In an effort to ensure market share, major exporting countries have pursued these agreements aggressively . Importing countries, and espe-cially the centrally planned and developing nations, often desire agreements to guarantee supplies year to year .
There are three principal types of agreements prevalent in the international wheat market : those for the current mar-
keting year only (supply agreements), those covering a pe-
riod of years (long-term agreements), and those giving preference to a particular country. Canada, Argentina, Aus-tralia, and the United States raised their agreement-related volume of trade by 1, 175, 14, and 16 percent, respectively, between 1979/80 and 1983/84 .17 The small increase in Can-ada's volume is misleading because over 50 percent of all
21
MONTHLY LABOR REVIEW October 1985 " U.S . Wheat Exports, 1980-84
Canadian wheat exports were already under agreement at the start of the study period . Every major exporting county has an agreement with China, and all except Argentina and Australia have agreements with the Soviet Union for wheat. (However, Argentina does send a large proportion of its total wheat exports to the Soviet Union.) The United States has not engaged extensively in these
agreements, having them only with China and the Soviet Union, while the other major exporters have numerous agreements . However, the United States does export com-parable quantities under agreement, although not to the in-creasingly important secondary markets. The recent growth in trade activity between Argentina and Iran exemplifies the effectiveness of these agreements in securing markets . Prior to the signing of an agreement between Argentina and Iran in March 1983, Argentina exported no wheat to Iran, while the United States had exported approximately 700 thousand metric tons in 1981/82 .18 As a result of the agreement, Argentina exported 1 .3 million metric tons of wheat, more than previous U.S . exports, to Iran in the 1983/84 marketing year, and the United States exported none .
Since the U.S . grain embargo of January 1980 to April 1981, the Soviet Union has come to rely heavily on long-term agreements in purchasing foreign wheat. The embargo encouraged the Soviet Union to diversify its sources of supply . As a result, the U.S . share of the Soviet market
decreased from 36.5 percent in the 1979/80 marketing year to 20.7 percent in 1983/84. Other exporters, however, re-alized significant increases. Canada's share increased from 14 .9 percent to 28.8 percent and Argentina's rose from 16.7 percent to 18 .0 percent, but the EC saw the most dramatic increase-from only 5.6 percent to 20.3 percent-over the same period . The decline in U.S . market share represented a dollar value loss of an estimated $500 million in 1983/ 84.19 With the exception of the increase in Argentina's share, most of the lost U.S . market was picked up by other countries under newly established long-term agreements . For instance, after the lifting of the embargo, Canada signed a 5-year agreement with the Soviet Union for 25 million metric tons of wheat and feed grains . This agreement will have increased the annual Soviet commitment to Canada for wheat purchases by more than 50 percent by marketing year
Such influences as trade agreements and credit arrange-ments work in concert with price in determining a buyer's source of wheat supplies . In addition, political considera-tions exert formidable influence in the decision process . However, these influences are difficult to examine in a rig-orous manner .
WHILE THE APPROACH taken in this analysis is somewhat
Chart 6. Stockpiles of wheat in the United States and in other major producing countries combined, marketing years 1975/76 - 1983/84
Thousands of metric tons
Thousands of metric tons 70,000 r- -1 70,000
EM United States 60,000 - M Other major producers' 60,000
50,000 50,000
40,000 40,000
30,000 30,000
20,000 20,000
10,000 10,000
1975/76 1976/77 1977/78 1978/79 1979/80 1980/81 1981/82 1982/83 1983/84
1 Includes Argentina, Australia, and Canada.
SOURCE : U.S . Department of Agriculture, Foreign Agriculture Service .
0
22

limited in scope, it does reveal several significant trends in U .S . prices for wheat relative to those of other major ex-
porters . Argentine prices for wheat declined at a rate of approximately 4 .3 percent relative to U .S . prices for com-parable products over the 1980-84 period . This decline was pronounced in the last 2 years of the study period, during which Argentine prices averaged some 12 percent below U .S . prices . Prices for Canadian spring wheat (Thunder Bay) declined relative to prices for the U .S . spring wheat at a rate of 2.0 percent, with Canadian prices moving into proximity with U .S . prices in 1983 and 1984 . The relative decline in foreign prices for wheat contributed to a 10-
percent loss of U .S . market share between 1982 and 1984 .
Furthermore, even though price data were unavailable for the European Community, the EC's policy of subsidizing exports, along with its significant gains in market share in the last several years, are prima facie evidence that U.S . products are at a price disadvantage vis-a-vis Community exports. On the other hand, Australian prices for wheat did not decline significantly relative to U.S prices, and U.S . sales in terms of volume did not fall off in areas where these two countries compete. However, the decline in U.S . market share cannot be completely explained by price, as domestic agricultural policy and the emergence of aggressive new marketing strategies among foreign exporters also appear to have eroded the U.S . competitive position . 0
FOOTNOTES
ACKNOWLEDGMENT : The authors gratefully acknowledge the helpful comments of Brent Moulton and Kim Zieschang of the Bureau's Division of Index Number Research, and David Johnson and Nicholas Peters of the Division of International Prices . We are also grateful to Shelley Meister of the Division of International Prices for help in preparation of the graph-ics .
' Wendy L . Wall, "U .S . Isn't Any Longer Cheapest Source of Some Kinds of Grain for Domestic Use," The Wall Street Journal, Jan. 14, 1985, p. 2, col. 3 .
z The export price index for wheat (chart I) includes the following classes of wheat: hard red winter, hard red spring, white, soft red winter, and durum .
'The Bureau of Labor Statistics' International Price Program is respon-sible for calculating import and export price indexes for the United States . These indexes are statistical measures of the average change in prices of products that are traded between the United States and the rest of the world . Export price indexes for wheat and other internationally traded products are Laspeyres indexes of the prices of products classified according to the Standard International Trade Classification (SITC) . Price relatives are as-signed equal importance within each weight category and are then aggre-gated to the SITC index level . Indexes are calculated for import categories in a similar manner :
i W
[ p,1 n Ix .~
Y-1 7_1 where x = SITC group for which index is calculated ; J the weight categories within group x (the Schedule B
categories for exports, and TSUSA categories for imports) ; i = product within category j; n = number of price relatives within category j; t = time; WY = share of value of the jib category in group x in the base
PYP7 year; price relative of product i in year t to base year 0.
Price indexes for U .S . exports and imports are published quarterly in the BLS press release "U .S . Import and Export Price Indexes," available on request . For a comprehensive review of price trends in international trade in 1984 see Patricia Szarek and Brian Costello, "Prices of U.S . Imports and Exports Declined in 1984," Monthly Labor Review, April 1985, pp . 10-26.
"From Wheat to Flour (Washington, National Millers' Association, 1981), p. I .
5 For purposes of this article, the EC will be considered as a single nation . The European Community as of December 1984 included : Belgium, Lux-embourg, Denmark, France, the Federal Republic of Germany, Greece,
Ireland, Italy, Netherlands, and the United Kingdom.
I Wheat, Agriculture Information Bulletin No . 467 (U.S . Department of Agriculture, Economic Research Service, September 1984), p. 10 .
'Estimates of trade value changes were calculated by multiplying the average price of all exports for all ports as of December 1984 ($153/metric ton) by the U.S . Department of Agriculture forcast volume of trade for the 1984/85 marketing year to arrive at the estimated value of total world trade in U .S . dollars ($16.126 billion) . The changes in market share were then multiplied by the trade value to determine the gain or loss for a given exporter .
e Wheat is classified according to the growing seasons of the plant, color of the wheat kernel, and texture of the ripened grain. The texture of the grain is the most important criterion because it reflects the protein content of the wheat kernel . There are two basic textures of the wheat kernel, hard and soft . Hard wheats, which include durum, have the highest protein content and therefore can command a higher price because they are the best type of wheat for use in making bread . Soft wheats contain lesser amounts of protein and are best used for making cookies, crackers, and cakes. Both soft and hard wheat kernels may be either red or white in appearance with various shades of carotenoid and other pigmentation into yellows or amber. Finally, a particular type of wheat's growing season is typically designated in its classification . Some types of wheat, called "win-ter wheat," may be planted only in the fall and harvested in the spring . Other types of wheat must be planted in the spring and harvested in the fall and are called "spring wheat." Winter wheat will not yield a crop if planted in spring and spring wheat usually cannot survive the average winters of the Midwestern United States . These three characteristics are usually designated in the name of a particular class of wheat, as in "hard red winter wheat." If the growing season is not designated, the wheat class may be grown in either season .
'Foreign Agriculture Service regional designation . The Foreign Agri-culture Service of the U.S . Department of Agriculture has established five regions of the world for purposes of collecting and reporting data . Asia/ Oceania/Middle East encompasses the entire Asian continent including India and the islands of the southern and eastern Pacific including Japan. Other regions are: West Europe, East Europe, Africa, and the Western Hemisphere .
'"Export Markets for U.S . Grain and Products, EMG-4-85 (U .S . De-partment of Agriculture, Foreign Agriculture Service, March 1985), p. 6.
"Grain Outlook and Situation, FG-1-85 (U.S . Department of Agricul-ture, Foreign Agriculture Service, January 1985), p . 4 .
"The Argentine price includes an ad valorem tax on all exports of wheat .
""Fo.b . port" loan rates are Foreign Agriculture Service f.a .s (free-alongside-ship) estimates, including handling and transportation charges to port of $1 per bushel . "Farmgate" represents the price at the farm excluding all transportation and handling costs.
"The Argentine price includes an 18-percent ad valorem tax .
23

MONTHLY LABOR REVIEW October 1985 * U.S . Wheat Exports, 1980-84
"Export Markets for U.S . Grain and Feed Commodities, EMG-8-84 (U.S . Department of Agriculture, Foreign Agriculture Service, August 1984), p. 11 .
"World Grain Situation and Outlook, FG-6-85 (U .S . Department of Agriculture, Foreign Agriculture Service), April 1985, p . 3 .
"Many of the trade agreements also include coarse grains as well as wheat. Because the coarse grain amounts traded under agreement could not be separated from wheat amounts, the percentages presented here are estimates .
"The United States carried on trade in wheat from 1979/80 until Iran signed the grain agreement with Argentina in 1983 . This span included the period of the U.S .-Iran hostage crisis .
'9 Lost dollar value for the United States was estimated by multiplying the average price for all major exporters for all ports for December 1983 ($155.67/metric ton) by 20 million metric tons, the volume of Soviet imports of wheat for 1983/84. Total dollar value for Soviet imports in 1983/84 was $3 . 11 billion . The change in market share was then multiplied by the trade value to determine U.S . loss of the Soviet market for 1983/ 84 .
An early BLS study of women workers-by women [BLS Commissioner Carroll D.] Wright's early and continuing
concern about the impact of changing industrial developments on the family, and particularly on the employment of women and chil-dren, was reflected in a series of landmark studies . In 1888, the new Bureau [of Labor Statistics] issued Working Women in Large Cities, which covered 17,000 "shop girls" engaged in light manual or mechanical work in factories and stores, representing about 7 percent of such employment in 22 cities .
Notably, the survey was conducted in large measure by women agents of the Department, evidence also of the changing. role of woman . Of these agents, Wright's report said, "The result of the work of the agents must bear testimony to the efficiency of the women employed by the Department, and to the fact that they are capable of taking up difficult and laborious work . They have stood on an equality in all respects with the male force of the Department, and have been compensated equally with them." The study reported on the wages, expenditures, health, moral
standards, work environment, family backgrounds, and marital sta-tus of the women. Commenting on the new opportunities and earn-ings of women, Wright observed, "A generation ago women were allowed to enter but few occupations . Now there are hundreds of vocations in which they can find employment . The present report names 343 industries in which they have been found actively en-gaged. , . . By the progress or change in industrial conditions, the limit to the employment of women has been removed or at least greatly extended, and their opportunities for earning wages corre-spondingly increased and the wages themselves greatly en-hanced . . . . . . He noted, however, that women were willing to work for lower wages than men .
-JOSEPH P . GOLDBERG AND WILLIAM T . MOYE The First Hundred Years of the
Bureau of Labor Statistics, Bulletin 2235 (Bureau of Labor
Statistics, 1985) .