U.S. Natural Gas Imports and Exports: 2004
41
U.S. Natural Gas Imports and Exports: 2004 This special report looks at recent trends in U.S. international trade of natural gas. Natural gas imports and exports data, including liquefied natural gas (LNG) data, are provided through 2004. A note on the data sources for this article is provided at the end. Questions concerning this article should be addressed to Damien Gaul at 202-586-2073 (e-mail [email protected] ), or Lejla Alic at 202-586-0858 (e-mail [email protected] ). U.S international trade of natural gas, including liquefied natural gas (LNG), in 2004 again exhibited rapidly changing trends. LNG imports reached historically high volumes and were nearly three times the volume received just 5 years ago. 1 Although LNG imports have grown as a relative share of total imports in recent years, pipeline imports to the United States from Canada continued to be the greatest supply source to meet U.S. demand. U.S. exports to Mexico and Canada each reached record highs, 1 Liquefied natural gas (LNG) is natural gas, primarily methane, which has been cooled to its liquid state at -260°F (-162.2°C). Liquefying natural gas reduces the volume it occupies by more than 600 times, making it a more practical size for storage and transportation. an indication of the increasingly integrated nature of the North American natural gas marketplace. Altogether the United States received imports from eight countries in 2004, while it exported natural gas to three countries (Figure 1). Net U.S. imports equaled approximately 15 percent of all domestic demand, a portion that has remained relatively constant since 1999. Figure 1. Flow of Natural Gas Imports and Exports, 2004 (Billion Cubic Feet) Source: Energy Information Administration, Office of Oil and Gas, Natural Gas Division, based on data from the Department of Energy, Office of Fossil Energy. LNG deliveries of 652 billion cubic feet include one shipment for which the point of origin was unassigned in a report to the Office of Fossil Energy. Energy Information Administration/Office of Oil and Gas, December 2005 1
Transcript of U.S. Natural Gas Imports and Exports: 2004

U.S. Natural Gas Imports and Exports: 2004
This special report looks at recent trends in U.S. international trade of natural gas. Natural gas imports and exports data, including liquefied natural gas (LNG) data, are provided through 2004. A note on the data sources for this article is provided at the end. Questions concerning this article should be addressed to Damien Gaul at 202-586-2073 (e-mail [email protected] ), or Lejla Alic at 202-586-0858 (e-mail [email protected] ).
U.S international trade of natural gas, including liquefied natural gas (LNG), in 2004 again exhibited rapidly changing trends. LNG imports reached historically high volumes and were nearly three times the volume received just 5 years ago.1 Although LNG imports have grown as a relative share of total imports in recent years, pipeline imports to the United States from Canada continued to be the greatest supply source to meet U.S. demand. U.S. exports to Mexico and Canada each reached record highs,
1 Liquefied natural gas (LNG) is natural gas, primarily methane, which has been cooled to its liquid state at -260°F (-162.2°C). Liquefying natural gas reduces the volume it occupies by more than 600 times, making it a more practical size for storage and transportation.
an indication of the increasingly integrated nature of the North American natural gas marketplace. Altogether the United States received imports from eight countries in 2004, while it exported natural gas to three countries (Figure 1). Net U.S. imports equaled approximately 15 percent of all domestic demand, a portion that has remained relatively constant since 1999.
Figure 1. Flow of Natural Gas Imports and Exports, 2004 (Billion Cubic Feet)
Source: Energy Information Administration, Office of Oil and Gas, Natural Gas Division, based on data from the Department of Energy, Office of Fossil Energy. LNG deliveries of 652 billion cubic feet include one shipment for which the point of origin was unassigned in a report to the Office of Fossil Energy.
Energy Information Administration/Office of Oil and Gas, December 2005 1

While many other countries rely on imports to meet a larger portion of demand, the United States is the largest importer of natural gas in the world. LNG imports to the United States still represent only a small part of domestic demand, but large percentage increases in LNG imports over the past several years have meant the United States also has become the third leading importer of LNG in the world behind South Korea and Japan.2 Because of the diverse operational capabilities and economics of the two forms of trade, this report distinguishes between international trade of natural gas by pipeline and LNG trade. After a brief overview of trends in U.S. international trade, this report addresses natural gas trade imports and exports by pipeline to Canada and Mexico in 2004 and then developments in U.S. participation in global LNG trade.
Overview/Trends In 2004, net imports to the United States were 3,404 billion cubic feet (Bcf), which was an increase of 140 Bcf, or 4.3 percent, over the previous year. Although U.S. exports to Mexico and Canada were up significantly,
2 BP, Statistical Review of World Energy 2005, Online. http://www.bp.com. (June 2005).
additional pipeline imports from Canada and net LNG imports more than offset the incremental outflows. LNG imports grew 29 percent to 652 Bcf. Net LNG imports grew to about 17 percent of overall net imports, which is up from 13 percent in 2003, as net pipeline imports fell for the third straight year (Figure 2). The increase in net imports for the year was the first increase since 2001. However, net imports of natural gas and LNG are still well below the 2001 volume of 3,604 Bcf. Gross imports from Canada in 2004 rose 169 Bcf, or 4.9 percent. The increase was the seventeenth increase in the last 18 years, with the only decrease coming in 2003. Although the reversal from the decline in 2003 in gross imports from Canada suggests that the decrease was only temporary, net imports from Canada still were below the level in any of the past five years with the exception of 2003. Net imports from Canada increased only slightly, reflecting the continued difficulty throughout North America for producers to ramp up production despite record high prices and drilling levels. Exports from the United States were also higher during the year, resulting in net imports from Canada totaling 3,212 Bcf, or 46 Bcf higher than in 2003.
Figure 2. Volume of Net Pipeline and LNG Imports, 1998-2004
0
500
1,000
1,500
2,000
2,500
3,000
3,500
4,000
1998 1999 2000 2001 2002 2003 2004
Bill
ion
Cub
ic F
eet
Net Pipeline Imports Net LNG Imports Net Imports
Sources: Energy Information Administration, Office of Oil and Gas, Natural Gas Division, based on data from the Department of Energy, Office of Fossil Energy.
Energy Information Administration/Office of Oil and Gas, December 2005 2

U.S. pipeline exports to Mexico rose to 397 Bcf, reaching a new record high. The increase from 2003 was 54 Bcf, or 16 percent. Although the volume of exports is small relative to the size of the U.S. marketplace, the exports have almost quadrupled since 2000 to serve industries by the border and supplement production from Petroleos Mexicanos (Pemex), Mexico’s state-owned petroleum company. The average price for all imports rose 64 cents per thousand cubic feet (Mcf), or 62 cents per million British thermal units (MMBtu) to $5.81 per Mcf ($5.67 per MMBtu).3 The price was 12 percent higher than the average price of $5.17 per Mcf ($5.05 per MMBtu) in 2003 and 84 percent higher than the average price of $3.15 per Mcf ($3.09 per MMBtu) in 2002. On a volumetric basis, the prices of imports by pipeline and for LNG were nearly identical at $5.80 per Mcf and $5.82, respectively. However, because of the higher Btu content of LNG compared with Canadian exports, prices for LNG on a Btu basis were less than those for pipeline imports. Prices for LNG imports averaged $5.47 per MMBtu, while prices for pipeline imports averaged $5.70. The average wellhead price in the United States in 2004 was $5.49 per Mcf ($5.33 per MMBtu).4
LNG imports rose 29 percent over 2003 to 652 Bcf as all four import terminals in the Lower 48 States were operational for the entire year. The volume of LNG imports in 2004 was another record high and nearly triple the volume received in 2000. Expansion of liquefaction facilities in Trinidad and Tobago allowed for increased deliveries from that country and supply from Algeria more than doubled. The natural gas industry continued moving toward an expansion of LNG infrastructure in the North America in anticipation of bringing competitively priced LNG from a variety of countries. One new facility began operations in 2005, and six are under construction: two along the U.S. Gulf Coast, two in eastern Canada, one in eastern Mexico, and one in Baja California, Mexico. The eastern Mexico terminal (Altamira) is expected to become operational in 2006 and the others by 2008. Ten U.S. proposed terminals have received regulatory approval either from the Federal Energy Regulatory Commission (FERC) or the U.S. Maritime Administration (MARAD). Of the ten U.S. terminals, eight are onshore (FERC approved) and two
3 Heating values for imports and exports are listed in Table SR 2, “Summary of Natural Gas Imports, 2003-2004,” and Table SR 3, “Summary of Natural Gas Exports, 2003-2004.” These tables are located at the end of this report. 4 Energy Information Administration, Natural Gas Monthly, July 2005 (Washington, D.C., July 2005) ,Table 5, for wellhead price data. The wellhead price was converted from dollars per Mcf to dollars per MMBtu using an average heat content of 1,030 Btu per cubic foot as published in Table A4 of the Annual Energy Review 2004.
are offshore (MARAD approved). Nine of the ten are located in the Gulf of Mexico. The FERC has also approved two pipelines to bring gas in from proposed LNG terminals in the Bahamas. There are also more than a dozen applications pending at federal agencies.
Canadian Pipeline Trade Although U.S. net imports from Canada in 2004 reversed a steep decline in the previous year, the increase in volumes did not resemble the growth in imports from Canada for much of the 1990s. Natural gas gross imports from Canada increased 169 Bcf, or 4.9 percent, over 2003 volumes to 3,607 Bcf, but higher U.S. exports to Canada nearly offset the entire increase. Net U.S. imports from Canada moved up only 46 Bcf, or 1.4 percent, to 3,212 Bcf. The volume of imports from Canada in recent years has reflected the overall growth trend in Canadian production, which has slowed or declined since 2000 so that 2004 production of 6,351 Bcf was only 109 Bcf more than 4 years earlier. Most Canadian production originates in the Western Canadian Sedimentary Basin (WCSB), where producers drilled a record number of wells.5 In 2004, it is estimated that 16,000 gas wells were drilled in Canada, mostly in the WCSB, which was 2,000 more than during the previous year (Figure 3). While at least a portion of the increase may be explained by producers having to access shallower, less-expensive wells because of a lack of better prospects, this increase in gas well drilling led to Canadian production for the year increasing by less than 2 percent. Figure 3. Wells Drilled and Canadian Production, 1997-2004
0
2,000
4,000
6,000
8,000
10,000
12,000
14,000
16,000
18,000
1997 1998 1999 2000 2001 2002 2003 2004
Wel
ls D
rille
d (in
thou
sand
s)
0
2
4
6
8
10
12
14
16
18
20
Production (Billion C
ubic Feeet per Day)
Wells Drilled Production
Source: Canadian Association of Petroleum Producers, Statistical Handbook.
5 Canadian Association of Petroleum Producers, Statistical Handbook. http://www.capp.ca.
Energy Information Administration/Office of Oil and Gas, December 2005 3

In response to the need to increase gas supplies in Canada, companies have launched the permitting process for a pipeline from the Mackenzie Delta in the Arctic. While resources in the Delta are viewed as plentiful, the effect of the Mackenzie pipeline on natural gas supply to the United States is uncertain, with at least a portion of the incremental supplies likely dedicated to Canadian oil sands production, a process that requires large volumes of natural gas. However, improvements in technologies have reduced the amount of natural gas consumed per barrel of oil sands production by about 25 percent since 1997.6 Additionally, substitutes to natural gas for fueling oil sands production are being developed. In the eastern part of Canada, the Sable Island Offshore Energy Project (SOEP), which produces natural gas from offshore Nova Scotia for delivery to New England, continues to experience exploration and development difficulties. In February 2004, Sable Island reserves were downgraded for the third consecutive year from an original estimate of 3.6 trillion cubic feet (Tcf) to 1.35 Tcf. 7 In addition to the slight increase in Canadian production, U.S imports from Canada increased owing to lower Canadian demand. Canadian end-use consumption was slightly lower, and there was also less natural gas added to Canadian storage during 2004 because of higher levels remaining in storage at the end of the 2003-2004 winter. More than half of Canadian production is delivered to the United States, primarily through large pipeline systems that are integrated with the U.S. interstate pipeline system. In all, imports from Canada comprised 85 percent of total U.S. natural gas imports in 2004, demonstrating again the importance of Canada’s natural gas industry to meeting U.S. demand. Canadian exports are also an important revenue source to that country, representing $21 billion (U.S dollars) in trade during 2004.8 Similar to U.S. domestic gas prices, the price of natural gas imports from Canada reached a record high in 2004. The annual average price was $5.80 per Mcf ($5.70 per MMBtu) for the year or more than 11 percent greater than the 2003 average of $5.23 per Mcf ($5.13 MMBtu). Prices rose sharply late in the year as average monthly prices rose from $4.94 per Mcf ($4.86 per MMBtu) in September to $6.91 per Mcf ($6.78 per MMBtu) in December. Although natural gas prices often rise as the calendar moves into the winter months, lost supply from
6 Stringham, Greg, “Canada’s Contribution to North America’s Natural Gas Needs,” Presentation before Ziff North American Natural Gas Conference, Calgary, Alberta, April 4, 2005. Available at : http://www.capp.ca. 7 Hughes, Larry, “Securing our energy future? A review of Nova Scotia’s energy sector in 2004,” Canadian Centre for Policy Alternatives Nova Scotia (July 2005), p. 5. 8 Derived from volume and price data in Table SR2, “Summary of Natural Gas Imports, 2003-2004.”
Hurricane Ivan and rising crude oil prices likely heightened concerns over supplies and resulted in a large surge in prices throughout North America during the final months of 2004. Growth of cross-border pipeline capacity has slowed significantly. In the late 1990s, a number of major new pipeline systems were built to provide outlets to increased Canadian production; however, in the past 2 years a total of only 274 million cubic feet per day of capacity has been added.9 Although Canadian production has grown only slowly if at all in recent years, thus limiting exports to the United States, LNG terminals in Canada for export of natural gas to the United States may influence future trends in U.S./Canada trade. The Energy Information Administration (EIA) has tracked up to six proposed LNG regasification plants in eastern Canada and two projects on the Canadian West Coast, although not all are proposed for direct export of natural gas to the United States. The most advanced proposals appear to be Irving Oil and Repsol’s project in Canaport, New Brunswick, and Anadarko Petroleum’s Bear Head LNG project on Point Tupper, Nova Scotia, both of which expect construction to be complete in late 2007 or 2008. Both projects have received regulatory approvals on environmental matters. With the continued disappointments surrounding the exploration and development of Sable Island reserves, the two projects hope to use existing and expanded capacity on the Maritimes and Northeast Pipeline (M&NP) to move gas into the U.S. Northeast. Bear Head LNG would be located 35 miles from the M&NP, while the Irving Oil terminal is proposed at a site about 60 miles from the pipeline.10
Currently, there are 25 principal entry points for imports from Canada into the United States. For this report, they are grouped into four regions: the Pacific Northwest, the West, the Midwest, and the Northeast (Figure 4). Imports into the West and the Midwest rose in 2004, while imports to the Northeast and the Pacific Northwest declined. The Midwest continued to receive the greatest percentage (46 percent) of total natural gas imports from Canada with imports of approximately 1,646 Bcf. The region, which had an increase in imports of 119 Bcf or 8 percent over 2003 volumes, includes the largest cross border pipeline system built in recent years. Alliance Pipeline System crosses the border at Sherwood, North Dakota, with an operating capacity of 1.3 Bcf per day. In the Northeast, the region with the second largest volume with 913 Bcf in imports from Canada, deliveries
9 Energy Information Administration, Gas Transportation Information System, Natural Gas Pipeline Capacity Database. 10 “Maritimes Inks Transportation Agreement for 1.5 Bcf/d with Anadarko, Repsol,” Natural Gas Intelligence (July 18, 2005).
Energy Information Administration/Office of Oil and Gas, December 2005 4

Figure 4. Monthly U.S. Natural Gas Imports from Canada by Region, 2003-2004 (Billion Cubic Feet)
Pacific Northwest
0
20
40
60
80
100
Jan Feb Mar Apr May Jun Jul Aug Sep Oct Nov Dec
2003
2004
West
0
20
40
60
80
100
120
Jan Feb Mar Apr May Jun Jul Aug Sep Oct Nov Dec
2003
2004
Midwest
0
20
40
60
80
100
120
140
160
Jan Feb Mar Apr May Jun Jul Aug Sep Oct Nov Dec
2003
2004
Northeast
0
20
40
60
80
100
120
Jan Feb Mar Apr May Jun Jul Aug Sep Oct Nov Dec
2004
2003
Source: Energy Information Administration, Office of Oil and Gas, Natural Gas Division, based on data from the Department of Energy, Office of Fossil Energy. Flows in the Pacific Northwest region include points of entry in the State of Washington. Flows in the West region include points of entry in Idaho. Points of entry in Montana, North Dakota, Michigan, Minnesota, are included in the Midwest region. Points of entry in New York, Vermont, and Maine are included in the Northeast region. declined for the second consecutive year. At the Niagara border crossing, where Tennessee Gas Pipeline connects with the TransCanada Pipeline system, volumes declined 6 Bcf to 363 Bcf. Volumes at Calais, Maine, where the M&NP crosses the border, fell 13 Bcf to 102 Bcf owing to production declines at Sable Island. Reflecting their proximity to major consuming markets with the highest prices in the United States, border points in the Northeast had the highest price of the four import regions. The average price for imports to the Northeast region was $6.44 per Mcf, which also reflected the largest year-to-year price increase of any region at 63 cents per Mcf. The United States exports natural gas by pipeline to Canada at numerous locations, including St. Clair, Michigan, where the Vector Pipeline crosses the border with a capacity of 1 Bcf per day. The volume of natural gas exported through the St. Clair point is by far the largest of any export point to Canada, as Vector Pipeline was constructed in 2000 to further integrate the North America pipeline grid and not to meet demand in a specific region. U.S. exports through St. Clair in 2004 were 318 Bcf, while total exports to Canada were 395 Bcf. The total volume of exports to Canada in 2004 included an increase of 124 Bcf, or 46 percent, over exports of 294 Bcf in 2003. The average price of exports
to Canada was $6.47 per Mcf ($6.35 MMBtu), 7 percent above the 2003 price. Pipeline exports to Canada represented 50 percent of total U.S. pipeline exports.
Mexican Pipeline Trade
Although Mexico ranks sixth in the Western Hemisphere in natural gas reserves, the country has had relatively limited reserve development and relies heavily on U.S. exports to meet growing demand. Current consumption in Mexico is small compared with that of the rest of North America at approximately 1.7 Tcf per year, which is 6.1 percent of the total 27.7 Tcf.11 In 2004, Mexico imported about one-fifth of the volume, or 397 Bcf, from the United States to meet the demand (Figure 5). Mexican natural gas production is concentrated in the south of the country, where it occurs mostly associated with crude oil production. In 2004, Mexico’s state oil and gas company Petroleos Mexicanos (Pemex) increased
11 BP, Statistical Review of World Energy 2005, Online. http://www.bp.com. (June 2005).
Energy Information Administration/Office of Oil and Gas, December 2005 5

Figure 5. Mexican Consumption, Production, and Imports from the United States, 1995-2004
0
500
1,000
1,500
2,000
2,500
3,000
1995 1996 1997 1998 1999 2000 2001 2002 2003 2004
Bill
ion
Cub
ic F
eet
U.S. Exports to MexicoMexican Production
Mexican Consumption
Source: Energy 2003 and Earlier Years: Energy Information Administration, International Energy Annual 2003. 2004: BP, at www.bp.com production slightly after reversing a downward trend the previous year. Additionally, Mexican officials continue to press forward with plans to reduce dependence on U.S. exports through developing the country’s reserves and construction of LNG terminals. Terminals are planned to be built on both the east and west coasts of the country. Mexico’s Strategic Gas Plan, formulated by Pemex in 2000, called for as increased domestic production through “multiple service contracts” (MSCs) with private companies, as well as imports of LNG to both east and west coasts.12 However, companies have been reluctant to participate in the MSCs, and legal challenges to distributed MSCs have proliferated. The MSCs are meant to comply with the country’s constitution, which prohibits foreign ownership of oil and gas resources, while providing sufficient economic incentive to encourage foreign investment in the oil and gas sectors. Under the program, companies lead financing and operations associated with a project, but Pemex retains ownership of the natural gas. Recently, Pemex suspended the program until Mexico’s Congress enacts legislation clarifying the regulatory authority over MSCs.13
12 Energy Information Administration, Mexico Country Analysis Brief (Washington, D.C., November 2004). 13 “Pemex Suspends MSC Program until Legislation Enacted,” Natural Gas Intelligence (June 27, 2005).
Mexico’s electric generation sector is increasingly relying on natural gas to meet incremental demand. With 95 percent of the Mexican population having access to electricity, demand for natural gas as a fuel for power generation is rising nationwide. In addition, as pipeline infrastructure to serve residential and commercial users continues to grow, requirements for natural gas in those sectors have increased substantially. Since 1998, U.S. exports to Mexico have grown from 53 Bcf to 397 Bcf in 2004. Last year’s volumes were the most ever exported to Mexico and nearly 16 percent higher than the level of the previous year. In all, Mexico has 15 natural gas interconnections with the southern United States, which add up to an import capacity of 3.6 Bcf per day.14 From these, six pipelines with a total capacity of 1.4 Bcf per day are connected to Pemex Gas’ National Pipeline System between the states of Tamaulipas and Nuevo León. The rest of the interconnections (2.0 Bcf per day of capacity) are connected to the isolated system of Pemex Gas (in the state of Sonora) and to other natural gas companies in Mexico (Sempra in Baja California and Gasoductos de Chihuahua in Chihuahua). Most of the interconnections in Tamaulipas have a bi-directional flow capability to allow gas transportation for imports and for exports.
14 Energy Information Administration, Gas Transportation Information System, Natural Gas Pipeline Capacity Database.
Energy Information Administration/Office of Oil and Gas, December 2005 6

Completion of several pipeline projects in recent years has supported the dramatic increase in export volumes at U.S.-Mexican border points. Exports of about 76 Bcf at the U.S.-Mexican border at Ogilby, California, on the recently-constructed North Baja Pipeline accounted for about 19 percent of flows, the highest of any point of exit to Mexico. Deliveries over the Roma, Texas, border point on Kinder Morgan’s Mier-Monterrey Pipeline were 63 Bcf, representing 16 percent of total exports to Mexico. The Mier-Monterrey Pipeline operated for its first full year since construction was completed March 20, 2003. Deliveries on Tennessee Gas Pipeline at Rio Bravo, Texas, increased 31 Bcf to a total of 40 Bcf as the pipeline’s South Texas Expansion project was operational for a complete year for the first time. The project was designed to deliver gas to a power plant in Rio Bravo, Mexico. The average price of U.S. pipeline exports to Mexico during the year was $5.89 per Mcf (also $5.89 per MMBtu), which was 10 percent higher than the average price in 2003.15 Because of higher prices and larger volumes, the value of total natural gas trade with Mexico reached record levels with receipts totaling approximately $2.3 billion, or 27 percent more than trade of $1.8 billion in 2003.
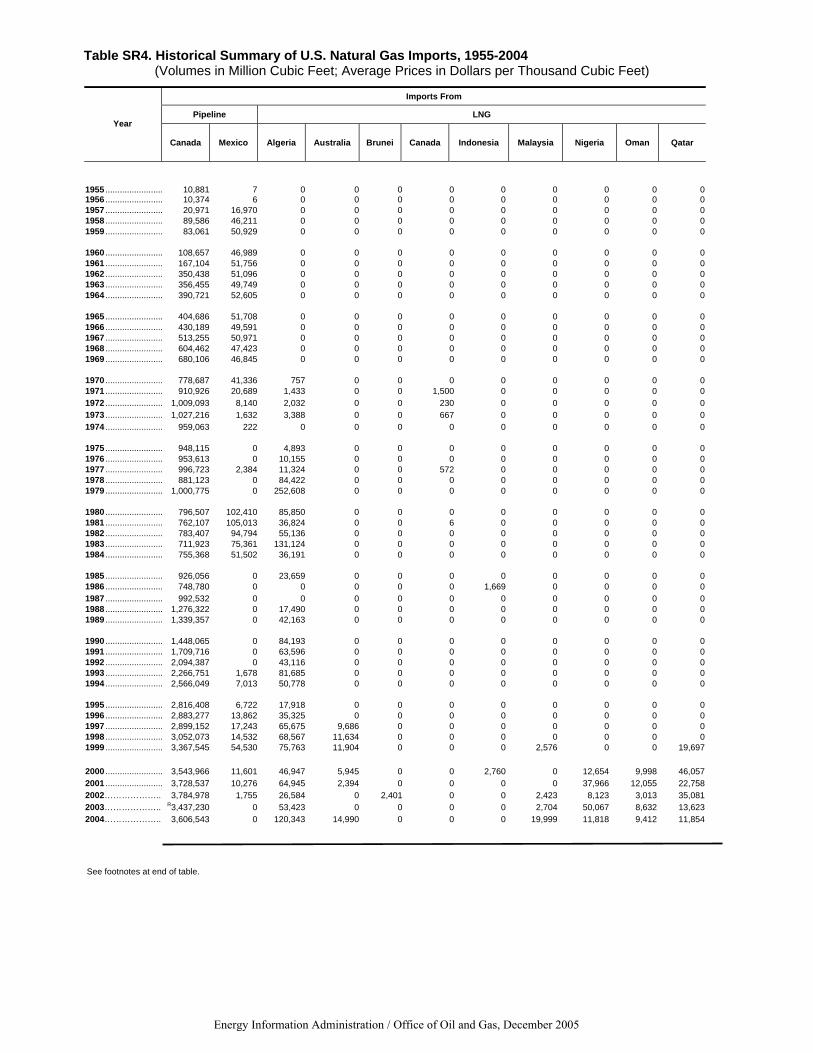
U.S. LNG Trade LNG deliveries reached a record high in 2004, reflecting the growing infrastructure for LNG trade both in domestic regasification facilities and liquefaction facilities world-wide. All indications are that growth in LNG trade will continue with industry pushing forward with plans to build numerous regasification terminals in North America and entering into agreements for LNG supplies. In 2004, the United States imported the gaseous equivalent of 652 Bcf from a total of seven countries, which was an increase of 29 percent over 2003.16 Trinidad and Tobago was once again the leading supplier, accounting for 71 percent of the deliveries to the United States. With the first full year of operations at the Atlantic LNG complex of a third train, or set of process units consisting of all equipment necessary to liquefy natural gas, imports from the country increased 22 percent from 378 Bcf to 462 Bcf. A fourth train at Atlantic LNG is expected to be completed in late 2005, which will make available an even greater volume of LNG to the United States. Last year, Algerian supplies totaled 120 Bcf, the second highest volume of any source country for LNG imports.
15 The heat content of natural gas exported to Mexico is 1,000 Btu per cubic foot. Thus, the price of gas exported per MMBtu is the same as the price per Mcf. 16 This volume does not include volumes imported through an import facility in Puerto Rico, which is a territory of the United States.
Despite an incident at the Skikda complex in January 2004, which shut down operations temporarily, the volume received by the United States was more than double the volume in 2003, as a contract between Algerian state oil and gas company Sonatrach and Norway’s Statoil for delivery to the United States became effective. Statoil delivered 66 Bcf to the Cove Point, Maryland, terminal under the 2-year contract. Other than Trinidad and Tobago and Algeria, source countries for U.S. LNG imports in 2004 included Malaysia (20.0 Bcf), Australia (15.0 Bcf), Qatar (11.9 Bcf), Nigeria (11.8 Bcf), and Oman (9.4 Bcf). These volumes, which were delivered under short-term authorizations with the Department of Energy, were delivered primarily in the summer as global demand for natural gas lessened and more supplies could be diverted to the high-priced U.S. market.17
Although prices for LNG in the global market are often set through long-term contracts of 20 or more years in length and are often tied to the price of oil, prices for U.S. LNG imports are usually set on a short-term basis. In 2004, the United States received cargoes carrying a total 440 Bcf through short-term authorizations from the Office of Fossil Energy. Although price considerations are not uniform for all LNG imports, prices for LNG cargoes under short-term authorizations appear pegged to U.S. domestic prices, particularly prices at the Henry Hub. In 2004, the average price for LNG imports by heat content was highest for Nigeria at $5.59 per MMBtu ($6.20 per Mcf). The price of imports from Trinidad and Tobago, including both short-term and long-term contracts, averaged $5.55 per MMBtu ($5.84 per Mcf), the second highest price received by any source country. In its first full year of operations since reopening for international trade in August 2003, Dominion’s regasification facility in Cove Point, Maryland, received the greatest volume of LNG deliveries of any of the four import terminals operating during the year (Figure 6). Dominion Cove Point received 209 Bcf, primarily from Trinidad and Tobago. Cove Point can add as much as 1 Bcf per day to the peak deliverability into the pipeline grid. Distrigas, located in Everett, Massachusetts, received 174 Bcf, which was the second highest volume received by the terminals and an increase of over 10 percent from
17 Section 3 of the Natural Gas Act of 1938 requires companies wanting to import or export natural gas to obtain an authorization from the Department of Energy, Office of Fossil Energy. There are both blanket and long-term authorizations. The blanket authorization enables companies to import or export on a short-term or spot market basis for a period of 2 years. The long-term authorization is used when a company has a signed gas purchase or sales agreement/contract for a period of time longer than 2 years.
Energy Information Administration/Office of Oil and Gas, December 2005 7

0
10
20
30
40
50
60
70
80
Janu
ary
Febr
uary
Mar
ch
Apr
il
May
June
July
Aug
ust
Sept
embe
r
Oct
ober
Nov
embe
r
Dec
embe
r
Bill
ion
Cub
ic F
eet
Everett Cove Point Elba Island Lake Charles
Figure 6. Monthly LNG Imports by Receiving Terminal, 2004
Source: Energy Information Administration, Office of Oil and Gas, Natural Gas Division, based on data from the Department of Energy, Office of Fossil Energy. 2003. The company, which is a subsidiary of Suez North America, completed an expansion of the terminal in April 2003 that increased its send-out capacity by approximately 300 million cubic feet (MMcf) per day to 725 MMcf per day. In 2004, all supplies received by Distrigas came from Trinidad and Tobago. Southern Union’s Trunkline LNG terminal, located in Lake Charles, Louisiana, received close to 164 Bcf, with much of the import volume arriving under short-term authorizations during the summer as LNG suppliers made spot cargoes available to buyers. El Paso’s Elba Island, Georgia, terminal received the least of the four operating terminals with 105 Bcf. Only five importers had LNG delivered to the United States, down from seven the previous year (Table 1). The number contrasts sharply with the number of mostly smaller merchant energy companies that earlier in the decade contemplated participation in the global industry. By far, the company with the largest deliveries is BG Group, which imported 269 Bcf to the Elba Island and Lake Charles terminals. BG Group, which owns the capacity rights at both of the terminals, brings short-term cargoes from a variety of source countries to the Lake
Charles terminal, where a vast network of pipelines allows blending of higher Btu content gas. The other importers were Distrigas, BP, Statoil, and Shell. Distrigas imported the second highest volume of any importer (174 Bcf), accounting for all deliveries to its facility in Massachusetts. BP, Statoil, and Shell, all of which share ownership of capacity at the Cove Point terminal, imported supplies primarily from Trinidad and Tobago and Algeria, both of which are source countries that supply LNG with relatively low Btu content compared with LNG from other countries. There was one exception to this in 2004 as BP used Cove Point’s new nitrogen-injection plant to reduce the Btu content of LNG from Nigeria in a shipment received in December. (See Box on “Interchangeability”). As LNG imports reached historical highs in 2004, they were more than 15 percent of U.S. imports, however they still represent only about 3 percent of U.S. consumption. It is expected that LNG imports will continue to grow, as economics of LNG supply indicate it can compete effectively with domestic resources of natural gas and pipeline imports.
Energy Information Administration/Office of Oil and Gas, December 2005 8

INTERCHANGEABILITY Because the composition of imported natural gas can differ significantly from that of domestic pipeline gas, one of the operational issues to consider with respect to imports of natural gas, particularly LNG, is interchangeability. Interchangeability is the ability to substitute one gaseous fuel for another in a combustion application without materially changing operational performance, safety, or emissions. In most other regions of the world, natural gas is not subjected to such high levels of ethane, propane, and butane extraction as in the United States, resulting in higher heating values than for U.S. pipeline gas. The presence of the more energy-dense hydrocarbons (ethane, propane, and butane) and low levels of non-hydrocarbons result in a portion of imported LNG supplies having a gross heating value between 1,100 and 1,150 Btu per cubic foot or about 10 percent higher than that of typical U.S. domestic pipeline gas. The introduction of high-Btu LNG into the pipeline system is a concern to pipeline operators and utilities if the resulting composition of the commingled product is outside acceptable limits for pipeline gas. The potential consequences of using such gas in combustion equipment could include:
• A change in the performance of gas-fired appliances that may result in flame instability, the incomplete combustion of the gas at the burner, the formation of unsafe levels of carbon monoxide in the exhaust gas, and increased pollutant emissions.
• Increased emissions from combustion turbines, which may result in noncompliance with environmental restrictions.
• Knocking in reciprocating natural gas engines, which reduces engine performance and damages parts.
There are ways to address interchangeability to allow the introduction of high-Btu LNG into the pipeline system. If the composition of imported LNG requires adjustment to enhance its interchangeability with U.S. pipeline gas, one or more of the following mitigation methods may be utilized:
• Diluting the richer regasified LNG with inert gases such as nitrogen • Extracting the ethane, propane, and butanes at the LNG import location prior to
delivery into the gas pipeline infrastructure • Extracting ethane, propane, butanes, and residual pentane-plus components at the
LNG liquefaction and export facilities prior to shipping to the United States • Blending of richer LNG with leaner LNG at the U.S. LNG import terminal • Blending of richer vaporized LNG with leaner pipeline gases downstream of the
U.S. LNG import terminal.
Energy Information Administration/Office of Oil and Gas, December 2005 9

Table 1. LNG Importers, 2004
Company Parent Nation Volume (Bcf) LNG Source Countries Terminal
Distrigas Corporation Suez Belgium 174 Trinidad and Tobago Everett
BP Energy Company BP United Kingdom 80 Trinidad and Tobago, Nigeria Cove Point
Statoil Natural Gas, LLC Statoil Group Norway 66 Trinidad and Tobago, Algeria Cove Point
BG LNG Services, Inc. BG Group United Kingdom 269
Trinidad and Tobago, Algeria, Australia, Oman, Qatar, Nigeria, Malaysia
Elba Island, Lake Charles
Shell NA LNG, LLC Shell The Netherlands 62 Trinidad and Tobago Cove Point
LNG Importers by Volume (2004)
Source: Energy Information Administration, Office of Oil and Gas, Natural Gas Division, based on data from the Department of Energy, Office of Fossil Energy. The United States also exports LNG to two countries, although the volume is relatively small and not expected to grow. Slightly more than 62 Bcf of LNG was delivered to Japan from the ConocoPhillips/Marathon facility in Kenai, Alaska, a decrease of about 4 Bcf from the 66 Bcf exported in 2003. A relatively small amount of LNG was exported to Mexico (by truck), totaling about 368 MMcf.
U.S. LNG Trade Expansion Sustained high prices in North American markets have continued to spur development of new LNG-related infrastructure. The first new LNG import facility in the Lower 48 States in 24 years was under construction in 2004 and began receiving shipments in early 2005. Further, the number of proposed LNG re-gasification plants has grown to more than 40. While not all are expected to be built, the number of projects underscores the economic opportunity for LNG imports at a time when the annual average U.S. wellhead price was $5.49 per Mcf ($5.35 per MMBtu) and LNG supplies are projected to increase around the world, including, most importantly to the United States, in the Atlantic Basin. (See Box on “Atlantic Basin LNG Capacity Expansion”) For the purpose of this report, terminal proposals are grouped in four geographic regions: the North America West Coast; the Gulf of Mexico region; the Bahamas; and the North American East Coast (Table 2). Projects in Canada would move regasified product south through existing pipelines, while LNG deliveries to terminals in Mexico would either displace current U.S. exports to the country or result in localized exports to the United States. Bahamas-based projects include proposals to build pipelines into Florida.
The greatest number of proposed LNG terminal projects is slated for the Gulf of Mexico region. Nearly 20 LNG terminals are in various stages of planning, approval, construction, and operation on the U.S. Gulf Coast. Owing to extensive pipeline infrastructure through and out of the region, the Gulf region offers an opportunity for project sponsors to avoid some costs of new construction and take advantage of economies of scale. The projects include nine new projects that have been approved by FERC and MARAD: ExxonMobil’s Vista del Sol terminal, Quintana Island, Texas; Cheniere Energy’s Sabine Pass LNG in Louisiana; Cheniere’s Corpus Christi LNG in Texas; Sempra Energy’s Cameron LNG in Louisiana; Chevron’s Port Pelican project in offshore Louisiana; Freeport LNG in Texas; ExxonMobil’s Golden Pass terminal in Texas; Occidental’s Ingleside Energy facility in Texas; and Shell’s Gulf Landing in offshore Louisiana. Of these approved projects, three have begun construction and several have plans to begin construction by year-end 2005. Construction has started at Freeport LNG’s terminal on Quintana Island. Freeport LNG believes that its construction schedule (to be completed in late 2007 or early 2008) means it will be the first new onshore terminal in the United States in more than 20 years. The terminal is owned by a partnership of Michael S. Smith and ConocoPhillips, Cheniere Energy, Dow, and Contango Oil & Gas. ConocoPhillips has contracted for 500 MMcf per day of the capacity until mid-2009 and 1 Bcf per day thereafter; Dow Chemical, 500 MMcf per day; and Mitsubishi Corp., 150 MMcf per day for 17 years starting in 2009. Freeport has filed with FERC to expand the terminal capacity to 4.0 Bcf per day, which would make it the largest in the United States.
Energy Information Administration/Office of Oil and Gas, December 2005 10

ATLANTIC BASIN LNG CAPACITY EXPANSION Similar to other links in the LNG supply chain, liquefaction projects often take years to plan and construct before becoming operational. But once constructed, LNG plants can provide large quantities of natural gas to the market. In the Atlantic Basin, defined as LNG activity in Europe, Africa, and the Western Hemisphere (excluding an export terminal in Alaska on the Pacific Ocean), several projects well underway are expected to provide a large increase in LNG supplies available to the United States, as well as to other markets. Over 90 percent of the LNG volumes delivered to the United States in 2004 was exported from countries in the Atlantic Basin. While Atlantic Basin LNG producers at the end of 2004 had 2.1 Tcf (43 million tons)1 of annual capacity, expansions in Nigeria and Trinidad and Tobago, as well as new facilities in Egypt and Norway, could increase annual Atlantic Basin liquefaction capacity to 3.3 Tcf (73 million tons) by the end of 2006.2 Currently, Trinidad and Tobago’s LNG facility at Point Fortin has three trains with an annual capacity of 482 Bcf (9.9 million tons). The construction of a fourth train that could produce an additional 253 Bcf (5.2 million tons) per year is expected to be completed by the end of 2005. Trinidad and Tobago is the largest-volume supplier of LNG to the United States, delivering 462 Bcf in 2004. Although Nigeria has not supplied large volumes of LNG to the United States in the past (U.S. imports totaled 12 Bcf in 2004), exports are likely to increase in the near future with the completion of two more trains at Nigeria’s Bonny Island LNG plant. Capacity at the Bonny Island plant is currently 463 Bcf (9.5 million tons). The two additional trains, scheduled to begin operation in 2005, will increase capacity by 400 Bcf per year (8.2 million tons per year). Two LNG export projects have been completed in 2005 in Egypt. The projects, which mark the country’s entrance into LNG exporting, are a one-train liquefaction facility at Damietta with an annual capacity of 244 Bcf (5.0 million tons) and a one-train project at Idku that started up with an annual capacity of 175 Bcf (3.6 million tons). Construction of a second train at Idku will be completed in 2006. Also in 2006, Norway’s Statoil, which is relatively new to LNG markets, will begin exporting LNG from a liquefaction terminal now being built on Melkøye Island in the Norwegian Sea. The plant is expected to have a capacity of 200 Bcf per year (4.1 million tons per year). Exports from these new plants will be delivered to markets in Spain, France, and the United States. Further capacity expansion in the Atlantic Basin will occur with renovation of Algeria’s LNG production plants. On January 19, 2004, a boiler exploded at the Skikda LNG export terminal in Algeria, which was once the lone supplier of LNG to the United States. The explosion destroyed three of six LNG trains at the Skikda terminal, resulting in production at the plant declining 76 percent during 2004. Algeria has decided to replace the three destroyed trains with a single, larger one, upon which construction should finish by mid-2007. 1 The conversion used here is 48.7 billion cubic feet to 1 million tons. 2Energy Information Administration, The Global Liquefied Natural Gas Market: Status & Outlook, DOE/EIA-0637 (Washington, DC, December 2003), Appendix G, p. 55.
Energy Information Administration/Office of Oil and Gas, December 2005 11

Table 2. Proposed LNG Terminals in North America as of August 1, 2005.
Project Owners Location Status
Mexican Gulf CoastAltimira Shell (75%), Total (25%) Altamira, Mexico 500 Under ConstructionDorado HiLoad Tideland Oil and Gas Offshore Gulf of Mexico 1,400 Announced
U.S. Gulf Coast Pelican Island LNG BP Galveston 1,200 AnnouncedVista del Sol LNG ExxonMobil Quintana Island, Texas 1,000 ApprovedSabine Pass/Cheniere Cheniere Sabine Pass, Louisiana 2,600 Under ConstructionPort Pelican ChevronTexaco Louisiana (Offshore) 1,600 ApprovedCameron LNG Sempra Energy Hackberry, Louisiana 1,500 Under ConstructionCorpus Christi LNG Cheniere Energy (67%), Sherwin (33%) Corpus Christi, Texas 2,600 ApprovedGolden Pass LNG ExxonMobil Sabine Pass, Texas 1,000 ApprovedCreole Trail LNG Cheniere Louisiana 3,300 AppliedMain Pass Energy Hub Freeport-McMoRan Sulphur Gulf of Mexico (Offshore) 1,000 AppliedGulf Landing Shell West Cameron, Louisiana (Offshore) 1,000 ApprovedFreeport LNG Freeport, Cheniere, Contango Freeport, Texas 1,500 Under ConstructionCalhoun LNG Gulf Coast LNG Partners Port Lavaca, Texas 1,000 AppliedCasotte Landing ChevronTexaco Pascagoula, Mississippi 1,000 AppliedCompass Port ConocoPhillips Gulf of Mexico (Offshore) 900 AppliedPearl Crossing ExxonMobil Gulf of Mexico (Offshore) 1,000 AppliedBeacon Port ConocoPhillips Gulf of Mexico (Offshore) 1,500 AppliedPort Arthur Sempra Energy Port Arthur, Texas 1,500 AppliedIngleside Energy Occidental Petroleum Ingleside, Texas 1,000 ApprovedGulf LNG Gulf LNG Energy Pascagoula, Mississippi 1,000 Applied
Canadian East Coast Canaport Irving Oil Canaport, New Brunswick, Canada 1,000 ApprovedBear Head LNG Anadarko Bearhead, Nova Scotia 1,000 ApprovedKeltic LNG Keltic Petrochemicals Goldboro, Nova Scotia 500 AnnouncedRabaska LNG Gaz Metro/Enbridge Levin, Quebec 500 AppliedQuebec LNG TransCanada, PetroCanada Gros Cacouna 500 AnnouncedPoint Tupper Statia Terminals Strait of Canso 500 Announced
U.S. East Coast KeySpan LNG Keyspan, BG LNG Services Providence, Rhode Island 525 Not approved by FERCCrown Landing BP Logan Township, New Jersey 1,200 AppliedWeaver's Cove Hess LNG Fall River, Massachusetts 800 ApprovedNortheast Gateway Project Excelerate Energy Massachusetts(Offshore) 800 AppliedBroadwater Energy TransCanada, Shell Long Island Sound 1,000 AppliedQuoddy Bay Quoddy Bay LLC Passamaquoddy Bay, Maine 500 AnnouncedDowneast LNG Kestrel Energy Robbinston, Maine 500 AnnouncedNeptune LNG Suez Energy North America Massachusetts (Offshore) 400 Applied
Florida/BahamasOcean Express LNG AES Ocean Cay, Bahamas 850 AppliedCalypso LNG Tractebel /El Paso/FPL Freeport Grand Caymon, Bahamas 832 Applied
Mexican West CoastTerminal GNL Mar Adentro de B.C. ChevronTexaco Baja California, Mexico (offshore) 750 ApprovedEnergia Costa Azul LNG Sempra Energy, Shell Baja California, Mexico 1,000 ApprovedRepsol Repsol Lazaro Cardenas, Mexico 500 AppliedSonora Pacific LNG DKRW Energy Puerto Libertad, Sonora 1,300 Applied
U.S West CoastClearwater Port Crystal Energy Oxnard, California (Offshore) 1,000 AppliedSound Energy Solutions Mitsubishi/ConocoPhillips Long Beach, Caifornia 700 AppliedCabrillo Port LNG BHP Billiton Oxnard, California (Offshore) 800 AppliedPort Westward LNG Port Westward LNG St. Helens, Oregon 700 AnnouncedJordan Cove Energy Projects Development Coos County, Oregon 250 AnnouncedGolden Gateway Excelerate Energy Offshore Northern California 500 AnnouncedNorthern Star Natural Gas Northern Star Natural Bradwood, Oregon 1,000 Applied
Canadian West CoastKitimat LNG Galveston LNG Elmsley Voce, Kitimat, British Columbi 340 AnnouncedWestpac Terminal LNG Westpac Terminal LNG Prince Rupert, British Columbia 340 Announced
Capacity (Million Cubic Feet per
Day)
Source: Energy Information Administration, Office of Oil and Gas, Natural Gas Division, based on information from the Federal Energy Regulatory Commission (FERC), industry trade press, company Internet sites, and other.
Energy Information Administration/Office of Oil and Gas, December 2005 12

Cheniere Energy has started construction of its Sabine Pass terminal in Cameron Parish, Louisiana, after the terminal received final approval from FERC in late 2004. Capacity has been reserved by Total with 1 Bcf per day for 20 years and Chevron with 700 MMcf per day for 20 years. Operations are expected to begin in late 2007 or early 2008. A third Cheniere terminal, Corpus Christi LNG in Texas, with a capacity of 2.6 Bcf per day, plans to begin construction in the third-quarter of 2005. The company has initiated the pre-filing process with FERC for a fourth terminal, Creole Trail LNG in Cameron Parish, Louisiana. It would have a send-out capacity of 3.3 Bcf per day. Cheniere has 100-percent ownership in both. In December 2003, Cameron LNG was the first new onshore terminal to be approved by FERC in more than 20 years. Construction of the terminal has begun, and owner Sempra LNG has signed an agreement to provide Tractebel LNG North America up to one-third of the capacity, or about 500 MMcf per day, at the terminal for 20 years. And recently, Italy’s ENI signed a preliminary agreement to take 600 MMcf per day of capacity for 20 years. As a result, construction is expected to begin later this year. ExxonMobil, which has proposed three projects in the Gulf of Mexico region, has received approval from FERC for two terminals. The Golden Pass project near Sabine Pass, Texas, and the Vista del Sol terminal near Corpus Christi, Texas, each will have the capacity to deliver up to 1 Bcf per day into the pipeline grid and are likely to be employed for receiving LNG to the United States from Qatar starting in 2009. ExxonMobil has signed heads of agreement with Qatar for 2 Bcf per day of supply starting in 2009. ExxonMobil has also applied to MARAD for approval of its Pearl Crossing LNG terminal 40 miles off Louisiana. The application has progressed to where it has received a favorable Draft Environmental Impact Statement. The processing of many offshore applications had been suspended between August and November 2004 pending a decision by government authorities on the impact of open rack vaporizers on marine life in the Gulf. In a recent opinion, however, MARAD noted that the agency does not believe open rack vaporizers pose a threat to the marine environment. MARAD has approved Shell’s Gulf Landing offshore LNG terminal to be located 38 miles off Cameron, Louisiana. The gravity-based structure will have send-out capacity of 1.0 Bcf per day and cost an estimated $700 million. This facility was the first to be approved with the open rack vaporizers since concern was raised last year, and it has drawn legal challenges from a variety of environmental groups for the decision.
Of the projects in the East Coast region, the only one to have received approval from the Federal government (FERC in this case) is Hess LNG, also known as Weaver’s Cove. The facility, proposed by a partnership of Amerada Hess and Poten, would be located in Fall River, Massachusetts, and is designed with a peak send-out of 800 MMcf per day. The project sponsors have pledged to move forward with the facility despite opposition from the public, as well as local and state governments. Although Weaver’s Cove is the only terminal project to receive regulatory approval on the East Coast, there are other applications before FERC. BP has proposed its 1.2 Bcf-day Crown Landing LNG facility for Logan Township, New Jersey. Additionally, a partnership of Shell and TransCanada Pipelines has proposed the Broadwater Energy terminal in the Long Island Sound. Suez Energy North America has proposed to construct Neptune LNG, a port offshore Massachusetts that will operate by mooring specially designed LNG ships equipped to vaporize LNG. Suez projects the facility’s average send-out will be 400 MMcf per day. Excelerate Energy has a similar proposal before regulators, also slated for offshore Massachusetts. One terminal in the Northeast has been rejected by the FERC. The Commission denied an application from KeySpan LNG and Algonquin Gas Transmission to convert an existing LNG storage facility in Providence, Rhode Island, into a new LNG import terminal because the facility would not meet current construction and safety standards. KeySpan’s LNG peak-shaving facility was placed in service in 1974 and currently receives LNG deliveries by truck from Distrigas’ LNG terminal in Everett, Massachusetts. More stringent standards were implemented in 1980 but did not affect the already-constructed KeySpan facility. FERC concluded the existing facility does not meet current Federal safety standards because the LNG storage tank impoundment was designed to contain 100 percent of the tank contents rather than 110 percent and thermal radiation and flammable vapor exclusion zones would extend offsite onto adjacent properties. On the West Coast, FERC continues to consider a proposed facility for Long Beach, California. Sound Energy Solutions, a partnership of Mitsubishi and ConocoPhillips, has proposed a facility with send-out capacity of 700 MMcf per day. A second project called the Northern Star LNG also recently started the pre-filing process with the FERC. Northern Star is a small project development company that has targeted Bradwood, Oregon, on the Columbia River as a good port for receiving large LNG carriers. They have filed with FERC for terminal with a deliverability of 1 Bcf per day. Two applications are also before MARAD to construct facilities near offshore near Oxnard, California: Crystal Energy has proposed a deepwater port with send-out of
Energy Information Administration/Office of Oil and Gas, December 2005 13

1 Bcf per day, and BHP Billiton’s proposed Cabrillo Port would have a capacity of 800 MMcf per day.
Conclusion
After two years of declines, net imports of natural gas and LNG to the United States in 2004 increased by 4.3 percent. Growth in the LNG sector of U.S. natural gas supply accounted for the majority of the increase, as the United States imported a record 652 Bcf, 29 percent more than in 2003. U.S. imports by pipeline from Canada reversed a one-year downturn but rose only slightly to 3,607 Bcf. Meanwhile, pipeline exports to Mexico and Canada continued a rapid expansion, further evidence of an integrated North American marketplace.
Energy Information Administration/Office of Oil and Gas, December 2005 14

Data Sources Data Sources Data for 1995 through 2004 are based on company filings made with the U.S. Department of Energy, Office of Fossil Energy, but may be the result of adjustments by the Energy Information Administration during review and comparison with data from EIA’s Natural Gas Monthly and Natural Gas Annual. The Office of Fossil Energy filings report data on a monthly level and are received quarterly. The Office of Fossil Energy collects these data as part of its regulatory oversight responsibilities. These data are published by the Office of Fossil Energy in the quarterly report, Natural Gas Imports and Exports (DOE/FE-0360). Data related to pipeline and terminal capacities are from the Energy Information Administration, Office of Oil and Gas, as well as from trade press, companies and industry sources.
Data for 1995 through 2004 are based on company filings made with the U.S. Department of Energy, Office of Fossil Energy, but may be the result of adjustments by the Energy Information Administration during review and comparison with data from EIA’s Natural Gas Monthly and Natural Gas Annual. The Office of Fossil Energy filings report data on a monthly level and are received quarterly. The Office of Fossil Energy collects these data as part of its regulatory oversight responsibilities. These data are published by the Office of Fossil Energy in the quarterly report, Natural Gas Imports and Exports (DOE/FE-0360). Data related to pipeline and terminal capacities are from the Energy Information Administration, Office of Oil and Gas, as well as from trade press, companies and industry sources. The data for 1994 and earlier years are taken from Form FPC-14, “Annual Report for Importers and Exporters of Natural Gas,” which was discontinued in 1995. The data reported on Form FPC-14 represented physical movements of natural gas, whereas the data collected by the Office of Fossil Energy are reported on an equity (sales) basis. For 1994 and earlier years, comparisons of the information in this article (physical movements) with the information reported by the Office of Fossil Energy (sales) may show differences because reporting requirements were different. Efforts were made to resolve these differences. Further information about how import and export data are collected is provided in the Natural Gas Monthly, Appendix B, “Data Sources.”
Energy Information Administration/Office of Oil and Gas, December 2005 15 Energy Information Administration/Office of Oil and Gas, December 2005 15
The data for 1994 and earlier years are taken from Form FPC-14, “Annual Report for Importers and Exporters of Natural Gas,” which was discontinued in 1995. The data reported on Form FPC-14 represented physical movements of natural gas, whereas the data collected by the Office of Fossil Energy are reported on an equity (sales) basis. For 1994 and earlier years, comparisons of the information in this article (physical movements) with the information reported by the Office of Fossil Energy (sales) may show differences because reporting requirements were different. Efforts were made to resolve these differences. Further information about how import and export data are collected is provided in the Natural Gas Monthly, Appendix B, “Data Sources.”

Energy Information Administration / Office of Oil and Gas, December 2005
Table SR1. Historical Summary of U.S. Natural Gas Net Imports, 1955-2004 (Million Cubic Feet)
Year Total Imports
Total Exports Net Imports Total Consumption
Net Imports as Percentage of
Total Consumption
1955 .......................... 10,888 31,029 – 8,693,657 –1956 .......................... 10,380 35,963 – 9,288,865 –1957 .......................... 37,941 41,655 – 9,846,139 –1958 .......................... 135,797 38,719 97,078 10,302,608 0.91959 .......................... 133,990 18,413 115,577 11,321,181 1.0 1960 .......................... 155,646 11,332 144,314 11,966,537 1.21961 .......................... 218,860 10,747 208,113 12,489,268 1.71962 .......................... 401,534 15,814 385,720 13,266,513 2.91963 .......................... 406,204 16,957 389,247 13,970,229 2.81964 .......................... 443,326 19,603 423,723 14,813,808 2.9 1965 .......................... 456,394 26,132 430,262 15,279,716 2.81966 .......................... 479,780 24,639 455,141 16,452,403 2.81967 .......................... 564,226 81,614 482,612 17,388,360 2.81968 .......................... 651,885 93,745 558,140 18,632,062 3.01969 .......................... 726,951 51,304 675,647 20,056,240 3.4 1970 .......................... 820,780 69,813 750,967 21,139,386 3.61971 .......................... 934,548 80,212 854,336 21,793,454 3.91972 .......................... 1,019,496 78,013 941,483 22,101,452 4.31973 .......................... 1,032,901 77,169 955,732 22,049,363 4.31974 .......................... 959,284 76,789 882,495 21,223,133 4.2 1975 .......................... 953,008 72,675 880,333 19,537,593 4.51976 .......................... 963,768 64,711 899,057 19,946,496 4.51977 .......................... 1,011,002 55,626 955,376 19,520,581 4.91978 .......................... 965,545 52,532 913,013 19,627,478 4.71979 .......................... 1,253,383 55,673 1,197,710 20,240,761 5.9 1980 .......................... 984,767 48,731 936,036 19,877,293 4.71981 .......................... 903,949 59,372 844,577 19,403,858 4.41982 .......................... 933,336 51,728 881,608 18,001,055 4.91983 .......................... 918,407 54,639 863,768 16,834,914 5.11984 .......................... 843,060 54,753 788,307 17,950,524 4.4 1985 .......................... 949,715 55,268 894,447 17,280,943 5.21986 .......................... 750,449 61,271 689,178 16,221,296 4.21987 .......................... 992,532 54,020 938,512 17,210,809 5.51988 .......................... 1,293,812 73,638 1,220,174 18,029,588 6.81989 .......................... 1,381,520 106,871 1,274,648 18,800,826 6.8 1990 .......................... 1,532,259 85,565 1,446,694 18,715,090 7.71991 .......................... 1,773,313 129,244 1,644,068 19,035,156 8.41992 .......................... 2,137,504 216,282 1,921,222 19,544,364 9.71993 .......................... 2,350,115 140,183 2,209,931 20,279,095 10.91994 .......................... 2,623,839 161,738 2,462,101 20,707,717 11.9 1995 .......................... 2,841,048 154,119 2,686,929 21,580,665 12.51996 .......................... 2,937,413 153,393 2,784,020 21,966,616 12.71997 .......................... 2,994,173 157,006 2,837,167 R22,737,342 R12.51998 .......................... 3,152,058 159,007 2,993,051 R22,245,956 R13.51999 .......................... 3,585,505 163,415 3,422,090 R22,405,151 R15.3 2000 .......................... 3,781,603 243,716 3,537,887 R23,333,121 R15.22001 .......................... 3,976,939 373,278 3,603,661 22,238,624 16.22002…………………… 4,015,463 516,233 3,499,230 R23,007,017 15.22003…………………… R3,943,749 R679,922 R3,263,827 R22,375,090 R14.62004…………………… 4,258,558 854,138 3,404,421 22,432,326 15.2
a Preliminary data. - Not applicable. R Revised data. Notes: Totals may not equal sum of components due to independent rounding. Geographic coverage is the continental United States including Alaska. Sources: Total Consumption: Historical Natural Gas Annual for 1955
through 2000; Natural Gas Monthly, July 2005, for 2001 through 2004. All Other Data: 1955-1971: Federal Power Commission, informally collected by letter. 1972-1994: Energy Information Administration (EIA), Form FPC-14, "Annual Report for Importers and Exporters of Natural Gas." 1995 to present: EIA based on data from the Office of Fossil Energy, U.S. Department of Energy, Natural Gas Imports and Exports.

Energy Information Administration / Office of Oil and Gas, December 2005
Table SR2. Summary of U.S. Natural Gas Imports, 2003-2004
Volume Average Btu Revenue Average Price
(million cubic feet) (Cubic Foot) (thousand dollars) (dollars/
thousand cubic feet)
(dollars/ million Btu) Source
2003 2004
Percent Change
2003 2004 2003 2004 2003 2004
Percent Change
2003 2004
Percent Change
Pipeline Canada........................ R3,437,230 3,606,543 4.9 1,019 1,019 R17,975,080 20,931,261 5.23 5.80 11.0 5.13 5.70 11.1 Mexico......................... 0 0 - 0 0 0 0 0 0 - 0 0 - Total ............................ R3,437,230 3,606,543 4.9 1,019 1,019 R17,975,080 20,931,261 5.23 5.80 11.0 5.13 5.70 11.1 LNG
Algeria ......................... 53,423 120,343 125.3 1,090 1,090 284,054 700,425 5.32 5.82 9.4 4.88 5.34 9.4 Australia ...................... 0 14,990 - 0 1,173 0 96,927 0 6.47 - 0 5.51 - Brunei………………... 0 0 - 0 0 0 0 0 0 - 0 0 - Indonesia..................... 0 0 - 0 0 0 0 0 0 - 0 0 - Malaysia ...................... 2,704 19,999 639.6 1,097 1,097 13,438 98,535 4.97 4.93 -0.8 4.53 4.49 -0.9 Nigeria......................... 50,067 11,818 -76.4 1,110 1,110 233,244 73,308 4.66 6.20 33.0 4.20 5.59 33.1 Oman ......................... 8,632 9,412 9.0 1,040 1,040 32,440 52,647 3.76 5.59 48.7 3.61 5.38 49.0 Qatar ........................... 13,623 11,854 -13.0 1,125 1,125 67,938 67,388 4.99 5.68 13.8 4.43 5.05 14.0 Trinidad/Tobago……. 378,069 462,100 22.2 1,051 1,051 1,793,583 2,697,428 4.74 5.84 23.2 4.51 5.55 23.1 Un. Arab Emirates....... 0 0 - 0 0 0 0 0 0 - 0 0 - Othera.......................... 0 1,500 - 0 1,090 0 8,277 0 5.52 - 0 5.06 - Total............................ 506,519 652,015 28.7 1,063 1,063 2,424,697 3,794,937 4.79 5.82 21.5 4.50 5.47 21.6 Grand Total .................. R3,943,749 4,258,558 8.0 1,025 1,025 R20,399,777 24,726,198 5.17 5.81 12.2 5.05 5.67 12.3
Table SR3. Summary of U.S. Natural Gas Exports, 2003-2004
Volume Average Btu Revenue Average Price
(million cubic feet) (Cubic Foot) (thousand dollars) (dollars/
thousand cubic feet)
(dollars/ million Btu) Source
2003 2004
Percent Change
2003 2004 2003 2004 2003 2004
Percent Change
2003 2004
Percent Change
Pipeline
Canada........................ R270,988 394,585 34.1 1,019 1,019 R1,635,340 2,553,611 R6.03 6.47 6.9 R5.92 6.35 7.1 Mexico......................... R342,859 397,086 19.3 1,000 1,000 R1,836,445 2,339,850 5.36 5.89 9.9 5.36 5.89 9.9 Total ............................ R613,848 791,671 26.2 1,009 1,009 R3,471,786 4,893,461 R5.66 6.18 8.8 R5.61 6.13 8.9 LNG
Japan .......................... R65,698 62,099 -3.7 1,010 1,010 R293,462 306,941 4.47 4.94 10.5 4.42 4.90 10.9 Mexico......................... 376 368 -2.1 1,000 1,000 2,191 3,010 5.82 8.19 40.7 5.82 8.19 40.7 Total ............................ R66,075 62,467 -3.5 1,010 1,010 R295,653 309,951 R4.47 4.96 10.7 4.43 4.91 10.8 Grand Total…………… R679,922 854,138 23.5 1,009 1,009 R3,767,439 5,203,412 R5.54 6.09 93 R5.49 6.04 9.4
R Revised data. Notes: Totals may not equal sum of components due to independent rounding. Geographic coverage is the continental United States including Alaska.
Source: Energy Information Administration based on data from the Office of Fossil Energy, U.S. Department of Energy, Natural Gas Imports and Exports.
a The point of origin for volumes of imported LNG was unassigned in the reports to the Office of Fossil Energy. R Revised data. – Not applicable. Notes: Totals may not equal sum of components due to independent rounding.
Geographic coverage is the continental United States including Alaska. Prices for LNG imports are reported as “landed,” defined as received at the terminal. Source: Energy Information Administration based on data from the Office of Fossil Energy, U.S. Department of Energy, Natural Gas Imports and Exports.
Energy Information Administration / Office of Oil and Gas, December 2005
Table SR4. Historical Summary of U.S. Natural Gas Imports, 1955-2004 (Volumes in Million Cubic Feet; Average Prices in Dollars per Thousand Cubic Feet)
Imports From
Pipeline LNG Year
Canada Mexico Algeria Australia Brunei Canada Indonesia Malaysia Nigeria Oman Qatar
1955 ........................ 10,881 7 0 0 0 0 0 0 0 0 01956 ........................ 10,374 6 0 0 0 0 0 0 0 0 01957 ........................ 20,971 16,970 0 0 0 0 0 0 0 0 01958 ........................ 89,586 46,211 0 0 0 0 0 0 0 0 01959 ........................ 83,061 50,929 0 0 0 0 0 0 0 0 0 1960 ........................ 108,657 46,989 0 0 0 0 0 0 0 0 01961 ........................ 167,104 51,756 0 0 0 0 0 0 0 0 01962 ........................ 350,438 51,096 0 0 0 0 0 0 0 0 01963 ........................ 356,455 49,749 0 0 0 0 0 0 0 0 01964 ........................ 390,721 52,605 0 0 0 0 0 0 0 0 0 1965 ........................ 404,686 51,708 0 0 0 0 0 0 0 0 01966 ........................ 430,189 49,591 0 0 0 0 0 0 0 0 01967 ........................ 513,255 50,971 0 0 0 0 0 0 0 0 01968 ........................ 604,462 47,423 0 0 0 0 0 0 0 0 01969 ........................ 680,106 46,845 0 0 0 0 0 0 0 0 0 1970 ........................ 778,687 41,336 757 0 0 0 0 0 0 0 01971 ........................ 910,926 20,689 1,433 0 0 1,500 0 0 0 0 01972 ........................ 1,009,093 8,140 2,032 0 0 230 0 0 0 0 01973 ........................ 1,027,216 1,632 3,388 0 0 667 0 0 0 0 01974 ........................ 959,063 222 0 0 0 0 0 0 0 0 0 1975 ........................ 948,115 0 4,893 0 0 0 0 0 0 0 01976 ........................ 953,613 0 10,155 0 0 0 0 0 0 0 01977 ........................ 996,723 2,384 11,324 0 0 572 0 0 0 0 01978 ........................ 881,123 0 84,422 0 0 0 0 0 0 0 01979 ........................ 1,000,775 0 252,608 0 0 0 0 0 0 0 0 1980 ........................ 796,507 102,410 85,850 0 0 0 0 0 0 0 01981 ........................ 762,107 105,013 36,824 0 0 6 0 0 0 0 01982 ........................ 783,407 94,794 55,136 0 0 0 0 0 0 0 01983 ........................ 711,923 75,361 131,124 0 0 0 0 0 0 0 01984 ........................ 755,368 51,502 36,191 0 0 0 0 0 0 0 0 1985 ........................ 926,056 0 23,659 0 0 0 0 0 0 0 01986 ........................ 748,780 0 0 0 0 0 1,669 0 0 0 01987 ........................ 992,532 0 0 0 0 0 0 0 0 0 01988 ........................ 1,276,322 0 17,490 0 0 0 0 0 0 0 01989 ........................ 1,339,357 0 42,163 0 0 0 0 0 0 0 0 1990 ........................ 1,448,065 0 84,193 0 0 0 0 0 0 0 01991 ........................ 1,709,716 0 63,596 0 0 0 0 0 0 0 01992 ........................ 2,094,387 0 43,116 0 0 0 0 0 0 0 01993 ........................ 2,266,751 1,678 81,685 0 0 0 0 0 0 0 01994 ........................ 2,566,049 7,013 50,778 0 0 0 0 0 0 0 0 1995 ........................ 2,816,408 6,722 17,918 0 0 0 0 0 0 0 01996 ........................ 2,883,277 13,862 35,325 0 0 0 0 0 0 0 01997 ........................ 2,899,152 17,243 65,675 9,686 0 0 0 0 0 0 01998 ........................ 3,052,073 14,532 68,567 11,634 0 0 0 0 0 0 01999 ........................ 3,367,545 54,530 75,763 11,904 0 0 0 2,576 0 0 19,697 2000 ........................ 3,543,966 11,601 46,947 5,945 0 0 2,760 0 12,654 9,998 46,0572001 ........................ 3,728,537 10,276 64,945 2,394 0 0 0 0 37,966 12,055 22,7582002……………….. 3,784,978 1,755 26,584 0 2,401 0 0 2,423 8,123 3,013 35,0812003……………….. R3,437,230 0 53,423 0 0 0 0 2,704 50,067 8,632 13,6232004……………….. 3,606,543 0 120,343 14,990 0 0 0 19,999 11,818 9,412 11,854
See footnotes at end of table.

Energy Information Administration / Office of Oil and Gas, December 2005
Table SR4. Historical Summary of U.S. Natural Gas Imports, 1955-2004 (Volumes in Million Cubic Feet; Average Prices in Dollars per Thousand Cubic Feet) – Continued
Imports From
LNG Year
Trinidad/Tobago
Un. Arab Emirates Othera
Total Importsb
Average Price
1955 ..................... 0 0 0 10,888 NA1956 ..................... 0 0 0 10,380 NA1957 ..................... 0 0 0 37,941 NA1958 ..................... 0 0 0 135,797 NA1959 ..................... 0 0 0 133,990 NA 1960 ..................... 0 0 0 155,646 NA1961 ..................... 0 0 0 218,860 NA1962 ..................... 0 0 0 401,534 NA1963 ..................... 0 0 0 406,204 NA1964 ..................... 0 0 0 443,326 NA 1965 ..................... 0 0 0 456,394 NA1966 ..................... 0 0 0 479,780 NA1967 ..................... 0 0 0 564,226 NA1968 ..................... 0 0 0 651,885 NA1969 ..................... 0 0 0 726,951 NA 1970 ..................... 0 0 0 820,780 NA1971 ..................... 0 0 0 934,548 NA1972 ..................... 0 0 0 1,019,496 0.311973 ..................... 0 0 0 1,032,901 0.351974 ..................... 0 0 0 959,284 0.55 1975 ..................... 0 0 0 953,008 1.211976 ..................... 0 0 0 963,768 1.721977 ..................... 0 0 0 1,011,002 1.981978 ..................... 0 0 0 965,545 2.131979 ..................... 0 0 0 1,253,383 2.49 1980 ..................... 0 0 0 984,767 4.281981 ..................... 0 0 0 903,949 4.881982 ..................... 0 0 0 933,336 5.031983 ..................... 0 0 0 918,407 4.781984 ..................... 0 0 0 843,060 4.08 1985 ..................... 0 0 0 949,715 3.211986 ..................... 0 0 0 750,449 2.431987 ..................... 0 0 0 992,532 1.951988 ..................... 0 0 0 1,293,812 1.841989 ..................... 0 0 0 1,381,520 1.82 1990 ..................... 0 0 0 1,532,259 1.941991 ..................... 0 0 0 1,773,313 1.831992 ..................... 0 0 0 2,137,504 1.851993 ..................... 0 0 0 2,350,115 2.031994 ..................... 0 0 0 2,623,839 1.87 1995 ..................... 0 0 0 2,841,048 1.491996 ..................... 0 4,949 0 2,937,413 1.971997 ..................... 0 2,417 0 2,994,173 2.171998 ..................... 0 5,252 0 3,152,058 1.971999 ..................... 50,777 2,713 0 3,585,505 2.24 2000 ..................... 98,949 2,725 0 3,781,603 3.952001 ..................... 98,009 0 0 3,976,939 4.432002…………….. 151,104 0 0 4,015,463 3.152003…………….. 378,069 0 0 R3,943,749 5.172004…………….. 462,100 0 1,500 4,258,558 5.81 a The point of origin for volumes of imported LNG was unassigned in the
reports to the Office of Fossil Energy. b Volumes reported for 1966 through 1997 are on a pressure base of 14.73 pounds per square inch absolute and 60 degrees Fahrenheit. Volumes for 1955 through 1965 are as reported. NA Not available. R Revised data. Notes: Totals may not equal sum of components due to independent rounding. Geographic coverage is the continental United States including
Alaska. Prior to 2003, prices for LNG imports may be reported as either “landed,” defined as received at the terminal or “tailgate,” defined as regasification at the terminal. For 2003 and 2004, all prices for LNG imports are reported as “landed.” Sources: 1955-1971: Federal Power Commission, informally collected by letter. 1972-1994: Energy Information Administration, Form FPC-14, "Annual Report for Importers and Exporters of Natural Gas." 1995 to present: Energy Information Administration based on data from the Office of Fossil Energy, U.S. Department of Energy, Natural Gas Imports and Exports.

Energy Information Administration / Office of Oil and Gas, December 2005
Table SR5. Historical Summary of U.S. Natural Gas Exports, 1955-2004 (Volumes in Million Cubic Feet; Average Prices in Dollars per Thousand Cubic Feet)
Exports To
Pipeline LNG Year
Canada Mexico Japan Mexico
Total Exports Average Price
1955 .............................. 11,467 19,562 0 0 31,029 NA1956 .............................. 16,819 19,144 0 0 35,963 NA1957 .............................. 30,867 10,788 0 0 41,655 NA1958 .............................. 32,129 6,590 0 0 38,719 NA1959 .............................. 11,739 6,674 0 0 18,413 NA 1960 .............................. 5,759 5,573 0 0 11,332 NA1961 .............................. 5,577 5,170 0 0 10,747 NA1962 .............................. 5,574 10,240 0 0 15,814 NA1963 .............................. 6,879 10,078 0 0 16,957 NA1964 .............................. 9,763 9,840 0 0 19,603 NA 1965 .............................. 17,979 8,153 0 0 26,132 NA1966 .............................. 20,281 4,358 0 0 24,639 NA1967 .............................. 70,456 11,158 0 0 81,614 NA1968 .............................. 81,647 12,098 0 0 93,745 NA1969 .............................. 34,931 13,391 2,982 0 51,304 NA 1970 .............................. 10,878 14,678 44,257 0 69,813 NA1971 .............................. 14,349 15,632 50,231 0 80,212 NA1972 .............................. 15,553 14,579 47,882 0 78,013 0.511973 .............................. 14,824 13,999 48,346 0 77,169 0.541974 .............................. 13,263 13,268 50,258 0 76,789 0.72 1975 .............................. 10,219 9,454 53,002 0 72,675 1.251976 .............................. 7,506 7,425 49,779 0 64,711 1.551977 .............................. 31 3,940 51,655 0 55,626 1.921978 .............................. 66 4,033 48,434 0 52,532 2.131979 .............................. 76 4,308 51,289 0 55,673 2.29 1980 .............................. 113 3,886 44,732 0 48,731 4.701981 .............................. 106 3,337 55,929 0 59,372 5.901982 .............................. 162 1,705 49,861 0 51,728 5.811983 .............................. 136 1,646 52,857 0 54,639 5.101984 .............................. 127 1,786 52,840 0 54,753 4.92 1985 .............................. 178 2,207 52,883 0 55,268 4.771986 .............................. 9,203 1,896 50,172 0 61,271 2.811987 .............................. 3,297 2,125 48,599 0 54,020 3.071988 .............................. 19,738 2,327 51,573 0 73,638 2.741989 .............................. 38,443 17,004 51,424 0 106,871 2.51 1990 .............................. 17,359 15,659 52,546 0 85,565 3.101991 .............................. 14,791 60,448 54,005 0 129,244 2.591992 .............................. 67,777 95,973 52,532 0 216,282 2.251993 .............................. 44,518 39,676 55,989 0 140,183 2.591994 .............................. 52,556 46,500 62,682 0 161,738 2.50 1995 .............................. 27,554 61,283 65,283 0 154,119 2.391996 .............................. 51,905 33,840 67,648 0 153,393 2.971997 .............................. 56,447 38,372 62,187 0 157,006 3.021998 .............................. 39,891 53,133 65,951 33 159,007 2.451999 .............................. 38,508 61,025 63,607 275 163,415 2.61 2000 .............................. 72,586 105,102 65,610 418 243,716 4.102001……………………. 166,690 140,370 65,753 465 373,278 4.192002……………………. 189,313 263,078 63,439 403 516,233 3.412003……………………. R270,988 R342,859 R65,698 376 R679,922 R5.542004……………………. 394,585 397,086 62,099 368 854,138 6.09 R Revised data. Notes: Totals may not equal sum of components due to independent rounding. Geographic coverage is the continental United States including Alaska. LNG exports to Mexico are shipped by truck. Sources: 1955-1971: Federal Power Commission, informally collected
by letter. 1972-1994: Energy Information Administration, Form FPC-14, "Annual Report for Importers and Exporters of Natural Gas." 1995 to present: Energy Information Administration based on data from the Office of Fossil Energy, U.S. Department of Energy, Natural Gas Imports and Exports.

Table SR6. U.S. Natural Gas Imports by Point of Entry, 2003-2004(Volumes in Million Cubic Feet; Average Prices in Dollars per Thousand Cubic Feet)
Yearand
Month
Canada (Pipeline)
Pacific Northwest West Midwest
Sumas, WA Eastport, ID Babb, MT Detroit, MI Havre, MT
Volume AveragePrice Volume Average
Price Volume AveragePrice Volume Average
Price Volume AveragePrice
2003January ..................... 37,034 4.91 50,629 4.29 339 4.29 0 - 0 - February ................... 30,229 5.06 36,830 4.72 300 5.61 555 6.96 0 - March ........................ 34,706 6.55 38,729 6.41 331 7.87 641 6.16 0 -
April .......................... 29,652 4.25 51,913 4.63 322 4.58 24 5.95 0 - May ........................... 26,781 4.66 43,824 4.78 332 4.75 0 - 0 - June .......................... 28,369 4.92 47,992 5.74 321 4.90 0 - 0 -
July ........................... 25,411 4.62 61,373 4.90 340 4.32 0 - 0 - August ...................... 30,943 4.19 57,701 4.28 340 4.05 0 - 0 - September ................ 29,455 4.29 53,366 4.49 323 4.20 0 - 0 -
October ..................... 26,506 4.27 52,708 4.32 1,170 4.31 0 - 0 - November ................. 32,511 4.28 59,036 4.18 207 4.16 807 4.91 0 - December ................. 34,660 4.73 69,550 4.59 320 4.22 487 6.28 0 -
Total .......................... 366,257 4.76 623,652 4.72 4,645 4.70 2,514 5.96 0 - 2004
January ..................... 33,663 5.32 57,591 5.21 32 4.90 585 6.42 0 - February ................... 33,242 5.08 58,527 4.99 21 3.93 233 5.70 0 - March ........................ 32,785 4.65 55,464 4.74 15 3.33 35 6.27 0 -
April .......................... 26,922 4.63 50,862 4.78 26 4.32 153 6.05 0 - May ........................... 27,331 5.09 49,952 5.15 168 4.84 0 - 0 - June .......................... 24,544 5.52 54,598 5.50 198 4.84 99 7.04 0 -
July ........................... 21,530 5.24 64,901 5.30 339 5.41 0 - 0 - August ...................... 21,499 5.19 69,866 5.28 278 4.77 0 - 0 - September ................ 25,683 4.83 58,737 4.72 1,491 4.65 0 - 0 -
October ..................... 25,915 4.84 47,283 4.77 823 4.87 0 - 0 - November ................. 31,238 6.73 63,921 6.39 930 6.73 12 6.72 0 - December ................. 34,700 6.21 76,184 6.18 11 4.05 0 - 0 -
Total .......................... 339,051 5.31 707,885 5.30 4,333 5.21 1,117 6.27 0 -
See footnotes at end of table.
Energy Information Administration / Office of Oil and Gas, December 2005

Table SR6. U.S. Natural Gas Imports by Point of Entry, 2003-2004(Volumes in Million Cubic Feet; Average Prices in Dollars per Thousand Cubic Feet) —Continued
Yearand
Month
Canada (Pipeline)
Midwest
International Falls,MN
Marysville,MI Noyes, MN Port of del Bonita,
MT Port of Morgan, MT
Volume AveragePrice Volume Average
Price Volume AveragePrice Volume Average
Price Volume AveragePrice
2003January ..................... 0 - 0 - 40,044 4.71 24 4.13 65,634 4.65February ................... 0 - 0 - 36,608 5.55 25 4.76 56,620 5.43March ........................ 0 - 0 - 34,985 7.19 0 - 58,162 8.58
April .......................... 0 - 0 - 24,061 R4.59 26 4.63 62,856 4.98May ........................... 0 - 0 - 30,428 4.80 31 4.87 68,380 4.98June .......................... 0 - 0 - 23,409 5.09 31 5.22 52,242 5.63
July ........................... 0 - 0 - 29,346 4.77 31 5.24 59,462 5.13August ...................... 0 - 0 - 24,618 4.35 31 4.25 60,323 4.46September ................ 0 - 0 - 20,395 4.40 29 4.54 61,295 4.70
October ..................... 0 - 0 - 26,762 4.31 29 4.32 57,386 4.45November ................. 0 - 0 - 28,446 4.50 0 - 47,045 4.64December ................. 0 - 0 - R40,699 5.24 0 - 49,884 5.07
Total .......................... 0 - 0 - R359,801 5.04 257 4.68 699,288 5.222004
January ..................... 0 - 0 - 38,397 5.96 0 - 62,823 5.99February ................... 0 - 0 - 30,062 5.58 0 - 58,803 5.71March ........................ 0 - 0 - 34,061 5.22 0 - 62,330 5.10
April .......................... 0 - 0 - 34,661 5.02 0 - 55,467 5.14May ........................... 0 - 0 - 27,071 5.43 0 - 59,282 5.48June .......................... 0 - 0 - 28,720 5.65 0 - 61,329 5.99
July ........................... 0 - 0 - 28,649 5.62 0 - 63,191 5.66August ...................... 0 - 0 - 27,978 5.45 0 - 64,507 5.54September ................ 0 - 0 - 28,484 4.74 0 - 60,872 4.75
October ..................... 0 - 0 - 31,151 5.29 0 - 61,397 5.00November ................. 0 - 140 7.61 44,314 6.98 0 - 55,972 7.62December ................. 0 - 163 7.97 45,748 7.10 0 - 64,538 6.78
Total .......................... 0 - 303 7.80 399,298 5.77 0 - 730,512 5.73
See footnotes at end of table.
Energy Information Administration / Office of Oil and Gas, December 2005

Table SR6. U.S. Natural Gas Imports by Point of Entry, 2003-2004(Volumes in Million Cubic Feet; Average Prices in Dollars per Thousand Cubic Feet) —Continued
Yearand
Month
Canada (Pipeline)
Midwest
Portal, ND Sherwood, NDa St Clair, MI Sweet Grass, MT Warroad, MN
Volume AveragePrice Volume Average
Price Volume AveragePrice Volume Average
Price Volume AveragePrice
2003January ..................... 7 3.03 R41,008 4.84 342 5.64 0 - 633 4.97February ................... 5 2.98 R37,227 5.94 237 6.00 0 - 595 5.60March ........................ 5 2.89 R35,604 8.08 438 9.68 0 - 658 8.60
April .......................... 5 3.16 R34,145 5.10 10 5.66 0 - 391 5.22May ........................... 5 3.22 R36,019 5.29 448 5.54 0 - 357 5.18June .......................... 37 3.17 R39,365 5.68 696 6.19 0 - 336 6.02
July ........................... 29 2.92 R34,081 5.05 1,212 5.71 0 - 275 5.40August ...................... 41 3.28 R34,559 4.68 405 4.65 0 - 310 4.80September ................ 38 3.36 R34,297 4.73 599 5.20 0 - 292 6.06
October ..................... 34 3.29 R36,042 4.58 627 4.95 76 3.88 275 4.49November ................. 24 3.11 R36,167 4.61 158 4.77 58 3.89 386 4.41December ................. 25 3.03 R36,684 5.13 30 5.23 213 5.85 417 4.79
Total .......................... 255 3.17 R435,199 5.31 5,202 5.84 347 5.09 4,925 5.632004
January ..................... 20 3.23 41,312 6.07 0 - 238 5.18 626 6.07February ................... 6 3.77 38,922 5.61 0 - 201 4.67 544 5.81March ........................ 9 3.39 38,279 5.15 0 - 217 4.75 525 5.20
April .......................... 13 3.50 38,658 5.35 1,038 5.81 224 5.01 345 5.39May ........................... 30 3.50 37,439 5.86 881 6.33 296 5.46 477 5.91June .......................... 40 5.42 37,509 6.27 1,616 6.91 283 5.27 383 6.43
July ........................... 40 4.87 39,176 5.88 2,250 6.34 252 5.26 309 6.10August ...................... 275 4.94 37,666 5.67 2,583 6.20 219 4.83 410 5.81September ................ 394 4.72 38,343 5.03 625 5.03 207 4.42 343 5.03
October ..................... 650 6.05 39,772 5.52 3,037 6.36 214 5.45 0 - November ................. 76 4.63 34,365 6.94 4,645 6.40 186 5.32 393 7.93December ................. 9 4.28 37,233 6.88 6,178 7.02 192 5.68 438 8.07
Total .......................... 1,562 5.26 458,675 5.84 22,853 6.50 2,728 5.12 4,793 6.15
See footnotes at end of table.
Energy Information Administration / Office of Oil and Gas, December 2005

Table SR6. U.S. Natural Gas Imports by Point of Entry, 2003-2004(Volumes in Million Cubic Feet; Average Prices in Dollars per Thousand Cubic Feet) —Continued
Yearand
Month
Canada (Pipeline)
Midwest Northeast
Whitlash, MT Total Calais, ME Champlain, NY Grand Island,NY
Volume AveragePrice Volume Average
Price Volume AveragePrice Volume Average
Price Volume AveragePrice
2003January ..................... 1,182 4.44 R149,215 4.72 11,647 6.00 0 - 15,518 5.46February ................... 1,214 5.75 R133,387 5.63 8,396 6.96 0 - 14,671 7.11March ........................ 1,413 7.19 R132,238 8.06 11,439 9.90 0 - 8,339 9.03
April .......................... 1,194 4.67 R123,032 4.94 R11,513 R5.39 1,454 4.31 5,352 5.74May ........................... 1,210 4.90 R137,210 5.03 R12,794 R5.47 1,484 4.31 2,867 5.71June .......................... 1,191 4.99 R117,627 5.54 R11,442 5.87 1,407 4.31 2,609 6.41
July ........................... 855 4.36 R125,631 R5.03 9,064 5.19 1,407 4.30 3,755 5.61August ...................... 951 4.19 R121,579 4.51 7,639 4.74 1,432 4.31 4,390 5.34September ................ 860 4.27 R118,129 4.66 8,119 4.75 1,389 4.30 3,936 5.39
October ..................... 889 4.20 R123,289 4.46 7,964 4.38 1,260 4.30 3,584 5.79November ................. 1,772 4.10 R115,069 4.59 6,855 4.51 1,261 4.48 4,760 5.07December ................. 1,744 4.65 R130,502 5.14 8,429 5.43 1,485 4.48 6,639 6.02
Total .......................... 14,475 4.86 R1,526,906 R5.20 R115,301 R5.85 12,579 4.34 76,421 6.262004
January ..................... 2,199 5.28 146,231 6.00 8,437 7.25 1,114 4.48 9,847 6.55February ................... 2,066 4.84 130,858 5.63 7,476 7.73 1,422 4.48 7,992 6.05March ........................ 2,179 4.65 137,651 5.13 8,011 5.49 1,486 4.48 5,716 5.88
April .......................... 2,012 5.06 132,597 5.19 8,350 5.77 1,386 4.48 7,033 6.06May ........................... 1,794 5.02 127,438 5.60 7,188 6.09 1,385 4.48 5,005 6.45June .......................... 1,719 4.90 131,897 6.00 8,082 6.70 1,421 4.48 2,752 6.84
July ........................... 1,389 5.31 135,596 5.73 10,057 6.18 1,515 4.47 2,789 6.60August ...................... 1,337 5.00 135,252 5.57 10,645 5.95 1,454 4.48 2,508 6.39September ................ 1,405 4.45 132,164 4.83 9,876 5.10 1,428 4.48 2,869 5.57
October ..................... 1,472 4.85 138,517 5.26 7,508 5.95 1,168 4.53 3,816 6.32November ................. 1,196 5.87 142,230 7.18 7,913 7.25 1,242 4.75 5,787 7.66December ................. 1,303 5.99 155,812 6.90 8,748 8.18 1,481 4.77 10,497 7.88
Total .......................... 20,069 5.06 1,646,242 5.78 102,292 6.44 16,502 4.53 66,612 6.63
See footnotes at end of table.
Energy Information Administration / Office of Oil and Gas, December 2005

Table SR6. U.S. Natural Gas Imports by Point of Entry, 2003-2004(Volumes in Million Cubic Feet; Average Prices in Dollars per Thousand Cubic Feet) —Continued
Yearand
Month
Canada (Pipeline)
Northeast
Highgate Springs,VT Massena, NY Niagara Falls,
NYNorth Troy,
VT Pittsburg, NH
Volume AveragePrice Volume Average
Price Volume AveragePrice Volume Average
Price Volume AveragePrice
2003January ..................... 1,297 R5.46 1,021 5.87 37,407 5.13 0 - 4,832 5.77February ................... 1,006 5.72 890 5.87 33,203 R6.60 0 - 4,291 6.58March ........................ 889 R6.88 771 7.57 31,739 8.49 0 - 3,820 9.94
April .......................... 775 5.97 549 5.59 32,111 5.43 0 - 2,041 5.61May ........................... 426 5.72 270 6.05 30,278 5.46 0 - 1,871 5.79June .......................... 343 7.24 297 6.41 25,680 5.96 0 - 2,114 6.37
July ........................... 280 6.51 289 6.04 29,418 5.56 0 - 2,484 5.65August ...................... 333 6.00 507 5.41 30,677 5.06 0 - 2,367 5.11September ................ 323 6.22 291 5.89 26,595 5.05 0 - 2,315 5.11
October ..................... 626 5.60 505 5.35 30,050 4.87 0 - 2,340 5.08November ................. 804 5.00 653 6.23 24,993 4.89 0 - 2,542 5.06December ................. 1,169 5.20 776 6.19 R36,900 5.77 0 - R3,965 R5.06
Total .......................... 8,272 5.80 6,817 6.08 R369,052 5.71 0 - R34,983 R6.082004
January ..................... 1,429 6.18 1,145 6.94 31,510 6.74 0 - 4,106 6.60February ................... 1,178 5.89 973 6.86 27,321 6.32 0 - 3,549 6.62March ........................ 924 5.29 837 6.37 28,227 5.66 0 - 2,859 5.38
April .......................... 716 5.60 625 6.03 28,000 5.72 0 - 793 6.13May ........................... 424 6.38 406 6.44 29,663 6.33 0 - 853 6.70June .......................... 390 7.26 334 7.17 34,753 6.75 0 - 989 7.02
July ........................... 323 7.31 293 6.80 35,768 6.34 0 - 866 6.61August ...................... 344 7.12 350 6.67 32,572 6.10 0 - 796 6.38September ................ 366 6.50 340 5.92 28,608 5.42 0 - 869 5.57
October ..................... 592 5.68 525 6.34 35,541 6.20 0 - 515 6.42November ................. 870 7.49 674 8.61 23,759 7.60 0 - 226 8.48December ................. 1,206 7.27 855 9.09 27,628 7.97 0 - 837 8.18
Total .......................... 8,761 6.39 7,357 7.06 363,350 6.41 0 - 17,257 6.44
See footnotes at end of table.
Energy Information Administration / Office of Oil and Gas, December 2005

Table SR6. U.S. Natural Gas Imports by Point of Entry, 2003-2004(Volumes in Million Cubic Feet; Average Prices in Dollars per Thousand Cubic Feet) —Continued
Yearand
Month
Canada (Pipeline) Mexico (Pipeline)
Northeast Total Texas
Waddington,NY Total
Volume AveragePrice
Alamo, TX El Paso, TX
Volume AveragePrice Volume Average
Price Volume AveragePrice Volume Average
Price
2003January ..................... 27,456 5.67 99,178 5.48 R336,055 4.90 0 - 0 - February ................... 24,893 6.58 87,352 6.69 R287,797 5.77 0 - 0 - March ........................ 30,694 8.10 87,690 8.63 R293,362 7.84 0 - 0 -
April .......................... 23,579 5.52 R77,376 5.46 R281,973 4.95 0 - 0 - May ........................... 21,538 5.62 R71,528 R5.51 R279,344 R5.08 0 - 0 - June .......................... 21,083 6.08 R64,975 5.99 R258,964 5.62 0 - 0 -
July ........................... 23,618 5.62 70,314 5.52 R282,729 5.08 0 - 0 - August ...................... 25,048 R5.10 72,393 5.05 R282,616 4.56 0 - 0 - September ................ 22,923 5.24 65,891 5.09 R266,841 4.69 0 - 0 -
October ..................... 24,650 4.86 70,979 4.86 R273,482 4.52 0 - 0 - November ................. 21,494 5.04 63,362 4.93 R269,978 4.54 0 - 0 - December ................. R30,015 5.67 R89,378 R5.67 R324,089 5.12 0 - 0 -
Total .......................... R296,989 5.81 R920,415 5.81 R3,437,230 5.23 0 - 0 - 2004
January ..................... 24,710 7.40 82,298 6.92 319,783 6.02 0 - 0 - February ................... 24,431 6.48 74,342 6.46 296,970 5.65 0 - 0 - March ........................ 25,999 5.70 74,060 5.64 299,959 5.13 0 - 0 -
April .......................... 21,759 5.82 68,662 5.77 279,043 5.20 0 - 0 - May ........................... 23,735 6.32 68,658 6.28 273,379 5.63 0 - 0 - June .......................... 24,985 6.75 73,706 6.71 284,744 6.05 0 - 0 -
July ........................... 25,922 6.41 77,534 6.32 299,561 5.76 0 - 0 - August ...................... 25,456 6.19 74,123 6.10 300,740 5.60 0 - 0 - September ................ 26,643 5.45 70,999 5.38 287,583 4.94 0 - 0 -
October ..................... 26,407 6.15 76,070 6.14 287,786 5.37 0 - 0 - November ................. 49,645 6.87 90,117 7.14 327,506 6.98 0 - 0 - December ................. 31,542 7.92 82,794 7.91 349,489 6.91 0 - 0 -
Total .......................... 331,234 6.51 913,365 6.44 3,606,543 5.81 0 - 0 -
See footnotes at end of table.
Energy Information Administration / Office of Oil and Gas, December 2005

Table SR6. U.S. Natural Gas Imports by Point of Entry, 2003-2004(Volumes in Million Cubic Feet; Average Prices in Dollars per Thousand Cubic Feet) —Continued
Yearand
Month
Mexico (Pipeline) LNG
Texas Total Midwest
Hidalgo, TX McAllen, TX Penitas, TX
Volume AveragePrice
Lake Charles, LA
Volume AveragePrice Volume Average
Price Volume AveragePrice Volume Average
Price
2003January ..................... 0 - 0 - 0 - 0 - 9,095 4.80February ................... 0 - 0 - 0 - 0 - 8,509 5.16March ........................ 0 - 0 - 0 - 0 - 16,667 6.25
April .......................... 0 - 0 - 0 - 0 - 19,991 5.65May ........................... 0 - 0 - 0 - 0 - 26,074 4.90June .......................... 0 - 0 - 0 - 0 - 24,535 5.05
July ........................... 0 - 0 - 0 - 0 - 32,027 5.68August ...................... 0 - 0 - 0 - 0 - 24,535 4.35September ................ 0 - 0 - 0 - 0 - 24,523 4.66
October ..................... 0 - 0 - 0 - 0 - 28,571 4.39November ................. 0 - 0 - 0 - 0 - 15,943 4.13December ................. 0 - 0 - 0 - 0 - 7,767 5.41
Total .......................... 0 - 0 - 0 - 0 - 238,237 5.002004
January ..................... 0 - 0 - 0 - 0 - 12,784 5.34February ................... 0 - 0 - 0 - 0 - 5,443 6.06March ........................ 0 - 0 - 0 - 0 - 13,529 5.85
April .......................... 0 - 0 - 0 - 0 - 8,342 5.18May ........................... 0 - 0 - 0 - 0 - 14,571 5.67June .......................... 0 - 0 - 0 - 0 - 20,353 5.90
July ........................... 0 - 0 - 0 - 0 - 34,536 5.44August ...................... 0 - 0 - 0 - 0 - 17,178 5.11September ................ 0 - 0 - 0 - 0 - 14,342 4.87
October ..................... 0 - 0 - 0 - 0 - 8,594 5.36November ................. 0 - 0 - 0 - 0 - 0 - December ................. 0 - 0 - 0 - 0 - 14,067 7.12
Total .......................... 0 - 0 - 0 - 0 - 163,738 5.61
See footnotes at end of table.
Energy Information Administration / Office of Oil and Gas, December 2005

Table SR6. U.S. Natural Gas Imports by Point of Entry, 2003-2004(Volumes in Million Cubic Feet; Average Prices in Dollars per Thousand Cubic Feet) —Continued
Yearand
Month
LNG Grand Total
Northeast Southeast Total
Volume AveragePrice
Cove Point, MD Everett, MA Elba Island, GA
Volume AveragePrice
Volume AveragePrice Volume Average
Price Volume AveragePrice
2003January ..................... 0 - 12,202 4.52 1,816 5.34 23,113 4.69 R359,168 R4.88February ................... 0 - 12,498 4.61 0 - 21,007 4.83 R308,804 5.71March ........................ 0 - 12,443 4.35 1,892 4.93 31,002 5.41 R324,364 7.61
April .......................... 0 - 10,018 5.03 2,673 4.97 32,682 5.40 R314,655 5.00May ........................... 0 - 14,119 4.41 5,621 5.26 45,814 4.79 R325,157 R5.04June .......................... 0 - 13,752 4.83 9,628 5.24 47,914 5.02 R306,878 5.53
July ........................... 1,890 4.29 13,904 4.44 9,982 5.28 57,803 5.27 R340,532 5.11August ...................... 3,011 4.33 14,366 4.44 7,101 4.54 49,012 4.40 R331,628 4.54September ................ 12,667 5.09 14,029 4.12 2,615 4.19 53,835 4.60 R320,676 4.67
October ..................... 14,654 4.54 14,298 3.92 0 - 57,523 4.31 R331,005 4.48November ................. 17,637 4.69 13,163 4.14 0 - 46,743 4.34 R316,721 4.51December ................. 16,219 4.62 13,487 4.29 2,599 6.40 40,072 4.78 R364,161 5.08
Total .......................... 66,078 4.69 158,277 4.41 43,927 5.12 506,519 4.79 R3,943,749 5.172004
January ..................... 16,233 6.45 16,593 4.92 7,803 6.42 53,413 5.71 373,195 5.98February ................... 19,818 5.95 15,843 5.35 7,855 6.02 48,959 5.78 345,930 5.67March ........................ 15,970 5.24 14,222 4.59 5,313 5.37 49,033 5.23 348,992 5.15
April .......................... 16,154 5.52 13,700 4.77 7,866 5.62 46,061 5.25 325,105 5.21May ........................... 16,386 5.88 14,306 4.98 7,899 6.18 53,162 5.62 326,541 5.63June .......................... 14,278 6.57 12,905 5.26 9,653 7.28 57,190 6.15 341,934 6.06
July ........................... 17,605 6.17 13,800 5.34 9,149 6.42 75,090 5.71 374,651 5.75August ...................... 18,387 6.05 13,409 5.40 10,530 6.32 59,504 5.68 360,244 5.62September ................ 20,128 5.28 12,367 4.66 10,201 5.32 57,038 5.05 344,621 4.96
October ..................... 13,576 5.52 15,217 4.94 10,361 6.04 47,748 5.42 335,533 5.38November ................. 17,491 7.65 15,857 5.70 7,831 7.97 41,179 6.96 368,685 6.98December ................. 23,268 7.70 15,561 5.83 10,742 8.12 63,638 7.18 413,128 6.96
Total .......................... 209,294 6.21 173,780 5.16 105,203 6.47 652,015 5.82 4,258,558 5.81
a EIA is reducing the reported volume of gas imported by pipelinefrom Canada by the amount of natural gas liquids removed from thesaturated natural gas carried by Alliance Pipeline. Alliance movessaturated natural gas from the border to a processing plant in Illinois. After the adjustment, volumes of imported natural gas on this pipelineare on the same physical basis as other reported volumes of pipelineimports.
- Not applicable.
R Revised data. Notes: Totals may not equal sum of components due to independentrounding. Geographic coverage is the continental United Statesincluding Alaska. Prices for LNG imports are reported as “landed,”defined as received at the terminal. Sources: Energy Information Administration based on data from theOffice of Fossil Energy, U.S. Department of Energy, Natural GasImports and Exports, and EIA estimates of dry natural gas imports.
Energy Information Administration / Office of Oil and Gas, December 2005

Energy Information Administration / Office of Oil and Gas, December 2005
Table SR7. Summary of U.S. Natural Gas Imports, 1978-2004 (Volumes in Million Cubic Feet; Average Prices in Dollars per Thousand Cubic Feet)
Pipeline Total Pipeline LNG
Canada Mexico Algeria Year And
Month Volume Average Price Volume Average Price
Volume Average Price Volume Average Price
1978 Total ................ 881,123 2.19 0 - 881,123 2.19 84,422 1.531979 Total ................ 1,000,775 2.61 0 - 1,000,775 2.61 252,608 2.031980 Total ................ 796,507 4.32 102,410 4.41 898,917 4.33 85,850 3.771981 Total ................ 762,107 4.83 105,013 5.01 867,120 4.85 36,824 5.541982 Total ................ 783,407 4.97 94,794 5.02 878,200 4.98 55,136 5.82 1983 Total ................ 711,923 4.49 75,361 4.70 787,284 4.51 131,124 6.411984 Total ................ 755,368 4.01 51,502 4.49 806,870 4.04 36,191 4.901985 Total ................ 926,056 3.17 0 - 926,056 3.17 23,659 4.601986 Total ................ 748,780 2.42 0 - 748,780 2.42 0 -1987 Total ................ 992,532 1.95 0 - 992,532 1.95 0 - 1988 Total ................ 1,276,322 1.83 0 - 1,276,322 1.83 17,490 2.711989 Total ................ 1,339,357 1.81 0 - 1,339,357 1.81 42,163 2.221990 Total ................ 1,448,065 1.91 0 - 1,448,065 1.91 84,193 2.471991 Total ................ 1,709,716 1.81 0 - 1,709,716 1.81 63,596 2.361992 Total ................ 2,094,387 1.84 0 - 2,094,387 1.84 43,116 2.54 1993 Total ................ 2,266,751 2.02 1,678 1.94 2,268,429 2.02 81,685 2.201994 Total ................ 2,566,049 1.86 7,013 1.99 2,572,377 1.86 50,778 2.281995 Total ................ 2,816,408 1.48 6,722 1.53 2,823,130 1.48 17,918 2.301996 Total ................ 2,883,277 1.96 13,862 2.25 2,897,138 1.96 35,325 2.701997 Total ................ 2,899,152 2.15 17,243 2.31 2,916,394 2.15 65,675 2.67 1998 Total ................ 3,052,073 1.95 14,532 2.03 3,066,605 1.95 68,567 2.511999 Total ................ 3,367,545 2.23 54,530 2.14 3,422,075 2.23 75,763 2.412000 Total ................ 3,543,966 3.97 11,601 5.43 3,555,567 3.98 46,947 3.482001 Total ................ 3,728,537 4.43 10,276 5.00 3,738,814 4.44 64,945 3.732002 Total ................ 3,784,978 3.13 1,755 2.36 3,786,733 3.13 26,584 3.61 2003 January.................. R336,055 4.90 0 - R341,867 4.90 0 - February ................ R287,797 5.77 0 - R293,076 R5.78 0 - March .................... R293,362 7.84 0 - R298,399 7.84 2,778 7.54
April ....................... R281,973 4.95 0 - R286,620 R4.96 10,893 5.93 May........................ R279,344 R5.08 0 - R284,135 R5.08 4,190 4.60 June....................... R258,964 5.62 0 - R264,280 5.62 2,788 5.36
July ........................ R282,729 5.08 0 - R287,603 5.08 5,462 6.47 August ................... R282,616 4.56 0 - R287,569 R4.57 2,768 4.47 September............. R266,841 4.69 0 - R271,666 4.69 8,191 4.99
October.................. R273,482 4.52 0 - R278,651 4.52 10,910 4.69 November.............. R269,978 4.54 0 - R275,152 4.54 2,784 4.24 December.............. R324,089 5.12 0 - R329,379 5.12 2,659 4.79 Total ...................... R3,437,230 5.23 0 - R3,498,395 5.23 53,423 5.32 2004 January.................. 319,783 6.02 0 - 319,783 6.02 7,223 5.53 February ................ 296,970 5.65 0 - 296,970 5.65 8,075 6.16 March .................... 299,959 5.13 0 - 299,959 5.13 10,909 5.96
April ....................... 279,043 5.20 0 - 279,043 5.20 7,998 5.31 May........................ 273,379 5.63 0 - 273,379 5.63 5,367 5.54 June....................... 284,744 6.05 0 - 284,744 6.05 15,559 5.79
July ........................ 299,561 5.76 0 - 299,561 5.76 10,803 5.66 August ................... 300,740 5.60 0 - 300,740 5.60 21,788 5.33 September............. 287,583 4.94 0 - 287,583 4.94 7,418 5.03
October.................. 287,786 5.37 0 - 287,786 5.37 8,407 5.36 November.............. 327,506 6.98 0 - 327,506 6.98 2,810 7.25 December.............. 349,489 6.91 0 - 349,489 6.91 13,986 7.40 Total ...................... 3,606,543 5.80 0 - 3,606,543 5.80 120,343 5.82
See footnotes at end of table.

Energy Information Administration / Office of Oil and Gas, December 2005
Table SR7. Summary of U.S. Natural Gas Imports, 1978-2004 (Volumes in Million Cubic Feet; Average Prices in Dollars per Thousand Cubic Feet) –
Continued
LNG
Australia Brunei Canada Indonesia Year And
Month Volume Average
Price Volume Average Price Volume Average
Price Volume Average Price
1978 Total.................. 0 - 0 - 0 - 0 - 1979 Total.................. 0 - 0 - 0 - 0 - 1980 Total.................. 0 - 0 - 0 - 0 - 1981 Total.................. 0 - 0 - 6 6.63 0 - 1982 Total.................. 0 - 0 - 0 - 0 - 1983 Total.................. 0 - 0 - 0 - 0 - 1984 Total.................. 0 - 0 - 0 - 0 - 1985 Total.................. 0 - 0 - 0 - 0 - 1986 Total.................. 0 - 0 - 0 - 1,669 4.62 1987 Total.................. 0 - 0 - 0 - 0 - 1988 Total.................. 0 - 0 - 0 - 0 - 1989 Total.................. 0 - 0 - 0 - 0 - 1990 Total.................. 0 - 0 - 0 - 0 - 1991 Total.................. 0 - 0 - 0 - 0 - 1992 Total.................. 0 - 0 - 0 - 0 - 1993 Total.................. 0 - 0 - 0 - 0 - 1994 Total.................. 0 - 0 - 0 - 0 - 1995 Total.................. 0 - 0 - 0 - 0 - 1996 Total.................. 0 - 0 - 0 - 0 - 1997 Total.................. 9,686 2.92 0 - 0 - 0 - 1998 Total.................. 11,634 3.30 0 - 0 - 0 - 1999 Total.................. 11,904 2.70 0 - 0 - 0 - 2000 Total.................. 5,945 3.25 0 - 0 - 2,760 3.99 2001 Total.................. 2,394 3.86 0 - 0 - 0 - 2002 Total.................. 0 - 2,401 3.25 0 - 0 - 2003 January ................... 0 - 0 - 0 - 0 - February.................. 0 - 0 - 0 - 0 - March ...................... 0 - 0 - 0 - 0 -
April ......................... 0 - 0 - 0 - 0 - May ......................... 0 - 0 - 0 - 0 - June ........................ 0 - 0 - 0 - 0 -
July.......................... 0 - 0 - 0 - 0 - August ..................... 0 - 0 - 0 - 0 - September............... 0 - 0 - 0 - 0 -
October ................... 0 - 0 - 0 - 0 - November................ 0 - 0 - 0 - 0 - December................ 0 - 0 - 0 - 0 - Total........................ 0 - 0 - 0 - 0 - 2004 January ................... 0 - 0 - 0 - 0 - February.................. 0 - 0 - 0 - 0 - March ...................... 0 - 0 - 0 - 0 -
April ......................... 0 - 0 - 0 - 0 - May ......................... 2,945 5.90 0 - 0 - 0 - June ........................ 2,918 6.64 0 - 0 - 0 -
July.......................... 5,984 6.08 0 - 0 - 0 - August ..................... 0 - 0 - 0 - 0 - September............... 0 - 0 - 0 - 0 -
October ................... 0 - 0 - 0 - 0 - November................ 0 - 0 - 0 - 0 - December................ 3,143 7.57 0 - 0 - 0 - Total........................ 14,990 6.47 0 - 0 - 0 -
See footnotes at end of table.
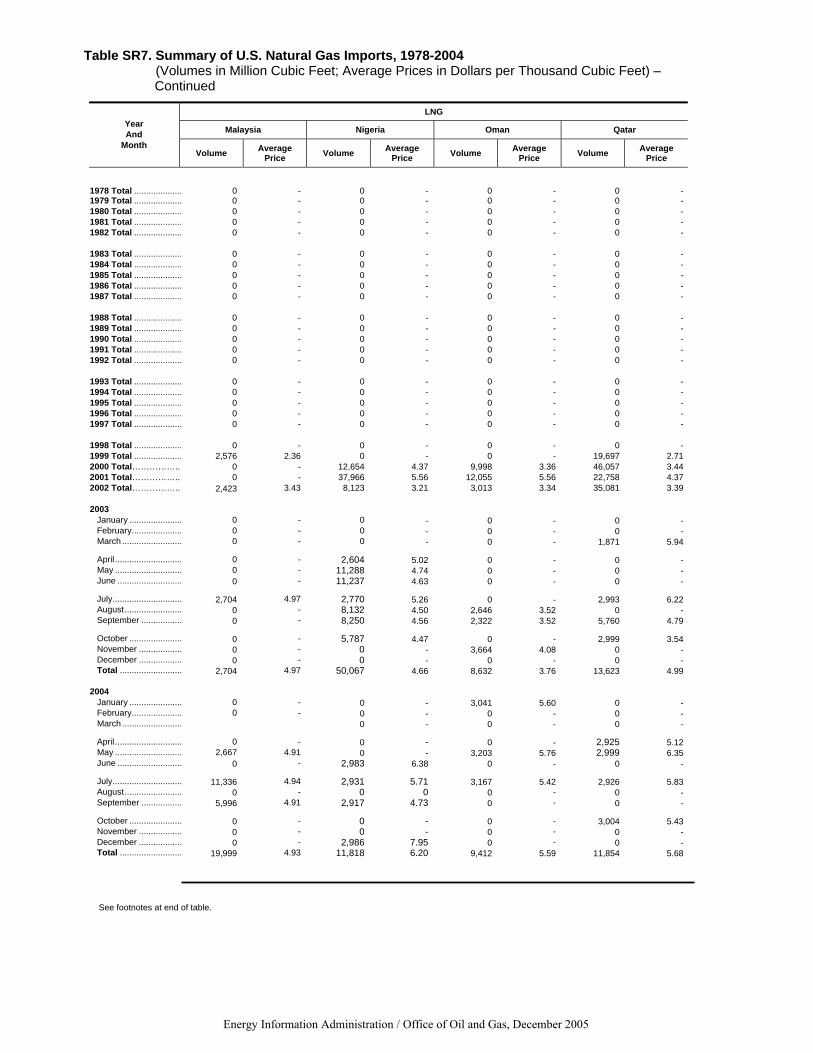
Energy Information Administration / Office of Oil and Gas, December 2005
Table SR7. Summary of U.S. Natural Gas Imports, 1978-2004 (Volumes in Million Cubic Feet; Average Prices in Dollars per Thousand Cubic Feet) –
Continued
LNG
Malaysia Nigeria Oman Qatar Year And
Month Volume Average
Price Volume Average Price Volume Average
Price Volume Average Price
1978 Total .................... 0 - 0 - 0 - 0 -1979 Total .................... 0 - 0 - 0 - 0 -1980 Total .................... 0 - 0 - 0 - 0 -1981 Total .................... 0 - 0 - 0 - 0 -1982 Total .................... 0 - 0 - 0 - 0 - 1983 Total .................... 0 - 0 - 0 - 0 -1984 Total .................... 0 - 0 - 0 - 0 -1985 Total .................... 0 - 0 - 0 - 0 -1986 Total .................... 0 - 0 - 0 - 0 -1987 Total .................... 0 - 0 - 0 - 0 - 1988 Total .................... 0 - 0 - 0 - 0 -1989 Total .................... 0 - 0 - 0 - 0 -1990 Total .................... 0 - 0 - 0 - 0 -1991 Total .................... 0 - 0 - 0 - 0 -1992 Total .................... 0 - 0 - 0 - 0 - 1993 Total .................... 0 - 0 - 0 - 0 -1994 Total .................... 0 - 0 - 0 - 0 -1995 Total .................... 0 - 0 - 0 - 0 -1996 Total .................... 0 - 0 - 0 - 0 -1997 Total .................... 0 - 0 - 0 - 0 - 1998 Total .................... 0 - 0 - 0 - 0 -1999 Total .................... 2,576 2.36 0 - 0 - 19,697 2.712000 Total…………….. 0 - 12,654 4.37 9,998 3.36 46,057 3.442001 Total…………….. 0 - 37,966 5.56 12,055 5.56 22,758 4.372002 Total…………….. 2,423 3.43 8,123 3.21 3,013 3.34 35,081 3.39 2003 January ...................... 0 - 0 - 0 - 0 - February..................... 0 - 0 - 0 - 0 - March ......................... 0 - 0 - 0 - 1,871 5.94
April ............................ 0 - 2,604 5.02 0 - 0 - May ............................ 0 - 11,288 4.74 0 - 0 - June ........................... 0 - 11,237 4.63 0 - 0 -
July............................. 2,704 4.97 2,770 5.26 0 - 2,993 6.22 August........................ 0 - 8,132 4.50 2,646 3.52 0 - September ................. 0 - 8,250 4.56 2,322 3.52 5,760 4.79
October ...................... 0 - 5,787 4.47 0 - 2,999 3.54 November .................. 0 - 0 - 3,664 4.08 0 - December .................. 0 - 0 - 0 - 0 - Total .......................... 2,704 4.97 50,067 4.66 8,632 3.76 13,623 4.99 2004 January ...................... 0 - 0 - 3,041 5.60 0 - February..................... 0 - 0 - 0 - 0 - March ......................... 0 - 0 - 0 -
April ............................ 0 - 0 - 0 - 2,925 5.12 May ............................ 2,667 4.91 0 - 3,203 5.76 2,999 6.35 June ........................... 0 - 2,983 6.38 0 - 0 -
July............................. 11,336 4.94 2,931 5.71 3,167 5.42 2,926 5.83 August........................ 0 - 0 0 0 - 0 - September ................. 5,996 4.91 2,917 4.73 0 - 0 -
October ...................... 0 - 0 - 0 - 3,004 5.43 November .................. 0 - 0 - 0 - 0 - December .................. 0 - 2,986 7.95 0 - 0 - Total .......................... 19,999 4.93 11,818 6.20 9,412 5.59 11,854 5.68
See footnotes at end of table.

Energy Information Administration / Office of Oil and Gas, December 2005
Table SR7. Summary of U.S. Natural Gas Imports, 1978-2004 (Volumes in Million Cubic Feet; Average Prices in Dollars per Thousand Cubic Feet) –
Continued
LNG Total LNG Grand Total
Trinidad/Tobago United Arab Emirates Othera Year And
Month Volume Average
Price Volume Average Price Volume Average
Price Volume Average
Price Volume Average Price
1978 Total................... 0 - 0 - 0 - 84,422 1.53 965,545 2.131979 Total................... 0 - 0 - 0 - 252,608 2.03 1,253,383 2.491980 Total................... 0 - 0 - 0 - 85,850 3.77 984,767 4.281981 Total................... 0 - 0 - 0 - 36,830 5.54 903,949 4.881982 Total................... 0 - 0 - 0 - 55,136 5.82 933,336 5.03 1983 Total................... 0 - 0 - 0 - 131,124 6.41 918,407 4.781984 Total................... 0 - 0 - 0 - 36,191 4.90 843,060 4.081985 Total................... 0 - 0 - 0 - 23,659 4.60 949,715 3.211986 Total................... 0 - 0 - 0 - 1,669 4.62 750,449 2.431987 Total................... 0 - 0 - 0 - 0 - 992,532 1.95 1988 Total................... 0 - 0 - 0 - 17,490 2.71 1,293,812 1.841989 Total................... 0 - 0 - 0 - 42,163 2.22 1,381,520 1.821990 Total................... 0 - 0 - 0 - 84,193 2.47 1,532,259 1.941991 Total................... 0 - 0 - 0 - 63,596 2.36 1,773,313 1.831992 Total................... 0 - 0 - 0 - 43,116 2.54 2,137,504 1.85 1993 Total................... 0 - 0 - 0 - 81,685 2.20 2,350,115 2.031994 Total................... 0 - 0 - 0 - 50,778 2.28 2,623,839 1.871995 Total................... 0 - 0 - 0 - 17,918 2.30 2,841,048 1.491996 Total................... 0 - 4,949 3.46 0 - 40,274 2.80 2,937,413 1.971997 Total................... 0 - 2,417 3.74 0 - 77,778 R2.74 2,994,173 2.17 1998 Total................... 0 - 5,252 2.63 0 - 85,453 2.63 3,152,058 1.971999 Total................... 50,777 2.39 2,713 3.03 0 - 163,430 2.47 3,585,505 2.242000 Total…………… 98,949 3.43 2,725 3.53 0 - 226,036 3.50 3,781,603 3.952001 Total…………… 98,009 4.14 0 - 0 - 238,126 4.35 3,976,939 4.432002 Total…………… 151,104 3.40 0 - 0 - 228,730 3.41 4,015,463 3.15 2003 January .................... 23,113 4.69 0 - 0 - 23,113 4.69 R359,168 4.89 February................... 21,007 4.83 0 - 0 - 21,007 4.83 R308,804 5.71 March ....................... 26,353 5.14 0 - 0 - 31,002 5.41 R324,364 7.61
April .......................... 19,184 5.16 0 - 0 - 32,682 5.40 R314,655 5.00 May .......................... 30,336 4.84 0 - 0 - 45,814 4.79 R325,157 R5.04 June ......................... 33,889 5.13 0 - 0 - 47,914 5.02 R306,878 5.53
July........................... 43,874 5.07 0 - 0 - 57,803 5.27 R340,532 5.11 August ...................... 35,466 4.44 0 - 0 - 49,012 4.40 R331,628 4.54 September................ 29,312 4.55 0 - 0 - 53,835 4.60 R320,676 4.67
October .................... 37,828 4.24 0 - 0 - 57,523 4.31 R331,005 4.48 November................. 40,295 4.38 0 - 0 - 46,743 4.34 R316,721 4.51 December................. 37,414 4.78 0 - 0 - 40,072 4.78 R364,161 5.08 Total......................... 378,069 4.74 0 - 0 - 506,519 4.79 R3,943,749 5.17 2004 January .................... 43,148 5.74 0 - 0 - 53,413 5.71 373,195 5.98 February................... 40,884 5.70 0 - 0 - 48,959 5.78 345,930 5.67 March ....................... 38,124 5.02 0 - 0 - 49,033 5.23 348,992 5.14
April .......................... 35,138 5.25 0 - 0 - 46,061 5.25 325,105 5.21 May .......................... 35,980 5.59 0 - 0 - 53,162 5.62 326,541 5.63 June ......................... 34,230 6.29 0 - 1,500 5.52 57,190 6.15 341,934 6.07
July........................... 37,942 5.92 0 - 0 - 75,090 5.71 374,651 5.75 August ...................... 37,716 5.88 0 - 0 - 59,504 5.68 360,244 5.61 September................ 40,708 5.10 0 - 0 - 57,038 5.05 344,621 4.96
October .................... 36,337 5.43 0 - 0 - 47,748 5.42 335,533 5.38 November................. 38,369 6.94 0 - 0 - 41,179 6.96 368,685 6.98 December................. 43,523 7.03 0 - 0 - 63,638 7.18 413,128 6.95
Total……………..… 462,100 5.84 0 - 1,500 5.52 652,015 5.82 4,258,558 5.81 a The point of origin for volumes of imported LNG was unassigned in the reports to the Office of Fossil Energy. R Revised data. - Not applicable. Notes: Totals may not equal sum of components due to independent rounding. Geographic coverage is the continental United States including Alaska. Prior to 2003, prices for LNG imports may be reported as either
“landed,” defined as received at the terminal or “tailgate,” defined as regasification at the terminal. For 2003 and 2004, all prices for LNG imports are reported as “landed.” Sources: 1978-1994: Energy Information Administration, Form FPC-14, "Annual Report for Importers and Exporters of Natural Gas." 1995 to present: Energy Information Administration based on data from the Office of Fossil Energy, U.S. Department of Energy, Natural Gas Imports and Exports.

Table SR8. U.S. Natural Gas Exports by Point of Exit, 2003-2004(Volumes in Million Cubic Feet; Average Prices in Dollars per Thousand Cubic Feet)
Yearand
Month
Canada (Pipeline)
Babb, MT Detroit, MI Eastport, ID Havre, MT Marysville,MI
Volume AveragePrice Volume Average
Price Volume AveragePrice Volume Average
Price Volume AveragePrice
2003January ..................... 0 - 1,204 5.11 15 4.34 664 4.57 0 - February ................... 38 6.48 1,090 5.79 0 - 615 3.87 0 - March ........................ 0 - 1,021 9.00 0 - 717 6.69 0 -
April .......................... 0 - 919 5.32 0 - 986 4.93 0 - May ........................... 0 - 1,018 5.66 0 - 936 4.93 0 - June .......................... 0 - 2,053 6.14 0 - 752 5.23 0 -
July ........................... 0 - 1,231 5.55 0 - 711 5.25 0 - August ...................... 0 - 578 4.82 0 - 833 4.25 0 - September ................ 0 - 1,407 5.11 0 - 633 4.55 0 -
October ..................... 0 - R1,076 4.85 0 - 629 4.33 0 - November ................. 0 - 4,169 4.89 0 - 545 4.20 509 4.86December ................. 0 - 3,971 5.21 0 - 829 4.44 302 5.39
Total ......................... 38 6.48 19,737 5.47 15 4.34 8,851 4.80 811 5.062004
January ..................... 88 5.19 4,750 6.48 48 5.36 1,580 5.39 305 6.52February ................... 555 5.03 4,812 6.12 0 - 1,655 5.20 285 6.24March ........................ 554 4.54 7,908 5.50 0 - 1,899 4.73 317 6.51
April .......................... 57 8.21 971 5.72 0 - 1,586 4.79 366 5.85May ........................... 110 4.79 2,430 6.21 0 - 1,688 4.97 302 6.82June .......................... 66 5.46 2,112 6.94 0 - 1,809 5.61 308 7.04
July ........................... 0 - 445 6.34 0 - 1,812 5.38 312 6.38August ...................... 0 - 447 6.33 0 - 1,788 5.34 304 6.57September ................ 0 - 1,801 5.15 0 - 2,670 5.43 302 5.36
October ..................... 0 - 3,853 6.04 0 - 1,765 4.63 326 6.10November ................. 0 - 5,408 7.77 0 - 1,835 6.05 555 7.94December ................. 0 - 5,094 7.79 0 - 1,864 6.18 774 8.05
Total ......................... 1,429 4.98 40,030 6.47 48 5.36 21,950 5.32 4,455 6.83
See footnotes at end of table.
Energy Information Administration / Office of Oil and Gas, December 2005
Table SR8. U.S. Natural Gas Exports by Point of Exit, 2003-2004(Volumes in Million Cubic Feet; Average Prices in Dollars per Thousand Cubic Feet) —Continued
Yearand
Month
Canada (Pipeline)
Niagara Falls,NY Noyes, MN Port of Morgan, MT Sault Ste. Marie, MI Sherwood, ND
Volume AveragePrice Volume Average
Price Volume AveragePrice Volume Average
Price Volume AveragePrice
2003January ..................... 311 6.90 0 - 0 - 0 - 0 - February ................... 199 6.62 0 - 0 - 0 - 0 - March ........................ 929 7.73 0 - 0 - 0 - 0 -
April .......................... 776 5.62 0 - 0 - 0 - 0 - May ........................... 0 - 0 - 0 - 0 - 0 - June .......................... 0 - 0 - 0 - 0 - 0 -
July ........................... 0 - * 4.90 0 - 0 - 20 5.47August ...................... 0 - 5 5.14 0 - 0 - 19 4.85September ................ 0 - 0 - 0 - 0 - 17 5.13
October ..................... 0 - 167 5.44 0 - 0 - 11 4.52November ................. 0 - 0 - 0 - 297 4.83 0 - December ................. 0 - 0 - 0 - 307 5.04 0 -
Total ......................... 2,215 6.77 172 5.43 0 - 605 4.94 66 5.052004
January ..................... 3 6.99 926 6.20 0 - 652 6.35 0 - February ................... 0 - 632 5.76 0 - 800 6.16 0 - March ........................ 0 - 634 5.16 0 - 590 5.51 0 -
April .......................... 0 - 0 - 0 - 519 5.63 0 - May ........................... 0 - 0 - 0 - 465 5.80 0 - June .......................... 0 - 0 - 0 - 513 6.91 0 -
July ........................... 0 - 0 - 0 - 652 6.23 0 - August ...................... 0 - 0 - 0 - 520 6.26 0 - September ................ 0 - 0 - 0 - 387 6.22 0 -
October ..................... 0 - 0 - 0 - 588 5.83 0 - November ................. 0 - 0 - 0 - 472 8.00 0 - December ................. 0 - 0 - 0 - 508 8.10 0 -
Total ......................... 3 6.99 2,193 5.77 0 - 6,666 6.38 0 -
See footnotes at end of table.
Energy Information Administration / Office of Oil and Gas, December 2005

Table SR8. U.S. Natural Gas Exports by Point of Exit, 2003-2004(Volumes in Million Cubic Feet; Average Prices in Dollars per Thousand Cubic Feet) —Continued
Yearand
Month
Canada (Pipeline)
St Clair, MI Sumas, WA Waddington,NY Warroad, MN Total
Volume AveragePrice Volume Average
Price Volume AveragePrice Volume Average
Price Volume AveragePrice
2003January ..................... R22,526 R6.68 0 - 0 - 0 - R24,719 R6.54February ................... R23,603 R7.76 0 - 0 - 0 - R25,546 R7.58March ........................ R26,178 R9.44 8 4.80 0 - 0 - R28,854 R9.30
April .......................... R19,980 R5.51 0 - 0 - 0 - R22,661 R5.48May ........................... R13,205 R5.59 0 - 0 - 0 - R15,159 R5.55June .......................... R14,679 R6.21 0 - 0 - 0 - R17,484 R6.16
July ........................... R11,467 5.65 0 - 0 - 0 - R13,429 R5.62August ...................... R12,757 R4.92 10 4.00 0 - 0 - R14,203 R4.88September ................ R16,599 5.23 0 - 0 - 0 - R18,657 R5.20
October ..................... R18,339 4.81 15 4.16 0 - 0 - R20,236 R4.80November ................. R26,693 4.93 0 - 0 - 0 - R32,214 R4.91December ................. 32,417 5.28 0 - 0 - 0 - R37,826 R5.25
Total ......................... R238,444 6.13 33 4.27 0 - 0 - R270,988 R6.032004
January ..................... 22,688 6.53 15 4.16 0 - 0 - 31,054 6.44February ................... 29,079 6.20 0 - 0 - 0 - 37,817 6.12March ........................ 43,800 5.56 0 - 0 - 0 - 55,703 5.51
April .......................... 29,222 5.79 0 - 0 - 0 - 32,720 5.74May ........................... 21,988 6.30 0 - 0 - 0 - 26,984 6.20June .......................... 19,615 6.99 0 - 0 - 0 - 24,424 6.88
July ........................... 20,003 6.53 0 - 0 - 0 - 23,224 6.42August ...................... 19,516 6.34 0 - 0 - 0 - 22,575 6.26September ................ 24,521 6.22 0 - 0 - 0 - 29,681 6.07
October ..................... 15,296 6.08 0 - 0 - 0 - 21,827 5.95November ................. 37,533 7.87 0 - 0 - 0 - 45,803 7.79December ................. 34,534 7.91 0 - 0 - 0 - 42,774 7.83
Total ......................... 317,797 6.56 15 4.16 0 - 0 - 394,585 6.47
See footnotes at end of table.
Energy Information Administration / Office of Oil and Gas, December 2005
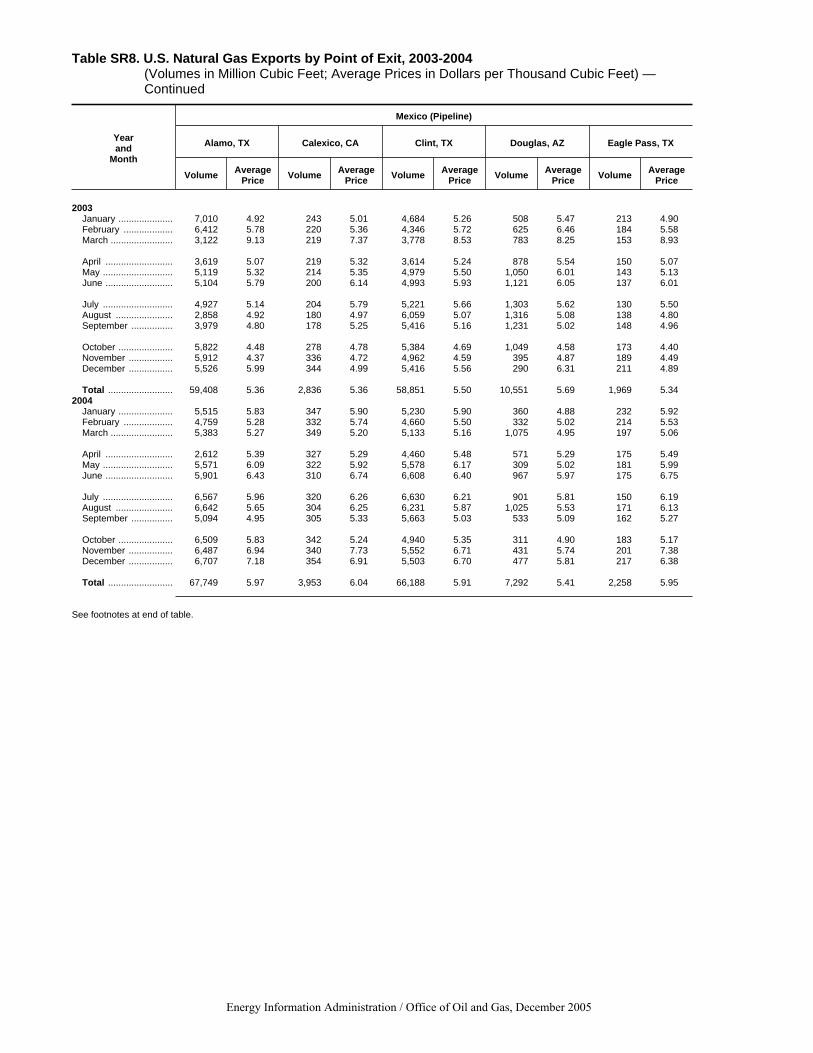
Table SR8. U.S. Natural Gas Exports by Point of Exit, 2003-2004(Volumes in Million Cubic Feet; Average Prices in Dollars per Thousand Cubic Feet) —Continued
Yearand
Month
Mexico (Pipeline)
Alamo, TX Calexico, CA Clint, TX Douglas, AZ Eagle Pass, TX
Volume AveragePrice Volume Average
Price Volume AveragePrice Volume Average
Price Volume AveragePrice
2003January ..................... 7,010 4.92 243 5.01 4,684 5.26 508 5.47 213 4.90February ................... 6,412 5.78 220 5.36 4,346 5.72 625 6.46 184 5.58March ........................ 3,122 9.13 219 7.37 3,778 8.53 783 8.25 153 8.93
April .......................... 3,619 5.07 219 5.32 3,614 5.24 878 5.54 150 5.07May ........................... 5,119 5.32 214 5.35 4,979 5.50 1,050 6.01 143 5.13June .......................... 5,104 5.79 200 6.14 4,993 5.93 1,121 6.05 137 6.01
July ........................... 4,927 5.14 204 5.79 5,221 5.66 1,303 5.62 130 5.50August ...................... 2,858 4.92 180 4.97 6,059 5.07 1,316 5.08 138 4.80September ................ 3,979 4.80 178 5.25 5,416 5.16 1,231 5.02 148 4.96
October ..................... 5,822 4.48 278 4.78 5,384 4.69 1,049 4.58 173 4.40November ................. 5,912 4.37 336 4.72 4,962 4.59 395 4.87 189 4.49December ................. 5,526 5.99 344 4.99 5,416 5.56 290 6.31 211 4.89
Total ......................... 59,408 5.36 2,836 5.36 58,851 5.50 10,551 5.69 1,969 5.342004
January ..................... 5,515 5.83 347 5.90 5,230 5.90 360 4.88 232 5.92February ................... 4,759 5.28 332 5.74 4,660 5.50 332 5.02 214 5.53March ........................ 5,383 5.27 349 5.20 5,133 5.16 1,075 4.95 197 5.06
April .......................... 2,612 5.39 327 5.29 4,460 5.48 571 5.29 175 5.49May ........................... 5,571 6.09 322 5.92 5,578 6.17 309 5.02 181 5.99June .......................... 5,901 6.43 310 6.74 6,608 6.40 967 5.97 175 6.75
July ........................... 6,567 5.96 320 6.26 6,630 6.21 901 5.81 150 6.19August ...................... 6,642 5.65 304 6.25 6,231 5.87 1,025 5.53 171 6.13September ................ 5,094 4.95 305 5.33 5,663 5.03 533 5.09 162 5.27
October ..................... 6,509 5.83 342 5.24 4,940 5.35 311 4.90 183 5.17November ................. 6,487 6.94 340 7.73 5,552 6.71 431 5.74 201 7.38December ................. 6,707 7.18 354 6.91 5,503 6.70 477 5.81 217 6.38
Total ......................... 67,749 5.97 3,953 6.04 66,188 5.91 7,292 5.41 2,258 5.95
See footnotes at end of table.
Energy Information Administration / Office of Oil and Gas, December 2005

Table SR8. U.S. Natural Gas Exports by Point of Exit, 2003-2004(Volumes in Million Cubic Feet; Average Prices in Dollars per Thousand Cubic Feet) —Continued
Yearand
Month
Mexico (Pipeline)
El Paso, TX Hidalgo, TX McAllen, TX Ogilby, CA Otay Mesa, CA
Volume AveragePrice Volume Average
Price Volume AveragePrice Volume Average
Price Volume AveragePrice
2003January ..................... 1,088 4.94 2,140 5.03 7,434 4.87 R4,091 R5.13 0 - February ................... 896 5.87 1,671 5.73 6,790 5.74 R3,488 5.62 0 - March ........................ 699 8.14 520 9.39 4,460 8.97 R2,388 R6.94 0 -
April .......................... 583 5.02 3,891 5.14 0 - R1,960 R5.27 0 - May ........................... 262 5.17 5,642 5.54 0 - R2,218 R6.00 0 - June .......................... 471 5.83 6,950 5.84 0 - R2,852 R5.90 0 -
July ........................... 484 5.41 295 5.04 5,275 5.18 R3,325 R5.32 0 - August ...................... 406 4.80 0 - 5,467 4.77 R6,896 R5.29 0 - September ................ 442 4.97 58 4.53 4,239 4.74 R5,607 R4.88 0 -
October ..................... 1,837 4.39 0 - 5,246 4.51 R7,304 4.74 0 - November ................. 1,882 4.26 210 4.65 6,248 4.47 R5,141 R4.54 0 - December ................. 2,403 5.57 120 6.19 5,723 5.64 R5,527 R5.36 0 -
Total ......................... 11,453 5.20 21,497 5.61 50,884 5.36 R50,797 5.25 0 - 2004
January ..................... 1,170 5.84 125 6.75 5,150 5.89 5,557 5.75 0 - February ................... 1,035 5.35 0 - 4,585 5.37 4,372 5.25 0 - March ........................ 726 5.10 30 5.38 5,045 5.34 4,927 5.10 0 -
April .......................... 572 5.21 0 - 2,485 5.64 5,324 5.39 0 - May ........................... 527 5.66 51 6.73 4,837 6.16 6,286 5.96 0 - June .......................... 460 6.53 86 6.52 5,454 6.48 6,770 6.19 0 -
July ........................... 441 6.19 15 6.04 6,042 5.99 8,506 6.00 0 - August ...................... 482 5.92 0 - 5,736 5.78 8,443 5.75 0 - September ................ 471 5.01 488 5.47 6,132 5.09 7,295 4.87 0 -
October ..................... 457 4.95 0 - 5,671 5.81 5,700 5.34 0 - November ................. 958 6.29 0 - 5,368 6.94 5,833 6.45 0 - December ................. 1,165 6.43 0 - 4,296 6.55 6,937 6.67 0 -
Total ......................... 8,462 5.76 795 5.87 60,801 5.92 75,950 5.76 0 -
See footnotes at end of table.
Energy Information Administration / Office of Oil and Gas, December 2005
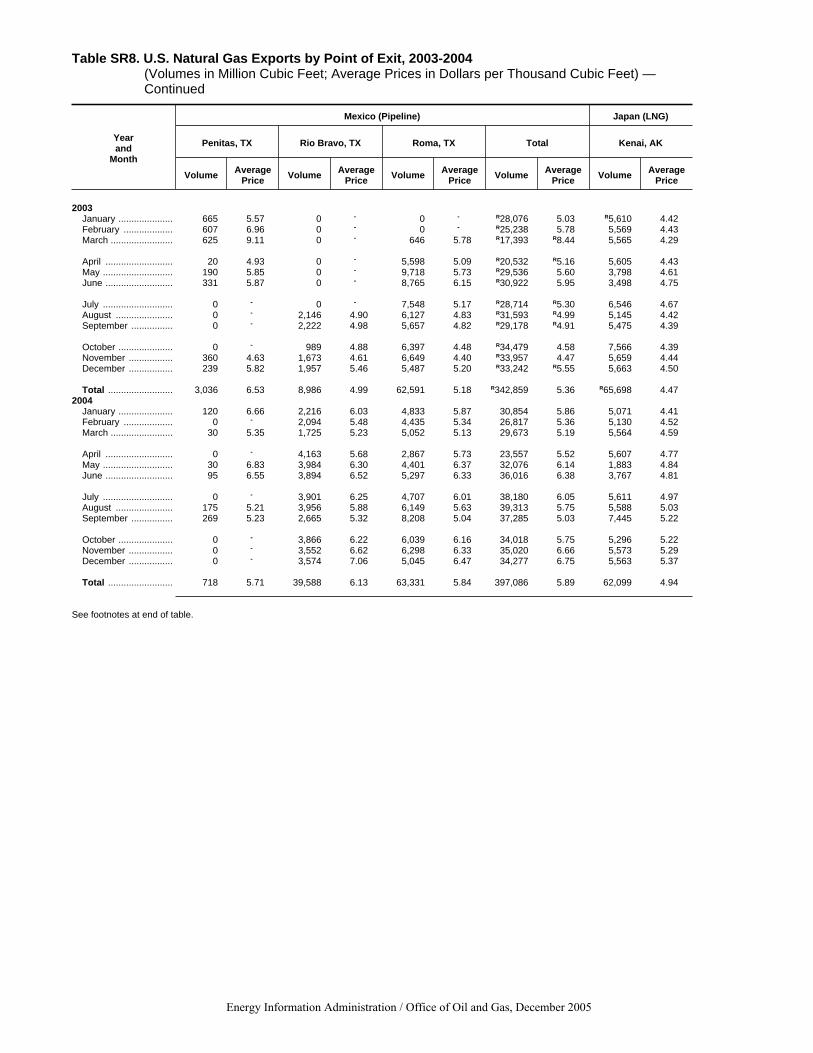
Table SR8. U.S. Natural Gas Exports by Point of Exit, 2003-2004(Volumes in Million Cubic Feet; Average Prices in Dollars per Thousand Cubic Feet) —Continued
Yearand
Month
Mexico (Pipeline) Japan (LNG)
Penitas, TX Rio Bravo, TX Roma, TX Total Kenai, AK
Volume AveragePrice Volume Average
Price Volume AveragePrice Volume Average
Price Volume AveragePrice
2003January ..................... 665 5.57 0 - 0 - R28,076 5.03 R5,610 4.42February ................... 607 6.96 0 - 0 - R25,238 5.78 5,569 4.43March ........................ 625 9.11 0 - 646 5.78 R17,393 R8.44 5,565 4.29
April .......................... 20 4.93 0 - 5,598 5.09 R20,532 R5.16 5,605 4.43May ........................... 190 5.85 0 - 9,718 5.73 R29,536 5.60 3,798 4.61June .......................... 331 5.87 0 - 8,765 6.15 R30,922 5.95 3,498 4.75
July ........................... 0 - 0 - 7,548 5.17 R28,714 R5.30 6,546 4.67August ...................... 0 - 2,146 4.90 6,127 4.83 R31,593 R4.99 5,145 4.42September ................ 0 - 2,222 4.98 5,657 4.82 R29,178 R4.91 5,475 4.39
October ..................... 0 - 989 4.88 6,397 4.48 R34,479 4.58 7,566 4.39November ................. 360 4.63 1,673 4.61 6,649 4.40 R33,957 4.47 5,659 4.44December ................. 239 5.82 1,957 5.46 5,487 5.20 R33,242 R5.55 5,663 4.50
Total ......................... 3,036 6.53 8,986 4.99 62,591 5.18 R342,859 5.36 R65,698 4.472004
January ..................... 120 6.66 2,216 6.03 4,833 5.87 30,854 5.86 5,071 4.41February ................... 0 - 2,094 5.48 4,435 5.34 26,817 5.36 5,130 4.52March ........................ 30 5.35 1,725 5.23 5,052 5.13 29,673 5.19 5,564 4.59
April .......................... 0 - 4,163 5.68 2,867 5.73 23,557 5.52 5,607 4.77May ........................... 30 6.83 3,984 6.30 4,401 6.37 32,076 6.14 1,883 4.84June .......................... 95 6.55 3,894 6.52 5,297 6.33 36,016 6.38 3,767 4.81
July ........................... 0 - 3,901 6.25 4,707 6.01 38,180 6.05 5,611 4.97August ...................... 175 5.21 3,956 5.88 6,149 5.63 39,313 5.75 5,588 5.03September ................ 269 5.23 2,665 5.32 8,208 5.04 37,285 5.03 7,445 5.22
October ..................... 0 - 3,866 6.22 6,039 6.16 34,018 5.75 5,296 5.22November ................. 0 - 3,552 6.62 6,298 6.33 35,020 6.66 5,573 5.29December ................. 0 - 3,574 7.06 5,045 6.47 34,277 6.75 5,563 5.37
Total ......................... 718 5.71 39,588 6.13 63,331 5.84 397,086 5.89 62,099 4.94
See footnotes at end of table.
Energy Information Administration / Office of Oil and Gas, December 2005

Table SR8. U.S. Natural Gas Exports by Point of Exit, 2003-2004(Volumes in Million Cubic Feet; Average Prices in Dollars per Thousand Cubic Feet) —Continued
Yearand
Month
Japan (LNG) Mexico (LNG) Grand Total
Port Nikiski, AK Nogales, AZ Otay Mesa, CA San Diego, CA
Volume AveragePrice
Volume AveragePrice Volume Average
Price Volume AveragePrice Volume Average
Price
2003January ..................... 0 - 36 5.82 9 5.82 0 - R58,449 5.61February ................... 0 - 32 5.82 8 5.82 0 - R56,393 R6.46March ........................ 0 - 32 5.82 7 5.82 0 - R51,851 R8.47
April .......................... 0 - 25 5.82 8 5.82 0 - R48,831 R5.22May ........................... 0 - 20 5.82 7 5.82 0 - R48,519 R5.51June .......................... 0 - 12 5.82 7 5.82 0 - R51,924 R5.94
July ........................... 0 - 10 5.82 7 5.82 0 - R48,707 R5.31August ...................... 0 - 12 5.82 8 5.82 0 - R50,962 4.90September ................ 0 - 20 5.82 8 5.82 0 - R53,337 R4.95
October ..................... 0 - 26 5.82 7 5.82 0 - R62,314 4.63November ................. 0 - 31 5.82 6 5.82 0 - R71,867 4.67December ................. 0 - 32 5.82 6 5.82 0 - R76,769 R5.32
Total ......................... 0 - 289 5.82 88 5.82 0 - R679,922 R5.542004
January ..................... 0 - 38 5.82 7 5.82 0 - 67,024 6.02February ................... 0 - 34 5.82 7 5.82 0 - 69,805 5.71March ........................ 0 - 24 5.82 18 5.82 0 - 90,982 5.35
April .......................... 0 - 25 8.19 7 8.19 0 - 61,916 5.57May ........................... 0 - 19 8.26 7 8.26 0 - 60,968 6.12June .......................... 0 - 13 8.47 8 8.47 0 - 64,227 6.48
July ........................... 0 - 7 10.62 8 10.62 0 - 67,031 6.09August ...................... 0 - 6 10.64 9 10.64 0 - 67,491 5.86September ................ 0 - 9 9.85 19 9.85 0 - 74,439 5.47
October ..................... 0 - 23 8.63 9 6.48 0 - 61,174 5.77November ................. 0 - 25 10.05 9 13.63 0 - 86,431 7.17December ................. 0 - 28 9.80 8 12.82 0 - 82,649 7.22
Total ......................... 0 - 252 7.90 116 8.82 0 - 854,138 6.09
- Not applicable. including Alaska.R Revised data.
* Less than 500,000 cubic feet. Notes: Totals may not equal sum of components due to independent rounding. Geographic coverage is the continental United States
Sources: Energy Information Administration based on data from the Office of Fossil Energy, U.S. Department of Energy, Natural Gas Imports and Exports.
Energy Information Administration / Office of Oil and Gas, December 2005

Energy Information Administration / Office of Oil and Gas, December 2005
Table SR9. Summary of U.S. Natural Gas Exports, 1978-2004 (Volumes in Million Cubic Feet; Average Prices in Dollars per Thousand Cubic Feet)
Pipeline Total Pipeline
Canada Mexico Year and
Month Volume Average Price Volume Average Price
Volume Average Price
1978 Total.............. 66 1.79 4,033 1.65 4,098 1.661979 Total.............. 76 2.04 4,308 1.97 4,384 1.971980 Total.............. 113 3.31 3,886 2.47 3,999 2.501981 Total.............. 106 4.79 3,337 3.37 3,443 3.411982 Total.............. 162 4.95 1,705 5.17 1,867 5.15 1983 Total.............. 136 4.60 1,646 4.79 1,782 4.781984 Total.............. 127 4.19 1,786 4.48 1,913 4.461985 Total.............. 178 3.06 2,207 3.99 2,385 3.921986 Total.............. 9,203 2.12 1,896 3.49 11,099 2.351987 Total.............. 3,297 1.81 2,125 3.18 5,421 2.35 1988 Total.............. 19,738 2.02 2,327 3.21 22,065 2.141989 Total.............. 38,443 2.00 17,004 2.14 55,447 2.051990 Total.............. 17,359 2.70 15,659 1.88 33,018 2.311991 Total.............. 14,791 1.91 60,448 1.76 75,239 1.791992 Total.............. 67,777 1.83 95,973 1.90 163,750 1.88 1993 Total.............. 44,518 2.14 39,676 2.02 84,195 2.081994 Total.............. 52,556 2.42 46,500 1.68 99,057 2.081995 Total.............. 27,554 1.96 61,283 1.50 88,836 1.641996 Total.............. 51,905 2.67 33,840 2.11 85,745 2.451997 Total.............. 56,447 2.52 38,372 2.46 94,818 2.49 1998 Total.............. 39,891 2.25 53,133 2.04 93,023 2.131999 Total.............. 38,508 2.35 61,025 2.27 99,533 2.302000 Total……….. 72,586 3.66 105,102 4.26 177,688 R4.022001 Total……….. 166,690 3.97 140,370 4.34 307,060 4.142002 Total……….. 189,313 3.35 263,078 3.30 452,391 3.32 2003 January ............... R24,719 R6.54 R28,076 5.03 R52,795 R5.74 February.............. R25,546 R7.58 R25,238 5.78 R50,784 R6.68 March .................. R28,854 R9.30 R17,393 R8.44 R46,247 R8.97 April ..................... R22,661 R5.48 R20,532 R5.16 R43,194 R5.33 May ..................... R15,159 R5.55 R29,536 5.60 R44,695 R5.59 June .................... R17,484 R6.16 R30,922 5.95 R48,406 R6.03 July...................... R13,429 R5.62 R28,714 R5.30 R42,143 R5.40 August ................. R14,203 R4.88 R31,593 R4.99 R45,796 R4.95 September........... R18,657 R5.20 R29,178 R4.91 R47,834 R5.02 October ............... R20,236 R4.80 R34,479 4.58 R54,715 4.67 November............ R32,214 R4.91 R33,957 4.47 R66,171 4.69 December............ R37,826 R5.25 R33,242 R5.55 R71,068 5.39 Total.................... R270,988 R6.03 R342,859 5.36 R613,848 R5.66 2004 January ............... 31,054 6.44 30,854 5.86 61,908 6.15 February.............. 37,817 6.12 26,817 5.36 64,634 5.81 March .................. 55,703 5.51 29,673 5.19 85,376 5.40 April ..................... 32,720 5.74 23,557 5.52 56,277 5.65 May ..................... 26,984 6.20 32,076 6.14 59,059 6.16 June .................... 24,424 6.88 36,016 6.38 60,439 6.58 July...................... 23,224 6.42 38,180 6.05 61,405 6.19 August ................. 22,575 6.26 39,313 5.75 61,887 5.94 September........... 29,681 6.07 37,285 5.03 66,966 5.49 October ............... 21,827 5.95 34,018 5.75 55,845 5.83 November............ 45,803 7.79 35,020 6.66 80,824 7.30 December............ 42,774 7.83 34,277 6.75 77,051 7.35 Total.................... 394,585 6.47 397,086 5.89 791,671 6.18
See footnotes at end of table.

Energy Information Administration / Office of Oil and Gas, December 2005
Table SR9. Summary of U.S. Natural Gas Exports, 1978-2004
(Volumes in Million Cubic Feet; Average Prices in Dollars per Thousand Cubic Feet) — Continued
1978 Total........................ 48,434 2.17 0 - 48,434 2.17 52,532 2.131979 Total........................ 51,289 2.32 0 - 51,289 2.32 55,673 2.291980 Total........................ 44,732 4.90 0 - 44,732 4.90 48,731 4.701981 Total........................ 55,929 6.05 0 - 55,929 6.05 59,372 5.901982 Total........................ 49,861 5.83 0 - 49,861 5.83 51,728 5.81 1983 Total........................ 52,857 5.11 0 - 52,857 5.11 54,639 5.101984 Total........................ 52,840 4.93 0 - 52,840 4.93 54,753 4.921985 Total........................ 52,883 4.81 0 - 52,883 4.81 55,268 4.771986 Total........................ 50,172 2.91 0 - 50,172 2.91 61,271 2.811987 Total........................ 48,599 3.15 0 - 48,599 3.15 54,020 3.07 1988 Total........................ 51,573 2.99 0 - 51,573 2.99 73,638 2.741989 Total........................ 51,424 3.01 0 - 51,424 3.01 106,871 2.511990 Total........................ 52,546 3.59 0 - 52,546 3.59 85,565 3.101991 Total........................ 54,005 3.71 0 - 54,005 3.71 129,244 2.591992 Total........................ 52,532 3.43 0 - 52,532 3.43 216,282 2.25 1993 Total........................ 55,989 3.34 0 - 55,989 3.34 140,183 2.591994 Total........................ 62,682 3.18 0 - 62,682 3.18 161,738 2.501995 Total........................ 65,283 3.41 0 - 65,283 3.41 154,119 2.391996 Total........................ 67,648 3.65 0 - 67,648 3.65 153,393 2.971997 Total........................ 62,187 3.83 0 - 62,187 3.83 157,006 3.02 1998 Total........................ 65,951 2.91 33 5.69 65,984 2.91 159,007 2.451999 Total........................ 63,607 3.08 275 6.95 63,882 3.10 163,415 2.612000 Total........................ 65,610 4.31 418 5.82 66,028 4.32 243,716 4.102001 Total........................ 65,753 4.39 465 5.82 66,218 4.40 373,278 4.192002 Total........................ 63,439 4.07 403 5.82 63,842 4.08 516,233 3.41 2003 January ......................... R5,610 4.42 44 5.82 R5,654 4.43 R58,449 5.61 February........................ 5,569 4.43 40 5.82 5,609 4.44 R56,393 R6.46 March ............................ 5,565 4.29 40 5.82 5,604 4.30 R51,851 R8.47 April ............................... 5,605 4.43 33 5.82 5,637 4.44 R48,831 R5.22 May ............................... 3,798 4.61 27 5.82 3,825 4.62 R48,519 R5.51 June .............................. 3,498 4.75 19 5.82 3,518 4.76 R51,924 R5.94 July................................ 6,546 4.67 18 5.82 6,564 4.67 R48,707 R5.31 August ........................... 5,145 4.42 21 5.82 5,166 4.43 R50,962 4.90 September..................... 5,475 4.39 28 5.82 5,503 4.40 R53,337 R4.95 October ......................... 7,566 4.39 32 5.82 7,598 4.40 R62,314 4.63 November...................... 5,659 4.44 37 5.82 5,696 4.45 R71,867 4.67 December...................... 5,663 4.50 38 5.82 5,701 4.51 R76,769 R5.32 Total.............................. R65,698 4.47 376 5.82 R66,075 R4.47 R679,922 R5.54 2004 January ......................... 5,071 4.41 45 5.82 5,116 4.42 67,024 6.02 February........................ 5,130 4.52 41 5.82 5,171 4.53 69,805 5.71 March ............................ 5,564 4.59 42 5.82 5,606 4.60 90,982 5.35 April ............................... 5,607 4.77 32 8.19 5,639 4.79 61,916 5.57 May ............................... 1,883 4.84 26 8.26 1,909 4.89 60,968 6.12 June .............................. 3,767 4.81 21 8.47 3,788 4.83 64,227 6.48 July................................ 5,611 4.97 15 10.62 5,627 4.98 67,031 6.09 August ........................... 5,588 5.03 15 10.64 5,604 5.05 67,491 5.86 September..................... 7,445 5.22 28 9.85 7,474 5.24 74,439 5.47 October ......................... 5,296 5.22 33 8.01 5,329 5.24 61,174 5.77 November...................... 5,573 5.29 34 10.97 5,607 5.32 86,431 7.17 December...................... 5,563 5.37 36 10.48 5,599 5.40 82,649 7.22
Total.............................. 62,099 4.94 368 8.19 62,467 4.96 854,138 6.09
LNG Total LNG Grand Total
Japan Mexico Year and
Month Volume Average
Price Volume Average Price
Volume Average Price Volume Average
Price
- Not applicable. R Revised data.
Notes: Totals may not equal sum of components due to independent rounding. Geographic coverage is the continental United States including Alaska. LNG exports to Mexico are shipped by truck.
Sources: 1978-1994: Energy Information Administration, Form FPC-14, "Annual Report for Importers and Exporters of Natural Gas." 1995 to present: Energy Information Administration based on data from the Office of Fossil Energy, U.S. Department of Energy, Natural Gas Imports and Exports.