How to Present more Readable Text for People with Dyslexia
21
Universal Access in the Information Society manuscript No. (will be inserted by the editor) How to Present more Readable Text for People with Dyslexia Luz Rello · Ricardo Baeza-Yates Received: date / Accepted: date Abstract The presentation of a text has a significant effect on the reading speed of people with dyslexia. This paper presents a set of recommendations to customize texts on a computer screen in a more accessible way for this target group. This set is based in an eye track- ing study with 92 people, 46 with dyslexia and 46 as control group, where the reading performance of the participants was measured. The following parameters were studied: color combinations for the font and the screen background, font size, column width as well as character, line and paragraph spacing. It was found that larger text and larger character spacing lead the partic- ipants with and without dyslexia to read significantly faster. The study is complemented with questionnaires to obtain the participants preferences for each of these parameters, finding other significant effects. These re- sults provide evidence that people with dyslexia may benefit from specific text presentation parameters that make text on a screen more readable. So far, these rec- ommendations based on eye tracking data are the most complete for people with dyslexia. Keywords Dyslexia · eye tracking · textual acces- sibility · text customization · recommendations · Luz Rello Human-Computer Interaction Institute Carnegie Mellon University, USA E-mail: [email protected] (this research was conducted while the first author was doing her PhD at the Web Research Group, Universitat Pompeu Fabra, Barcelona) Ricardo Baeza-Yates Yahoo Labs, Sunnyvale, CA, USA & Web Research Group Universitat Pompeu Fabra, Barcelona E-mail: [email protected] readability · text color · background color · font size · character, line and paragraph spacings · column width. 1 Introduction Dyslexia is a neurological reading disability which is characterized by difficulties with accurate and/or flu- ent word recognition and by poor spelling and decoding abilities. Secondary consequences may include problems in reading comprehension and reduced reading experi- ence that can impede growth of vocabulary and back- ground knowledge [43]. Since a great amount of infor- mation is presented as text, this condition makes more difficult for people with dyslexia to access written in- formation. At the same time, access to information and communication technologies is recognized as a basic hu- man right by United Nations [102]. Related to its social relevance, there are two reasons motivating the decision to approach textual accessibil- ity for users with dyslexia: first, they are a relatively large group of users, since dyslexia is frequent and uni- versal, and second, this kind of accessibility practices are not only good for people with dyslexia but also for other target groups. Frequent and universal. There is a universal neuro- cognitive basis for dyslexia [65] but its manifestations are variable due to different orthographies [35]. Depend- ing on the language, the estimations of dyslexia varies. The Interagency Commission on Learning Disabilities [42] states that 10-17.5% of the population in the U.S.A. has some level of dyslexia while Brunswick [16] esti- mates 10% for English and 3.5% for Italian. According to different statistics, from 8.6 [45] to 11% [18] of the Spanish speaking population has dyslexia. The authors
Transcript of How to Present more Readable Text for People with Dyslexia

Universal Access in the Information Society manuscript No.(will be inserted by the editor)
How to Present more Readable Text for People with Dyslexia
Luz Rello · Ricardo Baeza-Yates
Received: date / Accepted: date
Abstract The presentation of a text has a significant
effect on the reading speed of people with dyslexia. This
paper presents a set of recommendations to customize
texts on a computer screen in a more accessible way
for this target group. This set is based in an eye track-
ing study with 92 people, 46 with dyslexia and 46 as
control group, where the reading performance of the
participants was measured. The following parameters
were studied: color combinations for the font and the
screen background, font size, column width as well as
character, line and paragraph spacing. It was found that
larger text and larger character spacing lead the partic-
ipants with and without dyslexia to read significantly
faster. The study is complemented with questionnaires
to obtain the participants preferences for each of these
parameters, finding other significant effects. These re-sults provide evidence that people with dyslexia may
benefit from specific text presentation parameters that
make text on a screen more readable. So far, these rec-
ommendations based on eye tracking data are the most
complete for people with dyslexia.
Keywords Dyslexia · eye tracking · textual acces-
sibility · text customization · recommendations ·
Luz RelloHuman-Computer Interaction InstituteCarnegie Mellon University, USAE-mail: [email protected](this research was conducted while the first author was doingher PhD at the Web Research Group, Universitat PompeuFabra, Barcelona)
Ricardo Baeza-YatesYahoo Labs, Sunnyvale, CA, USA &Web Research GroupUniversitat Pompeu Fabra, BarcelonaE-mail: [email protected]
readability · text color · background color · font size ·character, line and paragraph spacings · column width.
1 Introduction
Dyslexia is a neurological reading disability which is
characterized by difficulties with accurate and/or flu-
ent word recognition and by poor spelling and decoding
abilities. Secondary consequences may include problems
in reading comprehension and reduced reading experi-
ence that can impede growth of vocabulary and back-
ground knowledge [43]. Since a great amount of infor-
mation is presented as text, this condition makes more
difficult for people with dyslexia to access written in-
formation. At the same time, access to information and
communication technologies is recognized as a basic hu-
man right by United Nations [102].
Related to its social relevance, there are two reasons
motivating the decision to approach textual accessibil-
ity for users with dyslexia: first, they are a relatively
large group of users, since dyslexia is frequent and uni-
versal, and second, this kind of accessibility practices
are not only good for people with dyslexia but also for
other target groups.
Frequent and universal. There is a universal neuro-
cognitive basis for dyslexia [65] but its manifestations
are variable due to different orthographies [35]. Depend-
ing on the language, the estimations of dyslexia varies.
The Interagency Commission on Learning Disabilities
[42] states that 10-17.5% of the population in the U.S.A.
has some level of dyslexia while Brunswick [16] esti-
mates 10% for English and 3.5% for Italian. According
to different statistics, from 8.6 [45] to 11% [18] of the
Spanish speaking population has dyslexia. The authors

2
made an estimation of the presence of dyslexic texts in
the Web and the results show that at least 0.67% of the
spelling errors found in the English Web [3] and 0.43 in
the Spanish Web [78] are made by people with dyslexia.
Good for others groups. The use of Web accessibil-
ity practices for people with dyslexia is beneficial for
all, since dyslexic-accessible practices alleviate difficul-
ties faced by all Internet users, as well as other users
with disabilities [26,31,55,69,111]. According to Zarach
[111], the guidelines to enhance readability for people
with dyslexia, also benefit people without dyslexia. For
example, Dixon [26] tested a piece of educational soft-
ware with dyslexic and non–dyslexic readers and the
results suggest that the symptoms of dyslexia are com-
mon to varying degrees among most people. Pollak [69]
showed how students with and without dyslexia bene-
fit from using multimodal documents. Also, Evett and
Brown [31] found that the web style guidelines for blind
or low vision readers are closely parallel to those for
dyslexic readers. Later, McCarthy and Swierenga re-
mark the overlap of dyslexic-accessible recommenda-
tions with more general textual accessibility recommen-
dations [55]. Hence, the present work is also extensi-
ble to general usability problems and to other target
groups.
Previous research indicate that the text presenta-
tion may have an impact on the reading performance
of people with dyslexia [1,37,50]. To the best of the au-
thors’ knowledge, this is the first time that eye tracking
is applied with such an extensive group of people, 46
participants with dyslexia and 46 without dyslexia, to
define dyslexic-accessible text presentation recommen-
dations. The present proposal would improve the ability
of people with dyslexia to read and access a wider range
of information content, empowering them by slightly
leveling the playing field. This paper presents the fol-
lowing main contributions:
– Larger font size, ranging from 18 to 26 points, lead
people with and without dyslexia to read signifi-
cantly faster.
– Larger character spacing, ranging from +7% to
+14%, lead people with and without dyslexia to
read significantly faster compared to smaller char-
acter spacing (-7%).
– Black text on white background instead of using
grey scales for the text is significantly preferred by
people with and without dyslexia.
– White text on black background instead of using
grey scales for the background is significantly pre-
ferred by people with and without dyslexia.
The rest of the paper is organized as follows. In Sec-
tion 2 dyslexia is defined and the common problems
that people with dyslexia encounter are explained. Sec-
tion 3 covers related work. Section 4 explains the ex-
perimental methodology, while Section 5 presents the
results. Section 6 presents a discussion and Section 7
the limitations of the study. Finally in Section 8 a set
of recommendations is proposed. Conclusions and fu-
ture challenges are given in Section 9.
2 Dyslexia
Brain structure, brain function and genetics studies
confirm the biological foundations of dyslexia [104].
However, despite its universal neuro-cognitive basis,
dyslexia manifestations are variable and culture-specific
[35]. This variability is due to the different language or-
thographies concerning their grade of consistency and
regularity [16]. English has an opaque –or deep– or-
thography in which the relationships between letters
and sounds are inconsistent and many exceptions are
permitted. English presents a significantly greater chal-
lenge to young readers than other languages, such as
Spanish or Italian, with a more regular alphabetic sys-
tem that contains consistent mappings between letters
and sounds, that is, a transparent –or shallow– orthog-
raphy. For instance, in [65], Italian participants with
dyslexia performed better on reading tasks than English
people with the same condition. Along an orthographic
transparency scale for European languages, English ap-
pears as the language with the deepest orthography and
Spanish as the second most shallow after Finnish [93].
Since the challenge of mapping phoneme to grapheme
depends on the orthographic transparency of the lan-
guage, Spanish shall be not be as challenging as other
languages according to this scale [93].
Hence, for the reasons described above, dyslexia has
been called a hidden disability, due to the difficulty of
its diagnosis in languages with shallow orthographies
[104], where diagnoses depend more on reading speed
that on the errors [24].
People with dyslexia encounter problems, not only
with some text presentation conditions, such as small
font size [55,89], but also with language-related condi-
tions. The following presents the dyslexia-related dif-
ficulties according to their language level. They were
collected from the cognitive neuroscience literature,
with the exception of the discourse level, where there
are recommendations from Web accessibility literature.
The poorer reading comprehension which characterized
dyslexia in this level has also been included because text
comprehension depends on longer segments of texts, not
only words. These difficulties are:

3
(a) Orthography:
– Orthographically similar words, e.g. addition
and audition [28,95];
– alternation of different typographical cases, e.g.
ElefANte (‘elefante’) [56];
– letter recognition [7,10];
– number recognition [20,51,84]; and
– poor spelling, such as letter reversals, e.g. trail
for trial [2,15,43,109].
(b) Phonology:
– Irregular words, e.g. vase1 [22,28,95]; and
– homophonic words or pseudo homophonic
words, like weather and whether [33,62].
(c) Morphology:
– Derivational errors, e.g. discomfortable [64,95,
103].
(d) Lexicon:
– New words, e.g. fantabulous [6,24];
– pseudo–words and non–words,2 e.g. happisfac-
tion [27,70,95,103];
– less frequent words, e.g. pristine [34,82,88,92];
– long words, e.g. prestidigitation [24,63,82,107];
– word additions, omissions and word recognition
[13,14,43,54];
– substitutions of functional words,3 e.g. of by for
[64,95,107];
– confusions of small words, e.g. in buy is, or buy
and but [24,105]; and
– misspellings recognition [39,77].
(e) Discourse:
– Short sentences and short paragraphs benefit ac-
cessibility for people with dyslexia according to
Web accessibility literature [9,11,61].
– Poor reading comprehension [104]. In dyslexia
this is related to decoding and not to problems
in oral or listening comprehension [23], that is, in
dyslexia, normally poor comprehension is caused
by a decoding mistake, such as word recognition.
Oral and reading comprehension need to be dif-
ferentiated, since decoding and listening com-
prehension have been shown to have different
implications in measuring comprehension [48].
Dyslexia affects decoding, though not listening
comprehension [38,57].
Additionally, there are visual difficulties associated
with dyslexia [29] that could be alleviated by modifi-
1 Words with no consistent correspondence betweengrapheme and phoneme, e.g. vase pronounced as /vaz/.2 A non-word is a word that has no meaning, is not known
to exist, or is disapproved.3 Functional words are words that have little lexical mean-
ing, but instead serve to express grammatical relationshipswith other words within a sentence.
cations of the visual display. The most studied in re-
lationship with dyslexia is the visual stress syndrome
(Meares-Irlen syndrome) [49]. The Meares-Irlen syn-
drome is characterized by symptoms of visual stress
and visual perceptual distortions that are alleviated by
using individually prescribed colored filters. Also pa-
tients susceptible to pattern glare, that is perceptual
distortions and discomfort from patterns, are prone to
Meares-Irlen syndrome and are also likely to find col-
ored filters useful [30]. Kriss and Evans [49] compared
colored overlays on a group of 32 children with dyslexia
with a control group of same size. The difference in
prevalence of the two groups did not reach statistical
significance. The authors conclude that Meares-Irlen
syndrome is prevalent in the general population and
possibly a little more common in dyslexia. Children
with dyslexia seemed to benefit more from colored over-
lays than non-dyslexic children. The authors stress that
Meares-Irlen syndrome and dyslexia are separate enti-
ties and are detected and treated in different ways [49].
Moreover, Jeanes et al. [44] showed how color overlays
helped the reading of children in school whithout tak-
ing into consideration dyslexia or other visual difficul-
ties. Gregor and Newell [37] and later Dickinson et al.
[25] have shown that visual changes in the presenta-
tion of text may alleviate some of the problems gener-
ated by dyslexia and the visual comorbidities related to
dyslexia.
3 Related Work
According to a survey by McCarthy and Swierenga [55],
studies about dyslexia and accessibility are scarce com-
pared to other groups of users with special needs. How-
ever, Al-Wabil et al. [1] claim that there are consider-
able barriers for people with dyslexia.
In the Web Content Accessibility Guidelines
(WCAG) [17], dyslexia is only one more disability
within a diverse group of cognitive disabilities. Accord-
ing to Santana et al. [89] this lack of explicit considera-
tion of dyslexia specificities in the guidelines make the
needs of users with dyslexia unfulfilled.
Previous work has been divided in user studies
about text customization and recommendations.
3.1 User Studies
Gregor and Newell [37] asked 12 students with dyslexia
to test different colors, sizes, spacings, column widths,
and similar letter highlighting to improve the subjective
readability of MS Word documents. The best parame-
ters were tested by seven people with dyslexia, which

4
reported a subjective increase in readability. The results
of this investigation were included in the SeeWord tool
for MS Word [36]. After, Dickinson et al. [25] carried
out a pilot study with six participants using the See-
Word software showing that reading accuracy improved
as well as the subjectively rated reading comfort.
Kurniawan and Conroy [50] tested different color
schemes for reading online with 27 users with dyslexia.
The participants had to read five online articles and
undertook comprehension questionnaires. The compre-
hension of readers with dyslexia was poorer for the com-
plex articles however the reading speed was not slower
using the color scheme the users selected.
Santana et al. [90] developed the Mozilla Firefox
extension Firefixia, a tool that allows readers with
dyslexia to customize websites to improve readability.
They tested Firefixia with four users and found that
readers with dyslexia appreciate customization. The
customization settings included in Firefixia are based
in previous user studies and recommendations. They
include font type, font size, color, character spacing,
line spacing and column width.
O’Brien et al. [59] compared the reading speeds us-
ing twelve different font sizes between two groups: chil-
dren with (aged 7 to 10 years), and without dyslexia
(aged 6 to 8 years). They showed how dyslexic read-
ing follows the same curve shape as skilled reading,
with constant reading rates across large font sizes and
a sharp decline in reading rates below a critical font
size. Readers with dyslexia presented higher critical
font sizes.
Zorzi et al. [113] conducted an experiment with 74
children with dyslexia (34 Italian and 40 French, aged
between 8 and 14). The children read on paper texts
with regular character spacing and extra large charac-
ter spacing (an increase of 2.5 pt in the standard letter
spacing using 14 points Times font). The texts with
larger character spacing lead to a better reading accu-
racy (number of errors) and speed (number of syllables
per second).
Schneps et al. [91] performed an experiment with
27 high school students with reading struggles. They
tested line length and extra large spacing. Regarding
line length, they compare two screen dimensions: iPod
Touch in portrait mode (5 cm × 7.5 cm) and the Ap-
ple iPad in landscape mode (19.7 cm × 14.8 cm). They
found that using a small device improved readability
(faster reading speeds, less number of fixations and less
regressive saccades). With regards to extra large spac-
ing they conclude that it improves comprehension in
those most impaired.
In the authors’ previous work, Rello et al. [86] tested
the same parameters of the present study. Eye tracking,
questionnaires and semi-structured interviews with 23
participants with dyslexia were used, testing grey scales
and colors for the text and the background, character,
line and paragraph spacing as well as column width.
The results were integrated in two text customization
tools: the web service Text4All [99]4 for websites and
the Android IDEAL eBook reader5 [47] for ebooks. Its
functionalities and usability were tested with 14 partic-
ipants with dyslexia using the think aloud protocol [52].
The participants reported a subjective improvement of
the reading comfort and functional improvements pro-
posed by the participants (mainly to the interface) were
subsequently integrated in the application.
3.2 Recommendations
There is a common agreement in specific studies
about dyslexia and accessibility that the application of
dyslexic-accessible practices benefits also the readabil-
ity for users without dyslexia [26,50,55]. Consequently,
the guidelines for developing Web sites accessible to
users with dyslexia [11,71,111] usually overlap with
guidelines for low-literacy users [58] or other disabili-
ties such as low vision [31]. For example, according to
Zarach [111] guidelines for enhanced readability for peo-
ple with dyslexia, also benefit people without dyslexia.
However, there is no universal profile of a user with
dyslexia and therefore some authors recommend using
a customizable environment for such users [37,58].
In relationship with the variables studied in the ex-
periments, the recommendations for text presentation
for people with dyslexia have focused in the following
parameters: text and background grey scale [86,101],
text and background colors [11,12,37,71,86], font size
[1,12,25,71,86,111], paragraph spacing [11,86], char-
acter spacing [66,71], line spacing [71,86] and column
width [11,12,86].
Except from preliminary work [86], this study differs
from the rest of the related approaches specifically in
the application of eye tracking to measure readability of
a text. The current study addresses the methodological
weaknesses of the authors’ previous work improving it
in the following points:
– The results are based in a larger number of partici-
pants with dyslexia (46 participants instead of 23).
– The results are compared with a similar control
group without dyslexia (46 people).
– Text comprehension is included as a control vari-
able.
4 http://www.text4all.net/dyswebxia.html5 https://play.google.com/store/apps/details?id=
org.easyaccess.epubreader
5
– The presentation of the conditions are counter-
balanced, instead of randomized, to cancel out order
effects. Each of the counter-balanced conditions was
read by the same number of participants.
4 Methodology
Eight experiments were conducted to study the effect
of eight text presentation parameters on readability. In
the experiments, 92 participants (46 with dyslexia) had
to read a set of texts, which were altered to include the
different values of the parameters.
4.1 Design
For each experiment there were four or eight conditions.
Each of the conditions correspond with the levels of the
parameters taken as independent variables. The exper-
iments followed a within-subjects design, so every par-
ticipant contributed to each of the conditions in the
experiments. The order of the experimental conditions
was counter-balanced to cancel out sequence effects. No
combinations of conditions were studied. Table 1 shows
a summary of the experiments.
The levels of the variables were chosen taking into
account the difficulties that people with dyslexia find
(see Section 2); previous user studies (see Section 3);
and literature about recommendations for readers with
dyslexia (see Section 3). More details of the parameters
used in comparison with the literature are given in Sec-
tion 6. The following presents the independent variables
and their levels.
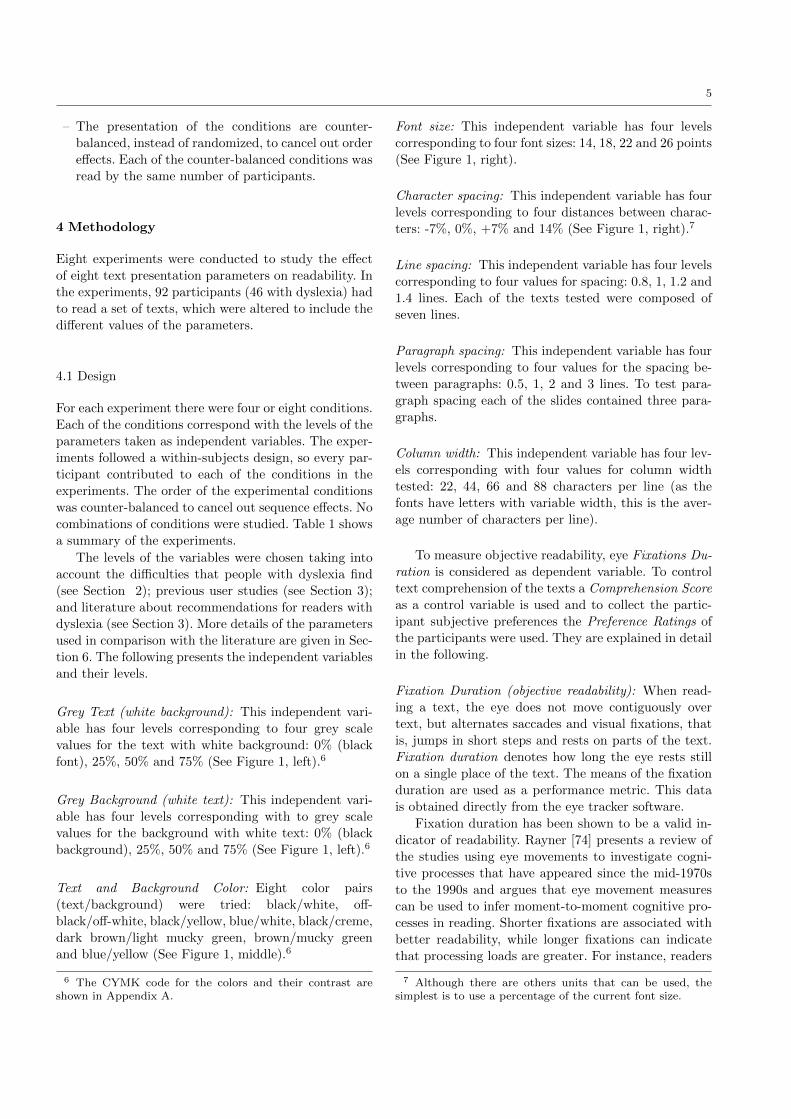
Grey Text (white background): This independent vari-
able has four levels corresponding to four grey scale
values for the text with white background: 0% (black
font), 25%, 50% and 75% (See Figure 1, left).6
Grey Background (white text): This independent vari-
able has four levels corresponding with to grey scale
values for the background with white text: 0% (black
background), 25%, 50% and 75% (See Figure 1, left).6
Text and Background Color: Eight color pairs
(text/background) were tried: black/white, off-
black/off-white, black/yellow, blue/white, black/creme,
dark brown/light mucky green, brown/mucky green
and blue/yellow (See Figure 1, middle).6
6 The CYMK code for the colors and their contrast areshown in Appendix A.
Font size: This independent variable has four levels
corresponding to four font sizes: 14, 18, 22 and 26 points
(See Figure 1, right).
Character spacing: This independent variable has four
levels corresponding to four distances between charac-
ters: -7%, 0%, +7% and 14% (See Figure 1, right).7
Line spacing: This independent variable has four levels
corresponding to four values for spacing: 0.8, 1, 1.2 and
1.4 lines. Each of the texts tested were composed of
seven lines.
Paragraph spacing: This independent variable has four
levels corresponding to four values for the spacing be-
tween paragraphs: 0.5, 1, 2 and 3 lines. To test para-
graph spacing each of the slides contained three para-
graphs.
Column width: This independent variable has four lev-
els corresponding with four values for column width
tested: 22, 44, 66 and 88 characters per line (as the
fonts have letters with variable width, this is the aver-
age number of characters per line).
To measure objective readability, eye Fixations Du-
ration is considered as dependent variable. To control
text comprehension of the texts a Comprehension Score
as a control variable is used and to collect the partic-
ipant subjective preferences the Preference Ratings of
the participants were used. They are explained in detail
in the following.
Fixation Duration (objective readability): When read-
ing a text, the eye does not move contiguously over
text, but alternates saccades and visual fixations, that
is, jumps in short steps and rests on parts of the text.
Fixation duration denotes how long the eye rests still
on a single place of the text. The means of the fixation
duration are used as a performance metric. This data
is obtained directly from the eye tracker software.
Fixation duration has been shown to be a valid in-
dicator of readability. Rayner [74] presents a review of
the studies using eye movements to investigate cogni-
tive processes that have appeared since the mid-1970s
to the 1990s and argues that eye movement measures
can be used to infer moment-to-moment cognitive pro-
cesses in reading. Shorter fixations are associated with
better readability, while longer fixations can indicate
that processing loads are greater. For instance, readers
7 Although there are others units that can be used, thesimplest is to use a percentage of the current font size.

6
Design Within-subjects
Independent Color black/whiteVariables (text and background) off-black/off-white(one per experiment) black/yellow
blue/whiteblack/cremeblue/yellowdark brown/light mucky greenbrown/mucky green
Grey Text (white background) 0% (black font)25%50%75%
Grey Background (white text) 0% (black background)25%50%75%
Font Size 14 points18 points22 points26 points
Character Spacing -7% character0% character+7% character14% character
Line Spacing 0.8 lines1 line1.2 lines1.4 lines
Paragraph Spacing 0.5 lines1 line2 lines3 lines
Column Width 22 character per line44 character per line66 character per line88 character per line
Dependent Fixation Duration (objective readability)Variables Preference Rating (subjective preferences)Control Variable Comprehension Score (objective comprehensibility)
Participants Group D (46 participants) 26 female, 20 maleAge: range from 11 to 45(x = 20.70, s = 7.87)Education: high school (22),university (21), no higher education (3)
Group C (46 participants) 27 female, 19 maleAge: range from 13 to 37(x = 23.50, s = 8.16)Education: high school (16),university (28), no higher education (2)
Materials Base Texts 36 text fragmentsText PresentationComprehension Questionnaire 8 inferential items (1 item/condition)Preferences Questionnaire 8 items (1 item/condition)
Equipment Eye tracker Tobii 1750
Procedure Steps: Instructions, demographic questionnaire, reading task,comprehension questionnaire, preference questionnaires
Table 1 Experimental methodology summary for the experiments.

7
Fig. 1 Examples of the text and background grey scales and colors used, as well as character spacing and font size.
dyslexia
dyslexia
dyslexia
dyslexia dyslexia
dyslexia
dyslexia
dyslexia
dyslexia
dyslexia
dyslexia
dyslexia
black/white
off-black/off-white
black/yellow
blue/white
dyslexia
dyslexia
dyslexia
d y s l e x i a
dyslexia
dyslexia
dyslexia
dyslexia
grey scale: 0%
black/creme
dark brown/light mucky green
brown/mucky green
blue/yellow
char. spacing: +14%
+7% !!0% !!–7%
25%
50%
75%
dyslexia
dyslexia
dyslexia
dyslexiasize: 14 points
18 points !!22 points !!26 points
present longer fixations at low-frequency words than at
high-frequency words [41,46,72,75,76].
There are three studies that show why fixation du-
ration is also a valid indicator for people with dyslexia.
First, Hyona and Olson [40] found that dyslexic readers
show the typical word frequency effect in which low-
frequency words are fixated longer than high-frequency
words.
Second, Pirozzolo and Rayner [68] and Olson et
al. [60] found that when dyslexic readers were given a
text appropriate for their reading level, their eye move-
ments (fixations, saccades and regressions) were much
like those of normal readers at that particular age level.
Third, Rayner [73] showed that normal children’s
eye movements (fixation durations, saccade lengths,
and the size of the perceptual span) could be similar
to the dyslexic readers’ eye movements when they were
given a text that was too difficult for them.
In sum, as Rayner [74] concludes “the most appro-
priate conclusion remains that eye movements reflect
the difficulties that dyslexic individuals have reading
and are not the cause of the reading problem”.
Comprehension Score (objective comprehensibility):
Moving the eyes over a text does not guarantee its
comprehension, specially in people with dyslexia where
comprehension was found to be independent from read-
ability [77]. To check that the text was not only read,
but also understood, text comprehension is measured
using a comprehension questionnaire with inferential
items, that is, questions that require a deep understand-
ing of the content of the text. They include multiple-
choice questions with three possible choices, one correct
choice and two wrong choices. Each item referred to the
understanding of the whole stories presented because
fragments presented were too short to ask comprehen-
sion questions for each fragment. From these answers, a
comprehension score, the percentage of correct answers
is computed, where the correct choice scored 100% and
the others 0%. To guarantee that recordings analyzed in
this study were valid and comparable, the comprehen-
sion score was used as a control variable, such that if the
recording of a complete session did not have an overall
100% comprehension score, it was discarded from the
analysis.
Preference Rating (subjective preferences): To measure
the participants’ preferences, they were asked to select
the texts that they found easiest to read. For each ex-
periment, they wrote their answers in a paper question-
naire while they saw the options on the screen. The par-
ticipant could see the options for as long and as many
times as desired. Whenever the participant selected one,
two, three or four options as most readable, the weights
1, 0.5, 0.33 and 0.25 respectively, were given to those
options. To calculate the average preference rating the
weights are summed and then divided by the number
of participants.
4.2 Participants
Overall, 92 participants undertook the experiment.
They included 46 Spanish speakers (26 female, 20 male)
with a confirmed diagnosis of dyslexia (group D) and 46
Spanish speakers (27 female, 19 male) without dyslexia,
which served as a control group (group C). The ages of
group D ranged from 13 to 37, with a mean age of 23.50
years (s = 8.16), while the ages of group C ranged from
13 to 43, with a mean age of 20.70 years (s = 7.87).
Apart from 3 participants with dyslexia and 2 with-
out dyslexia who had no higher education, the rest were
attending school or high school (22 participants with
dyslexia and 16 participants without dyslexia) or were
studying or had already finished university degrees (21
participants with dyslexia and 28 participants without
dyslexia).
Participants from group D were asked to bring their
diagnoses to the experiment, to guarantee that dyslexia
was diagnosed in an authorized centre or hospital. In
the Catalan protocol of dyslexia diagnosis [94], the dif-
ferent kinds of dyslexia, extensively found in literature,
are not considered. Therefore, one can only guarantee
that the participant was diagnosed in a authorized cen-
ter or hospital but not the exact type of dyslexia. Three

8
of these participants were also diagnosed with attention
deficit disorder. None of the participants were screened
for visual stress (Meares-Irlen) syndrome.
4.3 Materials
The materials used in the experiment were: base texts,
comprehension questionnaires, and preferences ques-
tionnaires. The test presentation was also controlled.
4.3.1 Base Texts
For the reading tests two stories were used. The first
story8 was written in verse, while the second is a frag-
ment in prose.9
The overall text was divided in 36 fragments and
each of them was presented to the participants with
a different condition. To maintain the independence of
the variables, there were no combinations among the
conditions levels. The texts fragments belonging to dif-
ferent levels of the same condition were comparable to
each other. They had the same number of words and
the same number of syllables for the shorter passages
(texts containing less than 22 words). The shorter texts
were extracted from the story written in verse so they
were very similar to each other having the same rhythm
and meter.
4.3.2 Comprehension Questionnaire
Multiple-choice questions with three possible choices,
one correct choice and two wrong were used. The com-
prehension questionnaire was composed of three items
about the general content of the text. An example of
an item is given below.
– ¿Por que querıan matar las hormigas a su companera?‘Why did the ants wanted to kill their comrade?’– Porque era egoısta. ‘Because she was selfish’.– Porque veıa las estrellas. ‘Because she saw the stars’.– Porque no rezaba. ‘Because she did not pray’.
4.3.3 Preferences Questionnaire
The slides that the participant read were replayed and
through a paper questionnaire, the participant chose
what s/he thought was the best reading alternative be-
tween the options given for each of the parameters. The
questionnaire had eight items, one for each experiment,
8 Los Encuentros del Caracol Aventurero (The Encountersof the Adventurous Snail) by Federico Garcıa Lorca.9 From the book Soy dix-leso? (I am dys-dumb?) of the
Papelucho series by Marcela Paz. This text example is givenin Appendix B.
and four to eight possible choices depending on the
number of levels of the variable. Each item was com-
posed of one statement and the options. The statement
was always the same. See an example of an item below.
– Leo mejor el texto... ‘I read best the text...’1 � 2 � 3 � 4 �
4.3.4 Text Presentation
For the experiment it was decided to present the texts
in Arial because of the following reasons. First, Arial is
the most common font used on screen for the Web [19].
Second, Arial has been highly recommended in previous
work. For instance, Evett and Brown [31] put in com-
parison recommendations for readers with low vision
and dyslexia, and both groups agree in using Arial and
Comic Sans. In addition, the British Dyslexia Associa-
tion also recommends using Arial. Third, in Lockley’s
[53] study, Arial was the preferred font. Also in a re-
cent study using eye tracking with 48 participants with
dyslexia [79], Arial was the font which lead to shorter
reading times compared to other eleven fonts.10 Un-
justified text was used, since justified text alignment
produces irregular spacing between words that make
reading harder [11,66,71].
The default parameters of text presentation were
black text and white background for colors (no text and
background grey scales were taken into consideration),
20 points for font size, 0% for character spacing, 1 for
line spacing, 1 for paragraph spacing, and 66 characters
for column width.
4.4 Equipment and Software
The eye tracker used was the Tobii T50 [98] that has
a 17-inch TFT monitor with a resolution of 1024x768
pixels. The time measurements of the eye tracker have a
precision of 0.02 seconds. The eye tracker was calibrated
for each participant and the light focus was always in
the same position. The distance between the participant
and the eye tracker was constant (approximately 60 cm.
or 24 in.) and controlled by using a fixed chair.
The software used for analyzing the eye tracking
data was Tobii Studio 3.0 and the R 2.14.1 statistical
software for the statistical analysis.
10 The fonts tested were: Arial, Arial Italic, ComputerModern Unicode, Courier, Garamond, Helvetica, Myriad,OpenDyslexic, OpenDyslexic Italic, Times, Times Italic, andVerdana [79].
9
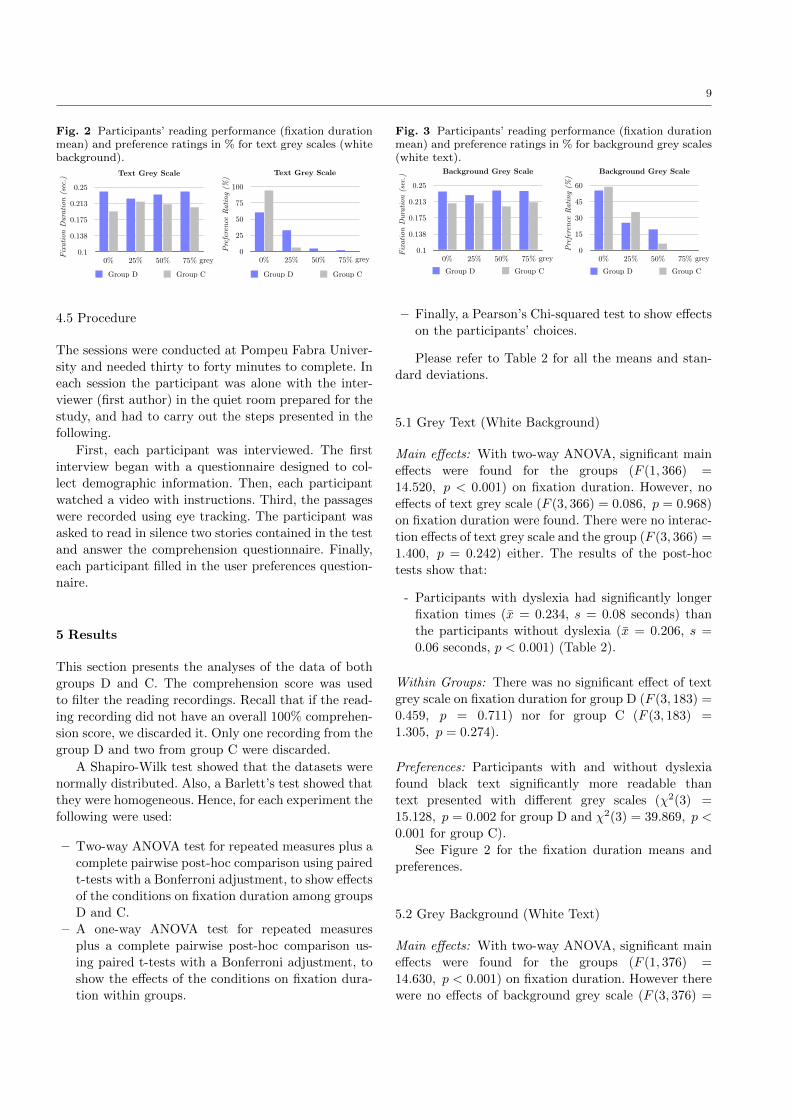
Fig. 2 Participants’ reading performance (fixation durationmean) and preference ratings in % for text grey scales (whitebackground).
Non_Dys Font Contrast Back Contrast
Colors Size Chart Spa Line Spa Par Spacing Column Width
1 46 3 0 5 32 5 2 32 0 28 3 19 9 19 10 243 0 17 16 24 0 5 22 164 3 0 7 0 8 19 8 15 96 117 158 4
Scale-0 = 1 Scale-0 = 2 Color-blackoff-whiteoff = 5 Size-14 = 4 Spacing +14 = 2 Line Spacing 0.8 = 3 Spacing .4 = 4 Column width 1/4 = 4
Scale-25 = 4 Scale-25 = 3 Color-yellow-black = 6 Size-18= 3 Spacing +7 = 4 Line Spacing 1 = 4 Spacing 2 = 3 Column width 2/4 = 3
Scale-50 = 3 Scale-50 = 1 Color-blue-white = 8 Size-22= 2 Spacing 0 = 1 Line Spacing 1.4 = 1 Spacing 1 = 2 Column width 3/4 = 2
Scale-75 = 2 Scale-75 = 4 Color-brown-green = 1 Size-26= 1 Spacing -7 = 3 Line Spacing 1.2 = 2 Spacing 3 = 1 Column width 4/4 = 1
Color-black-creme = 3Color-dark brown-green = 2
Color-yellow-blue = 4Color-black-white = 7
Font Contrast Back Contrast
Colors Size Chart Spa Line Spa Par Spacing Column Width
1 2 12 5 0 5 2 23 42 15 0 2 3 15 15 30 143 27 9 15 15 17 18 43 144 1 26 5 26 9 10 35 125 36 77 48 5
Scale-0 = 3 Scale-0 = 4 Color-black-white = 1 Size-14 = 1 Spacing +14 = 4 Line Spacing 0.8 = 1 Spacing .4 = 1 Column width 1/4 = 1
Scale-25 = 2 Scale-25 = 1 Color-blackoff-whiteoff = 2 Size-18= 2 Spacing +7 = 2 Line Spacing 1 = 2 Spacing 2 = 2 Column width 2/4 = 2
Scale-50 = 1 Scale-50 = 3 Color-yellow-black = 3 Size-22= 3 Spacing 0 = 3 Line Spacing 1.4 = 4 Spacing 1 = 3 Column width 3/4 = 3
Scale-75 = 4 Scale-75 = 2 Color-blue-white = 4 Size-26= 4 Spacing -7 = 1 Line Spacing 1.2 = 3 Spacing 3 = 4 Column width 4/4 = 4
Color-brown-green = 5Color-black-creme = 6
Color-dark brown-green = 7Color-yellow-blue = 8
Font Contrast Group D Group N Font Contrast Group D Group N0% 27 46 45 49 0%75% 15 3 46 49 75%50% 2 0 46 49 50%25% 1 0 46 49 25%
Font Contrast Group D Group N Font Contrast Group D Group N0% 60 93.8775510204082 0% 0.24 0.19425% 32.6086956521739 6.12244897959184 25% 0.223 0.21750% 4.34782608695652 0 50% 0.233 0.211
Correlation 75% 2.17391304347826 0 75% 0.24 0.204-0.968445715719153 99.1304347826087 100 0.017 0.023-0.993869371230394 0.01 0.017
Back Contrast Group D Group N 0.017 0.00999999999999998100% 26 28 47 48 7.6233183856502211.855670103092825% 12 17 47 48 4.484304932735438.7628865979381450% 9 3 47 48 7.623318385650225.1546391752577275% 0 0 47 48
Back Contrast Group D Group N Back Contrast Group D Group N100% 55.3191489361702 58.3333333333333 0% 0.236 0.20825% 25.531914893617 35.4166666666667 25% 0.227 0.209
Correlation 50% 19.1489361702128 6.25 50% 0.238 0.201-0.118995939068828 75% 0 0 75% 0.237 0.2110.188839041314493 0.008999999999999980.00699999999999998
0.011 0.007999999999999980.009999999999999980.009999999999999983.964757709251093.48258706467661
Size Group D Group N 4.845814977973563.9800995024875514 0 0 46 44 4.405286343612334.9751243781094418 2 3 48 4422 10 15 48 4426 34 26 48 44
Size Group D Group N Size Group D Group N14 0 0 14 0.259 0.22318 4.16666666666667 6.81818181818182 18 0.233 0.2
Correlation 22 20.8333333333333 34.0909090909091 22 0.216 0.198-0.791535362594822 26 70.8333333333333 59.0909090909091 26 0.208 0.186-0.852378048645091 0.051 0.037
0.025 0.0140.00800000000000001 0.012
14 24.519230769230819.892473118279618 12.01923076923087.5268817204301122 3.846153846153856.45161290322581
Chart Spa Group D Group N-7 5 0 46 490 17 32 46 49+7 15 8 46 49+14 9 9 46 49
Chart Spa Group D Group N Chart Spa Group D Group N-7 10.8695652173913 0 -7 0.234 0.1980 36.9565217391304 65.3061224489796 0 0.208 0.19
Correlation +7 32.6086956521739 16.3265306122449 +7 0.202 0.185-0.838022023794689 +14 19.5652173913043 18.3673469387755 +14 0.21 0.179-0.123430442777081 0.032 0.019
0.00599999999999998 0.0115 0 0.007999999999999980.00600000000000001
17 32 15.841584158415810.614525139664815 8 2.970297029702966.14525139664805
9 9 3.960396039603953.35195530726257
Line Spa Group D Group N0.8 2 5 45 481 15 19 45 481.2 18 19 45 481.4 10 5 45 48
Line Spa Group D Group N Line Spa Group D Group N0.8 4.44444444444444 10.4166666666667 0.8 0.233 0.2061 33.3333333333333 39.5833333333333 1 0.236 0.207
Correlation 1.2 40 39.5833333333333 1.2 0.237 0.2050.451017032441845 1.4 22.2222222222222 10.4166666666667 1.4 0.226 0.2040.447213595499958 0.00700000000000001 0.001
0.00999999999999998 -0.0010.011 -0.002
3.097345132743370.4854368932038844.42477876106194-0.4854368932038844.86725663716813-0.970873786407768
Par Spacing Group D Group N0.4 23 4 131 381 43 10 131 382 30 22 131 383 35 2 131 38
Par Spacing Group D Group N Par Spacing Group D Group N0.4 17.5572519083969 10.5263157894737 0.4 0.233 0.1981 32.824427480916 26.3157894736842 1 0.228 0.198
Correlation 2 22.9007633587786 57.8947368421053 2 0.22 0.196-0.274103716415761 3 26.7175572519084 5.26315789473684 3 0.221 0.197-0.676968662049936 0.013 0.002
0.00800000000000001 0.0020.001 0.001
5.909090909090911.020408163265313.636363636363641.020408163265310.4545454545454550.510204081632654
Column Width Group D Group N22 12 1 44 4444 14 24 44 4466 14 16 44 4488 4 3 44 44
Column Width Group D Group N Column Width Group D Group N22 27.2727272727273 2.27272727272727 22 0.219 0.19144 31.8181818181818 54.5454545454545 44 0.214 0.19
Correlation 66 31.8181818181818 36.3636363636364 66 0.221 0.1870.402618283010223 88 9.09090909090909 6.81818181818182 88 0.215 0.187-0.0148014204124575 0.005 0.004
0.00700000000000001 0.0031 0.001 02 2.336448598130842.139037433155083 3.271028037383181.604278074866314 0.467289719626169 05678
Colors Group D Group Nblack-white 5 15 46 65
blackoff-whiteoff 2 9 46 65yellow-black 15 11 46 65blue-white 5 4 46 65
brown-green 3 0 46 65black-creme 7 16 46 65
dark brown-green 4 3 46 65yellow-blue 5 7 46 65
Colors Group D Group N Colors Group D Group Nblack-creme black-white 10.8695652173913 23.0769230769231 black-creme 0.208 0.187yellow-blue blackoff-whiteoff 4.34782608695652 13.8461538461538 yellow-blue 0.214 0.182
brown-green yellow-black 32.6086956521739 16.9230769230769 brown-green 0.221 0.194blackoff-whiteoff blue-white 10.8695652173913 6.15384615384615 blackoff-whiteoff 0.222 0.201
black-white brown-green 6.52173913043478 0 black-white 0.223 0.195blue-white black-creme 15.2173913043478 24.6153846153846 blue-white 0.228 0.18
dark brown-green dark brown-green 8.69565217391304 4.61538461538461 dark brown-green 0.228 0.203yellow-black yellow-blue 10.8695652173913 10.7692307692308 yellow-black 0.23 0.189
black-creme 15.2173913043478 24.6153846153846 0.006000000000000010.00700000000000001yellow-blue 10.8695652173913 10.7692307692308 0.013 0.002brown-green 6.52173913043478 0 0.014 0.014blackoff-whiteoff 4.34782608695652 13.8461538461538 0.015 0.021black-white 10.8695652173913 23.0769230769231 0.02 0.015blue-white 10.8695652173913 6.15384615384615 0.02 0
Correlation dark brown-green 8.69565217391304 4.61538461538461 0.022 0.023yellow-black 32.6086956521739 16.9230769230769 0.00900000000000001
black-creme0.0918053760955382 yellow-blue 2.884615384615393.88888888888889black-creme 3.88888888888889-0.735791591345596 brown-green 6.250000000000011.11111111111111yellow-blue 1.11111111111111
blackoff-whiteoff 6.730769230769247.77777777777778brown-green 7.77777777777778black-white 7.2115384615384711.6666666666667blackoff-
whiteoff11.6666666666667
blue-white 9.615384615384628.33333333333334black-white 8.33333333333334dark brown-green 9.61538461538462 0 blue-white 0
yellow-black 10.576923076923112.7777777777778dark brown-green
12.7777777777778
5 yellow-black 5
Text Grey Scale
0
25
50
75
100
0% 25% 50% 75%Group D Group C
Chart 2
0
15
30
45
60
Untitled 1 Untitled 2 Untitled 3 Untitled 4
Back Contrast Colors
Background Grey Scale
0
15
30
45
60
0% 25% 50% 75%Group D Group C
Font Size
0
20
40
60
80
14 18 22 26Group D Group C
Character Spacing
0
17.5
35
52.5
70
–7% 0% +7% +14%Group D Group C
Line Spacing
0
10
20
30
40
0.8 1 1.2 1.4Group D Group C
Paragraph Spacing
0
15
30
45
60
0.5 1 2 3Group D Group C
Column Width
0
15
30
45
60
22 44 66 88Group D Group C
Text and Background Colors
0
10
20
30
40
Group D Group C
Text Grey Scale
0.1
0.138
0.175
0.213
0.25
0% 25% 50% 75%Group D Group C
Background Grey Scale
0.1
0.138
0.175
0.213
0.25
0% 25% 50% 75%Group D Group C
Text and Background Colors
0.1
0.138
0.175
0.213
0.25
Group D Group C
Font Size
0.1
0.138
0.175
0.213
0.25
14 18 22 26Group D Group C
Line Spacing
0.1
0.138
0.175
0.213
0.25
0.8 1 1.2 1.4Group D Group C
Paragraph Spacing
0.1
0.138
0.175
0.213
0.25
0.5 1 2 3Group D Group C
Column Width
0.1
0.138
0.175
0.213
0.25
22 44 66 88Group D Group C
Character Spacing
0.1
0.138
0.175
0.213
0.25
–7% 0% +7% +14%Group D Group C
lines lines lines lines
lines lines
char. char.
grey grey
grey grey
brown/g
reen
dark b
rown/
light g
reen
black/
yellow
blue/y
ellow
blue/w
hite
black/
creme
black
off/
white offbla
ck/whit
e
brown/g
reen
dark b
rown/
light g
reen
black/
yellow
blue/y
ellow
blue/w
hite
black/
creme
black
off/
white off
black/
white
points points
char. char.
Fixa
tion
Dura
tion
(sec
.)
Pref
eren
ce R
atin
g (%
)Pr
efer
ence
Rat
ing
(%)
Pref
eren
ce R
atin
g (%
)Pr
efer
ence
Rat
ing
(%)
Pref
eren
ce R
atin
g (%
)Pr
efer
ence
Rat
ing
(%)
Pref
eren
ce R
atin
g (%
)
Pref
eren
ce R
atin
g (%
)
Fixa
tion
Dura
tion
(sec
.)Fi
xatio
n Du
ratio
n (s
ec.)
Fixa
tion
Dura
tion
(sec
.)
Fixa
tion
Dura
tion
(sec
.)Fi
xatio
n Du
ratio
n (s
ec.)
Fixa
tion
Dura
tion
(sec
.)Fi
xatio
n Du
ratio
n (s
ec.)
4.5 Procedure
The sessions were conducted at Pompeu Fabra Univer-
sity and needed thirty to forty minutes to complete. In
each session the participant was alone with the inter-
viewer (first author) in the quiet room prepared for the
study, and had to carry out the steps presented in the
following.
First, each participant was interviewed. The first
interview began with a questionnaire designed to col-
lect demographic information. Then, each participant
watched a video with instructions. Third, the passages
were recorded using eye tracking. The participant was
asked to read in silence two stories contained in the test
and answer the comprehension questionnaire. Finally,
each participant filled in the user preferences question-
naire.
5 Results
This section presents the analyses of the data of both
groups D and C. The comprehension score was used
to filter the reading recordings. Recall that if the read-
ing recording did not have an overall 100% comprehen-
sion score, we discarded it. Only one recording from the
group D and two from group C were discarded.
A Shapiro-Wilk test showed that the datasets were
normally distributed. Also, a Barlett’s test showed that
they were homogeneous. Hence, for each experiment the
following were used:
– Two-way ANOVA test for repeated measures plus a
complete pairwise post-hoc comparison using paired
t-tests with a Bonferroni adjustment, to show effects
of the conditions on fixation duration among groups
D and C.
– A one-way ANOVA test for repeated measures
plus a complete pairwise post-hoc comparison us-
ing paired t-tests with a Bonferroni adjustment, to
show the effects of the conditions on fixation dura-
tion within groups.
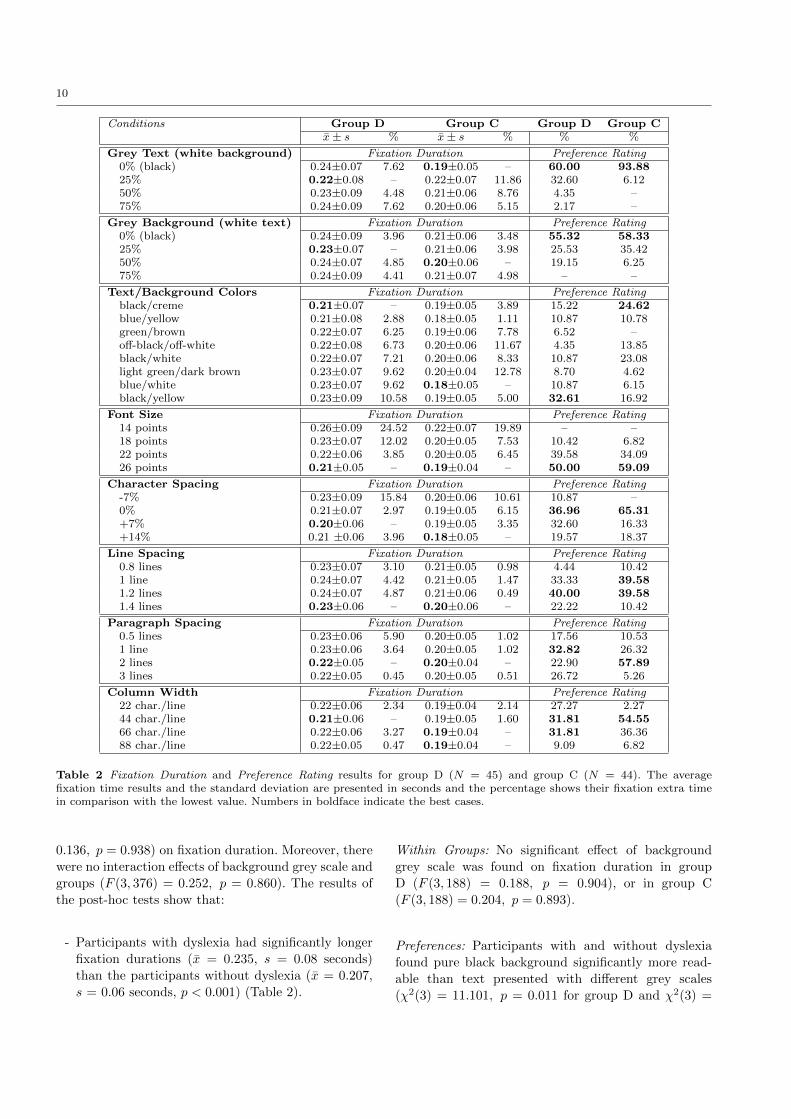
Fig. 3 Participants’ reading performance (fixation durationmean) and preference ratings in % for background grey scales(white text).
Non_Dys Font Contrast Back Contrast
Colors Size Chart Spa Line Spa Par Spacing Column Width
1 46 3 0 5 32 5 2 32 0 28 3 19 9 19 10 243 0 17 16 24 0 5 22 164 3 0 7 0 8 19 8 15 96 117 158 4
Scale-0 = 1 Scale-0 = 2 Color-blackoff-whiteoff = 5 Size-14 = 4 Spacing +14 = 2 Line Spacing 0.8 = 3 Spacing .4 = 4 Column width 1/4 = 4
Scale-25 = 4 Scale-25 = 3 Color-yellow-black = 6 Size-18= 3 Spacing +7 = 4 Line Spacing 1 = 4 Spacing 2 = 3 Column width 2/4 = 3
Scale-50 = 3 Scale-50 = 1 Color-blue-white = 8 Size-22= 2 Spacing 0 = 1 Line Spacing 1.4 = 1 Spacing 1 = 2 Column width 3/4 = 2
Scale-75 = 2 Scale-75 = 4 Color-brown-green = 1 Size-26= 1 Spacing -7 = 3 Line Spacing 1.2 = 2 Spacing 3 = 1 Column width 4/4 = 1
Color-black-creme = 3Color-dark brown-green = 2
Color-yellow-blue = 4Color-black-white = 7
Font Contrast Back Contrast
Colors Size Chart Spa Line Spa Par Spacing Column Width
1 2 12 5 0 5 2 23 42 15 0 2 3 15 15 30 143 27 9 15 15 17 18 43 144 1 26 5 26 9 10 35 125 36 77 48 5
Scale-0 = 3 Scale-0 = 4 Color-black-white = 1 Size-14 = 1 Spacing +14 = 4 Line Spacing 0.8 = 1 Spacing .4 = 1 Column width 1/4 = 1
Scale-25 = 2 Scale-25 = 1 Color-blackoff-whiteoff = 2 Size-18= 2 Spacing +7 = 2 Line Spacing 1 = 2 Spacing 2 = 2 Column width 2/4 = 2
Scale-50 = 1 Scale-50 = 3 Color-yellow-black = 3 Size-22= 3 Spacing 0 = 3 Line Spacing 1.4 = 4 Spacing 1 = 3 Column width 3/4 = 3
Scale-75 = 4 Scale-75 = 2 Color-blue-white = 4 Size-26= 4 Spacing -7 = 1 Line Spacing 1.2 = 3 Spacing 3 = 4 Column width 4/4 = 4
Color-brown-green = 5Color-black-creme = 6
Color-dark brown-green = 7Color-yellow-blue = 8
Font Contrast Group D Group N Font Contrast Group D Group N0% 27 46 45 49 0%75% 15 3 46 49 75%50% 2 0 46 49 50%25% 1 0 46 49 25%
Font Contrast Group D Group N Font Contrast Group D Group N0% 60 93.8775510204082 0% 0.24 0.19425% 32.6086956521739 6.12244897959184 25% 0.223 0.21750% 4.34782608695652 0 50% 0.233 0.211
Correlation 75% 2.17391304347826 0 75% 0.24 0.204-0.968445715719153 99.1304347826087 100 0.017 0.023-0.993869371230394 0.01 0.017
Back Contrast Group D Group N 0.017 0.00999999999999998100% 26 28 47 48 7.6233183856502211.855670103092825% 12 17 47 48 4.484304932735438.7628865979381450% 9 3 47 48 7.623318385650225.1546391752577275% 0 0 47 48
Back Contrast Group D Group N Back Contrast Group D Group N100% 55.3191489361702 58.3333333333333 0% 0.236 0.20825% 25.531914893617 35.4166666666667 25% 0.227 0.209
Correlation 50% 19.1489361702128 6.25 50% 0.238 0.201-0.118995939068828 75% 0 0 75% 0.237 0.2110.188839041314493 0.008999999999999980.00699999999999998
0.011 0.007999999999999980.009999999999999980.009999999999999983.964757709251093.48258706467661
Size Group D Group N 4.845814977973563.9800995024875514 0 0 46 44 4.405286343612334.9751243781094418 2 3 48 4422 10 15 48 4426 34 26 48 44
Size Group D Group N Size Group D Group N14 0 0 14 0.259 0.22318 4.16666666666667 6.81818181818182 18 0.233 0.2
Correlation 22 20.8333333333333 34.0909090909091 22 0.216 0.198-0.791535362594822 26 70.8333333333333 59.0909090909091 26 0.208 0.186-0.852378048645091 0.051 0.037
0.025 0.0140.00800000000000001 0.012
14 24.519230769230819.892473118279618 12.01923076923087.5268817204301122 3.846153846153856.45161290322581
Chart Spa Group D Group N-7 5 0 46 490 17 32 46 49+7 15 8 46 49+14 9 9 46 49
Chart Spa Group D Group N Chart Spa Group D Group N-7 10.8695652173913 0 -7 0.234 0.1980 36.9565217391304 65.3061224489796 0 0.208 0.19
Correlation +7 32.6086956521739 16.3265306122449 +7 0.202 0.185-0.838022023794689 +14 19.5652173913043 18.3673469387755 +14 0.21 0.179-0.123430442777081 0.032 0.019
0.00599999999999998 0.0115 0 0.007999999999999980.00600000000000001
17 32 15.841584158415810.614525139664815 8 2.970297029702966.14525139664805
9 9 3.960396039603953.35195530726257
Line Spa Group D Group N0.8 2 5 45 481 15 19 45 481.2 18 19 45 481.4 10 5 45 48
Line Spa Group D Group N Line Spa Group D Group N0.8 4.44444444444444 10.4166666666667 0.8 0.233 0.2061 33.3333333333333 39.5833333333333 1 0.236 0.207
Correlation 1.2 40 39.5833333333333 1.2 0.237 0.2050.451017032441845 1.4 22.2222222222222 10.4166666666667 1.4 0.226 0.2040.447213595499958 0.00700000000000001 0.001
0.00999999999999998 -0.0010.011 -0.002
3.097345132743370.4854368932038844.42477876106194-0.4854368932038844.86725663716813-0.970873786407768
Par Spacing Group D Group N0.4 23 4 131 381 43 10 131 382 30 22 131 383 35 2 131 38
Par Spacing Group D Group N Par Spacing Group D Group N0.4 17.5572519083969 10.5263157894737 0.4 0.233 0.1981 32.824427480916 26.3157894736842 1 0.228 0.198
Correlation 2 22.9007633587786 57.8947368421053 2 0.22 0.196-0.274103716415761 3 26.7175572519084 5.26315789473684 3 0.221 0.197-0.676968662049936 0.013 0.002
0.00800000000000001 0.0020.001 0.001
5.909090909090911.020408163265313.636363636363641.020408163265310.4545454545454550.510204081632654
Column Width Group D Group N22 12 1 44 4444 14 24 44 4466 14 16 44 4488 4 3 44 44
Column Width Group D Group N Column Width Group D Group N22 27.2727272727273 2.27272727272727 22 0.219 0.19144 31.8181818181818 54.5454545454545 44 0.214 0.19
Correlation 66 31.8181818181818 36.3636363636364 66 0.221 0.1870.402618283010223 88 9.09090909090909 6.81818181818182 88 0.215 0.187-0.0148014204124575 0.005 0.004
0.00700000000000001 0.0031 0.001 02 2.336448598130842.139037433155083 3.271028037383181.604278074866314 0.467289719626169 05678
Colors Group D Group Nblack-white 5 15 46 65
blackoff-whiteoff 2 9 46 65yellow-black 15 11 46 65blue-white 5 4 46 65
brown-green 3 0 46 65black-creme 7 16 46 65
dark brown-green 4 3 46 65yellow-blue 5 7 46 65
Colors Group D Group N Colors Group D Group Nblack-creme black-white 10.8695652173913 23.0769230769231 black-creme 0.208 0.187yellow-blue blackoff-whiteoff 4.34782608695652 13.8461538461538 yellow-blue 0.214 0.182
brown-green yellow-black 32.6086956521739 16.9230769230769 brown-green 0.221 0.194blackoff-whiteoff blue-white 10.8695652173913 6.15384615384615 blackoff-whiteoff 0.222 0.201
black-white brown-green 6.52173913043478 0 black-white 0.223 0.195blue-white black-creme 15.2173913043478 24.6153846153846 blue-white 0.228 0.18
dark brown-green dark brown-green 8.69565217391304 4.61538461538461 dark brown-green 0.228 0.203yellow-black yellow-blue 10.8695652173913 10.7692307692308 yellow-black 0.23 0.189
black-creme 15.2173913043478 24.6153846153846 0.006000000000000010.00700000000000001yellow-blue 10.8695652173913 10.7692307692308 0.013 0.002brown-green 6.52173913043478 0 0.014 0.014blackoff-whiteoff 4.34782608695652 13.8461538461538 0.015 0.021black-white 10.8695652173913 23.0769230769231 0.02 0.015blue-white 10.8695652173913 6.15384615384615 0.02 0
Correlation dark brown-green 8.69565217391304 4.61538461538461 0.022 0.023yellow-black 32.6086956521739 16.9230769230769 0.00900000000000001
black-creme0.0918053760955382 yellow-blue 2.884615384615393.88888888888889black-creme 3.88888888888889-0.735791591345596 brown-green 6.250000000000011.11111111111111yellow-blue 1.11111111111111
blackoff-whiteoff 6.730769230769247.77777777777778brown-green 7.77777777777778black-white 7.2115384615384711.6666666666667blackoff-
whiteoff11.6666666666667
blue-white 9.615384615384628.33333333333334black-white 8.33333333333334dark brown-green 9.61538461538462 0 blue-white 0
yellow-black 10.576923076923112.7777777777778dark brown-green
12.7777777777778
5 yellow-black 5
Text Grey Scale
0
25
50
75
100
0% 25% 50% 75%Group D Group C
Chart 2
0
15
30
45
60
Untitled 1 Untitled 2 Untitled 3 Untitled 4
Back Contrast Colors
Background Grey Scale
0
15
30
45
60
0% 25% 50% 75%Group D Group C
Font Size
0
20
40
60
80
14 18 22 26Group D Group C
Character Spacing
0
17.5
35
52.5
70
–7% 0% +7% +14%Group D Group C
Line Spacing
0
10
20
30
40
0.8 1 1.2 1.4Group D Group C
Paragraph Spacing
0
15
30
45
60
0.5 1 2 3Group D Group C
Column Width
0
15
30
45
60
22 44 66 88Group D Group C
Text and Background Colors
0
10
20
30
40
Group D Group C
Text Grey Scale
0.1
0.138
0.175
0.213
0.25
0% 25% 50% 75%Group D Group C
Background Grey Scale
0.1
0.138
0.175
0.213
0.25
0% 25% 50% 75%Group D Group C
Text and Background Colors
0.1
0.138
0.175
0.213
0.25
Group D Group C
Font Size
0.1
0.138
0.175
0.213
0.25
14 18 22 26Group D Group C
Line Spacing
0.1
0.138
0.175
0.213
0.25
0.8 1 1.2 1.4Group D Group C
Paragraph Spacing
0.1
0.138
0.175
0.213
0.25
0.5 1 2 3Group D Group C
Column Width
0.1
0.138
0.175
0.213
0.25
22 44 66 88Group D Group C
Character Spacing
0.1
0.138
0.175
0.213
0.25
–7% 0% +7% +14%Group D Group C
lines lines lines lines
lines lines
char. char.
grey grey
grey grey
brown/g
reen
dark b
rown/
light g
reen
black/
yellow
blue/y
ellow
blue/w
hite
black/
creme
black
off/
white offbla
ck/whit
e
brown/g
reen
dark b
rown/
light g
reen
black/
yellow
blue/y
ellow
blue/w
hite
black/
creme
black
off/
white off
black/
white
points points
char. char.
Fixa
tion
Dura
tion
(sec
.)
Pref
eren
ce R
atin
g (%
)Pr
efer
ence
Rat
ing
(%)
Pref
eren
ce R
atin
g (%
)Pr
efer
ence
Rat
ing
(%)
Pref
eren
ce R
atin
g (%
)Pr
efer
ence
Rat
ing
(%)
Pref
eren
ce R
atin
g (%
)
Pref
eren
ce R
atin
g (%
)
Fixa
tion
Dura
tion
(sec
.)Fi
xatio
n Du
ratio
n (s
ec.)
Fixa
tion
Dura
tion
(sec
.)
Fixa
tion
Dura
tion
(sec
.)Fi
xatio
n Du
ratio
n (s
ec.)
Fixa
tion
Dura
tion
(sec
.)Fi
xatio
n Du
ratio
n (s
ec.)
– Finally, a Pearson’s Chi-squared test to show effects
on the participants’ choices.
Please refer to Table 2 for all the means and stan-
dard deviations.
5.1 Grey Text (White Background)
Main effects: With two-way ANOVA, significant main
effects were found for the groups (F (1, 366) =
14.520, p < 0.001) on fixation duration. However, no
effects of text grey scale (F (3, 366) = 0.086, p = 0.968)
on fixation duration were found. There were no interac-
tion effects of text grey scale and the group (F (3, 366) =
1.400, p = 0.242) either. The results of the post-hoc
tests show that:
- Participants with dyslexia had significantly longer
fixation times (x = 0.234, s = 0.08 seconds) than
the participants without dyslexia (x = 0.206, s =
0.06 seconds, p < 0.001) (Table 2).
Within Groups: There was no significant effect of text
grey scale on fixation duration for group D (F (3, 183) =
0.459, p = 0.711) nor for group C (F (3, 183) =
1.305, p = 0.274).
Preferences: Participants with and without dyslexia
found black text significantly more readable than
text presented with different grey scales (χ2(3) =
15.128, p = 0.002 for group D and χ2(3) = 39.869, p <
0.001 for group C).
See Figure 2 for the fixation duration means and
preferences.
5.2 Grey Background (White Text)
Main effects: With two-way ANOVA, significant main
effects were found for the groups (F (1, 376) =
14.630, p < 0.001) on fixation duration. However there
were no effects of background grey scale (F (3, 376) =
10
Conditions Group D Group C Group D Group Cx± s % x± s % % %
Grey Text (white background) Fixation Duration Preference Rating0% (black) 0.24±0.07 7.62 0.19±0.05 – 60.00 93.8825% 0.22±0.08 – 0.22±0.07 11.86 32.60 6.1250% 0.23±0.09 4.48 0.21±0.06 8.76 4.35 –75% 0.24±0.09 7.62 0.20±0.06 5.15 2.17 –
Grey Background (white text) Fixation Duration Preference Rating0% (black) 0.24±0.09 3.96 0.21±0.06 3.48 55.32 58.3325% 0.23±0.07 – 0.21±0.06 3.98 25.53 35.4250% 0.24±0.07 4.85 0.20±0.06 – 19.15 6.2575% 0.24±0.09 4.41 0.21±0.07 4.98 – –
Text/Background Colors Fixation Duration Preference Ratingblack/creme 0.21±0.07 – 0.19±0.05 3.89 15.22 24.62blue/yellow 0.21±0.08 2.88 0.18±0.05 1.11 10.87 10.78green/brown 0.22±0.07 6.25 0.19±0.06 7.78 6.52 –off-black/off-white 0.22±0.08 6.73 0.20±0.06 11.67 4.35 13.85black/white 0.22±0.07 7.21 0.20±0.06 8.33 10.87 23.08light green/dark brown 0.23±0.07 9.62 0.20±0.04 12.78 8.70 4.62blue/white 0.23±0.07 9.62 0.18±0.05 – 10.87 6.15black/yellow 0.23±0.09 10.58 0.19±0.05 5.00 32.61 16.92
Font Size Fixation Duration Preference Rating14 points 0.26±0.09 24.52 0.22±0.07 19.89 – –18 points 0.23±0.07 12.02 0.20±0.05 7.53 10.42 6.8222 points 0.22±0.06 3.85 0.20±0.05 6.45 39.58 34.0926 points 0.21±0.05 – 0.19±0.04 – 50.00 59.09
Character Spacing Fixation Duration Preference Rating-7% 0.23±0.09 15.84 0.20±0.06 10.61 10.87 –0% 0.21±0.07 2.97 0.19±0.05 6.15 36.96 65.31+7% 0.20±0.06 – 0.19±0.05 3.35 32.60 16.33+14% 0.21 ±0.06 3.96 0.18±0.05 – 19.57 18.37
Line Spacing Fixation Duration Preference Rating0.8 lines 0.23±0.07 3.10 0.21±0.05 0.98 4.44 10.421 line 0.24±0.07 4.42 0.21±0.05 1.47 33.33 39.581.2 lines 0.24±0.07 4.87 0.21±0.06 0.49 40.00 39.581.4 lines 0.23±0.06 – 0.20±0.06 – 22.22 10.42
Paragraph Spacing Fixation Duration Preference Rating0.5 lines 0.23±0.06 5.90 0.20±0.05 1.02 17.56 10.531 line 0.23±0.06 3.64 0.20±0.05 1.02 32.82 26.322 lines 0.22±0.05 – 0.20±0.04 – 22.90 57.893 lines 0.22±0.05 0.45 0.20±0.05 0.51 26.72 5.26
Column Width Fixation Duration Preference Rating22 char./line 0.22±0.06 2.34 0.19±0.04 2.14 27.27 2.2744 char./line 0.21±0.06 – 0.19±0.05 1.60 31.81 54.5566 char./line 0.22±0.06 3.27 0.19±0.04 – 31.81 36.3688 char./line 0.22±0.05 0.47 0.19±0.04 – 9.09 6.82
Table 2 Fixation Duration and Preference Rating results for group D (N = 45) and group C (N = 44). The averagefixation time results and the standard deviation are presented in seconds and the percentage shows their fixation extra timein comparison with the lowest value. Numbers in boldface indicate the best cases.
0.136, p = 0.938) on fixation duration. Moreover, there
were no interaction effects of background grey scale and
groups (F (3, 376) = 0.252, p = 0.860). The results of
the post-hoc tests show that:
- Participants with dyslexia had significantly longer
fixation durations (x = 0.235, s = 0.08 seconds)
than the participants without dyslexia (x = 0.207,
s = 0.06 seconds, p < 0.001) (Table 2).
Within Groups: No significant effect of background
grey scale was found on fixation duration in group
D (F (3, 188) = 0.188, p = 0.904), or in group C
(F (3, 188) = 0.204, p = 0.893).
Preferences: Participants with and without dyslexia
found pure black background significantly more read-
able than text presented with different grey scales
(χ2(3) = 11.101, p = 0.011 for group D and χ2(3) =

11
Fig. 4 Participants’ reading performance (fixation durationmean) and preference ratings in % for text and backgroundcolors.
Non_Dys Font Contrast Back Contrast
Colors Size Chart Spa Line Spa Par Spacing Column Width
1 46 3 0 5 32 5 2 32 0 28 3 19 9 19 10 243 0 17 16 24 0 5 22 164 3 0 7 0 8 19 8 15 96 117 158 4
Scale-0 = 1 Scale-0 = 2 Color-blackoff-whiteoff = 5 Size-14 = 4 Spacing +14 = 2 Line Spacing 0.8 = 3 Spacing .4 = 4 Column width 1/4 = 4
Scale-25 = 4 Scale-25 = 3 Color-yellow-black = 6 Size-18= 3 Spacing +7 = 4 Line Spacing 1 = 4 Spacing 2 = 3 Column width 2/4 = 3
Scale-50 = 3 Scale-50 = 1 Color-blue-white = 8 Size-22= 2 Spacing 0 = 1 Line Spacing 1.4 = 1 Spacing 1 = 2 Column width 3/4 = 2
Scale-75 = 2 Scale-75 = 4 Color-brown-green = 1 Size-26= 1 Spacing -7 = 3 Line Spacing 1.2 = 2 Spacing 3 = 1 Column width 4/4 = 1
Color-black-creme = 3Color-dark brown-green = 2
Color-yellow-blue = 4Color-black-white = 7
Font Contrast Back Contrast
Colors Size Chart Spa Line Spa Par Spacing Column Width
1 2 12 5 0 5 2 23 42 15 0 2 3 15 15 30 143 27 9 15 15 17 18 43 144 1 26 5 26 9 10 35 125 36 77 48 5
Scale-0 = 3 Scale-0 = 4 Color-black-white = 1 Size-14 = 1 Spacing +14 = 4 Line Spacing 0.8 = 1 Spacing .4 = 1 Column width 1/4 = 1
Scale-25 = 2 Scale-25 = 1 Color-blackoff-whiteoff = 2 Size-18= 2 Spacing +7 = 2 Line Spacing 1 = 2 Spacing 2 = 2 Column width 2/4 = 2
Scale-50 = 1 Scale-50 = 3 Color-yellow-black = 3 Size-22= 3 Spacing 0 = 3 Line Spacing 1.4 = 4 Spacing 1 = 3 Column width 3/4 = 3
Scale-75 = 4 Scale-75 = 2 Color-blue-white = 4 Size-26= 4 Spacing -7 = 1 Line Spacing 1.2 = 3 Spacing 3 = 4 Column width 4/4 = 4
Color-brown-green = 5Color-black-creme = 6
Color-dark brown-green = 7Color-yellow-blue = 8
Font Contrast Group D Group N Font Contrast Group D Group N0% 27 46 45 49 0%75% 15 3 46 49 75%50% 2 0 46 49 50%25% 1 0 46 49 25%
Font Contrast Group D Group N Font Contrast Group D Group N0% 60 93.8775510204082 0% 0.24 0.19425% 32.6086956521739 6.12244897959184 25% 0.223 0.21750% 4.34782608695652 0 50% 0.233 0.211
Correlation 75% 2.17391304347826 0 75% 0.24 0.204-0.968445715719153 99.1304347826087 100 0.017 0.023-0.993869371230394 0.01 0.017
Back Contrast Group D Group N 0.017 0.00999999999999998100% 26 28 47 48 7.6233183856502211.855670103092825% 12 17 47 48 4.484304932735438.7628865979381450% 9 3 47 48 7.623318385650225.1546391752577275% 0 0 47 48
Back Contrast Group D Group N Back Contrast Group D Group N100% 55.3191489361702 58.3333333333333 0% 0.236 0.20825% 25.531914893617 35.4166666666667 25% 0.227 0.209
Correlation 50% 19.1489361702128 6.25 50% 0.238 0.201-0.118995939068828 75% 0 0 75% 0.237 0.2110.188839041314493 0.008999999999999980.00699999999999998
0.011 0.007999999999999980.009999999999999980.009999999999999983.964757709251093.48258706467661
Size Group D Group N 4.845814977973563.9800995024875514 0 0 46 44 4.405286343612334.9751243781094418 2 3 48 4422 10 15 48 4426 34 26 48 44
Size Group D Group N Size Group D Group N14 0 0 14 0.259 0.22318 4.16666666666667 6.81818181818182 18 0.233 0.2
Correlation 22 20.8333333333333 34.0909090909091 22 0.216 0.198-0.791535362594822 26 70.8333333333333 59.0909090909091 26 0.208 0.186-0.852378048645091 0.051 0.037
0.025 0.0140.00800000000000001 0.012
14 24.519230769230819.892473118279618 12.01923076923087.5268817204301122 3.846153846153856.45161290322581
Chart Spa Group D Group N-7 5 0 46 490 17 32 46 49+7 15 8 46 49+14 9 9 46 49
Chart Spa Group D Group N Chart Spa Group D Group N-7 10.8695652173913 0 -7 0.234 0.1980 36.9565217391304 65.3061224489796 0 0.208 0.19
Correlation +7 32.6086956521739 16.3265306122449 +7 0.202 0.185-0.838022023794689 +14 19.5652173913043 18.3673469387755 +14 0.21 0.179-0.123430442777081 0.032 0.019
0.00599999999999998 0.0115 0 0.007999999999999980.00600000000000001
17 32 15.841584158415810.614525139664815 8 2.970297029702966.145251396648059 9 3.960396039603953.35195530726257
Line Spa Group D Group N0.8 2 5 45 481 15 19 45 481.2 18 19 45 481.4 10 5 45 48
Line Spa Group D Group N Line Spa Group D Group N0.8 4.44444444444444 10.4166666666667 0.8 0.233 0.2061 33.3333333333333 39.5833333333333 1 0.236 0.207
Correlation 1.2 40 39.5833333333333 1.2 0.237 0.2050.451017032441845 1.4 22.2222222222222 10.4166666666667 1.4 0.226 0.2040.447213595499958 0.00700000000000001 0.001
0.00999999999999998 -0.0010.011 -0.002
3.097345132743370.4854368932038844.42477876106194-0.4854368932038844.86725663716813-0.970873786407768
Par Spacing Group D Group N0.4 23 4 131 381 43 10 131 382 30 22 131 383 35 2 131 38
Par Spacing Group D Group N Par Spacing Group D Group N0.4 17.5572519083969 10.5263157894737 0.4 0.233 0.1981 32.824427480916 26.3157894736842 1 0.228 0.198
Correlation 2 22.9007633587786 57.8947368421053 2 0.22 0.196-0.274103716415761 3 26.7175572519084 5.26315789473684 3 0.221 0.197-0.676968662049936 0.013 0.002
0.00800000000000001 0.0020.001 0.001
5.909090909090911.020408163265313.636363636363641.020408163265310.4545454545454550.510204081632654
Column Width Group D Group N22 12 1 44 4444 14 24 44 4466 14 16 44 4488 4 3 44 44
Column Width Group D Group N Column Width Group D Group N22 27.2727272727273 2.27272727272727 22 0.219 0.19144 31.8181818181818 54.5454545454545 44 0.214 0.19
Correlation 66 31.8181818181818 36.3636363636364 66 0.221 0.1870.402618283010223 88 9.09090909090909 6.81818181818182 88 0.215 0.187-0.0148014204124575 0.005 0.004
0.00700000000000001 0.0031 0.001 02 2.336448598130842.139037433155083 3.271028037383181.604278074866314 0.467289719626169 05678
Colors Group D Group Nblack-white 5 15 46 65
blackoff-whiteoff 2 9 46 65yellow-black 15 11 46 65blue-white 5 4 46 65
brown-green 3 0 46 65black-creme 7 16 46 65
dark brown-green 4 3 46 65yellow-blue 5 7 46 65
Colors Group D Group N Colors Group D Group Nblack-creme black-white 10.8695652173913 23.0769230769231 black-creme 0.208 0.187yellow-blue blackoff-whiteoff 4.34782608695652 13.8461538461538 yellow-blue 0.214 0.182
brown-green yellow-black 32.6086956521739 16.9230769230769 brown-green 0.221 0.194blackoff-whiteoff blue-white 10.8695652173913 6.15384615384615 blackoff-whiteoff 0.222 0.201
black-white brown-green 6.52173913043478 0 black-white 0.223 0.195blue-white black-creme 15.2173913043478 24.6153846153846 blue-white 0.228 0.18
dark brown-green dark brown-green 8.69565217391304 4.61538461538461 dark brown-green 0.228 0.203yellow-black yellow-blue 10.8695652173913 10.7692307692308 yellow-black 0.23 0.189
black-creme 15.2173913043478 24.6153846153846 0.006000000000000010.00700000000000001yellow-blue 10.8695652173913 10.7692307692308 0.013 0.002brown-green 6.52173913043478 0 0.014 0.014blackoff-whiteoff 4.34782608695652 13.8461538461538 0.015 0.021black-white 10.8695652173913 23.0769230769231 0.02 0.015blue-white 10.8695652173913 6.15384615384615 0.02 0
Correlation dark brown-green 8.69565217391304 4.61538461538461 0.022 0.023yellow-black 32.6086956521739 16.9230769230769 0.00900000000000001
black-creme0.0918053760955382 yellow-blue 2.884615384615393.88888888888889black-creme 3.88888888888889-0.735791591345596 brown-green 6.250000000000011.11111111111111yellow-blue 1.11111111111111
blackoff-whiteoff 6.730769230769247.77777777777778brown-green 7.77777777777778black-white 7.2115384615384711.6666666666667blackoff-
whiteoff11.6666666666667
blue-white 9.615384615384628.33333333333334black-white 8.33333333333334dark brown-green 9.61538461538462 0 blue-white 0
yellow-black 10.576923076923112.7777777777778dark brown-green
12.7777777777778
5 yellow-black 5
Text Grey Scale
0
25
50
75
100
0% 25% 50% 75%Group D Group C
Chart 2
0
15
30
45
60
Untitled 1 Untitled 2 Untitled 3 Untitled 4
Back Contrast Colors
Background Grey Scale
0
15
30
45
60
0% 25% 50% 75%Group D Group C
Font Size
0
20
40
60
80
14 18 22 26Group D Group C
Character Spacing
0
17.5
35
52.5
70
–7% 0% +7% +14%Group D Group C
Line Spacing
0
10
20
30
40
0.8 1 1.2 1.4Group D Group C
Paragraph Spacing
0
15
30
45
60
0.5 1 2 3Group D Group C
Column Width
0
15
30
45
60
22 44 66 88Group D Group C
Text and Background Colors
0
10
20
30
40
Group D Group C
Text Grey Scale
0.1
0.138
0.175
0.213
0.25
0% 25% 50% 75%Group D Group C
Background Grey Scale
0.1
0.138
0.175
0.213
0.25
0% 25% 50% 75%Group D Group C
Text and Background Colors
0.1
0.138
0.175
0.213
0.25
Group D Group C
Font Size
0.1
0.138
0.175
0.213
0.25
14 18 22 26Group D Group C
Line Spacing
0.1
0.138
0.175
0.213
0.25
0.8 1 1.2 1.4Group D Group C
Paragraph Spacing
0.1
0.138
0.175
0.213
0.25
0.5 1 2 3Group D Group C
Column Width
0.1
0.138
0.175
0.213
0.25
22 44 66 88Group D Group C
Character Spacing
0.1
0.138
0.175
0.213
0.25
–7% 0% +7% +14%Group D Group C
lines lines lines lines
lines lines
char. char.
grey grey
grey grey
brown/g
reen
dark b
rown/
light g
reen
black/
yellow
blue/y
ellow
blue/w
hite
black/
creme
black
off/
white offbla
ck/whit
e
brown/g
reen
dark b
rown/
light g
reen
black/
yellow
blue/y
ellow
blue/w
hite
black/
creme
black
off/
white off
black/
white
points points
char. char.
Fixa
tion
Dura
tion
(sec
.)
Pref
eren
ce R
atin
g (%
)Pr
efer
ence
Rat
ing
(%)
Pref
eren
ce R
atin
g (%
)Pr
efer
ence
Rat
ing
(%)
Pref
eren
ce R
atin
g (%
)Pr
efer
ence
Rat
ing
(%)
Pref
eren
ce R
atin
g (%
)
Pref
eren
ce R
atin
g (%
)
Fixa
tion
Dura
tion
(sec
.)Fi
xatio
n Du
ratio
n (s
ec.)
Fixa
tion
Dura
tion
(sec
.)
Fixa
tion
Dura
tion
(sec
.)Fi
xatio
n Du
ratio
n (s
ec.)
Fixa
tion
Dura
tion
(sec
.)Fi
xatio
n Du
ratio
n (s
ec.)
21.790, p < 0.001 for group C). See Figure 3 for the
fixation duration means and preferences.
5.3 Text and Background Colors
Main effects: With two-way ANOVA, significant main
effects were found for the groups (F (1, 732) =
40.028, p < 0.001) on fixation duration. However,
no effects of text and background colors (F (7, 732) =
0.848, p = 0.548) were found on fixation duration.
Moreover, no interaction effects of text and background
colors and groups (F (7, 732) = 0.528, p = 0.814) have
been found either. The results of the post-hoc tests
show that:
- Participants with dyslexia had significantly longer
fixation durations (x = 0.221, s = 0.08 seconds)
than the participants without dyslexia (x = 0.193,
s = 0.06 seconds, p < 0.001) (Table 2).
Within Groups: There was no significant effect of text
and background colors on fixation duration for group
D (F (7, 366) = 0.467, p = 0.858) nor for group C
(F (7, 366) = 1.149, p = 0.332).
Preferences: Participants with and without dyslexia
did not find any of the text and background colors sig-
Fig. 5 Participants’ reading performance (fixation durationmean) and preference ratings in % for font size.
Non_Dys Font Contrast Back Contrast
Colors Size Chart Spa Line Spa Par Spacing Column Width
1 46 3 0 5 32 5 2 32 0 28 3 19 9 19 10 243 0 17 16 24 0 5 22 164 3 0 7 0 8 19 8 15 96 117 158 4
Scale-0 = 1 Scale-0 = 2 Color-blackoff-whiteoff = 5 Size-14 = 4 Spacing +14 = 2 Line Spacing 0.8 = 3 Spacing .4 = 4 Column width 1/4 = 4
Scale-25 = 4 Scale-25 = 3 Color-yellow-black = 6 Size-18= 3 Spacing +7 = 4 Line Spacing 1 = 4 Spacing 2 = 3 Column width 2/4 = 3
Scale-50 = 3 Scale-50 = 1 Color-blue-white = 8 Size-22= 2 Spacing 0 = 1 Line Spacing 1.4 = 1 Spacing 1 = 2 Column width 3/4 = 2
Scale-75 = 2 Scale-75 = 4 Color-brown-green = 1 Size-26= 1 Spacing -7 = 3 Line Spacing 1.2 = 2 Spacing 3 = 1 Column width 4/4 = 1
Color-black-creme = 3Color-dark brown-green = 2
Color-yellow-blue = 4Color-black-white = 7
Font Contrast Back Contrast
Colors Size Chart Spa Line Spa Par Spacing Column Width
1 2 12 5 0 5 2 23 42 15 0 2 3 15 15 30 143 27 9 15 15 17 18 43 144 1 26 5 26 9 10 35 125 36 77 48 5
Scale-0 = 3 Scale-0 = 4 Color-black-white = 1 Size-14 = 1 Spacing +14 = 4 Line Spacing 0.8 = 1 Spacing .4 = 1 Column width 1/4 = 1
Scale-25 = 2 Scale-25 = 1 Color-blackoff-whiteoff = 2 Size-18= 2 Spacing +7 = 2 Line Spacing 1 = 2 Spacing 2 = 2 Column width 2/4 = 2
Scale-50 = 1 Scale-50 = 3 Color-yellow-black = 3 Size-22= 3 Spacing 0 = 3 Line Spacing 1.4 = 4 Spacing 1 = 3 Column width 3/4 = 3
Scale-75 = 4 Scale-75 = 2 Color-blue-white = 4 Size-26= 4 Spacing -7 = 1 Line Spacing 1.2 = 3 Spacing 3 = 4 Column width 4/4 = 4
Color-brown-green = 5Color-black-creme = 6
Color-dark brown-green = 7Color-yellow-blue = 8
Font Contrast Group D Group N Font Contrast Group D Group N0% 27 46 45 49 0%75% 15 3 46 49 75%50% 2 0 46 49 50%25% 1 0 46 49 25%
Font Contrast Group D Group N Font Contrast Group D Group N0% 60 93.8775510204082 0% 0.24 0.19425% 32.6086956521739 6.12244897959184 25% 0.223 0.21750% 4.34782608695652 0 50% 0.233 0.211
Correlation 75% 2.17391304347826 0 75% 0.24 0.204-0.968445715719153 99.1304347826087 100 0.017 0.023-0.993869371230394 0.01 0.017
Back Contrast Group D Group N 0.017 0.00999999999999998100% 26 28 47 48 7.6233183856502211.855670103092825% 12 17 47 48 4.484304932735438.7628865979381450% 9 3 47 48 7.623318385650225.1546391752577275% 0 0 47 48
Back Contrast Group D Group N Back Contrast Group D Group N100% 55.3191489361702 58.3333333333333 0% 0.236 0.20825% 25.531914893617 35.4166666666667 25% 0.227 0.209
Correlation 50% 19.1489361702128 6.25 50% 0.238 0.201-0.118995939068828 75% 0 0 75% 0.237 0.2110.188839041314493 0.008999999999999980.00699999999999998
0.011 0.007999999999999980.009999999999999980.009999999999999983.964757709251093.48258706467661
Size Group D Group N 4.845814977973563.9800995024875514 0 0 46 44 4.405286343612334.9751243781094418 2 3 48 4422 10 15 48 4426 34 26 48 44
Size Group D Group N Size Group D Group N14 0 0 14 0.259 0.22318 4.16666666666667 6.81818181818182 18 0.233 0.2
Correlation 22 20.8333333333333 34.0909090909091 22 0.216 0.198-0.791535362594822 26 70.8333333333333 59.0909090909091 26 0.208 0.186-0.852378048645091 0.051 0.037
0.025 0.0140.00800000000000001 0.012
14 24.519230769230819.892473118279618 12.01923076923087.5268817204301122 3.846153846153856.45161290322581
Chart Spa Group D Group N-7 5 0 46 490 17 32 46 49+7 15 8 46 49+14 9 9 46 49
Chart Spa Group D Group N Chart Spa Group D Group N-7 10.8695652173913 0 -7 0.234 0.1980 36.9565217391304 65.3061224489796 0 0.208 0.19
Correlation +7 32.6086956521739 16.3265306122449 +7 0.202 0.185-0.838022023794689 +14 19.5652173913043 18.3673469387755 +14 0.21 0.179-0.123430442777081 0.032 0.019
0.00599999999999998 0.0115 0 0.007999999999999980.00600000000000001
17 32 15.841584158415810.614525139664815 8 2.970297029702966.14525139664805
9 9 3.960396039603953.35195530726257
Line Spa Group D Group N0.8 2 5 45 481 15 19 45 481.2 18 19 45 481.4 10 5 45 48
Line Spa Group D Group N Line Spa Group D Group N0.8 4.44444444444444 10.4166666666667 0.8 0.233 0.2061 33.3333333333333 39.5833333333333 1 0.236 0.207
Correlation 1.2 40 39.5833333333333 1.2 0.237 0.2050.451017032441845 1.4 22.2222222222222 10.4166666666667 1.4 0.226 0.2040.447213595499958 0.00700000000000001 0.001
0.00999999999999998 -0.0010.011 -0.002
3.097345132743370.4854368932038844.42477876106194-0.4854368932038844.86725663716813-0.970873786407768
Par Spacing Group D Group N0.4 23 4 131 381 43 10 131 382 30 22 131 383 35 2 131 38
Par Spacing Group D Group N Par Spacing Group D Group N0.4 17.5572519083969 10.5263157894737 0.4 0.233 0.1981 32.824427480916 26.3157894736842 1 0.228 0.198
Correlation 2 22.9007633587786 57.8947368421053 2 0.22 0.196-0.274103716415761 3 26.7175572519084 5.26315789473684 3 0.221 0.197-0.676968662049936 0.013 0.002
0.00800000000000001 0.0020.001 0.001
5.909090909090911.020408163265313.636363636363641.020408163265310.4545454545454550.510204081632654
Column Width Group D Group N22 12 1 44 4444 14 24 44 4466 14 16 44 4488 4 3 44 44
Column Width Group D Group N Column Width Group D Group N22 27.2727272727273 2.27272727272727 22 0.219 0.19144 31.8181818181818 54.5454545454545 44 0.214 0.19
Correlation 66 31.8181818181818 36.3636363636364 66 0.221 0.1870.402618283010223 88 9.09090909090909 6.81818181818182 88 0.215 0.187-0.0148014204124575 0.005 0.004
0.00700000000000001 0.0031 0.001 02 2.336448598130842.139037433155083 3.271028037383181.604278074866314 0.467289719626169 05678
Colors Group D Group Nblack-white 5 15 46 65
blackoff-whiteoff 2 9 46 65yellow-black 15 11 46 65blue-white 5 4 46 65
brown-green 3 0 46 65black-creme 7 16 46 65
dark brown-green 4 3 46 65yellow-blue 5 7 46 65
Colors Group D Group N Colors Group D Group Nblack-creme black-white 10.8695652173913 23.0769230769231 black-creme 0.208 0.187yellow-blue blackoff-whiteoff 4.34782608695652 13.8461538461538 yellow-blue 0.214 0.182
brown-green yellow-black 32.6086956521739 16.9230769230769 brown-green 0.221 0.194blackoff-whiteoff blue-white 10.8695652173913 6.15384615384615 blackoff-whiteoff 0.222 0.201
black-white brown-green 6.52173913043478 0 black-white 0.223 0.195blue-white black-creme 15.2173913043478 24.6153846153846 blue-white 0.228 0.18
dark brown-green dark brown-green 8.69565217391304 4.61538461538461 dark brown-green 0.228 0.203yellow-black yellow-blue 10.8695652173913 10.7692307692308 yellow-black 0.23 0.189
black-creme 15.2173913043478 24.6153846153846 0.006000000000000010.00700000000000001yellow-blue 10.8695652173913 10.7692307692308 0.013 0.002brown-green 6.52173913043478 0 0.014 0.014blackoff-whiteoff 4.34782608695652 13.8461538461538 0.015 0.021black-white 10.8695652173913 23.0769230769231 0.02 0.015blue-white 10.8695652173913 6.15384615384615 0.02 0
Correlation dark brown-green 8.69565217391304 4.61538461538461 0.022 0.023yellow-black 32.6086956521739 16.9230769230769 0.00900000000000001
black-creme0.0918053760955382 yellow-blue 2.884615384615393.88888888888889black-creme 3.88888888888889-0.735791591345596 brown-green 6.250000000000011.11111111111111yellow-blue 1.11111111111111
blackoff-whiteoff 6.730769230769247.77777777777778brown-green 7.77777777777778black-white 7.2115384615384711.6666666666667blackoff-
whiteoff11.6666666666667
blue-white 9.615384615384628.33333333333334black-white 8.33333333333334dark brown-green 9.61538461538462 0 blue-white 0
yellow-black 10.576923076923112.7777777777778dark brown-green
12.7777777777778
5 yellow-black 5
Text Grey Scale
0
25
50
75
100
0% 25% 50% 75%Group D Group C
Chart 2
0
15
30
45
60
Untitled 1 Untitled 2 Untitled 3 Untitled 4
Back Contrast Colors
Background Grey Scale
0
15
30
45
60
0% 25% 50% 75%Group D Group C
Font Size
0
20
40
60
80
14 18 22 26Group D Group C
Character Spacing
0
17.5
35
52.5
70
–7% 0% +7% +14%Group D Group C
Line Spacing
0
10
20
30
40
0.8 1 1.2 1.4Group D Group C
Paragraph Spacing
0
15
30
45
60
0.5 1 2 3Group D Group C
Column Width
0
15
30
45
60
22 44 66 88Group D Group C
Text and Background Colors
0
10
20
30
40
Group D Group C
Text Grey Scale
0.1
0.138
0.175
0.213
0.25
0% 25% 50% 75%Group D Group C
Background Grey Scale
0.1
0.138
0.175
0.213
0.25
0% 25% 50% 75%Group D Group C
Text and Background Colors
0.1
0.138
0.175
0.213
0.25
Group D Group C
Font Size
0.1
0.138
0.175
0.213
0.25
14 18 22 26Group D Group C
Line Spacing
0.1
0.138
0.175
0.213
0.25
0.8 1 1.2 1.4Group D Group C
Paragraph Spacing
0.1
0.138
0.175
0.213
0.25
0.5 1 2 3Group D Group C
Column Width
0.1
0.138
0.175
0.213
0.25
22 44 66 88Group D Group C
Character Spacing
0.1
0.138
0.175
0.213
0.25
–7% 0% +7% +14%Group D Group C
lines lines lines lines
lines lines
char. char.
grey grey
grey grey
brown/g
reen
dark b
rown/
light g
reen
black/
yellow
blue/y
ellow
blue/w
hite
black/
creme
black
off/
white offbla
ck/whit
e
brown/g
reen
dark b
rown/
light g
reen
black/
yellow
blue/y
ellow
blue/w
hite
black/
creme
black
off/
white off
black/
white
points points
char. char.
Fixa
tion
Dura
tion
(sec
.)
Pref
eren
ce R
atin
g (%
)Pr
efer
ence
Rat
ing
(%)
Pref
eren
ce R
atin
g (%
)Pr
efer
ence
Rat
ing
(%)
Pref
eren
ce R
atin
g (%
)Pr
efer
ence
Rat
ing
(%)
Pref
eren
ce R
atin
g (%
)
Pref
eren
ce R
atin
g (%
)
Fixa
tion
Dura
tion
(sec
.)Fi
xatio
n Du
ratio
n (s
ec.)
Fixa
tion
Dura
tion
(sec
.)
Fixa
tion
Dura
tion
(sec
.)Fi
xatio
n Du
ratio
n (s
ec.)
Fixa
tion
Dura
tion
(sec
.)Fi
xatio
n Du
ratio
n (s
ec.)
nificantly more readable (χ2(7) = 11.821, p = 0.107 for
group D and χ2(7) = 10.290, p = 0.172 for group C).
See Figure 4 for the fixation duration means and
preferences.
5.4 Font Size
Main effects: With two-way ANOVA, significant main
effects were identified in the fixation duration for the
groups (F (1, 372) = 19.713, p < 0.001) and for font
size (F (3, 372) = 8.804, p < 0.001). There was no in-
teraction effect for font size and groups (F (3, 372) =
0.458, p = 0.712). The results of the post-hoc tests
show that:
- Group D had significantly longer fixation durations
(x = 0.229, s = 0.07 seconds) than group C (x =
0.202, s = 0.05 seconds, p < 0.001) (Table 2).
- Participants present significant longer fixation du-
rations with 14 points font size than with 18 points
(p = 0.054), 22 points (p = 0.002) and 26 points
(p < 0.001) (Table 2).
Within Groups: A significant effect of font size on fixa-
tion duration in group D (F (3, 186) = 4.965, p = 0.002)
and in group C (F (3, 186) = 4.043, p = 0.008) was
found. The results of the post-hoc tests show that:
- For group D font size of 26 points lead to significant
shorter fixation durations (x = 0.208, s = 0.05 sec-
onds) than texts with 14 points (x = 0.259, s = 0.09
seconds, p = 0.003); and font size of 22 points lead
to significant shorter fixation durations (x = 0.216,
s = 0.06 seconds) than texts with 14 points (x =
0.259, s = 0.09 seconds, p = 0.003) (Table 2).
- Participants in group C had significant shorter fix-
ation durations with 26 points font size (x = 0.186,
s = 0.04 seconds) than with 14 points (x = 0.223, s
= 0.07 seconds, p = 0.005) (Table 2).
Preferences: Participants with and without dyslexia
found texts sizes of 26 points significantly easier to read

12
Fig. 6 Participants’ reading performance (fixation durationmean) and preference ratings in % for character spacing.
Non_Dys Font Contrast Back Contrast
Colors Size Chart Spa Line Spa Par Spacing Column Width
1 46 3 0 5 32 5 2 32 0 28 3 19 9 19 10 243 0 17 16 24 0 5 22 164 3 0 7 0 8 19 8 15 96 117 158 4
Scale-0 = 1 Scale-0 = 2 Color-blackoff-whiteoff = 5 Size-14 = 4 Spacing +14 = 2 Line Spacing 0.8 = 3 Spacing .4 = 4 Column width 1/4 = 4
Scale-25 = 4 Scale-25 = 3 Color-yellow-black = 6 Size-18= 3 Spacing +7 = 4 Line Spacing 1 = 4 Spacing 2 = 3 Column width 2/4 = 3
Scale-50 = 3 Scale-50 = 1 Color-blue-white = 8 Size-22= 2 Spacing 0 = 1 Line Spacing 1.4 = 1 Spacing 1 = 2 Column width 3/4 = 2
Scale-75 = 2 Scale-75 = 4 Color-brown-green = 1 Size-26= 1 Spacing -7 = 3 Line Spacing 1.2 = 2 Spacing 3 = 1 Column width 4/4 = 1
Color-black-creme = 3Color-dark brown-green = 2
Color-yellow-blue = 4Color-black-white = 7
Font Contrast Back Contrast
Colors Size Chart Spa Line Spa Par Spacing Column Width
1 2 12 5 0 5 2 23 42 15 0 2 3 15 15 30 143 27 9 15 15 17 18 43 144 1 26 5 26 9 10 35 125 36 77 48 5
Scale-0 = 3 Scale-0 = 4 Color-black-white = 1 Size-14 = 1 Spacing +14 = 4 Line Spacing 0.8 = 1 Spacing .4 = 1 Column width 1/4 = 1
Scale-25 = 2 Scale-25 = 1 Color-blackoff-whiteoff = 2 Size-18= 2 Spacing +7 = 2 Line Spacing 1 = 2 Spacing 2 = 2 Column width 2/4 = 2
Scale-50 = 1 Scale-50 = 3 Color-yellow-black = 3 Size-22= 3 Spacing 0 = 3 Line Spacing 1.4 = 4 Spacing 1 = 3 Column width 3/4 = 3
Scale-75 = 4 Scale-75 = 2 Color-blue-white = 4 Size-26= 4 Spacing -7 = 1 Line Spacing 1.2 = 3 Spacing 3 = 4 Column width 4/4 = 4
Color-brown-green = 5Color-black-creme = 6
Color-dark brown-green = 7Color-yellow-blue = 8
Font Contrast Group D Group N Font Contrast Group D Group N0% 27 46 45 49 0%75% 15 3 46 49 75%50% 2 0 46 49 50%25% 1 0 46 49 25%
Font Contrast Group D Group N Font Contrast Group D Group N0% 60 93.8775510204082 0% 0.24 0.19425% 32.6086956521739 6.12244897959184 25% 0.223 0.21750% 4.34782608695652 0 50% 0.233 0.211
Correlation 75% 2.17391304347826 0 75% 0.24 0.204-0.968445715719153 99.1304347826087 100 0.017 0.023-0.993869371230394 0.01 0.017
Back Contrast Group D Group N 0.017 0.00999999999999998100% 26 28 47 48 7.6233183856502211.855670103092825% 12 17 47 48 4.484304932735438.7628865979381450% 9 3 47 48 7.623318385650225.1546391752577275% 0 0 47 48
Back Contrast Group D Group N Back Contrast Group D Group N100% 55.3191489361702 58.3333333333333 0% 0.236 0.20825% 25.531914893617 35.4166666666667 25% 0.227 0.209
Correlation 50% 19.1489361702128 6.25 50% 0.238 0.201-0.118995939068828 75% 0 0 75% 0.237 0.2110.188839041314493 0.008999999999999980.00699999999999998
0.011 0.007999999999999980.009999999999999980.009999999999999983.964757709251093.48258706467661
Size Group D Group N 4.845814977973563.9800995024875514 0 0 46 44 4.405286343612334.9751243781094418 2 3 48 4422 10 15 48 4426 34 26 48 44
Size Group D Group N Size Group D Group N14 0 0 14 0.259 0.22318 4.16666666666667 6.81818181818182 18 0.233 0.2
Correlation 22 20.8333333333333 34.0909090909091 22 0.216 0.198-0.791535362594822 26 70.8333333333333 59.0909090909091 26 0.208 0.186-0.852378048645091 0.051 0.037
0.025 0.0140.00800000000000001 0.012
14 24.519230769230819.892473118279618 12.01923076923087.5268817204301122 3.846153846153856.45161290322581
Chart Spa Group D Group N-7 5 0 46 490 17 32 46 49+7 15 8 46 49+14 9 9 46 49
Chart Spa Group D Group N Chart Spa Group D Group N-7 10.8695652173913 0 -7 0.234 0.1980 36.9565217391304 65.3061224489796 0 0.208 0.19
Correlation +7 32.6086956521739 16.3265306122449 +7 0.202 0.185-0.838022023794689 +14 19.5652173913043 18.3673469387755 +14 0.21 0.179-0.123430442777081 0.032 0.019
0.00599999999999998 0.0115 0 0.007999999999999980.00600000000000001
17 32 15.841584158415810.614525139664815 8 2.970297029702966.145251396648059 9 3.960396039603953.35195530726257
Line Spa Group D Group N0.8 2 5 45 481 15 19 45 481.2 18 19 45 481.4 10 5 45 48
Line Spa Group D Group N Line Spa Group D Group N0.8 4.44444444444444 10.4166666666667 0.8 0.233 0.2061 33.3333333333333 39.5833333333333 1 0.236 0.207
Correlation 1.2 40 39.5833333333333 1.2 0.237 0.2050.451017032441845 1.4 22.2222222222222 10.4166666666667 1.4 0.226 0.2040.447213595499958 0.00700000000000001 0.001
0.00999999999999998 -0.0010.011 -0.002
3.097345132743370.4854368932038844.42477876106194-0.4854368932038844.86725663716813-0.970873786407768
Par Spacing Group D Group N0.4 23 4 131 381 43 10 131 382 30 22 131 383 35 2 131 38
Par Spacing Group D Group N Par Spacing Group D Group N0.4 17.5572519083969 10.5263157894737 0.4 0.233 0.1981 32.824427480916 26.3157894736842 1 0.228 0.198
Correlation 2 22.9007633587786 57.8947368421053 2 0.22 0.196-0.274103716415761 3 26.7175572519084 5.26315789473684 3 0.221 0.197-0.676968662049936 0.013 0.002
0.00800000000000001 0.0020.001 0.001
5.909090909090911.020408163265313.636363636363641.020408163265310.4545454545454550.510204081632654
Column Width Group D Group N22 12 1 44 4444 14 24 44 4466 14 16 44 4488 4 3 44 44
Column Width Group D Group N Column Width Group D Group N22 27.2727272727273 2.27272727272727 22 0.219 0.19144 31.8181818181818 54.5454545454545 44 0.214 0.19
Correlation 66 31.8181818181818 36.3636363636364 66 0.221 0.1870.402618283010223 88 9.09090909090909 6.81818181818182 88 0.215 0.187-0.0148014204124575 0.005 0.004
0.00700000000000001 0.0031 0.001 02 2.336448598130842.139037433155083 3.271028037383181.604278074866314 0.467289719626169 05678
Colors Group D Group Nblack-white 5 15 46 65
blackoff-whiteoff 2 9 46 65yellow-black 15 11 46 65blue-white 5 4 46 65
brown-green 3 0 46 65black-creme 7 16 46 65
dark brown-green 4 3 46 65yellow-blue 5 7 46 65
Colors Group D Group N Colors Group D Group Nblack-creme black-white 10.8695652173913 23.0769230769231 black-creme 0.208 0.187yellow-blue blackoff-whiteoff 4.34782608695652 13.8461538461538 yellow-blue 0.214 0.182
brown-green yellow-black 32.6086956521739 16.9230769230769 brown-green 0.221 0.194blackoff-whiteoff blue-white 10.8695652173913 6.15384615384615 blackoff-whiteoff 0.222 0.201
black-white brown-green 6.52173913043478 0 black-white 0.223 0.195blue-white black-creme 15.2173913043478 24.6153846153846 blue-white 0.228 0.18
dark brown-green dark brown-green 8.69565217391304 4.61538461538461 dark brown-green 0.228 0.203yellow-black yellow-blue 10.8695652173913 10.7692307692308 yellow-black 0.23 0.189
black-creme 15.2173913043478 24.6153846153846 0.006000000000000010.00700000000000001yellow-blue 10.8695652173913 10.7692307692308 0.013 0.002brown-green 6.52173913043478 0 0.014 0.014blackoff-whiteoff 4.34782608695652 13.8461538461538 0.015 0.021black-white 10.8695652173913 23.0769230769231 0.02 0.015blue-white 10.8695652173913 6.15384615384615 0.02 0
Correlation dark brown-green 8.69565217391304 4.61538461538461 0.022 0.023yellow-black 32.6086956521739 16.9230769230769 0.00900000000000001
black-creme0.0918053760955382 yellow-blue 2.884615384615393.88888888888889black-creme 3.88888888888889-0.735791591345596 brown-green 6.250000000000011.11111111111111yellow-blue 1.11111111111111
blackoff-whiteoff 6.730769230769247.77777777777778brown-green 7.77777777777778black-white 7.2115384615384711.6666666666667blackoff-
whiteoff11.6666666666667
blue-white 9.615384615384628.33333333333334black-white 8.33333333333334dark brown-green 9.61538461538462 0 blue-white 0
yellow-black 10.576923076923112.7777777777778dark brown-green
12.7777777777778
5 yellow-black 5
Text Grey Scale
0
25
50
75
100
0% 25% 50% 75%Group D Group C
Chart 2
0
15
30
45
60
Untitled 1 Untitled 2 Untitled 3 Untitled 4
Back Contrast Colors
Background Grey Scale
0
15
30
45
60
0% 25% 50% 75%Group D Group C
Font Size
0
20
40
60
80
14 18 22 26Group D Group C
Character Spacing
0
17.5
35
52.5
70
–7% 0% +7% +14%Group D Group C
Line Spacing
0
10
20
30
40
0.8 1 1.2 1.4Group D Group C
Paragraph Spacing
0
15
30
45
60
0.5 1 2 3Group D Group C
Column Width
0
15
30
45
60
22 44 66 88Group D Group C
Text and Background Colors
0
10
20
30
40
Group D Group C
Text Grey Scale
0.1
0.138
0.175
0.213
0.25
0% 25% 50% 75%Group D Group C
Background Grey Scale
0.1
0.138
0.175
0.213
0.25
0% 25% 50% 75%Group D Group C
Text and Background Colors
0.1
0.138
0.175
0.213
0.25
Group D Group C
Font Size
0.1
0.138
0.175
0.213
0.25
14 18 22 26Group D Group C
Line Spacing
0.1
0.138
0.175
0.213
0.25
0.8 1 1.2 1.4Group D Group C
Paragraph Spacing
0.1
0.138
0.175
0.213
0.25
0.5 1 2 3Group D Group C
Column Width
0.1
0.138
0.175
0.213
0.25
22 44 66 88Group D Group C
Character Spacing
0.1
0.138
0.175
0.213
0.25
–7% 0% +7% +14%Group D Group C
lines lines lines lines
lines lines
char. char.
grey grey
grey grey
brown/g
reen
dark b
rown/
light g
reen
black/
yellow
blue/y
ellow
blue/w
hite
black/
creme
black
off/
white offbla
ck/whit
e
brown/g
reen
dark b
rown/
light g
reen
black/
yellow
blue/y
ellow
blue/w
hite
black/
creme
black
off/
white off
black/
white
points points
char. char.
Fixa
tion
Dura
tion
(sec
.)
Pref
eren
ce R
atin
g (%
)Pr
efer
ence
Rat
ing
(%)
Pref
eren
ce R
atin
g (%
)Pr
efer
ence
Rat
ing
(%)
Pref
eren
ce R
atin
g (%
)Pr
efer
ence
Rat
ing
(%)
Pref
eren
ce R
atin
g (%
)
Pref
eren
ce R
atin
g (%
)
Fixa
tion
Dura
tion
(sec
.)Fi
xatio
n Du
ratio
n (s
ec.)
Fixa
tion
Dura
tion
(sec
.)
Fixa
tion
Dura
tion
(sec
.)Fi
xatio
n Du
ratio
n (s
ec.)
Fixa
tion
Dura
tion
(sec
.)Fi
xatio
n Du
ratio
n (s
ec.)
than the rest of the sizes (χ2(3) = 9.051, p = 0.03 for
group D and χ2(3) = 20.789, p < 0.01 for group C).
See Figure 5 for the fixation duration means and
preferences.
5.5 Character Spacing
Main effects: With two-way ANOVA, significant main
effects were found for the groups (F (1, 368) =
16.35, p < 0.001) and for character spacing
(F (3, 368) = 2.86, p = 0.037) of fixation duration. A
significant interaction of character spacing and groups
(F (3, 368) = 0.52, p = 0.665) has also been identified.
The results of the post-hoc tests show that:
- There is a significant difference of fixation duration
between group D (x = 0.212, s = 0.07 seconds) and
group C (x = 0.188, s = 0.05 seconds, p < 0.001)
(Table 2).
- Participants present significant longer fixation dura-
tions with character spacing -7% than with spacing
+7% (p = 0.035) and spacing +14% (p = 0.013),
but not with 1% (p = 0.140) (Table 2).
Within Groups: No significant effect of character spac-
ing on fixation duration for group D (F (3, 184) =
1.896, p = 0.132) or for group C (F (3, 184) =
1.283, p = 0.282) were identified.
Preferences: Participants with dyslexia did not find
any of the options significantly easier to read (χ2(3) =
2.025, p = 0.567), while participants without dyslexia
found text with 0% character spacing significantly more
readable (χ2(3) = 21.542, p < 0.001).
See Figure 6 for the fixation duration means and
preference ratings.
5.6 Line Spacing
Main effects: With two-way ANOVA, significant main
effects were identified for the groups (F (1, 372) =
17.793, p < 0.001) on fixation duration. No effects of
Fig. 7 Participants’ reading performance (fixation durationmean) and preference ratings in % for line spacing.
Non_Dys Font Contrast Back Contrast
Colors Size Chart Spa Line Spa Par Spacing Column Width
1 46 3 0 5 32 5 2 32 0 28 3 19 9 19 10 243 0 17 16 24 0 5 22 164 3 0 7 0 8 19 8 15 96 117 158 4
Scale-0 = 1 Scale-0 = 2 Color-blackoff-whiteoff = 5 Size-14 = 4 Spacing +14 = 2 Line Spacing 0.8 = 3 Spacing .4 = 4 Column width 1/4 = 4
Scale-25 = 4 Scale-25 = 3 Color-yellow-black = 6 Size-18= 3 Spacing +7 = 4 Line Spacing 1 = 4 Spacing 2 = 3 Column width 2/4 = 3
Scale-50 = 3 Scale-50 = 1 Color-blue-white = 8 Size-22= 2 Spacing 0 = 1 Line Spacing 1.4 = 1 Spacing 1 = 2 Column width 3/4 = 2
Scale-75 = 2 Scale-75 = 4 Color-brown-green = 1 Size-26= 1 Spacing -7 = 3 Line Spacing 1.2 = 2 Spacing 3 = 1 Column width 4/4 = 1
Color-black-creme = 3Color-dark brown-green = 2
Color-yellow-blue = 4Color-black-white = 7
Font Contrast Back Contrast
Colors Size Chart Spa Line Spa Par Spacing Column Width
1 2 12 5 0 5 2 23 42 15 0 2 3 15 15 30 143 27 9 15 15 17 18 43 144 1 26 5 26 9 10 35 125 36 77 48 5
Scale-0 = 3 Scale-0 = 4 Color-black-white = 1 Size-14 = 1 Spacing +14 = 4 Line Spacing 0.8 = 1 Spacing .4 = 1 Column width 1/4 = 1
Scale-25 = 2 Scale-25 = 1 Color-blackoff-whiteoff = 2 Size-18= 2 Spacing +7 = 2 Line Spacing 1 = 2 Spacing 2 = 2 Column width 2/4 = 2
Scale-50 = 1 Scale-50 = 3 Color-yellow-black = 3 Size-22= 3 Spacing 0 = 3 Line Spacing 1.4 = 4 Spacing 1 = 3 Column width 3/4 = 3
Scale-75 = 4 Scale-75 = 2 Color-blue-white = 4 Size-26= 4 Spacing -7 = 1 Line Spacing 1.2 = 3 Spacing 3 = 4 Column width 4/4 = 4
Color-brown-green = 5Color-black-creme = 6
Color-dark brown-green = 7Color-yellow-blue = 8
Font Contrast Group D Group N Font Contrast Group D Group N0% 27 46 45 49 0%75% 15 3 46 49 75%50% 2 0 46 49 50%25% 1 0 46 49 25%
Font Contrast Group D Group N Font Contrast Group D Group N0% 60 93.8775510204082 0% 0.24 0.19425% 32.6086956521739 6.12244897959184 25% 0.223 0.21750% 4.34782608695652 0 50% 0.233 0.211
Correlation 75% 2.17391304347826 0 75% 0.24 0.204-0.968445715719153 99.1304347826087 100 0.017 0.023-0.993869371230394 0.01 0.017
Back Contrast Group D Group N 0.017 0.00999999999999998100% 26 28 47 48 7.6233183856502211.855670103092825% 12 17 47 48 4.484304932735438.7628865979381450% 9 3 47 48 7.623318385650225.1546391752577275% 0 0 47 48
Back Contrast Group D Group N Back Contrast Group D Group N100% 55.3191489361702 58.3333333333333 0% 0.236 0.20825% 25.531914893617 35.4166666666667 25% 0.227 0.209
Correlation 50% 19.1489361702128 6.25 50% 0.238 0.201-0.118995939068828 75% 0 0 75% 0.237 0.2110.188839041314493 0.008999999999999980.00699999999999998
0.011 0.007999999999999980.009999999999999980.009999999999999983.964757709251093.48258706467661
Size Group D Group N 4.845814977973563.9800995024875514 0 0 46 44 4.405286343612334.9751243781094418 2 3 48 4422 10 15 48 4426 34 26 48 44
Size Group D Group N Size Group D Group N14 0 0 14 0.259 0.22318 4.16666666666667 6.81818181818182 18 0.233 0.2
Correlation 22 20.8333333333333 34.0909090909091 22 0.216 0.198-0.791535362594822 26 70.8333333333333 59.0909090909091 26 0.208 0.186-0.852378048645091 0.051 0.037
0.025 0.0140.00800000000000001 0.012
14 24.519230769230819.892473118279618 12.01923076923087.5268817204301122 3.846153846153856.45161290322581
Chart Spa Group D Group N-7 5 0 46 490 17 32 46 49+7 15 8 46 49+14 9 9 46 49
Chart Spa Group D Group N Chart Spa Group D Group N-7 10.8695652173913 0 -7 0.234 0.1980 36.9565217391304 65.3061224489796 0 0.208 0.19
Correlation +7 32.6086956521739 16.3265306122449 +7 0.202 0.185-0.838022023794689 +14 19.5652173913043 18.3673469387755 +14 0.21 0.179-0.123430442777081 0.032 0.019
0.00599999999999998 0.0115 0 0.007999999999999980.00600000000000001
17 32 15.841584158415810.614525139664815 8 2.970297029702966.145251396648059 9 3.960396039603953.35195530726257
Line Spa Group D Group N0.8 2 5 45 481 15 19 45 481.2 18 19 45 481.4 10 5 45 48
Line Spa Group D Group N Line Spa Group D Group N0.8 4.44444444444444 10.4166666666667 0.8 0.233 0.2061 33.3333333333333 39.5833333333333 1 0.236 0.207
Correlation 1.2 40 39.5833333333333 1.2 0.237 0.2050.451017032441845 1.4 22.2222222222222 10.4166666666667 1.4 0.226 0.2040.447213595499958 0.00700000000000001 0.001
0.00999999999999998 -0.0010.011 -0.002
3.097345132743370.4854368932038844.42477876106194-0.4854368932038844.86725663716813-0.970873786407768
Par Spacing Group D Group N0.4 23 4 131 381 43 10 131 382 30 22 131 383 35 2 131 38
Par Spacing Group D Group N Par Spacing Group D Group N0.4 17.5572519083969 10.5263157894737 0.4 0.233 0.1981 32.824427480916 26.3157894736842 1 0.228 0.198
Correlation 2 22.9007633587786 57.8947368421053 2 0.22 0.196-0.274103716415761 3 26.7175572519084 5.26315789473684 3 0.221 0.197-0.676968662049936 0.013 0.002
0.00800000000000001 0.0020.001 0.001
5.909090909090911.020408163265313.636363636363641.020408163265310.4545454545454550.510204081632654
Column Width Group D Group N22 12 1 44 4444 14 24 44 4466 14 16 44 4488 4 3 44 44
Column Width Group D Group N Column Width Group D Group N22 27.2727272727273 2.27272727272727 22 0.219 0.19144 31.8181818181818 54.5454545454545 44 0.214 0.19
Correlation 66 31.8181818181818 36.3636363636364 66 0.221 0.1870.402618283010223 88 9.09090909090909 6.81818181818182 88 0.215 0.187-0.0148014204124575 0.005 0.004
0.00700000000000001 0.0031 0.001 02 2.336448598130842.139037433155083 3.271028037383181.604278074866314 0.467289719626169 05678
Colors Group D Group Nblack-white 5 15 46 65
blackoff-whiteoff 2 9 46 65yellow-black 15 11 46 65blue-white 5 4 46 65
brown-green 3 0 46 65black-creme 7 16 46 65
dark brown-green 4 3 46 65yellow-blue 5 7 46 65
Colors Group D Group N Colors Group D Group Nblack-creme black-white 10.8695652173913 23.0769230769231 black-creme 0.208 0.187yellow-blue blackoff-whiteoff 4.34782608695652 13.8461538461538 yellow-blue 0.214 0.182
brown-green yellow-black 32.6086956521739 16.9230769230769 brown-green 0.221 0.194blackoff-whiteoff blue-white 10.8695652173913 6.15384615384615 blackoff-whiteoff 0.222 0.201
black-white brown-green 6.52173913043478 0 black-white 0.223 0.195blue-white black-creme 15.2173913043478 24.6153846153846 blue-white 0.228 0.18
dark brown-green dark brown-green 8.69565217391304 4.61538461538461 dark brown-green 0.228 0.203yellow-black yellow-blue 10.8695652173913 10.7692307692308 yellow-black 0.23 0.189
black-creme 15.2173913043478 24.6153846153846 0.006000000000000010.00700000000000001yellow-blue 10.8695652173913 10.7692307692308 0.013 0.002brown-green 6.52173913043478 0 0.014 0.014blackoff-whiteoff 4.34782608695652 13.8461538461538 0.015 0.021black-white 10.8695652173913 23.0769230769231 0.02 0.015blue-white 10.8695652173913 6.15384615384615 0.02 0
Correlation dark brown-green 8.69565217391304 4.61538461538461 0.022 0.023yellow-black 32.6086956521739 16.9230769230769 0.00900000000000001
black-creme0.0918053760955382 yellow-blue 2.884615384615393.88888888888889black-creme 3.88888888888889-0.735791591345596 brown-green 6.250000000000011.11111111111111yellow-blue 1.11111111111111
blackoff-whiteoff 6.730769230769247.77777777777778brown-green 7.77777777777778black-white 7.2115384615384711.6666666666667blackoff-
whiteoff11.6666666666667
blue-white 9.615384615384628.33333333333334black-white 8.33333333333334dark brown-green 9.61538461538462 0 blue-white 0
yellow-black 10.576923076923112.7777777777778dark brown-green
12.7777777777778
5 yellow-black 5
Text Grey Scale
0
25
50
75
100
0% 25% 50% 75%Group D Group C
Chart 2
0
15
30
45
60
Untitled 1 Untitled 2 Untitled 3 Untitled 4
Back Contrast Colors
Background Grey Scale
0
15
30
45
60
0% 25% 50% 75%Group D Group C
Font Size
0
20
40
60
80
14 18 22 26Group D Group C
Character Spacing
0
17.5
35
52.5
70
–7% 0% +7% +14%Group D Group C
Line Spacing
0
10
20
30
40
0.8 1 1.2 1.4Group D Group C
Paragraph Spacing
0
15
30
45
60
0.5 1 2 3Group D Group C
Column Width
0
15
30
45
60
22 44 66 88Group D Group C
Text and Background Colors
0
10
20
30
40
Group D Group C
Text Grey Scale
0.1
0.138
0.175
0.213
0.25
0% 25% 50% 75%Group D Group C
Background Grey Scale
0.1
0.138
0.175
0.213
0.25
0% 25% 50% 75%Group D Group C
Text and Background Colors
0.1
0.138
0.175
0.213
0.25
Group D Group C
Font Size
0.1
0.138
0.175
0.213
0.25
14 18 22 26Group D Group C
Line Spacing
0.1
0.138
0.175
0.213
0.25
0.8 1 1.2 1.4Group D Group C
Paragraph Spacing
0.1
0.138
0.175
0.213
0.25
0.5 1 2 3Group D Group C
Column Width
0.1
0.138
0.175
0.213
0.25
22 44 66 88Group D Group C
Character Spacing
0.1
0.138
0.175
0.213
0.25
–7% 0% +7% +14%Group D Group C
lines lines lines lines
lines lines
char. char.
grey grey
grey grey
brown/g
reen
dark b
rown/
light g
reen
black/
yellow
blue/y
ellow
blue/w
hite
black/
creme
black
off/
white offbla
ck/whit
e
brown/g
reen
dark b
rown/
light g
reen
black/
yellow
blue/y
ellow
blue/w
hite
black/
creme
black
off/
white off
black/
white
points points
char. char.
Fixa
tion
Dura
tion
(sec
.)
Pref
eren
ce R
atin
g (%
)Pr
efer
ence
Rat
ing
(%)
Pref
eren
ce R
atin
g (%
)Pr
efer
ence
Rat
ing
(%)
Pref
eren
ce R
atin
g (%
)Pr
efer
ence
Rat
ing
(%)
Pref
eren
ce R
atin
g (%
)
Pref
eren
ce R
atin
g (%
)
Fixa
tion
Dura
tion
(sec
.)Fi
xatio
n Du
ratio
n (s
ec.)
Fixa
tion
Dura
tion
(sec
.)
Fixa
tion
Dura
tion
(sec
.)Fi
xatio
n Du
ratio
n (s
ec.)
Fixa
tion
Dura
tion
(sec
.)Fi
xatio
n Du
ratio
n (s
ec.)
Fig. 8 Participants’ reading performance (fixation durationmean) and preference ratings in % for paragraph spacing.
Non_Dys Font Contrast Back Contrast
Colors Size Chart Spa Line Spa Par Spacing Column Width
1 46 3 0 5 32 5 2 32 0 28 3 19 9 19 10 243 0 17 16 24 0 5 22 164 3 0 7 0 8 19 8 15 96 117 158 4
Scale-0 = 1 Scale-0 = 2 Color-blackoff-whiteoff = 5 Size-14 = 4 Spacing +14 = 2 Line Spacing 0.8 = 3 Spacing .4 = 4 Column width 1/4 = 4
Scale-25 = 4 Scale-25 = 3 Color-yellow-black = 6 Size-18= 3 Spacing +7 = 4 Line Spacing 1 = 4 Spacing 2 = 3 Column width 2/4 = 3
Scale-50 = 3 Scale-50 = 1 Color-blue-white = 8 Size-22= 2 Spacing 0 = 1 Line Spacing 1.4 = 1 Spacing 1 = 2 Column width 3/4 = 2
Scale-75 = 2 Scale-75 = 4 Color-brown-green = 1 Size-26= 1 Spacing -7 = 3 Line Spacing 1.2 = 2 Spacing 3 = 1 Column width 4/4 = 1
Color-black-creme = 3Color-dark brown-green = 2
Color-yellow-blue = 4Color-black-white = 7
Font Contrast Back Contrast
Colors Size Chart Spa Line Spa Par Spacing Column Width
1 2 12 5 0 5 2 23 42 15 0 2 3 15 15 30 143 27 9 15 15 17 18 43 144 1 26 5 26 9 10 35 125 36 77 48 5
Scale-0 = 3 Scale-0 = 4 Color-black-white = 1 Size-14 = 1 Spacing +14 = 4 Line Spacing 0.8 = 1 Spacing .4 = 1 Column width 1/4 = 1
Scale-25 = 2 Scale-25 = 1 Color-blackoff-whiteoff = 2 Size-18= 2 Spacing +7 = 2 Line Spacing 1 = 2 Spacing 2 = 2 Column width 2/4 = 2
Scale-50 = 1 Scale-50 = 3 Color-yellow-black = 3 Size-22= 3 Spacing 0 = 3 Line Spacing 1.4 = 4 Spacing 1 = 3 Column width 3/4 = 3
Scale-75 = 4 Scale-75 = 2 Color-blue-white = 4 Size-26= 4 Spacing -7 = 1 Line Spacing 1.2 = 3 Spacing 3 = 4 Column width 4/4 = 4
Color-brown-green = 5Color-black-creme = 6
Color-dark brown-green = 7Color-yellow-blue = 8
Font Contrast Group D Group N Font Contrast Group D Group N0% 27 46 45 49 0%75% 15 3 46 49 75%50% 2 0 46 49 50%25% 1 0 46 49 25%
Font Contrast Group D Group N Font Contrast Group D Group N0% 60 93.8775510204082 0% 0.24 0.19425% 32.6086956521739 6.12244897959184 25% 0.223 0.21750% 4.34782608695652 0 50% 0.233 0.211
Correlation 75% 2.17391304347826 0 75% 0.24 0.204-0.968445715719153 99.1304347826087 100 0.017 0.023-0.993869371230394 0.01 0.017
Back Contrast Group D Group N 0.017 0.00999999999999998100% 26 28 47 48 7.6233183856502211.855670103092825% 12 17 47 48 4.484304932735438.7628865979381450% 9 3 47 48 7.623318385650225.1546391752577275% 0 0 47 48
Back Contrast Group D Group N Back Contrast Group D Group N100% 55.3191489361702 58.3333333333333 0% 0.236 0.20825% 25.531914893617 35.4166666666667 25% 0.227 0.209
Correlation 50% 19.1489361702128 6.25 50% 0.238 0.201-0.118995939068828 75% 0 0 75% 0.237 0.2110.188839041314493 0.008999999999999980.00699999999999998
0.011 0.007999999999999980.009999999999999980.009999999999999983.964757709251093.48258706467661
Size Group D Group N 4.845814977973563.9800995024875514 0 0 46 44 4.405286343612334.9751243781094418 2 3 48 4422 10 15 48 4426 34 26 48 44
Size Group D Group N Size Group D Group N14 0 0 14 0.259 0.22318 4.16666666666667 6.81818181818182 18 0.233 0.2
Correlation 22 20.8333333333333 34.0909090909091 22 0.216 0.198-0.791535362594822 26 70.8333333333333 59.0909090909091 26 0.208 0.186-0.852378048645091 0.051 0.037
0.025 0.0140.00800000000000001 0.012
14 24.519230769230819.892473118279618 12.01923076923087.5268817204301122 3.846153846153856.45161290322581
Chart Spa Group D Group N-7 5 0 46 490 17 32 46 49+7 15 8 46 49+14 9 9 46 49
Chart Spa Group D Group N Chart Spa Group D Group N-7 10.8695652173913 0 -7 0.234 0.1980 36.9565217391304 65.3061224489796 0 0.208 0.19
Correlation +7 32.6086956521739 16.3265306122449 +7 0.202 0.185-0.838022023794689 +14 19.5652173913043 18.3673469387755 +14 0.21 0.179-0.123430442777081 0.032 0.019
0.00599999999999998 0.0115 0 0.007999999999999980.00600000000000001
17 32 15.841584158415810.614525139664815 8 2.970297029702966.14525139664805
9 9 3.960396039603953.35195530726257
Line Spa Group D Group N0.8 2 5 45 481 15 19 45 481.2 18 19 45 481.4 10 5 45 48
Line Spa Group D Group N Line Spa Group D Group N0.8 4.44444444444444 10.4166666666667 0.8 0.233 0.2061 33.3333333333333 39.5833333333333 1 0.236 0.207
Correlation 1.2 40 39.5833333333333 1.2 0.237 0.2050.451017032441845 1.4 22.2222222222222 10.4166666666667 1.4 0.226 0.2040.447213595499958 0.00700000000000001 0.001
0.00999999999999998 -0.0010.011 -0.002
3.097345132743370.4854368932038844.42477876106194-0.4854368932038844.86725663716813-0.970873786407768
Par Spacing Group D Group N0.4 23 4 131 381 43 10 131 382 30 22 131 383 35 2 131 38
Par Spacing Group D Group N Par Spacing Group D Group N0.4 17.5572519083969 10.5263157894737 0.4 0.233 0.1981 32.824427480916 26.3157894736842 1 0.228 0.198
Correlation 2 22.9007633587786 57.8947368421053 2 0.22 0.196-0.274103716415761 3 26.7175572519084 5.26315789473684 3 0.221 0.197-0.676968662049936 0.013 0.002
0.00800000000000001 0.0020.001 0.001
5.909090909090911.020408163265313.636363636363641.020408163265310.4545454545454550.510204081632654
Column Width Group D Group N22 12 1 44 4444 14 24 44 4466 14 16 44 4488 4 3 44 44
Column Width Group D Group N Column Width Group D Group N22 27.2727272727273 2.27272727272727 22 0.219 0.19144 31.8181818181818 54.5454545454545 44 0.214 0.19
Correlation 66 31.8181818181818 36.3636363636364 66 0.221 0.1870.402618283010223 88 9.09090909090909 6.81818181818182 88 0.215 0.187-0.0148014204124575 0.005 0.004
0.00700000000000001 0.0031 0.001 02 2.336448598130842.139037433155083 3.271028037383181.604278074866314 0.467289719626169 05678
Colors Group D Group Nblack-white 5 15 46 65
blackoff-whiteoff 2 9 46 65yellow-black 15 11 46 65blue-white 5 4 46 65
brown-green 3 0 46 65black-creme 7 16 46 65
dark brown-green 4 3 46 65yellow-blue 5 7 46 65
Colors Group D Group N Colors Group D Group Nblack-creme black-white 10.8695652173913 23.0769230769231 black-creme 0.208 0.187yellow-blue blackoff-whiteoff 4.34782608695652 13.8461538461538 yellow-blue 0.214 0.182
brown-green yellow-black 32.6086956521739 16.9230769230769 brown-green 0.221 0.194blackoff-whiteoff blue-white 10.8695652173913 6.15384615384615 blackoff-whiteoff 0.222 0.201
black-white brown-green 6.52173913043478 0 black-white 0.223 0.195blue-white black-creme 15.2173913043478 24.6153846153846 blue-white 0.228 0.18
dark brown-green dark brown-green 8.69565217391304 4.61538461538461 dark brown-green 0.228 0.203yellow-black yellow-blue 10.8695652173913 10.7692307692308 yellow-black 0.23 0.189
black-creme 15.2173913043478 24.6153846153846 0.006000000000000010.00700000000000001yellow-blue 10.8695652173913 10.7692307692308 0.013 0.002brown-green 6.52173913043478 0 0.014 0.014blackoff-whiteoff 4.34782608695652 13.8461538461538 0.015 0.021black-white 10.8695652173913 23.0769230769231 0.02 0.015blue-white 10.8695652173913 6.15384615384615 0.02 0
Correlation dark brown-green 8.69565217391304 4.61538461538461 0.022 0.023yellow-black 32.6086956521739 16.9230769230769 0.00900000000000001
black-creme0.0918053760955382 yellow-blue 2.884615384615393.88888888888889black-creme 3.88888888888889-0.735791591345596 brown-green 6.250000000000011.11111111111111yellow-blue 1.11111111111111
blackoff-whiteoff 6.730769230769247.77777777777778brown-green 7.77777777777778black-white 7.2115384615384711.6666666666667blackoff-
whiteoff11.6666666666667
blue-white 9.615384615384628.33333333333334black-white 8.33333333333334dark brown-green 9.61538461538462 0 blue-white 0
yellow-black 10.576923076923112.7777777777778dark brown-green
12.7777777777778
5 yellow-black 5
Text Grey Scale
0
25
50
75
100
0% 25% 50% 75%Group D Group C
Chart 2
0
15
30
45
60
Untitled 1 Untitled 2 Untitled 3 Untitled 4
Back Contrast Colors
Background Grey Scale
0
15
30
45
60
0% 25% 50% 75%Group D Group C
Font Size
0
20
40
60
80
14 18 22 26Group D Group C
Character Spacing
0
17.5
35
52.5
70
–7% 0% +7% +14%Group D Group C
Line Spacing
0
10
20
30
40
0.8 1 1.2 1.4Group D Group C
Paragraph Spacing
0
15
30
45
60
0.5 1 2 3Group D Group C
Column Width
0
15
30
45
60
22 44 66 88Group D Group C
Text and Background Colors
0
10
20
30
40
Group D Group C
Text Grey Scale
0.1
0.138
0.175
0.213
0.25
0% 25% 50% 75%Group D Group C
Background Grey Scale
0.1
0.138
0.175
0.213
0.25
0% 25% 50% 75%Group D Group C
Text and Background Colors
0.1
0.138
0.175
0.213
0.25
Group D Group C
Font Size
0.1
0.138
0.175
0.213
0.25
14 18 22 26Group D Group C
Line Spacing
0.1
0.138
0.175
0.213
0.25
0.8 1 1.2 1.4Group D Group C
Paragraph Spacing
0.1
0.138
0.175
0.213
0.25
0.5 1 2 3Group D Group C
Column Width
0.1
0.138
0.175
0.213
0.25
22 44 66 88Group D Group C
Character Spacing
0.1
0.138
0.175
0.213
0.25
–7% 0% +7% +14%Group D Group C
lines lines lines lines
lines lines
char. char.
grey grey
grey grey
brown/g
reen
dark b
rown/
light g
reen
black/
yellow
blue/y
ellow
blue/w
hite
black/
creme
black
off/
white offbla
ck/whit
e
brown/g
reen
dark b
rown/
light g
reen
black/
yellow
blue/y
ellow
blue/w
hite
black/
creme
black
off/
white off
black/
white
points points
char. char.
Fixa
tion
Dura
tion
(sec
.)
Pref
eren
ce R
atin
g (%
)Pr
efer
ence
Rat
ing
(%)
Pref
eren
ce R
atin
g (%
)Pr
efer
ence
Rat
ing
(%)
Pref
eren
ce R
atin
g (%
)Pr
efer
ence
Rat
ing
(%)
Pref
eren
ce R
atin
g (%
)
Pref
eren
ce R
atin
g (%
)
Fixa
tion
Dura
tion
(sec
.)Fi
xatio
n Du
ratio
n (s
ec.)
Fixa
tion
Dura
tion
(sec
.)
Fixa
tion
Dura
tion
(sec
.)Fi
xatio
n Du
ratio
n (s
ec.)
Fixa
tion
Dura
tion
(sec
.)Fi
xatio
n Du
ratio
n (s
ec.)
line spacing (F (3, 372) = 0.238, p = 0.870) on fixation
duration were identified. However, there were no inter-
action effects of line spacing and groups (F (3, 372) =
0.109, p = 0.955). The results of the post-hoc tests
show that:
- Group D had significantly longer fixation durations
(x = 0.233, s = 0.07 seconds) than group C (x =
0.206, s = 0.06 seconds, p < 0.001) (Table 2).
Within Groups: No significant effect of line spacing on
fixation duration for group D (F (3, 186) = 0.267, p =
0.849) or for group C (F (3, 186) = 0.032, p = 0.993)has been identified.
Preferences: Participants did not find any of the op-
tions of line spacing significantly easier to read (χ2(3) =
2.164, p = 0.539 for group D and χ2(3) = 3.179, p =
0.365 for group C).
See Figure 7 for the fixation duration means and
preference ratings.
5.7 Paragraph Spacing
Main effects: With two-way ANOVA, significant main
effects were found for the groups (F (1, 374) =
28.545, p < 0.001) on fixation duration. However, no
effects were found of paragraph spacing (F (3, 374) =
0.453, p = 0.715) on fixation duration. Also, interaction
effects of paragraph spacing and groups (F (3, 374) =
0.234, p = 0.873) could not be found.
The results of the post-hoc tests show that:

13
- Group C had significantly shorter fixation durations
(x = 0.197, s = 0.05 seconds) than group D (x =
0.225, s = 0.06 seconds, p < 0.001) (Table 2).
Within Groups: No significant effect of paragraph spac-
ing on fixation duration for group D (F (3, 187) =
0.544, p = 0.652) or for group C (F (3, 187) =
0.024, p = 0.995) has been identified.
Preferences: Participants did not find any of the op-
tions of line paragraph significantly easier to read
(χ2(3) = 2.357, p = 0.502 for group D and χ2(3) =
2.813, p = 0.421 for group C).
See Figure 8 for the fixation duration means and
preferences.
5.8 Column Width
Main effects: With two-way ANOVA, significant main
effects for the groups (F (1, 372) = 30.776, p < 0.001)
on fixation duration were found. However, there was no
effects of column width (F (3, 372) = 0.155, p = 0.927)
on fixation duration. Moreover, there were no interac-
tion effects of column width and groups (F (3, 372) =
0.216, p = 0.886).
The results of the post-hoc tests show that:
- Group C had significantly shorter fixation durations
(x = 0.189, s = 0.05 seconds) than group D (x =
0.217, s = 0.05 seconds, p < 0.001) (Table 2).
Within Groups: There was no significant effect of
column width on fixation duration for group D
(F (3, 186) = 0.176, p = 0.913) nor for group C
(F (3, 186) = 0.201, p = 0.895).
Preferences: Participants with dyslexia did not find
any of the options of column width significantly easier
to read (χ2(3) = 0.845, p = 0.839), while participants
without dyslexia found the option of 44 characters per
line significantly more readable (χ2(3) = 14.750, p =
0.002).
See Figure 9 for the fixation duration means and
preferences.
6 Discussion
General Comments. In general, participants with-
out dyslexia read significantly faster and had shorter
fixation durations than participants with dyslexia. For
the font size variable, participants with dyslexia had
significantly shorter fixation durations when using big-
ger fonts compared to smaller fonts.
Fig. 9 Participants’ reading performance (fixation durationmean) and preference ratings in % for column width.
Non_Dys Font Contrast Back Contrast
Colors Size Chart Spa Line Spa Par Spacing Column Width
1 46 3 0 5 32 5 2 32 0 28 3 19 9 19 10 243 0 17 16 24 0 5 22 164 3 0 7 0 8 19 8 15 96 117 158 4
Scale-0 = 1 Scale-0 = 2 Color-blackoff-whiteoff = 5 Size-14 = 4 Spacing +14 = 2 Line Spacing 0.8 = 3 Spacing .4 = 4 Column width 1/4 = 4
Scale-25 = 4 Scale-25 = 3 Color-yellow-black = 6 Size-18= 3 Spacing +7 = 4 Line Spacing 1 = 4 Spacing 2 = 3 Column width 2/4 = 3
Scale-50 = 3 Scale-50 = 1 Color-blue-white = 8 Size-22= 2 Spacing 0 = 1 Line Spacing 1.4 = 1 Spacing 1 = 2 Column width 3/4 = 2
Scale-75 = 2 Scale-75 = 4 Color-brown-green = 1 Size-26= 1 Spacing -7 = 3 Line Spacing 1.2 = 2 Spacing 3 = 1 Column width 4/4 = 1
Color-black-creme = 3Color-dark brown-green = 2
Color-yellow-blue = 4Color-black-white = 7
Font Contrast Back Contrast
Colors Size Chart Spa Line Spa Par Spacing Column Width
1 2 12 5 0 5 2 23 42 15 0 2 3 15 15 30 143 27 9 15 15 17 18 43 144 1 26 5 26 9 10 35 125 36 77 48 5
Scale-0 = 3 Scale-0 = 4 Color-black-white = 1 Size-14 = 1 Spacing +14 = 4 Line Spacing 0.8 = 1 Spacing .4 = 1 Column width 1/4 = 1
Scale-25 = 2 Scale-25 = 1 Color-blackoff-whiteoff = 2 Size-18= 2 Spacing +7 = 2 Line Spacing 1 = 2 Spacing 2 = 2 Column width 2/4 = 2
Scale-50 = 1 Scale-50 = 3 Color-yellow-black = 3 Size-22= 3 Spacing 0 = 3 Line Spacing 1.4 = 4 Spacing 1 = 3 Column width 3/4 = 3
Scale-75 = 4 Scale-75 = 2 Color-blue-white = 4 Size-26= 4 Spacing -7 = 1 Line Spacing 1.2 = 3 Spacing 3 = 4 Column width 4/4 = 4
Color-brown-green = 5Color-black-creme = 6
Color-dark brown-green = 7Color-yellow-blue = 8
Font Contrast Group D Group N Font Contrast Group D Group N0% 27 46 45 49 0%75% 15 3 46 49 75%50% 2 0 46 49 50%25% 1 0 46 49 25%
Font Contrast Group D Group N Font Contrast Group D Group N0% 60 93.8775510204082 0% 0.24 0.19425% 32.6086956521739 6.12244897959184 25% 0.223 0.21750% 4.34782608695652 0 50% 0.233 0.211
Correlation 75% 2.17391304347826 0 75% 0.24 0.204-0.968445715719153 99.1304347826087 100 0.017 0.023-0.993869371230394 0.01 0.017
Back Contrast Group D Group N 0.017 0.00999999999999998100% 26 28 47 48 7.6233183856502211.855670103092825% 12 17 47 48 4.484304932735438.7628865979381450% 9 3 47 48 7.623318385650225.1546391752577275% 0 0 47 48
Back Contrast Group D Group N Back Contrast Group D Group N100% 55.3191489361702 58.3333333333333 0% 0.236 0.20825% 25.531914893617 35.4166666666667 25% 0.227 0.209
Correlation 50% 19.1489361702128 6.25 50% 0.238 0.201-0.118995939068828 75% 0 0 75% 0.237 0.2110.188839041314493 0.008999999999999980.00699999999999998
0.011 0.007999999999999980.009999999999999980.009999999999999983.964757709251093.48258706467661
Size Group D Group N 4.845814977973563.9800995024875514 0 0 46 44 4.405286343612334.9751243781094418 2 3 48 4422 10 15 48 4426 34 26 48 44
Size Group D Group N Size Group D Group N14 0 0 14 0.259 0.22318 4.16666666666667 6.81818181818182 18 0.233 0.2
Correlation 22 20.8333333333333 34.0909090909091 22 0.216 0.198-0.791535362594822 26 70.8333333333333 59.0909090909091 26 0.208 0.186-0.852378048645091 0.051 0.037
0.025 0.0140.00800000000000001 0.012
14 24.519230769230819.892473118279618 12.01923076923087.5268817204301122 3.846153846153856.45161290322581
Chart Spa Group D Group N-7 5 0 46 490 17 32 46 49+7 15 8 46 49+14 9 9 46 49
Chart Spa Group D Group N Chart Spa Group D Group N-7 10.8695652173913 0 -7 0.234 0.1980 36.9565217391304 65.3061224489796 0 0.208 0.19
Correlation +7 32.6086956521739 16.3265306122449 +7 0.202 0.185-0.838022023794689 +14 19.5652173913043 18.3673469387755 +14 0.21 0.179-0.123430442777081 0.032 0.019
0.00599999999999998 0.0115 0 0.007999999999999980.00600000000000001
17 32 15.841584158415810.614525139664815 8 2.970297029702966.145251396648059 9 3.960396039603953.35195530726257
Line Spa Group D Group N0.8 2 5 45 481 15 19 45 481.2 18 19 45 481.4 10 5 45 48
Line Spa Group D Group N Line Spa Group D Group N0.8 4.44444444444444 10.4166666666667 0.8 0.233 0.2061 33.3333333333333 39.5833333333333 1 0.236 0.207
Correlation 1.2 40 39.5833333333333 1.2 0.237 0.2050.451017032441845 1.4 22.2222222222222 10.4166666666667 1.4 0.226 0.2040.447213595499958 0.00700000000000001 0.001
0.00999999999999998 -0.0010.011 -0.002
3.097345132743370.4854368932038844.42477876106194-0.4854368932038844.86725663716813-0.970873786407768
Par Spacing Group D Group N0.4 23 4 131 381 43 10 131 382 30 22 131 383 35 2 131 38
Par Spacing Group D Group N Par Spacing Group D Group N0.4 17.5572519083969 10.5263157894737 0.4 0.233 0.1981 32.824427480916 26.3157894736842 1 0.228 0.198
Correlation 2 22.9007633587786 57.8947368421053 2 0.22 0.196-0.274103716415761 3 26.7175572519084 5.26315789473684 3 0.221 0.197-0.676968662049936 0.013 0.002
0.00800000000000001 0.0020.001 0.001
5.909090909090911.020408163265313.636363636363641.020408163265310.4545454545454550.510204081632654
Column Width Group D Group N22 12 1 44 4444 14 24 44 4466 14 16 44 4488 4 3 44 44
Column Width Group D Group N Column Width Group D Group N22 27.2727272727273 2.27272727272727 22 0.219 0.19144 31.8181818181818 54.5454545454545 44 0.214 0.19
Correlation 66 31.8181818181818 36.3636363636364 66 0.221 0.1870.402618283010223 88 9.09090909090909 6.81818181818182 88 0.215 0.187-0.0148014204124575 0.005 0.004
0.00700000000000001 0.0031 0.001 02 2.336448598130842.139037433155083 3.271028037383181.604278074866314 0.467289719626169 05678
Colors Group D Group Nblack-white 5 15 46 65
blackoff-whiteoff 2 9 46 65yellow-black 15 11 46 65blue-white 5 4 46 65
brown-green 3 0 46 65black-creme 7 16 46 65
dark brown-green 4 3 46 65yellow-blue 5 7 46 65
Colors Group D Group N Colors Group D Group Nblack-creme black-white 10.8695652173913 23.0769230769231 black-creme 0.208 0.187yellow-blue blackoff-whiteoff 4.34782608695652 13.8461538461538 yellow-blue 0.214 0.182
brown-green yellow-black 32.6086956521739 16.9230769230769 brown-green 0.221 0.194blackoff-whiteoff blue-white 10.8695652173913 6.15384615384615 blackoff-whiteoff 0.222 0.201
black-white brown-green 6.52173913043478 0 black-white 0.223 0.195blue-white black-creme 15.2173913043478 24.6153846153846 blue-white 0.228 0.18
dark brown-green dark brown-green 8.69565217391304 4.61538461538461 dark brown-green 0.228 0.203yellow-black yellow-blue 10.8695652173913 10.7692307692308 yellow-black 0.23 0.189
black-creme 15.2173913043478 24.6153846153846 0.006000000000000010.00700000000000001yellow-blue 10.8695652173913 10.7692307692308 0.013 0.002brown-green 6.52173913043478 0 0.014 0.014blackoff-whiteoff 4.34782608695652 13.8461538461538 0.015 0.021black-white 10.8695652173913 23.0769230769231 0.02 0.015blue-white 10.8695652173913 6.15384615384615 0.02 0
Correlation dark brown-green 8.69565217391304 4.61538461538461 0.022 0.023yellow-black 32.6086956521739 16.9230769230769 0.00900000000000001
black-creme0.0918053760955382 yellow-blue 2.884615384615393.88888888888889black-creme 3.88888888888889-0.735791591345596 brown-green 6.250000000000011.11111111111111yellow-blue 1.11111111111111
blackoff-whiteoff 6.730769230769247.77777777777778brown-green 7.77777777777778black-white 7.2115384615384711.6666666666667blackoff-
whiteoff11.6666666666667
blue-white 9.615384615384628.33333333333334black-white 8.33333333333334dark brown-green 9.61538461538462 0 blue-white 0
yellow-black 10.576923076923112.7777777777778dark brown-green
12.7777777777778
5 yellow-black 5
Text Grey Scale
0
25
50
75
100
0% 25% 50% 75%Group D Group C
Chart 2
0
15
30
45
60
Untitled 1 Untitled 2 Untitled 3 Untitled 4
Back Contrast Colors
Background Grey Scale
0
15
30
45
60
0% 25% 50% 75%Group D Group C
Font Size
0
20
40
60
80
14 18 22 26Group D Group C
Character Spacing
0
17.5
35
52.5
70
–7% 0% +7% +14%Group D Group C
Line Spacing
0
10
20
30
40
0.8 1 1.2 1.4Group D Group C
Paragraph Spacing
0
15
30
45
60
0.5 1 2 3Group D Group C
Column Width
0
15
30
45
60
22 44 66 88Group D Group C
Text and Background Colors
0
10
20
30
40
Group D Group C
Text Grey Scale
0.1
0.138
0.175
0.213
0.25
0% 25% 50% 75%Group D Group C
Background Grey Scale
0.1
0.138
0.175
0.213
0.25
0% 25% 50% 75%Group D Group C
Text and Background Colors
0.1
0.138
0.175
0.213
0.25
Group D Group C
Font Size
0.1
0.138
0.175
0.213
0.25
14 18 22 26Group D Group C
Line Spacing
0.1
0.138
0.175
0.213
0.25
0.8 1 1.2 1.4Group D Group C
Paragraph Spacing
0.1
0.138
0.175
0.213
0.25
0.5 1 2 3Group D Group C
Column Width
0.1
0.138
0.175
0.213
0.25
22 44 66 88Group D Group C
Character Spacing
0.1
0.138
0.175
0.213
0.25
–7% 0% +7% +14%Group D Group C
lines lines lines lines
lines lines
char. char.
grey grey
grey grey
brown/g
reen
dark b
rown/
light g
reen
black/
yellow
blue/y
ellow
blue/w
hite
black/
creme
black
off/
white offbla
ck/whit
e
brown/g
reen
dark b
rown/
light g
reen
black/
yellow
blue/y
ellow
blue/w
hite
black/
creme
black
off/
white off
black/
white
points points
char. char.
Fixa
tion
Dura
tion
(sec
.)
Pref
eren
ce R
atin
g (%
)Pr
efer
ence
Rat
ing
(%)
Pref
eren
ce R
atin
g (%
)Pr
efer
ence
Rat
ing
(%)
Pref
eren
ce R
atin
g (%
)Pr
efer
ence
Rat
ing
(%)
Pref
eren
ce R
atin
g (%
)
Pref
eren
ce R
atin
g (%
)
Fixa
tion
Dura
tion
(sec
.)Fi
xatio
n Du
ratio
n (s
ec.)
Fixa
tion
Dura
tion
(sec
.)
Fixa
tion
Dura
tion
(sec
.)Fi
xatio
n Du
ratio
n (s
ec.)
Fixa
tion
Dura
tion
(sec
.)Fi
xatio
n Du
ratio
n (s
ec.)
Although no more significant effects were found,
people with dyslexia were in general more sensitive to
text-presentation changes, since they presented larger
differences in fixation duration among the different con-
ditions.
Regarding the differences between the groups, the
results are consistent with other eye tracking studies
that found significant differences among the two popu-
lations [41,46,72,75,76].
Regarding the sensitivity of fixation duration with
respect to the parameters, there are clearly two differ-
ent groups for people with dyslexia, even when normal-
izing with respect to the range of values used in each
parameter. The first group is the set of parameters that
affect reading performance in a large percentage (10%
or above), which are in order of importance: font size,
character spacing, text and background color, and text
grey scale. This group seems to suggest that the most
important high-level characteristic that the text needs,
is to let people to distinguish letters well. The second
group, where impact is 5% or less, is formed by para-
graph spacing, background gray scale, line spacing and
column width. This suggests that distinguishing words
and lines is less important, and that most probably,
word spacing also does not have a large impact in read-
ability (unless it gets really small).
For group C the order above changes a bit, though
groups remain the same. In the first group, character
spacing moves to the last position (fourth). In the sec-
ond group paragraph spacing moves to the last position
and column width and line spacing are swapped. How-
ever, as the readability impact of these three parameters
mentioned is 2% or less, the order is not really relevant.
Each parameter is discussed in detail in the following.
Text Grey scale. Using a pure black text on a pure
white background is not recommended for people with
dyslexia due to its high contrast, as many of them are
sensitive to the brightness and this can cause the words
to swirl or blur together [11]. No effects on objetive
readability could be found. Most of participants with-
out dyslexia (93,88%) chose black over white as the

14
most readable option, maybe because it is the most
frequent color combination used in computer screens.
However, only 60% of the participants with dyslexia
chose this option.
Background Grey scale. No recommendations
about grey scale background for people with dyslexia
could be found, apart from the suggestion of using light
grey as background [101], such as the color with the fol-
lowing hexadecimal code: FFFFE5 [89]. No differences
on the objective readability of the participants could be
identified. However, most of the study participants said
that grey actually did not help them. Further experi-
ments shall be carried out about the role of the back-
ground, because light on dark has different readability
requirements than dark on light [21].
Text and Background Color. Poor color selections
are one of the key problems encountered by people
with dyslexia when reading [55]. Although the pair off-
black/off-white is the one recommended for Web acces-
sibility for dyslexics [11], it was the least often selected
by the participants with dyslexia (only two selected
it). The most preferred color pair chosen by the par-
ticipants with dyslexia was black over yellow, which is
not consistent with [11], who recommends to avoid high
contrast (black/white is the highest contrast combina-
tion). According to [67], high contrasts creates so much
vibration that it diminishes readability. Also, mucky
green/brown and blue/yellow pairs were chosen by peo-
ple with dyslexia, as in the experiments carried out by
Gregor and Newell [36,37].
Surprisingly, the most often selected pair
(black/yellow) has the highest mean for the fixa-
tion durations (0.23 seconds). As comparison, the
average of the color combinations is 0.22 seconds. On
the other hand, the color pair which was the fastest to
read was black/creme (mean of 0.21 for the fixation
duration). This pair of colors is used by the British
Dyslexia Association for their website.11
According to the W3C algorithm [110], brightness
differences of less than 125 and color differences of less
than 500 are not supposed to be good. All the pair col-
ors selected by the participants match this guideline, ex-
cept dark brown/light mucky green pair (brightness dif-
ference: 107, color difference: 240). However, the read-
ability of colored text/background pairs is influenced
by the size of the text [21] and the size used in this
study was 20 points.
For group C, higher preferences ratings were
strongly correlated with shorter fixations. In this case
11 http://www.bdadyslexia.org.uk/
blue/white and blue/yellow where the best pairs of col-
ors, suggesting than in future experiments blue/creme
should also be tried.
Font Size. Another key problem experienced by peo-
ple with dyslexia is finding the text too small [55]. Al-
though the recommended font size for this target group
is 12 or 14 points [1,12,11], some readers with dyslexia
may prefer a larger font [25,12].
For both groups, texts presented with 18, 22, and
26 point size led to significant shorter fixation durations
compared to texts with 14 points. For participants with
dyslexia, texts with 22 and 26 points also led to sig-
nificant shorter fixation durations than texts with 14
points. Hence, larger font sizes are more readable for
people with and without dyslexia.
Unexpectedly, more than half of the participants
with and without dyslexia, 24 and 26 respectively,
selected the biggest option (26 points). None chose
the smaller option, 14 points, which is already a rec-
ommended and relatively big font size. Since all the
columns had the same width (a mean of 50 characters
for 12 points), column width could not influence these
decisions. Further investigations shall be carried out to
find the font size preferred by people with and with-
out dyslexia, as clearly there must be a turning point
where a very large size starts making the reading more
difficult.
In a later study, Rello et al [87] tested the effect of
font size and line spacing on Wikipedia web pages us-
ing eye tracking. They found significant improvements
(in objective readability and comprehensibility) within
groups starting from 18 points font size instead of 22
points. This can be due to the fact that this study mea-
sured the impact of font size in the context of the Web
and not in raw text.
Character Spacing. Pedley recommends creating a
slightly larger distance between individual words and
reduce letter-spacing slightly [66], so that the letters
within a word lie closer together while Rainger sug-
gests to have large spacing between letter combinations
[71]. Zorzi et al. [113] conducted studies on paper –
not on screen– obtaining that larger character spac-
ings improved the reading performance of children with
dyslexia (reading speed and reading errors).
Consistently, the results of the present study show
that participants (groups D and C) present significant
shorter fixation durations with character spacing of
+7% and +14%, while -7% lead to significant longer fix-
ation durations. However, no differences within groups
could be found. Also, the results show that most of
the participants without dyslexia significantly prefer

15
the standard spacing among characters (32 users) and
that participants with dyslexia prefer either the stan-
dard separation or more separated characters (17 users
for 0% and 15 for +7%).
Line Spacing. Even though it is recommended to use
a line spacing of 1.5 to 2 [71], the results show that
line spacing does not have a significant effect on the
participants’ readability and preferences. Similarly, in
[87] line spacing was tested using eye tracking finding
no effects on objective readability.
Paragraph Spacing. According to Bradford [11],
paragraphs –even when they have a single line– should
always be spaced out with an empty line between each
paragraph. However, the effect of paragraph spacing on
objective readability and on the user preferences has
been found in the results of the present study.
Column Width. Accordingly to [11,12], which rec-
ommend to avoid long lines –60 to 70 characters– and
to avoid narrow columns [12], most of the participants
preferred the intermediate values: paragraphs with lines
of 44 (14 users in group D and 24 in group C) or 66
characters (14 users in group D and 16 in group C).
These results are not comparable with Schneps et al.
[91] since they used a 34 points font and other devices
in their experiment. Some of the participants said that
they preferred the text with the widest column because
they believed it was shorter than the others. Since the
texts had the same number of words a side effect of
having a wider column width was that the text had
less lines and seemed to be shorter.
7 Limitations of the Study
Even if in shallow languages, as Spanish [93], one of the
main characteristic of reading with dyslexia is that their
reading process is slower [24], shorter fixation durations
can be used as indicator of text readability, not as a
possible alleviation of the issues related to dyslexia and
reading.
One limitation of the study is that it only uses fix-
ation duration as a measure of reading performance.
Other measures such as reading errors were not used
because the reading was done in silence trying to emu-
late natural online reading. Reading time was also not
used because the texts lengths were not the same. Com-
prehension could also have been used as a measure,
however it was only used as a control variable because
the text presentation was modified for different frag-
ments among the two stories and it was not possible to
discriminate if the comprehension was due to compre-
hending a single fragment or the whole story. Further
studies shall overcome this limitation and measure ob-
jective readability using more dependent measures.
Moreover, the texts tested were small so the results
are not extensible to longer reading tasks such as emails
or heavy-text web pages. For instance, the effect of font
size and line spacing was tested on Wikipedia pages us-
ing eye tracking and a significant effect for only people
with dyslexia started at 18 points font size instead of
22 points as in the present study [87].
Another limitation is that this study does not take
into consideration the interaction effects between vari-
ables. All the conditions were tested independently.
While Tinker found multiple interactions between var-
ious typographical parameters [97] others did not [8,
87]. One example of interactions found by Tinker [96]
was between font size and line width, showing that long
lines, very short lines, and small type size, and the com-
binations of these lead to significantly slower readings.
Using eye tracking, Beymer et al. [8] compared font size
and font type and found no significant effects. Also, no
interaction effects between font size and line width were
found in Rello et al. [87] when reading Wikipedia texts.
A recent study [112] has shown that brain process-
ing differs from prose to poetry. The authors are not
aware the are no studies that compare the interaction
of dyslexia and prose versus poetry. The fact that both
genres have been used in the experiment could have
added a hidden variable. However, all levels of each of
the conditions were always shown with the same kind
of text. Only line spacing and paragraph spacing used
texts in prose.
One of the reasons that could explain why the com-
prehension was so high in the study is that the different
use of text customization could have enhanced the com-
prehension. For instance, Frase and Schwartz used line
breaking to increase the speed of comprehension [32].
8 Text Customization Recommendations
Table 3 presents a set of recommendations for format-
ting screen text in a more accessible way for people
with dyslexia. Both quantitative data for the readabil-
ity (objective readability) of the text given by the eye
tracker and the user preferences (subjective readability)
have been considered. Since the user preferences might
change with time [5] priority was given to the objective
readability data in the recommendations. The authors’
own results regarding font type are included, because
the experimental setting was very similar: same de-
fault text presentation, same equipment (eye tracker),

16
Values with positive effectsCondition Measures with Dyslexia without Dyslexia
Font Size Obj. Readability 18, 22 and 26 points22 and 26 points 26 points
Subj. Preferences 26 points 26 pointsRecommendation: ranging from 18 to 26 points
Character Spacing Obj. Readability +7% and +14%no effects no effects
Subj. Preferences no effects 0%Recommendation: ranging from 0%, +7% to +14%
Line Spacing Obj. Readability no effects no effectsSubj. Preferences no effects no effectsNo recommendations
Paragraph Spacing Obj. Readability no effects no effectsSubj. Preferences no effects no effectsNo recommendations
Grey Text (white background) Obj. Readability no effects no effectsSubj. Preferences 0% 0%
Grey Background (white text) Obj. Readability no effects no effectsSubj. Preferences 0% 0%Recommendation: black font on white background, or
white font on black backgroundColors (text/background) Obj. Readability no effects no effects
Subj. Preferences no effects no effectsNo recommendations
Column Width Obj. Readability no effects no effectsSubj. Preferences no effects 44 char./lineNo recommendations
Font Type Obj. Readability Arial ArialCourier CourierCMU CMUHelvetica Verdana
Subj. Preferences Verdana VerdanaHelvetica HelveticaArial Arial
Recommendation: Arial, Courier, CMU, Helvetica,and Verdana
Obj. Readability roman romansans serif sans serifmonospaced monospaced
Subj. Preferences roman romansans serif no effectsno effects proportional
Recommendation: roman and sans serif
Table 3 Text customization results and recommendations for more readable screen text. Each of the parameters are inde-pendent from each other and no interactions between them were tested in the experiments. Font Size and Character Spacingdistinguish between effects taking into account both groups and within groups because different effects were found in bothcases.
same independent and dependent variables and similar
methodology [79].
Notice that the results for each of the parameters
are independent from each other and no interactions
between them were tested in the experiment. These are
only text customization recommendations, the combi-
nation of the parameters and the final customization
of the text are left to the user. Certain studies have
shown the benefits of self text customization [37,25].
Furthermore, WebAIM [106], British Dyslexia Associ-
ation [12], as well as the Web Accessibility Initiative
(WAI) [110] recommend text customization. Further-
more, depending on the individual, dyslexia could po-
tentially show reading performance issues in many pos-
sible ways. Also, the degree of severity differs from indi-
vidual to individual [108]. This suggests that text cus-
tomizability is more likely to better support the overall
population than a single option. Therefore the recom-
mendations addressed in this work shall be taken as
a starting setting for text customization. Nonetheless,
note that only half of the participants with dyslexia –
and without dyslexia– are able to guess correctly which

17
text parameters lead them to an objective faster read-
ing.
According to the results of this study, the parame-
ters that enhance readability are very similar for both,
people with and without dyslexia. Even if reading times
for group C will be still smaller than for group D, these
recommendations can be used for all the population
without problems as the difficulty of reading is being
balanced.
9 Conclusions and Future Work
The effect of eight text presentation parameters on ob-
jective readability and subjective preferences for people
with and without dyslexia was tested. For readability,
the main conclusions are that:
– Larger font sizes significantly improve readability,
especially for people with dyslexia (ranging from 18
to 24 points);
– Larger character spacings (up to +7% - +14%) sig-
nificantly improve readability for people with and
without dyslexia;
– Regarding preferences, both groups found texts with
no grey scales and with larger font sizes significantly
more readable;
– Participants without dyslexia also found texts with
standard character spacing and 44 characters per
line column width significantly more readable.
These findings can have impact on screen text pre-
sentation recommendations and on the text options
chosen by developers, designers, or content produc-
ers when they target people with dyslexia. For in-
stance, these recommendations have been adapted and
included in two eBook readers for people with dyslexia,
one for Android (IDEAL eBook Reader [47]) and one
for iOS (DysWebxia Reader [83]), in a game for chil-
dren with dyslexia Piruletras or Dyseggxia [85], and in
the Text4All [99,100] web service.12 Below the recom-
mendations are summarized and Figure 10 shows an
example that uses the text recommendations for font
size and character spacing, where the rest of the cus-
tomization parameters were left to the user [80]:
– Font Size: 18, 22 and 26 points (17-Inch screen).
– Character Spacing: ranging from 0%, +7% to
+14%.
– Font/Background Colors: black font on white
background, or white font on black background.
– Typeface: Arial, Courier, CMU, Helvetica, or Ver-
dana.
– Font Style: roman and sans serif.
12 http://www.text4all.net/.
Fig. 10 Text example using the dyslexic-accessible recom-mendations for font size and character spacing. There is noevidence that the effects would be cumulatively positive.
‘Simpler’
Ideal
Configuration
Font
Synonyms
Color
Helvetica
However, there are still problems found by individ-
uals with dyslexia which remain unsolved. Given that
dyslexia is a learning disability that affects language,
it can be assumed that accessibility can be approached
not only in terms of text presentation, but also in terms
of text content [4]. The use of complicated language has
been extensively pointed out as one of the key prob-
lems for this target group. For instance, more frequent
and shorter words may improve readability for people
with dyslexia [24,82], so they may benefit from tools
that modify the text content by performing lexical sim-
plification [80,81]. The authors are currently exploring
which other text-modification strategies apart from lex-
ical simplification might be beneficial for users with
dyslexia.
Acknowledgements The authors would like to thank Mari-Carmen Marcos for her assistance with the eye tracking hard-ware. Special thanks to the participants with dyslexia andtheir families.
References
1. Al-Wabil, A., Zaphiris, P., Wilson, S.: Web navigationfor individuals with dyslexia: an exploratory study. Uni-versal Access in Human Computer Interaction. Copingwith Diversity 4554, 593–602 (2007)

18
2. American Psychiatric Association: Diagnostic and sta-tistical manual of mental disorders: DSM-IV-TR. Amer-ican Psychiatric Publishing, Inc. (2000)
3. Baeza-Yates, R., Rello, L.: Estimating dyslexia in theWeb. In: Proc. W4A 2011. ACM Press, Hyderabad,India (2011)
4. Baeza-Yates, R., Rello, L., Dembowski, J.: A context-aware synonym simplification algorithm: CASSA. In:Proc. NAACL ’15. ACM, Denver, Colorado, USA (2015)
5. Barnum, C.M.: Usability Testing Essentials: Ready,Set... Test! Morgan Kaufmann (2010)
6. Beauvois, M.F., Derouesne, J.: Phonological alexia:three dissociations. Journal of Neurology, Neurosurgery& Psychiatry 42, 1115–1124 (1979)
7. Berninger, V.W., Nielsen, K.H., Abbott, R.D., Wijs-man, E., Raskind, W.: Writing problems in develop-mental dyslexia: Under-recognized and under-treated.Journal of School Psychology 46(1), 1–21 (2008)
8. Beymer, D., Russell, D., Orton, P.: An eye trackingstudy of how font size and type influence online read-ing. In: Proceedings of the 22nd British HCI GroupAnnual Conference on People and Computers: Cul-ture, Creativity, Interaction - Volume 2, BCS-HCI ’08,pp. 15–18. British Computer Society, Swinton, UK,UK (2008). URL http://dl.acm.org/citation.cfm?
id=1531826.1531831
9. Boldyreff, C., Burd, E., Donkin, J., Marshall, S.: Thecase for the use of plain English to increase Web acces-sibility. wse p. 42 (2001)
10. Bouma, H., Legein, C.P.: Foveal and parafoveal recog-nition of letters and words by dyslexics and by averagereaders. Neuropsychologia 15(1), 69–80 (1977)
11. Bradford, J.: Designing web pages for dyslexic readers(2011). http://www.dyslexia-parent.com/mag35.html
12. British Dyslexia Association: Dyslexia style guide(2012). http://www.bdadyslexia.org.uk/
13. Bruck, M.: The word recognition and spelling of dyslexicchildren. Reading Research Quarterly pp. 51–69 (1988)
14. Bruck, M.: Word-recognition skills of adults with child-hood diagnoses of dyslexia. Developmental Psychology26(3), 439 (1990)
15. Bruck, M.: Component spelling skills of college studentswith childhood diagnoses of dyslexia. Learning Disabil-ity Quarterly pp. 171–184 (1993)
16. Brunswick, N.: Unimpaired reading development anddyslexia across different languages. In: S. McDougall,P. de Mornay Davies (eds.) Reading and dyslexia indifferent orthographies, pp. 131–154. Psychology Press,Hove (2010)
17. Caldwell, B., Cooper, M., Reid, L.G., Vanderheiden,G.: Web content accessibility guidelines (WCAG) 2.0.WWW Consortium (W3C) (2008)
18. Carrillo, M.S., Alegrıa, J., Miranda, P., Perez, S.: Eval-uacion de la dislexia en la escuela primaria: Prevalenciaen espanol (Evaluation of dyslexia in primary school:The prevalence in Spanish). Escritos de Psicologıa (Psy-chology Writings) 4(2), 35–44 (2011)
19. Chapman, C.: The most popular fonts used by design-ers (2011). http://www.webdesignerdepot.com/2011/
08/the-most-popular-fonts-used-by-designers/
20. Cohen, L., Dehaene, S., Verstichel, P.: Number wordsand number non-words: A case of deep dyslexia extend-ing to Arabic numerals. Brain 117, 267–279 (1994)
21. Collier, D.: Colour text legibility (2012).http://www.hgrebdes.com/colour/spectrum/
colourvisibility.html
22. Coltheart, M., Masterson, J., Byng, S., Prior, M., Ri-doch, J.: Surface dyslexia. The Quarterly Journal ofExperimental Psychology A: Human Experimental Psy-chology 35A, 469–495 (1983)
23. Cornoldi, C., Oakhill, J.V.: Reading comprehension dif-ficulties: Processes and intervention. Routledge (2013)
24. Cuetos, F., Valle, F.: Modelos de lectura y dislexias(Reading models and dyslexias). Infancia y Aprendizaje(Infancy and Learning) 44, 3–19 (1988)
25. Dickinson, A., Gregor, P., Newell, A.F.: Ongoing in-vestigation of the ways in which some of the problemsencountered by some dyslexics can be alleviated usingcomputer techniques. In: Proc. ASSETS’02, pp. 97–103.Edinburgh, Scotland (2002)
26. Dixon, M.: Comparative study of disabled vs. non-disabled evaluators in user-testing: dyslexia and firstyear students learning computer programming. Univer-sal Access in Human Computer Interaction. Coping withDiversity pp. 647–656 (2007)
27. Elbro, C., Nielsen, I., Petersen, D.K.: Dyslexia in adults:Evidence for deficits in non-word reading and in thephonological representation of lexical items. Annals ofdyslexia 44(1), 203–226 (1994)
28. Ellis, A.W.: Reading, writing and dyslexia. Erlbaum,London (1984)
29. Evans, B.: Dyslexia and vision, vol. 5. Wiley (2001)30. Evans, B.J., Cook, A., Richards, I.L., Drasdo, N.: Effect
of pattern glare and colored overlays on a simulated-reading task in dyslexics and normal readers. Optome-try & Vision Science 71(10), 619–628 (1994)
31. Evett, L., Brown, D.: Text formats and web design forvisually impaired and dyslexic readers-clear text for all.Interacting with Computers 17, 453–472 (2005)
32. Frase, L.T., Schwartz, B.J.: Typographical cues that fa-cilitate comprehension. Journal of Educational Psychol-ogy 71(2), 197 (1979)
33. Frith, U.: A developmental framework for developmentaldyslexia. Annals of dyslexia 36(1), 67–81 (1986)
34. Garcıa-Albea, J.E., Sanchez-Casas, R.M., Viso, S.: Efec-tos de la frecuencia de uso en el reconocimiento de pal-abras (Effects of usage frequency in word recognition).Investigaciones psicologicas (Psychological Research) 1,24–63 (1982)
35. Goulandris, N.E.: Dyslexia in different languages: Cross-linguistic comparisons. Whurr Publishers (2003)
36. Gregor, P., Dickinson, A., Macaffer, A., Andreasen, P.:Seeword: a personal word processing environment fordyslexic computer users. British Journal of EducationalTechnology 34(3), 341–355 (2003)
37. Gregor, P., Newell, A.F.: An empirical investigation ofways in which some of the problems encountered bysome dyslexics may be alleviated using computer tech-niques. In: Proc. ASSETS’00, ASSETS 2000, pp. 85–91.ACM Press, New York, NY, USA (2000)
38. Hagtvet, B.E.: Listening comprehension and readingcomprehension in poor decoders: Evidence for the im-portance of syntactic and semantic skills as well asphonological skills. Reading and writing 16(6), 505–539(2003)
39. Holmes, V., Carruthers, J.: The relation between read-ing and spelling in skilled adult readers. Journal of mem-ory and language 39(2), 264–289 (1998)
40. Hyona, J., Olson, R.K.: Eye fixation patterns amongdyslexic and normal readers: Effects of word length andword frequency. Journal of Experimental Psychology:Learning, Memory, and Cognition 21(6), 1430 (1995)

19
41. Inhoff, A.W., Rayner, K.: Parafoveal word processingduring eye fixations in reading: Effects of word fre-quency. Perception & Psychophysics 40(6), 431–439(1986)
42. Interagency Commission on Learning Disabilities:Learning Disabilities: A Report to the U.S. Congress.Government Printing Office, Washington DC, U.S.(1987)
43. International Dyslexia Association: Definition ofdyslexia: http://interdys.org/DyslexiaDefinition.
htm (2011). Based in the initial definition of theResearch Committee of the Orton Dyslexia Society,former name of the IDA, done in 1994
44. Jeanes, R., Busby, A., Martin, J., Lewis, E., Stevenson,N., Pointon, D., Wilkins, A.: Prolonged use of colouredoverlays for classroom reading. British Journal of Psy-chology 88(4), 541–548 (1997)
45. Jimenez, J.E., Guzman, R., Rodrıguez, C., Artiles, C.:Prevalencia de las dificultades especıficas de apren-dizaje: La dislexia en espanol (the prevalence of specificlearning difficulties: Dyslexia in Spanish). Anales dePsicologıa (Annals of Psychology) 25(1), 78–85 (2009)
46. Just, M.A., Carpenter, P.A.: A theory of reading: Fromeye fixations to comprehension. Psychological review87, 329–354 (1980)
47. Kanvinde, G., Rello, L., Baeza-Yates, R.: IDEAL: adyslexic-friendly e-book reader (poster). In: Proc. AS-SETS’12, pp. 205–206. Boulder, USA (2012)
48. Keenan, J.M., Betjemann, R.S., Olson, R.K.: Readingcomprehension tests vary in the skills they assess: Differ-ential dependence on decoding and oral comprehension.Scientific Studies of Reading 12(3), 281–300 (2008)
49. Kriss, I., Evans, B.J.W.: The relationship betweendyslexia and Meares-Irlen Syndrome. Journal of Re-search in Reading 28(3), 350–364 (2005)
50. Kurniawan, S., Conroy, G.: Comparing comprehensionspeed and accuracy of online information in studentswith and without dyslexia. Advances in Universal WebDesign and Evaluation: Research, Trends and Opportu-nities, Idea Group Publishing, Hershey, PA pp. 257–70(2006)
51. Landerl, K., Bevan, A., Butterworth, B., et al.: Devel-opmental dyscalculia and basic numerical capacities: Astudy of 8–9-year-old students. Cognition 93(2), 99–125(2004)
52. Lewis, C.: Using the “thinking-aloud” method in cogni-tive interface design. IBM TJ Watson Research Center(1982)
53. Lockley, S.: Dyslexia and higher education: accessibilityissues. The Higher Education Academy (2002)
54. Lyon, G.R.: Toward a definition of dyslexia. Annals ofDyslexia 45(1), 3–27 (1995)
55. McCarthy, J.E., Swierenga, S.J.: What we know aboutdyslexia and web accessibility: a research review. Uni-versal Access in the Information Society 9, 147–152(2010)
56. McClelland, J.L.: Preliminary letter identification in theperception of words and non-words. Journal of Ex-perimental Psychology: Human Perception and Perfor-mance 2(1), 80–91 (1976)
57. Mosberg, L., Johns, D.: Reading and listening compre-hension in college students with developmental dyslexia.Learning Disabilities Research & Practice (1994)
58. Nielsen, J.: Lower-literacy users (2012). Jakob Nielsen’sAlertbox. http://www.useit.com/alertbox/20050314.
html
59. O’Brien, B.A., Mansfield, J.S., Legge, G.E.: The effectof print size on reading speed in dyslexia. Journal ofResearch in Reading 28(3), 332–349 (2005)
60. Olson, R.K., Kliegl, R., Davidson, B.J.: Dyslexic andnormal readers’ eye movements. Journal of Experimen-tal Psychology: Human Perception and Performance9(5), 816 (1983)
61. Paciello, M.G.: Web accessibility for people with disabil-ities. CMP Books, Lawrence, Kansas (2000)
62. Patterson, K., Marshall, J.C., Coltheart, M.: Surfacedyslexia: Neuropsychological and cognitive studies ofphonological reading. Lawrence Erlbaum Associates,London (1985)
63. Patterson, K.E.: Neuropsychological approaches to thestudy of reading. British Journal of Psychology 72(2),151–174 (1981)
64. Patterson, K.E.: The relation between reading andphonological coding: Further neuropsychological obser-vations. Neurocase 1(3), 251–257 (1995)
65. Paulesu, E., Demonet, J.F., Fazio, F., McCrory, E.,Chanoine, V., Brunswick, N., Cappa, S.F., Cossu, G.,Habib, M., Frith, C.D., Frith, U.: Dyslexia: Cultural di-versity and biological unity. Science 291(5511), 2165–2167 (2001)
66. Pedley, M.: Designing for dyslexics: Part 3(2006). http://accessites.org/site/2006/11/
designing-for-dyslexics-part-3-of-367. Perron, C.: Colour choices on web pages: Contrast
vs readability (2012). http://www.writer2001.com/
index.htm68. Pirozzolo, F.J., Rayner, K.: The neural control of eye
movements in acquired and developmental reading dis-orders. Studies in Neurolinguistics 4, 1–27 (1978)
69. Pollak, D.: Dyslexia, the self and higher education:Learning life histories of students identified as dyslexic.Trentham Books Ltd (2005)
70. Rack, J.P., Snowling, M.J., Olson, R.K.: The nonwordreading deficit in developmental dyslexia: A review.Reading Research Quarterly pp. 29–53 (1992)
71. Rainger, P.: A dyslexic perspective on e-content ac-cessibility (2012). www.texthelp.com/media/39360/
USDyslexiaAndWebAccess.PDF72. Raney, G.E., Rayner, K.: Word frequency effects and
eye movements during two readings of a text. CanadianJournal of Experimental Psychology 49(2), 151 (1995)
73. Rayner, K.: Eye movements and the perceptual span inbeginning and skilled readers. Journal of experimentalchild psychology 41(2), 211–236 (1986)
74. Rayner, K.: Eye movements in reading and informationprocessing: 20 years of research. Psychological Bulletin124, 372–422 (1998)
75. Rayner, K., Duffy, S.A.: Lexical complexity and fixationtimes in reading: Effects of word frequency, verb com-plexity, and lexical ambiguity. Memory & Cognition14(3), 191–201 (1986)
76. Rayner, K., Raney, G.E.: Eye movement control in read-ing and visual search: Effects of word frequency. Psy-chonomic Bulletin & Review 3(2), 245–248 (1996)
77. Rello, L., Baeza-Yates, R.: Lexical quality as a proxy forweb text understandability (poster). In: Proc. WWW’12, pp. 591–592. Lyon, France (2012)
78. Rello, L., Baeza-Yates, R.: The presence of English andSpanish dyslexia in the Web. New Review of Hyperme-dia and Multimedia 8, 131–158 (2012)
79. Rello, L., Baeza-Yates, R.: Good fonts for dyslexia. In:Proc. ASSETS’13. ACM Press, Bellevue, Washington,USA (2013)

20
80. Rello, L., Baeza-Yates, R.: Evaluation of Dyswebxia: Areading app designed for people with dyslexia. In: Proc.W4A ’14. Seoul, Korea (2014)
81. Rello, L., Baeza-Yates, R., Bott, S., Saggion, H.: Sim-plify or help? Text simplification strategies for peoplewith dyslexia. In: Proc. W4A ’13. Rio de Janeiro, Brazil(2013)
82. Rello, L., Baeza-Yates, R., Dempere, L., Saggion, H.:Frequent words improve readability and short words im-prove understandability for people with dyslexia. In:Proc. INTERACT ’13. Cape Town, South Africa (2013)
83. Rello, L., Baeza-Yates, R., Saggion, H., Bayarri, C., Bar-bosa, S.D.J.: An iOS reader for people with dyslexia(demo). In: Proc. ASSETS’13. ACM Press, Bellevue,Washington, USA (2013)
84. Rello, L., Bautista, S., Baeza-Yates, R., Gervas, P.,Hervas, R., Saggion, H.: One half or 50%? An eye-tracking study of number representation readability. In:Proc. INTERACT ’13. Cape Town, South Africa (2013)
85. Rello, L., Bayarri, C., Otal, Y., Pielot, P.: A computer-based method to improve the spelling of children withdyslexia using errors. In: Proc. The 16th InternationalACM SIGACCESS Conference of Computers and Ac-cessibility (ASSETS 2014). Rochester, USA (2014)
86. Rello, L., Kanvinde, G., Baeza-Yates, R.: Layout guide-lines for web text and a web service to improve acces-sibility for dyslexics. In: Proc. W4A ’12. ACM Press,Lyon, France (2012)
87. Rello, L., Pielot, M., Marcos, M.C., Carlini, R.: Sizematters (spacing not): 18 points for a dyslexic-friendlyWikipedia. In: Proc. W4A ’13. Rio de Janeiro, Brazil(2013)
88. Rubenstein, H., Garfield, L., Millikan, J.A.: Homo-graphic entries in the internal lexicon1. Journal of Ver-bal Learning and Verbal Behavior 9(5), 487–494 (1970)
89. de Santana, V.F., de Oliveira, R., Almeida, L.D.A.,Baranauskas, M.C.C.: Web accessibility and people withdyslexia: a survey on techniques and guidelines. In:Proc. W4A ’12, p. 35. ACM (2012)
90. Santana, V.F., Oliveira, R., Almeida, L.D.A., Ito, M.:Firefixia: An accessibility web browser customizationtoolbar for people with dyslexia. In: Proc. W4A ’13.Rio de Janeiro, Brazil (2013)
91. Schneps, M.H., Thomson, J.M., Sonnert, G., Pomplun,M., Chen, C., Heffner-Wong, A.: Shorter lines facilitatereading in those who struggle. PloS ONE 8(8), e71,161(2013)
92. Schuberth, R.E., Eimas, P.D.: Effects of context on theclassification of words and non-words. Journal of Ex-perimental Psychology: Human Perception and Perfor-mance 3(1), 27–36 (1977)
93. Seymour, P.H.K., Aro, M., Erskine, J.M.: Foundationliteracy acquisition in European orthographies. BritishJournal of psychology 94(2), 143–174 (2003)
94. Speech Therapy Association of Catalonia: PRODIS-CAT: Protocol de deteccio i actuacio en la dislexia.Ambit Educativo (Protocol for detection and manage-ment of dyslexia. Educational scope.). Education De-partment of the Catalonian government (2011)
95. Temple, C.M.: Developmental analogues to acquiredphonological dyslexia. In: Dyslexia: a global issue. Mar-tinus Nijhoff Publishers, La Haya (1984)
96. Tinker, M.A.: Influence of simultaneous variation in sizeof type, width of line, and leading for newspaper type.Journal of Applied Psychology 47(6), 380 (1963)
97. Tinker, M.A.: Legibility of print, vol. 1. Iowa State Uni-versity Press Ames (1963)
98. Tobii Technology: Product description of Tobii 50 Series(2005)
99. Topac, V.: The development of a text customization toolfor existing web sites. In: Text Customization for Read-ability Symposium (2012)
100. Topac, V.: Improving text accessibility and understand-ing of domain-specific information. Ph.D. thesis, Uni-versitatea Politehnica Timisoara (2014)
101. Tseng, A.: Six surprising bad prac-tices that hurt dyslexic users (2012).http://uxmovement.com/content/
6-surprising-bad-practices-that-hurt-dyslexic-users/
102. United Nations Committee of the General Assembly:Convention on the Rights of Persons with Disabilities.United Nations, New York (2006)
103. Valle, F.: Reading errors in Spanish. In: Reading andwriting problems in different systems. Kluwer (1988)
104. Vellutino, F.R., Fletcher, J.M., Snowling, M.J., Scanlon,D.M.: Specific reading disability (dyslexia): What havewe learned in the past four decades? Journal of childpsychology and psychiatry 45(1), 2–40 (2004)
105. Warrington, E., Zangwill, O.L.: A study of dyslexia.Journal of Neurology, Neurosurgery, and Psychiatry20(3), 208 (1957)
106. WebAIM: Web accessibility in mind (2014). http://
webaim.org/
107. Wimmer, H.: Characteristics of developmental dyslexiain a regular writing system. Applied psycholinguistics14(1) (1993)
108. Wolf, M., O’Rourke, A.G., Gidney, C., Lovett, M.,Cirino, P., Morris, R.: The second deficit: An investiga-tion of the independence of phonological and naming-speed deficits in developmental dyslexia. Reading andWriting 15(1-2), 43–72 (2002)
109. World Health Organization: International statisticalclassification of diseases, injuries and causes of death(ICD-10), tenth edn. World Health Organization (1993)
110. World Wide Web Consortium (W3C): Web accessibilityinitiative (WAI) (2011). http://www.w3.org/WAI/
111. Zarach, V.: Ten guidelines for improving accessibilityfor people with dyslexia (2012). CETIS Univer-sity of Wales, Bangor. http://wiki.cetis.ac.uk/
Ten_Guidelines_for_Improving_Accessibility_for_
People_with_Dyslexia
112. Zeman, A., Milton, F., Smith, A., Rylance, R.: By heartan fmri study of brain activation by poetry and prose.Journal of Consciousness Studies 20(9-10), 9–10 (2013)
113. Zorzi, M., Barbiero, C., Facoettia, A., Lonciari, I., Car-rozzi, M., Montico, M., Bravar, L., George, F., Pech-Georgel, C., Ziegler, J.: Extra-large letter spacing im-proves reading in dyslexia. Proceedings of the NationalAcademy of Sciences 109, 11,455–11,459 (2012)

21
Appendix A: Color and Brightness
The CYMK/RGB codes for the contrast and colors
used are:
Text contrast:
– 0% (pure black font, 000000/0,0,0): Brightness text: 255;Brightness background: 0; Brightness difference: -255;Color difference: 765.
– 25% (404040/64,64,64): Brightness text: 255; Brightnessbackground: 63; Brightness difference: 192; Colourdifference: 573.
– 50% (7E7E7E/126,126,126): Brightness text: 255;Brightness background: 126; Brightness difference: 129;Colour difference: 387.
– 75% (BFBFBF/191,191,191): Brightness text: 255;Brightness background: 191; Brightness difference: 64;Colour difference: 191.
Background contrast:
– 100% (pure black background, 000000/0,0,0): Brightnesstext: 0; Brightness background: 255; Brightnessdifference: -255; Color difference: 765.
– 25% (404040/64,64,64): Brightness text: 63; Brightnessbackground: 255; Brightness difference: -192; Colourdifference: 573.
– 50% (7E7E7E/126,126,126): Brightness text: 126;Brightness background: 255; Brightness difference: -129;Colour difference: 387.
– 75% (BFBFBF/191,191,191): Brightness text: 191;Brightness background: 255; Brightness difference: -64;Colour difference: 191.
Colors:
– black (000000/0,0,0) / white (FFFFFF/255,255,255):Color difference: 765, Brightness difference: 255;
– off-black (0A0A0A/10,10,10) /off-white(FFFFE5/255,255,259):Color difference: 735, Brightness difference: 245;
– black (000000/10,10,10) / yellow (FFFF00/255,255,0):Color difference: 510, Brightness difference: 226;
– blue (00007D/0,0,125) / white (FFFFFF/255,255,255):Color difference: 640, Brightness difference: 241;
– dark brown (1E1E00/30,30,0) / light mucky green(B9B900/185,185,0):Color difference: 310, Brightness difference: 137
– brown (282800/40,40,0) / mucky green(A0A000/160,160,0):Color difference: 240, Brightness difference: 107
– black (000000/0,0,0) / creme (FAFAC8/250,250,200):Color difference: 700, Brightness difference: 244;
– blue (00007D/0,0,125) / yellow (FFFF00/255,255,0):Color difference: 635, Brightness difference: 212
Appendix B: Text Example
¿Soy dix-leso?
by Marcela Paz (Papelucho series)
Por la tarde fuimos al doctor. Era un senor bastante
pregunton, que se hacıa el simpatico por fuera, pero
se notaba que era malo por dentro. Me martillo las
costras y otras cuestiones con un martillito lindo. Y
mientras hablaba y hablaba con la mama se martillaba
su otra mano gorda.
Yo pensaba que pasarıa si en vez de su mano gorda
se martillara el tremendo grano que tenıa en la nariz?
Pero apenas se lo rasco y siguio dale que dale hablando
de “este nino”. Y “este nino” por aquı y “este nino”
por alla.
Trate de entender lo que decıan.
Casi lo entendı. No estoy seguro si la cosa es que
soy superdotado o viceversa. Menos mal que ademas
parece que soy dixleso, que es algo muy guay y como
distinto. Y tampoco me importa mucho ser ası.
Mis padres fueron al colegio a hablar con mi profe
y volvieron furiosos.
De todos modos yo tengo mi enfermedad propia y
nadie me la quita.
Pero en la noche, me desvele. Porque claro, en el
dıa a uno le gusta ser enfermo y en la noche no. Ası
que desperte a mi padre apretetandole la nariz porque
es el unico modo de despertarlo.


![Test Your C Skills 8MB [Proper Readable Text]Smallest Sized Yashwant Kanetkar](https://static.fdocuments.in/doc/165x107/55cf9d8b550346d033ae185b/test-your-c-skills-8mb-proper-readable-textsmallest-sized-yashwant-kanetkar.jpg)