How to get an edge with margins and marginsplot - Stata · Introduction Predictive Margins and...
28
Introduction Predictive Margins and Their Pictures Conclusion How to get an edge with margins and marginsplot Bill Rising StataCorp LP 2012 UK Stata Users Group Meeting London 13 September 2012 Bill Rising Margins and marginsplot
Transcript of How to get an edge with margins and marginsplot - Stata · Introduction Predictive Margins and...

IntroductionPredictive Margins and Their Pictures
Conclusion
How to get an edge with margins and marginsplot
Bill Rising
StataCorp LP
2012 UK Stata Users Group MeetingLondon
13 September 2012
Bill Rising Margins and marginsplot

IntroductionPredictive Margins and Their Pictures
ConclusionGoals
Getting Started
This will be an interactive demonstrationWe want to explore the margins commandOn the way we will learn about making nice graphs to help withexplanations
Bill Rising Margins and marginsplot

IntroductionPredictive Margins and Their Pictures
ConclusionGoals
Getting Ready
We’ll be doing a lot of work with categorical variablesBy default, Stata does not show the base reference class whenusing factor variablesLet’s fix this. set showbaselevels on, permanently
Bill Rising Margins and marginsplot
IntroductionPredictive Margins and Their Pictures
ConclusionIntroducing Predictive MarginsNon-Linear Models
Starting Simple
We will start with the low birthweight dataset from Hosmer andLemeshow’s book on logistic regression. webuse lbw
We can take a peek at the dataset. codebook, compact
Bill Rising Margins and marginsplot
IntroductionPredictive Margins and Their Pictures
ConclusionIntroducing Predictive MarginsNon-Linear Models
Linear Regression Coefficients
Let’s start simple with an easy linear regression for birthweights. regress bwt c.age##c.age lwt i.smoke i.race
We know what the coefficients meanThe coefficient for 1.smoke says: all other things being equal (i.e.weight and race), we think smokers’ babies are about 400 lighterthan non-smokers’ babies
We can see that age looks to have a quadratic effectIt would be nice to see this more clearly
Bill Rising Margins and marginsplot
IntroductionPredictive Margins and Their Pictures
ConclusionIntroducing Predictive MarginsNon-Linear Models
Asking a Different Question
Now suppose instead of being asked about the effect of age, weare asked
“What would the model take for the average weight of a baby fora mother aged 30?”
There are two paths we can take here:We could plug in 30 for the age for all the women in our sample,leave all other covariates the same, predict the birthweights, andaverage the results
Order: predict with partial info, then average
We could average all the other covariates, set age to 30, andpredict
Order: average, then predict with partial info
The first path is called ‘predictive margins’ or ‘average predictivemargins’—it is the one we will take
Bill Rising Margins and marginsplot
IntroductionPredictive Margins and Their Pictures
ConclusionIntroducing Predictive MarginsNon-Linear Models
A Predictive Margin
Stata implements predictive margins using the marginscommandHere is what we could use as our best guess of the mean weightof babies of women aged 30:. margins, at(age==30)
Computationally, the point estimate could be computed byChanging age to 30 everywhereUsing predict to get predicted valuesFinding the mean of those values
margins does more—it computes standard errors
Bill Rising Margins and marginsplot
IntroductionPredictive Margins and Their Pictures
ConclusionIntroducing Predictive MarginsNon-Linear Models
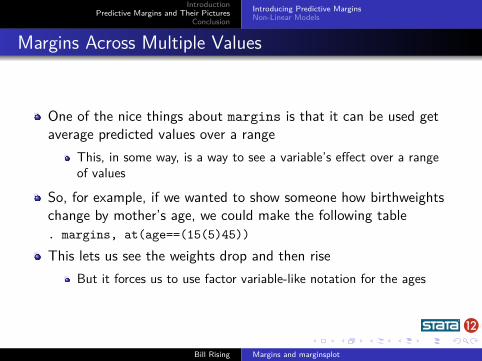
Margins Across Multiple Values
One of the nice things about margins is that it can be used getaverage predicted values over a range
This, in some way, is a way to see a variable’s effect over a rangeof values
So, for example, if we wanted to show someone how birthweightschange by mother’s age, we could make the following table. margins, at(age==(15(5)45))
This lets us see the weights drop and then riseBut it forces us to use factor variable-like notation for the ages
Bill Rising Margins and marginsplot
IntroductionPredictive Margins and Their Pictures
ConclusionIntroducing Predictive MarginsNon-Linear Models
Picturing Predictive Margins
Stata has a command which can draw graphs arising from themargins command: marginsplot
Here is a very simple example. marginsplot
This gives a good view of the parabolic shape
We will now investigate margins
Bill Rising Margins and marginsplot
IntroductionPredictive Margins and Their Pictures
ConclusionIntroducing Predictive MarginsNon-Linear Models
What About Comparing Groups?
Suppose we would like to compare weights across the three racecategoriesThis is done by including race in the varlist for the marginscommand:. margins race
We can do this because we specified i.race in the modelAside: this is equivalent to the following. margins, at(race==1) at(race==2) at(race==3)
These values can be interpreted as best-guesses for partialinformation for your sample
Bill Rising Margins and marginsplot
IntroductionPredictive Margins and Their Pictures
ConclusionIntroducing Predictive MarginsNon-Linear Models
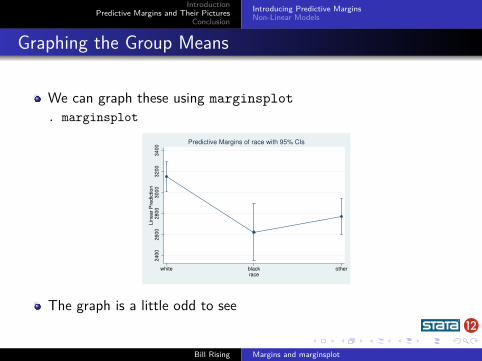
Graphing the Group Means
We can graph these using marginsplot. marginsplot
2400
2600
2800
3000
3200
3400
Lin
ear
Pre
dic
tion
white black otherrace
Predictive Margins of race with 95% CIs
The graph is a little odd to see
Bill Rising Margins and marginsplot
IntroductionPredictive Margins and Their Pictures
ConclusionIntroducing Predictive MarginsNon-Linear Models
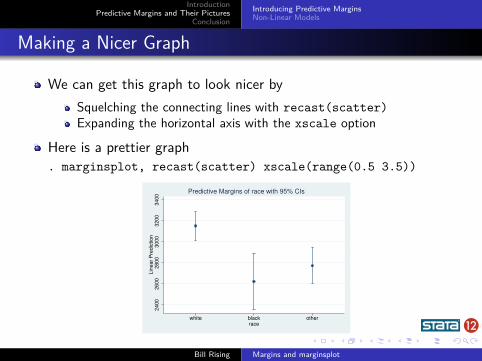
Making a Nicer Graph
We can get this graph to look nicer bySquelching the connecting lines with recast(scatter)Expanding the horizontal axis with the xscale option
Here is a prettier graph. marginsplot, recast(scatter) xscale(range(0.5 3.5))2400
2600
2800
3000
3200
3400
Lin
ear
Pre
dic
tion
white black otherrace
Predictive Margins of race with 95% CIs
Bill Rising Margins and marginsplot
IntroductionPredictive Margins and Their Pictures
ConclusionIntroducing Predictive MarginsNon-Linear Models
More Complex Margins
There is no reason for us to limit our predictive margins to becomputed over just one variableWe could just as well look to see how age and smoking statuswork togetherHere is the the margins command. margins smoke, at(age==(15(5)45))
Bill Rising Margins and marginsplot
IntroductionPredictive Margins and Their Pictures
ConclusionIntroducing Predictive MarginsNon-Linear Models
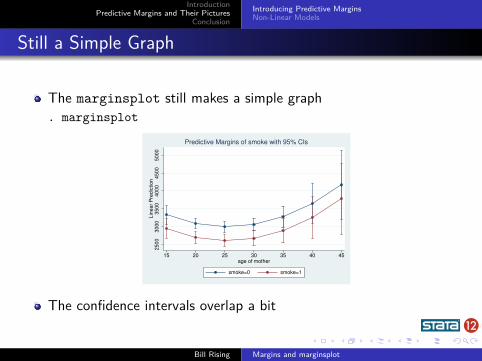
Still a Simple Graph
The marginsplot still makes a simple graph. marginsplot
2500
3000
3500
4000
4500
5000
Lin
ear
Pre
dic
tion
15 20 25 30 35 40 45age of mother
smoke=0 smoke=1
Predictive Margins of smoke with 95% CIs
The confidence intervals overlap a bit
Bill Rising Margins and marginsplot
IntroductionPredictive Margins and Their Pictures
ConclusionIntroducing Predictive MarginsNon-Linear Models
Driving the Point Home
If we wanted to specify smoking and age, we could use theinteraction notation in the margins command
This is true even though there were no interactions—all that isdone is that all possible combinations of smoking status and raceare included
The command is not bad. . .. margins race#smoke, at(age==(15(5)45))
. . . but the output is
Bill Rising Margins and marginsplot
IntroductionPredictive Margins and Their Pictures
ConclusionIntroducing Predictive MarginsNon-Linear Models
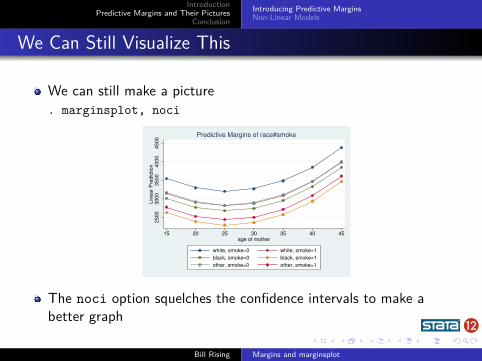
We Can Still Visualize This
We can still make a picture. marginsplot, noci
2500
3000
3500
4000
4500
Lin
ear
Pre
dic
tion
15 20 25 30 35 40 45age of mother
white, smoke=0 white, smoke=1
black, smoke=0 black, smoke=1
other, smoke=0 other, smoke=1
Predictive Margins of race#smoke
The noci option squelches the confidence intervals to make abetter graph
Bill Rising Margins and marginsplot
IntroductionPredictive Margins and Their Pictures
ConclusionIntroducing Predictive MarginsNon-Linear Models
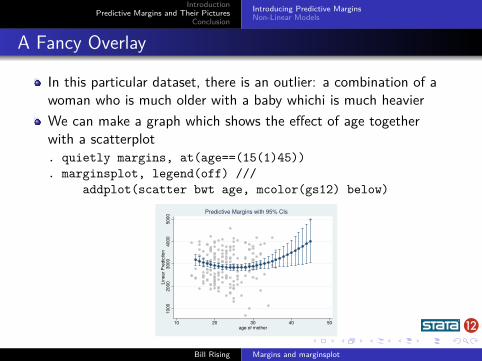
A Fancy Overlay
In this particular dataset, there is an outlier: a combination of awoman who is much older with a baby whichi is much heavierWe can make a graph which shows the effect of age togetherwith a scatterplot. quietly margins, at(age==(15(1)45)). marginsplot, legend(off) ///
addplot(scatter bwt age, mcolor(gs12) below)
10
00
20
00
30
00
40
00
50
00
Lin
ea
r P
red
ictio
n
10 20 30 40 50age of mother
Predictive Margins with 95% CIs
Bill Rising Margins and marginsplot

IntroductionPredictive Margins and Their Pictures
ConclusionIntroducing Predictive MarginsNon-Linear Models
A Richer Dataset
Now will switch over to the nhanes2 dataset. webuse nhanes2
This is a nice dataset, because it has good things for both linearand logistic regressionThese are survey data. svyset
We will need to use the svy: prefix for estimation
Bill Rising Margins and marginsplot
IntroductionPredictive Margins and Their Pictures
ConclusionIntroducing Predictive MarginsNon-Linear Models
Looking at Diabetes
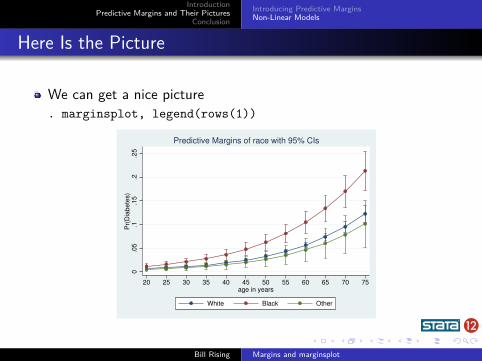
Now we would like to look at the chances of having diabetesHere is a simple model. svy: logistic diabetes age i.sex i.race bmi
We can see that age and bmi both increase the odds of diabetesby about 6% for each unit increaseHow does this play out for race and age?. margins race, at(age==(20(5)75)) vce(uncond)
Bill Rising Margins and marginsplot
IntroductionPredictive Margins and Their Pictures
ConclusionIntroducing Predictive MarginsNon-Linear Models
Here Is the Picture
We can get a nice picture. marginsplot, legend(rows(1))
0.0
5.1
.15
.2.2
5P
r(D
iabete
s)
20 25 30 35 40 45 50 55 60 65 70 75age in years
White Black Other
Predictive Margins of race with 95% CIs
Bill Rising Margins and marginsplot
IntroductionPredictive Margins and Their Pictures
ConclusionIntroducing Predictive MarginsNon-Linear Models
This is Better than Odds Ratios
This type of graph is something that makes explaining a logisticmodel much easier than via odds ratiosIt is as applicable to the general population as much as yourbelief that your sample is representative of the general population
Which is important for the odds ratios also
Here, a picture is worth a thousand hard words
Bill Rising Margins and marginsplot
IntroductionPredictive Margins and Their Pictures
ConclusionIntroducing Predictive MarginsNon-Linear Models
For Probit Fans
If you prefer probit models, we can use the same type of logic. svy: probit diabetes age i.sex i.race bmi
Now the coefficients are not very interpretable
We can still get margins. margins race, at(age==(20(5)75)) vce(uncond)
Creating the predictive margins still works the same
Bill Rising Margins and marginsplot
IntroductionPredictive Margins and Their Pictures
ConclusionIntroducing Predictive MarginsNon-Linear Models
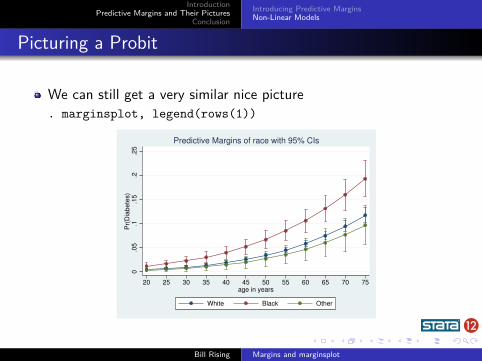
Picturing a Probit
We can still get a very similar nice picture. marginsplot, legend(rows(1))
0.0
5.1
.15
.2.2
5P
r(D
iabete
s)
20 25 30 35 40 45 50 55 60 65 70 75age in years
White Black Other
Predictive Margins of race with 95% CIs
Bill Rising Margins and marginsplot
IntroductionPredictive Margins and Their Pictures
ConclusionIntroducing Predictive MarginsNon-Linear Models
Interactions
Here is a model with interactions. svy: logit diabetes c.age##c.age##race bmi i.sex
If we look at the output, the higher-level interactions are neededin the modelThey are nearly impossible to picture or to talk about, however
Bill Rising Margins and marginsplot
IntroductionPredictive Margins and Their Pictures
ConclusionIntroducing Predictive MarginsNon-Linear Models
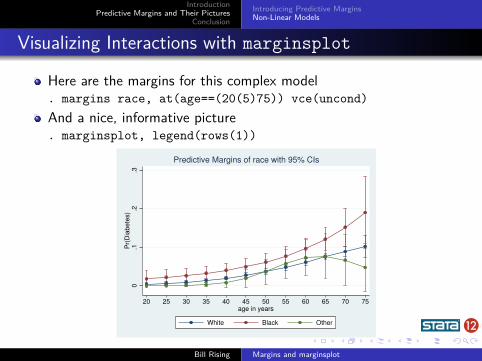
Visualizing Interactions with marginsplot
Here are the margins for this complex model. margins race, at(age==(20(5)75)) vce(uncond)And a nice, informative picture. marginsplot, legend(rows(1))
0.1
.2.3
Pr(
Dia
bete
s)
20 25 30 35 40 45 50 55 60 65 70 75age in years
White Black Other
Predictive Margins of race with 95% CIs
Bill Rising Margins and marginsplot
IntroductionPredictive Margins and Their Pictures
ConclusionIntroducing Predictive MarginsNon-Linear Models
Bothered by Counterfactuals
You might have been bothered by the idea in the precedingexamples that we used. margins race, ...
This sets every observtion to each race category while computingthe predictive marginsIf you would rather compute the predictive margins within eachrace, use the over option. margins, at(age==(20(5)75)) vce(uncond) over(race)
The differences from before are small, and the picture is similar(not shown in handouts). marginsplot, legend(rows(1))
Bill Rising Margins and marginsplot
IntroductionPredictive Margins and Their Pictures
ConclusionConclusion
Conclusion
marginsplot is very good for showing how models workThis can be used to good effect when explaining even simplenon-linear modelsThis can be used to good effect when explaining any type ofinteractions
Bill Rising Margins and marginsplot
IntroductionPredictive Margins and Their Pictures
ConclusionConclusion
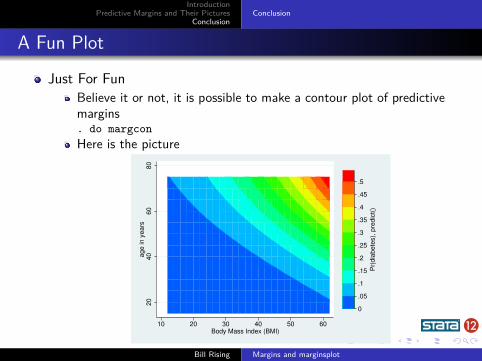
A Fun Plot
Just For FunBelieve it or not, it is possible to make a contour plot of predictivemargins. do margconHere is the picture
20
40
60
80
age in y
ears
10 20 30 40 50 60Body Mass Index (BMI)
0
.05
.1
.15
.2
.25
.3
.35
.4
.45
.5
Pr(
dia
bete
s),
pre
dic
t()
Enjoy! Bill Rising Margins and marginsplot