How the U.S. and Other Countries Compare: Lessons Learned ... · How the U.S. and Other Countries...
54
1 1 National Conference on Student Assessment How the U.S. and Other Countries Compare: Lessons Learned International Data CCSSO – San Diego June 22, 2015 Andreas Schleicher
Transcript of How the U.S. and Other Countries Compare: Lessons Learned ... · How the U.S. and Other Countries...

11 National Conference on Student Assessment
How the U.S. and Other Countries Compare: Lessons Learned International Data
CCSSO – San Diego
June 22, 2015
Andreas Schleicher

Increased likelihood of positive outcomes among adults with higher literacy skills
1.0
1.5
2.0
2.5
3.0
3.5
4.0
4.5
Being
Employed
High wages Good to
excellent
health
Participation
in volunteer
activities
High levels of
political
efficacy
High levels of
trust
United States
2
(scoring at Level 4/5 compared with those scoring at Level 1 or below)
Odds ratio

5 PISA in brief
• Over half a million students…– representing 28 million 15-year-olds in 65 countries/economies
… took an internationally agreed 2-hour test…– Goes beyond testing whether students can
reproduce what they were taught…
… to assess students’ capacity to extrapolate from what they know and creatively apply their knowledge in novel situations
– Mathematics, reading, science, problem-solving, financial literacy
– Total of 390 minutes of assessment material
… and responded to questions on…– their personal background, their schools
and their engagement with learning and school
• Parents, principals and system leaders provided data on…– school policies, practices, resources and institutional factors that
help explain performance differences .
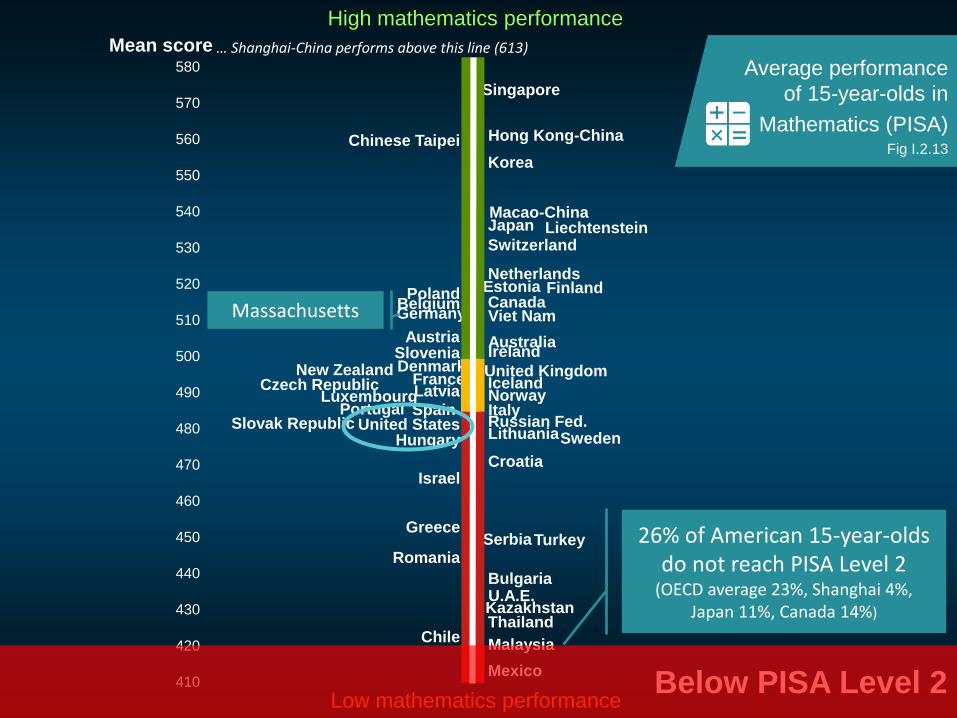
Singapore
Hong Kong-ChinaChinese Taipei
Korea
Macao-ChinaJapan LiechtensteinSwitzerland
NetherlandsEstonia FinlandCanada
PolandBelgiumGermany Viet Nam
Austria AustraliaIrelandSlovenia
DenmarkNew ZealandCzech Republic France
United KingdomIceland
LatviaLuxembourg NorwayPortugal ItalySpain
Russian Fed.Slovak Republic United StatesLithuaniaSwedenHungary
CroatiaIsrael
GreeceSerbiaTurkey
Romania
BulgariaU.A.E.KazakhstanThailand
ChileMalaysia
Mexico410
420
430
440
450
460
470
480
490
500
510
520
530
540
550
560
570
580
Mean score
High mathematics performance
Low mathematics performance
… Shanghai-China performs above this line (613)
Average performance
of 15-year-olds in
Mathematics (PISA)Fig I.2.13
Below PISA Level 2
Massachusetts
26% of American 15-year-olds do not reach PISA Level 2
(OECD average 23%, Shanghai 4%, Japan 11%, Canada 14%)
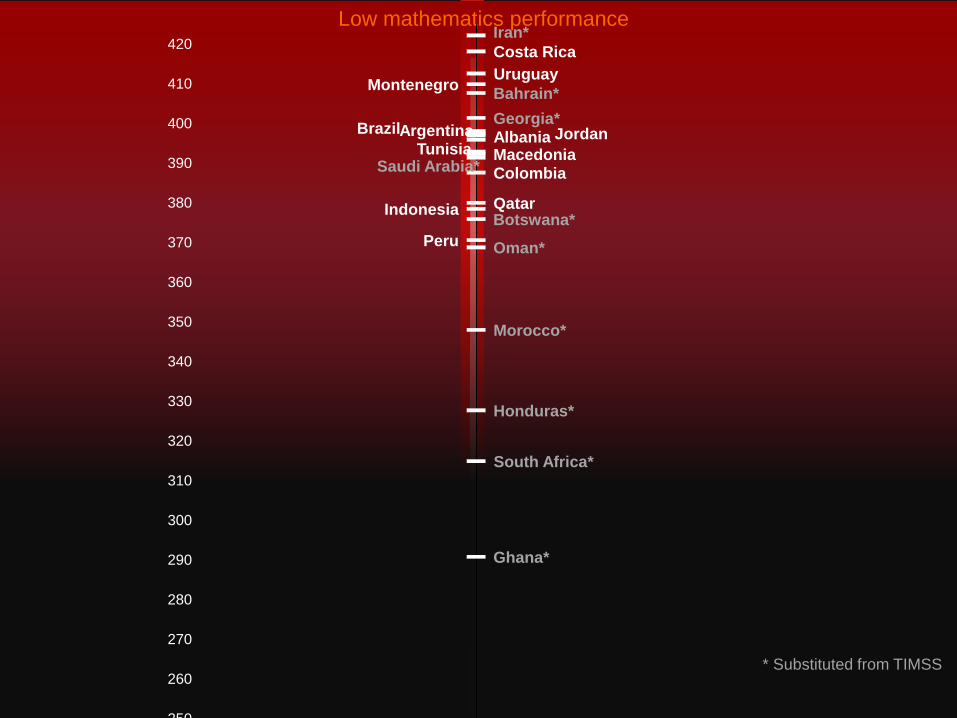
Low mathematics performanceIran*
Costa Rica
UruguayMontenegro
Bahrain*
Georgia*Brazil JordanArgentina Albania
Tunisia MacedoniaSaudi Arabia* Colombia
QatarIndonesiaBotswana*
Peru Oman*
Morocco*
Honduras*
South Africa*
Ghana*
250
260
270
280
290
300
310
320
330
340
350
360
370
380
390
400
410
420
* Substituted from TIMSS
3880% GDP
4,526 bn$
751% GDP
23,841 bn$

Singapore
Hong Kong-ChinaChinese Taipei
Korea
Macao-ChinaJapan LiechtensteinSwitzerland
NetherlandsEstonia FinlandCanada
PolandBelgiumGermany Viet Nam
Austria AustraliaIrelandSlovenia
DenmarkNew ZealandCzech Republic France
United KingdomIceland
LatviaLuxembourg NorwayPortugal ItalySpain
Russian Fed.Slovak Republic United StatesLithuaniaSwedenHungary
CroatiaIsrael
GreeceSerbiaTurkey
Romania
BulgariaU.A.E.KazakhstanThailand
ChileMalaysia
Mexico
High mathematics performance
Low mathematics performance
86% GDP
402 bn$
153% GDP
27,929 bn$

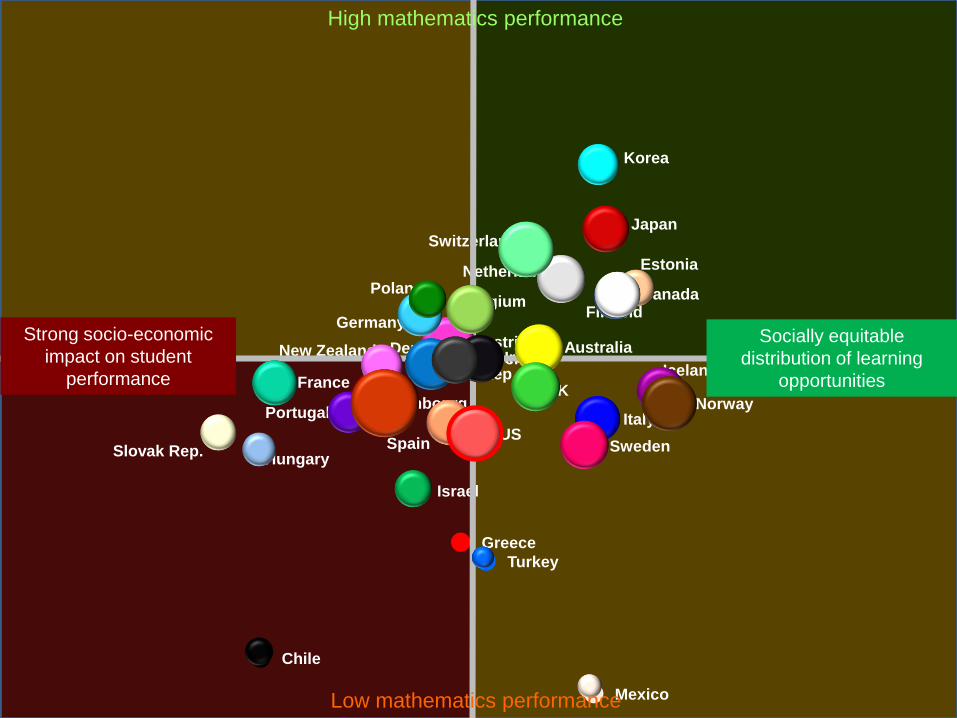
Socially equitable
distribution of learning
opportunities
High mathematics performance
Low mathematics performance
Average performance
of 15-year-olds in
mathematics
Strong socio-economic
impact on student
performance
Singapore
Hong Kong-ChinaChinese Taipei
Korea
Macao-ChinaJapan LiechtensteinSwitzerland
NetherlandsEstonia FinlandCanada
PolandBelgiumGermany Viet Nam
Austria AustraliaIrelandSlovenia
DenmarkNew ZealandCzech Republic France
United KingdomIceland
LatviaLuxembourg NorwayPortugal ItalySpain
Russian Fed.Slovak Republic United StatesLithuaniaSwedenHungary
CroatiaIsrael
GreeceSerbiaTurkey
Romania
BulgariaU.A.E.KazakhstanThailand
ChileMalaysia
Mexico

AustraliaAustria
Belgium Canada
Chile
Czech Rep.
Denmark
Estonia
Finland
France
Germany
Greece
Hungary
IcelandIreland
Israel
Italy
Japan
Korea
Luxembourg
Mexico
Netherlands
New Zealand
Norway
Poland
Portugal
Slovak Rep.
Slovenia
Spain Sweden
Switzerland
Turkey
UK
US
Singapore
Hong Kong-ChinaChinese Taipei
Macao-China
Liechtenstein
Viet Nam
Latvia
Russian Fed.Lithuania
Croatia
SerbiaRomania
BulgariaUnited Arab
EmiratesKazakhstan
Thailand
Malaysia
02468101214161820222426
2012
Socially equitable
distribution of learning
opportunities
Strong socio-economic
impact on student
performance
Massachusetts
High mathematics performance
Low mathematics performance

AustraliaAustria
Belgium Canada
Chile
Czech Rep.
Denmark
Estonia
Finland
France
Germany
Greece
Hungary
IcelandIreland
Israel
Italy
Japan
Korea
Luxembourg
Mexico
Netherlands
New Zealand
Norway
Poland
Portugal
Slovak Rep.
Slovenia
Spain Sweden
Switzerland
Turkey
UK
US
2012
Socially equitable
distribution of learning
opportunities
Strong socio-economic
impact on student
performance
High mathematics performance
Low mathematics performance
AustraliaAustria
Belgium Canada
Chile
Czech Rep.
Denmark
Estonia
Finland
France
Germany
Greece
Hungary
IcelandIreland
Israel
Italy
Japan
Korea
Luxembourg
Mexico
Netherlands
New Zealand
Norway
Poland
Portugal
Slovak Rep.
Slovenia
Spain Sweden
Switzerland
Turkey
UK
US
Socially equitable
distribution of learning
opportunities
Strong socio-economic
impact on student
performance
High mathematics performance
Low mathematics performance

-10
-5
0
5
10
15
Port
ugal
Spa
in
Sw
itze
rlan
d
Belg
ium
Kor
ea
Lux
em
bou
rg
Germ
any
Gre
ece
Jap
an
Aus
tral
ia
Uni
ted K
ingd
om
New
Zeal
and
Fra
nce
Neth
erl
ands
Den
mar
k
Ital
y
Aus
tria
Cze
ch R
epu
blic
Hun
gary
Nor
way
Icela
nd
Irela
nd
Mexic
o
Fin
land
Sw
eden
Uni
ted S
tate
s
Pola
nd
Slo
vak
Repu
blic
Salary as % of GDP/capita Instruction time 1/teaching time 1/class size
Contribution of various factors to upper secondary teacher
compensation costs, per student as a percentage of GDP per capita (2004)
Percentage points
Difference with OECD average

Mean mathematics performance, by school location, after acc
ounting for socio-economic statusFig II.3.32020
Behavioural issues equate to lower job satisfaction,
class size doesn’t
Teachers' job satisfaction level following the number of students in the classroom in relation to the percentage of
students with behavioural problems
10.0
10.5
11.0
11.5
12.0
12.5
13.0
15
or
less
16
-20
21
-25
26
-30
31
-35
36
or
more
Teach
er
job
sati
sfa
cti
on
(le
vel)
Class size (number of students)
Average
10.0
10.5
11.0
11.5
12.0
12.5
13.0
No
ne
1%
to 1
0%
11
% to 3
0%
31
% o
r m
ore
Teach
er
job
sati
sfa
cti
on
(le
vel)
Students with behavioural problems
Average

AustraliaAustria
Belgium Canada
Chile
Czech Rep.
Denmark
Estonia
Finland
France
Germany
Greece
Hungary
IcelandIreland
Israel
Italy
Japan
Korea
Luxembourg
Mexico
Netherlands
New Zealand
Norway
Poland
Portugal
Slovak Rep.
Slovenia
Spain Sweden
Switzerland
Turkey
UK
US
High mathematics performance
Low mathematics performance
Socially equitable
distribution of learning
opportunities
Strong socio-economic
impact on student
performance

AustraliaAustria
Belgium Canada
Chile
Czech Rep.
Denmark
Estonia
Finland
France
Germany
Greece
Hungary
IcelandIreland
Israel
Italy
Japan
Korea
Luxembourg
Mexico
Netherlands
New Zealand
Norway
Poland
Portugal
Slovak Rep.
Slovenia
Spain Sweden
Switzerland
Turkey
UK
US
Singapore
Shanghai
Singapore
2003 - 2012
Chile 2003
Turkey 2003
High mathematics performance
Low mathematics performance
Socially equitable
distribution of learning
opportunities
Strong socio-economic
impact on student
performance

2424 Why poverty need not be destiny
It’s not just about poor kids in poor neighborhoods but about many kids in many neighborhoods
The country where students go to class matters more than what social class students come from

2525PISA mathematics performance
by decile of social background
300
325
350
375
400
425
450
475
500
525
550
575
600
625
650
675
Mexic
oChile
Gre
ece
Norw
ay
Sw
eden
Icela
nd
Isra
el
Italy
United S
tate
sSpain
Denm
ark
Luxem
bourg
Aust
ralia
Irela
nd
United K
ingdom
Hungary
Canada
Fin
land
Aust
ria
Turk
ey
Lie
chte
nst
ein
Cze
ch R
epublic
Est
onia
Port
ugal
Slo
venia
Slo
vak R
epublic
New
Zeala
nd
Germ
any
Neth
erlands
Fra
nce
Sw
itze
rland
Pola
nd
Belg
ium
Japan
Maca
o-C
hin
aH
ong K
ong-C
hin
aKore
aSin
gapore
Chin
ese
Taip
ei
Shanghai-Chin
a
Source: PISA 2012

Australia
Brazil
Chile
Estonia
Spain
France
Iceland
Israel
Italy
Japan
Korea
Bulgaria
Malaysia
Mexico
NetherlandsNorway
Poland
Portugal
RomaniaSerbia
Singapore
Slovak Republic
Latvia
United States
0
10
20
30
40
50
60
0 10 20 30 40 50 60 70
% s
tudents
from
dis
advanta
ged b
ack
gro
unds
the p
erc
enta
ge o
f st
udents
with a
valu
e o
f ESCS low
er
than -
1
% principals who reported that more than 30% of their studentsare from socioeconomically disadvantaged homes
Social background – principal and students
Size of bullet represents
impact of social background
on student performance

0
10
20
30
40
50
60S
ha
ngh
ai-
Ch
ina
Sin
ga
po
reC
hin
ese
Taip
ei
Ho
ng
Kon
g-C
hin
aK
ore
aL
iech
tenste
inM
aca
o-C
hin
aJa
pa
nS
witze
rla
nd
Belg
ium
Neth
erla
nds
Germ
any
Pola
nd
Cana
da
Fin
land
New
Ze
ala
nd
Austr
alia
Esto
nia
Austr
iaS
loven
iaV
iet N
am
Fra
nce
Czech R
ep
ub
licO
EC
D a
ve
rag
eU
nited
Kin
gd
om
Luxe
mb
ou
rgIc
ela
nd
Slo
vak R
epu
blic
Ire
land
Port
ug
al
Denm
ark
Italy
Norw
ay
Isra
el
Hung
ary
United
Sta
tes
Lithu
ania
Sw
ede
nS
pa
inL
atv
iaR
ussia
n F
ede
ratio
nC
roa
tia
Tu
rkey
Serb
iaB
ulg
aria
Gre
ece
Un
ited
Ara
b E
mira
tes
Rom
ania
Th
aila
nd
Qata
rC
hile
Uru
gua
yM
ala
ysia
Mo
nte
neg
roK
aza
kh
sta
nA
lban
iaT
unis
iaB
razil
Me
xic
oP
eru
Co
sta
Ric
aJo
rdan
Colo
mb
iaIn
do
ne
sia
Arg
en
tin
a
%
Percentage of top performers
in mathematics27 Tab I.2.1a
Across OECD, 13% of students are top performers (Level 5 or 6). They can develop and work with models for complex situations, and work strategically with advanced thinking and reasoning skills
Massachusetts
Connecticut
Florida

2828 Why care about advanced skills?
-20
-15
-10
-5
0
5
10
15
20
25
%Evolution of employment in occupational groups
defined by PIAAC problem-solving skills
Employment of workers with advanced
problem-solving skills
Employment of workers with poor problem-solving skillsEmployment of workers with
medium-low problem-solving skills (PIAAC)
Source:PIAAC 2011
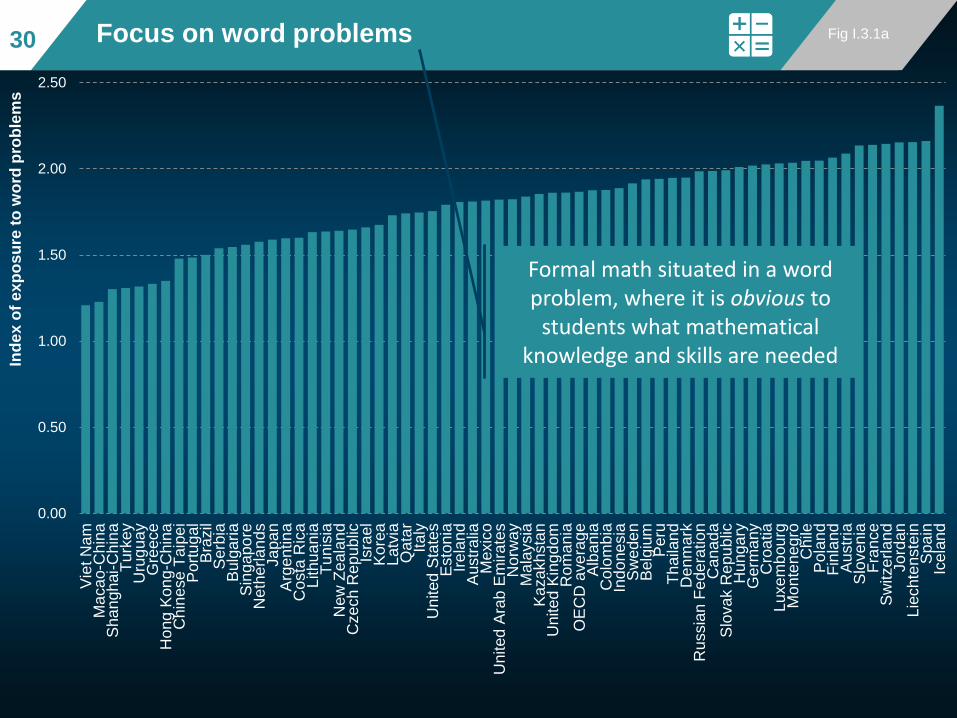
Math teaching ≠ math teachingPISA = reason mathematically and understand, formulate, employ
and interpret mathematical concepts, facts and procedures
29
0.00
0.50
1.00
1.50
2.00
2.50V
iet N
am
Ma
ca
o-C
hin
aS
ha
ngh
ai-
Ch
ina
Tu
rke
yU
rug
ua
yG
reece
Hong
Kon
g-C
hin
aC
hin
ese
Taip
ei
Port
ug
al
Bra
zil
Serb
iaB
ulg
aria
Sin
ga
po
reN
eth
erla
nds
Ja
pa
nA
rgen
tin
aC
osta
Ric
aL
ithu
ania
Tu
nis
iaN
ew
Ze
ala
nd
Czech R
ep
ub
licIs
rael
Kore
aL
atv
iaQ
ata
rIt
aly
Un
ited
Sta
tes
Esto
nia
Ire
land
Austr
alia
Me
xic
oU
nited
Ara
b E
mira
tes
Norw
ay
Ma
laysia
Kaza
kh
sta
nU
nited
Kin
gd
om
Rom
ania
OE
CD
ave
rag
eA
lban
iaC
olo
mb
iaIn
do
ne
sia
Sw
ede
nB
elg
ium
Peru
Th
aila
nd
Denm
ark
Ru
ssia
n F
ede
ratio
nC
ana
da
Slo
vak R
epu
blic
Hu
ng
ary
Germ
any
Cro
atia
Luxe
mb
ou
rgM
on
ten
eg
roC
hile
Pola
nd
Fin
land
Austr
iaS
loven
iaF
ran
ce
Sw
itze
rla
nd
Jo
rdan
Lie
ch
tenste
inS
pa
inIc
ela
nd
Ind
ex
of
ex
po
su
re t
o w
ord
pro
ble
ms
Focus on word problems Fig I.3.1a30
Formal math situated in a word problem, where it is obvious to
students what mathematical knowledge and skills are needed

0.00
0.50
1.00
1.50
2.00
2.50S
wede
nIc
ela
nd
Tu
nis
iaA
rgen
tin
aS
witze
rla
nd
Bra
zil
Luxe
mb
ou
rgIr
ela
nd
Neth
erla
nds
New
Ze
ala
nd
Costa
Ric
aA
ustr
iaL
iech
tenste
inM
ala
ysia
Ind
one
sia
Denm
ark
United
Kin
gd
om
Uru
gua
yL
ithu
ania
Germ
any
Austr
alia
Chile
OE
CD
ave
rag
eS
lovak R
epu
blic
Th
aila
nd
Qata
rF
inla
nd
Port
ug
al
Colo
mb
iaM
exic
oP
eru
Czech R
ep
ub
licIs
rael
Italy
Belg
ium
Hong
Kon
g-C
hin
aP
ola
nd
Fra
nce
Spa
inM
on
ten
eg
roG
reece
Tu
rkey
Slo
ven
iaV
iet N
am
Hung
ary
Bulg
aria
Kaza
kh
sta
nC
hin
ese
Taip
ei
Cana
da
Un
ited
Sta
tes
Esto
nia
Rom
ania
Latv
iaS
erb
iaJa
pa
nK
ore
aC
roa
tia
Alb
an
iaR
ussia
n F
ede
ratio
nU
nited
Ara
b E
mira
tes
Jo
rdan
Ma
ca
o-C
hin
aS
inga
po
reS
ha
ngh
ai-
Ch
ina
Ind
ex
of
ex
po
su
re t
o f
orm
al m
ath
em
ati
cs
Focus on conceptual understanding Fig I.3.1b 31
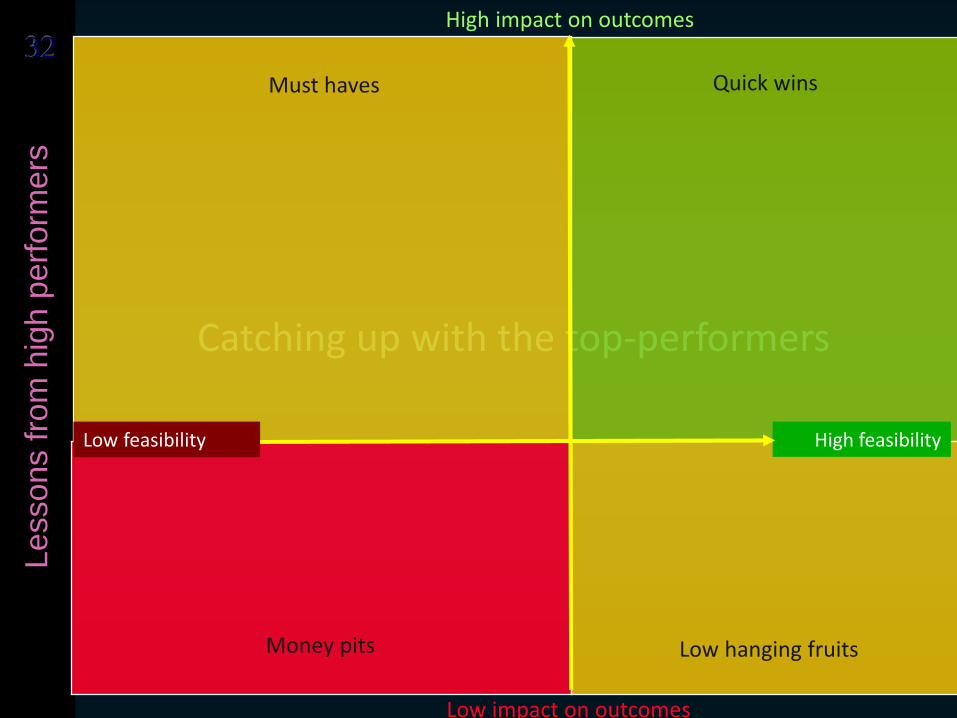
3232L
essons f
rom
hig
h p
erf
orm
ers
Catching up with the top-performers
Low impact on outcomes
High impact on outcomes
Low feasibility High feasibility
Money pits
Must haves
Low hanging fruits
Quick wins
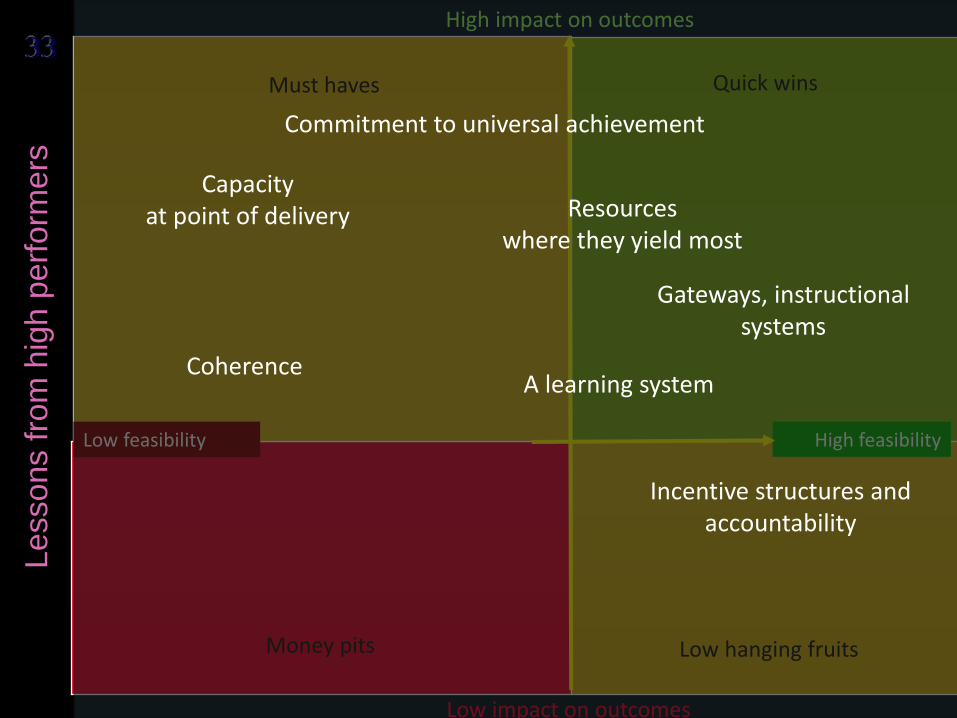
3333L
essons f
rom
hig
h p
erf
orm
ers
Low impact on outcomes
High impact on outcomes
Low feasibility High feasibility
Money pits
Must haves
Low hanging fruits
Quick wins
Commitment to universal achievement
Gateways, instructional systems
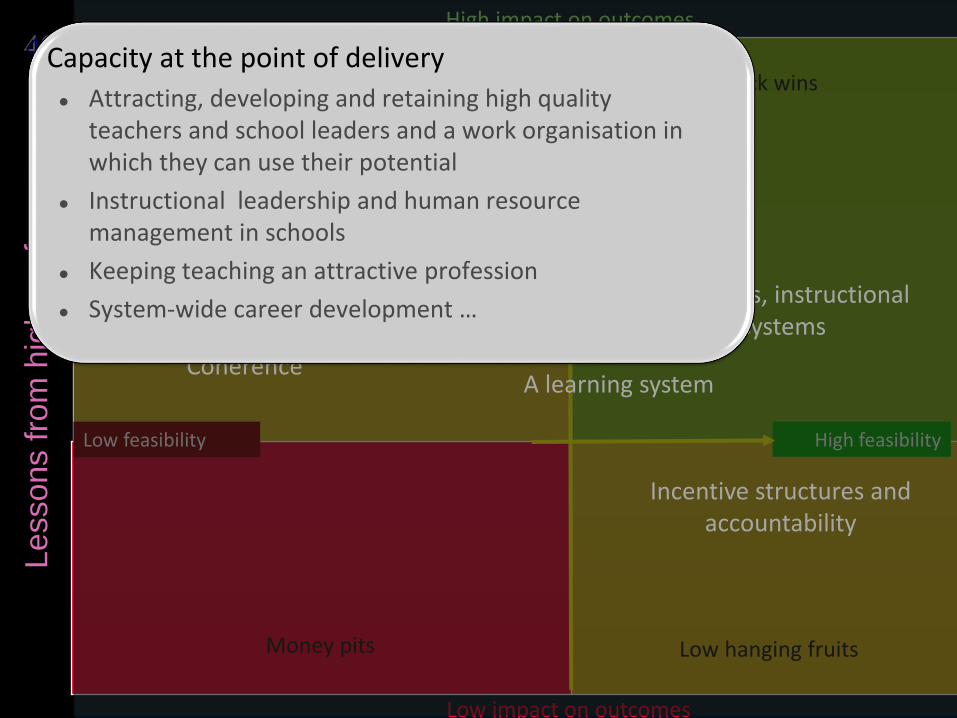
Capacity at point of delivery
Incentive structures and accountability
Resources where they yield most
A learning systemCoherence

3434L
essons f
rom
hig
h p
erf
orm
ers
Low impact on outcomes
High impact on outcomes
Low feasibility High feasibility
Money pits
Must haves
Low hanging fruits
Quick wins
Commitment to universal achievement
Gateways, instructional systems
Capacity at point of delivery
Incentive structures and accountability
Resources where they yield most
A learning systemCoherence
A commitment to education and the belief that competencies can be learned and therefore all children can achieve Universal educational standards and personalization as
the approach to heterogeneity in the student body…
… as opposed to a belief that students have different destinations to be met with different expectations, and selection/stratification as the approach to heterogeneity
Clear articulation who is responsible for ensuring student success and to whom

United States
Poland
Hong Kong-China
Brazil
New Zealand
Greece
Uruguay
United Kingdom
EstoniaFinland
Albania
Croatia
Latvia
Slovak RepublicLuxembourg
Germany
Lithuania
Austria
Czech Republic
Chinese Taipei
France
Thailand
Japan
Turkey Sweden
HungaryAustralia
Israel
Canada
IrelandBulgaria
Jordan
Chile
Macao-China
U.A.E.
Belgium
Netherlands
Spain
Argentina
Indonesia
Denmark
Kazakhstan
Peru
Costa Rica
Switzerland
Montenegro
Tunisia
Iceland
Slovenia
Qatar
Singapore
Portugal
Norway
Colombia
Malaysia
Mexico
Liechtenstein
Korea
Serbia
Russian Fed.
Romania
Viet Nam
Italy
Shanghai-China
R² = 0.36
300
350
400
450
500
550
600
650
-0.60 -0.40 -0.20 0.00 0.20 0.40 0.60 0.80 1.00 1.20
Me
an
ma
the
ma
tic
s p
erf
orm
an
ce
Mean index of mathematics self-efficacy
OE
CD
ave
rag
e
Countries where students have stronger beliefs
in their abilities perform better in mathematics35 Fig III.4.5

Perceived self-responsibility for failure
in mathematics
Percentage of students who reported "agree" or "strongly agree" with the following statements:
0 20 40 60 80 100
I’m not very good at solving mathematics problems
My teacher did not explain the concepts wellthis week
This week I made bad guesses on the quiz
Sometimes the course material is too hard
The teacher did not get students interested inthe material
Sometimes I am just unlucky
%
France Shanghai-China OECD average
Fig III.3.636

-20
-10
0
10
20
30
40
Colo
mb
iaC
osta
Ric
aP
eru
Isra
el
Luxe
mb
ou
rgC
hile
Tu
nis
iaS
lovak R
epu
blic
Lie
ch
tenste
inIt
aly
Kore
aS
pa
inA
rgen
tin
aB
razil
Port
ug
al
Gre
ece
Ja
pa
nA
ustr
iaU
rug
ua
yM
exic
oH
ong
Kon
g-C
hin
aB
ulg
aria
Tu
rkey
Ind
one
sia
Hung
ary
Vie
t N
am
Un
ited
Sta
tes
Rom
ania
U.A
.E.
Ch
inese
Taip
ei
Cana
da
Ire
land
Belg
ium
Kaza
kh
sta
nC
ze
ch R
ep
ub
licO
EC
D a
ve
rag
eC
roa
tia
Fra
nce
Sha
ngh
ai-
Ch
ina
Mo
nte
neg
roP
ola
nd
Serb
iaM
ala
ysia
Esto
nia
Qata
rM
aca
o-C
hin
aN
eth
erla
nds
Ne
w Z
eala
nd
Norw
ay
Lithu
ania
Slo
ven
iaD
enm
ark
Jo
rdan
Sw
itze
rla
nd
Austr
alia
Germ
any
Latv
iaR
ussia
n F
ed.
Sw
ede
nS
inga
po
reU
nited
Kin
gd
om
Th
aila
nd
Fin
land
Icela
nd
Sc
ore
-po
int
dif
fere
nc
e (
bo
ys
-gir
ls)
Gender gap among the highest-achieving students (90th percentile)
Gender gap adjusted for differences in mathematics self-efficacy between boys and girls
Gender gap
Greater self-efficacy among girls could shrink the gender gap in mathematics
performance, particularly among the highest-performing students 37 Fig III.7.12
Boys do better
Girls do better
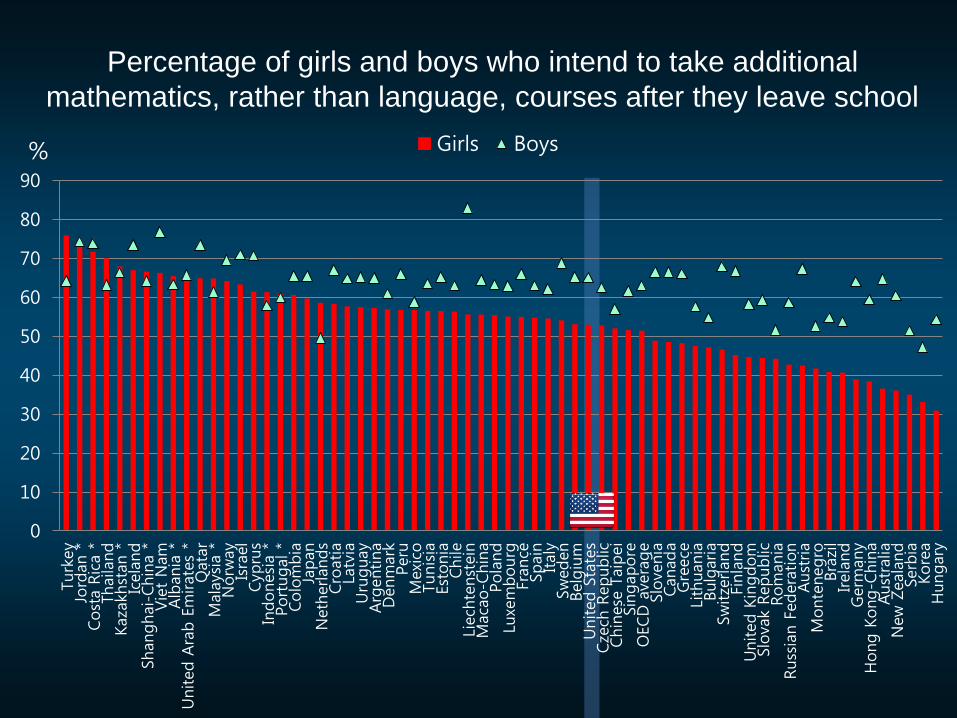
Percentage of girls and boys who intend to take additional
mathematics, rather than language, courses after they leave school
0
10
20
30
40
50
60
70
80
90
Turk
ey
Jord
an *
Cost
a R
ica *
Thaila
nd
Kaza
khst
an *
Icela
nd
Shanghai-Chin
a *
Vie
t N
am
Alb
ania
*United A
rab E
mirate
s *
Qata
rM
ala
ysia
*N
orw
ay
Isra
el
Cyp
rus
Indonesia *
Portugal *
Colo
mbia
Japan
Neth
erlands
Cro
atia
Latv
iaUru
guay
Arg
entina
Denm
ark
Peru
Mexi
coTunisia
Est
onia
Chile
Liech
tenst
ein
Maca
o-C
hin
aPola
nd
Luxe
mbourg
France
Spain
Italy
Sw
eden
Belg
ium
United S
tate
sCze
ch R
epublic
Chin
ese
Taip
ei
Sin
gapore
OECD
ave
rage
Slo
venia
Canada
Gre
ece
Lith
uania
Bulg
aria
Sw
itze
rland
Finla
nd
United K
ingdom
Slo
vak
Republic
Rom
ania
Russ
ian F
edera
tion
Aust
ria
Monte
negro
Bra
zil
Irela
nd
Germ
any
Hong K
ong-C
hin
aAust
ralia
New
Zeala
nd
Serb
iaKore
aH
ungary
Girls Boys%

3939L
essons f
rom
hig
h p
erf
orm
ers
Low impact on outcomes
High impact on outcomes
Low feasibility High feasibility
Money pits
Must haves
Low hanging fruits
Quick wins
Commitment to universal achievement
Gateways, instructional systems
Capacity at point of delivery
Incentive structures and accountability
Resources where they yield most
A learning systemCoherence
Clear ambitious goals that are shared across the system and aligned with high stakes gateways and instructional systems
Well established delivery chain through which curricular goals translate into instructional systems, instructional practices and student learning (intended, implemented and achieved)
High level of metacognitive content of instruction …
4040L
essons f
rom
hig
h p
erf
orm
ers
Low impact on outcomes
High impact on outcomes
Low feasibility High feasibility
Money pits
Must haves
Low hanging fruits
Quick wins
Commitment to universal achievement
Gateways, instructional systems
Capacity at point of delivery
Incentive structures and accountability
Resources where they yield most
A learning systemCoherence
Capacity at the point of delivery
Attracting, developing and retaining high quality teachers and school leaders and a work organisation in which they can use their potential
Instructional leadership and human resource management in schools
Keeping teaching an attractive profession
System-wide career development …

Developing Teaching
as a profession
Recruit top candidates into the profession
Support teachers in continued
development of practice
Retain and recognise effective teachers –path for growth
Improve the societal
view of teaching as
a profession
Mean mathematics performance, by school location, after acc
ounting for socio-economic status4141 Capacity at the point of delivery

Mean mathematics performance, by school location,
after accounting for socio-economic statusFig II.3.34242 Teachers' perceptions of the value of teaching
Percentage of lower secondary teachers who "agree" or "strongly agree" that teaching profession is a valued profession
in society
0
10
20
30
40
50
60
70
80
90
100
Mala
ysia
Sin
gapore
Kore
a
Abu D
habi (U
AE)
Finla
nd
Mexi
co
Alb
erta (Canada)
Flanders
(Belg
ium
)
Neth
erlands
Aust
ralia
Engla
nd (UK)
Rom
ania
Isra
el
United S
tate
s
Chile
Ave
rage
Norw
ay
Japan
Latv
ia
Serb
ia
Bulg
aria
Denm
ark
Pola
nd
Icela
nd
Est
onia
Bra
zil
Italy
Cze
ch R
epublic
Portugal
Cro
atia
Spain
Sw
eden
France
Slo
vak R
epublic
Perc
enta
ge o
f te
ach
ers

Mean mathematics performance, by school location,
after accounting for socio-economic statusFig II.3.34343
Countries where teachers believe their profession is valued
show higher levels of student achievement
Relationship between lower secondary teachers' views on the value of their profession in society and the country’s
share of top mathematics performers in PISA 2012
Australia
Brazil
Bulgaria
Chile
Croatia
Czech Republic
Denmark
EstoniaFinland
France
IcelandIsrael
Italy
Japan
Korea
Latvia
Mexico
Netherlands
Norway
Poland
Portugal
Romania
Serbia
Singapore
Slovak Republic
SpainSweden
Alberta (Canada)
England (UK)
Flanders (Belgium)
United States
0
5
10
15
20
25
30
35
40
45
0 10 20 30 40 50 60 70 80
Share
of
math
em
atics
top p
erf
orm
ers
Percentage of teachers who agree that teaching is valued in society
R2 = 0.24 r= 0.49

Teacher skills and graduate skills (numeracy)
230 250 270 290 310 330 350
Italy
Poland
Estonia
United States
Canada
Ireland
Korea
England (UK)
England/N. Ireland (UK)
Denmark
Northern Ireland (UK)
Slovak Republic
France
Australia
Sweden
Czech Republic
Austria
Netherlands
Norway
Germany
Flanders (Belgium)
Finland
Japan
Middle half of the numeracy
skill distribution of graduates
(16-65 years)
PIAAC test scores (numeracy)

Teacher skills and graduate skills (numeracy)
230 250 270 290 310 330 350
Italy
Poland
Estonia
United States
Canada
Ireland
Korea
England (UK)
England/N. Ireland (UK)
Denmark
Northern Ireland (UK)
Slovak Republic
France
Australia
Sweden
Czech Republic
Austria
Netherlands
Norway
Germany
Flanders (Belgium)
Finland
Japan
Middle half of the numeracy
skill distribution of graduates
(16-65 years)
Numeracy skills of teachers
PIAAC test scores (numeracy)

Mean mathematics performance, by school location,
after accounting for socio-economic statusFig II.3.34646 Teachers Self-Efficacy and Professional Collaboration
11.40
11.60
11.80
12.00
12.20
12.40
12.60
12.80
13.00
13.20
13.40
Never
Once
a y
ear
or
less
2-4
tim
es
a y
ear
5-1
0 t
imes
a y
ear
1-3
tim
es
a m
onth
Once
a w
eek o
r m
ore
Teach
er
self-e
ffic
acy
(le
vel)
Teach jointly as a
team in the same
class
Observe other
teachers’ classes and
provide feedback
Engage in joint
activities across
different classes
Take part in
collaborative
professional learning

0
10
20
30
40
50
60
70
80
90
100D
iscu
ss indiv
idual
students
Share
reso
urc
es
Team
confe
rence
s
Colla
bora
te for co
mm
on
standard
s
Team
teach
ing
Colla
bora
tive
PD
Join
t act
ivitie
s
Cla
ssro
om
obse
rvations
Perc
enta
ge o
f te
ach
ers
Average United States
Professional collaboration
Percentage of lower secondary teachers who report doing the following activities at least once per month
Teacher co-operation47
Exchange and co-ordination

Mean mathematics performance, by school location, after acc
ounting for socio-economic statusFig II.3.34848 Teachers' needs for professional development
Percentage of lower secondary teachers indicating they have a high level of need for professional development in the
following areas
0 5 10 15 20 25 30 35 40
Knowledge of the curriculum
Knowledge of the subject field(s)
School management and administration
Pedagogical competencies
Developing competencies for future work
Teaching cross-curricular skills
Student evaluation and assessment practice
Student career guidance and counselling
Approaches to individualised learning
Teaching in a multicultural or multilingual setting
Student behaviour and classroom management
New technologies in the workplace
ICT skills for teaching
Teaching students with special needs
United States Average

4949L
essons f
rom
hig
h p
erf
orm
ers
Low impact on outcomes
High impact on outcomes
Low feasibility High feasibility
Money pits
Must haves
Low hanging fruits
Quick wins
Commitment to universal achievement
Gateways, instructional systems
Capacity at point of delivery
Incentive structures and accountability
Resources where they yield most
A learning systemCoherence
Incentives, accountability, knowledge management
Aligned incentive structures
For students How gateways affect the strength, direction, clarity and nature of the
incentives operating on students at each stage of their education
Degree to which students have incentives to take tough courses and study hard
Opportunity costs for staying in school and performing well
For teachers Make innovations in pedagogy and/or organisation
Improve their own performance and the performance of their colleagues
Pursue professional development opportunities that lead to stronger pedagogical practices
A balance between vertical and lateral accountability
Effective instruments to manage and share knowledge and spread innovation – communication within the system and with stakeholders around it
A capable centre with authority and legitimacy to act
5050L
essons f
rom
hig
h p
erf
orm
ers
50 Aligning autonomy with accountability

5151L
essons f
rom
hig
h p
erf
orm
ers
51
51
Hong Kong-China
Brazil
Uruguay
Albania
Croatia
Latvia
Lithuania
Chinese Taipei
ThailandBulgaria
Jordan
Macao-China
UAE Argentina
Indonesia
Kazakhstan
Peru
Costa Rica
Tunisia
Qatar
Singapore
Colombia
Malaysia
Serbia
Romania
Viet Nam
Shanghai-China
USA
Poland
New Zealand
Greece
UK
Estonia
Finland
Slovak Rep.
Luxembourg
GermanyAustria
Czech Rep.
France
Japan
Turkey
Sweden
HungaryAustralia
Israel
Canada
Chile
Belgium
NetherlandsSpain
Denmark
Switzerland
Iceland
Slovenia
Portugal
Norway
Korea
Italy
R² = 0.13
300
350
400
450
500
550
600
650
-1.5 -1 -0.5 0 0.5 1 1.5
Ma
the
ma
tic
s p
erf
orm
an
ce
(sc
ore
po
ints
)
Index of school responsibility for curriculum and assessment (index points)
Countries that grant schools autonomy over curricula and assessments tend to perform better in mathematics
Source: PISA 2012
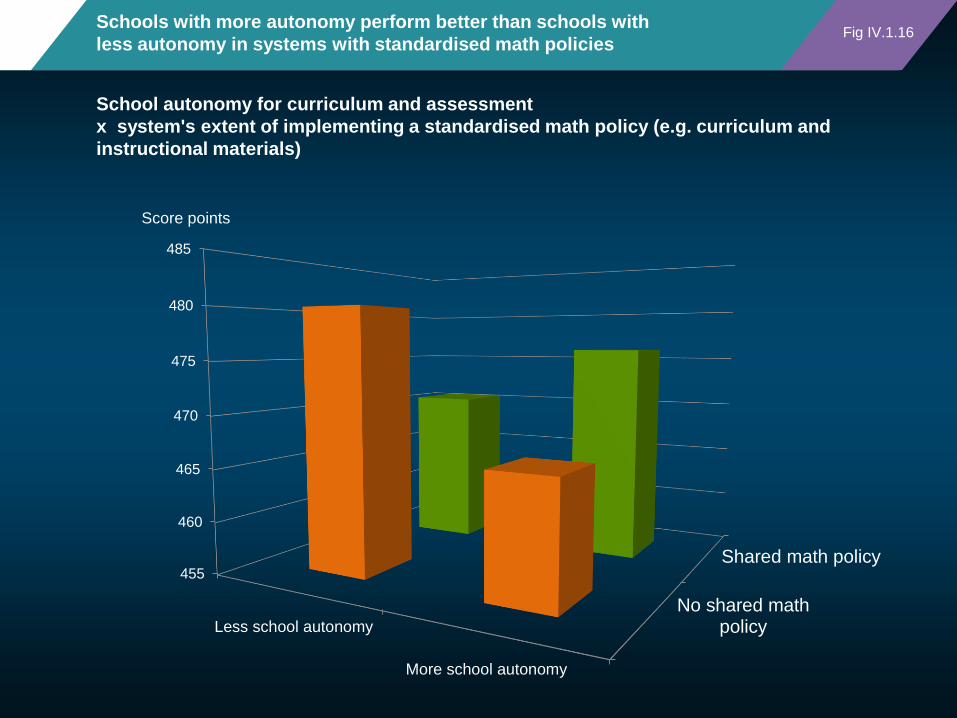
No shared mathpolicy
Shared math policy455
460
465
470
475
480
485
Less school autonomy
More school autonomy
Schools with more autonomy perform better than schools with
less autonomy in systems with standardised math policies
Score points
School autonomy for curriculum and assessment
x system's extent of implementing a standardised math policy (e.g. curriculum and
instructional materials)
Fig IV.1.16

Schools with more autonomy perform better than schools with
less autonomy in systems with more accountability arrangements
School data not public
School data public464
466
468
470
472
474
476
478
Less school autonomy
More school autonomy
Score points
School autonomy for curriculum and assessment
x system's level of posting achievement data publicly
Fig IV.1.16
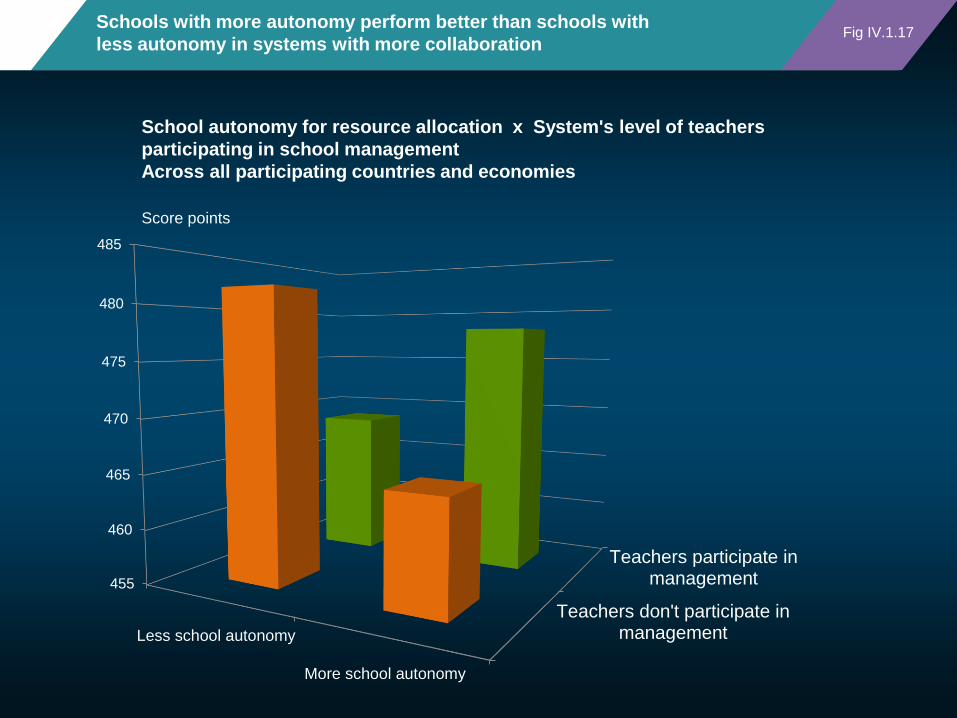
Schools with more autonomy perform better than schools with
less autonomy in systems with more collaboration
Teachers don't participate inmanagement
Teachers participate inmanagement455
460
465
470
475
480
485
Less school autonomy
More school autonomy
Score points
School autonomy for resource allocation x System's level of teachers
participating in school management
Across all participating countries and economies
Fig IV.1.17

0 20 40 60 80 100
Written specification of the school's curriculum andeducational goals
Written specification of student-performance standards
Systematic recording of data, including teacher andstudent attendance and graduation rates, test results…
Internal evaluation/self-evaluation
External evaluation
Written feedback from students (e.g. regarding lessons,teachers or resources)
Teacher mentoring
Regular consultation with one or more experts over aperiod of at least six months with the aim of improving…
Implementation of a standardised policy for mathematics
%
Percentage of students in schools whose principal reported that their schools have the following for quality assurance and improvement:
Singapore OECD average
Quality assurance and school improvement Fig IV.4.1455
5656L
essons f
rom
hig
h p
erf
orm
ers
Low impact on outcomes
High impact on outcomes
Low feasibility High feasibility
Money pits
Must haves
Low hanging fruits
Quick wins
Commitment to universal achievement
Gateways, instructional systems
Capacity at point of delivery
Incentive structures and accountability
Resources where they yield most
A learning systemCoherence
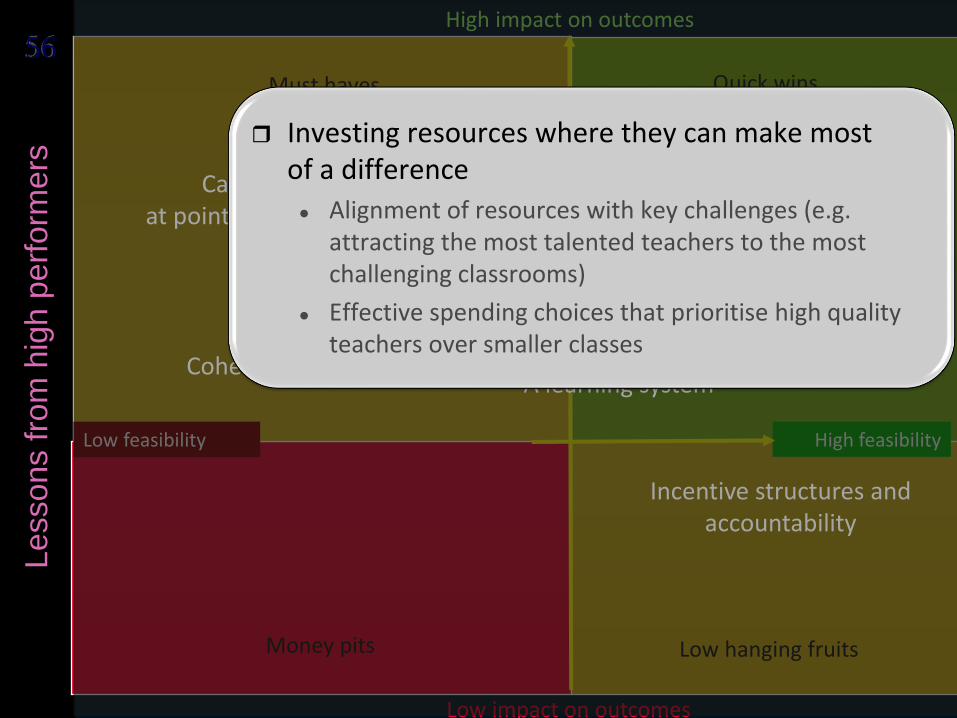
Investing resources where they can make mostof a difference
Alignment of resources with key challenges (e.g. attracting the most talented teachers to the most challenging classrooms)
Effective spending choices that prioritise high quality teachers over smaller classes

5757 Align the resources with the challenges
Hong Kong-China
Brazil
Uruguay
Croatia
Latvia
Chinese Taipei
Thailand
Bulgaria
Jordan
Macao-China
UAE
Argentina
Indonesia
Kazakhstan
Peru
Costa RicaMontenegro
Tunisia
Qatar
Singapore
Colombia
MalaysiaSerbia
Romania
Viet Nam
Shanghai-China
USA
Poland
New Zealand
Greece
UK
Estonia
Finland
Slovak Rep.
Luxembourg
Germany
AustriaFrance
Japan
TurkeySweden Hungary
AustraliaIsrael
Canada
Ireland
Chile
Belgium
SpainDenmark
Switzerland
Iceland
Slovenia
PortugalNorway
Mexico
Korea
Italy
R² = 0.19
300
350
400
450
500
550
600
650
700
-0.500.511.5
Ma
the
ma
tic
s p
erf
orm
an
ce
(sc
ore
po
ints
)
Equity in resource allocation(index points)
Greater equityLess equity
Adjusted by per capita GDP
Countries with better performance in mathematics tend to allocate educational resources more equitably
Source: PISA 2012

5858 Adequate resources to address disadvantage
Disadvantaged schools reported
more teacher shortage
Advantaged schools reported
more teacher shortage
-0.5
-0.3
-0.1
0.1
0.3
0.5
0.7
0.9
1.1
1.3
1.5
Ko
rea
Esto
nia
Isra
el
La
tvia
Slo
ve
nia
Ita
lyP
ola
nd
Sin
gap
ore
Arg
en
tin
aN
eth
erl
an
ds
Po
rtu
ga
lC
olo
mb
iaF
ran
ce
Fin
lan
dT
un
isia
Ma
cao
-Ch
ina
Sp
ain
Gre
ec
eS
wit
zerl
an
dN
orw
ay
Ru
ss
ian
Fe
d.
Jap
an
Au
str
iaM
on
ten
eg
roC
roati
aC
an
ad
aO
EC
D a
ve
rag
eG
erm
an
yD
en
mark
Hu
ng
ary
Un
ite
d K
ing
do
mL
ux
em
bo
urg
Ho
ng
Ko
ng
-Ch
ina
Belg
ium
Ice
lan
dV
iet
Na
mIr
ela
nd
Un
ite
d S
tate
sC
hil
eC
zech
Rep
ub
lic
Serb
iaT
urk
ey
Me
xic
oIn
do
nesia
Uru
gu
ay
Sh
an
gh
ai-
Ch
ina
Slo
va
k R
ep
ub
lic
Sw
ed
en
Bra
zil
Ne
w Z
ea
lan
dA
us
tralia
Ch
ine
se
Ta
ipe
i
Me
an
in
de
x d
iffe
ren
ce
Difference between socio-economically disadvantaged and socio-economically advantaged schools
A shortage of qualified teachers is more of concernin disadvantaged schools

5959L
essons f
rom
hig
h p
erf
orm
ers
Low impact on outcomes
High impact on outcomes
Low feasibility High feasibility
Money pits
Must haves
Low hanging fruits
Quick wins
Commitment to universal achievement
Gateways, instructional systems
Capacity at point of delivery
Incentive structures and accountability
Resources where they yield most
A learning systemCoherence
Coherence of policies and practices
Alignment of policies across all aspects of the system
Coherence of policies over sustained periods of time
Consistency of implementation
Fidelity of implementation (without excessive control)

6060L
essons f
rom
hig
h p
erf
orm
ers
Low impact on outcomes
High impact on outcomes
Low feasibility High feasibility
Money pits
Must haves
Low hanging fruits
Quick wins
Commitment to universal achievement
Gateways, instructional systems
Capacity at point of delivery
Incentive structures and accountability
Resources where they yield most
A learning systemCoherence

6161L
essons f
rom
hig
h p
erf
orm
ers Some students learn at high levels All students need to learn at high levels
Student inclusion
Routine cognitive skills Conceptual understanding, complex ways of thinking, ways of working
Curriculum, instruction and assessment
Standardisation and compliance High-level professional knowledge workers
Teacher quality
‘Tayloristic’, hierarchical Flat, collegial
Work organisation
Primarily to authorities Primarily to peers and stakeholders
Accountability
What it all means
The old bureaucratic system The modern enabling system

6262L
essons f
rom
hig
h p
erf
orm
ers
62
62 Thank you
Find out more about our work at www.oecd.org
– All publications
– The complete micro-level database
Email: [email protected]
Twitter: SchleicherEDU
and remember:
Without data, you are just another person with an opinion