hOw Much tennessee Public schOOls sPend PeR student
15
OFFICE OF RESEARCH AND EDUCATION ACCOUNTABILITY HOW MUCH TENNESSEE PUBLIC SCHOOLS SPEND PER STUDENT MARCH 2021 J ASON E. MUMPOWER Comptroller of the Treasury TARA BERGFELD Principal Legislative Research Analyst KIM POTTS Principal Legislative Research Analyst
Transcript of hOw Much tennessee Public schOOls sPend PeR student

Office Of ReseaRch and educatiOn accOuntability
hOw Much tennessee Public schOOls sPend PeR student
MaRch 2021
JasOn e. MuMPOweR
Comptroller of the Treasury
taRa beRgfeld
Principal Legislative Research AnalystKiM POtts
Principal Legislative Research Analyst
2
OverviewIn late June 2020, the Tennessee Department of Education (TDOE or the department) published data showing per-pupil expenditures for every public school in the state for school year 2018-19. To provide some context to the amount of per-pupil spending shown for each school, OREA has released an interactive dashboard of per-pupil spending and demographic data for all K-12 public schools and districts.
This report describes the department’s methodology in calculating the per-pupil figures at both the school and district level. It also explains briefly how school districts are funded in Tennessee and how, in turn, school districts allocate funds to their schools. The report examines Tennessee’s data and discusses factors that are important for the General Assembly and other education stakeholders to consider regarding the per-pupil figures, particularly when comparing schools.
Federal education law requires states to report per-pupil spending by schoolUnder a provision in the federal education law, the Every Student Succeeds Act (ESSA),A passed into law in 2015, the annual State Report Card for public schools must include:
The per-pupil expenditures of Federal, State, and local funds, including actual personnel expenditures and actual non-personnel expenditures of Federal, State, and local funds, disaggregated by source of funds, for each local educational agency and each school in the State for the preceding fiscal year.1
Though states had long reported per-pupil expenditures by district, reporting these figures by school was a new requirement. Because most school districts’ accounting systems had not been designed to report spending at the school level, states needed time to develop the ability to comply with this requirement. The U.S. Department of Education granted states additional time to reach compliance also because the 2016 federal ESSA regulations, which addressed the per-pupil expenditure reporting requirement for state report cards and detailed the expenditures to include and exclude from the calculations, were disapproved by Congress in a 2017 resolution also signed by the President. Because of this, states were limited to using only the statutory language to determine how to proceed.2
Following the disapproval of the regulations, in 2017, the U.S. Department of Education directed states to its contracted education support agencies for assistance.3 States could collaborate with other states through the Edunomics Lab at Georgetown University “on operationalizing the broad ESSA provision and making
A The federal Every Student Succeeds Act (ESSA), signed into law December 2015, is the most recent version of the Elementary and Secondary Education Act of 1965. ESSA replaces the No Child Left Behind Act of 2001 (NCLB), the previous version of the 1965 education law.
OREA interactive dashboard with all Tennessee schools’ per-pupil expenditure information
OREA’s dashboard allows users to view the 2018-19 school year per-pupil expenditure figures for all Tennessee school districts and K-12 public schools.
An interactive map allows users to view a breakdown of 2018-19 average district level per-pupil expenditures.
Report card calculations: the data used for calculating per-pupil expenditures makes a difference
States have long reported and published district level per-pupil expenditure figures but because these included such items as state level program and administrative costs, among others, the resulting figures did not represent actual district level expenditures.
The previous formula took total district operating expenditures (excluding student body education and adult education), USDA commodity values (school nutrition), and state level program and administrative costs, and divided that figure by average daily attendance (ADA).
The updated per-pupil figure required by ESSA no longer includes state level administrative costs. It also uses enrollment on October 1 as the denominator in the calculation instead of ADA.
3
the school-level financial data meaningful across states.”4 Tennessee is a member of a network of states and school districts facilitated by Edunomics called the Financial Transparency Working Group (FiTWiG).B This collective network developed Interstate Financial Reporting, “a set of voluntary, minimal reporting criteria that states could voluntarily use to make valid, apples-to-apples comparisons of school-level per-pupil expenditures across states.”5
Tennessee developed a formula for calculating school-level per-pupil expendituresTo establish a per-pupil expenditure at the school level, in basic terms, each school’s expenditures would be added together along with any district-wide (or shared expenditures), and the resulting total would then be divided by the number of students enrolled in the school as of October 1. According to ESSA, the calculation must include funds from federal, state, and local sources, and these must be disaggregated by source in the figures reported. (See “A short explanation of how K-12 public schools in Tennessee are funded” on page 5.)
To develop its formula, Tennessee had to decide the details of which standard expenditures to include (for example, how to divide and assign central or shared expenditures, such as transportation, to schools,), as well as what to exclude to make the figures comparable and useful across the state. Tennessee followed the voluntary Interstate Financial Reporting criteria, as did most participating states, according to Edunomics.6
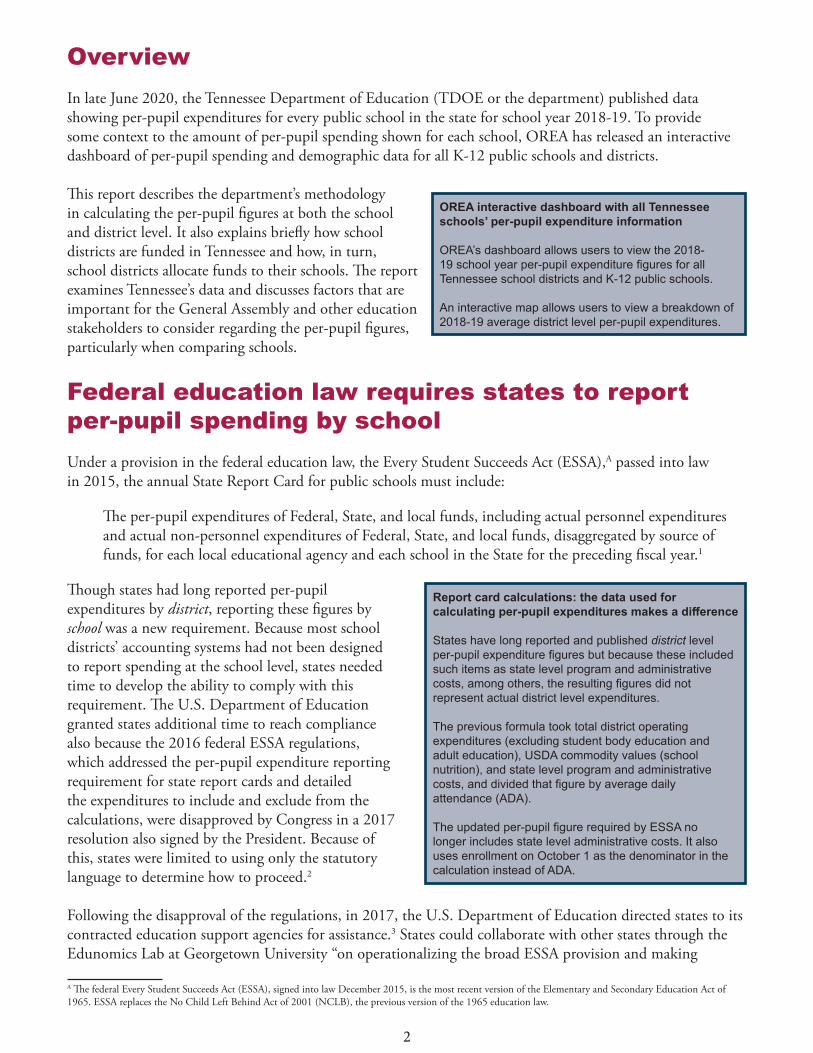
In 2018, TDOE created the Tennessee Financial Transparency Working Group, modeled after the national Financial Transparency Working Group (FiTWiG), of which the state is a member, to compile input from stakeholders (i.e., districts) on what expenditures to include at the school level versus district level and how to collect and present data.7 TDOE gathered input through a pilot project that included the participation of 13 Tennessee school districts using FY2017 expenditures to help create a draft formula for determining school- versus district-level expenditures.8,C Tennessee’s final formula designates certain expenditures that can be distinguished at the school level, such as salaries and benefits for those working at least 50 percent of their time in a school, instructional supplies and materials, utilities, and school nutrition.9 All other expenditures are considered district level. To obtain a per-pupil figure, the total school-level and district-level expenditures are each divided by the student membership figure as of October 1 of the school year.10
Exhibit 1: School-level expenditures
Source: Tennessee Department of Education.
B At the time of the 2018 IFR report, FiTWiG comprised 39 states and more than 20 school districts throughout the U.S.C Anderson County, Bartlett City, Clinton City, Greeneville City, Hardin County, Johnson City, Madison County, Manchester City, Millington City, Rutherford County, Sevier County, Shelby County, and Williamson County school districts participated in the pilot program with TDOE.
Expenditure categories• Salaries• Benefits and retirement• Instructional supplies and materials• Utilities
Accounts• Regular instruction program• Alternative instruction program• Special education program• Vocational education program• Attendance• Health services• Other student support
• Support services/regular instruction program• Support Services/Alternative Instruction Program• Support Services/Special Education Program• Support Services/Vocational Education Program• Office of the Principal• Food Service
4
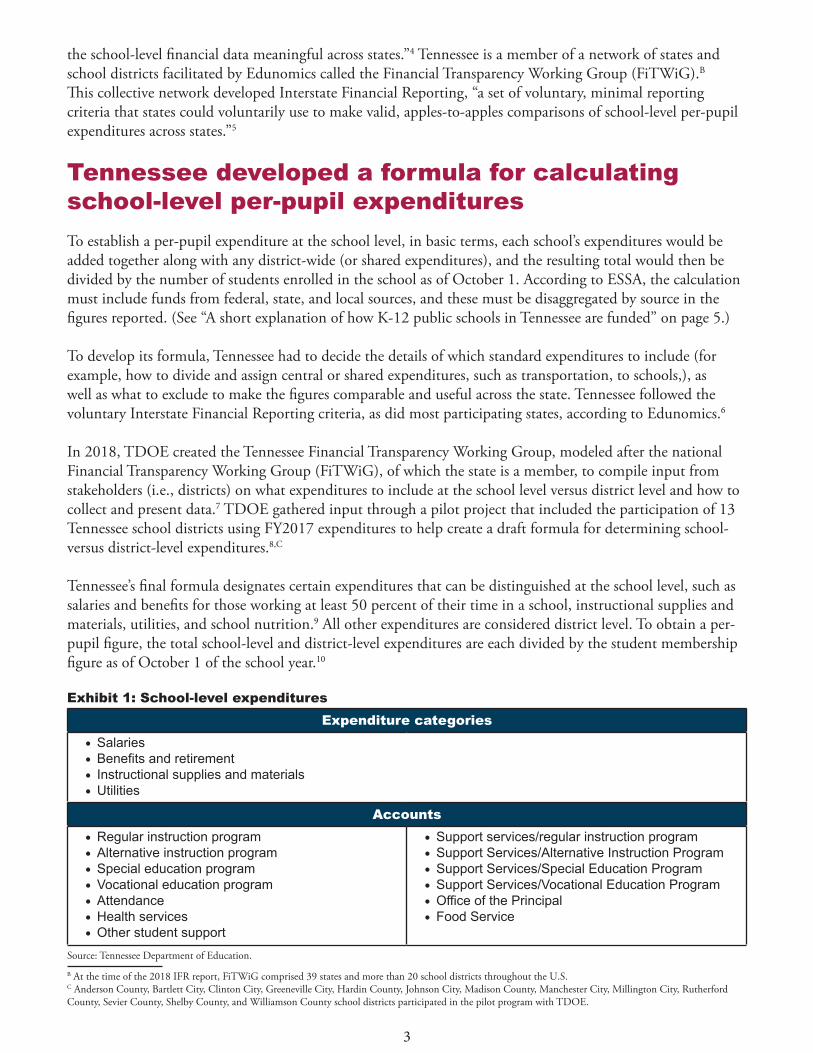
Exhibit 2: Tennessee’s per-pupil expenditure formula
The per-pupil figures do not include the following types of expenditures:
• student body education – learning experiences including school sponsored co-curricular activities such as band, choir, speech, etc., student-financed and managed activities (e.g., class of 20xx) and club accounts, and school sponsored athletic activities;
• instruction and support services for adult education – programs include activities that prepare adult students for a job or postsecondary education (e.g., community college or certificate program), upgrade occupational competence, etc.;
• noninstructional expenditures for early childhood and community service (e.g., expenditures for system staff participating in community organizations such as leadership, family resource centers, Families First, Pre-K programs, extended school programs, and community-sponsored activities);
• regular capital outlay – site acquisition services, site improvement services, architecture and engineering services, etc.;
• debt service – expenditures for servicing long-term debt (obligations exceeding one year);• transfers – transfers to other funds such as debt service or indirect cost payments;• capital projects – expenditures related to constructing, remodeling, and equipping buildings where long-
term debt is usually involved in financing the activity; and • private purpose trust – funds dedicated for a specific purpose. In some cases, districts may use only the
interest earned on the principal investment.11
In addition, private funds from organizations affiliated with schools (e.g., parent-teacher associations, booster clubs) are not included in either the school- or district-level figures.
OREA created two tools to view the per-pupil expenditure dataOREA developed two tools for public analysis of the 2018-19 school-level per-pupil figures. First, an interactive dashboard allows a user to select a school district and view both district- and school-level financial and demographic information. Users can choose to view all schools within a district or select one or more for comparison. Second, a searchable map of Tennessee displays the average school and district per-pupil amounts as well as district-level demographic data.
The department plans to add more visualization tools with the per-pupil expenditure data to the State Report Card. In September 2020, the U.S. Department of Education released an interactive map of the U.S., allowing access to each state’s per-pupil spending by school. Some states’ data is not yet viewable on the site, including Tennessee’s.
School level per pupil
+District level per pupil
Federal State and Local
School nutrition Federal State and
LocalSchool nutrition
=Total school expenditures
÷Student enrollment
=Per-pupil expenditure by school
5
A short explanation of how K-12 public schools in Tennessee are funded
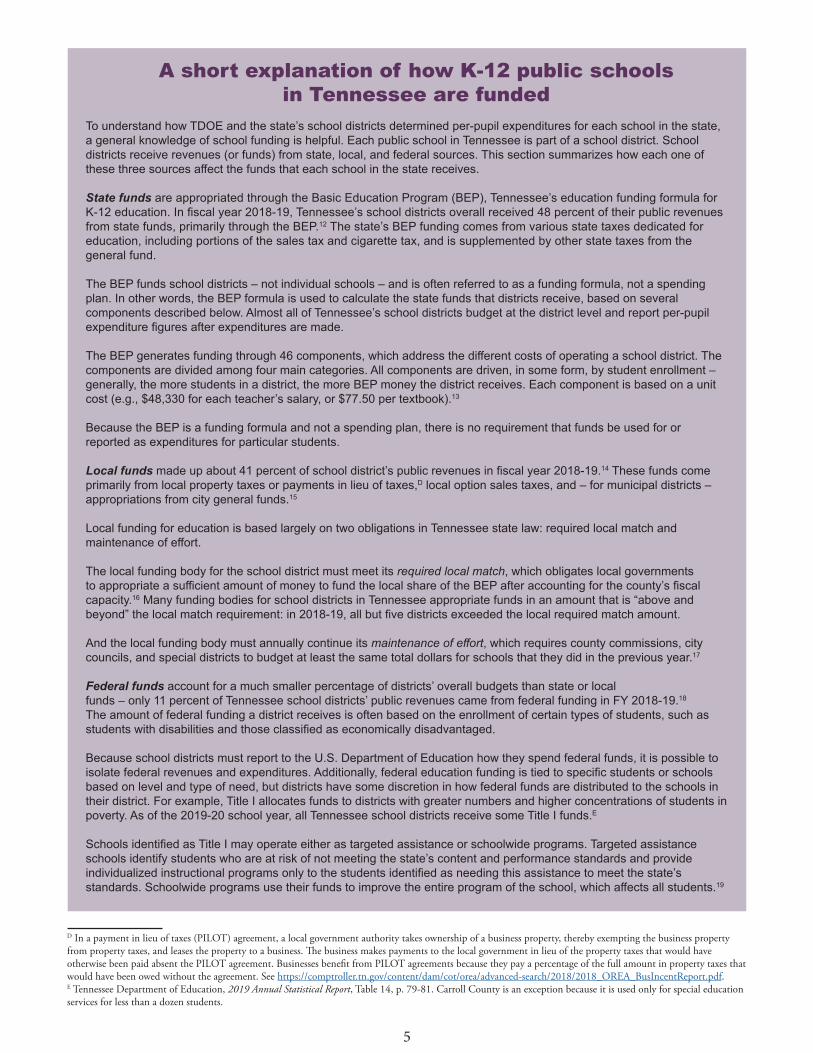
To understand how TDOE and the state’s school districts determined per-pupil expenditures for each school in the state, a general knowledge of school funding is helpful. Each public school in Tennessee is part of a school district. School districts receive revenues (or funds) from state, local, and federal sources. This section summarizes how each one of these three sources affect the funds that each school in the state receives.
State funds are appropriated through the Basic Education Program (BEP), Tennessee’s education funding formula for K-12 education. In fiscal year 2018-19, Tennessee’s school districts overall received 48 percent of their public revenues from state funds, primarily through the BEP.12 The state’s BEP funding comes from various state taxes dedicated for education, including portions of the sales tax and cigarette tax, and is supplemented by other state taxes from the general fund.
The BEP funds school districts – not individual schools – and is often referred to as a funding formula, not a spending plan. In other words, the BEP formula is used to calculate the state funds that districts receive, based on several components described below. Almost all of Tennessee’s school districts budget at the district level and report per-pupil expenditure figures after expenditures are made. The BEP generates funding through 46 components, which address the different costs of operating a school district. The components are divided among four main categories. All components are driven, in some form, by student enrollment – generally, the more students in a district, the more BEP money the district receives. Each component is based on a unit cost (e.g., $48,330 for each teacher’s salary, or $77.50 per textbook).13 Because the BEP is a funding formula and not a spending plan, there is no requirement that funds be used for or reported as expenditures for particular students.
Local funds made up about 41 percent of school district’s public revenues in fiscal year 2018-19.14 These funds come primarily from local property taxes or payments in lieu of taxes,D local option sales taxes, and – for municipal districts – appropriations from city general funds.15
Local funding for education is based largely on two obligations in Tennessee state law: required local match and maintenance of effort. The local funding body for the school district must meet its required local match, which obligates local governments to appropriate a sufficient amount of money to fund the local share of the BEP after accounting for the county’s fiscal capacity.16 Many funding bodies for school districts in Tennessee appropriate funds in an amount that is “above and beyond” the local match requirement: in 2018-19, all but five districts exceeded the local required match amount.
And the local funding body must annually continue its maintenance of effort, which requires county commissions, city councils, and special districts to budget at least the same total dollars for schools that they did in the previous year.17
Federal funds account for a much smaller percentage of districts’ overall budgets than state or local funds – only 11 percent of Tennessee school districts’ public revenues came from federal funding in FY 2018-19.18 The amount of federal funding a district receives is often based on the enrollment of certain types of students, such as students with disabilities and those classified as economically disadvantaged.
Because school districts must report to the U.S. Department of Education how they spend federal funds, it is possible to isolate federal revenues and expenditures. Additionally, federal education funding is tied to specific students or schools based on level and type of need, but districts have some discretion in how federal funds are distributed to the schools in their district. For example, Title I allocates funds to districts with greater numbers and higher concentrations of students in poverty. As of the 2019-20 school year, all Tennessee school districts receive some Title I funds.E
Schools identified as Title I may operate either as targeted assistance or schoolwide programs. Targeted assistance schools identify students who are at risk of not meeting the state’s content and performance standards and provide individualized instructional programs only to the students identified as needing this assistance to meet the state’s standards. Schoolwide programs use their funds to improve the entire program of the school, which affects all students.19
D In a payment in lieu of taxes (PILOT) agreement, a local government authority takes ownership of a business property, thereby exempting the business property from property taxes, and leases the property to a business. The business makes payments to the local government in lieu of the property taxes that would have otherwise been paid absent the PILOT agreement. Businesses benefit from PILOT agreements because they pay a percentage of the full amount in property taxes that would have been owed without the agreement. See https://comptroller.tn.gov/content/dam/cot/orea/advanced-search/2018/2018_OREA_BusIncentReport.pdf.E Tennessee Department of Education, 2019 Annual Statistical Report, Table 14, p. 79-81. Carroll County is an exception because it is used only for special education services for less than a dozen students.
6
School districts use different methods to allocate education funds to each individual school
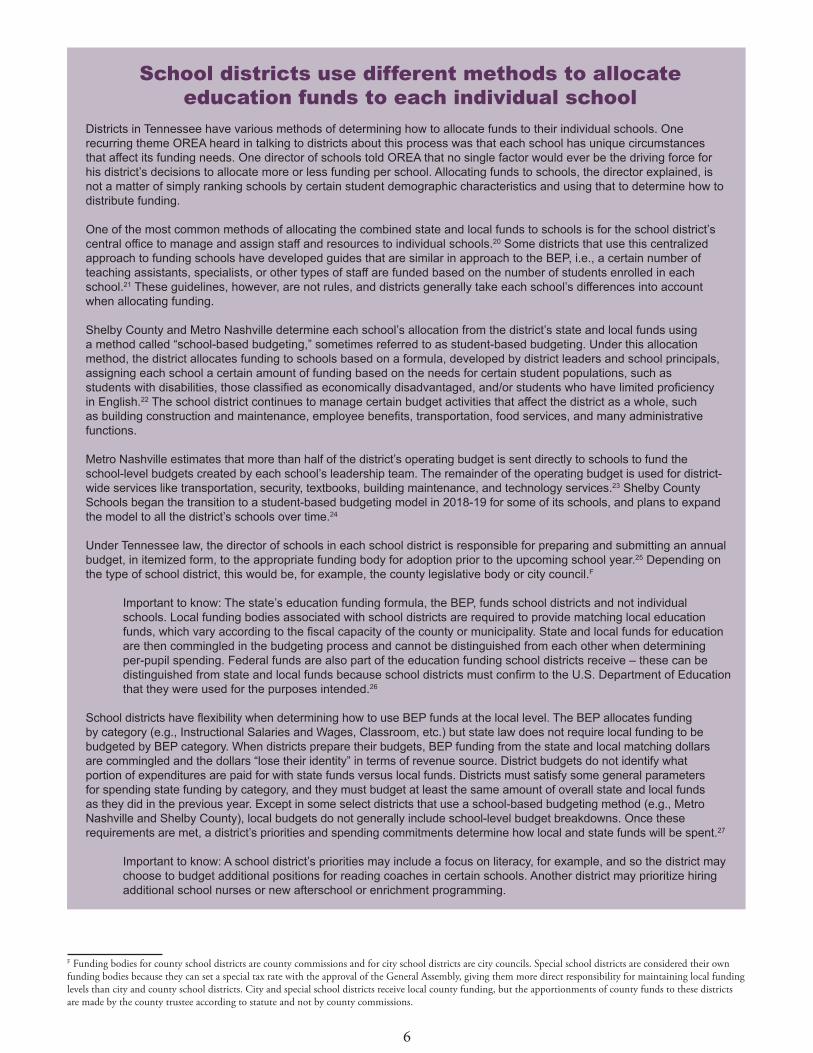
Districts in Tennessee have various methods of determining how to allocate funds to their individual schools. One recurring theme OREA heard in talking to districts about this process was that each school has unique circumstances that affect its funding needs. One director of schools told OREA that no single factor would ever be the driving force for his district’s decisions to allocate more or less funding per school. Allocating funds to schools, the director explained, is not a matter of simply ranking schools by certain student demographic characteristics and using that to determine how to distribute funding.
One of the most common methods of allocating the combined state and local funds to schools is for the school district’s central office to manage and assign staff and resources to individual schools.20 Some districts that use this centralized approach to funding schools have developed guides that are similar in approach to the BEP, i.e., a certain number of teaching assistants, specialists, or other types of staff are funded based on the number of students enrolled in each school.21 These guidelines, however, are not rules, and districts generally take each school’s differences into account when allocating funding. Shelby County and Metro Nashville determine each school’s allocation from the district’s state and local funds using a method called “school-based budgeting,” sometimes referred to as student-based budgeting. Under this allocation method, the district allocates funding to schools based on a formula, developed by district leaders and school principals, assigning each school a certain amount of funding based on the needs for certain student populations, such as students with disabilities, those classified as economically disadvantaged, and/or students who have limited proficiency in English.22 The school district continues to manage certain budget activities that affect the district as a whole, such as building construction and maintenance, employee benefits, transportation, food services, and many administrative functions. Metro Nashville estimates that more than half of the district’s operating budget is sent directly to schools to fund the school-level budgets created by each school’s leadership team. The remainder of the operating budget is used for district-wide services like transportation, security, textbooks, building maintenance, and technology services.23 Shelby County Schools began the transition to a student-based budgeting model in 2018-19 for some of its schools, and plans to expand the model to all the district’s schools over time.24
Under Tennessee law, the director of schools in each school district is responsible for preparing and submitting an annual budget, in itemized form, to the appropriate funding body for adoption prior to the upcoming school year.25 Depending on the type of school district, this would be, for example, the county legislative body or city council.F
Important to know: The state’s education funding formula, the BEP, funds school districts and not individual schools. Local funding bodies associated with school districts are required to provide matching local education funds, which vary according to the fiscal capacity of the county or municipality. State and local funds for education are then commingled in the budgeting process and cannot be distinguished from each other when determining per-pupil spending. Federal funds are also part of the education funding school districts receive – these can be distinguished from state and local funds because school districts must confirm to the U.S. Department of Education that they were used for the purposes intended.26
School districts have flexibility when determining how to use BEP funds at the local level. The BEP allocates funding by category (e.g., Instructional Salaries and Wages, Classroom, etc.) but state law does not require local funding to be budgeted by BEP category. When districts prepare their budgets, BEP funding from the state and local matching dollars are commingled and the dollars “lose their identity” in terms of revenue source. District budgets do not identify what portion of expenditures are paid for with state funds versus local funds. Districts must satisfy some general parameters for spending state funding by category, and they must budget at least the same amount of overall state and local funds as they did in the previous year. Except in some select districts that use a school-based budgeting method (e.g., Metro Nashville and Shelby County), local budgets do not generally include school-level budget breakdowns. Once these requirements are met, a district’s priorities and spending commitments determine how local and state funds will be spent.27
Important to know: A school district’s priorities may include a focus on literacy, for example, and so the district may choose to budget additional positions for reading coaches in certain schools. Another district may prioritize hiring additional school nurses or new afterschool or enrichment programming.
F Funding bodies for county school districts are county commissions and for city school districts are city councils. Special school districts are considered their own funding bodies because they can set a special tax rate with the approval of the General Assembly, giving them more direct responsibility for maintaining local funding levels than city and county school districts. City and special school districts receive local county funding, but the apportionments of county funds to these districts are made by the county trustee according to statute and not by county commissions.

7
Spending requirements by category in the Basic Education Program (BEP) formula
Instructional salaries generate funding for classroom teachers and other licensed positions, such as principals and librarians. Funding must be spent on teacher salaries though districts do not have to spend the money on specific types of teachers. Districts with an average weighted salary below the state average must spend all BEP funds generated in the Instructional Salaries and Wages category on salaries for licensed instructional positions.
Instructional benefits cover retirement and health insurance for classroom teachers and other licensed personnel. Districts with an average weighted salary above the state average may use BEP Instructional Salaries and Wages funding on either salaries or benefits. Classroom includes textbooks, classroom supplies, technology, and some positions such as nurses and instructional assistants; State law requires that Classroom category funding only be spent on Instructional or Classroom items.
Non-classroom includes superintendents, school buses, maintenance and operations, and capital outlay. Funding generated in the Non-classroom category may be spent in any of the BEP’s four categories.
Types of school districts in Tennessee
Local school districts in Tennessee are one of three types: county, municipal, or special. There are 141 local school districts in the state. Districts vary widely in the number of schools administered and the number of students served. Unlike school districts in most other states, most school districts in Tennessee are financially dependent on another government body, either a county or a city. (Tennessee’s special school districts are an exception. Unlike county and municipal districts, special school districts are established by private acts of the state legislature and must have the legislature’s approval for any tax levy to support operations).
Municipal school districts have additional funding sources that may result in more revenues for education overall than county school districts. On average, municipal school districts spent about $600 more per pupil in 2018-19 than county districts. Municipal school districts typically receive a designated portion of city tax revenues, in addition to their share of county tax revenues and their state Basic Education Program (BEP) funds. Municipal districts are also, on average, smaller than county districts, meaning that funding for education is divided by fewer students, which tends to result in a higher per-pupil expenditure figure.
Type ofschool district
Average total per-pupil expenditures
Average number of schools
Average enrollment
County $9,467 16 8,963
Municipal $10,085 5 3,187
Special $9,618 4 1,586

8
Context is key when analyzing Tennessee’s school-level per-pupil expenditure data, and data limitations should be consideredAs states begin publishing expenditures at the school level, one major challenge exists in presenting such information: schools that appear similar in some respects – grade levels, number of students, for example – may differ in the amount of spending per student, and it will be important to consider possible explanations for such differences. Because districts must account for a variety of factors when allocating funds to schools, it is not advisable to isolate a single factor as the reason certain schools in a district spent more per pupil than others. This section discusses several elements that should be considered when reviewing school per-pupil expenditures.
Data considerations
ESSA requires only the reporting of the total per-pupil expenditure at the district and school levels. The reporting requirement was not designed to provide an in-depth view of how each school spends money.28
The method TDOE used to collect school per-pupil expenditure data from districts in this first year (2018-19) limits data analysis. TDOE asked each district to provide information in the form of an Excel spreadsheet with totals of specific expenditures (i.e., salaries and benefits, instructional supplies and materials, utilities, and school nutrition) that could be attributed to each school, and to provide a breakdown between federal and state/local expenditures.29 (Tennessee’s formula combines state and local funds into one expenditure category because, when districts prepare their budgets, BEP funding from the state and local matching dollars are commingled and the dollars “lose their identity” in terms of revenue source. District budgets do not identify what portion of expenditures are paid for with state funds versus local funds.30)
The spreadsheets that districts provided contain totals for the expenditures in each category by school but do not contain all the data – i.e., individual expenditures and accounts – that districts used to aggregate the expenditure totals. As expenditure reporting requirements do not include a provision for districts to distinguish between state and local sources, the per-pupil expenditure formula cannot capture this split. TDOE officials indicated a high level of confidence in the data that districts provided, but OREA did not verify districts’ data.31 The department provided OREA with some select districts’ spreadsheets for review. Salaries and benefits made up the bulk of school expenditures across the board, but data for these was not collected in a way that would allow an analysis, for example, of whether the school employs a larger proportion of newer teachers with lower salaries or more experienced teachers with higher salaries.G
Private donations that schools receive are not included in the data. For some schools, private funds are a significant source of funding that may be used to fund items such as building renovations, teacher supplies, and technology needs.32 The inclusion of these funds into the per-pupil spending data could help identify differences among schools that are unrelated to the funds derived from federal, state, and local sources of funds. Few states have elected to include private funds in their reporting of per-pupil school spending, however – OREA identified only one: Massachusetts. In the federal regulations concerning the reporting of per-pupil school-level expenditures that were ultimately revoked, private funds specifically were not to be included in state and local expenditures used for reporting.33
G Tennessee educator information, such as salary and licensure data, is available through TN Compass. Aggregated data must be requested from TDOE and is not readily available for public download.
9
Interpreting per-pupil expenditure data
As of the 2018-19 school year, only the two largest districts in the state, Metro Nashville and Shelby County, are using school-based budgeting. Almost all of Tennessee’s school districts budget at the district level and, after expenditures are made, then report per-pupil expenditure figures. (See “A short explanation of how K-12 public schools in Tennessee are funded” starting on page 5 for more information on how districts budget and distribute funds for education.)
It is important to keep in mind that this data is best used to compare schools within one district, not to compare schools from different districts to one another. Tennessee’s school districts are quite varied in terms of size and student demographics. Seven of the state’s 141 districts have only one school while Shelby County served over 100,000 students in 202 schools in 2018-19. The five largest urban districts in the state are different from most of the other districts not only in the number of students enrolled but in the student populations they serve and the resources they have available. The revenue sources available to school districts and the way they distribute funds to schools can also vary – urban school districts can raise more local revenue for education than smaller rural districts. The total amount of funds spent at an urban school with a large population of poor students is not an even comparison to a small rural school with a less diverse student population.
Additionally, it is not advisable to isolate a single factor – such as the grade level, or the percent of economically disadvantaged students or English learners at a school – as the reason a school spent more per pupil compared to other schools. Further statistical analyses may reveal the influence that these variables have on spending, but one director of schools told OREA that no single factor would ever be the driving force for his district’s decisions to allocate more or less funding to a particular school. Allocating funds to schools, this director explained, is not a matter of simply ranking schools by certain student demographic characteristics and using that to determine how to distribute funding.34 See “School districts use different methods to allocate education funds to each individual school” on page 6.
OREA analyzed total school-level expenditures per pupil in several districts to illustrate different factors that could influence school-level per-pupil figures. Some examples are described below.
Special population schools
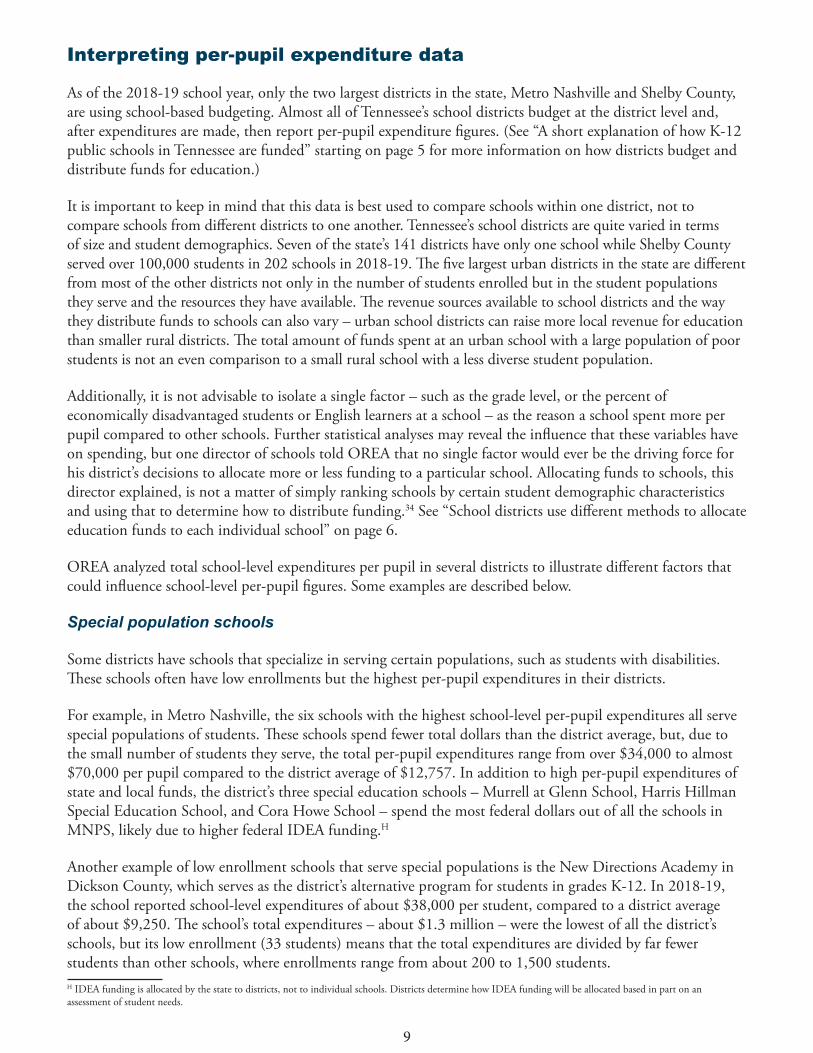
Some districts have schools that specialize in serving certain populations, such as students with disabilities. These schools often have low enrollments but the highest per-pupil expenditures in their districts.
For example, in Metro Nashville, the six schools with the highest school-level per-pupil expenditures all serve special populations of students. These schools spend fewer total dollars than the district average, but, due to the small number of students they serve, the total per-pupil expenditures range from over $34,000 to almost $70,000 per pupil compared to the district average of $12,757. In addition to high per-pupil expenditures of state and local funds, the district’s three special education schools – Murrell at Glenn School, Harris Hillman Special Education School, and Cora Howe School – spend the most federal dollars out of all the schools in MNPS, likely due to higher federal IDEA funding.H
Another example of low enrollment schools that serve special populations is the New Directions Academy in Dickson County, which serves as the district’s alternative program for students in grades K-12. In 2018-19, the school reported school-level expenditures of about $38,000 per student, compared to a district average of about $9,250. The school’s total expenditures – about $1.3 million – were the lowest of all the district’s schools, but its low enrollment (33 students) means that the total expenditures are divided by far fewer students than other schools, where enrollments range from about 200 to 1,500 students. H IDEA funding is allocated by the state to districts, not to individual schools. Districts determine how IDEA funding will be allocated based in part on an assessment of student needs.
10
Enrollment and grade span
In addition to a school’s enrollment, the grade levels served may influence spending. Elementary schools often enroll fewer students than high schools, but state law requires elementary schools to have smaller class sizes than high schools which may result in more teachers – thus, potentially higher expenditures – per grade.I
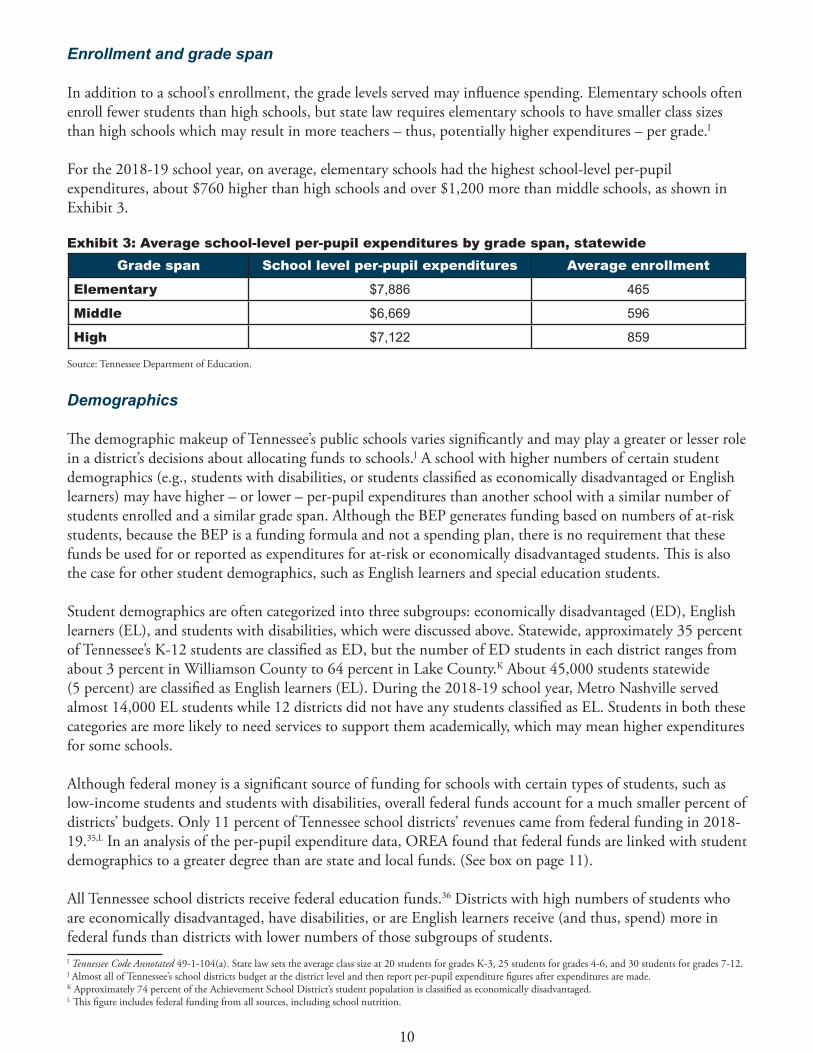
For the 2018-19 school year, on average, elementary schools had the highest school-level per-pupil expenditures, about $760 higher than high schools and over $1,200 more than middle schools, as shown in Exhibit 3.
Exhibit 3: Average school-level per-pupil expenditures by grade span, statewide
Source: Tennessee Department of Education.
Demographics
The demographic makeup of Tennessee’s public schools varies significantly and may play a greater or lesser role in a district’s decisions about allocating funds to schools.J A school with higher numbers of certain student demographics (e.g., students with disabilities, or students classified as economically disadvantaged or English learners) may have higher – or lower – per-pupil expenditures than another school with a similar number of students enrolled and a similar grade span. Although the BEP generates funding based on numbers of at-risk students, because the BEP is a funding formula and not a spending plan, there is no requirement that these funds be used for or reported as expenditures for at-risk or economically disadvantaged students. This is also the case for other student demographics, such as English learners and special education students.
Student demographics are often categorized into three subgroups: economically disadvantaged (ED), English learners (EL), and students with disabilities, which were discussed above. Statewide, approximately 35 percent of Tennessee’s K-12 students are classified as ED, but the number of ED students in each district ranges from about 3 percent in Williamson County to 64 percent in Lake County.K About 45,000 students statewide (5 percent) are classified as English learners (EL). During the 2018-19 school year, Metro Nashville served almost 14,000 EL students while 12 districts did not have any students classified as EL. Students in both these categories are more likely to need services to support them academically, which may mean higher expenditures for some schools.
Although federal money is a significant source of funding for schools with certain types of students, such as low-income students and students with disabilities, overall federal funds account for a much smaller percent of districts’ budgets. Only 11 percent of Tennessee school districts’ revenues came from federal funding in 2018-19.35,L In an analysis of the per-pupil expenditure data, OREA found that federal funds are linked with student demographics to a greater degree than are state and local funds. (See box on page 11).
All Tennessee school districts receive federal education funds.36 Districts with high numbers of students who are economically disadvantaged, have disabilities, or are English learners receive (and thus, spend) more in federal funds than districts with lower numbers of those subgroups of students. I Tennessee Code Annotated 49-1-104(a). State law sets the average class size at 20 students for grades K-3, 25 students for grades 4-6, and 30 students for grades 7-12.J Almost all of Tennessee’s school districts budget at the district level and then report per-pupil expenditure figures after expenditures are made.K Approximately 74 percent of the Achievement School District’s student population is classified as economically disadvantaged.L This figure includes federal funding from all sources, including school nutrition.
Grade span School level per-pupil expenditures Average enrollment
Elementary $7,886 465
Middle $6,669 596
High $7,122 859

11
The federal laws that require the distribution of these funds to states are Title I, Title III, and the Individuals with Disabilities Education Act (IDEA). (See “Federal funds received by Tennessee school districts.”) States distribute the funds to districts, which then allocate the funds to schools. The funds can be used to supplement state and local funds for districts but cannot be used to supplant them.M
English learners
During the 2018-19 school year, six school districts accounted for about 69 percent of all students classified as English learners.N Two of these districts (Davidson and Shelby) served almost half (or 48 percent) of all EL students in Tennessee.O For example, within Metro Nashville, which serves the largest number (13,701) of EL students in the state, EL students are not evenly distributed among the schools. In 2018-19, one elementary school, Tusculum Elementary, served more EL students (451 students) than 47 other schools combined, which served a collective total of 417 students. Five schools reported serving no EL students.
Shelby County served approximately 8,000 EL students, the second highest total number in the state after Metro Nashville. During the 2018-19 school year, 29 schools in Shelby County reported no EL students while six schools served almost 20 percent (1,560) of the district’s 7,950 EL students. Of the 10 schools with the highest percentage of EL students, the per-pupil amounts range from $10,925 to $14,100.
Economically disadvantaged students
The BEP’s at-risk component provides a specified amount of state funding for each student identified as “at risk.”P The term is also synonymous with another descriptor for students: “economically disadvantaged or ED.”Q As explained previously, it is important not to use one single variable to explain why a school spends more or less than similar schools in the same district. In larger districts with a diverse student population, however, students’ economic status is an important consideration that may factor into school decisions about spending. Schools with large populations of poor students may not have access to private sources of fundraising through
M In general, schools and districts can use Title I funds in ways they deem best to achieve the goals of Title I: to supplement instructional support for students at risk of educational failure, within certain fiscal parameters. Districts must be able to verify that each Title I school receives the same amount of state and local funds it would have received if it did not participate in the Title I program – in other words, districts can supplement but cannot supplant state and local education funds with federal Title I funds. 20 U.S. Code 6321 (a); 20 U.S. Code 7901.N According to federal law, an English Learner student is one “whose difficulties in speaking, reading, writing, or understanding the English language may be sufficient to deny the individual the ability to meet the challenging state academic standards, the ability to successfully achieve in classrooms where the language of instruction is English, or the opportunity to participate fully in society.”O Davidson, Shelby, Knox, Hamilton, Rutherford, and Hamblen had 31,174 of the state’s 45,250 EL students in 2018-19 or about 69 percent. Davidson and Shelby alone had 21,624 EL students (most in Davidson) or about 48 percent of all EL students in the state.P At-risk students meet direct certification eligibility guidelines, i.e., a process that allows states and school districts to certify children who are eligible for free meals. The term “at risk” also refers to students who are homeless, migrant, foster, and runaway students – i.e., students who experience circumstances that make them more likely to be at risk academically. The amount of funding generated for the at-risk component includes state funds with a required local match. The amount depends on the fiscal capacity of the school district.Q Tennessee Department of Education, Every Student Succeeds Act: Building on Success in Tennessee, ESSA State Plan, Updated Aug. 13, 2018, p. 68: “The ‘economically disadvantaged students’ subgroup includes all students who are directly certified to receive free lunch without the need to complete the household application. Homeless, runaway, and migrant children and children from households that receive benefits under the Supplemental Nutrition Assistance Program (SNAP), Temporary Assistance for Needy Families (TANF), or the Food Distribution Program on Indian Reservations (FDPIR) are deemed “categorically eligible” for free school meals and are directly certified.” See https://www.tn.gov/content/dam/tn/education/documents/TN_ESSA_State_Plan_Approved.pdf.
Federal funds received by Tennessee school districts
All Tennessee school districts receive federal Title I, Part A funds. In fiscal year 2019, Tennessee’s grant for Title I, Part A totaled $302,108,622. Shelby County received the largest Title I, Part A subgrant at $61,147,324, and Richard City received the smallest at $86,246. All Tennessee school districts receive Title I funds.
In 2018-19, 66 districts received Title III funding to support English learners academically.
In 2018-19, all school districts received funds under the Individuals with Disabilities Education Act (IDEA) to support students with disabilities academically. Tennessee’s IDEA grant totaled $239,217,149 that year. Shelby County had the largest subgrant at $26,488,747, and State Board of Education had the smallest at $53,954.
Source: Tennessee Department of Education, Annual Statistical Report, 2018-19, Table 14.
12
groups such as booster clubs or parent-teacher organizations, for example. Conversely, larger urban districts have more resources for local funding for education which may influence total funds for education.
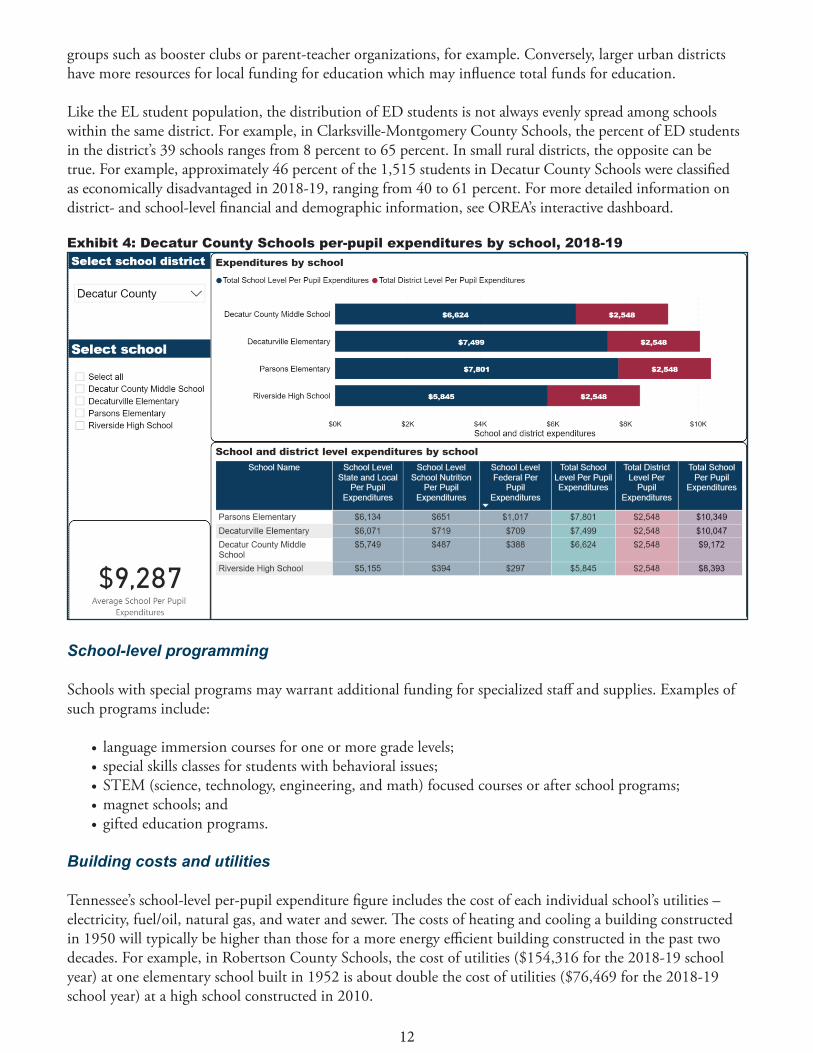
Like the EL student population, the distribution of ED students is not always evenly spread among schools within the same district. For example, in Clarksville-Montgomery County Schools, the percent of ED students in the district’s 39 schools ranges from 8 percent to 65 percent. In small rural districts, the opposite can be true. For example, approximately 46 percent of the 1,515 students in Decatur County Schools were classified as economically disadvantaged in 2018-19, ranging from 40 to 61 percent. For more detailed information on district- and school-level financial and demographic information, see OREA’s interactive dashboard.
Exhibit 4: Decatur County Schools per-pupil expenditures by school, 2018-19
School-level programming
Schools with special programs may warrant additional funding for specialized staff and supplies. Examples of such programs include:
• language immersion courses for one or more grade levels; • special skills classes for students with behavioral issues; • STEM (science, technology, engineering, and math) focused courses or after school programs;• magnet schools; and• gifted education programs.
Building costs and utilities
Tennessee’s school-level per-pupil expenditure figure includes the cost of each individual school’s utilities – electricity, fuel/oil, natural gas, and water and sewer. The costs of heating and cooling a building constructed in 1950 will typically be higher than those for a more energy efficient building constructed in the past two decades. For example, in Robertson County Schools, the cost of utilities ($154,316 for the 2018-19 school year) at one elementary school built in 1952 is about double the cost of utilities ($76,469 for the 2018-19 school year) at a high school constructed in 2010.

13
Endnotes1 20 USC 6311 (h)(1)(C )(x), https://www.law.cornell.edu/uscode/text/20/6311.
2 Edunomics Lab, Interstate Financial Reporting: Making the most of school-level per-student spending data, 2018, p. 1, https://edunomicslab.org/wp-content/uploads/2018/03/Interstate-Financial-Reporting_FINAL.pdf (accessed Oct. 27, 2020).
3 Jason Botel, Acting Assistant Secretary, United States Department of Education, Dear Colleague Letter, June 28, 2017, https://oese.ed.gov/files/2020/07/perpupilreqltr.pdf (accessed Dec. 1, 2020).
4 Edunomics Lab, Interstate Financial Reporting: Making the most of school-level per-student spending data, 2018, p. 1, https://edunomicslab.org/wp-content/uploads/2018/03/Interstate-Financial-Reporting_FINAL.pdf (accessed Oct. 27, 2020).
5 Ibid.
6 Lucy Hadley, Elizabeth Ross, and Marguerite Roza, A Moment of (Early) Truth: Taking Stock of School-by-School Spending Data, Edunomics Lab, 2020, https://edunomicslab.org/wp-content/uploads/2020/07/School-Level-Data-Brief_R5.pdf (accessed Oct. 15, 2020).
7 Tennessee Department of Education, Local Finance Update, 2018 Spring Fiscal Workshop, p. 92, https://eplan.tn.gov/documentlibrary/ViewDocument.aspx?DocumentKey=1363194&inline=true (accessed Oct. 9, 2020).
8 Ibid.
9 Tennessee Department of Education, Executive Director, Office of Local Finance, interview, Aug. 12, 2020.
10 Ibid.
11 Tennessee Department of Education, Office of Local Finance, Standardized System of Accounting and Reporting, Issued July 1, 2001, https://eplan.tn.gov/documentlibrary/ViewDocument.
aspx?DocumentKey=415987&inline=true (accessed Sept. 15, 2020).
12 Tennessee Department of Education, 2019 Annual Statistical Report, Table 19, p. 96.
13 See a complete explanation of the BEP at https://comptroller.tn.gov/office-functions/research-and-education-accountability/interactive-tools/bep.html.
14 Tennessee Department of Education, 2019 Annual Statistical Report, Table 14, p. 96.
15 See OREA Education Glossary, “Revenue Sources,” https://comptroller.tn.gov/office-functions/research-and-education-accountability/collections/glossary.html.
16 See OREA BEP Portal, https://comptroller.tn.gov/office-functions/research-and-education-accountability/interactive-tools/bep.html.
17 Tennessee Code Annotated 49-3-314(c)(1-3).
18 Tennessee Department of Education, 2019 Annual Statistical Report, Table 19, p. 96.
19 See OREA Education Glossary, “Title I,” https://comptroller.tn.gov/office-functions/research-and-education-accountability/collections/glossary.html.
20 Director of Schools, Dickson County Schools, interview, Sept. 18, 2020.
21 Ibid.
22 Rebecca R. Skinner, Congressional Research Service, State and Local Financing of Public Schools, Aug. 26, 2019.
23 Budgets, Metro Nashville Public Schools, https://www.mnps.org/budgets (accessed Nov. 16, 2020).
24 Shelby County Schools, Back 2 Students, Frequently Asked Questions, http://www.scsk12.org/back2students/files/2018/Back2StudentsFAQs.pdf (accessed Nov. 16, 2020).
25 Tennessee Code Annotated 49-2-203(9)(A)(i).
14
26 Tara Bergfeld and Linda Wesson, Teacher Salaries in Tennessee, 2015-2018, Comptroller of the Treasury, Office of Research and Education Accountability, April 2019, p. 7, https://comptroller.tn.gov/office-functions/research-and-education-accountability/publications/k-12-education/content/teacher-salaries-in-tennessee--2015-to-2018.html (accessed Nov. 16, 2020).
27 Ibid.
28 Lucy Hadley, Elizabeth Ross, and Marguerite Roza, A Moment of (Early) Truth: Taking Stock of School-by-School Spending Data, Edunomics Lab, https://edunomicslab.org/wp-content/uploads/2020/07/School-Level-Data-Brief_R5.pdf (accessed Oct. 27, 2020).
29 Tennessee Department of Education, Office of Local Finance, select LEA spreadsheets.
30 Tara Bergfeld and Linda Wesson, Teacher Salaries in Tennessee, 2015-2018, Comptroller of the Treasury, Office of Research and Education Accountability, April 2019, p. 7, https://comptroller.tn.gov/office-functions/research-and-education-accountability/publications/k-12-education/content/teacher-salaries-in-tennessee--2015-to-2018.html (accessed Nov. 16, 2020).
31 Tennessee Department of Education, Executive Director, Office of Local Finance, interview, Aug. 12, 2020.
32 Jason Gonzales, “How the community rallied around one Nashville school to give its students – and teachers – a chance to thrive,” The Tennessean, Nov. 19, 2019, https://www.tennessean.com/story/news/education/dismissed/2019/11/20/how-community-rallied-around-nashville-school-let-thrive/2562054001/ (accessed Oct. 28, 2019). Jessica Bliss and Jason Gonzales, “Others step up for Nashville schools in needy communities without PTO support,” The Tennessean, Oct. 23, 2019, https://www.tennessean.com/story/news/education/dismissed/2019/10/24/nashville-public-schools-pto-inequity-step-up/3943237002/ (accessed Oct. 28, 2020). Jessica Bliss and Jason Gonzales, “In a district already facing deep divides, one Nashville school’s PTO raised $218,000, one $150,” The
Tennessean, Oct. 23, 2019, https://www.tennessean.com/story/news/education/dismissed/2019/10/24/nashville-schools-pto-fundraising-parent-teacher-support/2157624001/ (accessed Oct. 28, 2020).
33 34 CFR 200.35, 7-1-17 Edition, https://www.govinfo.gov/content/pkg/CFR-2017-title34-vol1/pdf/CFR-2017-title34-vol1-sec200-35.pdf (accessed Nov. 16, 2020).
34 Director of Schools, Dickson County Schools, interview, Sept. 18, 2020.
35 Tennessee Department of Education, 2019 Annual Statistical Report, p. 96.
36 Tennessee Department of Education, 2019 Annual Statistical Report, Table 14, pp. 79-81.
Office of Research and Education Accountability
Russell Moore | Director425 Rep. John Lewis Way N. Nashville, Tennessee 37243
615.401.7866 www.comptroller.tn.gov/OREA/


![How Much Americans Spend On Their Cars [Infographic]](https://static.fdocuments.in/doc/165x107/55bfd8e5bb61ebd9588b4576/how-much-americans-spend-on-their-cars-infographic.jpg)