How much does Australia spend and is it enough? -...
57
PREVENTIVE HEALTH: HOW MUCH DOES AUSTRALIA SPEND AND IS IT ENOUGH? 1 June 2017 Preventive health: How much does Australia spend and is it enough? Hannah Jackson and Alan Shiell Department of Public Health, La Trobe University and the Australian Prevention Partnership Centre
-
Upload
duongtuong -
Category
Documents
-
view
221 -
download
2
Transcript of How much does Australia spend and is it enough? -...

PREVENTIVE HEALTH: HOW MUCH DOES AUSTRALIA SPEND AND IS IT ENOUGH? 1
June 2017
Preventive health: How much does Australia spend and is it enough?
Hannah Jackson and Alan Shiell Department of Public Health, La Trobe University and the Australian Prevention Partnership Centre
2 PREVENTION 1ST
About Prevention 1st Prevention 1st is a campaign by the Foundation for Alcohol Research and Education (FARE), the Public Health Association of Australia (PHAA), Alzheimer’s Australia, and the Consumers Health Forum of Australia, calling on all Australian governments and political parties to commit to a strong preventive health agenda to tackle Australia’s greatest health challenge.
Contributing organisations
This report was commissioned by the Heart Foundation, Kidney Australia, Alzheimer’s Australia, the Australia Health Promotion Association and the Foundation for Alcohol Research and Education.
Citing this report
Jackson H, Shiell A. (2017) Preventive health: How much does Australia spend and is it enough? Canberra: Foundation for Alcohol Research and Education.
Acknowledgements Professor Brian Ferguson, Public Health England and Professor Eric Breton, École des Hautes Études en Santé Publique, for their contribution to our understanding of the English and French funding models. Dr Stephen Duckett, Grattan Institute, for providing advice in the development of this report.
PREVENTIVE HEALTH: HOW MUCH DOES AUSTRALIA SPEND AND IS IT ENOUGH? 3
Contents
Acronyms ................................................................................................................................................ 5
Summary ................................................................................................................................................. 6
Background ......................................................................................................................................... 6
Key findings ......................................................................................................................................... 6
What did we do? ................................................................................................................................. 7
What did we find? ............................................................................................................................... 7
How much does Australia spend on prevention? ........................................................................... 7
How much should we spend? ......................................................................................................... 7
Is prevention cost-effective? .......................................................................................................... 8
Models for funding prevention ....................................................................................................... 8
Conclusions ......................................................................................................................................... 9
1. Introduction ...................................................................................................................................... 10
2. Public health expenditure in Australia .............................................................................................. 11
2.1 Sources of public health expenditure data ........................................................................... 11
2.2 Trends in national public health expenditure ....................................................................... 11
2.3 Public health expenditure by each state and territory ......................................................... 14
2.4 International comparisons .................................................................................................... 17
2.5 Shortcomings in accounting methods that limit comparability ............................................ 19
3. How much should Australia spend on prevention? .......................................................................... 21
3.1 Is Australia spending too little on prevention? ..................................................................... 21
3.2 How should we decide how much to spend on prevention? ............................................... 21
3.3 Is there any evidence to suggest that prevention spending could be increased?................ 23
4. Outcome monitoring ......................................................................................................................... 24
4.1 The need to monitor outcomes of Australia’s spending on prevention ............................... 24
4.2 OECD indicators of quality health promotion and preventive care ...................................... 24
4.3 The Australian Health Policy Collaboration’s Health Tracker ............................................... 25
4.4 Public Health England’s Public Health Outcomes Framework .............................................. 28
4.5 Discussion of outcome monitoring frameworks ................................................................... 30
5. Models for funding prevention ......................................................................................................... 30
5.1 What are funding models?.................................................................................................... 30
5.2 Flow of funds to prevention in Australia and comparator countries ................................... 31
5.3 The perverse incentive effects of institutional structure ..................................................... 36
6. Conclusions ....................................................................................................................................... 37

4 PREVENTION 1ST
Appendix A ............................................................................................................................................ 38
Appendix B ............................................................................................................................................ 41
AIHW definition of public health activities ....................................................................................... 41
References ............................................................................................................................................ 53
PREVENTIVE HEALTH: HOW MUCH DOES AUSTRALIA SPEND AND IS IT ENOUGH? 5
Acronyms ACE – Assessing cost-effectiveness
AIHW – Australian Institute of Health and Welfare
ANPHA – Australian National Preventive Health Agency
GDP – Gross domestic product
HPV – Human papilloma virus
ICHA – International Classification for Health Accounts
MSAC – Medical Services Advisory Committee
NPAPH – National Partnership Agreement on Preventive Health
NGO – Non-government organisation
NICE – National Institute of Health and Care Excellence
NHA – National Health Accounts
NHS – National Health Service
OECD – Organisation for Economic Co-operation and Development
PBAC – Pharmaceutical Benefits Advisory Committee
PBMA – Program budgeting and marginal analysis
PHOFA – Public health outcomes funding agreements
PPP – Purchasing power parity
SHA – System of Health Accounts
WHO – World Health Organization
6 PREVENTION 1ST
Summary
Background Chronic disease is responsible for 83 per cent of all premature deaths in Australia and 66 per cent of the burden of disease, making it our nation’s greatest health challenge.
Conditions such as heart disease, stroke, heart failure, chronic kidney disease, lung disease and type 2 diabetes, are common in Australia. These conditions are largely considered preventable and are placing great pressure on Australia’s healthcare systems as they struggle to deal with the increasing flow of patients.
It has been suggested that spending on chronic disease prevention (referred to in this report as ‘prevention’) is lower in Australia than in equivalent Organisation for Economic Co-operation and Development (OECD) countries, despite the persistently high burden of preventable disease in this country. It is therefore pertinent to ask whether this is the case, and further, whether enough is being spent on prevention and whether there is a better way to fund prevention in Australia.
In this report, we summarise the available evidence for national levels of expenditure on preventive health over the past 15 years, and compare spending in Australia with that of selected OECD countries. We interrogate the question of whether Australia spends enough on preventive health and describe a framework for evaluating this question more systematically. We also briefly describe funding models for Australia and for select OECD countries and raise questions about how these models might affect the efficiency with which resources allocated to prevention are used.
Key findings • Australia spends about $2 billion on prevention each year, or $89 per person. This is 1.34 per cent
of all health spending, which is considerably less than countries such as Canada, the United Kingdom and New Zealand.
• Australia could and probably should spend more on preventive health. This view does not come from comparing spending levels among jurisdictions in Australia, or between Australia and equivalent OECD countries. Rather it comes from assessing the cost-effectiveness of different means of promoting health and treating disease.
• Many preventive health interventions are cost-effective. Some promote health and reduce costs overall because of the reduced need to treat expensive diseases. Others allow Australians to live longer and better quality lives, and come at a reasonable cost to the health system.
• The funding model in Australia, which describes the agencies involved in prevention and how the money flows between them in return for the provision of services, is complex. The question of how this impacts on the efficiency and equity of the overall effort to prevent illness and promote health has not been explored fully and warrants further consideration.
• Alone among the countries we examined, England has established institutional structures to evaluate the cost-effectiveness of preventive health interventions and monitor their outcomes. Australia should explore lessons from this experience, and the costs and consequences of developing ‘made in Australia’ equivalents.
PREVENTIVE HEALTH: HOW MUCH DOES AUSTRALIA SPEND AND IS IT ENOUGH? 7
What did we do? The report addresses four questions:
1. What trends have been observed in preventive health spending in Australia, and how do the jurisdictions compare?
2. How does Australia’s spending on preventive health compare with selected OECD countries?
3. What funding models do comparator countries use, and how do these compare with Australia?
4. What target would be appropriate for preventive health expenditure in Australia, and which indicators should be used to monitor the resulting improvements in population health?
Our aim was to answer these questions relying only on publicly available data and a small number of key informant interviews.
What did we find?
How much does Australia spend on prevention?
Australia reportedly spends more than $2 billion on prevention each year, or around $89 per person.1 This is equivalent to 1.34 per cent of all health spending and 0.13 per cent of gross domestic product (GDP). While we spend close to the average of all OECD countries on health care in total (9.3 per cent of GDP compared with the OECD average of 9.0 per cent in 20152), we reportedly spend substantially less on prevention than Canada, the USA, the UK and New Zealand.3
However, the National Health Accounts typically understate total spending on prevention.4-7 Spending by agencies other than health departments is excluded from the national health accounts, and not all prevention spending by health agencies is counted under the ‘public health’ tab. Actual spending on prevention may be anywhere between three and 12 times as much as is reported in national accounts.
Furthermore, despite efforts to standardise accounting definitions, there remain differences among jurisdictions within Australia, and between Australia and other OECD countries, in the way prevention is funded, organised and delivered, and this means that like is not always being compared with like in reports of health expenditure.
How much should we spend?
We should resist the temptation to conclude that Australia should spend more on prevention because we spend so little compared with equivalent countries. Even if they were directly comparable, estimates of total spending on prevention reveal nothing about whether resources are used efficiently or whether any increase in spending would be worth the opportunity cost.
Instead, the key to determining whether or not Australia should spend more on prevention is to compare the added value of an increase in spending to the opportunity cost of that increase. That is, we could compare the benefits of increasing prevention spending annually by $100 million, for example, with the benefits lost because that $100 million can no longer be spent on something else, such as reducing hospital waiting lists, or improving the quality of early child development programs. If the value of the benefits derived from prevention exceeds the value of the opportunity cost, then there is a case for increasing spending. We should also look at what prevention activities might be curtailed if spending were to be reduced by $100 million and to compare the impact of this with the
8 PREVENTION 1ST
benefits that would be gained by allocating that $100 million to something else. This process is what economists refer to as marginal analysis.
What constitutes value is contested. It should at the very least include considerations of both efficiency (cost-effectiveness) and equity. There will always be a need to exercise judgment in weighing up benefits and costs, and in considering how both are distributed among the population. Although there is no objective way of doing this, techniques such as program-budgeting and marginal analysis (see Appendix A) provide a systematic and transparent framework for making these judgments.
Is prevention cost-effective?
There is clear evidence that many preventive health interventions are cost-effective. For example, the 2010 Assessing Cost-Effectiveness (ACE) in Prevention study8 evaluated more than 120 such interventions in the Australian context. Several of these interventions, typically involving policy actions to reduce consumption of hazardous goods, are seen as cost-saving. This is because the cost of the intervention is offset by savings resulting from a reduced need to treat disease. This suggests that population health could be improved and health spending reduced if there was the political will to act on the policy recommendations. The ACE study also found that several other interventions help people to live in good health for longer – and at a reasonable cost to the health system.
Thus, the health of Australians would benefit both by reorganising the current suite of preventive health activities and by increasing spending in those activities assessed as cost-effective.
Research-based evidence such as the ACE study suggests that prevention is cost-effective but this is not the same as showing that it is good value for money ‘in practice’. Thus, there remains the need to monitor the performance of Australia’s spending on prevention to ensure that the expected impacts are realised. Frameworks have been developed to monitor outcomes, and Australia’s Health Tracker, developed by the Australian Health Policy Collaboration, provides a useful basis for a prevention framework.9 With further development, Health Tracker could embrace all of prevention and not just chronic disease. Another example is England’s Public Health Outcomes Framework,10 which provides comparative data on more than 60 indicators of the public’s health at both the public health regional and local government levels. Unlike Health Tracker, it also includes indicators that relate to exposure to the social determinants of health.
Models for funding prevention
The funding models presented in Section 5 of the full report show the agencies involved in funding and delivering prevention and public health interventions, and the funding mechanisms that are used to transfer resources between them. Each flow of funds diagram is complex, with multiple funding mechanisms connecting multiple agencies and organisations. This builds in useful redundancy, meaning that if one funding channel dries up, services can often be sustained with support from other channels, but it also increases the risk of unnecessary and inefficient duplication.
England stands out as the only country examined that has a formal agency, the National Institute of Health and Care Excellence (NICE) to scrutinise the cost-effectiveness of public health interventions. The idea for such an agency in Australia to advise on prevention spending warrants further examination.
Another question worthy of further study is whether or not the institutional structures established to direct the flow of funds to prevention enhances or undermines efforts to provide services efficiently.
PREVENTIVE HEALTH: HOW MUCH DOES AUSTRALIA SPEND AND IS IT ENOUGH? 9
The siloing effect of such structures may distort the allocation of resources, upsetting the balance among funded activities and hampering efforts to maximise their combined impact on health and wellbeing.
With every preventive health activity, the funding mechanism, outcomes and performance criteria, need to be aligned. If they are not, there is a risk that more energy will be spent on devising ways to game the reporting system than the efficient delivery of quality services.
Conclusions The evidence considered here suggests that a strong case can be made for increasing spending on preventive health. This conclusion does not come from comparing levels of spending among jurisdictions within Australia, or between Australia and selected OECD countries. Instead, it comes from studies that have examined the cost-effectiveness of preventive health interventions. This evidence shows that the health of Australians could be improved both by reconfiguring existing preventive health activities, and by increasing spending on those activities shown to be the most cost-effective.
We also suspect, but as yet have no evidence to support the idea, that the choice of funding mechanism (how money is allocated to whom for prevention) is an important determinant of the overall efficiency of prevention expenditure. This question warrants further consideration.
Finally, England stands alone among the countries we examined in having institutional structures in place both for assessing the cost-effectiveness of preventive health interventions (through NICE), and for monitoring the effectiveness of spending on prevention through Public Health England’s Public Health Outcomes framework. The latter is especially notable for including an extensive array of indicators on the impact of preventive health spending on exposure to the broader social determinants of health.
10 PREVENTION 1ST
1. Introduction This report describes and compares spending on preventive health in Australia. The Commonwealth Government’s decision to end the National Partnership Agreement on Preventive Health and the suggestion that spending on preventive health in Australia is substantially lower than in comparable countries makes it pertinent to ask whether enough is being spent on prevention and whether there is a better way of funding prevention in Australia.
The report addresses four questions:
1. What trends have been observed in preventive health spending in Australia, and how do the jurisdictions compare?
2. How does Australia’s spending on preventive health compare with selected OECD countries?
3. What funding models do comparator countries use, and how do these compare with Australia?
4. What target would be appropriate for preventive health expenditure in Australia, and which indicators should be used to monitor the resulting improvements in population health?
Our aim was to provide answers to these questions relying only on publicly available data and a small number of key informant interviews. We summarise the available evidence for national levels of expenditure on preventive health over the last fifteen years, and compare spending in Australia with that of selected OECD countries. We interrogate the question of whether Australia spends enough on prevention and describe a framework for evaluating this question. We also describe briefly funding models for Australia and for some OECD countries and raise questions about how the structures depicted in these models might affect the efficiency with which resources allocated to prevention are used.
One immediate challenge is the different definitions of preventive health and where prevention fits within public health more generally.11 Some definitions of prevention consider only primary prevention strategies (for example the National Public Health Partnership), others encompass primary and secondary prevention (such as the Australian National Preventive Health Agency) and still others encompass all three levels of prevention ( for example the World Health Organization). The place of health promotion also needs to be considered in relation to this definitional issue.
Both the Australian Institute of Health and Welfare (AIHW) and the OECD have worked hard to standardise what is treated as prevention and public health when accounting for expenditure, and while they have yet to iron out all issues we follow their definitions here (see glossary in Appendix A).
The AIHW regards preventive health as part of public health. This latter term is defined as,
activities that focus on prevention, promotion and protection rather than on treatment, on populations rather than on individuals, and on the factors and behaviours that cause illness and injury rather than the injury itself.12
A detailed list of the activities defined as public health in the Australian National Health Accounts is provided in Appendix B.
The OECD has also tried to standardise the way countries account for health expenditure through its System of Health Accounts.13,14 It too groups prevention and public health together, defining prevention and public health services as those that are “designed to enhance the health status of the
PREVENTIVE HEALTH: HOW MUCH DOES AUSTRALIA SPEND AND IS IT ENOUGH? 11
population as distinct from the curative services which repair health dysfunction.”15 This includes epidemiological surveillance, health promotion, disease prevention, and other general public health activities (which includes blood-bank operation and occupational health care).13
Despite similar definitions there are differences between the Australian National Health Accounts and the OECD’s System of Health Accounts in how public health is operationalised. The net effect on the estimates of spending on prevention in Australia that we present here turns out to be very small, but this is probably a quirk of the way accounting data is collected and processed by AIHW and is not an indication that the the two accounting systems share many similarities. Indeed, the evidence that we have from the UK suggests that reported spending on preventive health in Australia could be substantially higher if we were to adopt the OECD approach properly. We discuss this further in section 2.5.
2. Public health expenditure in Australia
2.1 Sources of public health expenditure data The data used to report spending in public health within Australia comes from the AIHW. Only government expenditure on public health within Australia is reported here, as data on private spending is not available consistently for all years and is of questionable quality. Spending on preventive health is a sub-set of public health expenditure and we have been unable to separate the components.
For international comparisons we have relied on data compiled by the OECD. In Australia’s case this is provided to the OECD by the AIHW. The AIHW takes data from the jurisdictions and classifies it according to both the Australian National Health Accounts and the OECD’s System of Health Accounts.
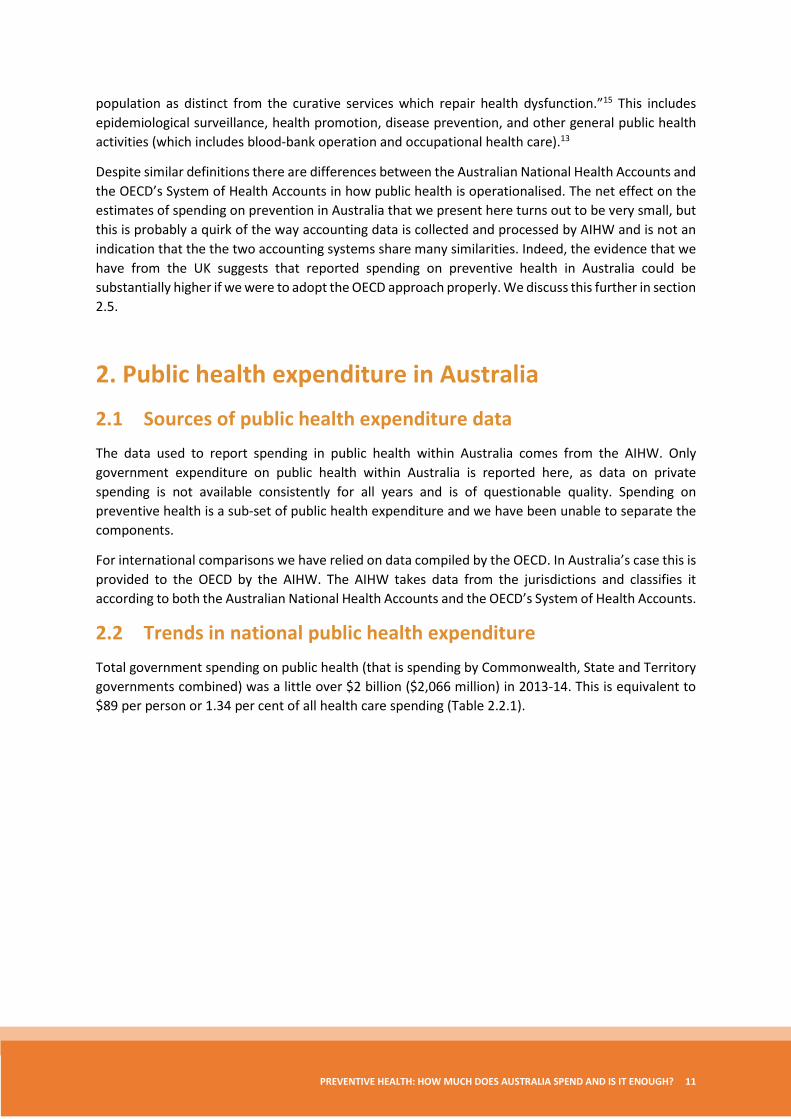
2.2 Trends in national public health expenditure Total government spending on public health (that is spending by Commonwealth, State and Territory governments combined) was a little over $2 billion ($2,066 million) in 2013-14. This is equivalent to $89 per person or 1.34 per cent of all health care spending (Table 2.2.1).
12 PREVENTION 1ST
Table 2.2.1: Total government expenditure on public health. Data source: AIHW1
YEAR
CURRENT PRICES ($AUD million)
CONSTANT PRICES [base year=2013-14] ($AUD million)
AMOUNT PER CAPITA in constant prices ($AUD)
PERCENTAGE OF GDP (%)
PUBLIC HEALTH EXP AS A PERCENTAGE OF TOTAL HEALTH EXP (%)
1999-00 915 1,391 74 0.14 1.74 2000-01 1,014 1,497 78 0.14 1.74 2001-02 1,091 1,568 81 0.14 1.73 2002-03 1,201 1,680 86 0.15 1.75 2003-04 1,200 1,616 82 0.14 1.63 2004-05 1,386 1,820 91 0.15 1.71 2005-06 1,420 1,787 88 0.14 1.64 2006-07 1,681 2,036 99 0.15 1.77 2007-08 2,122 2,494 119 0.18 2.05 2008-09 2,110 2,405 112 0.17 1.84 2009-10 1,872 2,058 94 0.14 1.54 2010-11 1,901 2,062 93 0.14 1.44 2011-12 2,179 2,307 102 0.15 1.53 2012-13 2,034 2,091 91 0.13 1.38 2013-14 2,066 2,066 89 0.13 1.34
Figure 2.2.1: Total government expenditure (Commonwealth plus State and Territory Governments) and per capita government expenditure on public health in constant prices [base year = 2013-14] – Data source AIHW1
0
20
40
60
80
100
120
140
0
500
1,000
1,500
2,000
2,500
3,000
1999
-00
2000
-01
2001
-02
2002
-03
2003
-04
2004
-05
2005
-06
2006
-07
2007
-08
2008
-09
2009
-10
2010
-11
2011
-12
2012
-13
2013
-14
Per c
apita
($AU
D)
Tota
l ($A
UD
mill
ions
)
Total expenditure
Per capita expenditure
PREVENTIVE HEALTH: HOW MUCH DOES AUSTRALIA SPEND AND IS IT ENOUGH? 13
Annual spending has fluctuated year on year, but over the whole period from 1999-00 to 2013-14 spending has increased in real terms (after adjusting for inflation) both in total and per person (Table 2.2.1 and Figure 2.2.1). However, annual spending on prevention is lower now than it was at its peak in 2007. This was when the national program to immunise girls and young women against human papillomavirus (HPV) was rolled out. The Australian Government spent $235 million on the implementation of the HPV vaccination program that year, which contributed 53% to the total annual increase in public health expenditure.16
A small part of this reduction is due to a change in accounting convention in 2008-09, which removed the departmental costs for three Commonwealth regulators (Therapeutic Goods Administration, Office of Gene Technology Regulator, National Industrial Chemicals Notification and Assessment Scheme) from public health services expenditure.17
In 2011-12 there was another, smaller spike in total and per capita expenditure, which probably reflects the impact of the National Partnership Agreement on Preventive Health (NPAPH), which began in 2009-10.18 This was intended to be a nine year agreement to provide substantial funding ($872 million) for activities and programs aimed at reducing the burden of chronic disease.19,20 The agreement was dissolved in 2014 when the Commonwealth Government pulled out of the national agreement, resulting in the removal of $370 million of funds that had been committed for preventive health.21,22 Implementation of the National Preventive Health Research Fund also began in 2011, which was a commitment of $13.1 million from the government to facilitate research required to allow effective translation of evidence into policy and preventive program efforts to address the concerns associated with tobacco, obesity and harmful alcohol consumption.23 In 2013-14, per capita expenditure on public health had returned to the level last observed ten years previously (Figure 2.2.1).
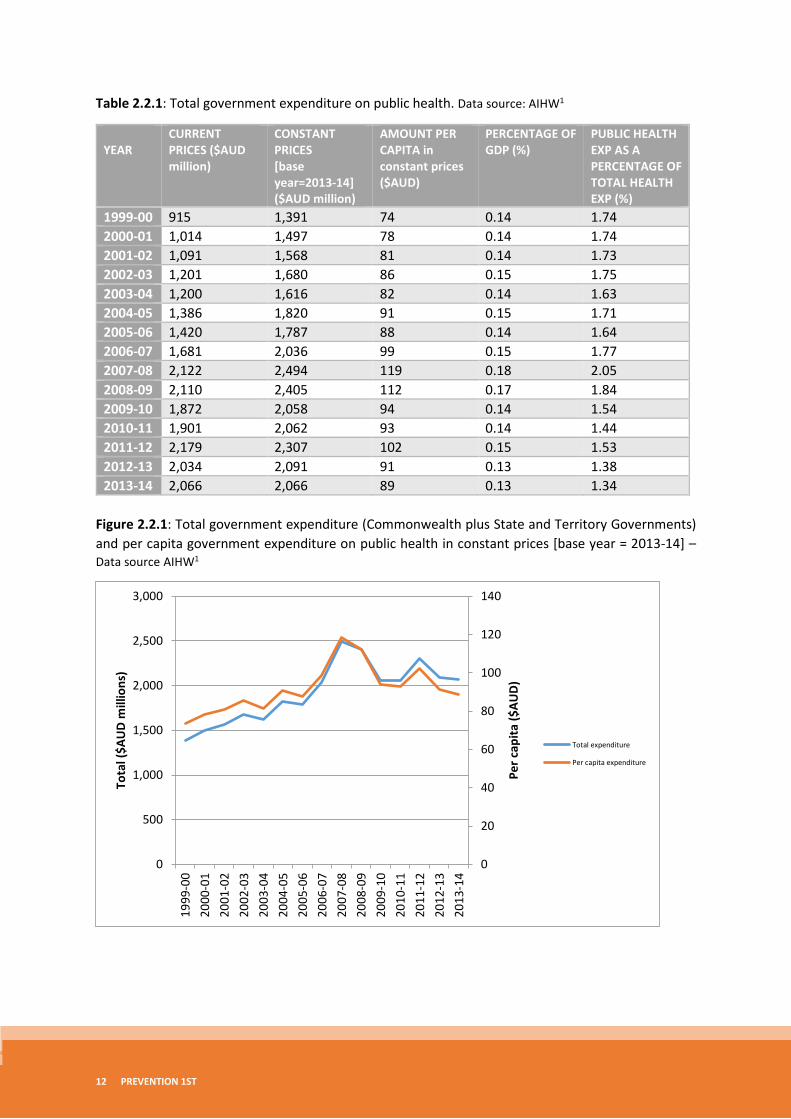
Figure 2.2.2: Total government spending on public health in Australia as a percentage of GDP – Data source AIHW1
0.00
0.02
0.04
0.06
0.08
0.10
0.12
0.14
0.16
0.18
0.20
%G
DP
Public health expenditure as a percentage of GDP
14 PREVENTION 1ST
With the exception of the spike in spending in 2007-08 because of the HPV Vaccination Program, public health expenditure as a percentage of GDP has remained relatively constant over the last 15 years at between 0.13 and 0.15 per cent of GDP. There is some indication, however, of a recent decline in expenditure.
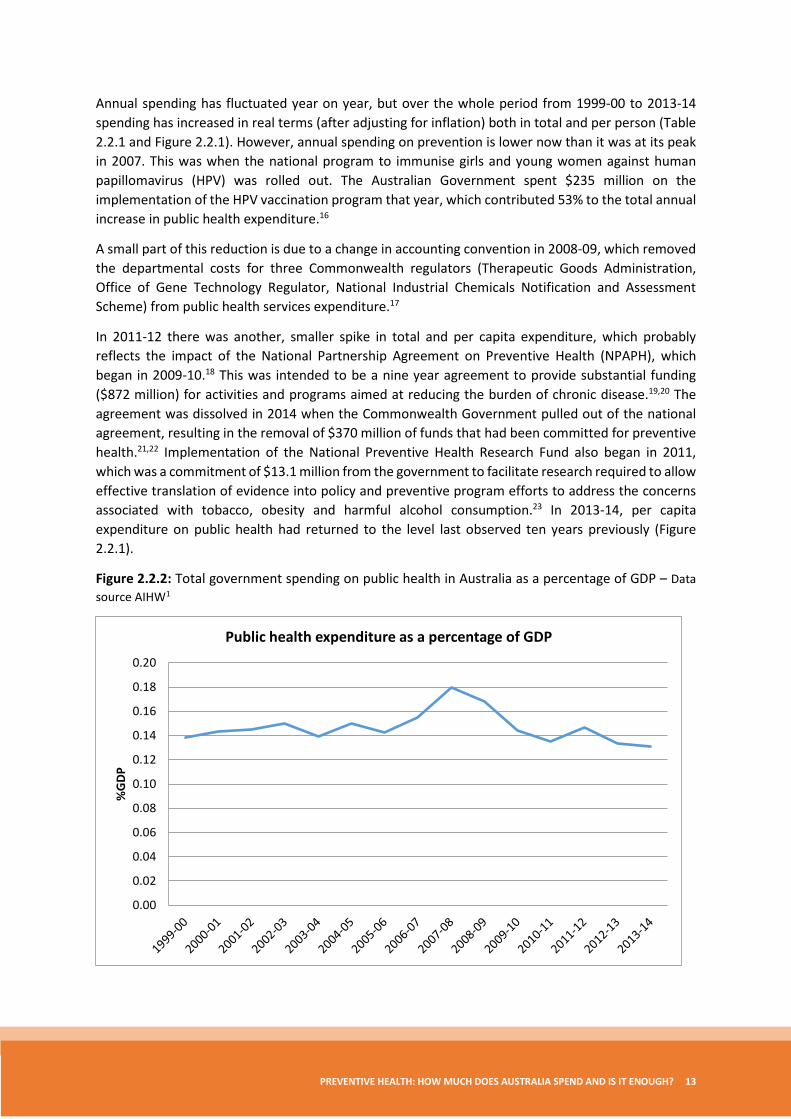
Figure 2.2.3: Government public health expenditure as a share of total health expenditurei (government and non-government) over time. Data source: AIHW1
Evidence of a relative decline in spending on public health is even more pronounced when seen as a percentage of total health expenditure. This remained relatively constant in the six years from 1999 to 2005 at about 1.7 per cent of all health spending, peaking in 2007-08 with the investment in HPV vaccination, and declining steadily since then, dropping below 1.5 per cent of health spending in 2011-12. This is against a backdrop of increasing real expenditure on health that exceeded the rate of increase in public health expenditure.
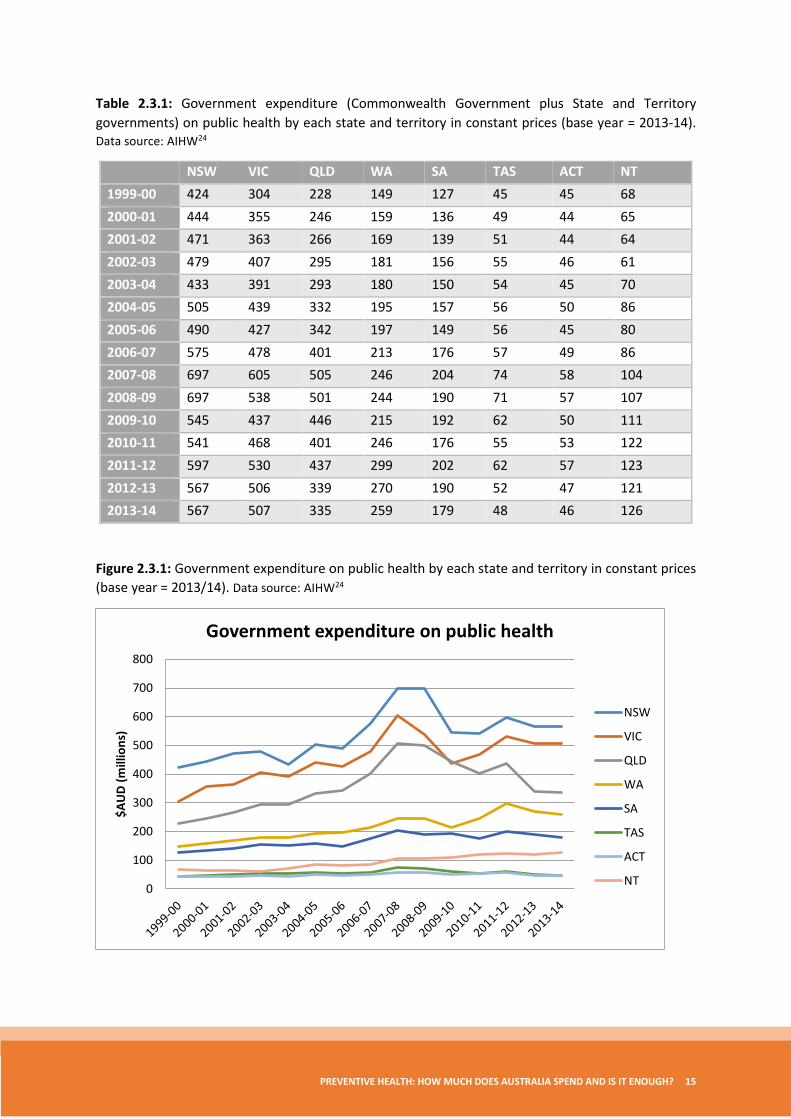
2.3 Public health expenditure by each state and territory Expenditure at state and territory levelsii mostly follows the trend previously presented in the national expenditure graphs. However, that the spike in government public health expenditure – seen in 2007-08 due to the implementation of the HPV vaccination program – is more pronounced for NSW, Victoria and Queensland; the three most populous states (Figure 2.3.1).
i Here, health expenditure includes recurrent expenditure (hospitals, primary health care and other) and capital expenditure from both government and non-government sources. ii The AIHW emphasises that national estimates for health expenditure should not be derived through the sum of the state and territory health expenditure estimates due to rounding issues.
0.00
0.50
1.00
1.50
2.00
2.50
Perc
enta
ge %
Government expenditure on public health as a percentage of total health expenditure
PREVENTIVE HEALTH: HOW MUCH DOES AUSTRALIA SPEND AND IS IT ENOUGH? 15
Table 2.3.1: Government expenditure (Commonwealth Government plus State and Territory governments) on public health by each state and territory in constant prices (base year = 2013-14). Data source: AIHW24
NSW VIC QLD WA SA TAS ACT NT 1999-00 424 304 228 149 127 45 45 68 2000-01 444 355 246 159 136 49 44 65 2001-02 471 363 266 169 139 51 44 64 2002-03 479 407 295 181 156 55 46 61 2003-04 433 391 293 180 150 54 45 70 2004-05 505 439 332 195 157 56 50 86 2005-06 490 427 342 197 149 56 45 80 2006-07 575 478 401 213 176 57 49 86 2007-08 697 605 505 246 204 74 58 104 2008-09 697 538 501 244 190 71 57 107 2009-10 545 437 446 215 192 62 50 111 2010-11 541 468 401 246 176 55 53 122 2011-12 597 530 437 299 202 62 57 123 2012-13 567 506 339 270 190 52 47 121 2013-14 567 507 335 259 179 48 46 126
Figure 2.3.1: Government expenditure on public health by each state and territory in constant prices (base year = 2013/14). Data source: AIHW24
0
100
200
300
400
500
600
700
800
$AU
D (m
illio
ns)
Government expenditure on public health
NSW
VIC
QLD
WA
SA
TAS
ACT
NT
16 PREVENTION 1ST
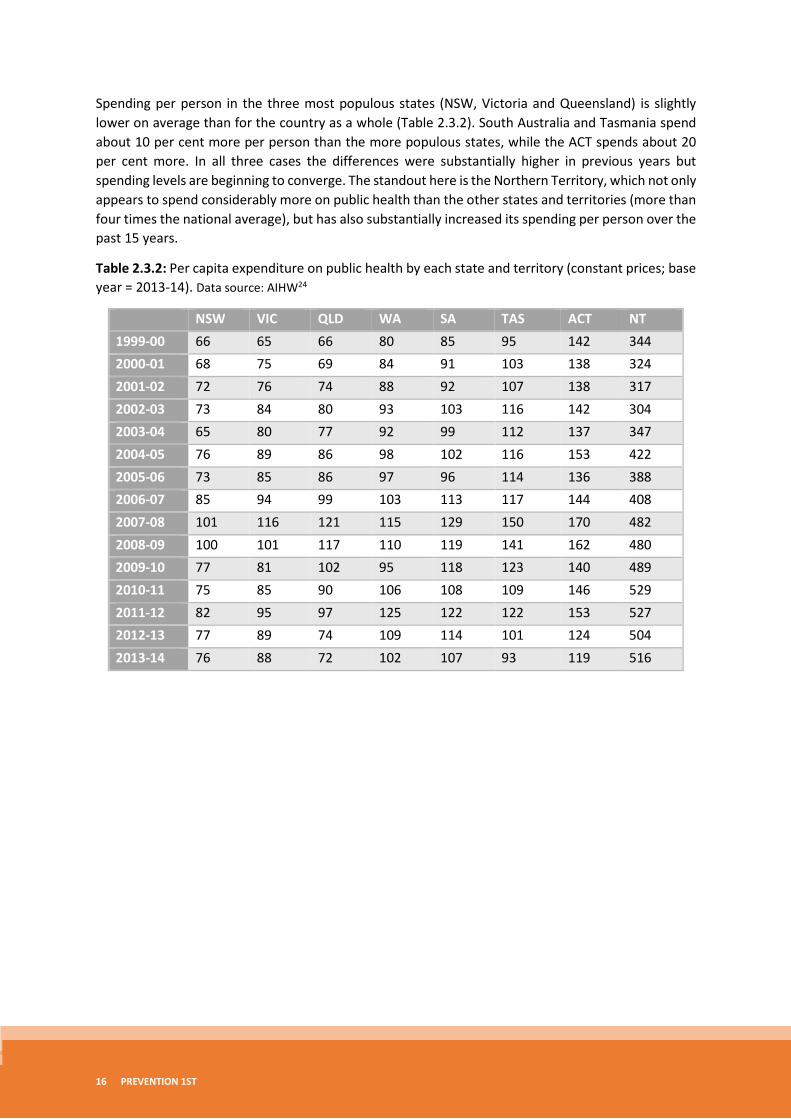
Spending per person in the three most populous states (NSW, Victoria and Queensland) is slightly lower on average than for the country as a whole (Table 2.3.2). South Australia and Tasmania spend about 10 per cent more per person than the more populous states, while the ACT spends about 20 per cent more. In all three cases the differences were substantially higher in previous years but spending levels are beginning to converge. The standout here is the Northern Territory, which not only appears to spend considerably more on public health than the other states and territories (more than four times the national average), but has also substantially increased its spending per person over the past 15 years.
Table 2.3.2: Per capita expenditure on public health by each state and territory (constant prices; base year = 2013-14). Data source: AIHW24
NSW VIC QLD WA SA TAS ACT NT 1999-00 66 65 66 80 85 95 142 344 2000-01 68 75 69 84 91 103 138 324 2001-02 72 76 74 88 92 107 138 317 2002-03 73 84 80 93 103 116 142 304 2003-04 65 80 77 92 99 112 137 347 2004-05 76 89 86 98 102 116 153 422 2005-06 73 85 86 97 96 114 136 388 2006-07 85 94 99 103 113 117 144 408 2007-08 101 116 121 115 129 150 170 482 2008-09 100 101 117 110 119 141 162 480 2009-10 77 81 102 95 118 123 140 489 2010-11 75 85 90 106 108 109 146 529 2011-12 82 95 97 125 122 122 153 527 2012-13 77 89 74 109 114 101 124 504 2013-14 76 88 72 102 107 93 119 516
PREVENTIVE HEALTH: HOW MUCH DOES AUSTRALIA SPEND AND IS IT ENOUGH? 17
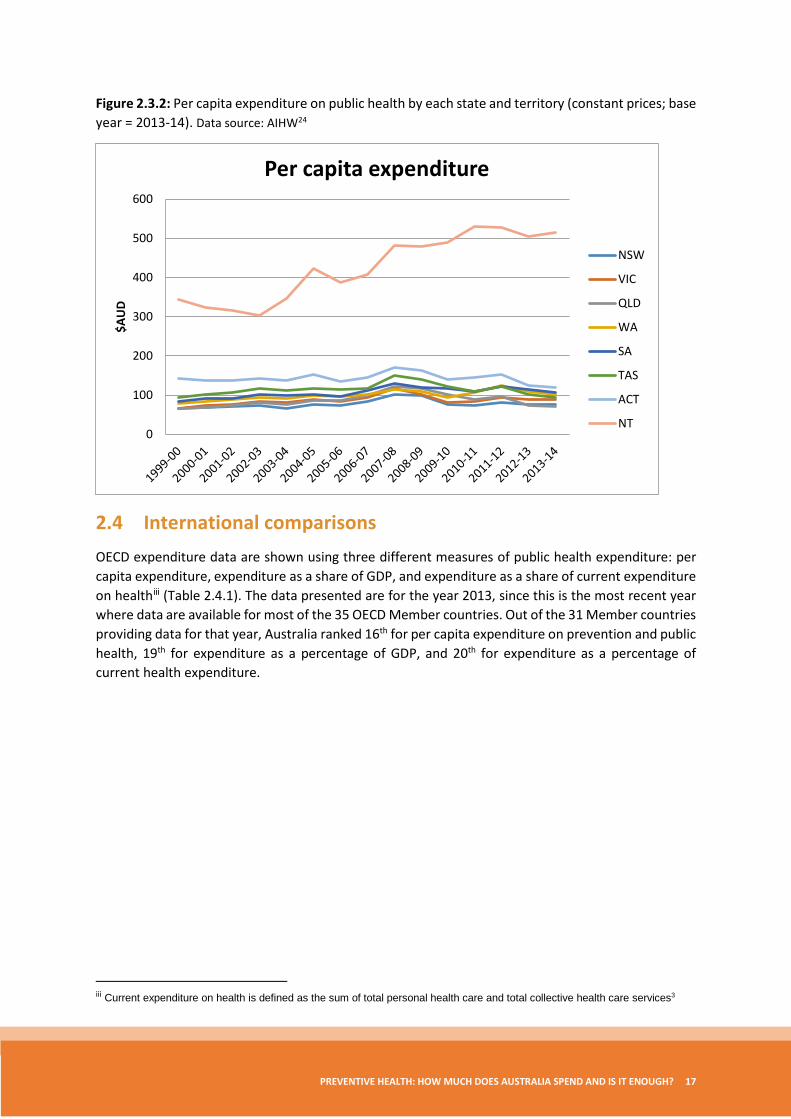
Figure 2.3.2: Per capita expenditure on public health by each state and territory (constant prices; base year = 2013-14). Data source: AIHW24
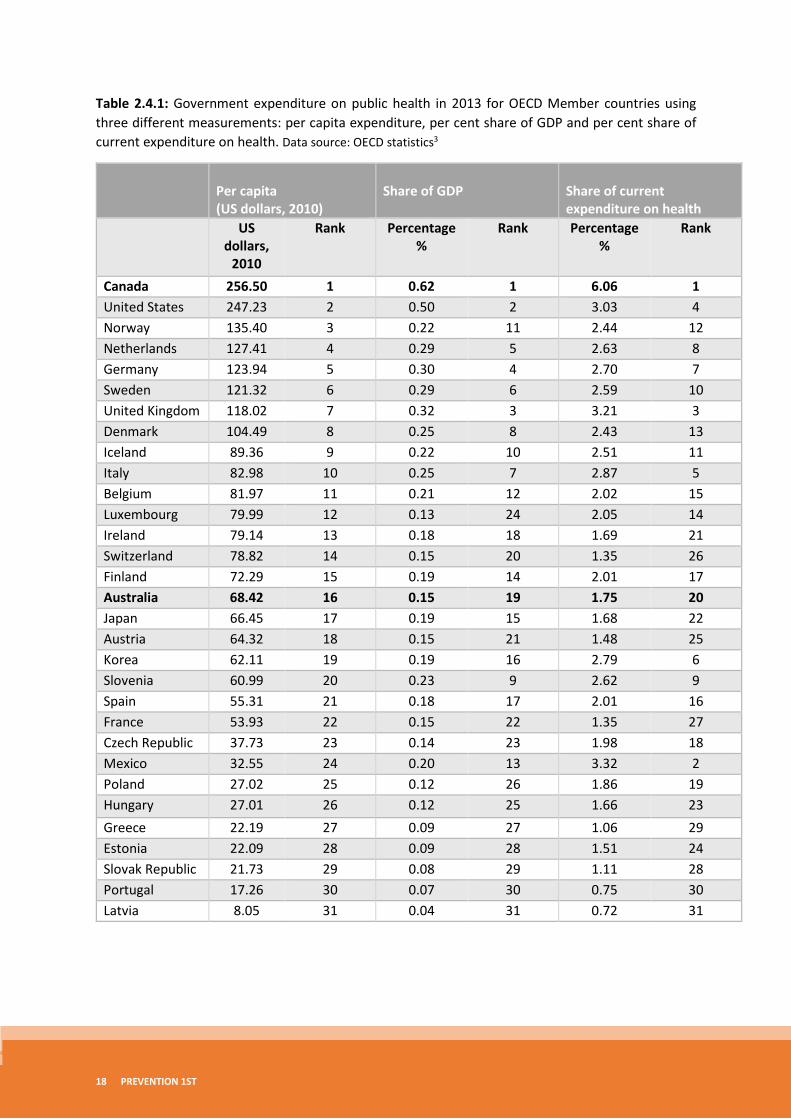
2.4 International comparisons OECD expenditure data are shown using three different measures of public health expenditure: per capita expenditure, expenditure as a share of GDP, and expenditure as a share of current expenditure on healthiii (Table 2.4.1). The data presented are for the year 2013, since this is the most recent year where data are available for most of the 35 OECD Member countries. Out of the 31 Member countries providing data for that year, Australia ranked 16th for per capita expenditure on prevention and public health, 19th for expenditure as a percentage of GDP, and 20th for expenditure as a percentage of current health expenditure.
iii Current expenditure on health is defined as the sum of total personal health care and total collective health care services3
0
100
200
300
400
500
600
$AU
D
Per capita expenditure
NSW
VIC
QLD
WA
SA
TAS
ACT
NT
18 PREVENTION 1ST
Table 2.4.1: Government expenditure on public health in 2013 for OECD Member countries using three different measurements: per capita expenditure, per cent share of GDP and per cent share of current expenditure on health. Data source: OECD statistics3
Per capita (US dollars, 2010)
Share of GDP
Share of current expenditure on health
US dollars,
2010
Rank Percentage %
Rank Percentage %
Rank
Canada 256.50 1 0.62 1 6.06 1 United States 247.23 2 0.50 2 3.03 4 Norway 135.40 3 0.22 11 2.44 12 Netherlands 127.41 4 0.29 5 2.63 8 Germany 123.94 5 0.30 4 2.70 7 Sweden 121.32 6 0.29 6 2.59 10 United Kingdom 118.02 7 0.32 3 3.21 3 Denmark 104.49 8 0.25 8 2.43 13 Iceland 89.36 9 0.22 10 2.51 11 Italy 82.98 10 0.25 7 2.87 5 Belgium 81.97 11 0.21 12 2.02 15 Luxembourg 79.99 12 0.13 24 2.05 14 Ireland 79.14 13 0.18 18 1.69 21 Switzerland 78.82 14 0.15 20 1.35 26 Finland 72.29 15 0.19 14 2.01 17 Australia 68.42 16 0.15 19 1.75 20 Japan 66.45 17 0.19 15 1.68 22 Austria 64.32 18 0.15 21 1.48 25 Korea 62.11 19 0.19 16 2.79 6 Slovenia 60.99 20 0.23 9 2.62 9 Spain 55.31 21 0.18 17 2.01 16 France 53.93 22 0.15 22 1.35 27 Czech Republic 37.73 23 0.14 23 1.98 18 Mexico 32.55 24 0.20 13 3.32 2 Poland 27.02 25 0.12 26 1.86 19 Hungary 27.01 26 0.12 25 1.66 23 Greece 22.19 27 0.09 27 1.06 29 Estonia 22.09 28 0.09 28 1.51 24 Slovak Republic 21.73 29 0.08 29 1.11 28 Portugal 17.26 30 0.07 30 0.75 30 Latvia 8.05 31 0.04 31 0.72 31
PREVENTIVE HEALTH: HOW MUCH DOES AUSTRALIA SPEND AND IS IT ENOUGH? 19
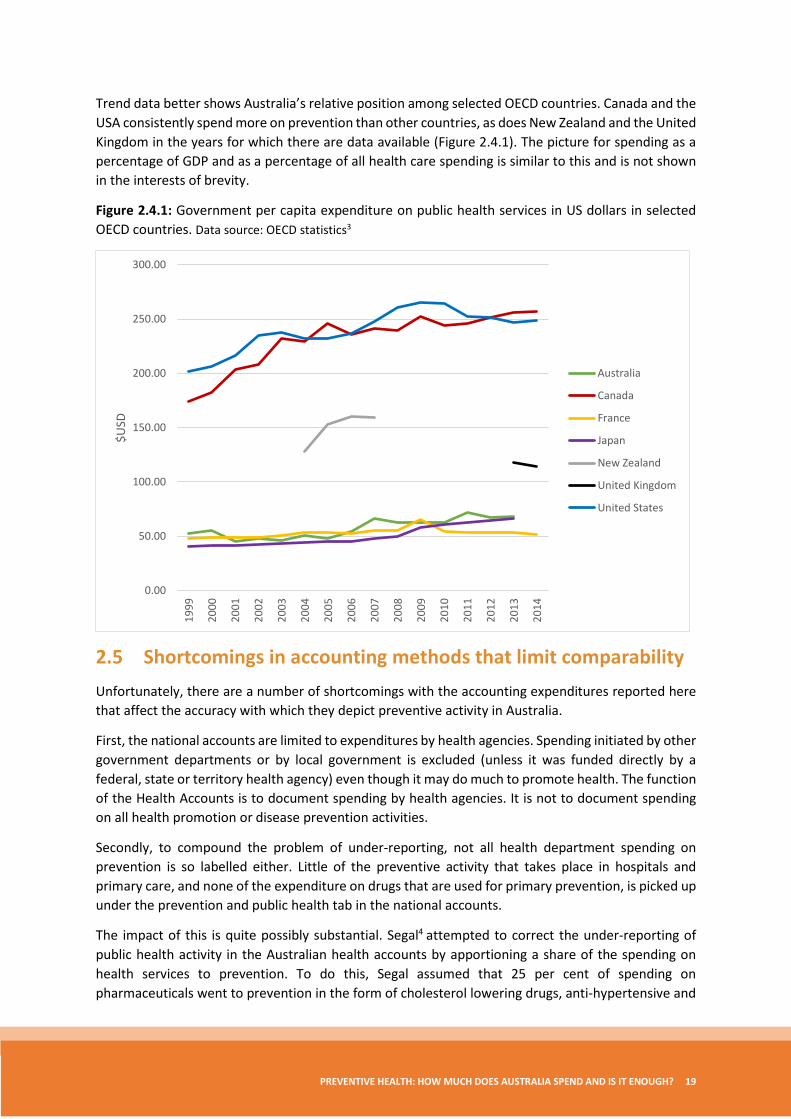
Trend data better shows Australia’s relative position among selected OECD countries. Canada and the USA consistently spend more on prevention than other countries, as does New Zealand and the United Kingdom in the years for which there are data available (Figure 2.4.1). The picture for spending as a percentage of GDP and as a percentage of all health care spending is similar to this and is not shown in the interests of brevity.
Figure 2.4.1: Government per capita expenditure on public health services in US dollars in selected OECD countries. Data source: OECD statistics3
2.5 Shortcomings in accounting methods that limit comparability Unfortunately, there are a number of shortcomings with the accounting expenditures reported here that affect the accuracy with which they depict preventive activity in Australia.
First, the national accounts are limited to expenditures by health agencies. Spending initiated by other government departments or by local government is excluded (unless it was funded directly by a federal, state or territory health agency) even though it may do much to promote health. The function of the Health Accounts is to document spending by health agencies. It is not to document spending on all health promotion or disease prevention activities.
Secondly, to compound the problem of under-reporting, not all health department spending on prevention is so labelled either. Little of the preventive activity that takes place in hospitals and primary care, and none of the expenditure on drugs that are used for primary prevention, is picked up under the prevention and public health tab in the national accounts.
The impact of this is quite possibly substantial. Segal4 attempted to correct the under-reporting of public health activity in the Australian health accounts by apportioning a share of the spending on health services to prevention. To do this, Segal assumed that 25 per cent of spending on pharmaceuticals went to prevention in the form of cholesterol lowering drugs, anti-hypertensive and
0.00
50.00
100.00
150.00
200.00
250.00
300.00
1999
2000
2001
2002
2003
2004
2005
2006
2007
2008
2009
2010
2011
2012
2013
2014
$USD
Australia
Canada
France
Japan
New Zealand
United Kingdom
United States
20 PREVENTION 1ST
anti-diabetic medication. Similarly, Segal assumed that 40 per cent of medical services, 10 per cent of hospital expenditure and 70 per cent of dental care truly classified as preventive. If these assumptions were correct, then spending on prevention would be closer to 20 per cent of government health expenditure, not less than 2 per cent as implied in the AIHW accounts. The work is crude, however even if Segal was out by a factor of two, actual spending on prevention would still be five times higher than that reflected in the accounts, and on par with what is seen in Canada and the USA.
However, Segal’s work does not explain away the difference between what Australia spends on public health and the levels of spending seen in comparable OECD countries, since under-recording of preventive activity in national systems of accounts has also been found elsewhere.
Miller and colleagues5 calculate that prevention spending in the USA is under-reported by a factor of three, and in the Netherlands, de Bekker-Grob and colleagues6 suggest that prevention spending is probably five times greater than that reported in the Dutch health accounts, primarily because of the exclusion of spending on health protection.
Third, despite the best efforts of the AIHW to standardise methods, there remain differences in the way jurisdictions account for some aspects of prevention and public health more generally, which reflect differences in the way that public health is funded, organised or delivered. In some Australian jurisdictions, services which would elsewhere be provided by the health department, are delivered through local government or state and territory departments other than health. This spending may not necessarily be reflected in the health accounts.7 Problems also arise in accounting for block funding that is provided to cover a multitude of activities that include prevention, such as grants to community health agencies that jointly cover services such as home nursing and health education. Some jurisdictions will account for all of this spending under one heading – say community health; others will use a rule of thumb to apportion the total spend to the different composite activities. Differences in practice distort comparisons among jurisdictions in a way that we have not been able to disentangle for this report.
The fourth issue lies in the way that Australia has adopted the OECD’s System of Health Accounts. AIHW takes data from the jurisdictions and classifies it according to both the national system and the OECD’s system. The end result in the figures that we are able to report here is negligibly small, but this is probably an artefact of the AIHW’s method rather than a reflection of any inherent similarities between the two sets of accounting systems.
A different approach was adopted recently by the Department of Health in the UK. It invested heavily in compiling a new set of accounts for public health with data classified at source according to the OECD’s system. This led to new activities being included as public health (dental check-ups for example) and a substantial increase in the share of health spending taken up by public health. We have been unable to quantify the effect however, because we lack comparative, counter-factual data. What we do know is that in 2000 the UK reported spending about the same amount per head on public health as Australia. By 2012, after adopting the OECD’s revised System of Health Accounts, the UK now reports spending twice as much per head on prevention as Australia.
Spending on public health in the UK probably has increased relative to Australia in that time, but we suspect that so too has the range of activities now recognised as public health in the accounts so that some but not all of the two-fold difference between the two countries is real.
PREVENTIVE HEALTH: HOW MUCH DOES AUSTRALIA SPEND AND IS IT ENOUGH? 21
3. How much should Australia spend on prevention?
3.1 Is Australia spending too little on prevention? It is tempting to contrast the small share of health service funding allocated to public health in Australia with the persistently large burden of preventable disease to conclude that prevention spending needs to be increased. International comparisons that show Australia apparently spending considerably less on public health than Canada, New Zealand and the UK, add weight to that argument.
The previous discussion both on the under-reporting of public health in the health accounts, and the distortions caused by institutional differences in how prevention is funded, organised and delivered, should undermine such arguments but they continue to be made, even in countries such as the USA, which as we have seen, already spends more on prevention per head of population than all OECD countries, with the exception of Canada.25
However, even if the accounts were comprehensive and directly comparable, information on how much is spent on prevention provides little guidance on the question of how much ought to be spent, as little or nothing is recorded about whether resources are being used efficiently, or whether any increase in spending will be worth the opportunity cost. By most indicators of population health, such as infant mortality or life expectancy, Australia fares as well as, if not better than, countries that spend a greater share of health resources on prevention.26 At face value, this might suggest that other countries are spending too much on prevention rather than Australia spending too little.
3.2 How should we decide how much to spend on prevention? The key to determining whether or not Australia ought to be spending more (or less) on prevention is to compare the value that is added by an increase in spending to the opportunity cost of that increase; that is to compare the benefits that would be obtained were prevention spending to be increased by $100 million, for example, with benefits lost because that $100 million could no longer be spent on something else. Funding may be removed from efforts to reduce waiting lists for example, or to improve the quality of early child development programs, or to increase the provision of social housing. If the benefits gained from spending more on prevention are greater in value than the best of these alternatives, then a case can be made for increasing spending. If the benefits do not justify the increase in spending, then, for completeness, one ought to look at what prevention activities might be curtailed if spending were to be reduced by $100 million and to compare the impact of this with the benefits that would otherwise be gained were that $100 million allocated elsewhere. This process is what economists refer to as marginal analysis.
The idea is illustrated in Figure 3.2.1 for one of the most difficult cases, where there is to be no overall increase in spending on health and one must instead consider whether the benefits of any increase in prevention spending justify taking resources away from other health services.
22 PREVENTION 1ST
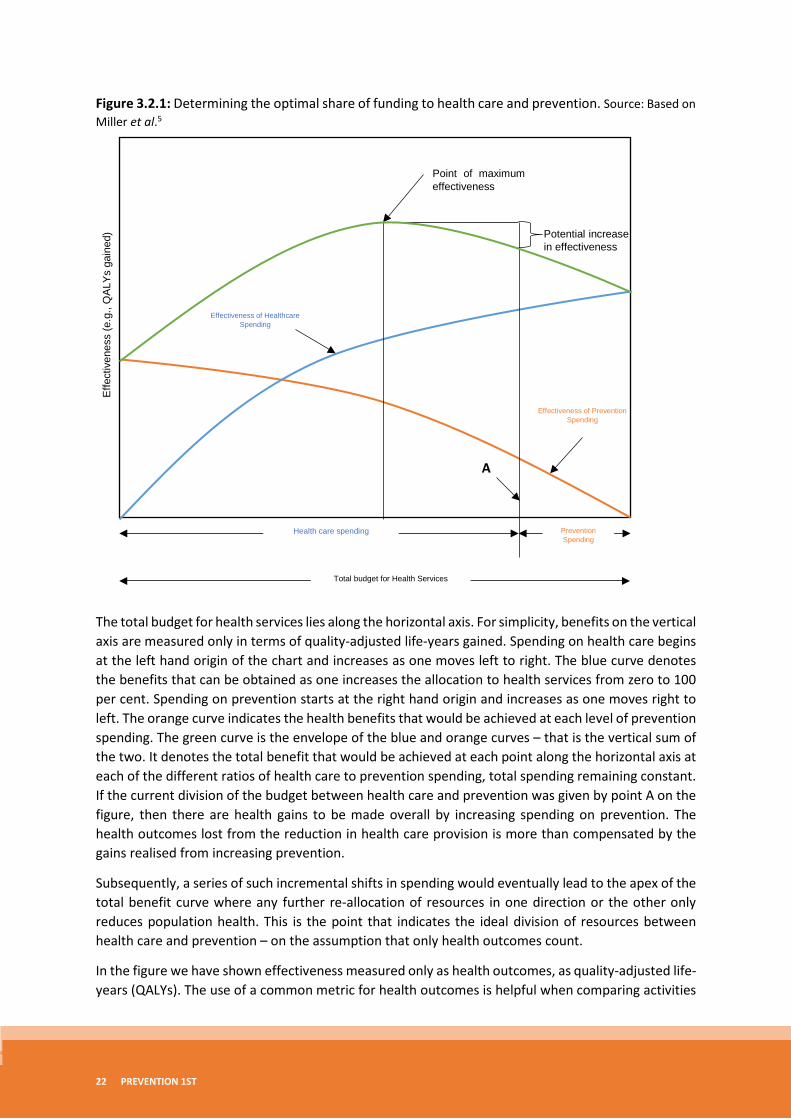
Figure 3.2.1: Determining the optimal share of funding to health care and prevention. Source: Based on Miller et al.5
The total budget for health services lies along the horizontal axis. For simplicity, benefits on the vertical axis are measured only in terms of quality-adjusted life-years gained. Spending on health care begins at the left hand origin of the chart and increases as one moves left to right. The blue curve denotes the benefits that can be obtained as one increases the allocation to health services from zero to 100 per cent. Spending on prevention starts at the right hand origin and increases as one moves right to left. The orange curve indicates the health benefits that would be achieved at each level of prevention spending. The green curve is the envelope of the blue and orange curves – that is the vertical sum of the two. It denotes the total benefit that would be achieved at each point along the horizontal axis at each of the different ratios of health care to prevention spending, total spending remaining constant. If the current division of the budget between health care and prevention was given by point A on the figure, then there are health gains to be made overall by increasing spending on prevention. The health outcomes lost from the reduction in health care provision is more than compensated by the gains realised from increasing prevention.
Subsequently, a series of such incremental shifts in spending would eventually lead to the apex of the total benefit curve where any further re-allocation of resources in one direction or the other only reduces population health. This is the point that indicates the ideal division of resources between health care and prevention – on the assumption that only health outcomes count.
In the figure we have shown effectiveness measured only as health outcomes, as quality-adjusted life-years (QALYs). The use of a common metric for health outcomes is helpful when comparing activities
Potential increase in effectiveness
Effe
ctiv
enes
s (e
.g.,
QA
LYs
gain
ed)
Point of maximum effectiveness
Total budget for Health Services
Prevention Spending
Health care spending
Effectiveness of Prevention Spending
Effectiveness of Healthcare Spending
A
PREVENTIVE HEALTH: HOW MUCH DOES AUSTRALIA SPEND AND IS IT ENOUGH? 23
designed only to improve health but, even then, it is not the only source of value. At the very least, any assessment of the value of different allocations of resources between prevention and care should also include considerations of equity, for example how health outcomes (and costs) are distributed among the population.27 Other values that might be considered important include the claim that different population groups have on resources, or the weighting that should be given if any to the severity or cause of the conditions being considered.28,29
For simplicity we have side stepped these issues, but we note that value is very likely to be contested as there is no objective way of measuring it. Thus, there will always be a need for judgement to be exercised in comparing and evaluating the consequences of changes in resource allocation. Techniques such as ‘program-budgeting and marginal analysis’,30 or one of its variants such as ‘portfolio analysis’,31 provide a framework to exercise these judgements. These techniques allow evidence, expertise and community values to be brought to bear on the problem in ways that make decisions transparent and open to scrutiny.32,33
Program budgeting and marginal analysis also resolves the issue that the accounts do not necessarily depict accurately the total spend on prevention. Figure 3.2.1 is drawn as if this is known, but it need not be. All that is required to begin with is an understanding of what activities are being provided and a crude idea of the resources associated with those activities. This is supported by a more detailed assessment of the cost and value-add of a sub-set of activities that, in economic terms, are ‘at the margin’ – that is, those that would be expanded or introduced if spending were increased from current levels, and those that would be cut back were spending reduced. One can determine the direction in which resources should be reallocated merely by focusing on these marginal activities, without accurate knowledge of total expenditure.
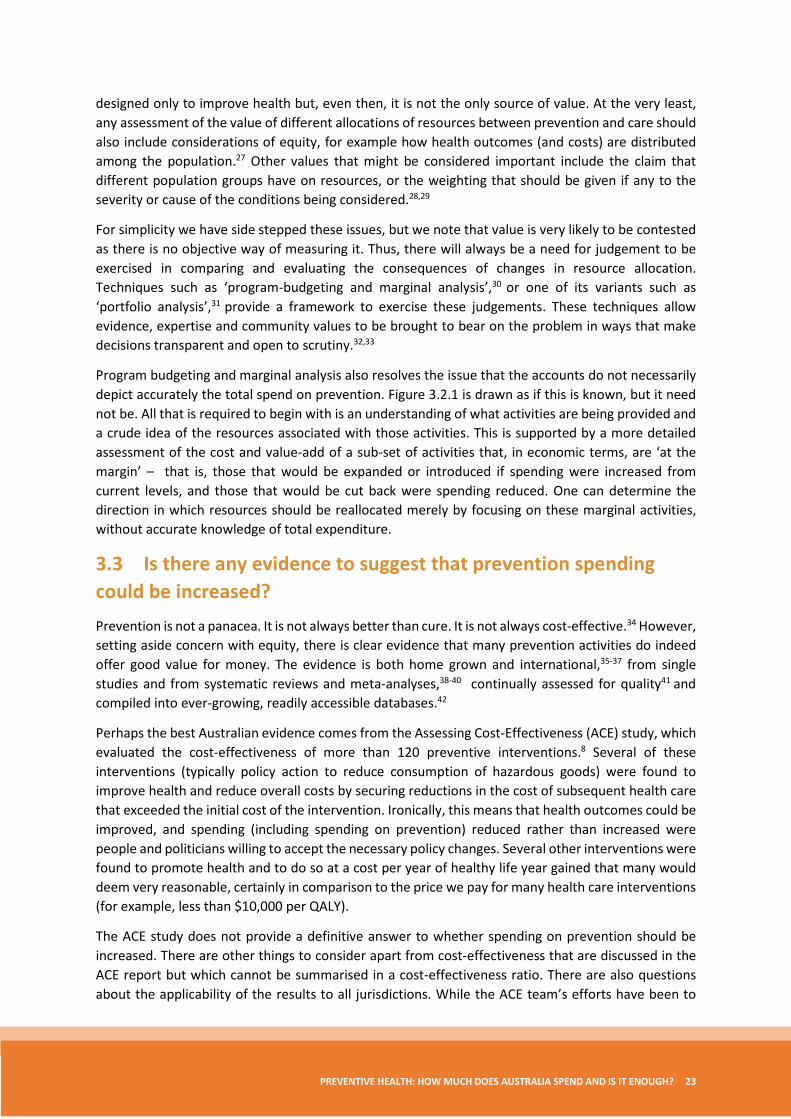
3.3 Is there any evidence to suggest that prevention spending could be increased? Prevention is not a panacea. It is not always better than cure. It is not always cost-effective.34 However, setting aside concern with equity, there is clear evidence that many prevention activities do indeed offer good value for money. The evidence is both home grown and international,35-37 from single studies and from systematic reviews and meta-analyses,38-40 continually assessed for quality41 and compiled into ever-growing, readily accessible databases.42
Perhaps the best Australian evidence comes from the Assessing Cost-Effectiveness (ACE) study, which evaluated the cost-effectiveness of more than 120 preventive interventions.8 Several of these interventions (typically policy action to reduce consumption of hazardous goods) were found to improve health and reduce overall costs by securing reductions in the cost of subsequent health care that exceeded the initial cost of the intervention. Ironically, this means that health outcomes could be improved, and spending (including spending on prevention) reduced rather than increased were people and politicians willing to accept the necessary policy changes. Several other interventions were found to promote health and to do so at a cost per year of healthy life year gained that many would deem very reasonable, certainly in comparison to the price we pay for many health care interventions (for example, less than $10,000 per QALY).
The ACE study does not provide a definitive answer to whether spending on prevention should be increased. There are other things to consider apart from cost-effectiveness that are discussed in the ACE report but which cannot be summarised in a cost-effectiveness ratio. There are also questions about the applicability of the results to all jurisdictions. While the ACE team’s efforts have been to
24 PREVENTION 1ST
localise their work, the study does not take into account synergistic affects among interventions or between interventions and context, so the complementary effects of everything else that a local jurisdiction might be doing are washed out. Finally, it has not yet been shown whether or not the Australian community really is willing to pay the price for increased prevention, even if it does look attractive in cost-effectiveness terms.
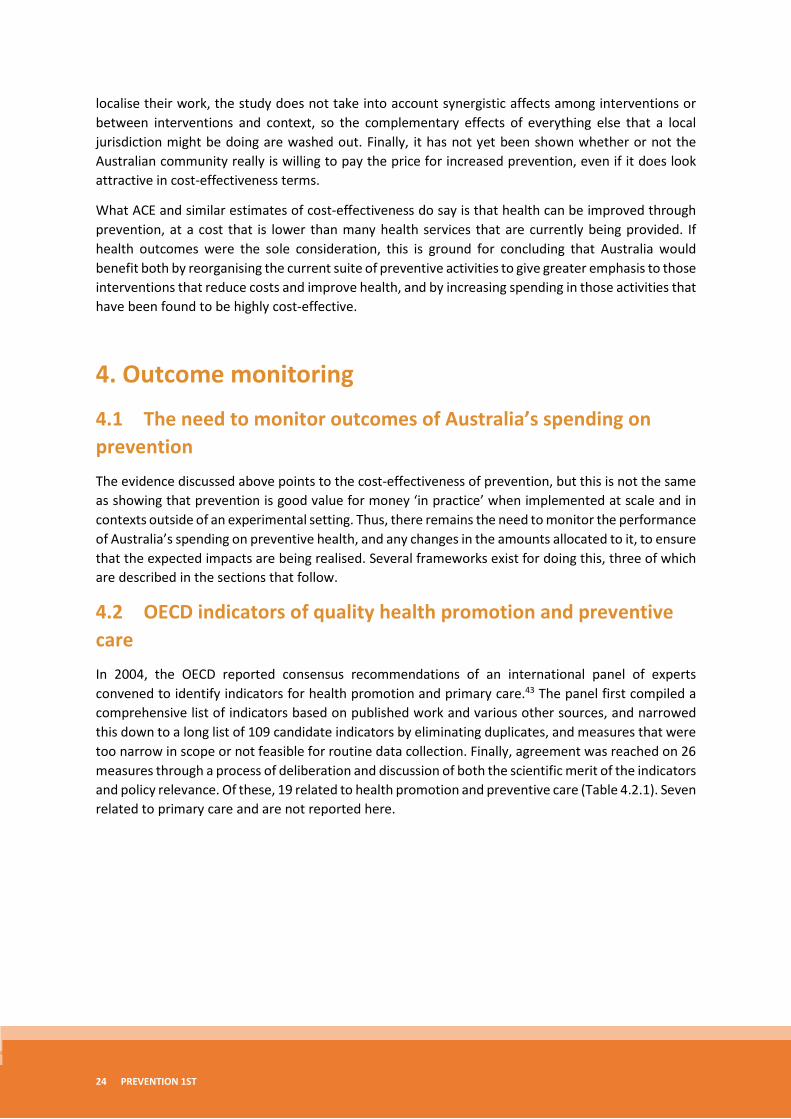
What ACE and similar estimates of cost-effectiveness do say is that health can be improved through prevention, at a cost that is lower than many health services that are currently being provided. If health outcomes were the sole consideration, this is ground for concluding that Australia would benefit both by reorganising the current suite of preventive activities to give greater emphasis to those interventions that reduce costs and improve health, and by increasing spending in those activities that have been found to be highly cost-effective.
4. Outcome monitoring
4.1 The need to monitor outcomes of Australia’s spending on prevention The evidence discussed above points to the cost-effectiveness of prevention, but this is not the same as showing that prevention is good value for money ‘in practice’ when implemented at scale and in contexts outside of an experimental setting. Thus, there remains the need to monitor the performance of Australia’s spending on preventive health, and any changes in the amounts allocated to it, to ensure that the expected impacts are being realised. Several frameworks exist for doing this, three of which are described in the sections that follow.
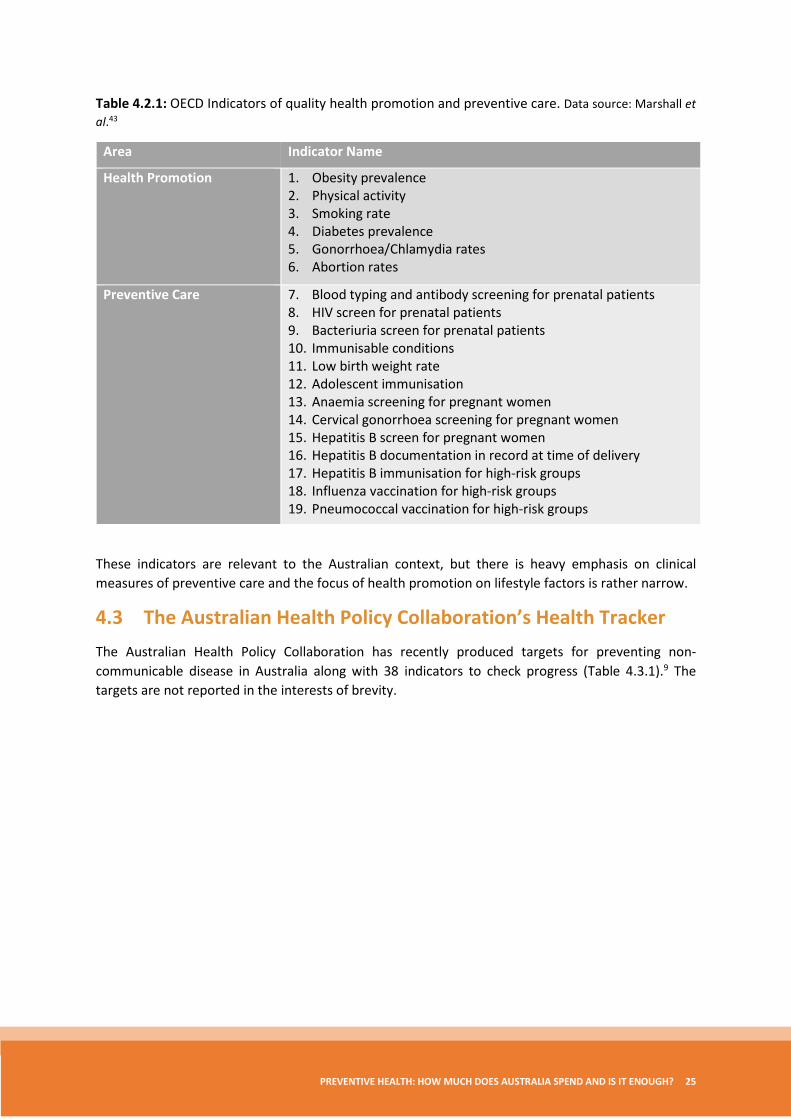
4.2 OECD indicators of quality health promotion and preventive care In 2004, the OECD reported consensus recommendations of an international panel of experts convened to identify indicators for health promotion and primary care.43 The panel first compiled a comprehensive list of indicators based on published work and various other sources, and narrowed this down to a long list of 109 candidate indicators by eliminating duplicates, and measures that were too narrow in scope or not feasible for routine data collection. Finally, agreement was reached on 26 measures through a process of deliberation and discussion of both the scientific merit of the indicators and policy relevance. Of these, 19 related to health promotion and preventive care (Table 4.2.1). Seven related to primary care and are not reported here.
PREVENTIVE HEALTH: HOW MUCH DOES AUSTRALIA SPEND AND IS IT ENOUGH? 25
Table 4.2.1: OECD Indicators of quality health promotion and preventive care. Data source: Marshall et al.43
Area Indicator Name
Health Promotion 1. Obesity prevalence 2. Physical activity 3. Smoking rate 4. Diabetes prevalence 5. Gonorrhoea/Chlamydia rates 6. Abortion rates
Preventive Care 7. Blood typing and antibody screening for prenatal patients 8. HIV screen for prenatal patients 9. Bacteriuria screen for prenatal patients 10. Immunisable conditions 11. Low birth weight rate 12. Adolescent immunisation 13. Anaemia screening for pregnant women 14. Cervical gonorrhoea screening for pregnant women 15. Hepatitis B screen for pregnant women 16. Hepatitis B documentation in record at time of delivery 17. Hepatitis B immunisation for high-risk groups 18. Influenza vaccination for high-risk groups 19. Pneumococcal vaccination for high-risk groups
These indicators are relevant to the Australian context, but there is heavy emphasis on clinical measures of preventive care and the focus of health promotion on lifestyle factors is rather narrow.
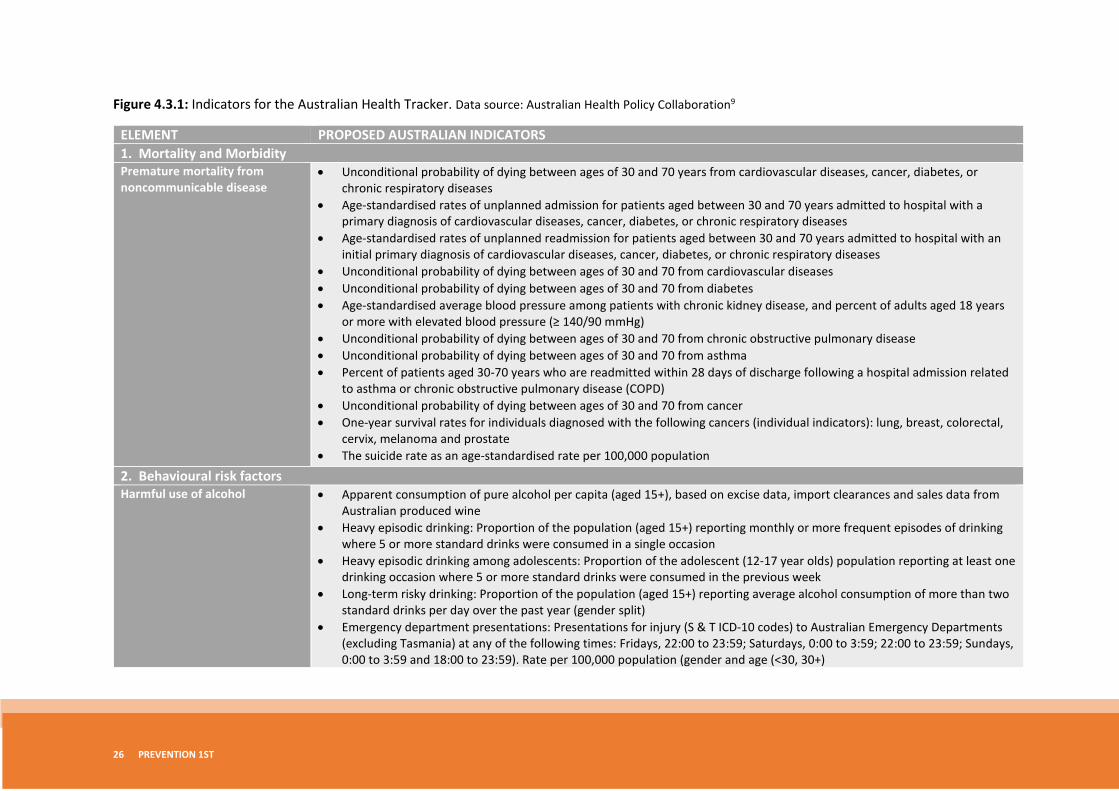
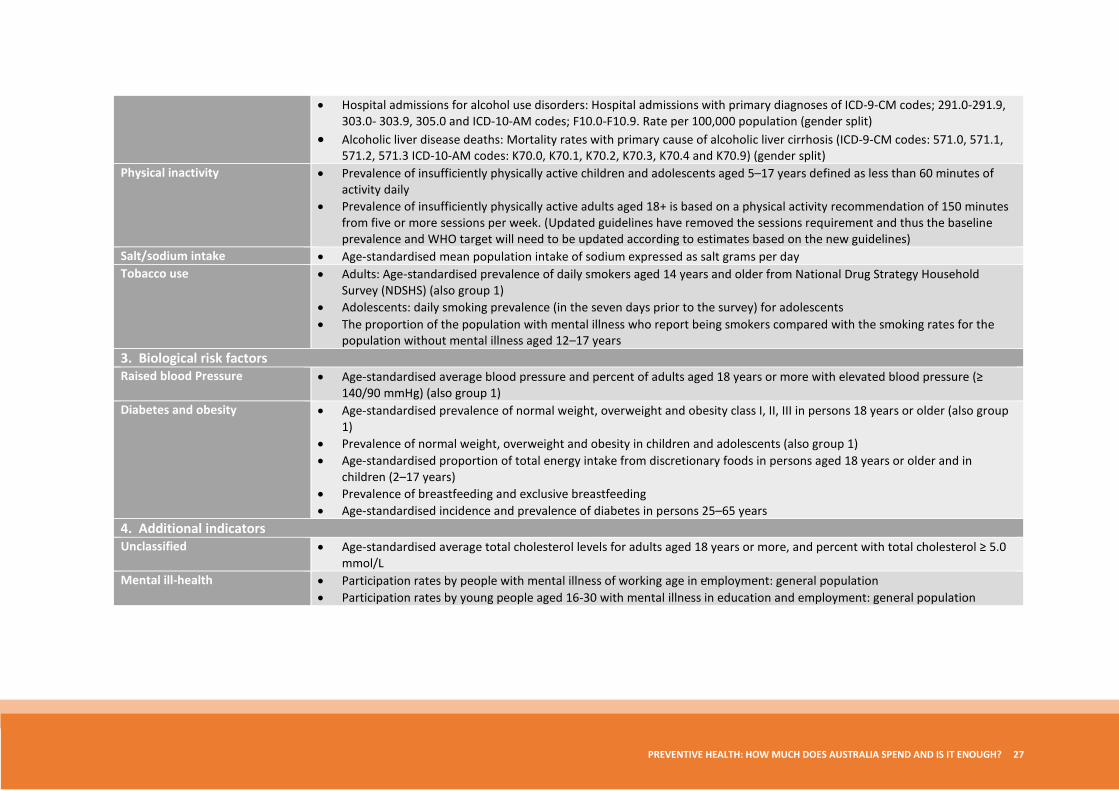
4.3 The Australian Health Policy Collaboration’s Health Tracker The Australian Health Policy Collaboration has recently produced targets for preventing non-communicable disease in Australia along with 38 indicators to check progress (Table 4.3.1).9 The targets are not reported in the interests of brevity.
26 PREVENTION 1ST
Figure 4.3.1: Indicators for the Australian Health Tracker. Data source: Australian Health Policy Collaboration9
ELEMENT PROPOSED AUSTRALIAN INDICATORS 1. Mortality and Morbidity Premature mortality from noncommunicable disease
• Unconditional probability of dying between ages of 30 and 70 years from cardiovascular diseases, cancer, diabetes, or chronic respiratory diseases
• Age-standardised rates of unplanned admission for patients aged between 30 and 70 years admitted to hospital with a primary diagnosis of cardiovascular diseases, cancer, diabetes, or chronic respiratory diseases
• Age-standardised rates of unplanned readmission for patients aged between 30 and 70 years admitted to hospital with an initial primary diagnosis of cardiovascular diseases, cancer, diabetes, or chronic respiratory diseases
• Unconditional probability of dying between ages of 30 and 70 from cardiovascular diseases • Unconditional probability of dying between ages of 30 and 70 from diabetes • Age-standardised average blood pressure among patients with chronic kidney disease, and percent of adults aged 18 years
or more with elevated blood pressure (≥ 140/90 mmHg) • Unconditional probability of dying between ages of 30 and 70 from chronic obstructive pulmonary disease • Unconditional probability of dying between ages of 30 and 70 from asthma • Percent of patients aged 30-70 years who are readmitted within 28 days of discharge following a hospital admission related
to asthma or chronic obstructive pulmonary disease (COPD) • Unconditional probability of dying between ages of 30 and 70 from cancer • One-year survival rates for individuals diagnosed with the following cancers (individual indicators): lung, breast, colorectal,
cervix, melanoma and prostate • The suicide rate as an age-standardised rate per 100,000 population
2. Behavioural risk factors Harmful use of alcohol • Apparent consumption of pure alcohol per capita (aged 15+), based on excise data, import clearances and sales data from
Australian produced wine • Heavy episodic drinking: Proportion of the population (aged 15+) reporting monthly or more frequent episodes of drinking
where 5 or more standard drinks were consumed in a single occasion • Heavy episodic drinking among adolescents: Proportion of the adolescent (12-17 year olds) population reporting at least one
drinking occasion where 5 or more standard drinks were consumed in the previous week • Long-term risky drinking: Proportion of the population (aged 15+) reporting average alcohol consumption of more than two
standard drinks per day over the past year (gender split) • Emergency department presentations: Presentations for injury (S & T ICD-10 codes) to Australian Emergency Departments
(excluding Tasmania) at any of the following times: Fridays, 22:00 to 23:59; Saturdays, 0:00 to 3:59; 22:00 to 23:59; Sundays, 0:00 to 3:59 and 18:00 to 23:59). Rate per 100,000 population (gender and age (<30, 30+)
PREVENTIVE HEALTH: HOW MUCH DOES AUSTRALIA SPEND AND IS IT ENOUGH? 27
• Hospital admissions for alcohol use disorders: Hospital admissions with primary diagnoses of ICD-9-CM codes; 291.0-291.9, 303.0- 303.9, 305.0 and ICD-10-AM codes; F10.0-F10.9. Rate per 100,000 population (gender split)
• Alcoholic liver disease deaths: Mortality rates with primary cause of alcoholic liver cirrhosis (ICD-9-CM codes: 571.0, 571.1, 571.2, 571.3 ICD-10-AM codes: K70.0, K70.1, K70.2, K70.3, K70.4 and K70.9) (gender split)
Physical inactivity • Prevalence of insufficiently physically active children and adolescents aged 5–17 years defined as less than 60 minutes of activity daily
• Prevalence of insufficiently physically active adults aged 18+ is based on a physical activity recommendation of 150 minutes from five or more sessions per week. (Updated guidelines have removed the sessions requirement and thus the baseline prevalence and WHO target will need to be updated according to estimates based on the new guidelines)
Salt/sodium intake • Age-standardised mean population intake of sodium expressed as salt grams per day Tobacco use • Adults: Age-standardised prevalence of daily smokers aged 14 years and older from National Drug Strategy Household
Survey (NDSHS) (also group 1) • Adolescents: daily smoking prevalence (in the seven days prior to the survey) for adolescents • The proportion of the population with mental illness who report being smokers compared with the smoking rates for the
population without mental illness aged 12–17 years 3. Biological risk factors Raised blood Pressure • Age-standardised average blood pressure and percent of adults aged 18 years or more with elevated blood pressure (≥
140/90 mmHg) (also group 1) Diabetes and obesity • Age-standardised prevalence of normal weight, overweight and obesity class I, II, III in persons 18 years or older (also group
1) • Prevalence of normal weight, overweight and obesity in children and adolescents (also group 1) • Age-standardised proportion of total energy intake from discretionary foods in persons aged 18 years or older and in
children (2–17 years) • Prevalence of breastfeeding and exclusive breastfeeding • Age-standardised incidence and prevalence of diabetes in persons 25–65 years
4. Additional indicators Unclassified • Age-standardised average total cholesterol levels for adults aged 18 years or more, and percent with total cholesterol ≥ 5.0
mmol/L Mental ill-health • Participation rates by people with mental illness of working age in employment: general population
• Participation rates by young people aged 16-30 with mental illness in education and employment: general population
28 PREVENTION 1ST
The Health Tracker includes indicators of both behavioural and biological health outcomes and risk factors. It also includes two indicators that relate to the social determinants of health, participation in employment and participation in education, but limits these only to people aged 16 and over who have a mental illness. The indicators were determined by expert working groups just as with the OECD indicators. Criteria covered relevance, applicability across population groups, technical (scientific) merit, feasibility, action-orientation, timeliness and marketability. Report cards will document both adult health and children’s health against the targets and in comparison with other OECD countries.
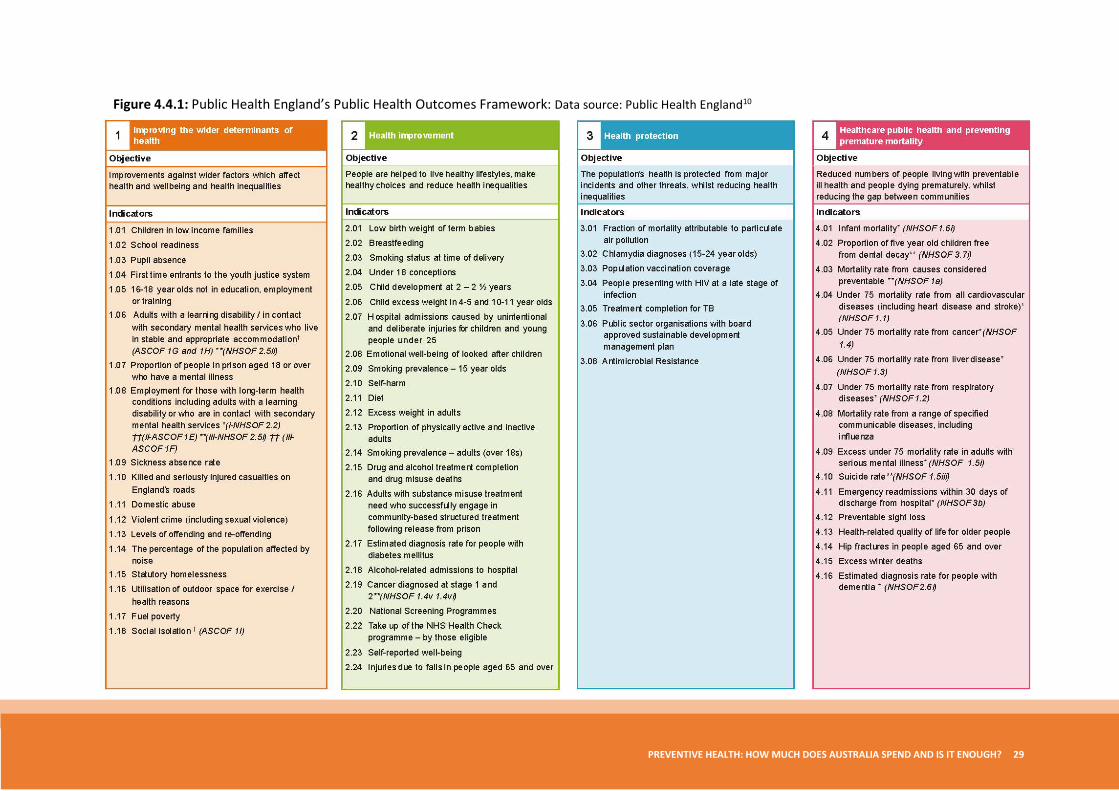
4.4 Public Health England’s Public Health Outcomes Framework Another ambitious effort to monitor the impact of public health activity is Public Health England’s Public Health Outcomes Framework.10 This provides comparative data on over 60 indicators of the public’s health at the level of both public health regions and local government (Figure 4.4.1). Indicators are grouped into four categories: improving the wider determinants of health, health improvement, health protection, and a collection of indicators on health care, preventive care and reduced mortality.
While there are small differences in detail between the Public Health Outcomes Framework and the indicators promulgated by the Australian Health Policy Collaboration in relation to measures of risk and health status, one notable difference is the inclusion of an extensive array of indicators that relate to exposure to the social determinants of health in the English framework. This is highly pertinent to current public health practice, even though few of the indicators in this category are likely to be affected by the activities typically captured in the accounts of public health spending. One exception is the indicator measuring the number of killed and seriously injured casualties on England’s roads. Following the OECD’s recommended accounting approach, the UK does now include the costs of providing advice on road safety in its accounts of prevention so there is some link there between spending and impact. In Australia, spending on safer road designs, on safety features in vehicles, and on safer routes for cyclists are unlikely to appear in the health accounts, despite the fact that each contributes to reducing the number of road-traffic related deaths and injuries.
PREVENTIVE HEALTH: HOW MUCH DOES AUSTRALIA SPEND AND IS IT ENOUGH? 29
Figure 4.4.1: Public Health England’s Public Health Outcomes Framework: Data source: Public Health England10
30 PREVENTION 1ST
4.5 Discussion of outcome monitoring frameworks The Australian Health Policy Collaboration Health Tracker provides an excellent starting point for monitoring the effectiveness of prevention spending over time. The battery of indicators would need to be expanded at some point to include communicable disease if the aim was to evaluate all prevention spending, but there is a framework in place to do this and a momentum that has been created. While expansions to the framework are being considered, a claim can also be made for including indicators of mental health and for following England’s lead by including measures of the impact of public health action on the social determinants of health.
One category of indicator missing from each of the frameworks discussed here is population exposure to health-promoting and health-harming policies and practices. There is capability to do this now. Indicators of neighbourhood walkability and liveability have been developed44 and the feasibility of measuring other exposures such as the local density of fast food or alcohol outlets, air quality and tobacco law enforcement, has been demonstrated in several studies.45-48 Publishing such data so that Australians know how their life chances and life choices are shaped by decisions outside their immediate control, could be one of the factors that unlocks population demand for effective public health policy and for increases in public health spending.49
5. Models for funding prevention
5.1 What are funding models? ‘Funding’ refers to the processes associated with the allocation of resources to those agencies and organisations responsible for delivering public health. This is distinct from ‘financing’, which refers to where the money comes from in the first place (whether raised through taxation for example, or through social insurance or direct user charges). How prevention ought to be financed is out of scope for this report.
Funding models aim to describe in simple terms the payment process. Ideally a model would include the agencies and organisations involved, both funders and funded, the mechanisms by which money is transferred from one to the other (for example, by contract, block grant, or special payment), the principles used to determine choice of funding mechanism and the amount of funding, and also the amount of funding actually allocated by each mechanism. In practice, there is a separation in the literature with one body of work describing institutional arrangements that govern the flow of funds, and another body of work quite separately looking at methods for allocating resources and the principles that should guide such action. The separation is unfortunate because as we argue in section 5.3 that the institutional arrangements for allocating funds shape the sorts of public health activity that can be provided, and influence the quality with which it is delivered, thus impacting on efforts to ensure resources are used efficiently and equitably.
PREVENTIVE HEALTH: HOW MUCH DOES AUSTRALIA SPEND AND IS IT ENOUGH? 31
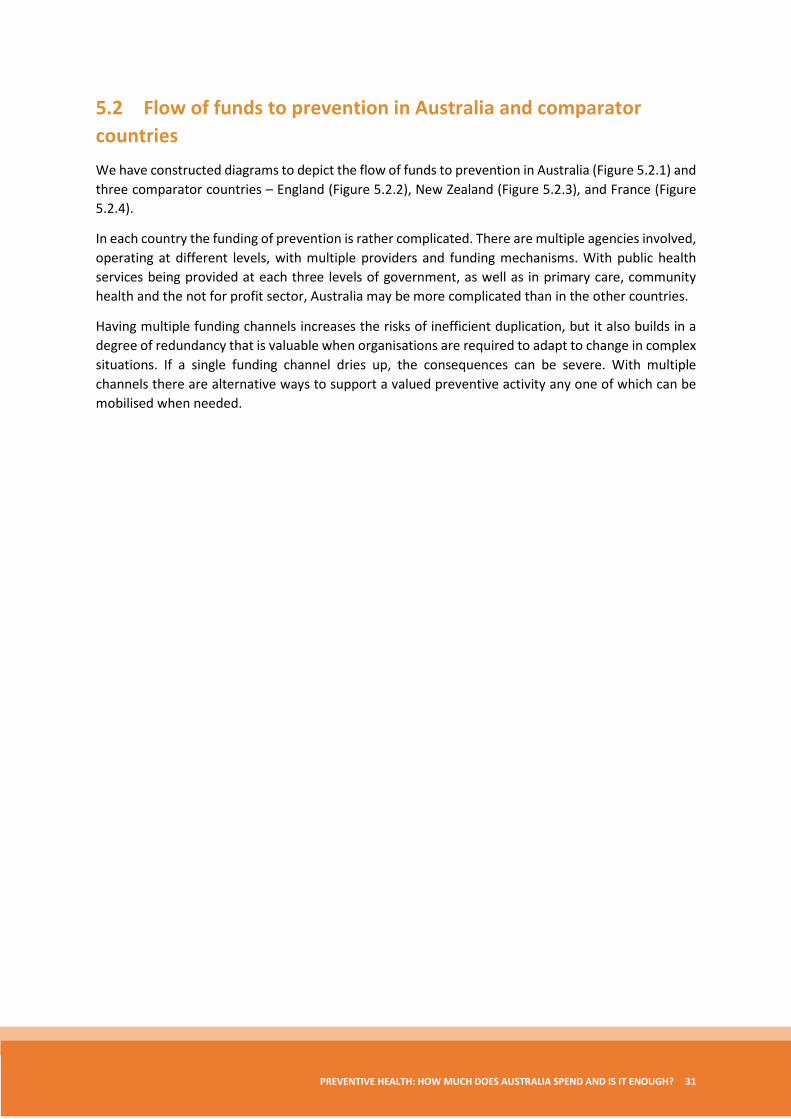
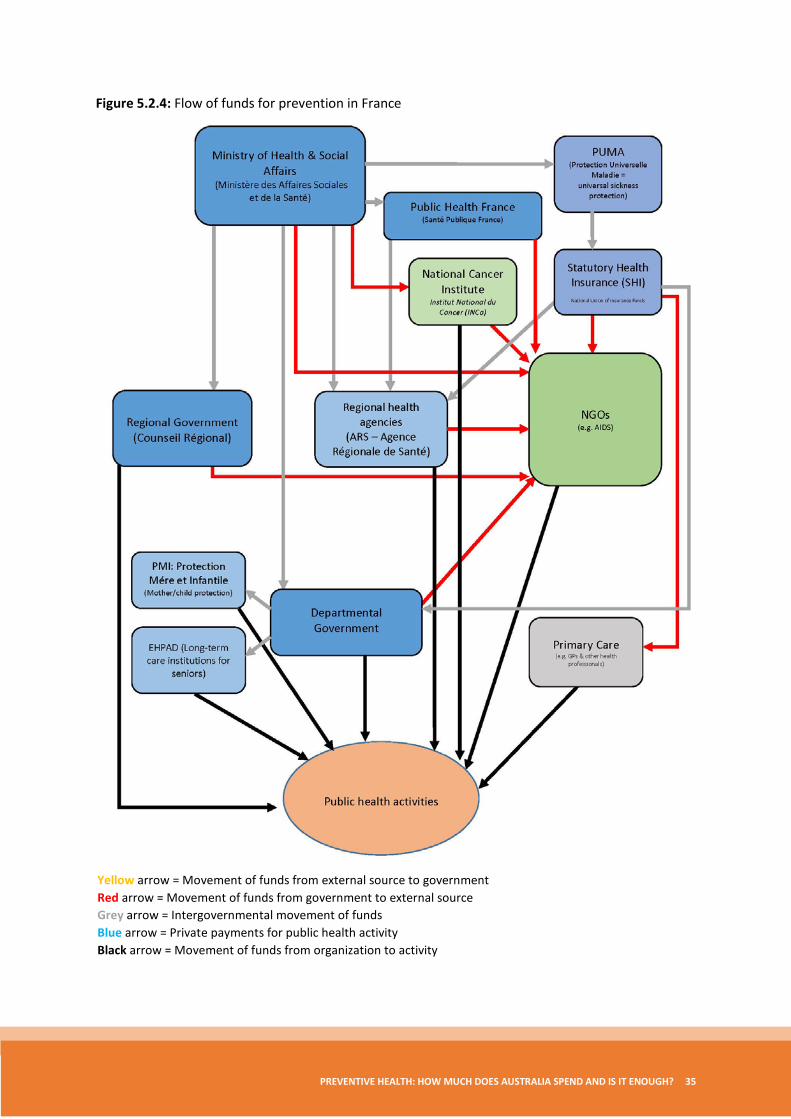
5.2 Flow of funds to prevention in Australia and comparator countries We have constructed diagrams to depict the flow of funds to prevention in Australia (Figure 5.2.1) and three comparator countries – England (Figure 5.2.2), New Zealand (Figure 5.2.3), and France (Figure 5.2.4).
In each country the funding of prevention is rather complicated. There are multiple agencies involved, operating at different levels, with multiple providers and funding mechanisms. With public health services being provided at each three levels of government, as well as in primary care, community health and the not for profit sector, Australia may be more complicated than in the other countries.
Having multiple funding channels increases the risks of inefficient duplication, but it also builds in a degree of redundancy that is valuable when organisations are required to adapt to change in complex situations. If a single funding channel dries up, the consequences can be severe. With multiple channels there are alternative ways to support a valued preventive activity any one of which can be mobilised when needed.
32 PREVENTION 1ST
Figure 5.2.1: Flow of funds for prevention in Australia
Yellow arrow = Movement of funds from external source to government Red arrow = Movement of funds from government to external source Grey arrow = Intergovernmental movement of funds Blue arrow = Private payments for public health activity Black arrow = Movement of funds from organization to activity
PREVENTIVE HEALTH: HOW MUCH DOES AUSTRALIA SPEND AND IS IT ENOUGH? 33
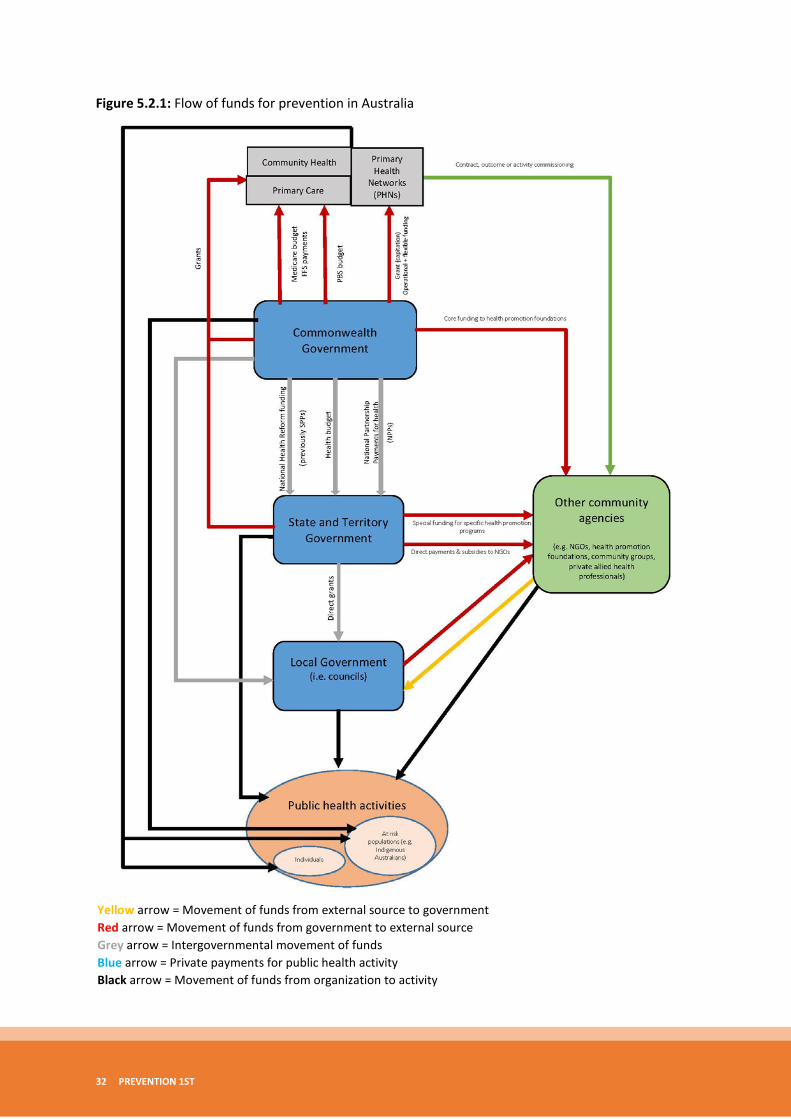
Figure 5.2.2: Flow of funds for prevention in England
Yellow arrow = Movement of funds from external source to government Red arrow = Movement of funds from government to external source Grey arrow = Intergovernmental movement of funds Blue arrow = Private payments for public health activity Black arrow = Movement of funds from organization to activity
34 PREVENTION 1ST
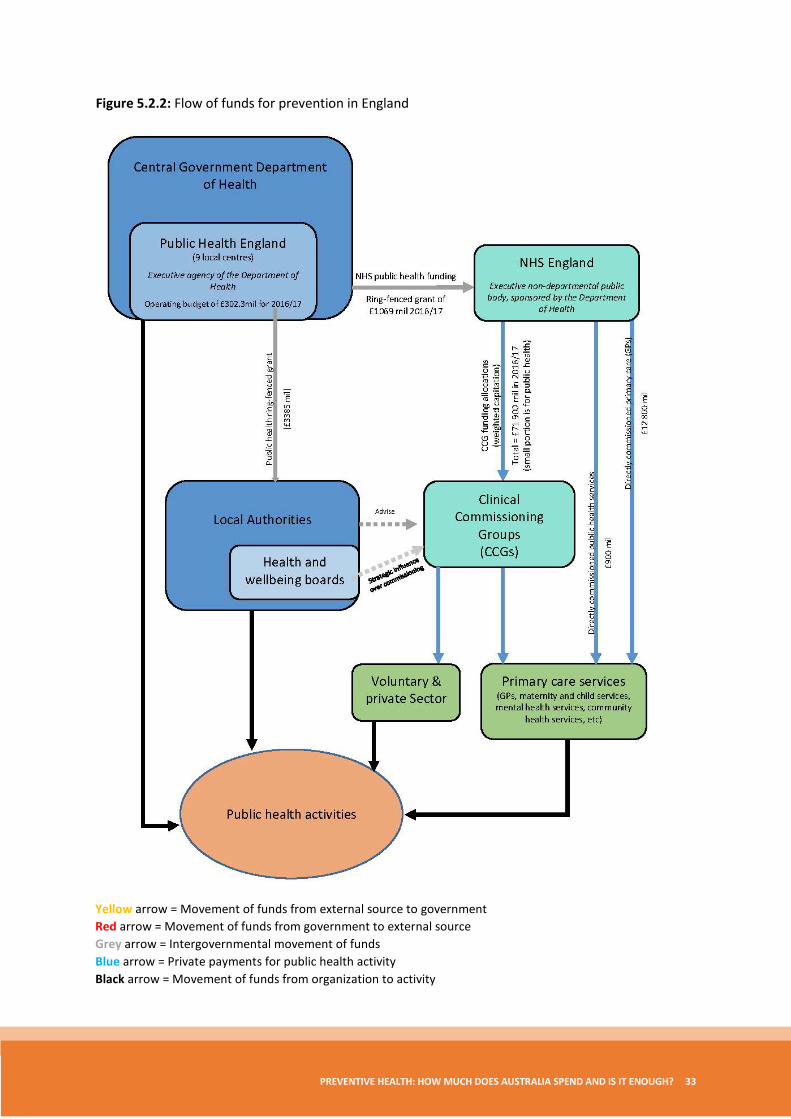
Figure 5.2.3: Flow of funds for prevention in New Zealand
Yellow arrow = Movement of funds from external source to government Red arrow = Movement of funds from government to external source Grey arrow = Intergovernmental movement of funds Blue arrow = Private payments for public health activity Black arrow = Movement of funds from organization to activity
PREVENTIVE HEALTH: HOW MUCH DOES AUSTRALIA SPEND AND IS IT ENOUGH? 35
Figure 5.2.4: Flow of funds for prevention in France
Yellow arrow = Movement of funds from external source to government Red arrow = Movement of funds from government to external source Grey arrow = Intergovernmental movement of funds Blue arrow = Private payments for public health activity Black arrow = Movement of funds from organization to activity
36 PREVENTION 1ST
Funding mechanisms include block grants based on population (adjusted for need), block grants based on expected activity levels, special payments for particular types of activity (such as one-off training), and activity-based or performance-based contracts for well-defined interventions such as vaccination. These mechanisms are seen in each country’s funding model. It is not the case, however, that choice of funding mechanism is always linked rationally to the type of activity it is designed to support.
In Australia, history has played a large part in the choice of which funding mechanism was used. There are examples, however, where the payment mechanism was explicitly chosen to align with the nature of the funded activity. As an example, in Victoria block grants were used to fund community-based Aboriginal health services because these allowed local expertise to determine the mix of services that best met local needs within a funding envelope consistent with other system-level goals.50
Of the models depicted here, England is alone in having an independent body, the newly renamed National Institute of Health and Care Excellence (NICE) that scrutinises the cost-effectiveness of public health interventions in the same way that the Pharmaceuticals Benefits Advisory Committee (PBAC) and the Medical Services Advisory Committee (MSAC) in Australia do for drugs and clinical procedures. In Australia, the idea for a prevention equivalent of PBAC and MSAC has been floated and warrants further consideration.51
5.3 The perverse incentive effects of institutional structure The institutional structures depicted in the flow of funds diagrams (that is the combination of the agencies and organisations involved in the funding and delivery or public health, and the funding mechanisms that join them) are unlikely to be neutral when it comes to the efficiency of public health provision. The type of public health activity provided depends to some extent on the choice of provider agency that receives funding. Structures can generate siloes that make it difficult to achieve the balanced allocation of resources depicted earlier in Figure 3.2.1 that maximises value.52
For example, in the absence of new institutional structures allowing primary care networks to commission work from a wide array of agencies, channelling funds through these networks would likely favour the provision of individual and group-based behavioural or clinical prevention rather than tackling social determinants, since the former is more consistent with general practice. Any imbalance in the share of funds allocated through this funding channel rather than an alternative more conducive to supporting action upstream, would manifest in differences in actual cost-effectiveness of marginal activities.
If ‘too much’ is allocated through primary health, then we will see more funds allocated to clinical prevention programs that are relatively less cost-effective. If ‘too little’ is allocated through primary health care channels relative to the alternatives, then we will find clinical prevention programs that are not being funded even though they warrant support based on their cost-effectiveness.
A second threat to efficiency arises with discordance between the nature of the activity being supported (for example infrastructure, capacity building, coalition building or service provision), the funding mechanism (such as a block grant, special payment or contracting), and the performance criteria written into any service agreement. Block grants for example, provide maximum leeway for provider organisations to choose how to meet local needs. Consistent with this aim, the performance indicators written into agreements should refer to high level health outcomes not micro-measures of process or service delivery. Performance measures that are not consistent with the nature of the activity being supported create perverse incentives and divert creative energy away from the task of improving public health, into efforts to subvert an unsupportive reporting mechanism.
PREVENTIVE HEALTH: HOW MUCH DOES AUSTRALIA SPEND AND IS IT ENOUGH? 37
We have not been able to examine in detail either the potential siloing effect of funding structures, or the congruence between policy objectives and funding mechanisms, and so cannot confirm whether the problems exists in Australia, but both issues warrant further exploration.
6. Conclusions The evidence considered here suggests that a strong case can be made for increasing spending on preventive health. However, this conclusion does not come from comparing levels of spending among jurisdictions within Australia, or between Australia and selected OECD countries. Australia does appear to spend less on preventive health than similar countries, including Canada, the UK and New Zealand, but this fact alone is not enough to justify the need to spend more. One needs to examine the health improvements expected from any increase in spending and demonstrate that these exceed the benefits that would otherwise be obtained were those same resources put to an alternative use.
Instead, we base the claim that more should be spent on prevention on evidence from studies examining the cost-effectiveness of preventive health interventions. This evidence shows that the health of Australians could be improved both by reconfiguring existing preventive health activities, and by increasing spending on those activities shown to be the most cost-effective.
We also suspect, but as yet have no evidence to support the idea, that the choice of funding mechanism (how money is allocated to whom for prevention) is an important determinant of the overall efficiency of the prevention spend. The funding model is not just a neutral way of distributing resources from government to providers of preventive health services. The different mechanisms employed may have a siloing effect such that channelling resources down one route will favour some forms of preventive health activity and not others. Since the choice of mechanisms seems to be largely based on history, the favoured activities need not be the most cost-effective or equitable. This issue warrants further consideration.
Finally, England stands alone among the countries we examined as having institutional structures in place both for assessing the cost-effectiveness of preventive interventions (through NICE) and for monitoring the effectiveness of spending on prevention through Public Health England’s Public Health Outcomes framework. The latter is especially notable for including an extensive array of indicators on the impact that preventive spending is having on exposure to the broader social determinants of health. The feasibility of transferring such initiatives and adapting them to the Australian context also warrants examination.
38 PREVENTION 1ST
Appendix A Constant prices
Monetary values that have been adjusted for inflation using an index developed by the Australian Bureau of Statistics. This allows for a more accurate comparison of expenditure estimates over different years (see current prices).
Current prices
Monetary values that are unadjusted for the effect of inflation. That is, they are reported in the exact dollar amount that was incurred during that year (see constant prices).
Determinants of health
These are the economic, social, environmental and personal factors that influence the health status of individuals and populations.53
Disease prevention
The WHO defines prevention as interventions occurring at all levels of society that are aimed at reducing the risk and burden of disease in individuals and populations through the interruption or delay of the disease process or reducing disability.54,55
The WHO Health Promotion Glossary secedes the terms health promotion and disease prevention by acknowledging that disease prevention usually occurs within the health sector on individuals who exhibit predefined risk behaviours or who have identifiable risk factors.53
Primary prevention
This level of prevention aims to prevent the initial occurrence of disease. Examples of primary prevention include actions which modify the upstream influences such as the socioeconomic determinants of health, nutrition and food supplementation, clinical preventive services such as vaccinations.56
Secondary prevention
Secondary prevention is concerned with the early detection of disease with a view to being able to intervene early to arrest or retard existing disease.53,56 Examples of this level of prevention include screening programs for the early detection of disease and preventive pharmaceuticals when provided early in the disease process.56
Tertiary prevention
Tertiary prevention is aimed at reducing the consequences associated with established disease through prevention of the recurrence of symptoms, prevention of complications and the provision of effective rehabilitation.57,58
Economic evaluation
Economic evaluation is “the comparative analysis of alternative courses of action in terms of both their costs and consequences”.59 It should involve an assessment (identify, measure, value) of the costs and consequences of alternative interventions being considered.
PREVENTIVE HEALTH: HOW MUCH DOES AUSTRALIA SPEND AND IS IT ENOUGH? 39
Equity
Equity is intimately linked with fairness. According to the WHO, equity relates to the “absence of avoidable or remediable differences among groups of people, whether those groups are defined socially, economically, demographically, or geographically.”60
Health outcomes
The WHO health promotion glossary defines health outcomes as “a change in the health status of an individual, group or population which is attributable to a planned intervention or series of interventions, regardless of whether such an intervention was intended to change health status.”53
Health promotion
The Ottawa Charter for Health Promotion defines health promotion as “the process of enabling people to increase control over, and to improve, their health”.61 Modern day health promotion aims to address a broad range of social and environmental interventions,62 moving beyond influencing individual behaviours and specific health-related risk factors.
Incremental analysis
Incremental analysis relates the difference in costs between one intervention and another to the difference in health outcomes, with the results expressed in terms such as the cost per year of life saved or the cost per quality-adjusted life-year gained.63,64
Marginal analysis
A marginal analysis evaluates the change in costs (or consequences) following a small change in the scale of production. That is a small increase in the budget for the service in question or a small decrease in the budget. See also program budget.
Opportunity cost
“Opportunity cost is the value of a resource in its most highly valued alternative use.”65 That is, the value of benefits that have been forgone as a consequence of the resource not being available for its best alternative use.
Portfolio analysis
A technique for setting priorities and a variant of program budgeting and marginal analysis that enables the degree of risk and uncertainty about effectiveness associated with different interventions to be factored into the decision-making process.31
Prevention
See disease prevention.
Primary care
Primary care is the first point of contact that a patient has with the health care system. The interaction between the patient and health professional will usually involve a diagnosis and associated treatment, and will often incorporate some degree of disease prevention – either primary, secondary or tertiary.66 It is primarily focussed on the individual, rather than tackling a disease state,67 and is generally understood to encompass a more narrow range of interventions in comparison to primary health care.
40 PREVENTION 1ST
Primary health care
Primary health care is a public health concept derived from the social model of health,66 and strengthened by the Declaration of Alma Ata from 1978. The Declaration of Alma Ata defines primary health care as “the first element of a continuing health care process”,68 and identifies that it is not only the first level of contact of patients with the health system, but that it also encompasses “promotive, preventive, curative and rehabilitative services”.68
The Australian Government Department of Health defines primary health care as “the frontline of Australia’s health care system”69 and as encompassing a broad range of services including “health promotion, prevention and screening, early intervention, treatment and management”.69
Program budget
A program budget is an estimation of the resources, expenditure and revenues relating to a given set of activities (that is a program), which are intended to be used, incurred or gained over a pre-specified period of time.70 Used in the context of ‘program budgeting and marginal analysis’ it refers to a less formal estimate or description of the resources associated with program delivery and the associated activities. This forms the basis for discussions about where resources might be beneficially reallocated within and between programs of work.
Program budget and marginal analysis (PBMA)
PBMA is a method for prioritising the allocation of resources across health programs. The first stage, the program budget, involves rough estimation of the resources currently allocated to each program of activity being examined. The second step (the marginal analysis) looks more closely at the net benefits to be gained, if any, by shifting resources within programs and across programs.33
Public health
The Australian Institute of Health and Welfare defines public health activities as those that are focused on “prevention, promotion and protection rather than on treatment, on populations rather than on individuals, and on the factors and behaviours that cause illness and injury rather than the injury itself”.12
One of the earliest and most commonly used definitions of public health comes from the Acheson Report, which defines public health as “the science and art of promoting health, preventing disease, and prolonging life through the organised efforts of society”.71
Purchasing power parity (PPP)
Purchasing power parity is a currency conversion method used to equalise the purchasing power of differing currencies through the elimination of differences in price levels. This aims to standardise international currencies to allow for more appropriate comparisons of financial data.
Quality-adjusted life-year (QALY)
A summary measure of health outcomes that uses subjective values to weight each additional year of life according to its health-related quality.
PREVENTIVE HEALTH: HOW MUCH DOES AUSTRALIA SPEND AND IS IT ENOUGH? 41
Appendix B
AIHW definition of public health activities We repeat below the guidance that AIHW provides health agencies about categories of spending to include as prevention and public health.iv
CODE 401 Public health – Communicable disease control
This category includes all activities associated with the development and implementation of programs to prevent the spread of communicable diseases.
Expenditure on communicable disease control is recorded using three sub-categories:
a) HIV/AIDS, hepatitis C and sexually transmitted infections b) Needle and syringe programs c) Other communicable disease control
The public health component of the HIV/AIDS, hepatitis C and sexually transmitted infections strategies includes all activities associated with the development and implementation of prevention and education programs to prevent the spread of HIV/AIDS, hepatitis C and sexually transmitted infections. Expenditure on treatment or diagnostic services is not included.
a) HIV/AIDS, hepatitis C and sexually transmitted infections
Inclusions
• Implementation of health promotion strategies aimed at increasing safe behaviour among at-risk populations including people living with HIV/AIDS (including through community sector agencies)
• Provision of sexual health services to at-risk populations to reduce prevalence of sexually transmitted infections, including testing for sexually transmitted infections (including HIV and hepatitis C), pre-test counselling for all sexually transmitted infections (including HIV), broad-based screening programs and contact tracing
• Programs toward prevention of sexually transmitted infections (STIs) and blood borne viruses (BBVs), including genital herpes, hepatitis B and C, human papilloma virus, chlamydia, gonorrhoea and syphilis
• Indigenous health programs targeting STIs and BBVs
• Consultation with community sector agencies regarding program priorities and delivery
• Promotion of access to culturally appropriate services
iv Australian Institute of Health and Welfare http://meteor.aihw.gov.au/content/index.phtml?itemId=tag.DownloadBoxMetadataItems&media=wpml&type=list&items[]=533041&form=short

42 PREVENTION 1ST
• Minimisation of the risk of transmission through occupational and non-occupational exposure through prophylaxis
• Support of targeted training to ensure provision of best practice sexual health services for at-risk populations
• Surveillance
• Development of and participation in relevant committees
• Diagnostic services
• Peer support programs immediately following diagnosis which promote safe sex practices and inform patients and carers about how to live with HIV/AIDS, blood borne viruses, hepatitis C and sexually transmitted infections
• Provision of high-quality data to health professionals to improve service delivery
• Participation in or initiation of research to establish data to inform service provision
• Funding to NGOs (for example, hepatitis councils, HIV/AIDS councils)
• Support of volunteer programs through access to training
• Management of people with HIV who place others at risk
Exclusions
• Treatment for sexually transmitted infections
• Pharmaceuticals
• HIV testing following diagnosis
• Specialist GPs for primary management of HIV/AIDS
• Access to HIV treatments and viral load testing
• Outpatient and ambulatory services
• Dental health services
• Welfare and housing referral services
• Admitted patient services
• Mental health services
• Community and home-based care services
• Palliative and respite care services
• Maternity services
• Hepatitis B and HPV immunisation (included in other organised immunisation)
• Safe sexual health messages (included in Selected health promotion)
PREVENTIVE HEALTH: HOW MUCH DOES AUSTRALIA SPEND AND IS IT ENOUGH? 43
b) Needle and syringe programs
Needle and syringe programs aim to reduce and prevent the transmission and spread of infectious diseases to individuals and the broader community through the provision of sterile injecting and disposal equipment, education, consultation and referral processes.
Inclusions
• Education and training of the labour force
• Provision of safe injecting equipment, including the cost of equipment, transport and staff to deliver the service
• Administration of the program, including identifying new sites, negotiating services
• Costs, addressing public concerns and policy development
• Negotiation with pharmacies to support initiatives
• Consultation with community agencies operating needle and syringe program sites
c) Other communicable disease control
This sub-category includes all other communicable disease control activities not assigned to the HIV/AIDS, hepatitis C and sexually transmitted infections or Needle and syringe program sub-categories as defined above.
Inclusions
• Surveillance systems, screenings, recording, notification and reporting systems
• Case response, contact tracing, investigation and disease outbreak planning and management
• Policy and support services specifically related to communicable disease control programs
• Provision and administration of vaccines for the management of disease outbreaks
• Provision of advice and education on all other communicable diseases
• Initial counselling for people tested
• Funding to NGOs for the provision of operating prevention programs
• Human quarantine-related services
• OzFoodNet programs
Exclusions
• Clinical and treatment services for communicable disease infections including sexually transmitted infections
• Provision and administration of vaccines for immunisation programs as defined in the Organised immunisation category
• Referral, treatment and associated counselling for communicable disease infections
44 PREVENTION 1ST
• Staff screening programs, staff immunisation and staff education
• Infection control activities in hospitals
• Funding to NGOs for the provision of treatment-based programs
CODE 402 Public health – Selected health promotion
This category includes those activities fostering healthy lifestyle and a healthy social environment overall, and health promotion activities targeted at health risk factors which lead to injuries, skin cancer and cardiovascular disease (for example, diet or inactivity) that are delivered on a population-wide basis. The underlying criterion for the inclusion of health promotion programs within this category was that they are population health programs promoting health and wellbeing.
Inclusions
• State government funding for health promotion councils or NGOs
• Organised population programs, or programs with a population focus (for example, programs on lifestyle risk factors, population level interventions targeting eating and physical activity, and Healthy communities, children and workers Cities and Healthy Schools programs)
• Development, administration, implementation and evaluation of policy, programs, guidelines and legislation
• Development and maintenance of health promotion databases (including data collection), where they can be separated from ‘non-public health’ databases
• Health sector input to cross-sector health education
• Organised population health screening of risk factors for preventable chronic disease
• Communication information and advice to the public
• Supportive environments for healthy living
• Innovative Health Services for homeless youth
Exclusions
• Opportunistic health checks of individuals, activities for heart disease risk factors (stress, blood pressure, cholesterol)
• Information programs on management of specific diseases post-diagnosis
• Community nurse activity (for example, ad-hoc talking to schools about nutrition)
• Individual counselling including health education on an ad-hoc basis
• Compliance with safety codes and maintenance of healthy environments
• Treatment for stress or other mental health disorders (for example, anxiety)
• Ad-hoc school education by school health nurses and school dental services
PREVENTIVE HEALTH: HOW MUCH DOES AUSTRALIA SPEND AND IS IT ENOUGH? 45
• Well Baby clinics, domiciliary care and home nursing services
• Neighbourhood watch programs
• Occupational health and safety education (included under ‘Public health-related activities’)
• Population health programs directed at domestic, family and general violence
• Population health programs providing a safe sexual health message – these are included in the communicable disease control category
• Public health education campaigns and school health education programs funded outside the health sector
• Health promotion activities that are associated with core public health categories – these are classified in the relevant categories (for example, safe drinking programs should be classified in the prevention of hazardous and harmful drug use category)
CODE 403 Public health – Organised immunisation
This category includes immunisation clinics, school immunisation programs, immunisation education, public awareness, immunisation databases and information systems.
Expenditure on organised immunisation is recorded using three sub-categories:
1. Organised childhood immunisation (as defined by the NHMRC National Immunisation Schedule) 2. Organised pneumococcal and influenza immunisation 3. All other organised immunisation (for example, tetanus)—as opposed to ad-hoc or opportunistic
immunisation
Inclusions
• Promotion, distribution, provision and administration of vaccines as listed
• Immunisation clinics and school immunisation programs
• Immunisation education and public awareness
• Immunisation databases and information systems
• Staff vaccination programs where part of organised immunisation and NHMRC schedule for all tetanus immunisation
Exclusions
• Immunisation after possible infection or on detection of illness (for example, rabies vaccine)—this expenditure should be included in the communicable disease control expenditure category
46 PREVENTION 1ST
CODE 404 Public health – Environmental health
This category relates to health protection education (for example, safe chemical storage, water pollutants), expert advice on specific issues, development of standards, risk management and public health aspects of environmental health protection. The costs of monitoring and regulating are to be included where costs are borne by a regulatory agency and principally have a public health focus (for example, radiation safety, and pharmaceutical regulation and safety).
Environmental health includes the following characteristics:
• Vector control
• Chemical regulation and safety
• Radiation safety and control
• Public health aspects of water quality control and fluoridation
• Legionella control
• Public health input to contaminated sites and unhealthy land
• Public health aspects of water environment control
• Public health input to hazardous materials management
• Public health aspects of waste water and solid waste
• Public health input to disaster management
• Public health contribution to environmental sampling, health impact statements and risk assessment
• Radiation regulation, water quality regulation, lead and asbestos regulation
• Environmental health monitoring
Inclusions
• Development, review and administration of legislation, policy and/or regulations health protection education (for example, safe chemical storage, water pollutants) and expert advice on specific issues
• Response to health complaints and investigation of breaches of legislation and disease outbreaks
• Surveillance, inspections and investigations to maintain standards (for example, water quality testing, sampling)
• Expert advice and provision of professional and technical support services on specific issues
• Administration of relevant legislation, such as the licensing of operators or conducting pest control examinations
PREVENTIVE HEALTH: HOW MUCH DOES AUSTRALIA SPEND AND IS IT ENOUGH? 47
• Maintenance of related databases (for example, issuing radiation licenses, and national notification of agricultural, veterinary and industrial chemicals and pesticides)
• Regulation and management of water fluoridation (includes addition of fluoride to water supplies)
• Public health component of assessment, remediation and management of contaminated land
• Public health input to land development applications
• Public health input to emergency management and disaster response management, including planning and emergency response teams
• Public health contribution to environmental sampling, health impact statements and risk assessment
• Public health input to control activities for vectors (for example, landfill, spraying, baiting, eradication) – to be included only if undertaken by regulatory agency
• Poisons regulation
• Pharmaceutical and therapeutic goods regulation
• Public health input to air and noise pollution control
• Training of environmental health workers
• Public health aspects of manufacture and distribution of medicines
Exclusions
• Costs borne by private or government industry in complying with regulations and legislation such as public health and environmental health acts
• Hospital infection control
• Treatment for infections (for example, Ross River fever or encephalitis treatment)
• Workplace testing or monitoring
• Installation and maintenance of systems (for example, waste disposal, storm water pollution, air-conditioning units)
• Management of land development applications
• Compliance with regulation which protects water courses and national parks
• Recycling programs
• Infectious waste control (for example, medical wastes and sharps) and disposal
• Environmental health protection research (to be included under Code 410, Public health research)
48 PREVENTION 1ST
CODE 405 Public health – Food standards and hygiene
This category includes the development, review and implementation of food standards, regulations and legislation as well as the testing of food by the regulatory agency.
Inclusions
• Development, review and implementation of food standards, regulations, legislation, policy and standards
• Surveillance (including inspections/audits), monitoring and enforcement of food legislation, policy and standards (including food premises registers, food safety programs, food safety supervisors and food safety auditing)
• Testing of prescribed contaminants in food by regulatory agency
• Education such as food safety awareness campaigns for suppliers and/or consumers
• Training and education for food handlers (including LGAs)
• Education and advice on food standards/requirements (for example, for food premises)
Exclusions
• Compliance costs of industry associated with food regulations (for example, labelling and safe food handling practices)
• Testing of food by industry
CODE 406 Public health – breast cancer screening
This category relates to breast cancer screening and includes expenditure for the complete breast cancer-screening pathway through organised programs. The breast cancer-screening pathway includes such activities as recruitment, screen taking, screen reading, assessment (this includes fine needle biopsy), core biopsy, open biopsy, service management and program management.
Inclusions
• State-wide coordination and planning
• Strategic policy development and implementation
• Service development and support
• Management of state registers
• Capital procurement and capacity planning
• Quality management and monitoring (management of registries, communication and education, including social marketing, workforce development, training and monitoring, evaluation and research)
Exclusions
• Treatment and surveillance for five years after diagnosis
PREVENTIVE HEALTH: HOW MUCH DOES AUSTRALIA SPEND AND IS IT ENOUGH? 49
• Post diagnosis follow up counselling and support
• Pathology services associated with treatment
• Breast cancer research collaboratives (to be included under Code 410, Public health research)
CODE 407 Public health – Cervical screening
This category relates to organised cervical screening programs such as the state cervical screening programs and rural access programs, including coordination, provision of screens and assessment services. Cervical screening, funded through Medicare, for both screening and diagnostic services is also included.
Inclusions
• State-wide coordination and planning
• Strategic policy development and implementation
• Service development and support
• Management of state Pap smear registers
• Quality management and monitoring
• Communication and education, including social marketing
• Monitoring, evaluation and research
Exclusions
• Colposcopy services and related histopathology
• Counselling and/or treatment for patients diagnosed with cervical cancer (the differences between abnormalities and malignant carcinomas are described in Screening to Prevent Cervical Cancer: Guidelines for the Management of Women with Screen Detected Abnormalities. NHMRC 2005)
• In some jurisdictions, third parties provide some aspects of cervical screening. In reporting expenditure for this category, jurisdictions should note if this is the case and whether or not this expenditure is included in the estimates they provide
CODE 408 Public health – Bowel cancer screening
This category relates to the organised National Bowel Cancer Screening Program (NBCSP). The screening pathways include:
• Self-administered Faecal occult blood test (FOBT)
• The National Register functions including letters of invitation and reminders (Commonwealth to provide costs)
• Follow up assessment colonoscopy services (public and private)
• Follow up officers (state-based/Commonwealth funded) tests for analysis
50 PREVENTION 1ST
• Program coordination and management
CODE 409 Public health – Prevention of hazardous and harmful drug use
This category includes activities targeted at the general population with the aim of preventing or reducing harmful use of alcohol, tobacco, illicit and other drugs of dependence, and mixed drugs. The Australian Standard Classification of Drugs of Concern includes analgesics, sedatives and hypnotics, stimulants and hallucinogens, anabolic agents and selected hormones, antidepressants and anti-psychotics, and also miscellaneous drugs of concern.
Report for each sub-category as below, the aggregate of which will be total expenditure on prevention of hazardous and harmful drug use:
1. Alcohol 2. Tobacco 3. Illicit and other drugs of dependence 4. Mixed
1. Alcohol
Inclusions
• Alcohol regulation, labelling, control and licensing
• Prevention strategies to encourage low risk alcohol use (as described in NHMRC guidelines) and discourage harmful use
• Formulating alcohol policy
• Social marketing
• Alcohol harm reduction strategies
Exclusions
• Any alcohol interventions programs with treatment of individuals as the major focus
• Activities designated as treatment services
• Services considered primarily of a welfare services nature (for example, night shelters)
• Services considered to be almost entirely providing accommodation and food services (for example, halfway houses)
2. Tobacco
Inclusions
• Formulating tobacco policy
• Social marketing
• Smoke free policies in the workplace
• Policies relating to smoke-free eating places and other public facilities
PREVENTIVE HEALTH: HOW MUCH DOES AUSTRALIA SPEND AND IS IT ENOUGH? 51
• Tobacco control legislation and enforcement
• Quit smoking programs such as Quitline
• Smoking prevention strategies for children and youth
Exclusions
• Activities designated as treatment services
3. Illicit and other drugs of dependence
Inclusions
• Policy and health promotion strategies to discourage illicit drug use
• Social marketing
• Control activity to limit supply and availability for misuse
Exclusions
• Any illicit drug interventions with treatment of individuals as the major focus
• Activities designated as treatment services
• Services considered primarily of a welfare services nature (for example, night shelters)
• Services considered to be almost entirely providing accommodation and food services (for example, halfway houses)
4. Mixed
Inclusions
• Social marketing
• Policy and health promotion strategies to improve behaviour
• Public health activities with regard to poly drug use
Exclusions
• Any anti-drug and alcohol programs with treatment of individuals as the major focus
• Activities designated as treatment services
• Services considered primarily of a welfare services nature (for example, night shelters)
• Services considered to be almost entirely providing accommodation and food services (for example, halfway houses)
52 PREVENTION 1ST
CODE 410 Public health – Public health research
Research and development (R and D) is defined according to the OECD standard as comprising creative work undertaken on a systematic basis in order to increase the stock of knowledge, including knowledge of man, culture and society, and the use of this stock of knowledge to devise new applications. An R and D activity is characterised by originality. It has investigation as a primary objective, the outcome of which is new knowledge, with or without a specific application, or new or improved materials, product, devices, processes or services. R and D ends when work is no longer primarily investigative.
Inclusions
• Communicable disease control research
• Selected health promotion research
• Organised immunisation research
• Environmental health research
• Food standards and hygiene research
• Breast cancer screening research
• Cervical screening research
• Prevention of hazardous and harmful drug use research
• Population health surveys
• Health status research
• Major public health research, which cannot be allocated to one of the above categories
Exclusions
• Public health evaluations
CODE 488 Public health – Other public health
Comprises public health functions not reported to the National Public Health Expenditure Project.
CODE 499 Public health – Not further defined
Comprises public health services that could be a combination of Codes 401 to 410 but which could not be further disaggregated.
PREVENTIVE HEALTH: HOW MUCH DOES AUSTRALIA SPEND AND IS IT ENOUGH? 53
References 1. Australian Institute of Health and Welfare. National health expenditure data cubes - current and
constant prices 1985–86 to 2013–14 [dataset]. Canberra: AIHW; 2014 [cited 2016 May]; Available from: https://reporting.aihw.gov.au/Reports/openRVUrl.do?rsRID=SBIP%3A%2F%2FMETASERVER%2FAIHW%2FReleasedPublic%2FExpenditure%2FReports%2FHEA+national+cube+-+85to14.srx%28Report%29
2. Organisation for Economic Co-operation and Development. OECD Health Statistics 2016: Frequently requested data [dataset]. Paris: OECD; 2016 [updated 2016 October 12; cited 2017 April 20]; Available from: http://www.oecd.org/els/health-systems/health-data.htm
3. Organisation for Economic Co-operation and Development. OECD statistics: Health expenditure and financing [dataset]. Paris: OECD; 2016 [cited 2016 August]; Available from: http://stats.oecd.org/Index.aspx?DataSetCode=SHA
4. Segal L. Developing a strategy for preventative health: a framework. Melbourne: Monash University Centre for Health Economics; 2006.
5. Miller G, Roehrig C, Hughes-Cromwick P, Lake C. Quantifying national spending on wellness and prevention. Adv Health Econ Health Serv Res 2008;19:1-24.
6. de Bekker-Grob EW, Polder JJ, Mackenbach JP, Meerding WJ. Towards a comprehensive estimate of national spending on prevention. BMC Public Health 2007;7:252.
7. Personal communication from AIHW. 8. Vos T, Carter R, Barendregt J, Mihalopoulos C, Veerman L, Magnus A, et al. Assessing cost-effectiveness
in prevention (ACE-Prevention): Final Report. Brisbane: University of Queensland & Melbourne: Deakin University; 2010.
9. McNamara K, Knight A, Livingston M, et al. Targets and indicators for chronic disease prevention in Australia. Australian Health Policy Collaboration, Technical Paper No. 2015-08. Melbourne: AHPC; 2015.
10. Department of Health. Improving outcomes and supporting transparency. Part 2: Summary technical specification of public health indicators. London: Public Health Policy and Strategy Unit; 2016.
11. Russell LM, Rubin GL, Leeder SR. Preventive health reform: what does it mean for public health? Med J Aust 2008;188(12):715-9.
12. Australian Institute of Health and Welfare. Public health expenditure in Australia 2008-09. Health and welfare expenditure series no.43. Cat. no HWE52. Canberra: AIHW; 2011.
13. Organisation for Economic Co-operation and Development. A system of health accounts. Version 1.0. Paris, France: OECD; 2000.
14. Organisation for Economic Co-operation and Development. A system of health accounts: 2011 edition. OECD; 2011 [updated 2011 October 10; cited 2016 July 14]; Available from: http://www.oecd.org/health/health-systems/a-system-of-health-accounts-9789264116016-en.htm
15. Organisation for Economic Co-operation and Development (OECD). OECD Health Statistics 2015: Definitions, sources and methods. OECD; 2015.
16. Australian Institute of Health and Welfare. Immunisations push public health spending up 21%. Canberra: AIHW; 2009 [updated 2009 November 6; cited 2016 April 22]; Available from: http://www.aihw.gov.au/media-release-detail/?id=6442464850
17. Australian Institute of Health and Welfare. Health expenditure Australia 2013-14. Health and welfare expenditure series no. 54. Canberra: AIHW; 2015.
18. Council of Australian Governments. National Partnership Agreement on Preventive Health. Canberra: Commonwealth of Australia; 2008.
19. Australian National Preventive Health Agency (ANPHA). State of Preventive Health 2013. Report to the Australian Government Minister for Health. Canberra: ANPHA; 2013.
20. Council of Australian Governments. Health and Ageing: Reform agenda. Canberra: COAG; n.d. [cited 2016 April 12]; Available from: http://www.federalfinancialrelations.gov.au/content/npa/health/_archive/health_preventive_national_part
nership.pdf 21. Biggs A. Health funding agreements. Canberra: Parliament of Australia; 2014 [updated 2014 May 19;
cited 2016 May 5]; Available from: http://www.aph.gov.au/about_parliament/parliamentary_departments/parliamentary_library/pubs/rp/bud
getreview201415/healthfunding
54 PREVENTION 1ST
22. Moodie R, Tolhurst P, Martin J. Australia’s health: being accountable for prevention. Med J Aust 2016; 206(6):223-5.
23. Australian National Preventive Health Agency (ANPHA). National Preventive Health Research Strategy: Building knowledge for a healthy Australia 2013-2018. Canberra: Commonwealth of Australia; 2013.
24. Australian Institute of Health and Welfare. State and territory health expenditure data cubes 1996−97 to 2013−14 [dataset]. Canberra: AIHW; 2014 [cited 2016 May]; Available from: https://reporting.aihw.gov.au/Reports/openRVUrl.do
25. Forsberg V, Fichtenberg C. The Prevention and Public Health Fund: A Critical Investment in our Nation’s Physical and Fiscal Health. American Public Health Association, Center for Public Health Policy, Issue Brief 2012; 2012.
26. Australian Institute of Health and Welfare (AIHW). Life expectancy. Key indicators of progress of chronic disease and associated determinants. Canberra: AIHW; 2011; Available from: http://www.aihw.gov.au/life-expectancy/
27. Cookson R, Drummond M, Weatherly H. Explicit incorporation of equity considerations into economic evaluation of public health interventions. Health Econ Policy Law 2009;4(Pt 2):231-45.
28. Mooney G. Communitarian claims and community capabilities: furthering priority setting? Soc Sci Med 2005;60(2):247-55.
29. Olsen JA, Richardson J. Preferences for the normative basis of health care priority setting: some evidence from two countries. Health Econ 2013;22(4):480-5.
30. Peacock S, Mitton C, Ruta D, et al. Priority setting in healthcare towards guidelines for the program budgeting and marginal analysis framework. Expert Review of Pharmacoeconomics & Outcomes Research Journal 2010;10:539-52.
31. Hawe P, Shiell A. Preserving innovation under increasing accountability pressures: the health promotion investment portfolio approach. Health Promot J Austr 1995;5:4-9.
32. Gibson J, Mitton C, Martin D, Donaldson C, Singer P. Ethics and economics: does programme budgeting and marginal analysis contribute to fair priority setting? J Health Serv Res Policy 2006;11(1):32-7.
33. Mitton C, Donaldson C. Health care priority setting: principles, practice and challenges. Cost Eff Resour Alloc 2004;2(1):3.
34. Shiell A, McIntosh K. Some economics of health promotion; what we know, don’t know and need to know before deciding how much to spend on promoting the public’s health. Harvard Health Policy Review 2006;7:21-31.
35. McDaid D, Needle J. Economic evaluation of public health: mapping the literature. Cardiff, UK: Report to the Welsh Assembly; 2006.
36. Dalziel K, Segal L, Mortimer D. Review of Australian health economic evaluation - 245 interventions: what can we say about cost effectiveness? Cost Eff Resour Alloc 2008;6:9.
37. Tengs TO, Adams ME, Pliskin JS, Safran DG, Siegel JE, Weinstein MC, et al. Five-hundred life-saving interventions and their cost-effectiveness. Risk Anal 1995;15(3):369-90.
38. Thow AM, Jan S, Leeder S, Swinburn B. The impact of fiscal policy interventions on diets, obesity and chronic disease: a systematic review. Bulletin of the World Health Organization 2010;88:609-14.
39. Schrappe M, Lauterbach K. Systematic review on the cost-effectiveness of public health interventions for HIV prevention in industrialized countries. AIDS 1998;12 Suppl A:S231-8.
40. Schwappach DL, Boluarte TA, Suhrcke M. The economics of primary prevention of cardiovascular disease - a systematic review of economic evaluations. Cost Eff Resour Alloc 2007;5:5.
41. Au F, Prahardhi S, Shiell A. Reliability of two instruments for critical assessment of economic evaluations. Value Health 2008;11(3):435-9.
42. Center for the Evaluation of Value and Risk in Health. Cost-effectiveness analysis registry (CEA registry). Tufts Medical Center; 2013; Available from: http://www.cearegistry.org/
43. Marshall M, Leatherman S, Mattke S, and the members of the OECD Health Promotion, Prevention and Primary Care Panel. Selecting Indicators for the Quality of Health Promotion, Prevention and Primary Care at the Health Systems Level in OECD Countries. OECD Health Technical Papers No. 16.; 2014.
44. Badlands H, Roberts R, Butterworth I, Giles-Corti B. How liveable is Melbourne? Conceptualising and testing urban liveability indicators: progress to date. McCaughey VicHealth Community Wellbeing Unit, University of Melbourne, Research Paper 3; 2015.
45. See for example, CADCA’s Prevent Tobacco Use Toolkit: Sample Intervention Maps. Retrieved from: http://www.preventtobaccouse.org/facts-tools/sample-intervention-maps/ - .WDUZr2XdtoE.
PREVENTIVE HEALTH: HOW MUCH DOES AUSTRALIA SPEND AND IS IT ENOUGH? 55
46. See for example, Air Pollution in Australia: Real-time Air Quality Index Visual Map. Downloaded from: http://aqicn.org/map/australia/ and Use of Community-Based Mapping and Monitoring to Reduce Air Pollution Exposures. Retrieved from: http://www.niehs.nih.gov/research/supported/translational/peph/prog/rta/cfg/phi/index.cfm.
47. Berke EM, Tanski SE, Demidenko E, Alford-Teaster J, Shi X, Sargent JD. Alcohol retail density and demographic predictors of health disparities: a geographic analysis. Am J Public Health 2010;100(10):1967-71.
48. Fraser LK, Clarke GP, Cade JE, Edwards KL. Fast food and obesity: a spatial analysis in a large United Kingdom population of children aged 13-15. Am J Prev Med 2012;42(5):e77-85.
49. Hawe P, Shiell A. Creating demand for a disease prevention and health promotion system. In: Roach R, editor. Alberta’s Energy Legacy: Ideas for the Future. Calgary: Canada West Foundation; 2007.
50. Moran M, Porter D, Curth-Bibb J. Funding Indigenous organisations: improving governance performance through innovations in public finance management in remote Australia. Issues paper no 11. Produced for the Closing the Gap Clearinghouse. Canberra: Australian Institute of Health and Welfare & Melbourne: Australian Institute of Family Studies; 2014.
51. Harris A, Mortimer D. Funding illness prevention ans health promotion in Australia: a way forward. Australia and New Zealand Health Policy 2009;6:25. doi 10.1186/1743-8462-6-25.
52. Segal L, Dalziel K, Mortimer D. Fixing the game: are between-silo differences in funding arrangements handicapping some interventions and giving others a head-start? Health Econ 2010;19(4):449-65.
53. Nutbeam D. Health Promotion Glossary. Geneva: WHO; 1998. 54. National Preventative Health Taskforce. Australia: the healthiest country by 2020 - A discussion paper.
Canberra: Commonwealth of Australia; 2008. 55. World Health Organization. Global forum on chronic diseases prevention and control. Geneva,
Switzerland: WHO; 2017 [cited 2017 February 8]; Available from: http://www.who.int/chp/about/global_forum/en/
56. World Health Organisation: Regional Office for the Eastern Mediterranean. About us: Assessment of essential public health functions. Cairo, Egypt: WHO; 2016 [cited 2016 November 21]; Available from: http://www.emro.who.int/about-who/public-health-functions/health-promotion-disease-prevention.html
57. Organisation for Economic Co-operation and Development. Glossary of statistical terms: Prevention and public health services [homepage on the Internet]. OECD; 2003 [updated 2003 March 11; cited 2016 April 1]; Available from: https://stats.oecd.org/glossary/detail.asp?ID=2106
58. Froom P, Benbassat J. Inconsistencies in the classification of preventive interventions. Prev Med 2000;31(2 Pt 1):153-8.
59. Drummond MF, Sculpher MJ, Torrance GW, O'Brien BJ, Stoddart GL. Methods for the economic evaluation of health care programmes. 3rd ed. New York: Oxford University Press; 2005.
60. World Health Organization. Health systems: Equity. Geneva, Switzerland: WHO; 2017 [cited 2017 February 7]; Available from: http://www.who.int/healthsystems/topics/equity/en/
61. World Health Organisation. Ottawa Charter for health Promotion. Geneva, Switzerland: WHO; 1986; Available from: http://www.who.int/healthpromotion/conferences/previous/ottawa/en/
62. World Health Organization. Health promotion. Geneva, Switzerland: WHO; 2017 [cited 2017 February 8]; Available from: http://www.who.int/topics/health_promotion/en/
63. Kowalczyk GI, Freeland MS, Levit KR. Using marginal analysis to evaluate health spending trends. Health Care Financing Review 1988;10(2):123-9.
64. Folland S. The economics of health and health care. 7th ed. Upper Saddle River, N.J.: Pearson; 2013. 65. Culyer AJ. The dictionary of health economics. 3rd ed. Cheltenham, UK: Edward Elgar Publishing; 2014. 66. Keleher H. Why primary health care offers a more comprehensive approach for tackling health inequities
than primary care. Aust J Prim Health, 2001;7(2):57-61. 67. Starfield B. Primary care: balancing health needs, services and technology. 2nd ed. New York and
Oxford: Oxford University Press; 1998. 68. World Health Organization. Declaration of Alma-Ata. International Conference on Primary Health Care,
Alma-Ata, USSR, 6-12 September 1978. WHO; 1978 [cited 2017 February 7]; Available from: http://www.who.int/publications/almaata_declaration_en.pdf?ua=1
69. Department of Health. National primary health care strategic framework: Primary health care in Australia. Australian Government; 2013 [updated 2013 April; cited 2017 February 6]; Available from: http://www.health.gov.au/internet/publications/publishing.nsf/Content/NPHC-Strategic-Framework~phc-australia

56 PREVENTION 1ST
70. NSW Treasury. Program budgeting and reporting. Sydney: NSW Government; n.d. [cited 2017 March 21]; Available from: http://www.treasury.nsw.gov.au/fmt/governance_and_accountability/resource_management_information
71. Public health in England: The report of the committee of inquiry into the future development of the public health function ("Acheson Report"). London: HMSO; 1988.

PREVENTIVE HEALTH: HOW MUCH DOES AUSTRALIA SPEND AND IS IT ENOUGH? 57
ISBN 978-0-6480852-3-2
![How Much Americans Spend On Their Cars [Infographic]](https://static.fdocuments.in/doc/165x107/55bfd8e5bb61ebd9588b4576/how-much-americans-spend-on-their-cars-infographic.jpg)