How MucH Do I NeeD To PAy My DIgITAl STAff? · How MucH Do I NeeD To PAy My DIgITAl STAff? A joint...
19
AIMIA 2016 Digital Industry Salaries HOW MUCH DO I NEED TO PAY MY DIGITAL STAFF? A joint publication from AIMIA, the digital industry association of Australia and major sponsor S2M Digital Recruitment.
Transcript of How MucH Do I NeeD To PAy My DIgITAl STAff? · How MucH Do I NeeD To PAy My DIgITAl STAff? A joint...

AIMIA 2016 Digital Industry Salaries
How MucH Do I NeeD To PAy My DIgITAl STAff?
A joint publication from AIMIA, the digital industry association of Australia and major sponsor S2M Digital Recruitment.

coNTeNTS
Introduction ....................................................................................................................................................... 3
Research Methodology .............................................................................................................................. 3
Acknowledgements .................................................................................................................................... 3
Key findings ................................................................................................................................................... 4
Detailed findings ........................................................................................................................................... 6
Salaries ............................................................................................................................................................. 14
Definitions ........................................................................................................................................................ 18

INTRoDucTIoNDetermining how much to pay digital professionals is a challenge faced by all employers. Market rates are always a key indicator of an appropriate salary, but are often difficult to determine, particularly across multiple job categories.
In November of 2015, AIMIA – The Digital Industry Association of Australia, in conjunction with S2M Digital Recruitment, conducted an extensive survey of people working in the Australian digital industry. Covering all major digital job categories, sectors and locations, the study provides a timely insight into salary bands, propensity to change employers, and the percentage increase required to consider changing jobs. The purpose of this report is to provide AIMIA members with a benchmarked study on the current salary bands for key digital professionals and to identify significant relevant trends in the market.
Reporting and analysis of the survey results were conducted by ShopScience Pty Ltd. Please note that all data in this report should be treated as indicative only, and that the findings should only be treated as a guide to actual salaries, and that individual salaries and salary expectations will vary depending on a wide range of factors.
ReSeARcH MeTHoDology
AcKNowleDgeMeNTS
Research was conducted via an online survey promoted through AIMIA’s members, subscriber data-base and social media channel during October 2015.
In total, 507 respondents took part in the survey although not all respondents completed all questions. Data collected included information regarding salary and position, respondent profile, years employed, team size and company profile.
The survey data was then compiled and validated before charts and tables were analysed.
AIMIA would like to thank all those who invested their valuable time to complete the 2016 AIMIA Digital Industry Salary.
David Jackson & Rebecca Coram – S2M Digital Recruitment s2m.com.au
Mark Fletcher – Shopscience shopscience.com.au
Katherine Mc Pherson – Hunterbox thehunterbox.com.au
John Ford – The One Centre theonecentre.com
3

Key fINDINgSMedian salaries
• Across the digital industry, median salaries are approximately 10% higher in Sydney than in Melbourne and other locations.
• There appears to be little difference in overall salaries when compared by employment type (e.g. contractor, full-time, part-time) indicating the industry is quite flexible about employment arrangements.
• At $200,000, the median salary of senior digital executives is much higher than for all of the other digital job categories. Senior digital executives are typically involved in major strategic digital initiatives such as transformation, and often report through to the organisation’s CEO and board. Taking out Senior Digital Executives the media of other digital positions was around $100,000. The median salary for eCommerce roles was $120,000, ranging through to social media roles that had a median of $75,000. • Digital employees in not-for-profit organisations typically have a lower median salary compared to those in other sectors.
Propensity to change employer
• The overall data shows a highly mobile market where employees can job hop to more responsibility and pay very easily, given a clear talent shortage, as identified in AIMIA’s Digital Demand Survey in April 2015.
• Digital professionals in Sydney and Melbourne are much more likely to change employers. 87% of Melbourne and 83% of the Sydney digital community are open to changing employees. This contrasted with just 65% in all other areas of Australia.
• An average of 15.5% of digital professionals would move for 10% or less incremental salary in Melbourne and Sydney, compared to 10% of digital professionals in other areas of Australia. However, 55% of digital professionals would move for 20% or less in Melbourne and Sydney, compared to 48% in other areas of Australia. Finally, for an increase in salary of 30%, 75% of digital professionals would move in Melbourne and Sydney, compared to 90% in other areas. Overall this suggests a highly mobile workforce in high demand.
• Overall, client service digital professionals are most open to changing jobs, with data analysts and strategy professionals the least likely.
• eCommerce professionals may be less satisfied with their current employers with 30% open to changing employers for as little as a 1-10% salary increase.
• Digital professionals working in not-for-profits are the least likely to be open to changing jobs, though a relatively high proportion (25%) would change for a 1-10% salary increase.
4
Key fINDINgSFocus on female digital professionals
• Across all digital professionals, the median salary for females was 15% lower than for males. Males averaged $101,000, while the median salary for females is only $85,000.
• The median salary differences are apparent in many of the digital professional job categories, with the largest discrepancies in the “soft skills” of sales and client service.
• Females represent 42% of the workforce in digital professions. This compares to just over 50% for all industries*.
Employers prefer “Ready Made” digital professionals
• Almost 70% of digital professionals are aged between 26 and 40, which highlights a young and vibrant industry, but interestingly only 8% of the workforce are between 18-25. We think this indicates the unwillingness of the industry to take on trainee or less experienced staff in digital roles.
• Supporting the focus on skilled labour preferences for the digital industry, 457 visas represent 10% of the digital industry workforce, which is 10 times the average for all other industries.
• In terms of education, 78% of respondents hold a bachelor degree or higher.
Career drivers
• By far, the major career driver is career progression at 45% followed by money (17%). This again supports an industry that has more demand than supply resulting in opportunities for digital professionals to progress to higher roles and money within and across employers very easily. This imbalance in supply and demand means that the industry is overpaying for experienced talent rather than growing supply through systemic training of young workforce entrants or importantly cross skilling existing staff already employed in the workforce but not in digital.
Where are digital professionals employed?
• The private sector employs over 81% of professionals (4% of these are digital start-ups) in the digital industry. 17% are in the public sector and 2% in not for profit.
• Digital agencies only account for 23% of people employed. 29% work in digital media. 14% within IT/vendors. 32% of now work in corporations or businesses. We see this trend increasing as more and more businesses transform to digital as an operational function within businesses and therefore taking more functions in-house.
• Over 73% of digital professionals are employed in digital teams of less than 15 people. However, 5% are now employed in teams of over 500 indicating how some larger businesses are transforming the way they operate (e.g. banks) and how the digital agency business is consolidating into larger businesses (e.g. Deloitte Digital)
*Source: Workplace Gender Equality Agency (WGEA) 2015
5

DeTAIleD fINDINgS
Median Salary VariationsLocation differences
Across the digital industry, median salaries are approximately 10% higher in Sydney than in Melbourne and other locations. In Sydney the median base is $100,000, whereas in Melbourne it is $90,000 and in other areas, $87,500.
Organisation sector and job category differences
The similar prorata salaries of full-time, contract and part-time employees suggests that the industry is open to flexible working conditions. It is noticeable, however, that digital employees in not-for-profit organisations typically have lower median salaries.
6
DeTAIleD fINDINgS
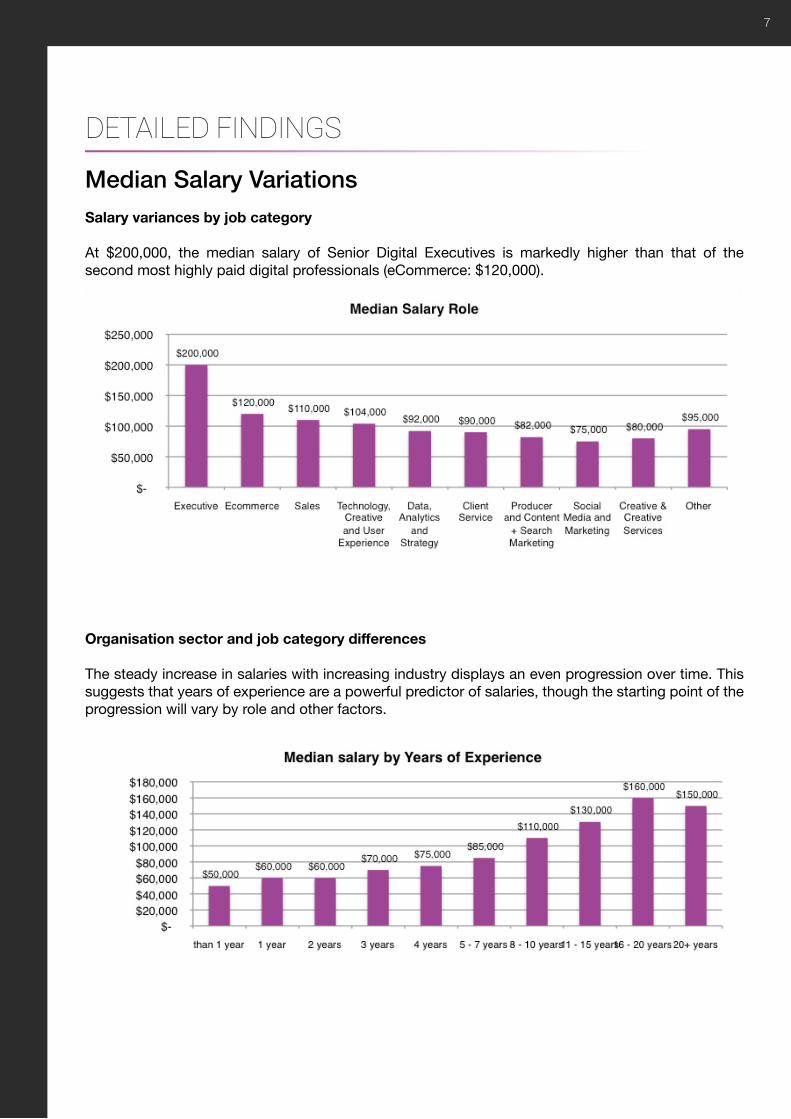
Median Salary VariationsSalary variances by job category
At $200,000, the median salary of Senior Digital Executives is markedly higher than that of the second most highly paid digital professionals (eCommerce: $120,000).
Organisation sector and job category differences
The steady increase in salaries with increasing industry displays an even progression over time. This suggests that years of experience are a powerful predictor of salaries, though the starting point of the progression will vary by role and other factors.
7

DeTAIleD fINDINgS
Propensity to Change EmployersLocation Differences
Digital professionals in Sydney (83%) and Melbourne (84%) are much more likely to be interested in changing employers, compared to other areas (65%). In Melbourne and Sydney, an average 15.5% of digital professionals would move for 10% or less incremental salary compared to 10% of digital professionals in other areas of Australia.
Job category differences
Overall, Social Media/Marketing (94%) digital professionals are most open to changing jobs, closely followed by Data Analysts and Strategy professionals (91%). This reflects the high demand for these skill sets.
8

DeTAIleD fINDINgS
Propensity to Change EmployersJob category differences
eCommerce professionals may be less satisfied with their current employers as 30% of professionals will move for less than 10% higher salary, and 80% will move for more than 20%.
9

DeTAIleD fINDINgS
Propensity to Change EmployersWork sector differences
Digital professionals working in not-for-profits are the least likely to be open to changing jobs, though a relatively high proportion (25%) would change for a 1-10% salary increase.
10

DeTAIleD fINDINgS
Focus on Female Digital ProfessionalsWhile digital professionals are at the forefront of technological developments, they may still be some way from achieving gender equality. On average women are paid 15% less compared to men.
Across all digital professionals, the median salary for males is $101,000, while the median salary for females is only $85,000. On other key measures, including whether they are open to changing employers, or what percentage increase in salary would be required for them to consider changing employers, the differences between males and females are marginal.
Salary differences by job categoryThe median salary differences are apparent in many of the digital professional job categories, with the largest discrepancies in the “soft skills” of Sales and Client Service.
Median Salaries Digital Professional job categories Males Females Differential
Sales $120,000 $75,000 $45,000 Client Service $110,000 $85,000 $25,000
Gender representation differences Females represent 42% of the workforce in digital professions. This compares to just over 50% for all industries2. This suggests that women still have some room to increase their presence in roles across the digital industry such as in development and project management areas.
2Source: Workplace Gender Equality Agency (WGEA)2015
11

DeTAIleD fINDINgS
Employers Prefer “Ready Made” digital professionalsThe following chart illustrates that the digital industry is centred on people 26-40, with over 70% in that range. Interestingly, just 8% of the workforce is under 25, and conversely 8% of the workforce is over 46. This comparison may indicate that the industry is not focussed on supporting either young inexperienced people or older workers, and instead prefers prime experience employees. Both of these scenarios can work to create a shortage of employees leading to higher salaries being paid for experienced people in the industry - especially when the overall digital employment market is in growth. These figures highlight the problem the industry has in creating mechanisms to attract people to the industry straight out of school and also in cross-training older workers into the digital roles.
The Australian digital industry continues to show high numbers of 457 visa employees with 10% of workers on temporary work or working holiday visas. This is compared to the national average of around 1%. Cumulatively, these results highlight the significant shortage of digitally skilled Australians in the industry and the preference the industry has for immediately skilled resources rather than a training/development approach.
Australian Citizen 74%
Australian Permanent Resident 16%
Temporary Work Visa/Working Holiday Visa 10%
In terms of levels of education, 78% of survey respondents in the digital industry are university educated which is consistent with the previously mentioned indications that the industry has a preference for skilled professionals. These statistics may also correlate with the low proportions of industry professionals outside of the 25-44 year age bracket.
Bachelor 74%
Diploma or less 22%
Masters or PHD 20%
12

DeTAIleD fINDINgS
Employers Prefer “Ready Made” digital professionalsCareer drivers
By far, the major career driver is career progression at 45% of respondents followed by money (17%). This again supports an industry that has more demand than supply resulting in opportunities for digital professionals to progress to higher roles and money within and across employers very easily. This imbalance in supply and demand means that the industry is overpaying for experienced talent rather than growing supply through systemic training of young workforce entrants or importantly cross skilling existing staff already employed in the workforce but not in digital.
People in the industry are also motivated by a positive progressive culture and a passion to do quality work, indicating it’s a vibrant competitive and hardworking industry.
Where are digital professionals employed?
The private sector dominates as the major employer of digital professionals, though the types of organisations that employ digital professionals are quite evenly spread across three main categories. Corporations are showing increased propensity to employ digital professionals in-house, however, digital agencies and design consultancies still employ a significant number of digital professionals. Media and publishing are also active employers given the level of disruption that the media industry has gone though over the last ten years.
Career Progression 45%
Money 17%
Culture 16%
Passion, Achievement, Quality of Work 13% Work/Life Balance, Flexibility 6%
Other 3%
Private Sector 77%
Public Sector 17%
Not-for-profit 2%
Start up 4%
Corporations/ Businesses 32%
Media Publishing/ Adv 29%
Digital Agency / Design/ Adv 23%
Education/ Training 2% IT/ Tech Vendors 14%
13
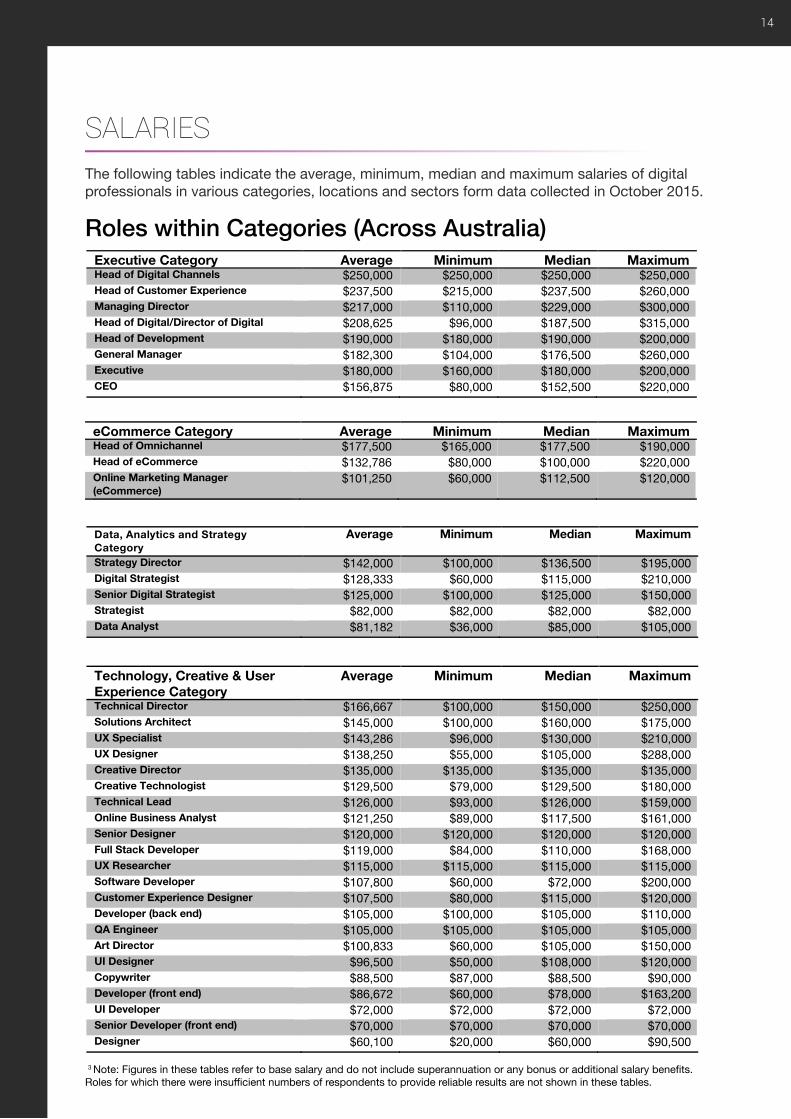
SAlARIeSThe following tables indicate the average, minimum, median and maximum salaries of digital professionals in various categories, locations and sectors form data collected in October 2015.
Roles within Categories (Across Australia)Executive Category Average Minimum Median Maximum Head of Digital Channels $250,000 $250,000 $250,000 $250,000 Head of Customer Experience $237,500 $215,000 $237,500 $260,000 Managing Director $217,000 $110,000 $229,000 $300,000 Head of Digital/Director of Digital $208,625 $96,000 $187,500 $315,000 Head of Development $190,000 $180,000 $190,000 $200,000 General Manager $182,300 $104,000 $176,500 $260,000 Executive $180,000 $160,000 $180,000 $200,000 CEO $156,875 $80,000 $152,500 $220,000 eCommerce Category Average Minimum Median Maximum Head of Omnichannel $177,500 $165,000 $177,500 $190,000 Head of eCommerce $132,786 $80,000 $100,000 $220,000 Online Marketing Manager (eCommerce)
$101,250 $60,000 $112,500 $120,000
Data, Analytics and Strategy Category
Average Minimum Median Maximum
Strategy Director $142,000 $100,000 $136,500 $195,000 Digital Strategist $128,333 $60,000 $115,000 $210,000 Senior Digital Strategist $125,000 $100,000 $125,000 $150,000 Strategist $82,000 $82,000 $82,000 $82,000 Data Analyst $81,182 $36,000 $85,000 $105,000
Technology, Creative & User Experience Category
Average Minimum Median Maximum
Technical Director $166,667 $100,000 $150,000 $250,000 Solutions Architect $145,000 $100,000 $160,000 $175,000 UX Specialist $143,286 $96,000 $130,000 $210,000 UX Designer $138,250 $55,000 $105,000 $288,000 Creative Director $135,000 $135,000 $135,000 $135,000 Creative Technologist $129,500 $79,000 $129,500 $180,000 Technical Lead $126,000 $93,000 $126,000 $159,000 Online Business Analyst $121,250 $89,000 $117,500 $161,000 Senior Designer $120,000 $120,000 $120,000 $120,000 Full Stack Developer $119,000 $84,000 $110,000 $168,000 UX Researcher $115,000 $115,000 $115,000 $115,000 Software Developer $107,800 $60,000 $72,000 $200,000 Customer Experience Designer $107,500 $80,000 $115,000 $120,000 Developer (back end) $105,000 $100,000 $105,000 $110,000 QA Engineer $105,000 $105,000 $105,000 $105,000 Art Director $100,833 $60,000 $105,000 $150,000 UI Designer $96,500 $50,000 $108,000 $120,000 Copywriter $88,500 $87,000 $88,500 $90,000 Developer (front end) $86,672 $60,000 $78,000 $163,200 UI Developer $72,000 $72,000 $72,000 $72,000 Senior Developer (front end) $70,000 $70,000 $70,000 $70,000 Designer $60,100 $20,000 $60,000 $90,500 3 Note: Figures in these tables refer to base salary and do not include superannuation or any bonus or additional salary benefits.
Roles for which there were insufficient numbers of respondents to provide reliable results are not shown in these tables.
14

SAlARIeS
Roles within Categories (Across Australia)Social Media, Search & Marketing Category
Average Minimum Median Maximum
Digital Channel Manager $227,000 $227,000 $227,000 $227,000 Digital Optimisation Manager $145,000 $145,000 $145,000 $145,000 Brand Manager $99,429 $60,000 $80,000 $190,000 Community Manager $95,000 $95,000 $95,000 $95,000 Marketing Manager $89,600 $52,000 $80,000 $160,000 Digital Marketing Manager $85,545 $55,000 $70,000 $165,000 Social Media and Marketing $84,300 $75,000 $84,300 $93,600 Search Marketing $83,000 $49,000 $80,000 $140,000 Product Manager $82,500 $82,500 $82,500 $82,500 Marketing Specialist $73,375 $50,000 $67,500 $140,000 Social Media Manager $69,250 $45,000 $66,000 $100,000 Digital Content Editor $63,750 $45,000 $65,000 $80,000 Digital Content Manager $53,500 $47,000 $53,500 $60,000
Client Service Category Average Minimum Median Maximum Client Services Director $137,500 $85,000 $150,000 $180,000 Group Account Director $131,667 $120,000 $135,000 $140,000 Account Director $99,556 $85,000 $95,000 $120,000 Senior Account Manager $84,500 $65,000 $81,500 $110,000 Account Manager $73,400 $65,000 $72,500 $85,000 Account Coordinator $66,000 $57,000 $66,000 $75,000 Sales Category Average Minimum Median Maximum Sales Director $162,600 $105,000 $200,000 $200,000 Sales $160,000 $160,000 $160,000 $160,000 Sales Executive $126,250 $55,000 $135,000 $180,000 Business Development Manager $103,818 $70,000 $115,000 $145,000 Senior Account Manager $95,375 $75,000 $98,250 $110,000 Account Executive $90,000 $90,000 $90,000 $90,000 Account Coordinator $72,880 $50,000 $77,000 $90,000 Producer and Content Category - Australia
Average Minimum Median Maximum
Executive Producer $137,000 $137,000 $137,000 $137,000 Production Director $115,000 $110,000 $115,000 $120,000 Senior Producer $95,500 $91,000 $95,500 $100,000 Content Producer $93,692 $40,000 $82,000 $173,000 Project Manager $83,000 $60,000 $71,000 $130,000 Producer $79,400 $60,000 $80,000 $100,000
Creative and Creative Services Average Minimum Median Maximum Creative & Creative Services $80,605 $45,000 $80,000 $130,000
15
SAlARIeS
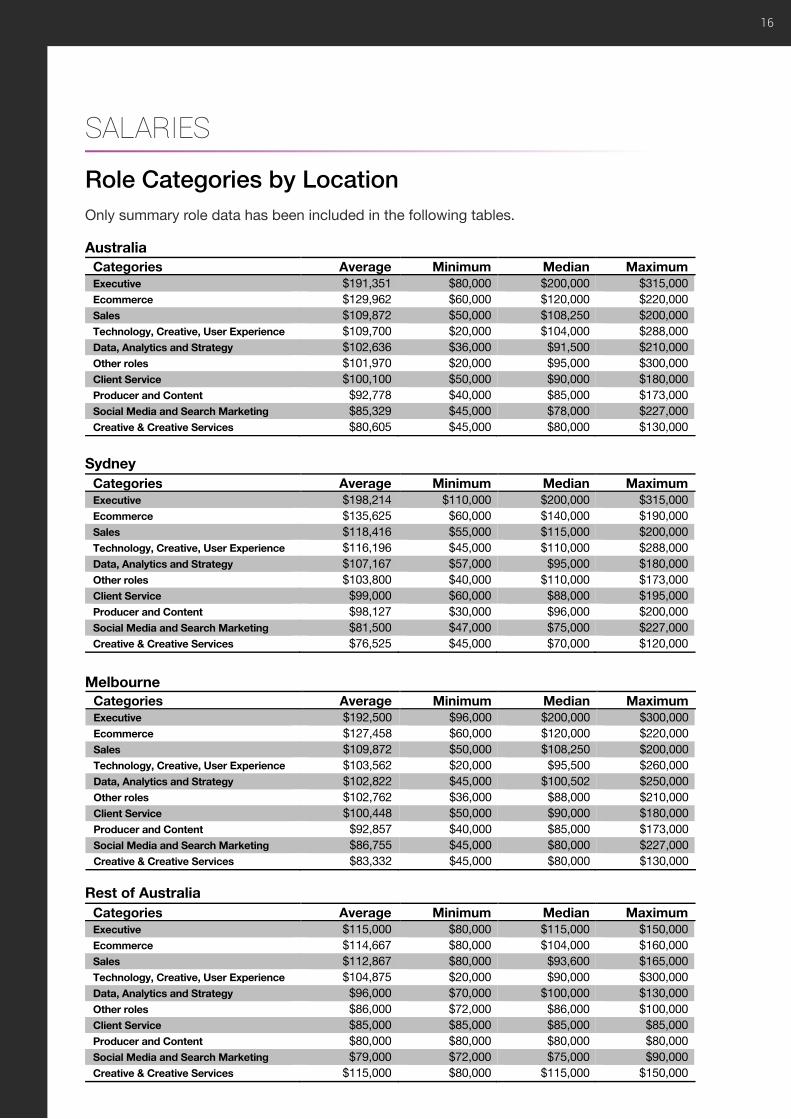
Role Categories by LocationOnly summary role data has been included in the following tables.
Australia
Sydney
Melbourne
Rest of Australia
Categories Average Minimum Median Maximum Executive $191,351 $80,000 $200,000 $315,000 Ecommerce $129,962 $60,000 $120,000 $220,000 Sales $109,872 $50,000 $108,250 $200,000 Technology, Creative, User Experience $109,700 $20,000 $104,000 $288,000 Data, Analytics and Strategy $102,636 $36,000 $91,500 $210,000 Other roles $101,970 $20,000 $95,000 $300,000 Client Service $100,100 $50,000 $90,000 $180,000 Producer and Content $92,778 $40,000 $85,000 $173,000 Social Media and Search Marketing $85,329 $45,000 $78,000 $227,000 Creative & Creative Services $80,605 $45,000 $80,000 $130,000
Categories Average Minimum Median Maximum Executive $198,214 $110,000 $200,000 $315,000 Ecommerce $135,625 $60,000 $140,000 $190,000 Sales $118,416 $55,000 $115,000 $200,000 Technology, Creative, User Experience $116,196 $45,000 $110,000 $288,000 Data, Analytics and Strategy $107,167 $57,000 $95,000 $180,000 Other roles $103,800 $40,000 $110,000 $173,000 Client Service $99,000 $60,000 $88,000 $195,000 Producer and Content $98,127 $30,000 $96,000 $200,000 Social Media and Search Marketing $81,500 $47,000 $75,000 $227,000 Creative & Creative Services $76,525 $45,000 $70,000 $120,000
Categories Average Minimum Median Maximum Executive $192,500 $96,000 $200,000 $300,000 Ecommerce $127,458 $60,000 $120,000 $220,000 Sales $109,872 $50,000 $108,250 $200,000 Technology, Creative, User Experience $103,562 $20,000 $95,500 $260,000 Data, Analytics and Strategy $102,822 $45,000 $100,502 $250,000 Other roles $102,762 $36,000 $88,000 $210,000 Client Service $100,448 $50,000 $90,000 $180,000 Producer and Content $92,857 $40,000 $85,000 $173,000 Social Media and Search Marketing $86,755 $45,000 $80,000 $227,000 Creative & Creative Services $83,332 $45,000 $80,000 $130,000
Categories Average Minimum Median Maximum Executive $115,000 $80,000 $115,000 $150,000 Ecommerce $114,667 $80,000 $104,000 $160,000 Sales $112,867 $80,000 $93,600 $165,000 Technology, Creative, User Experience $104,875 $20,000 $90,000 $300,000 Data, Analytics and Strategy $96,000 $70,000 $100,000 $130,000 Other roles $86,000 $72,000 $86,000 $100,000 Client Service $85,000 $85,000 $85,000 $85,000 Producer and Content $80,000 $80,000 $80,000 $80,000 Social Media and Search Marketing $79,000 $72,000 $75,000 $90,000 Creative & Creative Services $115,000 $80,000 $115,000 $150,000
16

SAlARIeS
Role Categories by Major SectorsOnly summary role data has been included in the following tables.
Private Sector
Public Sector
Categories Average Minimum Median Maximum Executive $192,793 $96,000 $200,000 $300,000 Ecommerce $140,500 $80,000 $120,000 $220,000 Sales $116,000 $60,000 $108,000 $200,000 Technology, Creative, User Experience $108,679 $45,000 $100,502 $288,000 Data, Analytics and Strategy $108,556 $60,000 $97,500 $210,000 Other roles $103,242 $36,500 $95,000 $300,000 Client Service $101,250 $50,000 $91,000 $180,000 Producer and Content $90,947 $40,000 $80,000 $137,000 Social Media and Search Marketing $84,411 $45,000 $75,000 $227,000 Creative & Creative Services $78,087 $45,000 $70,000 $130,000
Categories Average Minimum Median Maximum Executive $230,333 $140,000 $236,000 $315,000 Ecommerce $121,667 $100,000 $105,000 $160,000 Sales $117,533 $50,000 $110,000 $250,000 Technology, Creative, User Experience $106,694 $30,000 $95,500 $260,000 Data, Analytics and Strategy $98,250 $45,000 $91,000 $165,000 Other roles $96,714 $60,000 $85,000 $173,000 Client Service $89,333 $80,000 $88,000 $100,000 Producer and Content $84,700 $50,000 $77,000 $130,000 Social Media and Search Marketing $84,000 $83,000 $84,000 $85,000 Creative & Creative Services $80,400 $50,000 $80,000 $100,000
17

DefINITIoNS
Role Categories by Major SectorsMinimumThe minimum refers to the lowest salary recorded in this study for that particular role.
MedianThe “middle” observation in a set of data arranged in sequence. 50% of the data is below this point, and 50% of the data is above this point. To pay at the “median” point of the range is to be in the “middle” of the market.
MaximumThe maximum refers to the highest salary recorded in this study for that particular role.
Salary packageNote that figures appearing in the survey for “salary” are based on base salary not including superannuation. For most positions, superannuation at 9.5% will be needed to arrive at gross salary. More senior roles may have a bonus component, vehicle, car parking or other benefits in addition to salary plus superannuation, but these have not been included here.
Average versus meanThe average or mean is calculated by adding all the values together, and then dividing the total by the number in the sample. The average is probably the most well known statistic to most people, but is not often used for remuneration benchmarking purposes because it is easily influenced by either a few very high or very low values. The reasons for this are explained in the next section.
Median or average?As has been mentioned, many companies seek to benchmark their remuneration around the middle of the market, and the median, rather than the average, is the best indicator of this. Why is this so? The answer lies in the shape of most remuneration distributions, irrespective of the job being surveyed. Charts A and B illustrate this point quite well.
Chart A shows a symmetrical shape called the normal curve, and in this case, the median is the same value as the average. On the other hand, most remuneration distributions look like Chart B – there are a few very high values, but most of the values cluster in the lower end.
In such cases, the average is a few thousand dollars higher than the median, and is clearly higher than the “middle of the market”. If the average is much lower than the median, it means that there are a few very low values in the sample – either way, the median is a more stable statistic to use for salary benchmarking purposes.
18

A joint publication from AIMIA, the digital industry association of Australia and major sponsor S2M Digital Recruitment.