How Green Roofs and Cool Roofs Can Reduce Energy Use
33
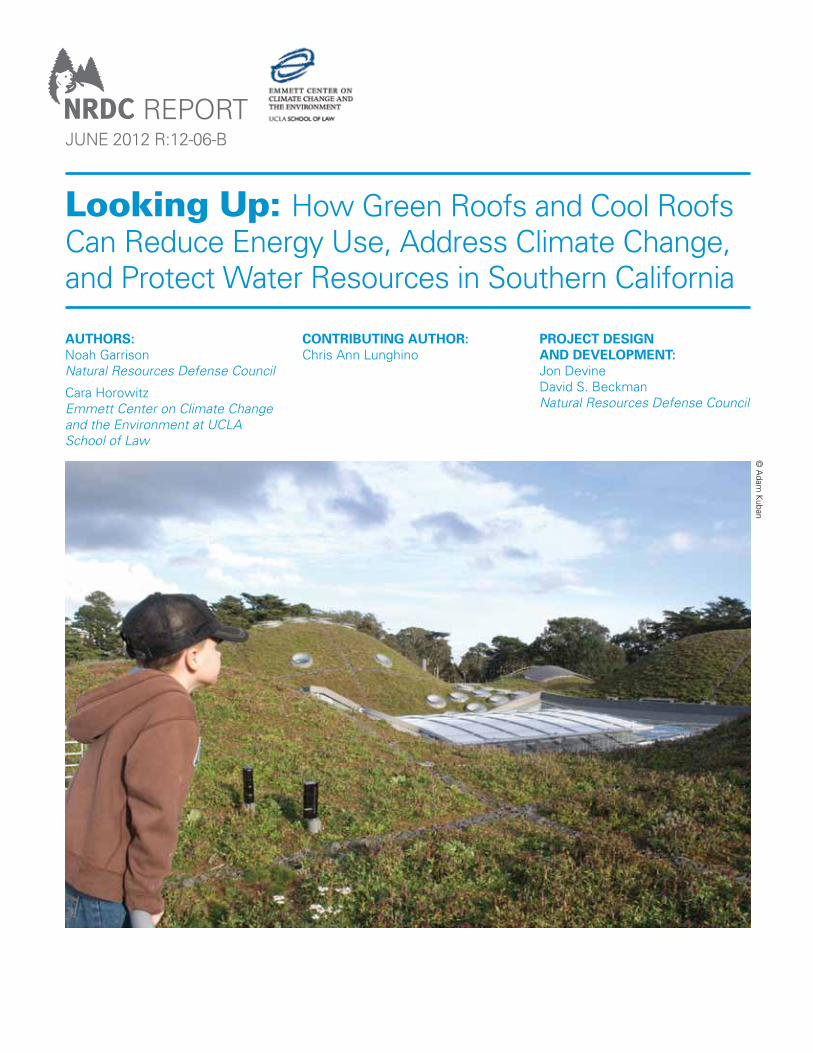
AUTHORS: Noah Garrison Natural Resources Defense Council Cara Horowitz Emmett Center on Climate Change and the Environment at UCLA School of Law CONTRIBUTING AUTHOR: Chris Ann Lunghino PROJECT DESIGN AND DEVELOPMENT: Jon Devine David S. Beckman Natural Resources Defense Council Looking Up: How Green Roofs and Cool Roofs Can Reduce Energy Use, Address Climate Change, and Protect Water Resources in Southern California REPORT JUNE 2012 R:12-06-B © Adam Kuban
Transcript of How Green Roofs and Cool Roofs Can Reduce Energy Use
Authors:Noah Garrison Natural Resources Defense Council
Cara Horowitz Emmett Center on Climate Change and the Environment at UCLA School of Law
Contributing Author:Chris Ann Lunghino
ProjeCt Design AnD DeveloPment:Jon DevineDavid S. BeckmanNatural Resources Defense Council
Looking Up: How Green Roofs and Cool Roofs Can Reduce Energy Use, Address Climate Change, and Protect Water Resources in Southern California
REPoRtJUNE 2012 R:12-06-B
© A
dam K
uban
About nrDCThe Natural Resources Defense Council (NRDC) is an international nonprofit environmental organization with more than 1.3 million members and online activists. Since 1970, our lawyers, scientists, and other environmental specialists have worked to protect the world’s natural resources, public health, and the environment. NRDC has offices in New York City, Washington, D.C., Los Angeles, San Francisco, Chicago, Livingston, Montana, and Beijing. Visit us at www.nrdc.org.
About the emmett Center on Climate Change and the environmentFounded in 2008 with a generous gift from Dan A. Emmett and his family, the Emmett Center was established at UCLA School of Law as the nation's first law school center focused exclusively on climate change. The Emmett Center is dedicated to studying and advancing law and policy solutions to the climate change crisis and to training the next generation of leaders in creating these solutions. The Center works across disciplines to develop and promote research and policy tools useful to decision-makers locally, statewide, nationally, and beyond. Cara Horowitz is the Andrew Sabin Family Foundation executive director of the Center. More information is available at www.law.ucla.edu/emmett.
AcknowledgementsNRDC would like to acknowledge and thank: Environment Now, the Sidney E. Frank Foundation, the Pisces Foundation, the Resources Legacy Fund, and the TOSA Foundation for their generous support of our work.
Cara Horowitz would like to acknowledge and thank all of the groundbreaking supporters of the Emmett Center on Climate Change and the Environment at UCLA School of Law, including especially Dan and Rae Emmett, the Andrew Sabin Family Foundation, Ralph and Shirley Shapiro, and Anthony and Jeanne Pritzker, whose vision and funding have made possible much of this work.
This report received substantial input and review from a number of individuals. Their participation contributed greatly to the quality of the report and its conclusions and recommendations. We acknowledge that they may not necessarily endorse all of the report’s recommendations. In particular, the authors wish to thank our peer reviewers: Kirstin Weeks, Arup; Haley Gilbert, Lawrence Berkeley National Laboratory; Dr. Ronnen Levinson, Lawrence Berkeley National Laboratory; Dr. Stuart Gaffin, Center for Climate Systems Research, Columbia University; and Angelica Pasqualini, Center for Climate Systems Research, Columbia University. The authors would like to thank Alexandra Kennaugh for managing the production of the report, and Sue Rossi for the design and production. The authors would also like to thank Aubrey Dugger, GreenInfo; Anna Berzins; Dr. Arthur C. Nelson, University of Utah; Mark Grey and Andy Henderson, Building Industry Association of Southern California; Mark Greninger, County of Los Angeles; and their colleagues Becky Hammer, Karen Hobbs, Larry Levine, Alisa Valderrama, Kaid Benfield, Amanda Eaken, and Meg Waltner for their expertise and guidance.
NRDC Director of Communications: Phil GutisNRDC Deputy Director of Communications: Lisa GoffrediNRDC Publications Director: Alex KennaughDesign and Production: Sue Rossi
© Natural Resources Defense Council 2012
PAge 1 | looking up
executive summary ....................................................................................................................................................................... 2
introduction .................................................................................................................................................................................... 4
environmental Challenges ............................................................................................................................................................. 5
benefits of green roofs and Cool roofs .................................................................................................................................... 12
Conclusion and Policy recommendations ................................................................................................................................. 20
Appendix A .................................................................................................................................................................................... 27
Appendix b .................................................................................................................................................................................... 30
tAble of Contents
PAge 2 | looking up
exeCutive summAry
Southern California faces multiple threats stemming from the expansion of
our urban and suburban environment. First, urbanization and development
transform landscapes into impervious surfaces, increasing the volume of
runoff that results from precipitation. More runoff means more pollution carried
by stormwater to our rivers, lakes, and beaches. Second, climate change, brought
about in part by increased energy use, threatens our water supply, particularly the
availability of freshwater resources like the Sierra snowpack, jeopardizes progress in
air quality, and endangers human health. Third, dark impervious surfaces in our cities
absorb and radiate heat back into the surrounding atmosphere at a far greater rate
than the natural landscape does, causing a heat island effect that raises ambient air
temperatures in developed areas, resulting in human health problems and additional
energy use for building cooling. Green roofs and cool roofs offer the potential to
address many of these issues and improve the sustainability of urban areas in
Southern California.
Green roofs and cool roofs can help protect water resources adversely impacted by climate change by reducing electricity usage, improving air quality, and shrinking our carbon footprint. Green roofs can also greatly reduce the volume of stormwater runoff from rainfall events, helping to keep California’s coastal and inland waters clean. Together, these smart roofing practices can provide many benefits:
n Green Roofs and cool roofs can save energy, reduce neighborhood temperatures, and protect human health. They have a strong regulating effect on the temperature of underlying roof surfaces and building interiors, reducing the energy needed for building cooling and the effects of the urban heat island effect.
The plants and growing medium of a green roof provide shade, thermal mass, and evaporative cooling that reduces temperatures on the roof surface and in the building interior below. While temperatures on the surface of a conventional dark roof may exceed those of ambient air by 90°F (50°C) or more on a hot, sunny day, with much of the heat transferred into the building’s interior, the temperature of a green roof may actually be cooler than the surrounding ambient air. Though results
have varied, studies have found that green roofs can reduce the energy needed for building cooling on the floor below the roof by upwards of 50 percent.
Cool roofs use reflective materials, often but not always light colored, to reflect more of the sun’s energy than traditional dark roofs, and to more efficiently transmit heat from the building’s interior. Compared to conventional dark roofs, the surface of a cool roof can be 50° to 60°F (28° to 33°C) cooler on a hot, sunny day. Studies have found that cool roofs can produce a similar savings in building cooling energy demand as green roofs.
n Green roofs can also protect our waters from pollution. They have substantial capacity to both absorb and delay rainfall runoff, reducing the volume of rainfall runoff and pollutants that flow to California’s rivers, lakes, and beaches. A green roof with a three- to four-inch soil layer can generally absorb between one-half to one inch of rainfall from a given storm event. Even when saturated, green roofs can substantially delay runoff, reducing flooding and erosion.
PAge 3 | looking up
© W
illiam M
cDonough +
Partners
This paper looks at the many benefits of green roofs and cool roofs for our communities and quantifies some of those benefits, including building cooling energy savings, greenhouse gas emissions reductions, and, for green roofs, stormwater volume reduction. The analysis shows that if green roofs or cool roofs were installed on 50 percent of the existing roof surfaces in urbanized Southern California, the resulting direct energy savings from reduced building cooling energy use could be up to 1.6 million megawatt-hours per year, saving residents up to $211 million in electricity costs and reducing greenhouse gas emissions by up to 465 thousand metric tons of CO
2 equivalent annually. Even
considering the installation of green roofs and cool roofs on new construction and redevelopment only, using these roof types could result in savings of up to one million megawatt-hours per year by 2035 (corresponding to $131 million in saved electricity costs based on 2012 rates), and greenhouse gas emissions reductions of up to 288 thousand metric tons of CO
2 equivalent annually.
Green roofs absorb and evaporate or transpirate rainfall, and therefore can reduce stormwater runoff in Southern California by tens of billions of gallons each year. If green roofs were installed on 50 percent of existing roof surfaces in Southern California, stormwater runoff would be reduced by more than 36 billion gallons per year. Even if green roofs were installed only on 50 percent of new and redevelopment projects, by 2035, runoff could be reduced by 20 billion gallons annually, with a substantial reduction in the volume of pollution reaching our local waters.
The scale of these benefits is truly impressive and justifies a much more aggressive set of policies and incentives to help advance the adoption of green roofs and cool roofs in our region. Municipalities and counties should provide guidance and incentives for residential and commercial private party installations of green roofs and cool roofs to increase their use in our communities. To promote the use of green roofs in particular, municipalities and counties should adopt strong standards for stormwater pollution controls that require the on-site retention of runoff through use of practices like green roofs that stop stormwater runoff at its source.
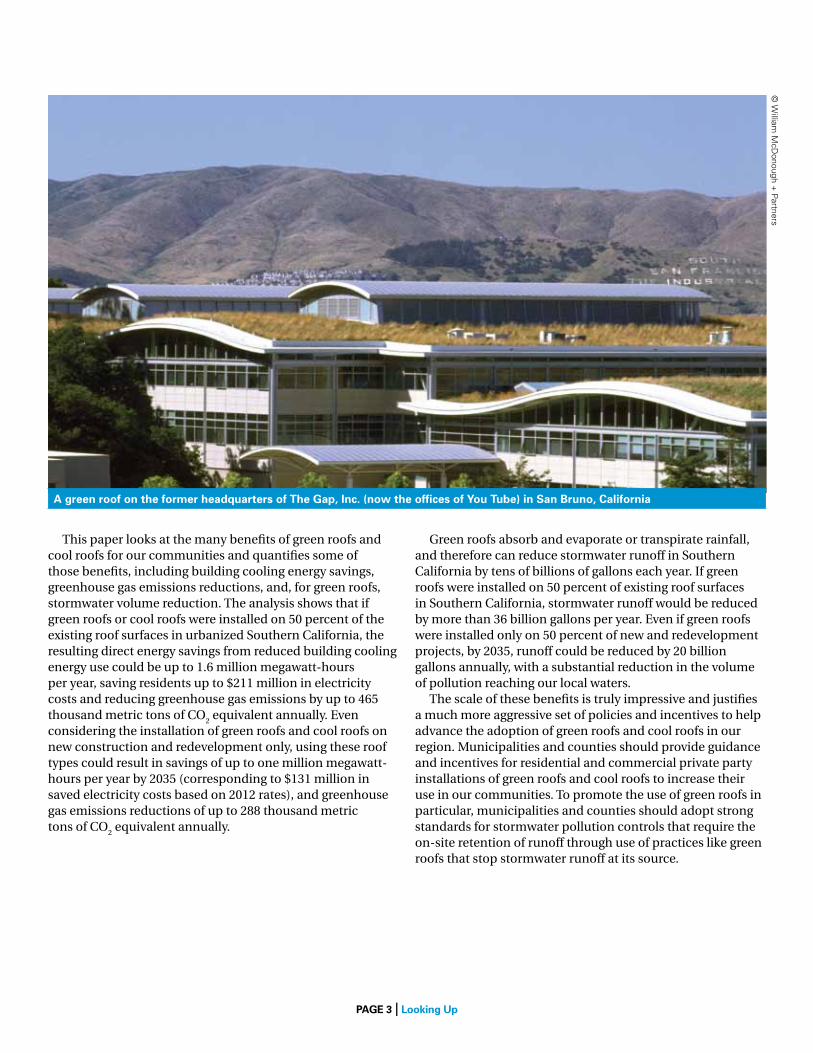
A green roof on the former headquarters of the gap, inc. (now the offices of you tube) in san bruno, California
PAge 4 | looking up
On April 30, 2012, the California Department of Water Resources reported that the Sierra snowpack, the source of up to one-third of the state’s freshwater supplies, was only 40 percent of its normal level for this time of year. Though well below historical levels, this reading may foreshadow major changes. Largely because of temperature increases from global warming, the snowpack is expected to shrink by 25 to 40 percent by 2050, meaning less water will be available for the tens of millions of Californians that rely on its runoff for their water needs.
Meanwhile, as our urban and suburban environments expand further outward in Southern California, we use more energy for lighting, vehicle traffic, and building cooling, among other uses. This results in greater emissions of the greenhouse gases that are contributing to the effects of global warming. And when it rains over our expanding cities, rooftops and other paved surfaces create vastly more runoff than occurs in the natural landscape, which in turn picks up and carries vastly more pollution to our rivers, lakes, and beaches.
Addressing all of these concerns will require judicious policies concerning growth and development that employ multiple practices, including the widespread use of green infrastructure—a term we use to mean a set of design principles and practices that restore or mimic natural hydrologic function. Green roofs, which are effectively living rooftops, can cost-effectively help solve many of these challenges at once, reducing energy used by buildings for cooling and heating, decreasing surface temperatures in cities, preventing stormwater runoff from carrying pollutants to surface waters, and providing other benefits.
Cool roofs, like green roofs, use smarter materials to reduce energy demand and lower temperatures compared with traditional rooftops. They do not yield all of the benefits of green roofs, but where installing a green roof may be impractical due to site-specific constraints, cool roofs can help address many of these same climate and energy issues facing our region.
introDuCtion©
Ken W
eston and Reza Iranpour/C
ity of Los Angeles
© w
ww
.luthringer.com
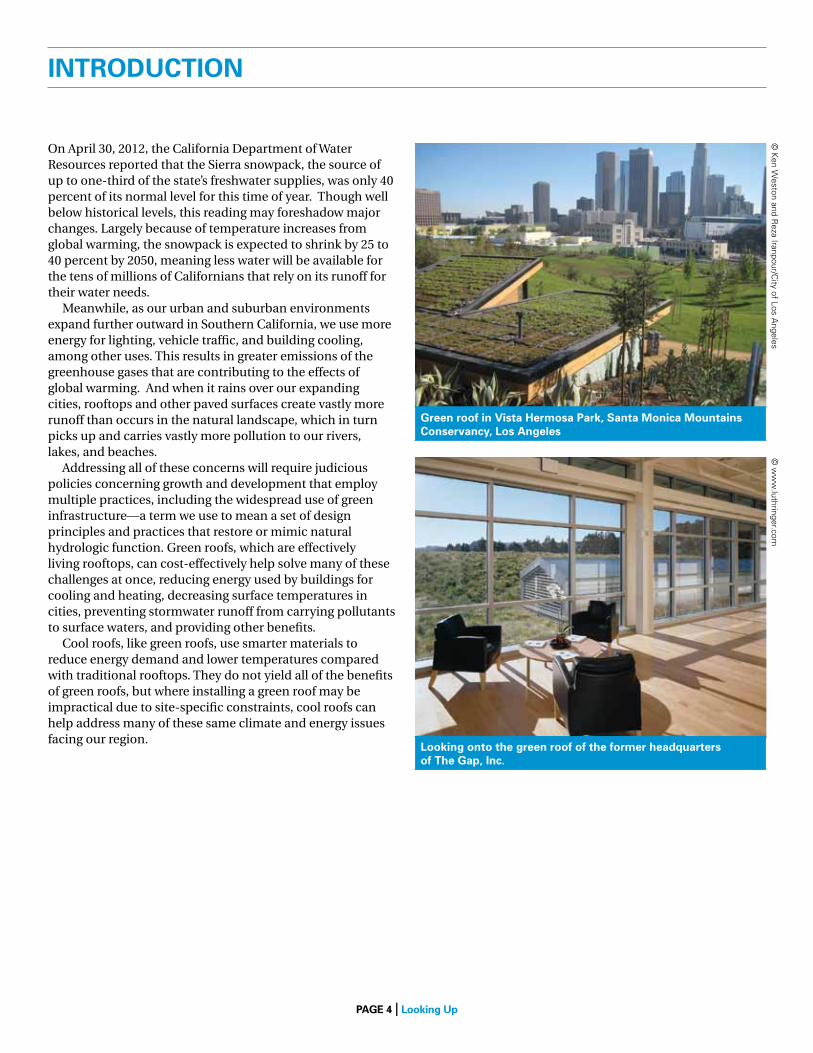
green roof in vista hermosa Park, santa monica mountains Conservancy, los Angeles
looking onto the green roof of the former headquarters of the gap, inc.
PAge 5 | looking up
VENTURACOUNTY
LOS ANGELESCOUNTY
SAN BERNARDINOCOUNTY
RIVERSIDECOUNTY
SAN DIEGOCOUNTY
ORANGECOUNTY
MEXICO
@
I
B
@
}
N
@
C
C
A
B
@
}
C
Los Angeles
LongBeach
Santa Ana
Riverside
SanBernardino
SanDiego
ChulaVista
Escondido
Oceanside
Anaheim
Ventura
Oxnard
SantaClarita
Temecula
Hemet
Palmdale
Victorville
PalmSprings
Percent Imperviousness:
< 20%
20 - 40%
40 - 60%
60 - 80%
Percent imperviousness based on NLCD 2001Impervious Surface dataset. Map created byGreenInfo Network, January 2009. 0 2512.5
Miles
IM P E RV I O U S NE S S - SO U TH E R N C AL I F O RN I A RE G I O N
80 - 100%
Public / Protected Open Space
Study Area Boundary
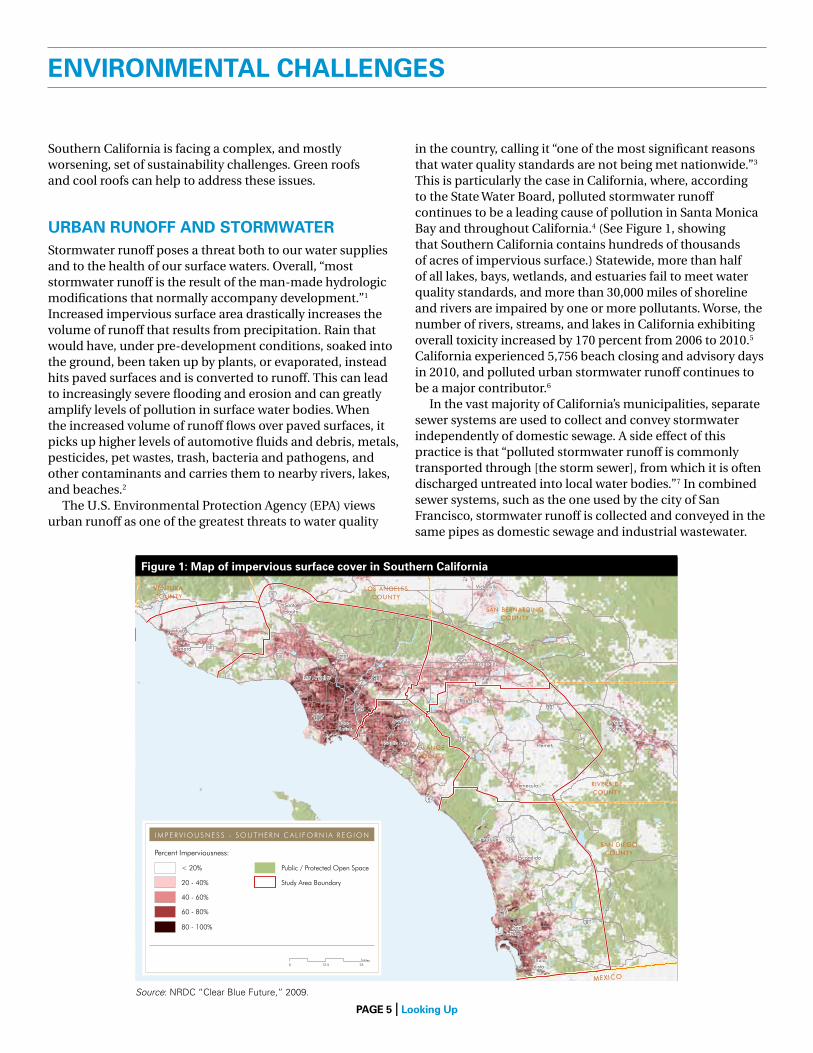
Southern California is facing a complex, and mostly worsening, set of sustainability challenges. Green roofs and cool roofs can help to address these issues.
urbAn runoff AnD stormwAterStormwater runoff poses a threat both to our water supplies and to the health of our surface waters. Overall, “most stormwater runoff is the result of the man-made hydrologic modifications that normally accompany development.”1 Increased impervious surface area drastically increases the volume of runoff that results from precipitation. Rain that would have, under pre-development conditions, soaked into the ground, been taken up by plants, or evaporated, instead hits paved surfaces and is converted to runoff. This can lead to increasingly severe flooding and erosion and can greatly amplify levels of pollution in surface water bodies. When the increased volume of runoff flows over paved surfaces, it picks up higher levels of automotive fluids and debris, metals, pesticides, pet wastes, trash, bacteria and pathogens, and other contaminants and carries them to nearby rivers, lakes, and beaches.2
The U.S. Environmental Protection Agency (EPA) views urban runoff as one of the greatest threats to water quality
in the country, calling it “one of the most significant reasons that water quality standards are not being met nationwide.”3 This is particularly the case in California, where, according to the State Water Board, polluted stormwater runoff continues to be a leading cause of pollution in Santa Monica Bay and throughout California.4 (See Figure 1, showing that Southern California contains hundreds of thousands of acres of impervious surface.) Statewide, more than half of all lakes, bays, wetlands, and estuaries fail to meet water quality standards, and more than 30,000 miles of shoreline and rivers are impaired by one or more pollutants. Worse, the number of rivers, streams, and lakes in California exhibiting overall toxicity increased by 170 percent from 2006 to 2010.5 California experienced 5,756 beach closing and advisory days in 2010, and polluted urban stormwater runoff continues to be a major contributor.6
In the vast majority of California’s municipalities, separate sewer systems are used to collect and convey stormwater independently of domestic sewage. A side effect of this practice is that “polluted stormwater runoff is commonly transported through [the storm sewer], from which it is often discharged untreated into local water bodies.”7 In combined sewer systems, such as the one used by the city of San Francisco, stormwater runoff is collected and conveyed in the same pipes as domestic sewage and industrial wastewater.
environmentAl ChAllenges
figure 1: map of impervious surface cover in southern California
Source: NRDC “Clear Blue Future,” 2009.
PAge 6 | looking up
Under normal conditions the wastewater is transported to a sewage treatment plant, where it is treated before being discharged. However, during periods of increased rainfall or snowmelt, “the wastewater volume in a combined sewer system can exceed the capacity of the sewer system or treatment plant.”8 For this reason, combined sewer systems are designed to overflow during rain events over a certain size and discharge excess wastewater directly to nearby rivers, lakes, or beaches, resulting in “stormwater…untreated human and industrial waste, toxic materials, and debris”
pouring directly into receiving waters.9 Consequently, the EPA considers combined sewer overflows to be “a major water pollution concern for the approximately 772 cities in the U.S. that have combined sewer systems.”10
Use of these conventional, engineered controls has been the dominant paradigm for addressing the challenges posed by stormwater across the United States for decades, with unfortunate consequences to the health of our nation’s surface water bodies.
green infrastructure as a stormwater Control solution
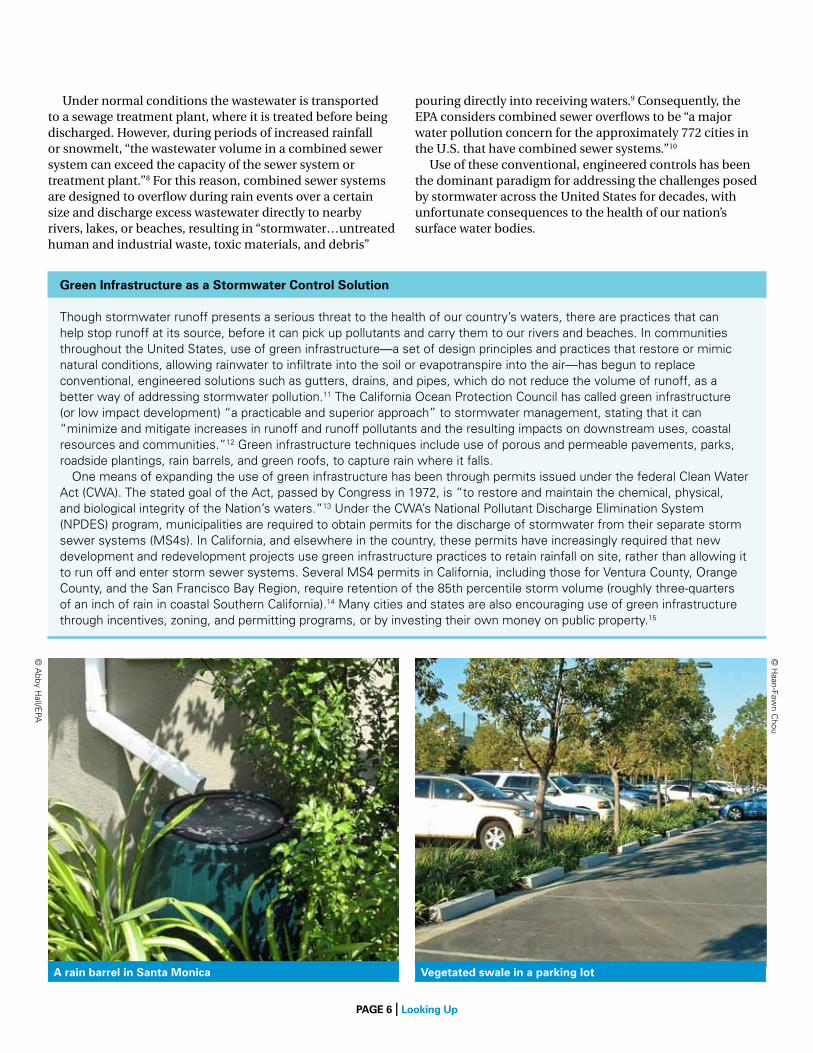
though stormwater runoff presents a serious threat to the health of our country’s waters, there are practices that can help stop runoff at its source, before it can pick up pollutants and carry them to our rivers and beaches. In communities throughout the United States, use of green infrastructure—a set of design principles and practices that restore or mimic natural conditions, allowing rainwater to infiltrate into the soil or evapotranspire into the air—has begun to replace conventional, engineered solutions such as gutters, drains, and pipes, which do not reduce the volume of runoff, as a better way of addressing stormwater pollution.11 the California ocean Protection Council has called green infrastructure (or low impact development) “a practicable and superior approach” to stormwater management, stating that it can “minimize and mitigate increases in runoff and runoff pollutants and the resulting impacts on downstream uses, coastal resources and communities.”12 Green infrastructure techniques include use of porous and permeable pavements, parks, roadside plantings, rain barrels, and green roofs, to capture rain where it falls. one means of expanding the use of green infrastructure has been through permits issued under the federal Clean Water Act (CWA). the stated goal of the Act, passed by Congress in 1972, is “to restore and maintain the chemical, physical, and biological integrity of the Nation’s waters.”13 Under the CWA’s National Pollutant Discharge Elimination System (NPDES) program, municipalities are required to obtain permits for the discharge of stormwater from their separate storm sewer systems (MS4s). In California, and elsewhere in the country, these permits have increasingly required that new development and redevelopment projects use green infrastructure practices to retain rainfall on site, rather than allowing it to run off and enter storm sewer systems. Several MS4 permits in California, including those for Ventura County, orange County, and the San Francisco Bay Region, require retention of the 85th percentile storm volume (roughly three-quarters of an inch of rain in coastal Southern California).14 Many cities and states are also encouraging use of green infrastructure through incentives, zoning, and permitting programs, or by investing their own money on public property.15
A rain barrel in santa monica vegetated swale in a parking lot
© H
aan-Fawn C
hou
© A
bby Hall/E
PA
PAge 7 | looking up
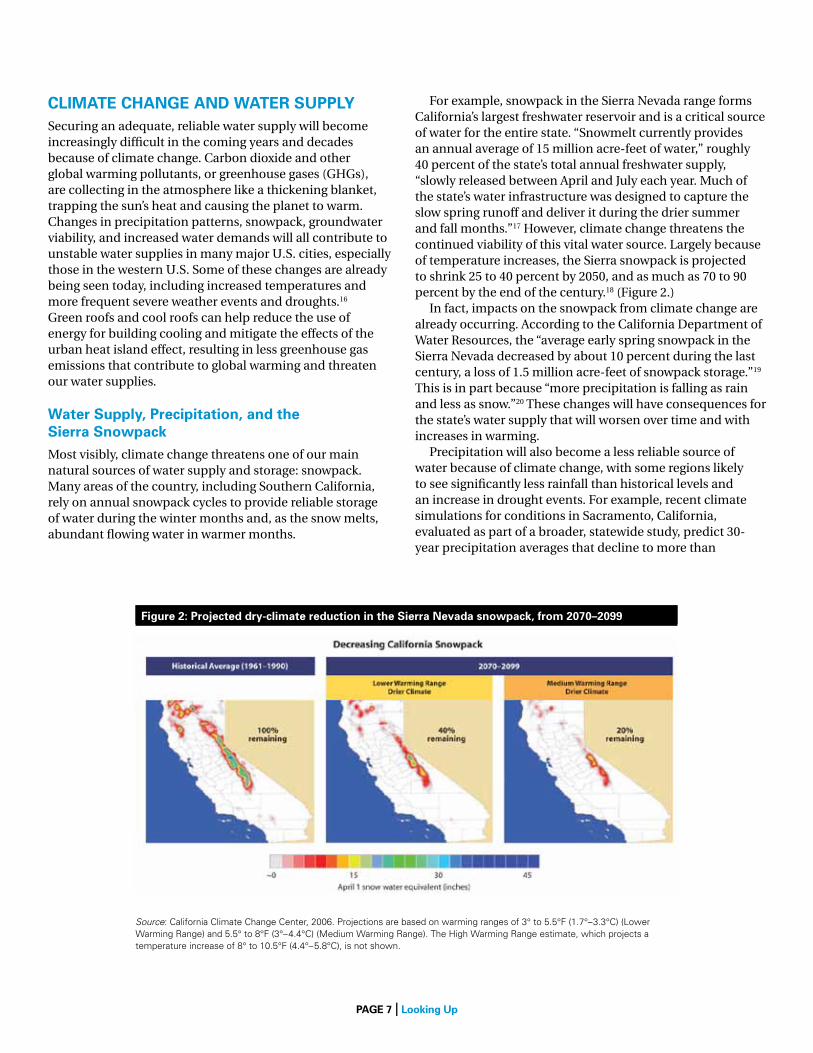
figure 2: Projected dry-climate reduction in the sierra nevada snowpack, from 2070–2099
Source: California Climate Change Center, 2006. Projections are based on warming ranges of 3° to 5.5°F (1.7°–3.3°C) (Lower Warming Range) and 5.5° to 8°F (3°–4.4°C) (Medium Warming Range). the High Warming Range estimate, which projects a temperature increase of 8° to 10.5°F (4.4°–5.8°C), is not shown.
ClimAte ChAnge AnD wAter suPPly Securing an adequate, reliable water supply will become increasingly difficult in the coming years and decades because of climate change. Carbon dioxide and other global warming pollutants, or greenhouse gases (GHGs), are collecting in the atmosphere like a thickening blanket, trapping the sun’s heat and causing the planet to warm. Changes in precipitation patterns, snowpack, groundwater viability, and increased water demands will all contribute to unstable water supplies in many major U.S. cities, especially those in the western U.S. Some of these changes are already being seen today, including increased temperatures and more frequent severe weather events and droughts.16 Green roofs and cool roofs can help reduce the use of energy for building cooling and mitigate the effects of the urban heat island effect, resulting in less greenhouse gas emissions that contribute to global warming and threaten our water supplies.
water supply, Precipitation, and the sierra snowpackMost visibly, climate change threatens one of our main natural sources of water supply and storage: snowpack. Many areas of the country, including Southern California, rely on annual snowpack cycles to provide reliable storage of water during the winter months and, as the snow melts, abundant flowing water in warmer months.
For example, snowpack in the Sierra Nevada range forms California’s largest freshwater reservoir and is a critical source of water for the entire state. “Snowmelt currently provides an annual average of 15 million acre-feet of water,” roughly 40 percent of the state’s total annual freshwater supply, “slowly released between April and July each year. Much of the state’s water infrastructure was designed to capture the slow spring runoff and deliver it during the drier summer and fall months.”17 However, climate change threatens the continued viability of this vital water source. Largely because of temperature increases, the Sierra snowpack is projected to shrink 25 to 40 percent by 2050, and as much as 70 to 90 percent by the end of the century.18 (Figure 2.)
In fact, impacts on the snowpack from climate change are already occurring. According to the California Department of Water Resources, the “average early spring snowpack in the Sierra Nevada decreased by about 10 percent during the last century, a loss of 1.5 million acre-feet of snowpack storage.”19 This is in part because “more precipitation is falling as rain and less as snow.”20 These changes will have consequences for the state’s water supply that will worsen over time and with increases in warming.
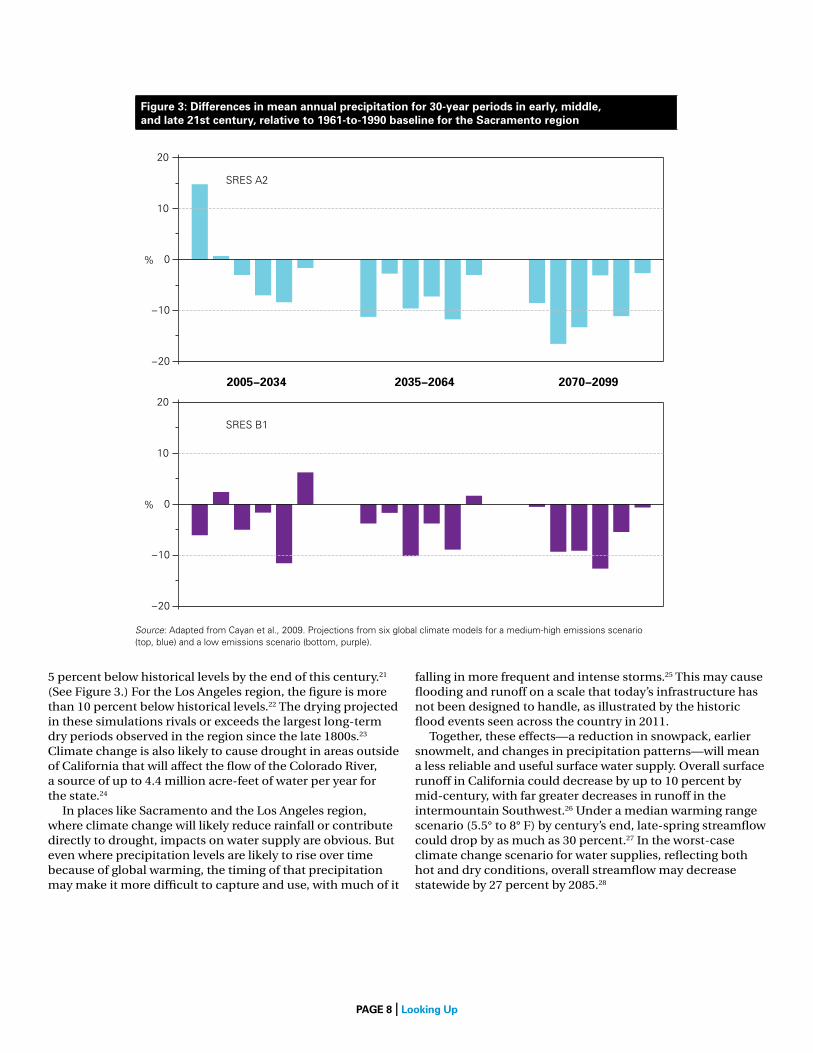
Precipitation will also become a less reliable source of water because of climate change, with some regions likely to see significantly less rainfall than historical levels and an increase in drought events. For example, recent climate simulations for conditions in Sacramento, California, evaluated as part of a broader, statewide study, predict 30-year precipitation averages that decline to more than
PAge 8 | looking up
5 percent below historical levels by the end of this century.21 (See Figure 3.) For the Los Angeles region, the figure is more than 10 percent below historical levels.22 The drying projected in these simulations rivals or exceeds the largest long-term dry periods observed in the region since the late 1800s.23 Climate change is also likely to cause drought in areas outside of California that will affect the flow of the Colorado River, a source of up to 4.4 million acre-feet of water per year for the state.24
In places like Sacramento and the Los Angeles region, where climate change will likely reduce rainfall or contribute directly to drought, impacts on water supply are obvious. But even where precipitation levels are likely to rise over time because of global warming, the timing of that precipitation may make it more difficult to capture and use, with much of it
falling in more frequent and intense storms.25 This may cause flooding and runoff on a scale that today’s infrastructure has not been designed to handle, as illustrated by the historic flood events seen across the country in 2011.
Together, these effects—a reduction in snowpack, earlier snowmelt, and changes in precipitation patterns—will mean a less reliable and useful surface water supply. Overall surface runoff in California could decrease by up to 10 percent by mid-century, with far greater decreases in runoff in the intermountain Southwest.26 Under a median warming range scenario (5.5° to 8° F) by century’s end, late-spring streamflow could drop by as much as 30 percent.27 In the worst-case climate change scenario for water supplies, reflecting both hot and dry conditions, overall streamflow may decrease statewide by 27 percent by 2085.28
figure 3: Differences in mean annual precipitation for 30-year periods in early, middle, and late 21st century, relative to 1961-to-1990 baseline for the sacramento region
Source: Adapted from Cayan et al., 2009. Projections from six global climate models for a medium-high emissions scenario (top, blue) and a low emissions scenario (bottom, purple).
−20
−10
0
10
20
−20
−10
0
10
20
SRES A2
SRES B1
2005−2034 2035−2064 2070−2099
%
%
PAge 9 | looking up
impacts to groundwater supplies
Unfortunately, climate change will also take a toll on groundwater supplies, which are often viewed as a safety net in California’s overall water supply picture. Approximately 30 percent of California’s urban and agricultural water needs are supplied by groundwater in an average year, a figure that rises to 40 percent or more during periods of drought.29 Groundwater basins are already stressed and overdrafted in many places throughout the state, such as in the Central Valley; basins in major population centers will be additionally threatened by increased salinity and saltwater intrusion as sea levels rise.
Recent studies project that by 2100, sea levels will be, on average, 1 to 1.4 meters (3.3 to 4.6 feet) higher than they were in 1990.30 Freshwater flowing toward the ocean, whether at the earth’s surface or underground, normally prevents saltwater from moving far inland. But when freshwater is pumped from a groundwater aquifer, this balance is disrupted, allowing saltwater to intrude into freshwater aquifers.31 The combination of freshwater withdrawals from aquifers and rising sea levels increases the likelihood that the saltwater layer in coastal aquifers will move closer to the surface. Seawater intrusion is already a problem for coastal aquifers in Los Angeles County and Orange County, where water has historically been withdrawn from aquifers at rates higher than they are recharged.32 Sea level rise will increase saltwater intrusion into these coastal aquifers. It will also degrade the quality and reliability of the freshwater supply pumped from the southern edge of the Sacramento–San Joaquin River Delta,33 from which much of Southern California gets its water.
In other words, excessive groundwater pumping and climate change will make our groundwater supplies less reliable.
All of this suggests we should be doing more, today, to develop the capacity to use stormwater, which will make our communities more resilient to changes in water supply over time. Without such adaptations, these serious constraints in water supply are likely to come just as demand for water that accompanies development and population growth soars. We should also be making use of practices, like green roofs and cool roofs, that reduce energy use and the resulting release of greenhouse gases that cause climate change, to limit the overall impacts of climate change in the first place.
water supply and energy in California
Increasing local supply of water through stormwater capture would have benefits beyond ensuring reliable supply. In California, almost 20 percent of our state’s total electricity and one-third of its non-power-plant natural gas usage are devoted to water systems.34 A significant portion of the electricity, “substantially above the national average,” is used in the conveyance of water, piping it from Northern California or the Colorado River across hundreds of miles and over mountain ranges into the relatively parched southern parts of the state.35 the California State Water Project, which pumps water a distance of 444 miles from the Sacramento-San Joaquin Delta to Southern California—lifting the water from just above sea level at the Delta nearly 3,000 feet over the tehachapi Mountains in the process—is the single-largest individual user of electricity in the state.36 this energy use is itself a significant contributor to the state’s greenhouse gas emissions.37 throughout the country, but especially in the West and in Southern California, saving water or supplying the water locally (for example, by capturing and using stormwater) helps to save energy, which in turn helps to address the root causes of climate change that threaten the security of our water supply.
greenhouse gas Pollution in southern California
Los Angeles County emits more carbon dioxide than any other county in the United States. A 2009 report found that the County of Los Angeles emits 21.4 million tons of carbon per year, handily beating out texas’s Harris County, the next-highest emitter at 19.4 million tons. San Diego, San Bernardino, and Riverside counties are all among the top 40 carbon-emitting counties—in fact, the six Southern California counties that form the focus of this study combine to account for 45 percent of California’s total annual carbon emissions.38 A substantial portion of these carbon emissions stems from the tremendous volume of vehicle traffic coursing through Southern California’s streets and freeways. A typical passenger vehicle in the United States emits 5.1 metric tons of Co2 per year,39 and Los Angeles County alone has an estimated 5.8 million registered automobiles and 1.1 million trucks or commercial vehicles.40 Another significant portion of the region’s carbon dioxide emissions comes from electricity used to cool buildings. Green roofs and cool roofs can help to reduce this energy usage.
PAge 10 | looking up
ClimAte AnD energy use in southern CAliforniA Across the United States, roughly 20 percent of all electrical energy used is for space cooling.41 The average residence equipped with a central air-conditioning system in California (50 percent of existing residential structures, with another 15 percent equipped with room air conditioners) uses approximately 766 kilowatt-hours (kWh) of electricity per year (roughly 0.49 kWh/ft2/year) for cooling,42 resulting in emissions of 483 pounds of CO
2 per year per residence.43
Commercial buildings in California on average use 2.04 kWh/ft2/year for cooling, with specific commercial sectors such as retail (2.21 kWh/ft2), food stores (2.58 kWh/ft2), offices (3.23 kWh/ft2), and restaurants (5.76 kWh/ft2) using substantially more electricity for cooling than others.44 Clearly, significant opportunity exists to reduce the amount of electricity used, and the GHG emissions that result from its production, by lessening the need to cool building interiors.
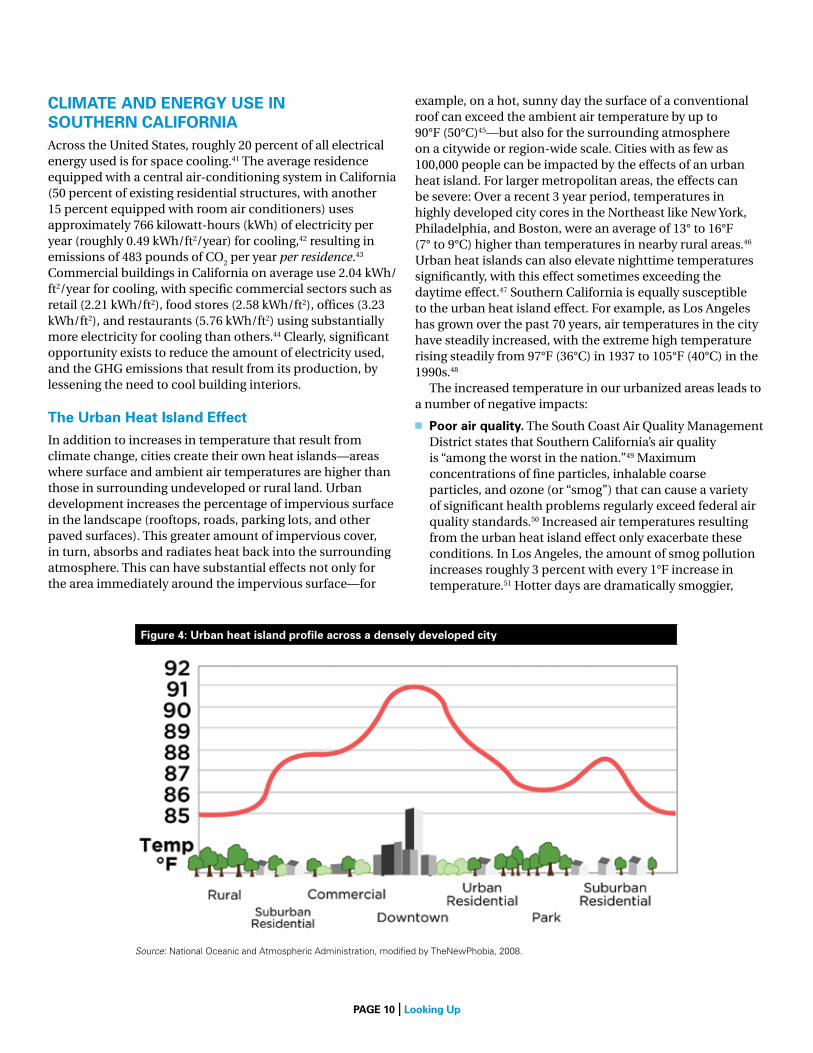
the urban heat island effectIn addition to increases in temperature that result from climate change, cities create their own heat islands—areas where surface and ambient air temperatures are higher than those in surrounding undeveloped or rural land. Urban development increases the percentage of impervious surface in the landscape (rooftops, roads, parking lots, and other paved surfaces). This greater amount of impervious cover, in turn, absorbs and radiates heat back into the surrounding atmosphere. This can have substantial effects not only for the area immediately around the impervious surface—for
example, on a hot, sunny day the surface of a conventional roof can exceed the ambient air temperature by up to 90°F (50°C)45—but also for the surrounding atmosphere on a citywide or region-wide scale. Cities with as few as 100,000 people can be impacted by the effects of an urban heat island. For larger metropolitan areas, the effects can be severe: Over a recent 3 year period, temperatures in highly developed city cores in the Northeast like New York, Philadelphia, and Boston, were an average of 13° to 16°F (7° to 9°C) higher than temperatures in nearby rural areas.46 Urban heat islands can also elevate nighttime temperatures significantly, with this effect sometimes exceeding the daytime effect.47 Southern California is equally susceptible to the urban heat island effect. For example, as Los Angeles has grown over the past 70 years, air temperatures in the city have steadily increased, with the extreme high temperature rising steadily from 97°F (36°C) in 1937 to 105°F (40°C) in the 1990s.48 The increased temperature in our urbanized areas leads to a number of negative impacts:
n Poor air quality. The South Coast Air Quality Management District states that Southern California’s air quality is “among the worst in the nation.”49 Maximum concentrations of fine particles, inhalable coarse particles, and ozone (or “smog”) that can cause a variety of significant health problems regularly exceed federal air quality standards.50 Increased air temperatures resulting from the urban heat island effect only exacerbate these conditions. In Los Angeles, the amount of smog pollution increases roughly 3 percent with every 1°F increase in temperature.51 Hotter days are dramatically smoggier,
figure 4: urban heat island profile across a densely developed city
Source: National oceanic and Atmospheric Administration, modified by theNewPhobia, 2008.
PAge 11 | looking up
wwith ozone going from “acceptable to terrible” with an increase of only 10 to 15°C (18° to 27°F),52 resulting in additional cases of asthma and hospitalizations for respiratory ailments.
n increased heat-related illness. Higher temperatures result in increased heat stress and other heat-related illnesses. Roughly 1,000 people die in the United States each year from extreme heat events,53 and a July 2006 heat wave in California resulted in 147 deaths, a number the California Climate Change Center states is almost certainly underreported.54 A statistical analysis suggests that for every increase of 10°F, mortalities increased by 4.3 percent in Los Angeles County and by 11.4 percent in San Bernardino County.55
n increased energy use and ghg emissions. As urban temperatures increase, we use more electricity to cool buildings than would be necessary without the effects of urban heat islands or climate change. This results in correspondingly higher levels of greenhouse gas emissions. In Los Angeles, the peak energy load increases by 2 percent for every 1°F rise in outside air temperature.56 Additionally, since air conditioners and centralized HVAC systems vent heated air into the atmosphere, their added use can further increase outside air temperatures, resulting in increased need for building cooling, and more GHG emissions.57
n increased water consumption and stress on ecosystem health. Many plants and animals are sensitive to the increased temperatures that occur in urban cores—for example, increased temperatures can interfere with photosynthesis—and the warmer temperatures can result in more water being used for irrigation to support stressed vegetation.58
While the challenges presented by climate change, stormwater runoff, and the urban heat island effect are critical and complex, there are practical, green infrastructure-based solutions that can address both their causes and their harmful effects.
figure 4: urban heat island profile across a densely developed city
Source: National oceanic and Atmospheric Administration, modified by theNewPhobia, 2008.
PAge 12 | looking up
Both green roofs and cool roofs make sense for Southern California. The region has mild winters but hot summers, and, as described earlier, experiences a dramatic urban heat island. This results in wasted energy and money to cool building interiors, and in excess GHGs being released into the atmosphere. The region’s already worst-in-the-nation air quality is a problem that is exacerbated by rising temperatures. Further, the region’s millions of acres of rooftops generate hundreds of thousands of acre-feet of stormwater runoff each year, contributing large amounts of pollution to local rivers, lakes, and beaches and adding to flood events. Green roofs offer an opportunity to address all of these challenges, and, where it may be impractical to install a green roof, cool roofs can help address the climate and energy issues facing our cities.
To quantify the benefits these types of roofs can provide, we have analyzed land use, energy use patterns, and studies of green roof and cool roof performance in order to determine the energy savings that could result from a reduced need for building cooling in Southern California. We have also analyzed the potential volume of stormwater runoff and pollutant load that could be retained by green roofs. In this section, we discuss the properties of green roofs and cool roofs and the results of our analyses. We also discuss additional benefits that green roofs and cool roofs can provide for Southern California’s urban areas with respect to reducing the urban heat island effect.
green roofs—bAsiCs AnD benefitsGreen roofs are vegetated roof surfaces—essentially, rooftops covered partially or entirely with living plants. Green roofs can help preserve a building’s roof surface while providing substantial environmental benefits. The plants and growing medium (engineered soil) of a green roof shade and protect the underlying roof structure from sunlight, thereby reducing its temperature. Further, green roofs cool through evapotranspiration: Plants take water in through their root systems and release it through their leaves in a process called transpiration. At the same time, evaporation—the conversion of water from liquid to gas—occurs from plant surfaces and directly from the growing medium.59 Energy from incoming solar radiation that would otherwise heat the roof surface and increase ambient air temperatures is instead used in the evapotranspiration process, resulting in latent heat loss that lowers surrounding air temperatures.60 The summer surface temperature of a green roof can be significantly cooler than the surface of an adjacent conventional roof at midday. For instance, a study in New York City found that peak daytime temperatures on green roofs averaged 60°F (33°C) cooler than on standard black roofs.61
Green roofs are typically referred to as either “extensive” or “intensive.” Extensive green roofs, which are the focus of this report, generally use a simple, lightweight system that includes a vegetated layer, a thin layer (3 to 6 inches) of soil or other growing medium, a drainage system, a root protection system, and a waterproof membrane.62 With extensive green roofs, the goal is often performance with minimal input: Plant selections are typically hardy, drought-tolerant varieties that need little maintenance, no fertilizers or pesticides, and scant human intervention of any kind once established.63 Intensive green roofs, on the other hand, generally serve as an amenity, acting more like a traditional garden or park space, with little limitation on the type of plant or tree that can be installed. While their purpose is usually shade and open space for the building’s occupants, intensive green roofs typically perform as well as, or better than, extensive green roofs in terms of stormwater runoff retention, urban heat island reduction, and air-conditioning energy savings. However, this performance for intensive green roofs generally comes at significant cost in terms of necessary structural support, initial investment, long-term maintenance, and irrigation water use.64
green roofs, Climate, and irrigation
A potential issue for green roof installation in Southern California is that the region receives most of its rainfall between November and March, when temperatures are cooler, meaning such roofs may require supplemental irrigation during the hotter summer months to achieve the maximum cooling benefit from evapotranspiration. the potential need for irrigation raises significant concerns for regions such as Southern California, where a principal goal is not to increase the strain on already over-allocated domestic water supplies, which themselves may require substantial energy to deliver to end users. one potential option is use of captured rainwater or graywater for irrigation, which can decrease or eliminate the need to use potable water supplies. However, unless a reliable source of nonpotable water is available, the preferred option may be the installation of non-irrigated green roofs made up of highly drought-resistant plants, coupled with a highly reflective aggregate in the growing matrix. (See discussion of roof properties such as solar reflectance, or albedo, below.) While evapotranspiration may be reduced in the summer months as a result of reduced irrigation, green roofs will still provide cooling as a result of shading and increased reflection of the sun’s energy.
benefits of green roofs AnD Cool roofs
PAge 13 | looking up
© A
dam K
uban
© C
ara Horow
itz
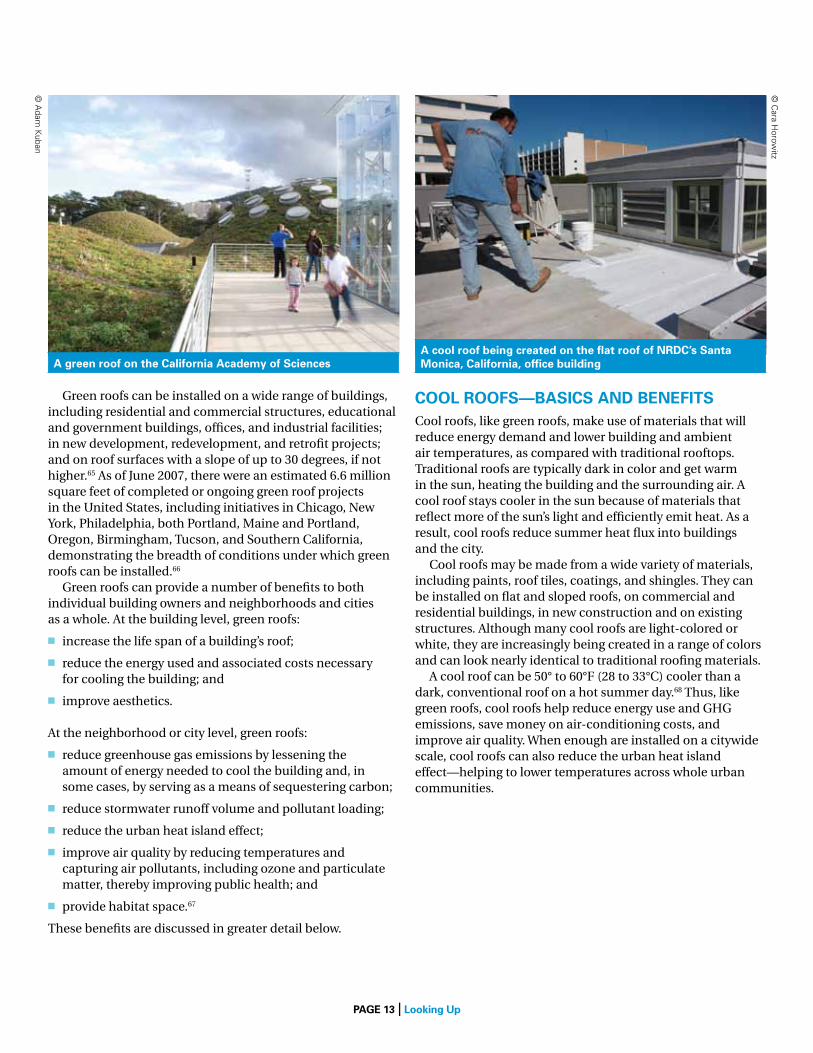
A green roof on the California Academy of sciencesA cool roof being created on the flat roof of nrDC’s santa monica, California, office building
Green roofs can be installed on a wide range of buildings, including residential and commercial structures, educational and government buildings, offices, and industrial facilities; in new development, redevelopment, and retrofit projects; and on roof surfaces with a slope of up to 30 degrees, if not higher.65 As of June 2007, there were an estimated 6.6 million square feet of completed or ongoing green roof projects in the United States, including initiatives in Chicago, New York, Philadelphia, both Portland, Maine and Portland, Oregon, Birmingham, Tucson, and Southern California, demonstrating the breadth of conditions under which green roofs can be installed.66
Green roofs can provide a number of benefits to both individual building owners and neighborhoods and cities as a whole. At the building level, green roofs:
n increase the life span of a building’s roof;
n reduce the energy used and associated costs necessary for cooling the building; and
n improve aesthetics.
At the neighborhood or city level, green roofs:
n reduce greenhouse gas emissions by lessening the amount of energy needed to cool the building and, in some cases, by serving as a means of sequestering carbon;
n reduce stormwater runoff volume and pollutant loading;
n reduce the urban heat island effect;
n improve air quality by reducing temperatures and capturing air pollutants, including ozone and particulate matter, thereby improving public health; and
n provide habitat space.67
These benefits are discussed in greater detail below.
Cool roofs—bAsiCs AnD benefitsCool roofs, like green roofs, make use of materials that will reduce energy demand and lower building and ambient air temperatures, as compared with traditional rooftops. Traditional roofs are typically dark in color and get warm in the sun, heating the building and the surrounding air. A cool roof stays cooler in the sun because of materials that reflect more of the sun’s light and efficiently emit heat. As a result, cool roofs reduce summer heat flux into buildings and the city.
Cool roofs may be made from a wide variety of materials, including paints, roof tiles, coatings, and shingles. They can be installed on flat and sloped roofs, on commercial and residential buildings, in new construction and on existing structures. Although many cool roofs are light-colored or white, they are increasingly being created in a range of colors and can look nearly identical to traditional roofing materials.
A cool roof can be 50° to 60°F (28 to 33°C) cooler than a dark, conventional roof on a hot summer day.68 Thus, like green roofs, cool roofs help reduce energy use and GHG emissions, save money on air-conditioning costs, and improve air quality. When enough are installed on a citywide scale, cool roofs can also reduce the urban heat island effect—helping to lower temperatures across whole urban communities.
PAge 14 | looking up
green roof, Cool roof, or solar Power?
While cool roofs have many significant benefits, it is important to note their limitations. Unlike green roofs, cool roofs do not reduce surface water pollution or stormwater runoff; because they are impervious surfaces, they contribute to urban runoff in the same way as traditional roofs. Cool roofs also do not sequester carbon from the atmosphere or capture air pollutants. Further, cool roofs may result in a “winter heat penalty,” as they may require higher heating costs during colder weather due to their ability to transmit heat from the building interior through the roof surface, while green roofs will provide insulation that saves heating energy during cold weather as well. Cool roofs can, however, be combined with rooftop rainwater capture systems that can provide substantial benefits in terms of stormwater runoff volume reduction and increased water supply,69 or coupled with increased insulation to increase energy benefits during colder periods of the year. Given their cooling energy and other benefits (including improving air quality through the mitigation of climate change and the urban heat island effect), cool roofs provide an important “smart” roofing alternative, especially for applications where site-specific constraints, such as a building’s load-bearing capacity, may make installation of a green roof impractical. their energy-saving and urban-cooling benefits are immediate, and they can be installed easily and quickly on a host of building types at little cost. Solar roofs are also a vast improvement over traditional roofs, providing building-cooling benefits through shading in addition to serving as a renewable energy source.70 Increasing the number of rooftop solar installations in Southern California would help mitigate climate change, strengthen renewable and distributed en ergy generation capacity, and reduce peak energy demand. Solar roofs can also be installed in combination with green roofs or cool roofs. In fact, installing a solar roof in combination with a green roof, which provides evaporative cooling, actually improves electricity production because photovoltaic processes are more efficient in cooler conditions.71 though outside the scope of this report to quantify and compare the total benefits of all three roof types, based on the benefits each can provide we see the different types of roofing strategies as complementary. Policy initiatives for smarter rooftops should push for green roofs, cool roofs, and solar roofs to make our cities more healthy, livable, sustainable, and resilient to a changing climate.
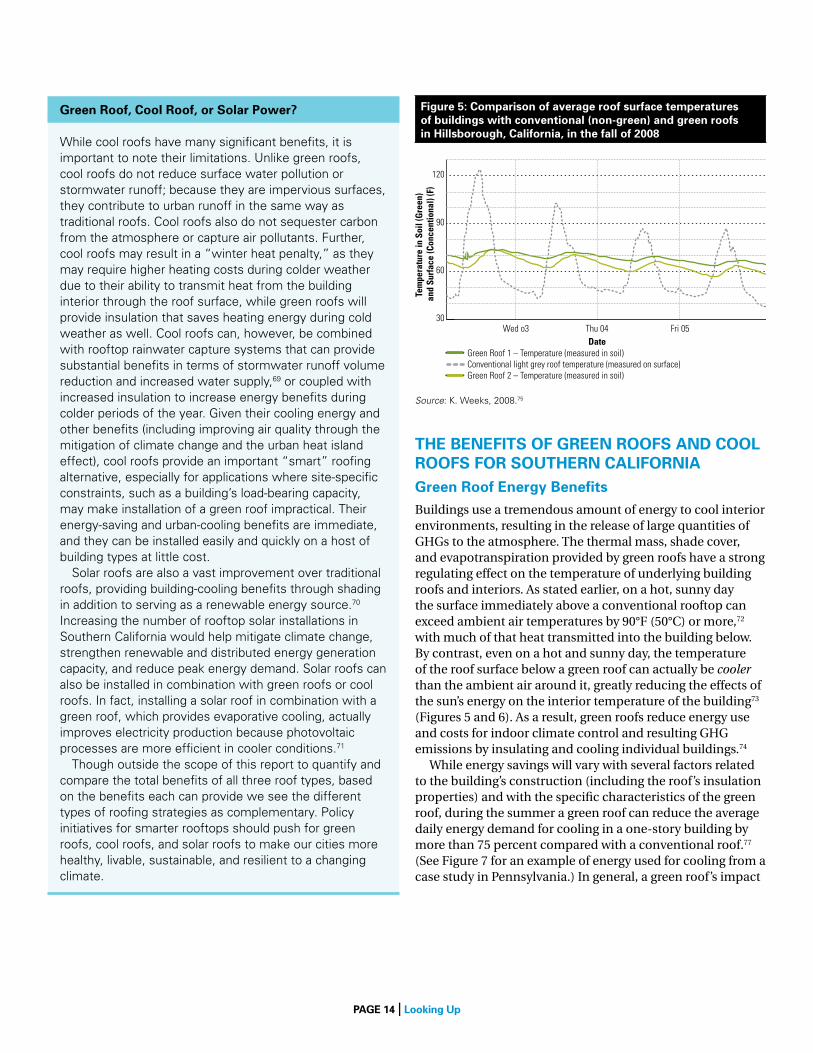
the benefits of green roofs AnD Cool roofs for southern CAliforniAgreen roof energy benefitsBuildings use a tremendous amount of energy to cool interior environments, resulting in the release of large quantities of GHGs to the atmosphere. The thermal mass, shade cover, and evapotranspiration provided by green roofs have a strong regulating effect on the temperature of underlying building roofs and interiors. As stated earlier, on a hot, sunny day the surface immediately above a conventional rooftop can exceed ambient air temperatures by 90°F (50°C) or more,72 with much of that heat transmitted into the building below. By contrast, even on a hot and sunny day, the temperature of the roof surface below a green roof can actually be cooler than the ambient air around it, greatly reducing the effects of the sun’s energy on the interior temperature of the building73 (Figures 5 and 6). As a result, green roofs reduce energy use and costs for indoor climate control and resulting GHG emissions by insulating and cooling individual buildings.74
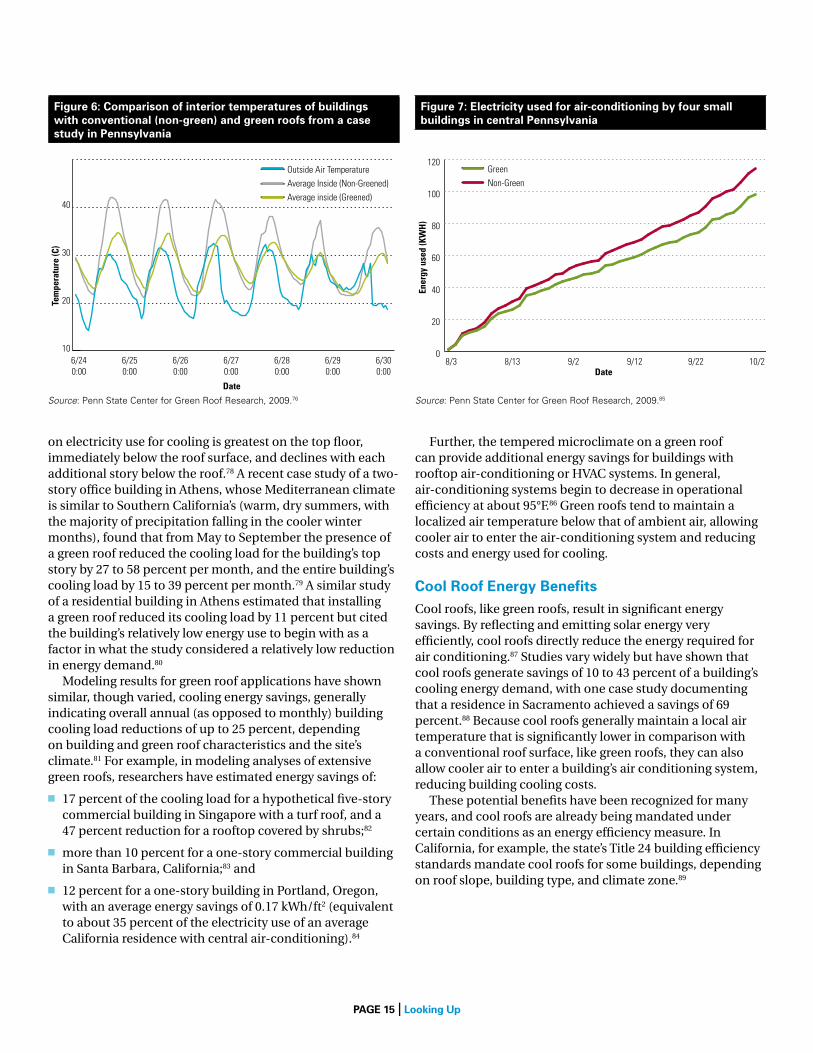
While energy savings will vary with several factors related to the building’s construction (including the roof’s insulation properties) and with the specific characteristics of the green roof, during the summer a green roof can reduce the average daily energy demand for cooling in a one-story building by more than 75 percent compared with a conventional roof.77 (See Figure 7 for an example of energy used for cooling from a case study in Pennsylvania.) In general, a green roof’s impact
figure 5: Comparison of average roof surface temperatures of buildings with conventional (non-green) and green roofs in hillsborough, California, in the fall of 2008
Wed o3
120
90
60
30Thu 04 Fri 05Date
Tem
pera
ture
in S
oil (
Gre
en)
and
Surf
ace
(Con
cent
iona
l) (F
)
Green Roof 1 – Temperature (measured in soil)Conventional light grey roof temperature (measured on surface)Green Roof 2 – Temperature (measured in soil)
Source: K. Weeks, 2008.75
PAge 15 | looking up
on electricity use for cooling is greatest on the top floor, immediately below the roof surface, and declines with each additional story below the roof.78 A recent case study of a two-story office building in Athens, whose Mediterranean climate is similar to Southern California’s (warm, dry summers, with the majority of precipitation falling in the cooler winter months), found that from May to September the presence of a green roof reduced the cooling load for the building’s top story by 27 to 58 percent per month, and the entire building’s cooling load by 15 to 39 percent per month.79 A similar study of a residential building in Athens estimated that installing a green roof reduced its cooling load by 11 percent but cited the building’s relatively low energy use to begin with as a factor in what the study considered a relatively low reduction in energy demand.80 Modeling results for green roof applications have shown similar, though varied, cooling energy savings, generally indicating overall annual (as opposed to monthly) building cooling load reductions of up to 25 percent, depending on building and green roof characteristics and the site’s climate.81 For example, in modeling analyses of extensive green roofs, researchers have estimated energy savings of:
n 17 percent of the cooling load for a hypothetical five-story commercial building in Singapore with a turf roof, and a 47 percent reduction for a rooftop covered by shrubs;82
n more than 10 percent for a one-story commercial building in Santa Barbara, California;83 and
n 12 percent for a one-story building in Portland, Oregon, with an average energy savings of 0.17 kWh/ft2 (equivalent to about 35 percent of the electricity use of an average California residence with central air-conditioning).84
Further, the tempered microclimate on a green roof can provide additional energy savings for buildings with rooftop air-conditioning or HVAC systems. In general, air-conditioning systems begin to decrease in operational efficiency at about 95°F.86 Green roofs tend to maintain a localized air temperature below that of ambient air, allowing cooler air to enter the air-conditioning system and reducing costs and energy used for cooling.
Cool roof energy benefitsCool roofs, like green roofs, result in significant energy savings. By reflecting and emitting solar energy very efficiently, cool roofs directly reduce the energy required for air conditioning.87 Studies vary widely but have shown that cool roofs generate savings of 10 to 43 percent of a building’s cooling energy demand, with one case study documenting that a residence in Sacramento achieved a savings of 69 percent.88 Because cool roofs generally maintain a local air temperature that is significantly lower in comparison with a conventional roof surface, like green roofs, they can also allow cooler air to enter a building’s air conditioning system, reducing building cooling costs.
These potential benefits have been recognized for many years, and cool roofs are already being mandated under certain conditions as an energy efficiency measure. In California, for example, the state’s Title 24 building efficiency standards mandate cool roofs for some buildings, depending on roof slope, building type, and climate zone.89
figure 6: Comparison of interior temperatures of buildings with conventional (non-green) and green roofs from a case study in Pennsylvania
figure 7: electricity used for air-conditioning by four small buildings in central Pennsylvania
10
20
30
40
Outside Air Temperature
Average Inside (Non-Greened)
Average inside (Greened)
6/240:00
6/250:00
6/260:00
6/270:00
6/280:00
6/290:00
6/300:00
Date
Tem
pera
ture
(C)
Ener
gy u
sed
(KW
H)
0
20
40
60
80
100
120
8/3 8/13 9/2 9/12 9/22 10/2Date
Green
Non-Green
Source: Penn State Center for Green Roof Research, 2009.76 Source: Penn State Center for Green Roof Research, 2009.85
PAge 16 | looking up
Definitions of key roof properties relating to building temperature and the urban heat island effect
solar reflectance is the fraction of solar energy that is reflected by a surface, such as a roof, and is expressed as a number between zero and one. the higher the value, the better the roof reflects solar energy and the more it keeps cool. For example, a white reflective coating or membrane may have a reflectance value of 0.8 (i.e., it reflects 80 percent of incident solar energy and absorbs the remaining 20 percent), while asphalt concrete may have a reflectance of 0.1 (it reflects 10 percent while absorbing 90 percent). the solar reflectance of a material is similar to its albedo, which is a true field measurement of a material’s reflectivity in sunlight conditions. A material’s initial solar reflectance often weathers over time to a relatively stable aged solar reflectance.90 Green roofs generally have a lower albedo than white or cool roofs (on the order of 0.25 or 0.3, which is still more reflective than traditional tar or gravel roofs, which have albedos of 0.08 to 0.18).91 Nevertheless, green roofs can cool as effectively as the brightest white roof surfaces; research indicates that vegetation may have a stronger influence on temperature than the albedo of built surfaces.92 As a result, the “equivalent albedo” of green roofs, accounting for latent heat loss from evaporative cooling, generally falls between 0.7 and 0.85.93
emittance (also called thermal emittance) is the amount of absorbed heat that is radiated from a roof, expressed as a number between zero and one. the higher the value, the better the roof radiates heat. Higher emittances help to keep building interiors cool and to lower energy demands.
solar reflectance index (sri) is a measure of a surface’s ability to stay cool in the sun. It is defined so that a standard black surface has an SRI of 0 and a standard white surface has an SRI of 100. SRI is calculated from solar reflectance and thermal emittance.
Adapted from California’s “Flex Your Power” website.94
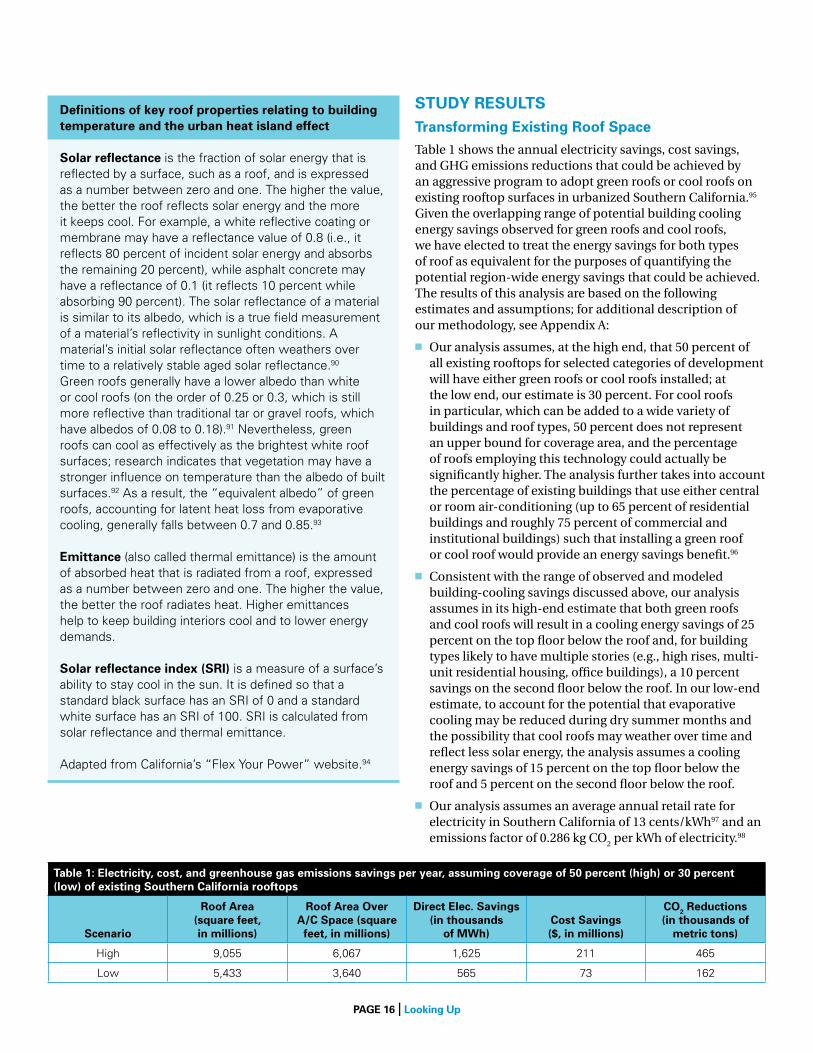
stuDy resultstransforming existing roof space Table 1 shows the annual electricity savings, cost savings, and GHG emissions reductions that could be achieved by an aggressive program to adopt green roofs or cool roofs on existing rooftop surfaces in urbanized Southern California.95 Given the overlapping range of potential building cooling energy savings observed for green roofs and cool roofs, we have elected to treat the energy savings for both types of roof as equivalent for the purposes of quantifying the potential region-wide energy savings that could be achieved. The results of this analysis are based on the following estimates and assumptions; for additional description of our methodology, see Appendix A:
n Our analysis assumes, at the high end, that 50 percent of all existing rooftops for selected categories of development will have either green roofs or cool roofs installed; at the low end, our estimate is 30 percent. For cool roofs in particular, which can be added to a wide variety of buildings and roof types, 50 percent does not represent an upper bound for coverage area, and the percentage of roofs employing this technology could actually be significantly higher. The analysis further takes into account the percentage of existing buildings that use either central or room air-conditioning (up to 65 percent of residential buildings and roughly 75 percent of commercial and institutional buildings) such that installing a green roof or cool roof would provide an energy savings benefit.96
n Consistent with the range of observed and modeled building-cooling savings discussed above, our analysis assumes in its high-end estimate that both green roofs and cool roofs will result in a cooling energy savings of 25 percent on the top floor below the roof and, for building types likely to have multiple stories (e.g., high rises, multi-unit residential housing, office buildings), a 10 percent savings on the second floor below the roof. In our low-end estimate, to account for the potential that evaporative cooling may be reduced during dry summer months and the possibility that cool roofs may weather over time and reflect less solar energy, the analysis assumes a cooling energy savings of 15 percent on the top floor below the roof and 5 percent on the second floor below the roof.
n Our analysis assumes an average annual retail rate for electricity in Southern California of 13 cents/kWh97 and an emissions factor of 0.286 kg CO
2 per kWh of electricity.98
table 1: electricity, cost, and greenhouse gas emissions savings per year, assuming coverage of 50 percent (high) or 30 percent (low) of existing southern California rooftops
scenario
roof Area (square feet, in millions)
roof Area over A/C space (square
feet, in millions)
Direct elec. savings (in thousands
of mwh)Cost savings ($, in millions)
Co2 reductions (in thousands of
metric tons)
High 9,055 6,067 1,625 211 465
Low 5,433 3,640 565 73 162
PAge 17 | looking up
Using the high-end estimate, installing green roofs or cool roofs on 50 percent of existing rooftop surfaces for selected development types across urbanized Southern California would result in direct electricity savings on the order of 1.6 million megawatt-hours per year, the removal of hundreds of thousands of metric tons of CO
2 equivalent from the
atmosphere, and a cost savings of up to $211 million for the region. The energy saved would be enough to power more than 127,000 single-family homes in California; the CO
2 reductions would be equivalent to removing more than
91,000 cars from the road each year.99
These results are conservative in that they assume only a low potential area of coverage, particularly for cool roofs. Moreover, for both green roofs and cool roofs, they do not account for the indirect electricity and GHG savings that could be achieved from a reduced need for building cooling due to an overall reduction in ambient urban temperatures or from increased air conditioning efficiency. This latter benefit is discussed below. Nor do these results account for potential reductions in heating energy required for buildings due to the insulating effects of a green roof, which can be substantial.100
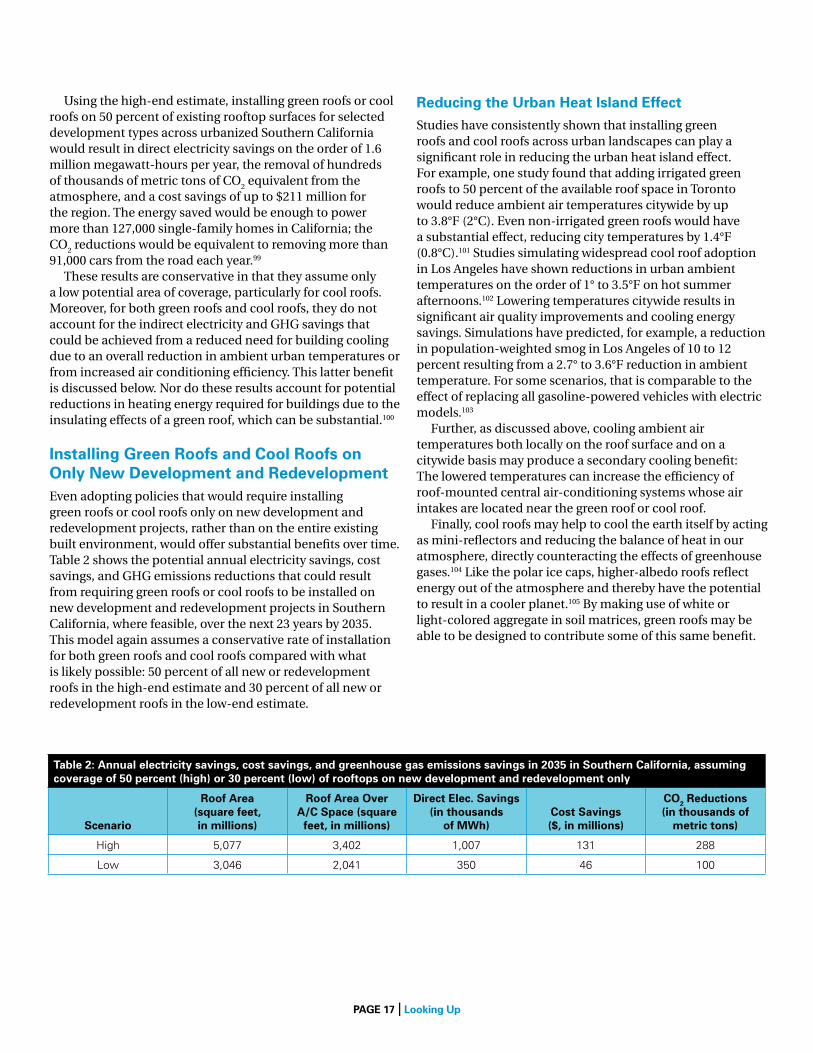
installing green roofs and Cool roofs on only new Development and redevelopment Even adopting policies that would require installing green roofs or cool roofs only on new development and redevelopment projects, rather than on the entire existing built environment, would offer substantial benefits over time. Table 2 shows the potential annual electricity savings, cost savings, and GHG emissions reductions that could result from requiring green roofs or cool roofs to be installed on new development and redevelopment projects in Southern California, where feasible, over the next 23 years by 2035. This model again assumes a conservative rate of installation for both green roofs and cool roofs compared with what is likely possible: 50 percent of all new or redevelopment roofs in the high-end estimate and 30 percent of all new or redevelopment roofs in the low-end estimate.
reducing the urban heat island effect Studies have consistently shown that installing green roofs and cool roofs across urban landscapes can play a significant role in reducing the urban heat island effect. For example, one study found that adding irrigated green roofs to 50 percent of the available roof space in Toronto would reduce ambient air temperatures citywide by up to 3.8°F (2°C). Even non-irrigated green roofs would have a substantial effect, reducing city temperatures by 1.4°F (0.8°C).101 Studies simulating widespread cool roof adoption in Los Angeles have shown reductions in urban ambient temperatures on the order of 1° to 3.5°F on hot summer afternoons.102 Lowering temperatures citywide results in significant air quality improvements and cooling energy savings. Simulations have predicted, for example, a reduction in population-weighted smog in Los Angeles of 10 to 12 percent resulting from a 2.7° to 3.6°F reduction in ambient temperature. For some scenarios, that is comparable to the effect of replacing all gasoline-powered vehicles with electric models.103
Further, as discussed above, cooling ambient air temperatures both locally on the roof surface and on a citywide basis may produce a secondary cooling benefit: The lowered temperatures can increase the efficiency of roof-mounted central air-conditioning systems whose air intakes are located near the green roof or cool roof.
Finally, cool roofs may help to cool the earth itself by acting as mini-reflectors and reducing the balance of heat in our atmosphere, directly counteracting the effects of greenhouse gases.104 Like the polar ice caps, higher-albedo roofs reflect energy out of the atmosphere and thereby have the potential to result in a cooler planet.105 By making use of white or light-colored aggregate in soil matrices, green roofs may be able to be designed to contribute some of this same benefit.
table 2: Annual electricity savings, cost savings, and greenhouse gas emissions savings in 2035 in southern California, assuming coverage of 50 percent (high) or 30 percent (low) of rooftops on new development and redevelopment only
scenario
roof Area (square feet, in millions)
roof Area over A/C space (square
feet, in millions)
Direct elec. savings (in thousands
of mwh)Cost savings ($, in millions)
Co2 reductions (in thousands of
metric tons)
High 5,077 3,402 1,007 131 288
Low 3,046 2,041 350 46 100
PAge 18 | looking up
In all, substantial opportunity exists to use green roofs and cool roofs to reduce the urban heat island effect in Southern California. While we do not quantify those additional benefits here, they would be additive with the electricity and GHG savings resulting from reduced need for building cooling calculated above, and in combination could provide a strong means of protecting California and its water resources against the impacts of climate change and rising temperatures.
Additional benefits—Carbon sequestration
Green roofs reduce the amount of carbon dioxide in the atmosphere through carbon sequestration. this is the removal of carbon dioxide and other forms of carbon from the air by plants through photosynthesis and the storage of that carbon in the plants and the soil in which they grow.120 Researchers at Michigan State University concluded that green roofs sequester approximately 1.52 metric tons of carbon per acre over the two years of the study (375 grams of carbon per square meter).121 According to their findings, if all 36,409 acres of commercial and industrial rooftops in the Detroit metropolitan area were greened, over a two-year period their plants and growing media together would sequester 55,252 metric tons of carbon, equivalent to taking more than 10,000 midsize sport utility vehicles or trucks off the road for a year.122
reducing stormwater runoff and Pollutant loading to local waters Because of their capacity to absorb and delay rainfall runoff, green roofs can serve as an effective tool for stormwater management, vastly reducing the quantity of stormwater runoff and the amount of pollutants that flow into Southern California’s rivers, lakes, and beaches.106 A green roof with a layer of soil 3 to 4 inches deep can generally absorb 0.5 to 1 inch of rainfall from a storm event, preventing that volume of runoff from ever flowing to storm drains and contributing to surface water pollution.107 For larger storms or back-to-back storm events, green roofs can delay runoff even after they become saturated and no longer absorb water, substantially reducing peak flow rates that contribute to stream erosion and flooding.108 By reducing the quantity of stormwater runoff, green roofs can also reduce strain on public storm sewer systems and the costs of operating and maintaining them.109
Estimated stormwater retention rates for extensive green roofs across the U.S. are impressive, typically ranging from 40 to 80 percent of total annual rainfall volume.110 A North Carolina study found that a green roof reduced total annual runoff from the roof’s surface by 60 percent and reduced runoff from peak rainfall events by 75 percent; a Portland, Oregon, study found that an extensive green roof with a soil depth of 4 inches (10 cm) reduced total runoff by nearly 70 percent.111 In a study in New York, which found only 30 percent annual rainfall retention by an extensive green roof, the roof was nevertheless able to retain roughly 10.2 gallons of rainfall per square foot per year, the equivalent of well over 12 inches of rainfall annually. In that case, the study’s authors theorized that the lower retention value was the result of the green roof’s modular construction, which both reduced the volume of soil media and constrained the horizontal flow of water on the roof.112
Retention of runoff can vary seasonally, with most studies demonstrating greater retention in summer months when plants are active and transpire greater volumes of water, but significant retention will still occur during cooler winter months. (In Southern California, seasonal variation may be minimal due to increased rainfall and mild temperatures in winter and spring.) A yearlong study in Pennsylvania found that despite the presence of snow and freezing conditions in winter months, which can reduce green roof performance, green roofs were still able to retain on the order of 20 percent of total monthly precipitation.113 During summer months, nearly all precipitation was retained.114
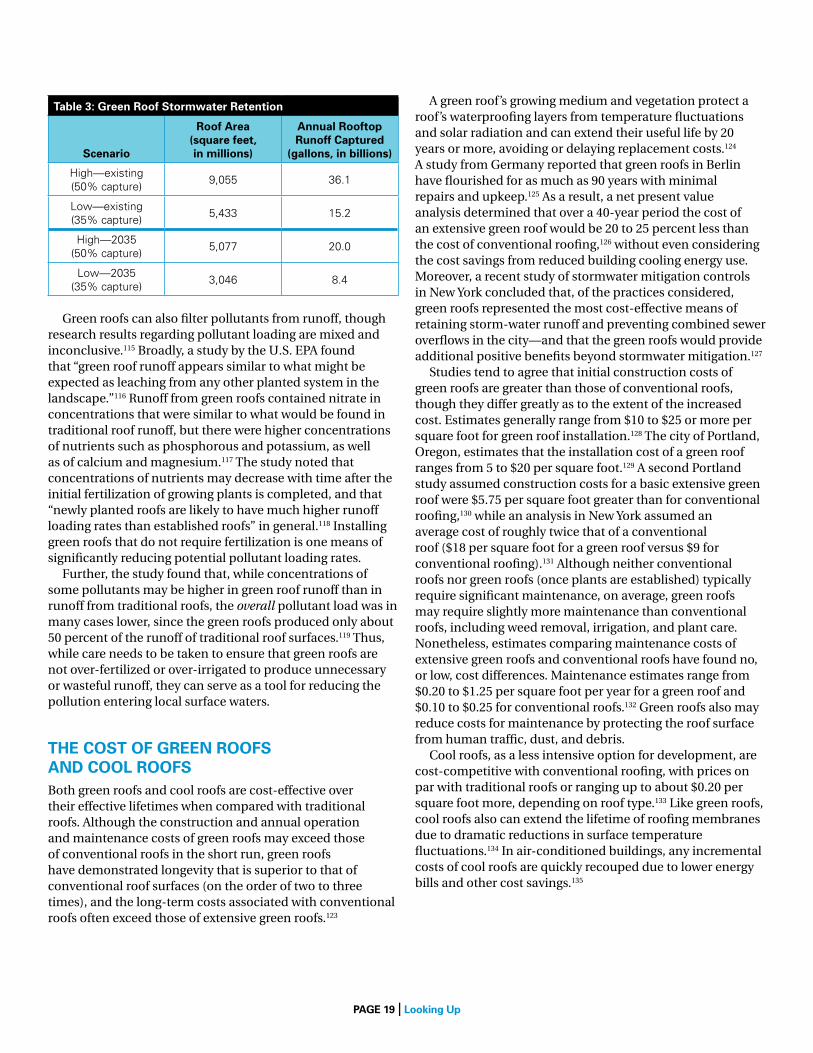
Table 3 shows the volume of stormwater runoff that could be retained by green roofs in Southern California under our various development scenarios. Our high-end estimates assume, again, that green roofs cover 50 percent of existing development or will be installed on 50 percent of roofs on new development and redevelopment occurring by 2035, and that the green roofs will retain 50 percent of the total annual rainfall. Our low-end estimates assume that green roofs cover 30 percent of existing development or will be installed on 30 percent of roofs on new development and redevelopment occurring by 2035, and that the green roofs will retain 35 percent of the total annual rainfall. In either scenario, the volume of captured water is substantial: billions of gallons per year, enough to fill more than 54,000 Olympic-size swimming pools in our high estimate for existing development.
PAge 19 | looking up
table 3: green roof stormwater retention
scenario
roof Area (square feet, in millions)
Annual rooftop runoff Captured
(gallons, in billions)
High—existing (50% capture)
9,055 36.1
Low—existing (35% capture)
5,433 15.2
High—2035 (50% capture)
5,077 20.0
Low—2035 (35% capture)
3,046 8.4
Green roofs can also filter pollutants from runoff, though research results regarding pollutant loading are mixed and inconclusive.115 Broadly, a study by the U.S. EPA found that “green roof runoff appears similar to what might be expected as leaching from any other planted system in the landscape.”116 Runoff from green roofs contained nitrate in concentrations that were similar to what would be found in traditional roof runoff, but there were higher concentrations of nutrients such as phosphorous and potassium, as well as of calcium and magnesium.117 The study noted that concentrations of nutrients may decrease with time after the initial fertilization of growing plants is completed, and that “newly planted roofs are likely to have much higher runoff loading rates than established roofs” in general.118 Installing green roofs that do not require fertilization is one means of significantly reducing potential pollutant loading rates.
Further, the study found that, while concentrations of some pollutants may be higher in green roof runoff than in runoff from traditional roofs, the overall pollutant load was in many cases lower, since the green roofs produced only about 50 percent of the runoff of traditional roof surfaces.119 Thus, while care needs to be taken to ensure that green roofs are not over-fertilized or over-irrigated to produce unnecessary or wasteful runoff, they can serve as a tool for reducing the pollution entering local surface waters.
the Cost of green roofs AnD Cool roofsBoth green roofs and cool roofs are cost-effective over their effective lifetimes when compared with traditional roofs. Although the construction and annual operation and maintenance costs of green roofs may exceed those of conventional roofs in the short run, green roofs have demonstrated longevity that is superior to that of conventional roof surfaces (on the order of two to three times), and the long-term costs associated with conventional roofs often exceed those of extensive green roofs.123
A green roof’s growing medium and vegetation protect a roof’s waterproofing layers from temperature fluctuations and solar radiation and can extend their useful life by 20 years or more, avoiding or delaying replacement costs.124 A study from Germany reported that green roofs in Berlin have flourished for as much as 90 years with minimal repairs and upkeep.125 As a result, a net present value analysis determined that over a 40-year period the cost of an extensive green roof would be 20 to 25 percent less than the cost of conventional roofing,126 without even considering the cost savings from reduced building cooling energy use. Moreover, a recent study of stormwater mitigation controls in New York concluded that, of the practices considered, green roofs represented the most cost-effective means of retaining storm-water runoff and preventing combined sewer overflows in the city—and that the green roofs would provide additional positive benefits beyond stormwater mitigation.127
Studies tend to agree that initial construction costs of green roofs are greater than those of conventional roofs, though they differ greatly as to the extent of the increased cost. Estimates generally range from $10 to $25 or more per square foot for green roof installation.128 The city of Portland, Oregon, estimates that the installation cost of a green roof ranges from 5 to $20 per square foot.129 A second Portland study assumed construction costs for a basic extensive green roof were $5.75 per square foot greater than for conventional roofing,130 while an analysis in New York assumed an average cost of roughly twice that of a conventional roof ($18 per square foot for a green roof versus $9 for conventional roofing).131 Although neither conventional roofs nor green roofs (once plants are established) typically require significant maintenance, on average, green roofs may require slightly more maintenance than conventional roofs, including weed removal, irrigation, and plant care. Nonetheless, estimates comparing maintenance costs of extensive green roofs and conventional roofs have found no, or low, cost differences. Maintenance estimates range from $0.20 to $1.25 per square foot per year for a green roof and $0.10 to $0.25 for conventional roofs.132 Green roofs also may reduce costs for maintenance by protecting the roof surface from human traffic, dust, and debris.
Cool roofs, as a less intensive option for development, are cost-competitive with conventional roofing, with prices on par with traditional roofs or ranging up to about $0.20 per square foot more, depending on roof type.133 Like green roofs, cool roofs also can extend the lifetime of roofing membranes due to dramatic reductions in surface temperature fluctuations.134 In air-conditioned buildings, any incremental costs of cool roofs are quickly recouped due to lower energy bills and other cost savings.135
PAge 20 | looking up
Green roofs and cool roofs offer the potential to improve the sustainability of urban areas in Southern California, protecting water resources and improving air quality by reducing the use of electricity for building cooling and resulting GHG emissions. Green roofs also offer the opportunity to greatly reduce the volume of stormwater runoff from rooftop surfaces, which can pick up and carry pollution to rivers, lakes, and beaches. While green roofs and cool roofs are increasingly finding acceptance in the urban environment, they are often overlooked as a solution to environmental challenges, particularly those related to water resources, because their benefits are not widely known. However, several policy options and incentives can be used to promote use of green roofs and cool roofs.
Provide incentives for residential and commercial private-party use of green roofs and cool roofsn Permitting incentives: Installing roofs in smart growth,
infill, redevelopment, or even re-roofing projects can entail substantial permitting requirements. To reduce barriers to green roof or cool roof construction and conversions, communities can offer advantages in the permitting process to projects that incorporate green roofs or cool roofs. For example, fast-track permitting procedures have been instituted for buildings with green roofs in Chicago.136 Alternatively, communities often offer permitting bonuses to projects incorporating green infrastructure practices: Chicago gives density and building height bonuses for projects with green roofs in the city’s business district,137
ConClusion AnD PoliCy reCommenDAtions ©
California A
cademy of S
ciences
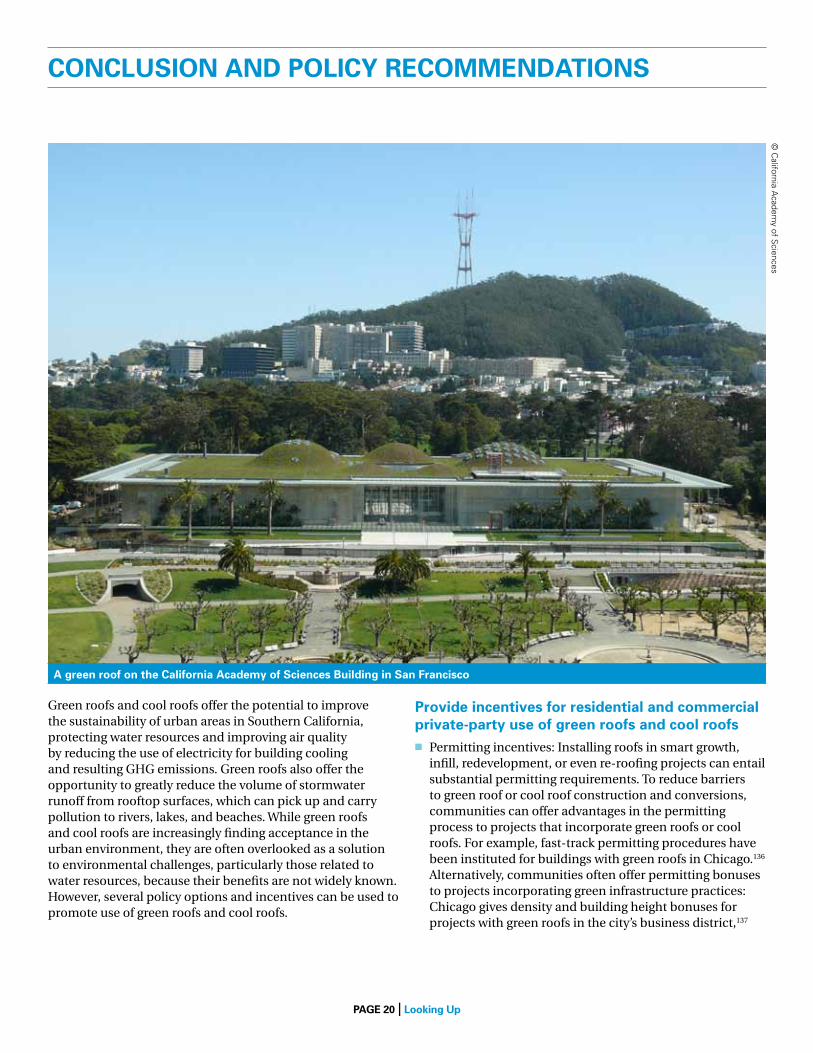
A green roof on the California Academy of sciences building in san francisco
PAge 21 | looking up
and Portland, Oregon, has offered developers proposing buildings in the Central City Plan District floor-area bonuses if a green roof is installed.138 Communities can also reduce or waive certain permit fees for green roof or cool roof installations. These permitting advantages provide an incentive for smart practices at little or no cost to the local government.
n Financial incentives: Construction or re-roofing projects often entail substantial permitting fees139 and other costs. To incentivize installation of green roofs and cool roofs, communities can reduce or waive these fees for green roof or cool roof projects. Communities can also implement grant programs that directly pay for the installation of green roofs or cool roofs on private land, or they can adopt tax rebate programs for green roofs and cool roofs that indirectly finance the cost of installation.
Adopt stormwater pollution control standards that require on-site volume retentionn The growing interest in use of green roofs is partially driven
by their utility for stormwater pollution management. On-site stormwater volume retention requirements that reduce pollution of surface waters are also effective at encouraging the use of green roofs. Adopting stormwater standards that focus on the volume of discharges is often the first step in developing more protective water quality regulations and promoting sustainable use of water resources.
n The Environmental Protection Agency is planning to reform the minimum requirements applicable to urban and suburban runoff sources nationwide. This is a once-in-a-generation opportunity to ensure that runoff sources across the country have modern pollution controls—which, in the case of urban runoff, is green infrastructure. If these national standards are sufficiently rigorous, they will help expand the use of green roofs. Additionally, regional permits and water quality improvement plans developed under the current federal requirements,140 as well as statewide regulations and local ordinances,141 offer strong opportunities to implement requirements to retain runoff on site, which in turn promotes the use of green roofs to absorb rainfall. Local ordinances and building codes can also set specific targets for installation of green roofs and cool roofs.
Provide guidance or other affirmative assistance for green roof and cool roof projectsn Through guidance and policy reform, cities should
proactively promote the use of green roofs and cool roofs to provide cooling energy savings, and green roofs to provide stormwater volume reduction benefits. Guidance includes demonstration projects, planning workshops, and technical manuals. Other assistance may include identifying and overcoming code and zoning barriers. Green roofs and cool roofs may individually 143reduce a relatively small portion of urban or suburban cooling energy use, and green roofs may individually manage only a relatively small volume of urban stormwater runoff, but collectively their installation can have a significant impact. As a result, cities should provide their residents with the knowledge and tools necessary to achieve their widespread installation.
Adopt and implement stormwater fee and rebate programsn Implementing a parcel-based stormwater fee can provide
cities with funding to address stormwater using green infrastructure practices on a regional level. Implementing a concurrent rebate program for practices that reduce stormwater runoff can, in turn, incentivize private investment in making green infrastructure improvements like installing green roofs and can reduce strain on municipal stormwater infrastructure. In particular, stormwater rebate programs can provide strong incentives for property owners to retrofit existing development that might otherwise contribute to stormwater runoff pollution and flooding, gaining benefits in terms of building cooling energy at the same time.
fully fund the u.s. ePA Clean water state revolving fundn Green roof projects and programs may be eligible to
receive support via the Clean Water State Revolving Fund. This fund provides critical assistance for projects that repair and rebuild failing water and wastewater infrastructure, and it has increasingly focused on green infrastructure projects in recent years. Given the clear benefits that practices such as green roofs can provide to the community, Congress should ensure that this program, which has been the unfortunate target of cuts during recent federal budget debates, is fully funded.
PAge 22 | looking up
endnotes
1 U.S. Environmental Protection Agency (EPA), Nonpoint on the Green Roof System: Selection, State of the Art and Energy Potential Investigation Source Control Branch (2007). “Reducing Stormwater Costs through Low Impact Development (LID) Strategies and Practices,” EPA 841-F-07-006, at 1, www.epa.gov/owow/NPS/lid/costs07/documents/reducingstormwatercosts.pdf.
2 U.S. EPA, office of Water (2005). “National Management Mea-sures to Control Nonpoint Source Pollution from Urban Areas,” EPA-841-B-05-004, at section 0.3.6, www.epa.gov/nps/urbanmm/pdf/urban_guidance.pdf.
3 U.S. General Accounting office (2001). “Water Quality, Better Data and Evaluation of Urban Runoff Programs Needed to Assess Effective-ness,” GAo-01-679, at 37, www.gao.gov/new.items/d01679.pdf.
4 See, e.g., California State Water Resources Control Board (April 30, 2003). “Waste Discharge Requirements for Storm Water Discharges from Small Municipal Separate Storm Sewer Systems,” Water Quality order No. 2003-0005-DWQ, National Pollutant Discharge Elimination System General Permit No. CAS000004, at Finding 1.
5 U.S. Environmental Protection Agency. “EPA Finalizes California’s List of Polluted Waters,” news release, october 11, 2011, yosemite.epa.gov/opa/admpress.nsf/0/F2D3C71584D71DE4852579260068780E.
6 Natural Resources Defense Council (2011). “testing the Waters: A Guide to Water Quality at Vacation Beaches,” at CA.3, www.nrdc.org/water/oceans/ttw/titinx.asp.
7 U.S. EPA, “Stormwater Discharges from Municipal Separate Storm Sewer Systems (MS4s),” cfpub.epa.gov/npdes/stormwater/munic.cfm.
8 U.S. EPA, “Combined Sewer overflows,” cfpub.epa.gov/npdes/home.cfm?program_id=5.
9 Ibid.
10 Ibid.
11 See, e.g., Natural Resources Defense Council (2011). “Rooftops to Rivers II: Green Strategies for Controlling Stormwater and Combined Sewer overflows,” www.nrdc.org/water/pollution/rooftopsii/. U.S. EPA (2008), “Managing Wet Weather with Green Infrastructure,” municipal handbook, EPA 833-F-08-007–EPA 833-F-08-010, water.epa.gov/infrastructure/greeninfrastructure/gi_policy.cfm#municipalhandbook.
12 California ocean Protection Council (May 15, 2008). “Resolution of the California ocean Protection Council Regarding Low Impact Develop-ment,” www.opc.ca.gov/webmaster/ftp/pdf/docs/Documents_Page/Reso-lutions/LID%20resolution.pdf.
13 33 U.S.C. §1251(a).
14 See, e.g., Los Angeles Regional Water Quality Control Board (July 8, 2010). Ventura County Municipal Separate Stormwater National Pollutant Discharge Elimination System (NPDES) Permit, order No. R4-2010-0108, NPDES Permit No. CAS004002. Also: San Diego Regional Water Quality Control Board (December 16, 2009). “the Waste Discharge Requirements for Discharges of Runoff from the Municipal Separate Storm Sewer Systems (MS4s) Draining the Watershed of the County of orange, the Incorporated Cities of orange County, and the orange County Flood Control District Within the San Diego Region,” order No. R9-2009-0002, NPDES Permit No. CAS0108740. Also: San Francisco Regional Water Quality Control Board (october 14, 2009, revised November 28, 2011). “Waste Discharge Requirements and National Pollutant Discharge Elimination System (NPDES) Permit for the Discharge of Stormwater Runoff from the Municipal Separate Storm Sewer Systems (MS4s) of the…San Francisco Bay Municipal Regional Stormwater Permit (MRP),” order No. R2-2009-0074, NPDES Permit No. CAS612008.
15 See Natural Resources Defense Council (2011). “Rooftops to Rivers II: Green Strategies for Controlling Stormwater and Combined Sewer overflows.”
16 See, e.g., the Rocky Mountain Climate organization and Natural Resources Defense Council (2011). “Doubled trouble: More Midwestern Extreme Storms,” www.rockymountainclimate.org/images/Doubled%20trouble.pdf; NRDC (2011). “thirsty for Answers: Preparing for the Water-Related Impacts of Climate Change in American Cities,” www.nrdc.org/water/files/thirstyforanswers.pdf.
17 California Department of Water Resources (october 2008). “Managing an Uncertain Future: Climate Change Adaptation Strategies for California’s Water,” at 4, www.water.ca.gov/climatechange/docs/ClimateChangeWhitePaper.pdf.
18 Ibid. Also: California Climate Change Center (2006). “our Changing Climate, Assessing the Risks to California,” at 6, www.energy.ca.gov/2006publications/CEC-500-2006-077/CEC-500-2006-077.PDF.
19 California Department of Water Resources (october 2008). “Managing an Uncertain Future: Climate Change Adaptation Strategies for California’s Water,” at 3.
20 California Climate Change Center (May 2009). “the Future Is Now: An Update on Climate Change Science Impacts and Response options for California,” prepared for the California Energy Commission, CEC-500-2008-071, at 15, www.energy.ca.gov/2008publications/CEC-500-2008-071/CEC-500-2008-071.PDF.
21 California Climate Change Center (August 2009). “Climate Change Scenarios and Sea Level Rise Estimates for the California 2009 Climate Change Scenarios Assessment,” CEC-500-2009-014-F, at 13-14 http://www.energy.ca.gov/2009publications/CEC-500-2009-014/CEC-500-2009-014-F.PDF.
22 Ibid.
23 Natural Resources Defense Council (2011). “thirsty for Answers: Preparing for the Water-Related Impacts of Climate Change in American Cities,” at 86.
24 California Adaptation Advisory Panel (2010). “Preparing for the Effects of Climate Change—A Strategy for California,” Pacific Council on International Policy, at 35, www.pacificcouncil.org/document.doc?id=183.
25 Bates, Bryson C., Z.W. Kundzewicz, S. Wu, and J.P. Palutikof, eds. (2008). “Climate Change and Water: technical Paper of the Intergovern-mental Panel on Climate Change,” IPCC Secretariat, Geneva, at 3, 104, www.ipcc.ch/publications_and_data/publications_and_data_technical_pa-pers.shtml#.t7ozSBz5MpQ. Also: California Climate Change Center (2006). “our Changing Climate, Assessing the Risks to California”, at 12.
26 U.S. Climate Change Science Program (May 2008). “Water Resources,” at 138, The Effects of Climate Change on Agriculture, Land Resources, Water Resources, and Biodiversity in the United States, www.climatescience.gov/Library/sap/sap4-3/final-report/default.htm.
27 California Climate Change Center (2006). “our Changing Climate: Assessing the Risks to California,” at 7. Also: Natural Resources Defense Council (March 2008). “Hotter and Drier: the West’s Changed Climate,” at 9-10, www.nrdc.org/globalWarming/west/contents.asp.
28 California Climate Change Center (March 2006). “Climate Warming and Water Supply Management in California,” CEC-500-2005-195-SF, at 3, www.energy.ca.gov/2005publications/CEC-500-2005-195/CEC-500-2005-195-SF.PDF.
29 California Department of Water Resources (october 2003). “California’s Groundwater—Bulletin 118 Update 2003,” at 24, www.water.ca.gov/groundwater/bulletin118/update2003.cfm/.
PAge 23 | looking up
30 Vermeer, M., and S. Rahmstorf (December 22, 2009). “Global Sea Level Linked to Global temperature,” Proceedings of the National Academy of Sciences 106(51), 21527-21532, at 21531, www.pnas.org/content/106/51/21527.full.pdf.
31 Huppert, D.D., A. Moore, and K. Dyson (2009). “Impacts of Climate Change on the Coasts of Washington State,” at 298-99, in Climate Impacts Group, Washington Climate Change Impacts Assessment, University of Washington, Seattle, Washington, cses.washington.edu/cig/res/ia/waccia.shtml.
32 See, e.g., Johnson, ted (Fall 2007). “Battling Seawater Intrusion in the Central & West Basins,” Water Replenishment District of Southern California, WRD Technical Bulletin, vol. 13, www.wrd.org/engineering/seawater-intrusion-los-angeles.php. Also: U.S. Geological Survey (1999). “Sustainability of Ground-Water Resources,” U.S. Geological Survey Circular 1186, at 74-75, pubs.usgs.gov/circ/circ1186/pdf/circ1186.pdf.
33 Cayan, D.R.; P.D. Bromirski, K. Hayhoe, M. tyree, M.D. Dettinger, and R.E. Flick (2008). “Climate Change Projections of Sea Level Extremes Along the California Coast,” Climatic Change 87 (Suppl 1):S57–S73.
34 California Energy Commission (November 2005). “Integrated Energy Policy Report,” CEC-100-2005-007-CMF, at 139, www.energy.ca.gov/2005publications/CEC-100-2005-007/CEC-100-2005-007-CMF.PDF. this includes the collection, conveyance, and treatment of water, the disposal of wastewater, and the heating or pressurizing of water in homes or businesses.
35 U.S. Department of Energy (DoE) (December 2006). “Energy De-mands on Water Resources: Report to Congress on the Interdependency of Energy and Water,” at 25, www.sandia.gov/energy-water/docs/121-RpttoCongress-EWwEIAcomments-FINAL.pdf. Also: California Energy Commission (November 2005). “California’s Water‒Energy Relationship,” Final Staff Report, CEC-700-2005-011-SF, at 9-10, 23-25, www.energy.ca.gov/2005publications/CEC-700-2005-011/CEC-700-2005-011-SF.PDF.
36 Anderson, Carrie (1999). “Energy Use in the Supply, Use and Dis-posal of Water in California,” Process Energy Group, Energy Efficiency Division, California Energy Commission.
37 Elkind, Ethan (2011). “Drops of Energy: Conserving Urban Water in California to Reduce Greenhouse Gas Emissions,” at 5, www.law.berkeley.edu/files/Drops_of_Energy_May_2011_v1.pdf.
38 Arizona State University School of Life Sciences (2010). Project Vulcan county/annual/sector total and per capita Co
2 emissions, http://vulcan.project.asu.edu/research.php; see Gurney, K.R., D. Mendoza, Y. Zhou, M. Fischer, C. Miller, S. Geethakumar, S. de la Rue du Can (2009). “the Vulcan Project: High Resolution Fossil Fuel Combustion Co2 Emissions Fluxes for the United States,” Environ. Sci. Technol 43, doi:10.1021/es900806c.
39 U.S. EPA (December 2011). “Greenhouse Gas Emissions from a typical Passenger Vehicle,” at 2, www.epa.gov/otaq/climate/documents/420f11041.pdf.
40 California Department of Motor Vehicles (2011). “Estimated Vehicles Registered by County for the Period of January 1 through December 31, 2010,” dmv.ca.gov/about/profile/est_fees_pd_by_county.pdf. orange, Riverside, San Bernardino, San Diego, and Ventura counties are home to another estimated 6.5 million automobiles.
41 U.S. DoE (2011) “Buildings Energy Data Book,” at 1.1.4, 1.2.5, build-ingsdatabook.eren.doe.gov/ChapterIntro1.aspx.
42 KEMA, Inc. (october 2010). “2009 California Residential Appliance Saturation Study,” prepared for the California Energy Commission, CEC‒ 200‒ 2010‒004‒ES, at 5, www.energy.ca.gov/2010publications/CEC-200-2010-004/CEC-200-2010-004-ES.PDF.
43 Based on an emissions factor of 0.631 lb. Co2 per kWh electricity for
Southern California Edison. See California Climate Registry (2008). “2007 Utility-Specific Emissions Factors,” www.climateregistry.org/resources/docs/PUP_Metrics-June-2009.xls. Emissions factors for the Los Angeles Department of Water and Power and for San Diego Gas & Electric are considerably higher.
44 Itron, Inc. (March 2006). “California Commercial End-Use Survey,” prepared for the California Energy Commission, CEC-400-2006-005, at 12, www.energy.ca.gov/2006publications/CEC-400-2006-005/CEC-400-2006-005.PDF.
45 U.S. EPA, Climate Protection Partnership Division (2008). “Reduc-ing Urban Heat Islands: Compendium of Strategies—Green Roofs,” at 1, www.epa.gov/hiri/resources/pdf/GreenRoofsCompendium.pdf.
46 NASA, “Satellites Pinpoint Drivers of Urban Heat Islands in the Northeast,” news release, December 13, 2010, www.nasa.gov/topics/earth/features/heat-island-sprawl.html.
47 See, e.g., Gaffin, S.R., C. Rosenzweig, R. Khanbilvardi, L. Parshall, S. Mahani, H. Glickman, R. Goldberg, R. Blake, R.B. Slosberg, and D. Hillel (2008). “Variations in New York City’s Urban Heat Island Strength over time and Space,” Theoretical and Applied Climatology, 94, 1-11, doi 10.1007/s00704-007-0368-3, pubs.giss.nasa.gov/abs/ga00100w.html.
48 City of Los Angeles, Environmental Affairs Department (2006). “Green Roofs—Cooling Los Angeles,” at II-1, www.fypower.org/pdf/LA_GreenRoofsResourceGuide.pdf. See also, tamrazian, A., S. LaDochy, J. Willis, and W. Patzert (2008). “Heat Waves in Southern California: Are they Becoming More Frequent and Longer Lasting?” Association of Pacific Coast Geographers Yearbook 70, 59-69, www.csus.edu/apcg/v70-ladochy.pdf. Between 1906 and 2006, the number of annual heat waves (three consecutive days over 90°F) increased by 3 events per year, and the number of individual days over 90°F increased by nearly 23 days.
49 South Coast Air Quality Management District (June 2007). “Final 2007 Air Quality Management Plan,” at ES-2, www.aqmd.gov/aqmp/07aqmp/aqmp/Complete_Document.pdf.
50 U.S. Environmental Protection Agency, “PM Standards Revision—2006,” www.epa.gov/oar/particlepollution/naaqsrev2006.html. these include measurements of PM 2.5 and PM 10.
51 Sailor, D.J. (1995). “Simulated Urban Climate Response to Modifications in Surface Albedo and Vegetative Cover,” Journal of Applied Meteorology 34(7), 1694-1704, at 1694. Also: Horowitz, Cara (2011). “Bright Roofs, Big City: Keeping L.A. Cool through an Aggressive Cool Roof Program,” Anthony Pritzker Environmental Law and Policy Briefs, Policy Brief No. 2, at 2, cdn.law.ucla.edu/SiteCollectionDocuments/Centers%20and%20Programs/Emmett%20Center%20on%20Climate%20Change%20and%20the%20Environment/Pritzker_02_Bright_Roofs_Big_City.pdf.
52 Ibid. Also: Rosenfeld, A.H., H. Akbari, J.J. Romm, and M. Pomerantz (1998). “Cool Communities: Strategies for Heat Island Mitigation and Smog Reduction,” Energy and Buildings 28, 51-62, at 51, coolcolors.lbl.gov/assets/docs/Papers/EnergyandBuilding-98%20%28RosenfeldAkbari-CoolCommunities%29.pdf.
53 Changnon, Stanley A., et al. (1996). “Impacts and Responses to the 1995 Heat Wave: A Call to Action,” Bulletin of the American Meteorological Society 77, 1497-1506, at 1498, http://journals.ametsoc.org/doi/pdf/10.1175/1520-0477%281996%29077%3C1497%3AIARttH%3E2.0.Co%3B2.
54 California Climate Change Center (March 2009). “Estimating the Mortality Effect of the July 2006 California Heat Wave,” CEC-500-2009-036-D, at 1, www.energy.ca.gov/2009publications/CEC-500-2009-036/CEC-500-2009-036-D.PDF.
55 Ibid., at 6.
PAge 24 | looking up
56 Akbari, H., A.H. Rosenfeld, and H. taha (1990). “Summer Heat Islands, Urban trees, and White Surfaces,” Lawrence Berkeley National Laboratory, LBL-28308, at 3 https://isswprod.lbl.gov/library/view-docs/public/output/LBL-28308.pdf; see also, Wong, N.H., S.K. Jusuf, N.I. Syafii, Y. Chen, N. Hajadi, H. Sathyanarayanan, and Y.V. Manickavasagam (2011). “Evaluation of the Impact of the Surrounding Urban Morphology on Build-ing Energy Consumption,” Solar Energy, v. 85, 57-71 (1 degree celsius of outdoor air temperature reduction saves 5 percent of building energy consumption).
57 Peck, Steven W., and Jordan Richie (2009). “Green Roofs and the Urban Heat Island Effect,” Buildings 103, www.buildings.com/ArticleDetails/tabid/3334/ArticleID/8620/Default.aspx#top.
58 Ibid.
59 Ibid. Also: U.S. EPA, Climate Protection Partnership Division (2008). “Reducing Urban Heat Islands: Compendium of Strategies—Green Roofs,” at 3.
60 Peck, Steven W., and Jordan Richie (2009). “Green Roofs and the Urban Heat Island Effect,” Buildings 103, no. 7. Also: U.S. DoE (August 2004). “Green Roofs,” Federal technology Alert, DoE/EE-0298, at 6, www1.eere.energy.gov/femp/pdfs/fta_green_roofs.pdf.
61 Gaffin, S.R., C. Rosenzweig, J. Eichenbaum-Pikser, R. Khanbilvardi, and t. Susca, (2010). “A temperature and Seasonal Energy Analysis of Green, White, and Black Roofs,” Columbia University, Center for Climate Systems Research, at 3, www.coned.com/coolroofstudy/. .
62 U.S. EPA, Climate Protection Partnership Division (2008). “Reducing Urban Heat Islands: Compendium of Strategies—Green Roofs,” at 4.
63 Ibid.; City of Los Angeles Environmental Affairs Department (2006). “Green Roofs—Cooling Los Angeles: A Resource Guide,” www.fypower.org/pdf/LA_GreenRoofsResourceGuide.pdf.
64 U.S. EPA, Climate Protection Partnership Division (2008). “Reducing Urban Heat Islands: Compendium of Strategies—Green Roofs,” at 4.
65 Ibid.
66 Ibid., at 2. Also: City of Los Angeles Environmental Affairs Department, 2006. “Green Roofs–Cooling Los Angeles: A Resource Guide,” www.fypower.org/pdf/LA_GreenRoofsResourceGuide.pdf; Lerum, Vidar (April 7, 2006). “Green Roofs in the Desert,” lab report, Arizona State University, www.vidarlerum.com/resources/greenroofreport.pdf; City of Portland, Maine, “Sustainable Portland: Incorporating sustainability into everyday decision-making,” at 6-7, www.portlandmaine.gov/planning/sustainableportlandbrochure.pdf; City of Philadelphia, Mayor’s office of Sustainability, “Green Buildings,” www.phila.gov/green/greenBuilding.html.
67 See Rosenzweig, C., S. Gaffin, and L. Parshall, eds. (2006). . “Green Roofs in the New York Metropolitan Region: Research Report,” Columbia University Center for Climate Systems Research and NASA Goddard Institute for Space Studies, pubs.giss.nasa.gov/docs/2006/2006_Rosenzweig_etal.pdf.
68 U.S. EPA, Climate Protection Partnership Division (2008). “Reducing Urban Heat Islands: Compendium of Strategies—Cool Roofs,” at 1, www.epa.gov/hiri/resources/pdf/CoolRoofsCompendium.pdf; Also: Gaffin, S.R., M. Imhoff, C. Rosenzweig, R. Khanbilvardi, A. Pasqualini, A.Y.Y. Kong, D. Grillo, A. Freed, D. Hillel, and E. Hartung (2012). “Bright Is the New Black: Multi-Year Performance of High-Albedo Roofs in an Urban Climate,” Environ. Res. Lett., 7, 014029, doi:10.1088/1748-9326/7/1/014029.
69 See, e.g., NRDC (2011) “Capturing Rainwater from Rooftops: An Efficient Water Resources Management Strategy that Increases Supply and Reduces Pollution,” www.nrdc.org/water/rooftoprainwatercapture.asp.
70 Weeks, Kirsten (2008). “the old and the Nueva: Green Roof thermal Performance” Greening Rooftops for Sustainable Communities Conference Proceedings.
71 U.S. DoE, Energy Efficiency and Renewable Energy (Aug 12, 2011). “Photovoltaic Cell Conversion Efficiency,” www.eere.energy.gov/basics/renewable_energy/pv_cell_conversion_efficiency.html.
72 U.S. EPA, Climate Protection Partnership Division (2008). “Reducing Urban Heat Islands: Compendium of Strategies—Green Roofs,” at 1.
73 Ibid.
74 See, e.g., City of toronto (2005). “Report on the Environmental Benefits and Costs of Green Roof technology for the City of toronto,” at 7-11, www.toronto.ca/greenroofs/pdf/fullreport103105.pdf; Also: Rosenzweig, C., S. Gaffin, and L. Parshall, eds. (2006). . “Green Roofs in the New York Metropolitan Region: Research Report,” Columbia University Center for Climate Systems Research and NASA Goddard Institute for Space Studies,.
75 Weeks, K. (2008). “the old and the Nueva: Green Roof thermal Performance,” Greening Rooftops for Sustainable Communities Confer-ence Proceedings. For one research site in tempe, Arizona, the daytime temperature (mean radiant temperature) peaked at roughly 20°F below the ambient air temperature. See Lerum, Vidar (April 7, 2006). “Green Roofs in the Desert,” lab report, Arizona State University.
76 Penn State Center for Green Roof Research (2009). “Green Roof Fact Sheets: Air Conditioning,” web.me.com/rdberghage/Centerforgreen-roof/airconditioning.html.
77 Liu, K. (2003). “Engineering Performance of Rooftop Gardens though Field Evaluation,” National Research Council Canada (Report NRCC-46294), at 1, www.nrc-cnrc.gc.ca/obj/irc/doc/pubs/nrcc46294/nrcc46294.pdf.
78 Spala, A., H.S. Bagiorgas, M.N. Assimakopoulos, J. Kalavrouziotis, D. Matthopoulos, and G. Mihalakakou (2008). “on the Green Roof System: Selection, State of the Art and Energy Potential Investigation of a System Installed in an office Building in Athens, Greece,” Renewable Energy 33(1), 173-177.
79 Ibid. Also see, generally, Gaffin, S.R., C. Rosenzweig, J. Eichenbaum-Pikser, R. Khanbilvardi, and t. Susca (2010). “A temperature and Seasonal Energy Analysis of Green, White, and Black Roofs. New York, NY,” Columbia University Center for Climate Systems Research.
80 Sfakianaki, A., E. Pagalou, K. Pavlou, M. Santamouris, and M.N. Assimakopoulos (2009). “theoretical and Experimental Analysis of the thermal Behaviour of a Green Roof System Installed in two Residential Buildings in Athens, Greece,” International Journal of Energy Research 33(12), 1059-1069, at 1065-1066.
81 Sonne, Jeff (2006). “Evaluating Green Roof Energy Performance,” ASHRAE Journal 48, at 59, www.fsec.ucf.edu/en/media/newsletters/br-post/winter2006/ASHRAEJeffSonne.pdf.
82 Wong, N.H., D.K.W. Cheong, J. Yan, C.S. Soh, C.L. ong, and A. Sia (2003). “the Effects of Rooftop Garden on Energy Consumption of a Commercial Building in Singapore,” Energy and Buildings, 35(4), 353–364.
83 Bass, B., and B. Baskaran (2003). “Evaluating Rooftop and Vertical Gardens as an Adaptation Strategy for Urban Areas,” National Research Council Canada, Report NRCC-46737, at 84-85, www.nrc-cnrc.gc.ca/obj/irc/doc/pubs/nrcc46737/nrcc46737.pdf.
84 City of Portland (2008). “Cost Benefit Evaluation of Ecoroofs 2008,” at 9, www.portlandonline.com/bes/index.cfm?a=261053&c=50818.
85 Penn State Center for Green Roof Research (2009). “Green Roof Fact Sheets, Air Conditioning,” web.me.com/rdberghage/Centerforgreen-roof/airconditioning.html.
86 Peck, Steven W., and Jordan Richie (2009). “Green Roofs and the Urban Heat Island Effect,” Buildings 103 (citing t. Leonard and J. Leonard, “the Green Roof Energy Performance—Rooftop Data Analyzed,” Greening Rooftops for Sustainable Communities Conference Proceedings (Green Roofs for Healthy Cities: Washington, 2005).
PAge 25 | looking up
87 See, e.g., Levinson, R., H. Akbari, S. Konopacki, and S.E. Bretz (2005). “Inclusion of Cool Roofs in Nonresidential title 24 Prescriptive Requirements,” Energy Policy 33, 151-170, DoI: 10.1016/S0301-4215(03)00206-4 (finding average savings of 0.297 kWh/ft2 for buildings with cool roofs). Also: Akbari, H., R. Levinson, and L. Rainer (2005). “Monitoring the Energy-Use Effects of Cool Roofs on California Commercial Buildings,” Energy and Buildings 37, 1007-1016 DoI: 10.1016/j.enbuild.2004.11.013 (results for climate zone 9, estimating potential energy savings as 1.1 kWh/ft2 for a retail building and 0.5 kWh/ft2 for a school building in the Los Angeles area).
88 See U.S. EPA (october 2008). “Reducing Urban Heat Islands: Compendium of Strategies—Cool Roofs,” at 9 (citing, Akbari, H., S. Bretz, J. Hanford, D. Kurn, B. Fishman, H. taha, and W. Bos (1993). “Monitoring Peak Power and Cooling Energy Savings of Shade trees and White Surfaces in the Sacramento Municipal Utility District (SMUD) Service Area: Data Analysis, Simulations, and Results,” Lawrence Berkeley National Laboratory, LBNL-34411; Parker, D.S., J.B. Cummings, J.R. Sherwin, t.C. Stedman, and J.E.R. McIlvaine (1994). “Measured Residential Cooling Energy Savings from Reflective Roof Coatings in Florida,” ASHRAE transactions, Paper 3788, 100(2), 36-49). ).
89 Cal. Code of Reg., title 24, Part 6, Building Energy Efficiency Code (2008). Cool roof requirements can be found in sections 118, 141, 142, 143, 149, 151, and 152.
90 Berdahl P., H. Akbari, R. Levinson, W.A. Miller (2008). “Weathering of Roofing Materials—An overview,” Construction and Building Materials 22, 423-433. Also: Gaffin, S.R., M. Imhoff, C. Rosenzweig, R. Khanbilvardi, A. Pasqualini, A.Y.Y. Kong, D. Grillo, A. Freed, D. Hillel, and E. Hartung (2012). “Bright Is the New Black: Multi-Year Performance of High-Albedo Roofs in an Urban Climate,” Environ. Res. Lett., 7, 014029, doi:10.1088/1748-9326/7/1/014029. Also: Cheng, Meng-Dawn, W. Miller, J. New, and P. Berdahl ( 2011). Understanding the Long-term Effects of Environmental Exposure on Roof Reflectance in California,” Construction and Building Materials 26:516-5.
91 U.S. DoE (August 2004). “Federal technology Alert: Green Roofs,” DoE/EE-0298, at 7, www1.eere.energy.gov/femp/pdfs/fta_green_roofs.pdf.
92 Rosenzweig, C., S. Gaffin, and L. Parshall, eds. (2006). . “Green Roofs in the New York Metropolitan Region: Research Report,” Colum-bia University Center for Climate Systems Research and NASA Goddard Institute for Space Studies, at 10-111.
93 Ibid., at 11.
94 State of California Flex Your Power program, “Cool Roofs,” www.fypower.org/inst/tools/products_results.html?id=100123.
95 For a description of our study area, please see our full methodology, presented in the Appendix.
96 KEMA, Inc. (october 2010). “2009 California Residential Appliance Saturation Study,” prepared for the California Energy Commission, CEC-200-2010-004-ES, at 5; Konopacki, S., H. Akbari, M. Pomerantz, S. Gabersek, and L. Gartland (May 1997). “Cooling energy savings potential of light-colored roofs for residential and commercial buildings in 11 U.S. metropolitan areas,” Lawrence Berkeley National Laboratory LBNL-39433, at table C-3, www.epa.gov/hiri/resources/pdf/11_cities_main.pdf.
97 Based on 2011 rate from Los Angeles Department of Water and Power, “2010 Power Integrated Resource Plan,” at Figure 5.5.
98 California Climate Registry (2008). “2007 Utility-Specific Emissions Factors,” www.climateregistry.org/resources/dos/PUP_Metrics-June-2009.xls. Emissions factor for Southern California Edison.
99 U.S. EPA (2012). “Clean Energy: Calculations and References,” www.epa.gov/cleanenergy/energy-resources/refs.html.
100 See Gaffin, S.R., C. Rosenzweig, J. Eichenbaum-Pikser, R. Khanbilvardi, and t. Susca, (2010). “A temperature and Seasonal Energy Analysis of Green, White, and Black Roofs,” Columbia University, Center for Climate Systems Research, at 10-11.
101 Liu, K., and B. Bass (2005) “Performance of Green Roof Systems,” National Research Council Canada, Report NRCC-47705, at 6-8, www.nrc-cnrc.gc.ca/obj/irc/doc/pubs/nrcc47705/nrcc47705.pdf.
102 See Sailor, D.J. (1995). “Simulated Urban Climate Response to Modifications in Surface Albedo and Vegetative Cover,” J. of Applied Meteorology 34, at 1700; Akbari, H. (2005). “Energy Saving Potentials and Air Quality Benefits of Urban Heat Island Mitigation,” Lawrence Berkeley National Laboratory, at 7 www.osti.gov/bridge/servlets/purl/860475-UlHWIq/860475.pdf (citing potential for 2°C reduction on a hot summer afternoon); Millstein, D. and S. Menon (2011). “Regional Climate Consequences of Large-scale Cool Roof and Photovoltaic Array Deployment,” Environ. Res. Lett. 6 at table 1 (predicting a 0.5°C drop in L.A. temperatures from cool roofs and pavements combined); Rosenfeld, A.H., H. Akbari, J.J. Romm, and M. Pomerantz (1998). “Cool Communities,” Energy and Buildings 28 (predicting a 1.5°C drop in L.A. temperatures from cool roofs and pavements combined).
103 Levinson, R., H. Akbari, S. Konopacki, and S.E. Bretz (2005). “Inclusion of Cool Roofs in Nonresidential title 24 Prescriptive Requirements,” Energy Policy 33, 151-170, at 158, DoI: 10.1016/S0301-4215(03)00206-4.
104 For a discussion of this effect, see Akbari, H., S. Menon, and A. Rosenfeld (2009). “Global Cooling: Increasing World-wide Urban Albedos to offset Co
2,” Climatic Change 94(3-4), 275-286.
105 Ibid.; VanCuren, “the Radiative Forcing Benefits of ‘Cool Roof’ Construction in California: Quantifying the Climate Impacts of Building Albedo Modification,” Climatic Change, in press; Horowitz, Cara (2011). “Bright Roofs, Big City: Keeping L.A. Cool through an Aggressive Cool Roof Program,” Anthony Pritzker Environmental Law and Policy Briefs, Policy Brief No. 2,; but see, Jacobson, M.Z., and J.E. ten Hoeve (2011), “Effects of Urban Surfaces and White Roofs on Global and Regional Climate,” J. Climate, in press.
106 We again note that while cool roofs do not provide this same benefit, they can be combined with rooftop rainwater capture systems such as rain barrels or cisterns which both reduce the volume of stormwater runoff and increase water supplies. See, NRDC (2011) “Capturing Rainwater from Rooftops: An Efficient Water Resources Management Strategy that Increases Supply and Reduces Pollution.”
107 U.S. DoE (August 2004). “Green Roofs,” Federal technology Alert, DoE/EE-0298, at 9. Also: U.S. EPA (February 2009). “Green Roofs for Stormwater Runoff Control,” EPA/600/R-09/026, www.epa.gov/nrmrl/pubs/600r09026/600r09026.pdf.
108 Ibid.
109 City of Portland (2008). “Cost Benefit Evaluation of Ecoroofs,” at 7-8, www.portlandonline.com/bes/index.cfm?a=261053&c=50818. Also: Gaffin, S.R., C. Rosenzweig, R. Khanbilvardi, J. Eichenbaum-Pikser, D. Hillel, P. Culligan, W. McGillis, and M. odlin (January 2011). “Stormwater Retention for a Modular Green Roof Using Energy Balance Data,” Colum-bia University Center for Climate Systems Research, www.coned.com/newsroom/pdf/Stormwater_Retention_Analysis.pdf.
110 Palla, A., I. Gnecco, L.G. Lanza (2010). “Hydrologic Restoration in the Urban Environment Using Green Roofs,” Water, 2(2), 140-154, at 152, www.mdpi.com/2073-4441/2/2/140/.
111 See U.S. EPA (october 2008). “Reducing Urban Heat Islands: Com-pendium of Strategies—Green Roofs,” at 9.
112 Gaffin, S.R., C. Rosenzweig, R. Khanbilvardi, J. Eichenbaum-Pikser, D. Hillel, P. Culligan, W. McGillis, and M. odlin (January 2011). “Stormwater Retention for a Modular Green Roof Using Energy Balance Data,” Columbia University Center for Climate Systems Research, at 18.
PAge 26 | looking up
113 U.S. EPA (February 2009). “Green Roofs for Stormwater Runoff Control,” EPA/600/R-09/026, at 3-14,
114 Ibid.
115 See, e.g., Ibid.; Berndtsson, J., et al. (2008), “First Flush Effect from Vegetated Roofs During Simulated Rain Events,” Nordic Hydrology 39(3), 171-179.
116 U.S. EPA (February 2009). “Green Roofs for Stormwater Runoff Control,” EPA/600/R-09/026, at 4-16.
117 Ibid.
118 Ibid., at 4-17.
119 Ibid., at 4-16.
120 U.S. Department of Agriculture (2009). “Urban forest effects model (UFoRE): About the application. How the model works,” http://www.ufore.org/about/01-00.html.
121 Getter, K. L., Rowe, D. B., Robertson, G. P., Cregg, B. M., & Andre-sen, J. A. (2009). Carbon sequestration potential of extensive green roofs. Environmental Science and Technology 43(19), 7564–7570.
122 Ibid.
123 U.S. EPA (october 2008). “Reducing Urban Heat Islands: Compendium of Strategies—Green Roofs,” at 10-11; Rosenzweig, C., S. Gaffin, and L. Parshall, eds. (2006). “Green Roofs in the New York Metropolitan Region: Research Report,” Columbia University Center for Climate Systems Research and NASA Goddard Institute for Space Studies at 41; City of toronto (2005), “Report on the Environmental Benefits and Costs of Green Roof technology for the City of toronto,” at 31-32.
124 U.S. EPA (2000). “Vegetated Roof Cover: Philadelphia, Pennsylva-nia,” Report EPA-841-B-00-005D, at 3. www.epa.gov/nps/roofcover.pdf.
125 Porsche, U. and M. Köhler (December 2003). “Life cycle costs of green roofs: A comparison of Germany, USA, and Brazil,” from the Proceedings of the World Climate and Energy Event, Rio de Janeiro, Brazil.
126 Clark, C., P. Adriaens, and F.B. talbot (2008). “Green roof valuation: a probabilistic economic analysis of environmental benefits,” Environ-mental Science and Technology 42(6), 2155–2161;.Also: City of toronto (2005), “Report on the Environmental Benefits and Costs of Green Roof technology for the City of toronto”; Wong, N. H., S.F. tay, R. Wong, C.L. ong, and A. Sia (2003). “Life cycle cost analysis of rooftop gardens in Singapore. Building and Environment 38(3), 499-509, finding that the life-cycle cost of extensive green roofs was less than the life-cycle cost of conventional roofs, whether or not energy costs were considered and regardless of higher green roof construction costs.
127 Gaffin, S.R., C. Rosenzweig, R. Khanbilvardi, J. Eichenbaum-Pikser, D. Hillel, P. Culligan, W. McGillis, and M. odlin (January 2011). “Stormwater Retention for a Modular Green Roof Using Energy Balance Data,” Columbia University Center for Climate Systems Research, at 3.
128 Ibid., at 17; Rosenzweig, C., S. Gaffin, and L. Parshall, eds. (2006). “Green Roofs in the New York Metropolitan Region: Research Report,” Columbia University Center for Climate Systems Research and NASA Goddard Institute for Space Studies, at 43.
129 City of Portland, Bureau of Environmental Services, “Ecoroof Incentives,” www.portlandonline.com/bes/index.cfm?c=48724&.
130 City of Portland (2008). “Cost Benefit Evaluation of Ecoroofs,” at 17-18.
131 Rosenzweig, C., S. Gaffin, and L. Parshall, eds. (2006). “Green Roofs in the New York Metropolitan Region: Research Report,” Columbia University Center for Climate Systems Research and NASA Goddard Institute for Space Studies, at 43-44.
132 Ibid., at 44; City of Portland (2008), “Cost Benefit Evaluation of Ecoroofs,” at 18; Columbia & NASA, 2006; Gaffin, et al. (January 2011), “Stormwater Retention for a Modular Green Roof Using Energy Balance Data,” at 17.
133 Akbari, H. (2005). “Energy Saving Potentials and Air Quality Benefits of Urban Heat Island Mitigation,” Lawrence Berkeley National Laboratory, at 5. Akbari, H., et al., (May 2006 draft). “Inclusion of Solar Reflectance and thermal Emittance Prescriptive Requirements for Residential Roofs in title 24,” California Energy Commission, at table 4, www.energy.ca.gov/title24/2008standards/prerulemaking/documents/2006-05-18_workshop/2006-05-17_RESIDENtIAL_RooFS.PDF.
134 See Gaffin, S.R., M. Imhoff, C. Rosenzweig, R. Khanbilvardi, A. Pasqualini, A.Y.Y. Kong, D. Grillo, A. Freed, D. Hillel, and E. Hartung (2012). “Bright Is the New Black: Multi-year Performance of High-Albedo Roofs in an Urban Climate,” Environ. Res. Lett., 7, 014029, doi:10.1088/1748-9326/7/1/014029.
135 Many studies demonstrate net energy savings and cost savings from cool roofs on air-conditioned buildings, including Levinson, R., H. Akbari, S. Konopacki, and S.E. Bretz (2005). “Inclusion of Cool Roofs in Nonresidential title 24 Prescriptive Requirements,” Energy Policy 33, 151-170, DoI: 10.1016/S0301-4215(03)00206-4; Rosenfeld, A.H., H. Akbari, J.J. Romm, and M. Pomerantz (1998). “Cool Communities: Strategies for Heat Island Mitigation and Smog Reduction,” Energy and Buildings 28, 51-62; and Konopacki, S., H. Akbari, M. Pomerantz, S. Gabersek, and L. Gartland (May 1997). “Cooling energy savings potential of light-colored roofs for residential and commercial buildings in 11 U.S. metropolitan areas,” Lawrence Berkeley National Laboratory LBNL-39433. In addition to savings from direct energy use reductions, building owners also save money because of lower ambient city temperatures; because they can install smaller HVAC systems; and because cool roofs are likely more durable than traditional roofs since they have to withstand far lower temperatures. Rosenfeld, A.H., H. Akbari, J.J. Romm, and M. Pomerantz (1998). “Cool Communities: Strategies for Heat Island Mitigation and Smog Reduction,” Energy and Buildings 28, 51-62.
136 taylor, D.A. (2007). “Growing Green Roofs, City by City,” Environ-mental Health Perspectives, 115(6): A306–A311, ehp03.niehs.nih.gov/article/info%3Adoi%2F10.1289%2Fehp.115-a306.
137 Ibid.
138 Liptan, t., and E. Strecker (2003). “Ecoroofs (Greenroofs)—A More Sustainable Infrastructure,” proceedings from the National Conference on Urban Stormwater: Enhancing Programs at the Local Level, Chicago, Feb-ruary 17–20, 2003, www.epa.gov/owow/NPS/natlstormwater03/20Liptan.pdf.
139 See, e.g., Los Angeles Department of Building and Safety, “Fee schedule for express permit fees,” ladbs.org/LADBSWeb/fee-schedule.jsf.
140 See, e.g., Ventura County Municipal Separate Stormwater National Pollutant Discharge Elimination System (NPDES) Permit, order No. R4-2010-0108, NPDES Permit No. CAS004002. Also: San Diego Regional Water Quality Control Board (December 16, 2009). “the Waste Discharge Requirements for Discharges of Runoff from the Municipal Separate Storm Sewer Systems (MS4s) Draining the Watershed of the County of orange, the Incorporated Cities of orange County, and the orange County Flood Control District Within the San Diego Region,” order No. R9-2009-0002, NPDES Permit No. CAS0108740.
141 See, e.g., City of Los Angeles, Department of Public Works (September 28, 2011). “Los Angeles Puts the LID on Stormwater Pollution,” press release, lacitysan.org/wpd/Siteorg/program/LID_ordinance_Passes.pdf; City of Santa Monica, Urban Watershed Management Program, “Working for a Cleaner Bay,” www.smgov.net/uploadedFiles/Departments/oSE/Categories/Urban_Runoff/UR_Brochure.pdf.
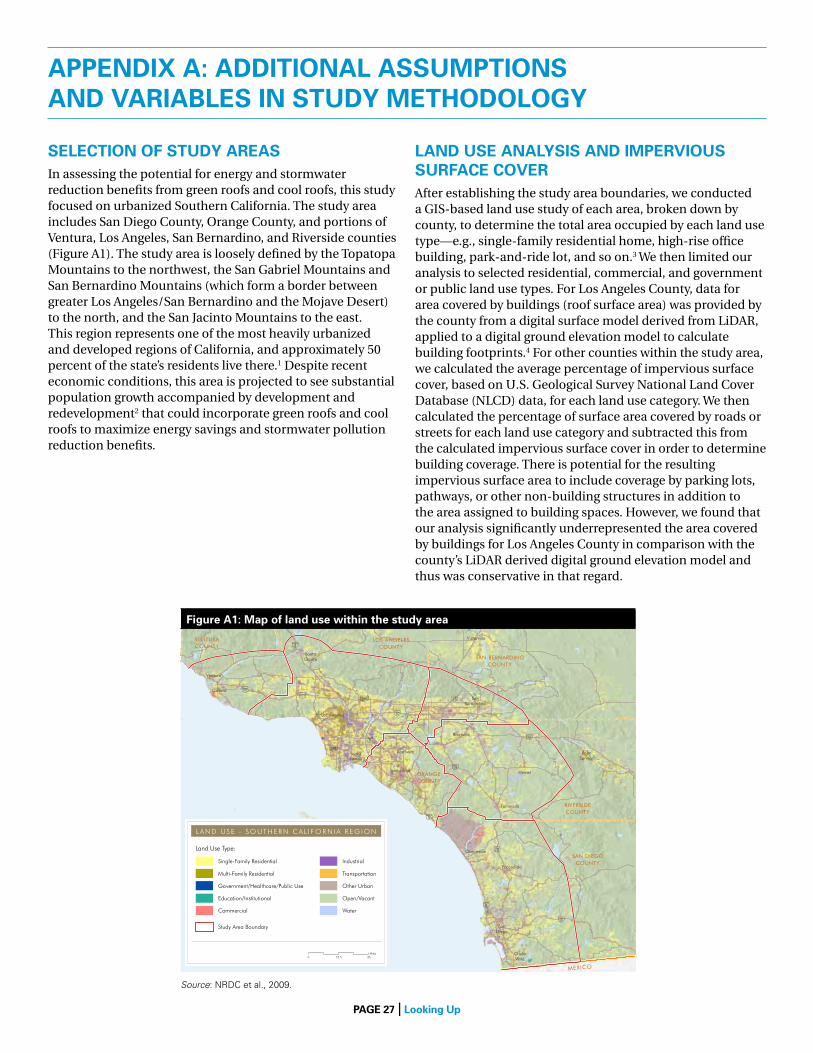
PAge 27 | looking up
VENTURACOUNTY
LOS ANGELESCOUNTY
SAN BERNARDINOCOUNTY
RIVERSIDECOUNTY
SAN DIEGOCOUNTY
ORANGECOUNTY
MEXICO
@
I
B
@
}
N
@
C
C
A
B
@
}
C
Los Angeles
LongBeach
Santa Ana
Riverside
SanBernardino
SanDiego
ChulaVista
Escondido
Oceanside
Anaheim
Ventura
Oxnard
SantaClarita
Temecula
Hemet
Palmdale
Victorville
PalmSprings
Land Use Type:
Single-Family Residential
Multi-Family Residential
Government/Healthcare/Public Use
Land use data based on SCAG 2005 and SANDAG2007 land use datasets. Map created by GreenInfoNetwork, January 2009. 0 2512.5
Miles
Study Area Boundary
Education/Institutional
Commercial
Industrial
Other Urban
Open/Vacant
Water
Transportation
LA N D U S E - SO U T H E R N C AL I F O R N I A R E G I O N
APPenDix A: ADDitionAl AssumPtions AnD vAriAbles in stuDy methoDology
seleCtion of stuDy AreAsIn assessing the potential for energy and stormwater reduction benefits from green roofs and cool roofs, this study focused on urbanized Southern California. The study area includes San Diego County, Orange County, and portions of Ventura, Los Angeles, San Bernardino, and Riverside counties (Figure A1). The study area is loosely defined by the Topatopa Mountains to the northwest, the San Gabriel Mountains and San Bernardino Mountains (which form a border between greater Los Angeles/San Bernardino and the Mojave Desert) to the north, and the San Jacinto Mountains to the east. This region represents one of the most heavily urbanized and developed regions of California, and approximately 50 percent of the state’s residents live there.1 Despite recent economic conditions, this area is projected to see substantial population growth accompanied by development and redevelopment2 that could incorporate green roofs and cool roofs to maximize energy savings and stormwater pollution reduction benefits.
lAnD use AnAlysis AnD imPervious surfACe CoverAfter establishing the study area boundaries, we conducted a GIS-based land use study of each area, broken down by county, to determine the total area occupied by each land use type—e.g., single-family residential home, high-rise office building, park-and-ride lot, and so on.3 We then limited our analysis to selected residential, commercial, and government or public land use types. For Los Angeles County, data for area covered by buildings (roof surface area) was provided by the county from a digital surface model derived from LiDAR, applied to a digital ground elevation model to calculate building footprints.4 For other counties within the study area, we calculated the average percentage of impervious surface cover, based on U.S. Geological Survey National Land Cover Database (NLCD) data, for each land use category. We then calculated the percentage of surface area covered by roads or streets for each land use category and subtracted this from the calculated impervious surface cover in order to determine building coverage. There is potential for the resulting impervious surface area to include coverage by parking lots, pathways, or other non-building structures in addition to the area assigned to building spaces. However, we found that our analysis significantly underrepresented the area covered by buildings for Los Angeles County in comparison with the county’s LiDAR derived digital ground elevation model and thus was conservative in that regard.
figure A1: map of land use within the study area
Source: NRDC et al., 2009.
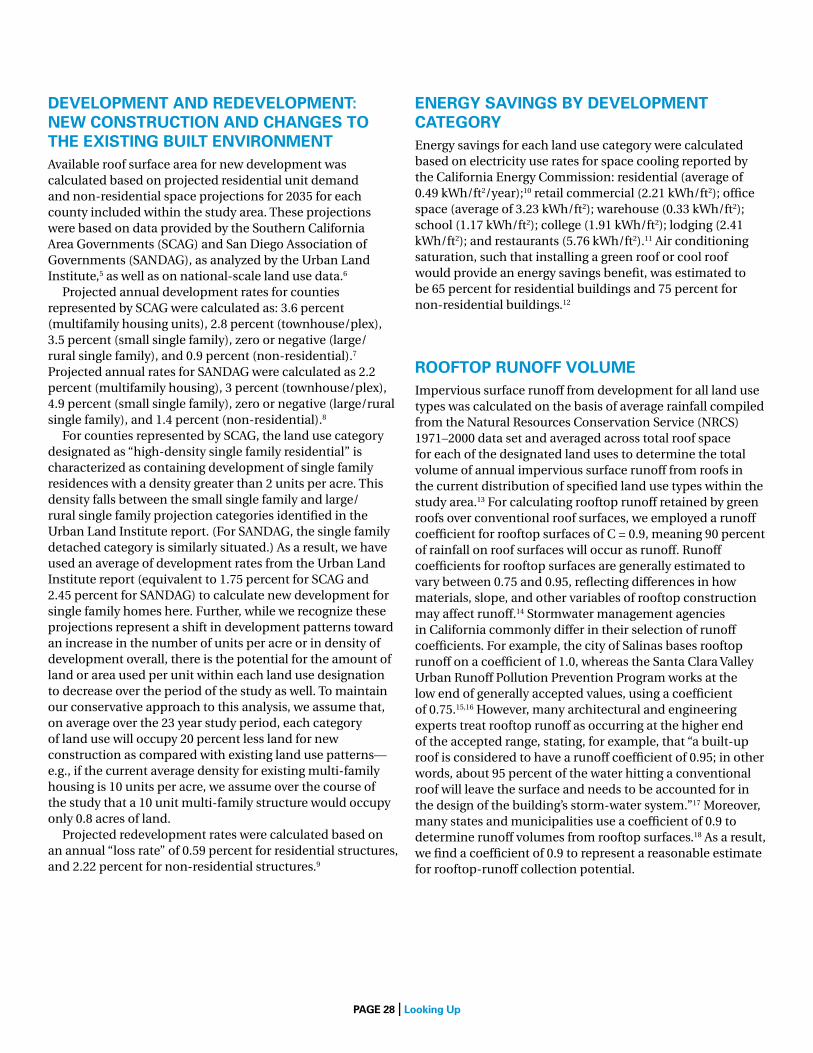
PAge 28 | looking up
DeveloPment AnD reDeveloPment: new ConstruCtion AnD ChAnges to the existing built environmentAvailable roof surface area for new development was calculated based on projected residential unit demand and non-residential space projections for 2035 for each county included within the study area. These projections were based on data provided by the Southern California Area Governments (SCAG) and San Diego Association of Governments (SANDAG), as analyzed by the Urban Land Institute,5 as well as on national-scale land use data.6
Projected annual development rates for counties represented by SCAG were calculated as: 3.6 percent (multifamily housing units), 2.8 percent (townhouse/plex), 3.5 percent (small single family), zero or negative (large/rural single family), and 0.9 percent (non-residential).7 Projected annual rates for SANDAG were calculated as 2.2 percent (multifamily housing), 3 percent (townhouse/plex), 4.9 percent (small single family), zero or negative (large/rural single family), and 1.4 percent (non-residential).8
For counties represented by SCAG, the land use category designated as “high-density single family residential” is characterized as containing development of single family residences with a density greater than 2 units per acre. This density falls between the small single family and large/rural single family projection categories identified in the Urban Land Institute report. (For SANDAG, the single family detached category is similarly situated.) As a result, we have used an average of development rates from the Urban Land Institute report (equivalent to 1.75 percent for SCAG and 2.45 percent for SANDAG) to calculate new development for single family homes here. Further, while we recognize these projections represent a shift in development patterns toward an increase in the number of units per acre or in density of development overall, there is the potential for the amount of land or area used per unit within each land use designation to decrease over the period of the study as well. To maintain our conservative approach to this analysis, we assume that, on average over the 23 year study period, each category of land use will occupy 20 percent less land for new construction as compared with existing land use patterns—e.g., if the current average density for existing multi-family housing is 10 units per acre, we assume over the course of the study that a 10 unit multi-family structure would occupy only 0.8 acres of land.
Projected redevelopment rates were calculated based on an annual “loss rate” of 0.59 percent for residential structures, and 2.22 percent for non-residential structures.9
energy sAvings by DeveloPment CAtegoryEnergy savings for each land use category were calculated based on electricity use rates for space cooling reported by the California Energy Commission: residential (average of 0.49 kWh/ft2/year);10 retail commercial (2.21 kWh/ft2); office space (average of 3.23 kWh/ft2); warehouse (0.33 kWh/ft2); school (1.17 kWh/ft2); college (1.91 kWh/ft2); lodging (2.41 kWh/ft2); and restaurants (5.76 kWh/ft2).11 Air conditioning saturation, such that installing a green roof or cool roof would provide an energy savings benefit, was estimated to be 65 percent for residential buildings and 75 percent for non-residential buildings.12
rooftoP runoff volumeImpervious surface runoff from development for all land use types was calculated on the basis of average rainfall compiled from the Natural Resources Conservation Service (NRCS) 1971–2000 data set and averaged across total roof space for each of the designated land uses to determine the total volume of annual impervious surface runoff from roofs in the current distribution of specified land use types within the study area.13 For calculating rooftop runoff retained by green roofs over conventional roof surfaces, we employed a runoff coefficient for rooftop surfaces of C = 0.9, meaning 90 percent of rainfall on roof surfaces will occur as runoff. Runoff coefficients for rooftop surfaces are generally estimated to vary between 0.75 and 0.95, reflecting differences in how materials, slope, and other variables of rooftop construction may affect runoff.14 Stormwater management agencies in California commonly differ in their selection of runoff coefficients. For example, the city of Salinas bases rooftop runoff on a coefficient of 1.0, whereas the Santa Clara Valley Urban Runoff Pollution Prevention Program works at the low end of generally accepted values, using a coefficient of 0.75.15,16 However, many architectural and engineering experts treat rooftop runoff as occurring at the higher end of the accepted range, stating, for example, that “a built-up roof is considered to have a runoff coefficient of 0.95; in other words, about 95 percent of the water hitting a conventional roof will leave the surface and needs to be accounted for in the design of the building’s storm-water system.”17 Moreover, many states and municipalities use a coefficient of 0.9 to determine runoff volumes from rooftop surfaces.18 As a result, we find a coefficient of 0.9 to represent a reasonable estimate for rooftop-runoff collection potential.
PAge 29 | looking up
endnotes
1 California Department of Finance (May 2012). “E-1 Population Estimates for Cities, Counties and the State with Annual Percent Change—January 1, 2011 and 2012,” www.dof.ca.gov/research/demographic/reports/estimates/e-1/view.php.
2 See Nelson, Arthur C. (2011). “the New California Dream: How Demographic and Economic trends May Shape the Housing Market, A Land Use Scenario for 2020 and 2035,” Urban Land Institute, at www.uli.org/ResearchAndPublications/~/media/ResearchAndPublications/Report/ULI%20Voices%20Nelson%20the%20New%20California%20Dream.ashx.
3 See Appendix B for a complete list of GIS data sets and parameters used in conducting the study.
4 County of Los Angeles (2006). “Solar Map,” solarmap.lacounty.gov/.
5 Nelson, Arthur C. (2011). “the New California Dream: How Demographic and Economic trends May Shape the Housing Market, A Land Use Scenario for 2020 and 2035,” Urban Land Institute, at 47-51, 58.
6 See Nelson, Arthur C. (2004). “toward a New Metropolis: the opportunity to Rebuild America,” Brookings Institution, www.brookings.edu/research/reports/2004/12/metropolitanpolicy-nelson.
7 Nelson, Arthur C. (2011). “the New California Dream: How Demographic and Economic trends May Shape the Housing Market, A Land Use Scenario for 2020 and 2035,” Urban Land Institute, at 47-48.
8 Ibid., at 50.
9 Ibid., at 58.
10 KEMA, Inc. (october 2010). “2009 California Residential Appliance Saturation Study,” prepared for the California Energy Commission, CEC‒ 200‒ 2010‒004‒ES, at 5, www.energy.ca.gov/2010publications/CEC-200-2010-004/CEC-200-2010-004-ES.PDF.
11 Itron, Inc. (March 2006). “California Commercial End-Use Survey,” prepared for the California Energy Commission, CEC-400-2006-005, at 12, www.energy.ca.gov/2006publications/CEC-400-2006-005/CEC-400-2006-005.PDF.
12 KEMA, Inc. (october 2010). “2009 California Residential Appliance Saturation Study,” prepared for the California Energy Commission, CEC- 200- 2010-004-ES; Konopacki, S., 1997, H. Akbari, M. Pomerantz, S. Gabersek, and L. Gartland (May 1997). ““Cooling energy savings potential of light-colored roofs for residential and commercial buildings in 11 U.S. metropolitan areas,” Lawrence Berkeley National Laboratory LBNL-39433, at table C-3, www.epa.gov/hiri/resources/pdf/11_cities_main.pdf.
13 According to the NRCS, the accepted standard set by the World Meteorological organization is a 30-year average, with 1961–1990 serving as the current base period, though a new 30 year average is calculated every 10 years. Natural Resources Conservation Service (2009). “State Annual Data Summaries: Glossary,” www.wcc.nrcs.usda.gov/factpub/ads/adsglsry.html. Because climate predictions vary in their estimates of change in the total annual volume of future precipitation (e.g., California Energy Commission [March 2009]. “Climate Change Related Impacts in the San Diego Region by 2050,” www.energy.ca.gov/publications/displayoneReport.php?pubNum=CEC-500-2009-027-D) and do not generally offer estimates of changes in precipitation with sufficient near-term resolution for the purposes of this study (i.e., between 2012 and 2035), we find the 1971 to 2000 data set to represent a reasonable estimate for precipitation over the period analyzed.
14 See California Department of transportation (March 2007). “Stormwater Pollution Prevention Plan (SWPPP) and Water Pollution Control Program (WPCP) Preparation Manual,” Stormwater Quality Handbooks, www.dot.ca.gov/hq/construc/stormwater/SWPPP_WPCP_PreparationManual_2007.pdf.
15 City of Salinas (october 2008). “Draft Stormwater Development Standards for New Development and Significant Redevelopment Projects,” www.ci.salinas.ca.us/services/engineering/pdf/SWDS_Jan09/oct08_SWDS_1-5.pdf.
16 Santa Clara Valley Urban Runoff Pollution Prevention Program (2004). “C.3 Stormwater Handbook,” www.eoainc.com/c3_handbook_final_may2004/.
17 Gonchar, Joann, (August 2006). “Rooftops Slowly, but Steadily, Start to Sprout,” Architectural Record, vol. 194, pp. 135-38, archrecord.construction.com/resources/conteduc/archives/0608edit-1.asp.
18 For example, the Metropolitan Water Reclamation District of Greater Chicago (MWRDGC) uses a runoff coefficient of 0.9 for hard roofs (see MWRDGC, “Values of Runoff Coefficients for Use in Designing Stormwater Detention Facilities per MWRD Requirements,” www.mwrd.org/irj/go/km/docs/documents/MWRD/internet/Departments/Engineering/docs/permit_application/runoff%20coefficients.pdf), and the New Mexico office of the State Engineer (NMoSE) cites a range of coefficients of 0.8 to 0.95 for common rooftop materials, with 0.9 as the median for asphalt and concrete roofs (NMoSE [2009], “Roof-Reliant Landscaping: Rainwater Harvesting with Cistern Systems in New Mexico,” www.ose.state.nm.us/wucp_RoofReliantLandscaping.html).
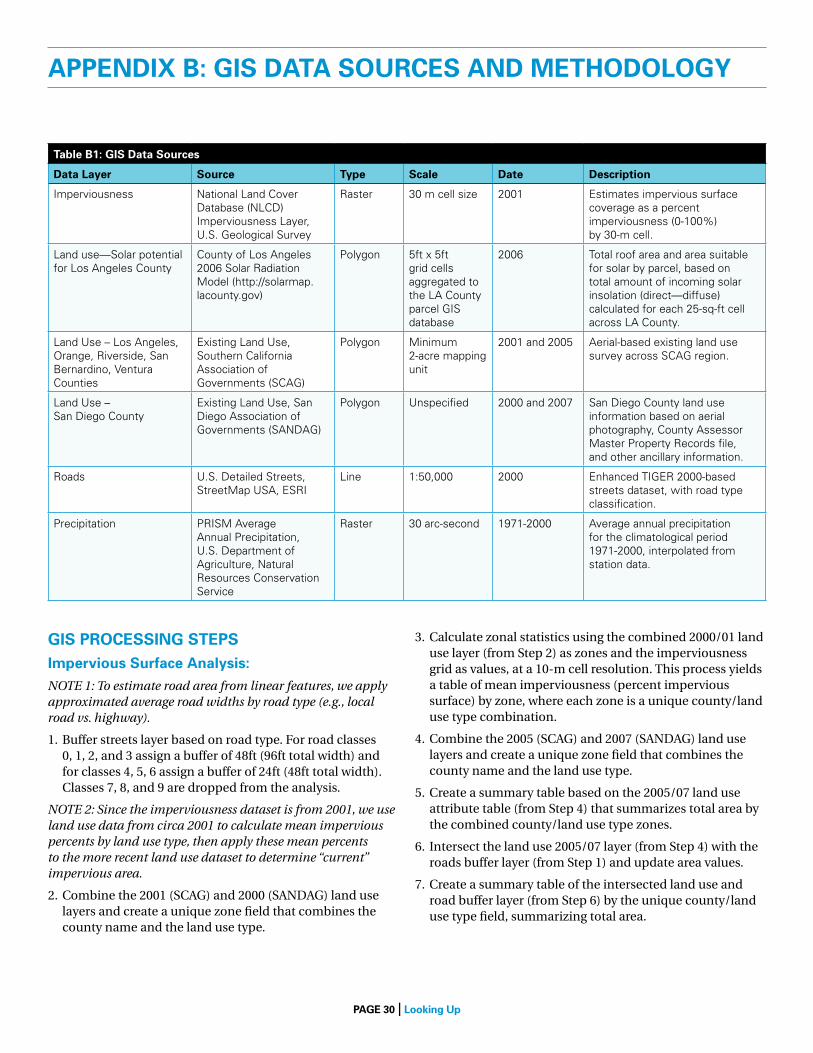
PAge 30 | looking up
APPenDix b: gis DAtA sourCes AnD methoDology
table b1: gis Data sources
Data layer source type scale Date Description
Imperviousness National Land Cover Database (NLCD) Imperviousness Layer, U.S. Geological Survey
Raster 30 m cell size 2001 Estimates impervious surface coverage as a percent imperviousness (0-100%) by 30-m cell.
Land use—Solar potential for Los Angeles County
County of Los Angeles 2006 Solar Radiation Model (http://solarmap.lacounty.gov)
Polygon 5ft x 5ft grid cells aggregated to the LA County parcel GIS database
2006 total roof area and area suitable for solar by parcel, based on total amount of incoming solar insolation (direct—diffuse) calculated for each 25-sq-ft cell across LA County.
Land Use – Los Angeles, orange, Riverside, San Bernardino, Ventura Counties
Existing Land Use, Southern California Association of Governments (SCAG)
Polygon Minimum 2-acre mapping unit
2001 and 2005 Aerial-based existing land use survey across SCAG region.
Land Use – San Diego County
Existing Land Use, San Diego Association of Governments (SANDAG)
Polygon Unspecified 2000 and 2007 San Diego County land use information based on aerial photography, County Assessor Master Property Records file, and other ancillary information.
Roads U.S. Detailed Streets, StreetMap USA, ESRI
Line 1:50,000 2000 Enhanced tIGER 2000-based streets dataset, with road type classification.
Precipitation PRISM Average Annual Precipitation, U.S. Department of Agriculture, Natural Resources Conservation Service
Raster 30 arc-second 1971-2000 Average annual precipitation for the climatological period 1971-2000, interpolated from station data.
gis ProCessing stePsimpervious surface Analysis:NOTE 1: To estimate road area from linear features, we apply approximated average road widths by road type (e.g., local road vs. highway).
1. Buffer streets layer based on road type. For road classes 0, 1, 2, and 3 assign a buffer of 48ft (96ft total width) and for classes 4, 5, 6 assign a buffer of 24ft (48ft total width). Classes 7, 8, and 9 are dropped from the analysis.
NOTE 2: Since the imperviousness dataset is from 2001, we use land use data from circa 2001 to calculate mean impervious percents by land use type, then apply these mean percents to the more recent land use dataset to determine “current” impervious area.
2. Combine the 2001 (SCAG) and 2000 (SANDAG) land use layers and create a unique zone field that combines the county name and the land use type.
3. Calculate zonal statistics using the combined 2000/01 land use layer (from Step 2) as zones and the imperviousness grid as values, at a 10-m cell resolution. This process yields a table of mean imperviousness (percent impervious surface) by zone, where each zone is a unique county/land use type combination.
4. Combine the 2005 (SCAG) and 2007 (SANDAG) land use layers and create a unique zone field that combines the county name and the land use type.
5. Create a summary table based on the 2005/07 land use attribute table (from Step 4) that summarizes total area by the combined county/land use type zones.
6. Intersect the land use 2005/07 layer (from Step 4) with the roads buffer layer (from Step 1) and update area values.
7. Create a summary table of the intersected land use and road buffer layer (from Step 6) by the unique county/land use type field, summarizing total area.
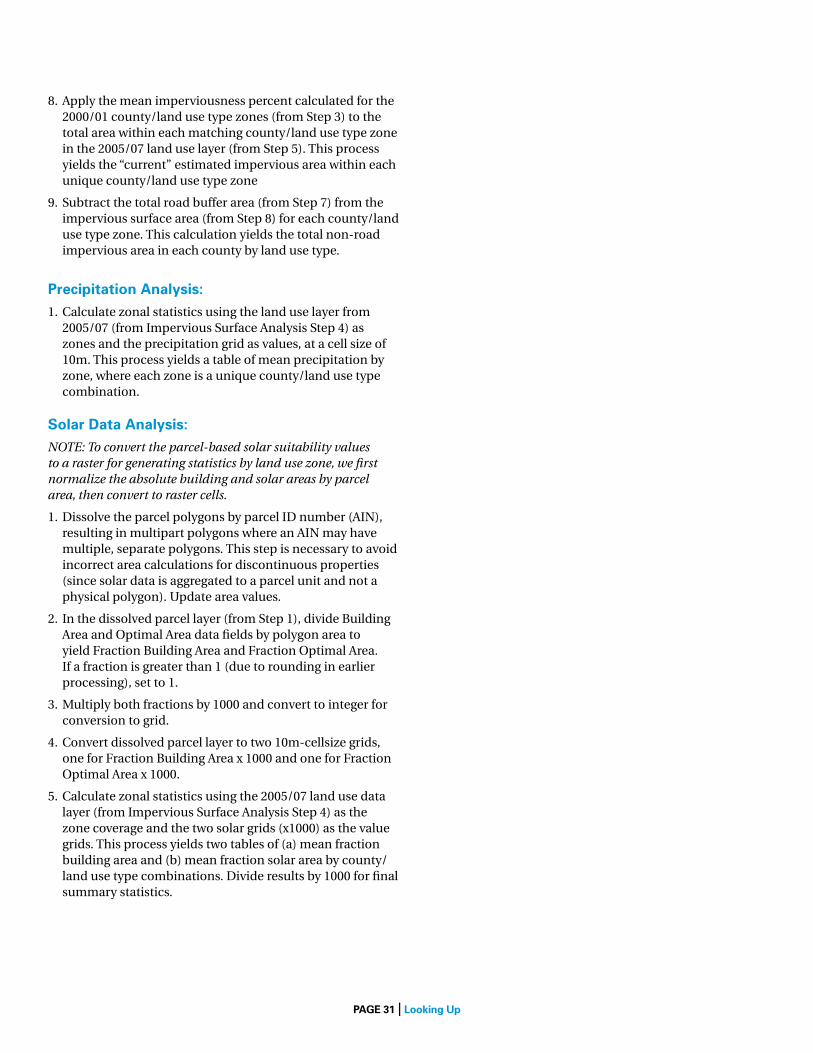
PAge 31 | looking up
8. Apply the mean imperviousness percent calculated for the 2000/01 county/land use type zones (from Step 3) to the total area within each matching county/land use type zone in the 2005/07 land use layer (from Step 5). This process yields the “current” estimated impervious area within each unique county/land use type zone
9. Subtract the total road buffer area (from Step 7) from the impervious surface area (from Step 8) for each county/land use type zone. This calculation yields the total non-road impervious area in each county by land use type.
Precipitation Analysis:1. Calculate zonal statistics using the land use layer from
2005/07 (from Impervious Surface Analysis Step 4) as zones and the precipitation grid as values, at a cell size of 10m. This process yields a table of mean precipitation by zone, where each zone is a unique county/land use type combination.
solar Data Analysis: NOTE: To convert the parcel-based solar suitability values to a raster for generating statistics by land use zone, we first normalize the absolute building and solar areas by parcel area, then convert to raster cells.
1. Dissolve the parcel polygons by parcel ID number (AIN), resulting in multipart polygons where an AIN may have multiple, separate polygons. This step is necessary to avoid incorrect area calculations for discontinuous properties (since solar data is aggregated to a parcel unit and not a physical polygon). Update area values.
2. In the dissolved parcel layer (from Step 1), divide Building Area and Optimal Area data fields by polygon area to yield Fraction Building Area and Fraction Optimal Area. If a fraction is greater than 1 (due to rounding in earlier processing), set to 1.
3. Multiply both fractions by 1000 and convert to integer for conversion to grid.
4. Convert dissolved parcel layer to two 10m-cellsize grids, one for Fraction Building Area x 1000 and one for Fraction Optimal Area x 1000.
5. Calculate zonal statistics using the 2005/07 land use data layer (from Impervious Surface Analysis Step 4) as the zone coverage and the two solar grids (x1000) as the value grids. This process yields two tables of (a) mean fraction building area and (b) mean fraction solar area by county/land use type combinations. Divide results by 1000 for final summary statistics.