Wrap Report Anna & Kristina’s Grocery Bag Sponsorship Program September 20 th , 2010 x 13 weeks

How Green Is that Grocery Bag Ban? An Assessment of the Environmental and Economic Effects of Grocery Bag Bans and Taxes
by Julian Morris and Brian Seasholes
Policy Study 437June 2014

Reason FoundationReason Foundation’s mission is to advance a free society by developing, applying
and promoting libertarian principles, including individual liberty, free markets and
the rule of law. We use journalism and public policy research to influence the frame-
works and actions of policymakers, journalists and opinion leaders.
Reason Foundation’s nonpartisan public policy research promotes choice, compe-
tition and a dynamic market economy as the foundation for human dignity and
progress. Reason produces rigorous, peer-reviewed research and directly engages the
policy process, seeking strategies that emphasize cooperation, flexibility, local knowl-
edge and results. Through practical and innovative approaches to complex problems,
Reason seeks to change the way people think about issues, and promote policies that
allow and encourage individuals and voluntary institutions to flourish.
Reason Foundation is a tax-exempt research and education organization as defined
under IRS code 501(c)(3). Reason Foundation is supported by voluntary contribu-
tions from individuals, foundations and corporations. The views are those of the
author, not necessarily those of Reason Foundation or its trustees.
Copyright © 2014, Reason Foundation. All rights reserved.

R e a s o n F o u n d a t i o n
How Green Is that Grocery Bag Ban? An Assessment of the Environmental and Economic Effects of Grocery Bag Bans and Taxes By Julian Morris and Brian Seasholes Executive Summary In the past 15 years, approximately 190 municipalities in the U.S. have passed ordinances imposing bans, fees and/or taxes on plastic shopping bags. Many have also introduced fees or taxes on paper bags. Proponents of such ordinances claim they are necessary in order to reduce litter and other environmental impacts, ranging from resource use to emissions of greenhouse gases. In addition, many proponents claim the ordinances will reduce municipal costs (such as those associated with litter removal and waste collection), with benefits for taxpayers. This study investigates all these claims using the best data available and finds: 1. The bans, fees and taxes on shopping bags have a minuscule impact on litter. 2. There is no evidence of a reduction in municipal litter or waste collection
costs as a result of the introduction of bans, fees and taxes on shopping bags. 3. Other environmental impacts are not significantly reduced and some,
including greenhouse gas emissions, may increase as a result especially of restrictions on the use of plastic (HDPE) shopping bags.
4. There is likely an adverse health effect from people failing to wash bacteria-
ridden reusable bags, the use of which may increase as a result of restrictions on the distribution of other bag types.

5. Reusable bags are less convenient and, when taking into account the time and resources required to remove bacteria from bags, are very costly for consumers.
6. The costs of plastic bag bans fall disproportionately on the poor. In sum, over the past 30 years, decisions by consumers and retailers have dramatically shifted consumption toward bags with superior environmental and cost characteristics, namely those made from high-density polyethylene (HDPE) plastic. By banning HDPE plastic bags, legislators have been reversing this trend, to the detriment of the environment and consumers. Those people who are genuinely concerned about reducing litter and other environmental problems should focus their efforts on solutions that have been proven to work. In the case of litter, this means communicating the benefits of litter reduction and undertaking amelioration. In the case of protecting marine animals (a concern especially in coastal states), banning plastic bags won’t make a difference but shifting toward more rational fisheries policies would.

R e a s o n F o u n d a t i o n
Table of Contents
Introduction .............................................................................................. 1
A Brief History of Plastic Bags and Their Discontents .................................. 3 1.1 Plastic Bags Bans, Taxes and Regulations ....................................................... 4
Evaluating the Impact of Plastic Bags ....................................................... 6 2.1 Restrictions on HDPE Bags Would Reduce Our Consumption of Resources ........ 6 2.2 Restrictions on HDPE Bags Would Reduce Litter and Protect the Marine Environment ........................................................................................................ 7 2.3 Would Restrictions on HDPE Bags Reduce Waste? ......................................... 16 2.4 Would Restrictions on HDPE Bags Reduce Our Impact on the Global Climate? . 21
Comparing the Impact of HDPE Bags and Alternatives Using Life Cycle Analysis ................................................................................................. 22 3.1 Life Cycle Analysis ........................................................................................ 22 3.2 LCAs of Grocery Bags ................................................................................... 23 3.3 Comparing the Impact of Bags on the Environment ........................................ 25 3.4 Comparing the Bags on the Basis of the LCAs ................................................ 34
Evaluating the Impact of Plastic Bag Regulations ..................................... 36 4.1 The Impact of Bag Taxes and Fees on Bag Use ............................................... 36 4.2 The Impact of Plastic Bag Bans on Bag Use ................................................... 38 4.3 Do Plastic Bag Bans, Taxes and Fees Benefit the Environment? ...................... 40 4.4 The Environmental Impact of Plastic Bag Bans in Practice .............................. 44 4.5 Do Plastic Bag Bans, Regulations and Taxes Save Taxpayers Money? ............. 48 4.6 What Are the Broader Economic Effects of Bag Bans, Taxes and Fees? ............ 50 4.7 Conclusions ................................................................................................. 56
Conclusions ............................................................................................ 57
About the Authors .................................................................................. 59
Endnotes ................................................................................................ 60

How Green Is that Grocery Bag Ban? | 1
Introduction
Every day, tens of millions of people in the U.S. use plastic grocery bags to carry their shopping home. Concerned at the possible impacts of such widespread use, environmental pressure groups have sought to introduce bans, taxes and fees on plastic bags. The number of U.S. municipalities passing legislation to restrict use through bans, taxes or fees has risen from 31 in 2008 to 191 by April 2014 in 15 states and the District of Columbia—as shown in Figure 1. Bills restricting plastic bag use have also been introduced in several states, though none have passed. And in 2013, for the third Congress in a row, Representative James P. Moran of Virginia introduced a bill to create a national five-cent tax on all disposable plastic or paper bags supplied by stores to customers. The bill failed again.
Source: compiled by authors from various sources1
Outside the U.S., 32 entire countries, including China, Bangladesh, the United Arab Emirates, Ireland, Italy and South Africa have introduced restrictions on
2 6 11 19
31 51
68
124
174 191
0 20 40 60 80
100 120 140 160 180 200
1998 2000 2002 2004 2006 2008 2010 2012 2014
Figure 1: Plastic Bag Bans, Taxes and Fees in the U.S.
2 | Reason Foundation
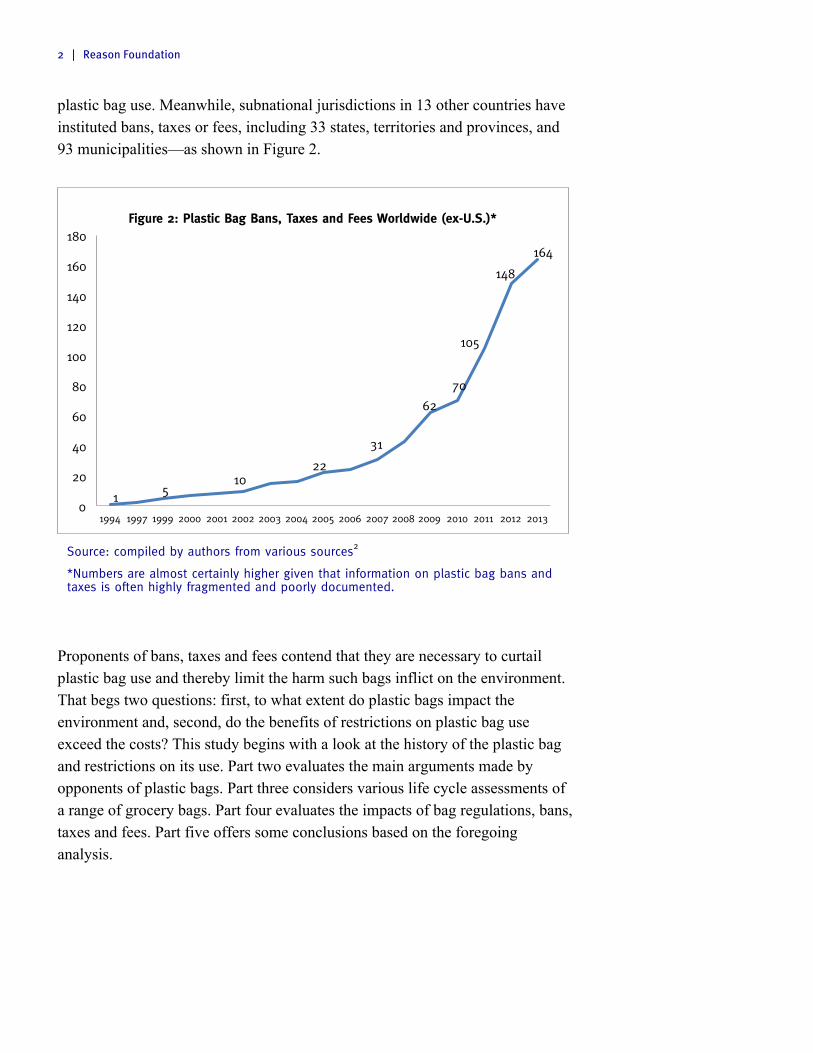
plastic bag use. Meanwhile, subnational jurisdictions in 13 other countries have instituted bans, taxes or fees, including 33 states, territories and provinces, and 93 municipalities—as shown in Figure 2.
Source: compiled by authors from various sources2
*Numbers are almost certainly higher given that information on plastic bag bans and taxes is often highly fragmented and poorly documented.
Proponents of bans, taxes and fees contend that they are necessary to curtail plastic bag use and thereby limit the harm such bags inflict on the environment. That begs two questions: first, to what extent do plastic bags impact the environment and, second, do the benefits of restrictions on plastic bag use exceed the costs? This study begins with a look at the history of the plastic bag and restrictions on its use. Part two evaluates the main arguments made by opponents of plastic bags. Part three considers various life cycle assessments of a range of grocery bags. Part four evaluates the impacts of bag regulations, bans, taxes and fees. Part five offers some conclusions based on the foregoing analysis.
1 5 10
22
31
62
70
105
148
164
0
20
40
60
80
100
120
140
160
180
1994 1997 1999 2000 2001 2002 2003 2004 2005 2006 2007 2008 2009 2010 2011 2012 2013
Figure 2: Plastic Bag Bans, Taxes and Fees Worldwide (ex-U.S.)*

How Green Is that Grocery Bag Ban? | 3
P a r t 1
A Brief History of Plastic Bags and Their Discontents
Plastic grocery bags are made from high-density polyethylene (HDPE). Polyethylene was discovered in 1898 by German chemist Hans von Pechmann but no commercial applications were developed until 1933, when Imperial Chemical Industries in the UK produced polyethylene insulation for radar cables.3 This and other early forms were all low-density polyethylene (LDPE), which remains a popular plastic for a wide range of uses, from playground slides to milk cartons. During the 1950s, research scientists at Phillips Petroleum in the U.S. and the Max Planck Institute for Coal Research in Germany invented higher density forms of polyethylene.4 In the late 1950s, researchers discovered how to form HDPE into a thin film from which were created plastic sandwich bags and garment-sized bags to protect dry cleaned items. By the mid-1960s, plastic bags became widely used for grocery produce and for packaging bread, and by the mid-1970s large retailers such as Sears, Montgomery Ward and J.C. Penney began offering plastic bags for customers’ purchases. In 1977, the plastic grocery bag became available to supermarkets but it was not until 1982, when two major supermarket chains, Safeway and Kroger, began to use the HDPE “t-shirt” bag—so named because of its shape when laid flat—that plastic grocery bags came into widespread use. By 1996, 80% of grocery bags used in the U.S. were plastic.5 As the use of all types of plastic increased, environmental pressure groups began complaining about what they saw as the drawbacks of plastic in general and plastic bags in particular. Their complaints have generally focused on litter, environmental degradation and wasteful use of resources. They have painted the plastic bag as a potent symbol of modern, industrialized, “throwaway” society that consumes too much of the earth’s resources.6 And they see restrictions on plastic bags as a crucial first step on the path toward a plastics-free society.7
4 | Reason Foundation
1.1 Plastic Bags Bans, Taxes and Regulations
In the late 1980s and early 1990s, lightweight plastic bags had become a visible litter issue in a few villages in remote regions of western Alaska, largely as a result of poor trash disposal methods and facilities. In response, those villages became the first to introduce bans on plastic bags.8 1989 was a watershed in the campaign against plastic in general. By the end of the year, there were at least 800 pieces of municipal and state legislation in 35 states addressing the role of plastics in the solid waste stream, up from less than a dozen two years earlier. The campaign against plastic bags really got going in the late 1990s. And in 2007 it went mainstream. That was the year San Francisco banned the distribution of lightweight plastic shopping bags by supermarkets and pharmacies with more than $2 million in annual sales. As the fourth largest city in the most populous state in the nation, not to mention a cultural bellwether, San Francisco’s actions often influence others. Ross Mirkarimi, the San Francisco Board of Supervisors member who led the charge to ban plastic bags, certainly saw the ban as a first step toward national action, stating: “Hopefully other cities and other states will follow suit.”9 And follow suit they did. San Francisco’s ban was the proverbial snowball that got the avalanche going. At the time of writing, 192 municipalities in 16 states and the District of Columbia have enacted bans, taxes or mandatory fees on lightweight plastic bags. Not surprisingly, California is the leading state for bag bans and taxes, including ordinances in over 100 municipalities. In addition to imposing restrictions on the use of HDPE bags, some municipalities have also placed restrictions on paper bags. However, these restrictions tend to be less onerous. As Figure 3 shows, 70 municipalities have imposed outright bans on HDPE bags with no restrictions on paper, while 119 municipalities have imposed bans on HDPE bags and introduced taxes or fees for paper bags. Only three municipalities have banned plastic and paper bags and only five have imposed taxes or fees on both plastic and paper. The implicit assumption underlying these legislative actions is that plastic is worse for the environment than paper.

How Green Is that Grocery Bag Ban? | 5
Source: compiled by authors from various sources as for Figure 1.
Note: The Washington, D.C. fee is actually a tax, although retailers keep 20%.
119
70
5 3 1 1 0
20
40
60
80
100
120
140
Ban plastic, fee for paper
Ban only plastic Fee for both paper & plastic
Ban paper & plastic
Fee only for plastic
Mandate biodegradable
plastic
Figure 3: Types of Plastic Bag Ordinances in the U.S. (1998–April 2014)
6 | Reason Foundation
P a r t 2
Evaluating the Impact of Plastic Bags
Proponents of restrictions on HDPE bags offer various justifications in support.10 Most of these justifications broadly pertain to environmental protection. Below we survey and assess the most popular arguments.
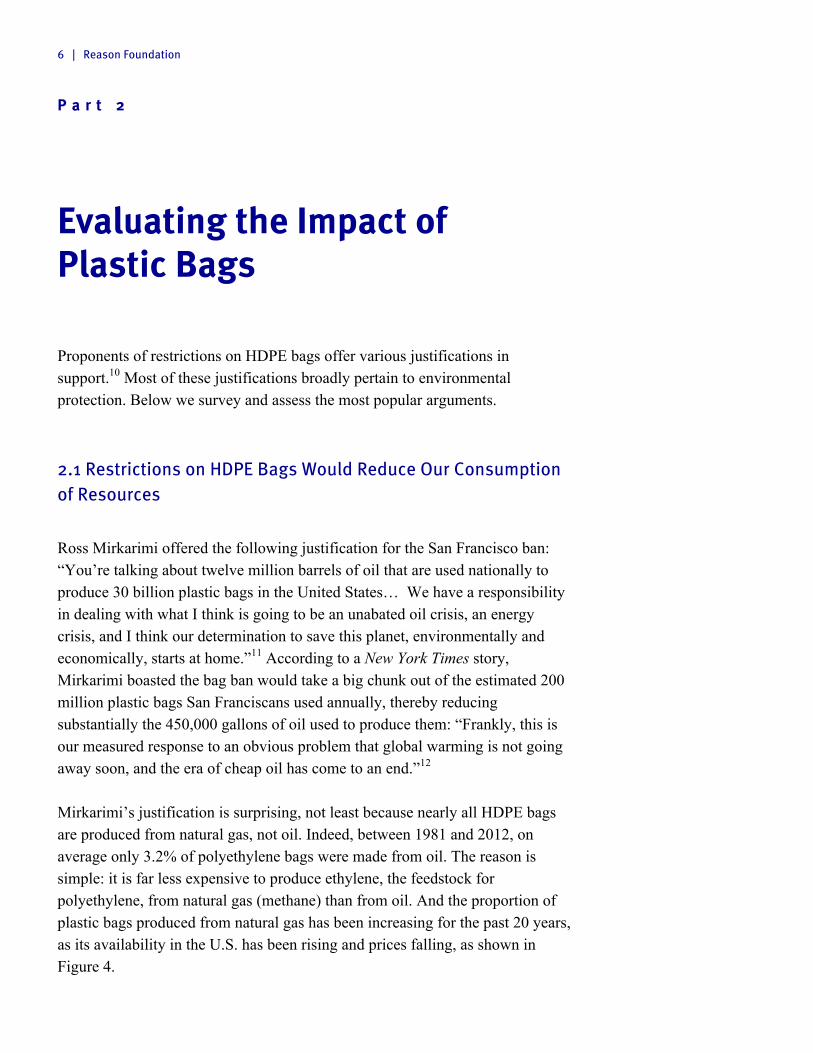
2.1 Restrictions on HDPE Bags Would Reduce Our Consumption of Resources
Ross Mirkarimi offered the following justification for the San Francisco ban: “You’re talking about twelve million barrels of oil that are used nationally to produce 30 billion plastic bags in the United States… We have a responsibility in dealing with what I think is going to be an unabated oil crisis, an energy crisis, and I think our determination to save this planet, environmentally and economically, starts at home.”11 According to a New York Times story, Mirkarimi boasted the bag ban would take a big chunk out of the estimated 200 million plastic bags San Franciscans used annually, thereby reducing substantially the 450,000 gallons of oil used to produce them: “Frankly, this is our measured response to an obvious problem that global warming is not going away soon, and the era of cheap oil has come to an end.”12 Mirkarimi’s justification is surprising, not least because nearly all HDPE bags are produced from natural gas, not oil. Indeed, between 1981 and 2012, on average only 3.2% of polyethylene bags were made from oil. The reason is simple: it is far less expensive to produce ethylene, the feedstock for polyethylene, from natural gas (methane) than from oil. And the proportion of plastic bags produced from natural gas has been increasing for the past 20 years, as its availability in the U.S. has been rising and prices falling, as shown in Figure 4.

How Green Is that Grocery Bag Ban? | 7
Source: U.S. Energy Information Administration13
The notion that oil plays a substantial role in the manufacture of HDPE bags is simply a myth. Ironically, one of the primary substitutes for HDPE bags, non-woven polypropylene (NWPP) bags, is derived from oil.14 So, restricting the sale and use of HDPE bags would likely increase oil consumption! But Mirkarimi’s assertion does raise the question of what the impact of restrictions on HDPE use might be on resource consumption more generally. This is addressed in several of the life cycle analyses discussed in the next section.
2.2 Restrictions on HDPE Bags Would Reduce Litter and Protect the Marine Environment
At one level, the assertion that plastic bags cause litter is ridiculous: litter is a result of human behavior, not of the products we use. Put another way: people cause litter, bags don’t. Responsible consumers dispose of their waste in ways that do not cause litter.
94%
95%
96%
97%
98%
99%
1980 1982 1984 1986 1988 1990 1992 1994 1996 1998 2000 2002 2004 2006 2008 2010 2012
Figure 4: Proportion of U.S. Ethylene Derived from Natural Gas, 1981–2012
Annual percentage Average percentage (1981–2012)
8 | Reason Foundation
Nonetheless, litter is composed of various components of which plastic bags are one. But this begs two questions: First, how significant a component of litter is the HDPE bag? Second, does litter from HDPE bags have a more egregious impact than other forms of litter?
How Significant Is Litter from HDPE Bags?
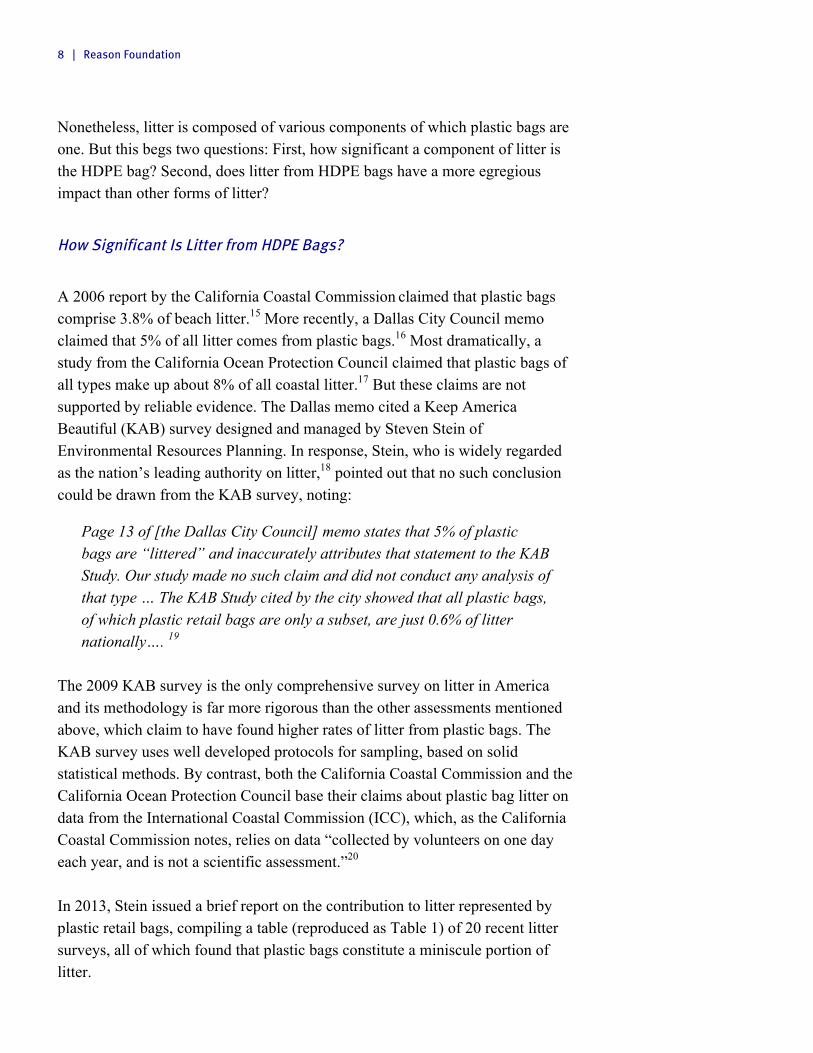
A 2006 report by the California Coastal Commission claimed that plastic bags comprise 3.8% of beach litter.15 More recently, a Dallas City Council memo claimed that 5% of all litter comes from plastic bags.16 Most dramatically, a study from the California Ocean Protection Council claimed that plastic bags of all types make up about 8% of all coastal litter.17 But these claims are not supported by reliable evidence. The Dallas memo cited a Keep America Beautiful (KAB) survey designed and managed by Steven Stein of Environmental Resources Planning. In response, Stein, who is widely regarded as the nation’s leading authority on litter,18 pointed out that no such conclusion could be drawn from the KAB survey, noting:
Page 13 of [the Dallas City Council] memo states that 5% of plastic bags are “littered” and inaccurately attributes that statement to the KAB Study. Our study made no such claim and did not conduct any analysis of that type … The KAB Study cited by the city showed that all plastic bags, of which plastic retail bags are only a subset, are just 0.6% of litter nationally…. 19
The 2009 KAB survey is the only comprehensive survey on litter in America and its methodology is far more rigorous than the other assessments mentioned above, which claim to have found higher rates of litter from plastic bags. The KAB survey uses well developed protocols for sampling, based on solid statistical methods. By contrast, both the California Coastal Commission and the California Ocean Protection Council base their claims about plastic bag litter on data from the International Coastal Commission (ICC), which, as the California Coastal Commission notes, relies on data “collected by volunteers on one day each year, and is not a scientific assessment.”20 In 2013, Stein issued a brief report on the contribution to litter represented by plastic retail bags, compiling a table (reproduced as Table 1) of 20 recent litter surveys, all of which found that plastic bags constitute a miniscule portion of litter.

How Green Is that Grocery Bag Ban? | 9
Table 1: Plastic Bags as a Proportion of Litter City Year Percent
Plastic bags City Year Percent
Plastic bags Toronto 2012 0.8% Durham 2003 0.3% Edmonton 2011 1.1% Peel 2003 0.1% Alberta 2009 0.0% York 2003 0.4% San Francisco 2008 0.6% Toronto 2002 0.6% San Jose 2008 0.4% Florida 2002 0.5% Keep Am. Beautiful 2008 0.6% Florida 2001 0.7% Alberta 2007 2.0% Florida 1997 0.6% San Francisco 2007 0.6% Florida 1996 1.0% Toronto 2006 0.1% Florida 1995 0.7% Toronto 2004 0.2% Florida 1994 0.6%
Source: Steven R. Stein, Plastic Retail Bags in Litter, Environmental Resources Planning, LLC., 2013
Stein also addressed those surveys asserting that plastic bags are a major component of litter:
Litter surveys showing unusually high rates of items such as plastic bags were typically conducted by volunteers rather than professional staff. These surveys tended to lack random sampling and statistical methodologies. At times, material categories were not consistent. While such studies have helped create awareness of litter’s impacts, their limitations have, in some cases, resulted in erroneous depictions of plastic retail bags as a component in the overall litter stream.21
Since HDPE bags are not a significant component of litter, it is irresponsible to argue that bans, taxes and other restrictions on their use would help prevent litter in any meaningful way. Indeed, it is possible that eliminating HDPE bags would result in more litter, since such bags are often reused as garbage bags to collect items used during car journeys (for example)—a job to which they are far better suited than paper bags or reusable polypropylene bags. Without HDPE bags in which to collect garbage, highways might suffer a profusion of food cartons, banana skins, drink cans, etc. The 2009 KAB litter survey was in fact a follow-up from a similar survey conducted 40 years previously. Over that time, the survey found that the total amount of visible litter per capita on or near highways had actually declined by 61%.22 However, the KAB report notes that the survey of visible litter does not necessarily reflect the amount of litter generated because of the rise of “litter abatement efforts”—i.e., organized removal of litter, often by volunteer groups.

10 | Reason Foundation
What Impact Does Litter from HDPE Bags Have?
Proponents of plastic bag bans contend that plastic bag litter causes several problems, chiefly: (1) clogging of storm drains, resulting in flooding; (2) damage to marine ecosystems. We address each of these in turn. Clogging of Storm Drains While clogging of storm drains is a potentially serious problem, it is important to focus on the most significant causes of such clogging. The KAB survey did find plastic bags in storm drains—but noted that they represented just under 1% of litter items in storm drains. By contrast, plastic drink containers represented about 2% and other plastic items represented over 10% (see Figure 5).23 On the basis of this evidence, it would not be appropriate to single out plastic bags, let alone plastic shopping bags, for particular attention. Rather, as noted above, it would seem that the underlying problem is the fact that people litter. Banning plastic bags would do little to reduce the problem of clogged storm drains, so attention should instead focus on ways to reduce the production of litter or mitigate its effects regardless of the product.
Source: KAB 2009 National Visible Litter Survey
Damage to Marine Ecosystems One of the primary justifications for imposing restrictions on the use of HDPE bags, especially in coastal areas, is the claim that such bags harm marine
Plastic Bags, 0.9% Plastic Drink Containers, 2.0%
Plastic Fast Food Items, 7.0%
Other Plastic, 10.2%
Inorganic Litter, 15.6%
Tobacco Products, 32.0%
Organic Litter, 32.2%
Figure 5: Types of Litter Found at Storm Drains

How Green Is that Grocery Bag Ban? | 11
ecosystems. The basic proposition that some plastic litter, including some HDPE bags, finds its way into the oceans, with adverse ecological effects, seems plausible. However, questions arise regarding the scale of the problem and the effectiveness of proposed solutions. Regarding the scale of the problem, a series of connected claims is frequently made, namely that: (1) most marine debris originates on land; (2) plastic bags represent a significant proportion of all marine debris and become concentrated in a “garbage patch” twice the size of Texas in the north Pacific Ocean; and (3) due to their widespread presence in the oceans, plastic bags kill over 100,000 marine mammals and millions of seabirds annually. Considering these in turn: What Proportion of Marine Debris Originates on Land? Greenpeace,24 the U.S. Environmental Protection Agency,25 the World Wildlife Fund (WWF),26 and many other organizations claim that at least 80% of marine debris comes from land-based sources. But the National Oceanic and Atmospheric Administration (NOAA) points out that we simply don’t have data that would support such claims, noting on its website that “We know relatively little about what is lying on the ocean floor or suspended in the water column. Because of this we truly can't say what the land- and ocean-based percentages are with any certainty or accuracy.”27 Given the lack of empirical evidence, it is simply dishonest to claim that 80%, or even most, marine debris originates on land. It is even more preposterous to claim, as WWF does, that “Over 80% of marine pollution comes from land-based activities. From plastic bags to pesticides—most of the waste we produce on land eventually reaches the oceans, either through deliberate dumping or from run-off through drains and rivers.”28 To put this in perspective, it is perhaps worth noting that The Monterey Bay Aquarium makes equally outrageous claims about the amount of debris generated at sea, noting that “Each year, an estimated 10,000 shipping containers fall off container ships at sea.”29 It turns out that claim also rests on essentially no data and is contradicted by available evidence, such as a survey of shipping companies conducted by the World Shipping Council, which estimated that there are “approximately 675” containers lost at sea each year, including catastrophic losses.30 That is an order of magnitude lower than the Monterey Bay Aquarium figure but gives an indication of one non land-based source of marine debris. Another such source is gear from fishing boats, which is discussed below.
12 | Reason Foundation
Is There a Garbage Patch in the North Pacific? Many organizations claim that marine debris (and especially plastic bags) concentrates in a massive “garbage patch” in an area of the Pacific Ocean north of Hawaii known as the North Pacific Subtropical Gyre. For example, the National Wildlife Federation asserts that “In fact, the largest landfill in the world is actually the Great Pacific Ocean Garbage Patch, where plastic outnumbers plankton.”31 Greenpeace International claims, “The trash vortex is an area the size of Texas in the North Pacific in which an estimated six kilos of plastic for every kilo of natural plankton, along with other slow degrading garbage, swirls slowly around like a clock, choked with dead fish, marine mammals, and birds who get snared.”32 Defenders of Wildlife33 and the National Audubon Society34 make similar claims. These claims have often been repeated uncritically in the media. For example, an editorial in the Los Angeles Times in June 2000 noted: “The Great Pacific Garbage Patch is an area of the ocean larger than Texas and thick with floating plastic debris: bottles, bottle caps, bits of packaging and uncountable plastic bags. It's not surprising that carry-out plastic bags make up so much of the patch; they constitute the third most common trash item found on California beaches, and they're light and easily lifted by the wind. That is just one of many reasons to ban them.”35 Again in 2006, the LA Times published a story headlined “Plague of Plastic Chokes the Seas.”36 In 2009, Oprah Winfrey opined:
Scientists believe the world’s largest garbage dump isn’t on land, it’s in the ocean. Estimated to be twice the size of Texas, the Great Pacific Garbage Patch stretches from the coast of California all the way to Japan. In some places the manmade debris is ninety-feet deep…In some parts of the ocean there’s already six times more plastic than plankton…The monumental amount of plastic trash has created an ecological disaster that has cost the lives of millions of seabirds and marine mammals…This is the most shocking thing I’ve seen.37
The media keep recycling the same claims. In 2012, Time magazine ran a story headlined “Great Pacific Garbage Patch Poses New Threat to Marine Life,” which largely repeated assertions in the 2006 LA Times story.38 But the reality of garbage in the North Pacific Ocean is very different. “The name ‘garbage patch’ is a misnomer,” states the National Oceanic and Atmospheric Administration. “There is no island of trash forming in the middle of the ocean, nor a blanket of trash that can be seen with satellite or aerial photographs. This is likely because much of the debris found here is small bits of floating plastic not easily seen

How Green Is that Grocery Bag Ban? | 13
from a boat.”39 NOAA also adds, “For the record, no scientifically sound estimates exist for the size or mass of these garbage patches.”40 Miriam Goldstein, a PhD oceanographer who has conducted extensive research on this issue, said in 2010, “The vast majority of plastic bits (>90%) are smaller than a pencil eraser, and are spread out enough to be mostly invisible to the naked eye.”41 Angelicque “Angel” White, professor of oceanography at Oregon State University, has led research expeditions to the North Pacific gyre to investigate the extent and impact of plastic debris there. Professor White says: “There is no doubt that the amount of plastic in the world’s oceans is troubling, but this kind of exaggeration undermines the credibility of scientists …We have data that allow us to make reasonable estimates; we don’t need the hyperbole.”42 Contrary to the absurd claims made by some activists, White estimates that if you took an area the size of a football field of waters having “the highest concentration (of plastic) ever recorded,” filtered the plastic and laid it out along the width of a football field, the plastic would extend less than one inch into the field. “If there is a takeaway message, it’s that we should consider it good news that the ‘garbage patch’ doesn’t seem to be as bad as advertised,” White stated.43 Even some activists are frustrated by the exaggeration. “The idea of a single, Texas-size garbage patch is the myth of media sensationalism. It’s led to grandiose images of islands of trash,” according to the 5 Gyres Institute, an organization dedicated to preventing ocean pollution.44 “The problem with superlative statements that this is somehow a huge floating mass of plastic is that they inevitably lead to desensitizing people when they learn the truth of it,” David Santillo, a senior scientist with Greenpeace, is reported to have told The Wall Street Journal.45 So, whence the great garbage patch myth? In 1997, Charles Moore, a boat captain and founder of the Algalita Marine Research Institute, was startled to see plastic trash in the ocean while sailing back to California from Hawaii; “Every time I came on deck to survey the horizon, I saw a soap bottle, bottle cap or a shard of plastic waste bobbing by,” he said.46 But it was Curtis Ebbesmeyer, an oceanographer who in retirement began studying flotsam, who “began referring to the area as the ‘eastern garbage patch.’” 47 And it was Ebbesmeyer who “estimated that the area, nearly covered with floating plastic debris, is roughly the size of Texas.”48 The following year, in an effort to measure the amount and extent of debris, Moore organized a trip to the subtropical gyre to collect samples. On the basis of this data, in 2001 Moore and colleagues published an estimate that there is six

14 | Reason Foundation
times more plastic than plankton in the North Pacific Gyre.49 Like the term “garbage patch”, the six-to-one plastic-to-plankton ratio soon became a widely cited article of truth. And, like the “patch” analogy, it turned out to be, well, garbage. “Given the observed concentration of plastic in the North Pacific, it is simply inaccurate to state that plastic outweighs plankton,” states Angel White.50 “Most oceanographers, including myself, do not think that comparing the dry weight of plankton and plastic is a helpful way of understanding what is going on in the ocean,” says Miriam Goldstein.51 Meanwhile, a study published in 2013 found almost four times less plastic debris per square kilometer than Moore’s widely cited 2001 survey.52 The likely reason is that the paper by Moore et al. “sampled from a much smaller area in the central gyre,” according to the 2013 paper.53 This makes sense because the center will tend to have higher concentrations of plastic, while the periphery will have lower concentrations. While the “garbage patch” analogy clearly does not apply, and while the scale of the problem of plastic debris in the oceans is far less extreme than claimed by Moore and the many activists and journalists who have repeated it, it is not entirely insignificant. Moreover, as Miriam Goldstein and colleagues showed in a 2012 paper, the amount of small particulate plastic in the oceans has increased dramatically over the past several decades. By comparing surveys undertaken in 1972–3 and again in 2009–10, Goldstein and colleagues showed that over the past 40 years concentrations of the small bits of plastic in the North Pacific Gyre have increased by approximately two orders of magnitude (i.e., one-hundred-fold).54 This is hardly surprising, however, as the amount of plastic in use in modern society has increased similarly. Are Plastic Bags Killing Millions of Marine Animals? So, accepting that plastic bags are among the increasing amounts of plastic that finds its way to the oceans, what impact are they having? Various pressure groups claim that plastic bags are responsible for carnage at sea. For example, the Monterey Bay Aquarium asserts, “Scientists estimate that around the world, up to one million seabirds and 100,000 marine mammals and sea turtles die each year from eating plastic.”55 Several others have made similar assertions.56 One hundred thousand marine mammal deaths a year: that sounds like a serious problem. So, what is the evidence to back it up? The number has apparently been floating around for some time and was used in a life cycle analysis by Nolan-ITU Pty Ltd, commissioned by the Australian government, which asserted:

How Green Is that Grocery Bag Ban? | 15
A figure of 100,000 marine animals killed annually has been widely quoted by environmental groups; this figure was from a study in Newfoundland which estimated the number of animals entrapped by plastic bags in that area from a four-year period from 1981–84.57
Nolan-ITU, in turn, cited a website operated by the Canadian government, on which it was asserted that:58 “A four year study off the coast of Newfoundland estimated that over 100,000 animals were killed by entanglement from 1981 to 1984.”59 But that study did not look at the impact of plastic debris, let alone plastic bags; it estimated the annual loss of marine animals as a result of incidental catch and entanglement in fishing gear and concluded:
It is now clear that hundreds of thousands, if not millions, of non-target marine animals are being killed annually in a variety of Atlantic and Pacific fisheries. The negative impact of this mortality is already evident in some populations and we can expect to see future declines in other populations if net mortality continues unabated.60
In other words, the claim that plastic debris has been killing hundreds of thousands of marine mammals and millions of birds seems to be based on the misinterpretation of a study assessing the unintended impact of fishing gear (which refers to “marine animals”, not mammals). While the possibility that fishing gear is causing large numbers of marine animal deaths is worrying, it tells us nothing about the impact of plastic debris, except that from fishing gear. David Laist, an expert on entanglement and since 1979 an analyst for the Marine Mammal Commission, told a reporter at The Times that “in reality plastic bags don’t figure in entanglement …The main culprits are fishing gear, ropes, lines and strapping bands. Most mammals are too big to get caught up in a plastic bag. … the impact of bags on whales, dolphins, porpoises and seals ranges from nil for most species to very minor for perhaps a few species. For birds, plastic bags are not a problem either.” 61 The death of marine animals as a result of entanglement is a serious issue that unfortunately is being overlooked because activists are blaming the deaths on plastic bags. As David Santillo, a senior biologist with Greenpeace, is reported to have said to The Times, “It’s very unlikely that many animals are killed by plastic bags. The evidence shows just the opposite. We are not going to solve the problem of waste by focusing on plastic bags. ... With larger mammals it’s fishing gear that’s the big problem. On a global basis plastic bags aren’t an issue.”62
16 | Reason Foundation
Meanwhile, in relation to the claim that plastic bag debris is causing bird deaths, The Times quotes Professor Geoff Boxshall of the British Museum, “I’ve never seen a bird killed by a plastic bag. Other forms of plastic in the ocean are much more damaging. Only a very small proportion is caused by bags.” 63 How Can Litter be Reduced? By any measure, plastic bags constitute a small proportion of all litter. So, it would be foolish to focus any strategy intended to reduce litter primarily on plastic bags. In his response to Dallas City Council’s misuse of the KAB data, Steven Stein notes:
The use of misleading data such as this will likely lead to discussions of narrowly focused material bans, which if put into place, will not resolve the littering issues they are meant to address in the City of Dallas. Instead, they will create a false sense of security that litter-related problems have been appropriately resolved….64
A far, far better way to reduce litter is to change people’s attitude toward littering. How might this be done? Many approaches are possible but some combination of education, easier waste disposal options in public places (for example by providing additional garbage bins), and enforcing sanctions—and even legal penalties—for littering. A good example of a strategy that combined these approaches to good effect is the “Don’t Mess with Texas” campaign, a program established by the Texas Highway Commission in 1985 to reduce litter on the state’s highways. The program combines education, advertising, celebrity endorsements, partnerships with retailers and other business, increased provision of roadside garbage bins, and a maximum fine of $2,000 for littering.65 Analysis by Daniel B. Syrek of the Institute for Applied Research found that the Don’t Mess with Texas campaign reduced litter on Texas’s highways by 72% between 1985 and 1990.66
2.3 Would Restrictions on HDPE Bags Reduce Waste?
A corollary to the claim that restrictions on HDPE bags reduce resource consumption is the claim that such a ban would reduce “waste.” The idea that modern society is wasteful—or more pejoratively that we live in a “throwaway society”—has been a central theme of modern environmentalism since its inception in the late 1960s. Industrial ecologist Pierre Desrochers shows that this
How Green Is that Grocery Bag Ban? | 17
characterization, which he traces back at least to the late 19th century, is belied by the evidence.67 Desrochers identifies numerous examples of companies that developed uses for by-products in order both to reduce waste and to generate new products, thereby increasing their companies’ profitability.68 Plastic bags emerged in the context of a highly developed system of production and exchange. For comparison, consider medieval Europe, where until the late 15th century, 90% of the population lived in villages in the countryside, the vast majority eking out an existence by planting, tending and harvesting crops.69 Most goods and services were provided locally; food was grown on strips of land within the village, timber was harvested from local trees.70 Trade tended to be regional rather than national or transnational and was limited to products of higher value that were relatively easily transported, such as leather (which was typically manufactured in towns), finished wool garments and jewelry.71 Limited trade meant a lack of competition in the supply of goods, which in turn meant that quality tended to be poor. Diets were monotonous and often lacked essential nutrients, contributing to rampant disease. If harvests failed, the poor starved to death.72 But people had very strong incentives to use the mediocre products they owned until no more life could be wrung from them. This meant that significant amounts of time—especially of women—were spent mending old clothes. Meanwhile, wastes were disposed of locally; that included human excrement, which was typically disposed of in open latrines. Such non-hygienic living contributed to high rates of communicable diseases. About a third of people died in the first five years of life; those who survived infancy could expect to live to about 60 (but the high infant mortality rate meant that life expectancy at birth was between 40 and 45).73 In modern America, the majority of people live in towns and work in industry or services, participating in a complex economy that relies on a web of exchanges to produce an enormous range of products. The high degree of trade, spanning towns, states and continents, ensures that there is substantial competition for nearly every kind of good and service, which drives innovation and improvements in quality. This dynamic market economy has resulted in dramatic improvements in both longevity and quality of life for the vast majority of Americans. Life expectancy at birth rose from 46 for men and 48 for women in 1900 to 76 for men and 81 for women in 2010, respectively.74 Meanwhile, reports of life satisfaction and happiness suggest that Americans today are far happier than they have ever been.75 Not only are we living longer, more satisfying, happier lives, we are also becoming more efficient in our use of resources, both in production and in

18 | Reason Foundation
consumption. From cars to computers, fewer materials are used to deliver the same or, usually, better performance. And because fewer materials are used, both production and consumption are associated with fewer emissions to the environment. In large part, these improvements have occurred in response to the incentives inherent in market systems; specifically (1) consumers have sought to acquire goods and services that meet their desires more effectively at lower total cost (including the cost of operation and disposal); (2) enterprises, operating in a competitive market, have sought to meet the perceived desires of consumers by producing higher quality goods and services at lower cost and have done this in part by reducing input costs through reduced material use, as well as by making products more efficient in consumption and more readily disposable. Among the products that have helped improve our lives is a whole range of disposable items. The advent of the disposable cup, for instance, reduced the practice of people drinking from the same receptacles without adequate cleansing, dramatically slowing the spread of disease and illness. For the same reason, modern hospitals rarely recycle anything, choosing instead to use disposable plastic products that can be incinerated. Plastic bags provide similar benefits, offering an inexpensive, hygienic means of carrying comestibles and other items. Given the tendencies in the market system to reduce waste, it seems reasonable to suggest that there should be a presumption that market actors are constantly striving to increase efficiency and reduce waste. The corollary to this is that proponents of intervention should be required to show that the net effect of their proposed intervention would be to reduce total waste. The claim here is not that market systems generate no waste. Rather, it is that markets tend to reduce waste and that those who seek to intervene in markets ostensibly to reduce waste further must demonstrate—at minimum—that their proposed intervention will actually reduce the total amount of waste produced without unduly affecting quality of life. With regard to plastic bags, environmental activists claim that their use results in unnecessary generation of waste, which ends up in landfills, where they languish undecomposed. For example, the WorldWatch Institute claims that “Every year, Americans reportedly throw away 100 billion plastic grocery bags, which can clog drains, crowd landfills, and leave an unsightly blot on the landscape.”76 A look at the data, however, reveals a very different picture. Analyses by the U.S. Environmental Protection Agency show that in 2010, the nation discarded 690,000 tons of HDPE bags. Of those, approximately 30,000 tons were

How Green Is that Grocery Bag Ban? | 19
recovered (i.e., recycled), meaning that a total of 660,000 tons were finally discarded—mostly into landfill (approximately 82% of non-recovered municipal solid waste goes to landfill; 18% is incinerated).77 The same year, the nation produced a total of just under 250 million tons of municipal solid waste, of which approximately 85 million tons were recovered and 165 million tons were discarded. So, HDPE bags constituted approximately 0.28% by weight of all waste generated and 0.4% by weight of all waste discarded.78 By comparison, in the same year, the nation discarded almost exactly the same amount of “reusable” polypropylene bags (680,000 tons), of which none were recovered. So, polypropylene actually constituted a slightly higher proportion of all bags going to landfills (at 0.41%).79 Meanwhile, also in the same year, the nation discarded just over 1 million tons of paper bags and sacks, of which approximately 25% was estimated to have been recovered and 75%, or 750,000 tons, discarded.80 Not only is that a larger weight, but because paper is less dense than plastic, it takes up considerably more space in landfills. As William Rathje, the late professor of archaeology at the University of Arizona who gained fame by applying archaeological techniques to excavating and analyzing the contents of landfills, noted, “Plastic bags, especially in landfills, take up so much less volume than paper bags. If you’re worried about the amount of space in landfills taken up by plastic bags—don’t.”81
Source: U.S. Environmental Protection Agency, Municipal Solid Waste Generation, Recycling, and Disposal in the United States
30,000 0
260,000
0
200,000
400,000
600,000
800,000
1,000,000
1,200,000
HDPE POLYPROPYLENE PAPER
Figure 6: Types of Bags Discarded and Recovered in the U.S., 2010
DISCARDED (tons) RECOVERED (tons)
660,000 680,000 780,000

20 | Reason Foundation
Landfill Decomposition
Another issue raised by those against plastic bags is that the bags take a long time to decompose in landfills. Proponents of restrictions on HDPE bags argue that paper bags and “biodegradable” plastic are superior because they break down faster than HDPE. In reality, nothing much breaks down in most landfills, even organic matter, because landfills essentially entomb waste, sealing it off from oxygen, thereby inhibiting decomposition.82 William Rathje notes that “In a normal, well-run landfill, paper bags do not biodegrade any faster over at least 40 years than plastic.”83 Below, we reproduce a photo of a nearly pristine newspaper that was more than 30 years old when recovered from a landfill by Rathje and colleagues.84
Correcting Perverse Incentives in the Production and Disposal of Household Waste
One area where the market has not necessarily created the least-waste solution is in the disposal of household solid waste. One important reason for this is that the collection and disposal of household solid waste is in most cases undertaken either directly by government employees or indirectly by companies contracted to government, with the costs borne by residents through their local taxes. In other words, collection and disposal has in most cases not been subject to normal market processes and the amount that households pay for waste disposal is unrelated to the amount of waste they generate.85 As a result, it is possible that households use more plastic shopping bags than they would if they had to pay for each pound of waste they produced.
How Green Is that Grocery Bag Ban? | 21
One way to incentivize households to make more rational choices regarding their consumption of material—including plastic shopping bags—and disposal of waste is to charge for each unit of waste produced and offer a discount for valuable recyclable material. Over the course of the past 30 years, many municipalities in the U.S. have adopted “pay as you throw” schemes, usually combined with unpriced curbside recycling programs. On average, households in municipalities with such schemes produce less waste and recycle more because of the scheme.86 However, charging for the disposal of each bag of waste can also have perverse effects, such as the tendency to compact trash prior to disposal rather than reduce the amount actually produced. For example, when Charlottesville, Virginia introduced per bag pricing for trash, the volume of trash disposed fell by 37% but the weight fell by only 14%.87 More important, however, is the effect of unit pricing on littering and illicit burning: about half of that 14% reduction in weight was a result of the otherwise well-heeled residents of Charlottesville engaging in “midnight dumping.”88 So, it is important to design pay-as-you-throw schemes in such a way as to reduce these perverse incentives; that likely means charging a fixed fee to cover fixed costs, a weight-based fee for variable costs, and (possibly) a refund for high value recyclable material. Assuming that the problems of charging for each pound of waste can be overcome, such charging would seem to be an equitable means of incentivizing consumers to use the number of plastic carrier bags that appropriately balances costs and benefits.
2.4 Would Restrictions on HDPE Bags Reduce Our Impact on the Global Climate?
Ross Mirkarimi and others who assert that reducing or eliminating HDPE bags would help reduce global warming through reduced oil consumption are simply wrong, but what of the claim that reducing plastic bag use would reduce greenhouse gas (GHG) emissions? This is a more complex question because it depends very much on what consumers use instead of HDPE bags. The life cycle analyses in the next section have sought to address this question by analyzing how the use of different kinds of bags, at various reuse and recycling rates, would impact GHG emissions.
22 | Reason Foundation
P a r t 3
Comparing the Impact of HDPE Bags and Alternatives Using Life Cycle Analysis
In Part 2, we discussed various claims that had been made regarding the impact of plastic bags on the environment. We showed that the most emotive of these claims—the impact of plastic bags on litter in general and the marine environment in particular—lacked a sound empirical basis. Indeed, whereas environmental pressure groups, the media and celebrities tend to focus on the impact of discarded plastic bags, the evidence suggests that such concerns are not well founded. A better way to evaluate the impact of plastic bags on the environment is to look at the total impact of such bags—and alternatives—over the course of their lifecycle.
3.1 Life Cycle Analysis
Life cycle analysis, or “LCA,” has its origins in a study by the Midwest Research Institute, which was commissioned in 1969 by Harry Teasley, then head of a production division at Coca Cola, to investigate the environmental impact of various different kinds of beverage containers.89 That LCA showed there was no single ideal container but, rather, that the container with the lowest environmental impact would depend on factors that varied both by location and use, including: the number of times a glass bottle is reused; the proportion of aluminum cans recycled (at the time extremely high recycling rates would have been required); and the method of disposal (at the time, incineration of PVC bottles would have led to relatively high levels of toxic emissions).90 As the Coca Cola study demonstrates, LCAs typically must make a range of assumptions regarding such things as which products are being compared, what are the likely rates of reuse and recycling for each product, which processes are used in collection and processing or repurposing, which environmental impacts

How Green Is that Grocery Bag Ban? | 23
should be assessed, and how to compare these (if at all). The Coca Cola study also demonstrates that the answer to these questions likely varies over time: since 1971, innovations have resulted in dramatic reductions in the amount of material needed to make both plastic bottles and aluminum cans; meanwhile, the amount of material required for a reusable glass bottle has changed relatively little. As a result, over time, the rates of reuse of glass bottles necessary to make them broadly equivalent in impact to single-use alternatives have increased. LCA methodology has become somewhat more formalized over the past 40 years and currently most practitioners follow the guidelines recommended by the International Organization for Standardization under ISO 14040:2006.91 Under these guidelines, an LCA involves four main steps: (a) assessment of goals and scope (this typically involves the identification of system boundaries and other limitations—see below); (b) inventory analysis (i.e., the collection of raw data on inputs and, where available, outputs); (c) impact assessment (i.e., the parsing of the raw data to produce consistent measures of impact across product types); (d) interpretation (i.e., analysis of the various incommensurate elements of the assessment matrix to offer insights and inputs into decision-making processes).
3.2 LCAs of Grocery Bags
During the past 25 years, numerous LCAs of grocery bags have been undertaken by research groups in the U.S. and other countries. In this section, we report on the main LCAs that have been developed, namely those produced by:
§ Franklin Associates (for the Council for Solid Waste Solutions, U.S.),92
§ Bousted Consulting and Associates (for the Progressive Bag Alliance, U.S.),93
§ Nolan-ITU (two studies for Environment Australia),94
§ Ecobilan-PWC (for Carrefour, France), and
§ Intertek (for the U.K. Environment Agency).95 In addition to these primary LCAs, there are numerous literature reviews, derivative and other (partial) synthesis reports, which have gathered information from some of the more substantive LCAs and sought to represent it in various ways. These include the Scottish Government LCA (which is based entirely on the Ecobilan-PWC analysis),96 the ULS Report (which synthesizes information from several studies), and the Chico Research Foundation97 (which combines

24 | Reason Foundation
some LCA data from the Bousted report with other data from a “streamlined” LCA produced by RMIT for the Australian province of Victoria).98 To avoid duplication of research results, we do not include these studies here.
Which Bags to Compare?
The first question an LCA must address is which products are being compared. In the case of grocery bags, the most common types are high-density polyethylene (HDPE), low-density polyethylene (LDPE), non-woven polypropylene (NWPP), and paper. Other, less common materials used to manufacture bags that have been included in some LCAs are: biopolymer, cotton, and jute. In addition, some stores do not offer any bags but permit customers to (re)use boxes, which could in principle therefore also be considered a comparator.
System Boundaries and Which Impacts to Include
The life of a product must start somewhere. Most LCAs chose to set the “cradle” as the “material extraction stage.” (In principle, one could go back a stage further and evaluate the impact of the process of manufacturing the equipment used to extract the materials. Indeed, one could carry this on ad infinitum. However, the relative impact of stages prior to material extraction is likely to be diminishingly small.) The boundary point for the end of a product’s life—its grave—is also potentially ambiguous. Some LCAs assume that most bags are disposed of in an organized manner and choose to end with the management of the bag as municipal waste (e.g. through landfill, incineration, recycling or composting). Others seek to quantify the extent and impact of disorganized end of life disposal, i.e., littering and associated harm. Having set the system boundaries, the LCA analyst must choose the specific stages in the life cycle that will be assessed. For grocery bags, the stages assessed typically are: raw materials extraction and production, bag production, packaging, transport, use, and end of life. The next task is to decide which environmental effects are worthy of consideration and how these should be addressed. Broadly, there are three categories of effects: resource consumption (including energy and water consumption), emissions to water (and associated proxies for “pollution,” such
How Green Is that Grocery Bag Ban? | 25
as biological oxygen demand and/or chemical oxygen demand), and emissions to the air. Again, there is no single “correct” way to account for these environmental effects. A large part of the problem is that while there are semi-objective measures for some environmental effects—such as the health impacts that result from high concentrations of certain water and air contaminants—for most effects there is no objective standard and, perhaps worse, no way of comparing different effects.99 In addition, once a choice has been made regarding what metrics to use (e.g. emissions of sulfur dioxide, consumption of electricity), very often similar bags manufactured at different plants will be associated with different levels of resource consumption and emissions due to variations in manufacturing processes as well as different transportation distances and methods. So, to the extent that bags are produced at multiple plants in multiple locations, impact estimates may not be generalizable from one seemingly identical bag to another. Some attempts have been made to standardize the way in which LCAs measure environmental impact. For example the Institute of Environmental Sciences at the University of Leiden in the Netherlands (known as CML) has produced an LCA handbook and related software that offers a methodology for characterizing and evaluating the environmental impact of products at various stages in their life cycle.100 This methodology addresses some but not all of the problems identified above. For example, it enables the LCA analyst to account for variations in the receiving environment when addressing issues such as eutrophication (i.e., the oversupply of fertilizing agents resulting in algal blooms, which deplete water of oxygen necessary for fish and other species to survive, and other problems) and toxicity (human and environmental).101 However, such assessments remain crude and are unable to address many of the subtle (and some not so subtle) differences in receiving environments.
3.3 Comparing the Impact of Bags on the Environment
As noted, several attempts have been made to compare the impact of different types of bags using life cycle analysis. Here we report on the most important primary LCAs so far released. Table 2 summarizes the various measures utilized by the different LCAs and shows which types of bags were assessed.

26 | Reason Foundation
The following subsections discuss each of these measures and provide summary data on the outputs for each measure. For clarity, we have rebased the analysis, so that for each measure, the estimated effect of one bag of any type is given as a multiple of the effect of one HDPE bag used once. Put another way, for each measure (global warming potential, air pollution, water use, etc.), the effect of a single use of an HDPE bag is given as 1.0 and the effect of a single use of one bag of each other type is a multiple of that.
Global Warming Potential
This is a measure of the emissions of gases, such as carbon dioxide and methane, thought to contribute to global warming by delaying the radiation of heat emitted by the earth. It is measured in “CO2 equivalents.” The equivalency value used in most LCAs is one developed by the Intergovernmental Panel on Climate Change.102 It is worth noting that the science of global warming remains in flux and there is some dispute over these equivalency values.103 However, for the purpose of the LCAs of paper bags it appears that the dominant gas under investigation is carbon dioxide itself, so any “equivalency” or lack thereof with methane, dinitrogen monoxide and other GHGs is probably not of great concern.
Table 2: LCAs of Grocery Bags LCA Year Country Types of bag Effects assessed
"abiotic
depletion" air emissions
water emissions
HDPE
LDPE
NW
PP
pape
r
biod
egra
dabl
e
clot
h
"mat
eria
l" c
onsu
med
ener
gy c
onsu
med
solid
was
te g
ener
ated
wat
er c
onsu
med
litte
r
gree
nhou
se g
as e
mis
sion
s
acid
ifica
tion
phot
oche
mic
al o
xida
tion
eutrop
hica
tion
fres
hwat
er e
coto
xici
ty
mar
ine
ecot
oxic
ity
hum
an tox
icity
Franklin Associates
1990 U.S. X X X X XXX XXX
Bousted 2007 U.S. X X X X X X X X
Ecobilan-PWC
2004 France X X X X X X X X X X X X
Nolan-ITU 2002 Australia X X X X X X X X X X
Nolan-ITU 2003 Australia X X X X X X XXX X X X X
Intertek 2011 U.K. X X X X X X XXX X X X X X
How Green Is that Grocery Bag Ban? | 27
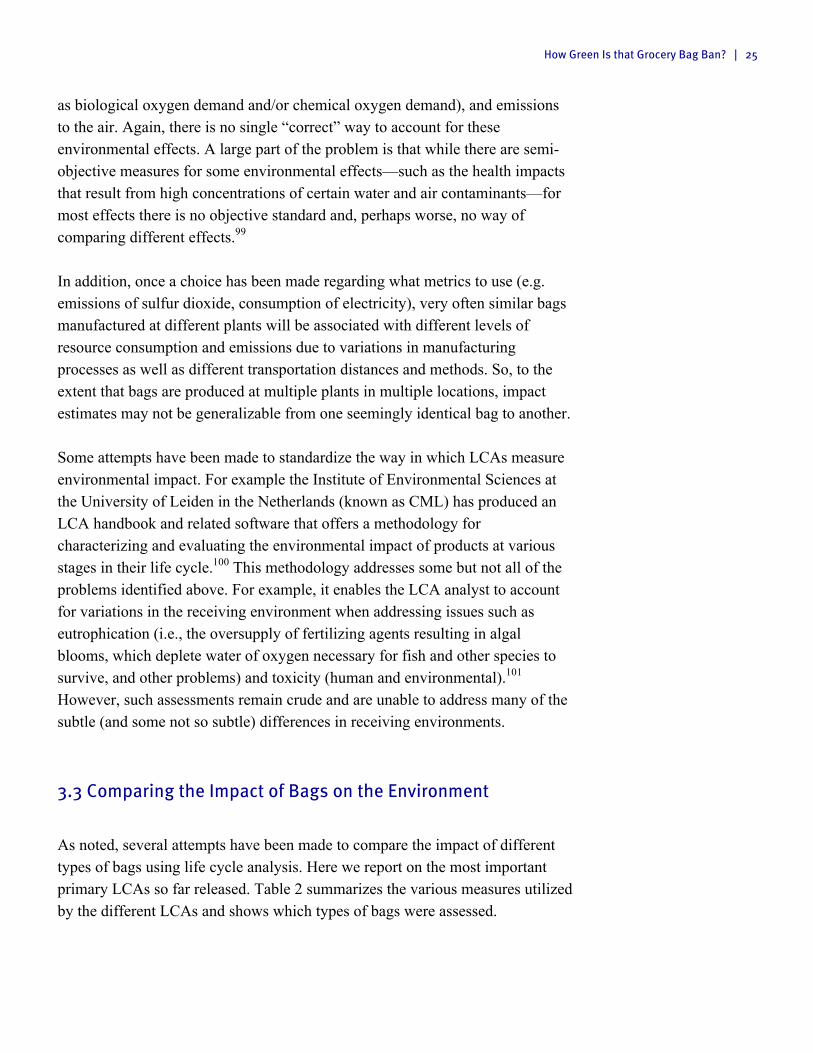
Table 3: Global Warming Potential of Various Bags Relative to HDPE LCA Bousted Ecobilan-PWC Nolan-ITU 2002 Nolan ITU 2003 Intertek
Bag
typ
e
HDPE 1.0 1.0 1.0 1.0 1.0 LDPE - 2.6 6.1 4.5 3.3 NWPP - - 42.6 33.1 10.3 Paper 2.3 3.3 2.5 4.9 2.7 Biodegradable 4.9 1.5 1.4 0.4 0.8 Cloth - - 27.4 1.0 130.4
Source: various LCAs cited in this report, adapted by authors (calculations available upon request).
As can be seen, the various LCAs resulted in sometimes dramatically different estimates of GHG emissions for the same type of bag. These reflect differences in assumed production and transportation factors that are location-specific (i.e., the kinds of input used to produce the bags, whether bags are produced domestically or imported, etc.). In the original reports, authors also made assumptions about reuse rates; 104 for the purposes of comparability, we have calculated the effects for a single use of each bag. As noted above, this enables us to see how many times a particular type of bag would actually have to be reused in order to have a comparable impact to an HDPE bag used once and then discarded. However, since a large proportion of people actually reuse their HDPE bags, the comparable rate would be higher. On the basis of this analysis, it is not possible to say conclusively which type of bag will result in the least emissions of greenhouse gases. To a significant degree, it depends on where the user lives and the ways in which he or she uses the bags. For individuals living in the U.K. who fastidiously care for their NWPP bags, so that they last for at least ten uses, perhaps they will achieve a global warming potential equivalent to using an HDPE bag once. But for those who tend to use their HDPE bags as trash bags it might be necessary to get 15 or more uses from a NWPP bag before achieving the same global warming potential. For people living in France who are able to eke out three or more uses from an LDPE bag and don’t currently reuse their HDPE bags, the Ecobilan-PWC analysis suggests that might be the bag with the lowest global warming potential. But for those who do reuse their HDPE bags, it might be necessary to get five or more uses from the LDPE bag in order to achieve fewer GHG emissions than the HDPE bags. For those living in Australia, biodegradable bags made from starch-polybutylene succinate adipate might be the option that results in the fewest GHG emissions,
28 | Reason Foundation
on the basis of Nolan-ITU’s 2003 study. But those who tend to reuse plastic bags for garbage might do better to stick with HDPE; first, because one wouldn’t want the bag biodegrading before it is time to throw it out; second, because by reusing the HDPE bag, most if not all the difference in global warming potential between the bags will be mitigated. For those who live in the U.S., the impact of NWPP bags might be assumed to be similar to that estimated by Nolan-ITU—since the relatively heavy bags are imported from China and thus, as with that study, will have high emissions associated with transportation. Meanwhile, if the Bousted analysis is correct, degradable bags are associated with considerably higher emissions than HDPE. So, it seems likely that the HDPE bag will have the least global warming potential under most circumstances, especially since 65% of Americans reuse their HDPE bags for garbage.105
Air Pollution
Three of the LCAs (Franklin Associates, Bousted and Ecobilan-PWC) included measures of air pollution. Franklin Associates used a simple measure (weight of emissions in pounds). Bousted included a measure of “acidification” or “acid rain” (i.e., emissions of nitrogen and sulfur oxides), while Ecobilan-PWC and Intertek included both broader measures of acidification (including not only sulfur dioxide (SO2) and nitrogen oxides (NOx) but also hydrochloric acid (HCL) and ammonia (NH3)106) and “photochemical oxidation” (chemicals such as dinitrogen monoxide (N20) and volatile organic compounds (VOCs) that can result in ozone-generating photochemical smog). While Franklin’s measure is simple and readily comparable, it offers no insight into the actual impact of the emissions. The other measures seek to relate emissions to impacts, however modelling limitations make it extremely difficult to draw firm conclusions regarding the actual effects of specific emissions and hence the validity of the assessments. The impact of nitrogen emissions, for example, is not readily equivalent to the impact of sulfur emissions, so Bousted’s separation of these items is in some respects more useful than Ecobilan-PWC and Intertek’s aggregate “acidification” measure. Moreover, the impact of these emissions is extremely complex and varies with the receiving ecosystem; it also varies non-linearly in response to the quantity of emissions and the presence of other emissions (in some cases, for example, emissions of nitrogen oxides may enhance growth of certain plant species; in others, they have the opposite effect).107

How Green Is that Grocery Bag Ban? | 29
As can be seen in Table 4, regardless of the LCA, a single paper or NWPP bag causes far greater emissions of most pollutants over their life cycle than an HDPE bag. But as with estimates of global warming potential, the LCAs vary considerably in their estimates, even when measuring the same phenomenon. For example, the Ecobilan-PWC LCA finds that a paper bag generates 1.9 times as much “acid rain” generating chemicals as an HDPE bag, while Intertek finds that a paper bag generates 2.8 times as much “acid rain,” and Bousted finds that a paper bag produces 3.9 times as much nitrogen oxides and 7.6 times as much sulfur dioxide as an HDPE bag.
Table 4: Air Pollution Due to Various Bags Relative to HDPE LCA Franklin Bousted Ecobilan – PWC Intertek Measure - SO2 NOx "acid rain" "smog" "acid rain" "smog"
Bag
type
HDPE 1.0 1.0 1.0 1.0 1.0 1.0 1.0 LDPE - - - 3.0 1.4 2.2 0.4 NWPP - - - - - 7.5 2.1 Paper 1.8 7.6 3.9 1.9 1.3 2.8 2.9 Biodegadable - 5.4 6.7 1.8 0.5 1.1 1.1 Cloth - - - - - 207.2 143.3
Source: various LCAs cited in this report, adapted by authors (calculations available upon request).
Abiotic Depletion and Consumption of Non-Renewable Energy Resources
Abiotic depletion refers to the removal of non-living resources, including oil, gas, coal, clay and peat from the earth. The measure used is “kilograms of Antimony (Sb) equivalents.” Critics have noted serious technical issues with the definition of the problem allegedly being addressed by this measure; for example, whether the problem is seen as scarcity, mining cost, or the environmental impact of mining will significantly affect the equivalency value, as will the discount rate chosen.108 Beyond these technical issues, such a measure presents two more fundamental challenges. First, it presumes different resources are substitutes for one another, which in most cases is obviously false (clay and peat are not substitutes for most applications, nor are coal and gold). Second, the availability and demand for particular resources are constantly changing as new sources are being discovered and new uses invented, so even for resources that are substitutes, the equivalency value will be constantly changing. Finally, the idea of “abiotic depletion” ignores the benefits that accrue through the use of the world’s abiotic resources, which includes the facilitation of research and development of new resources, as well as technologies that enable us to use existing resources more efficiently. As an illustration, consider

30 | Reason Foundation
that during the 19th century, whale oil was widely used for illumination and lubrication. Demand for the oil drove increases in the capture of whales. But whales grow slowly and by the mid-19th century stocks were falling, driving up prices. In response, entrepreneurs looked for alternatives. Various technologies were developed, beginning with the use of gasified coal for street lights. But such gas was not easily portable, nor could it be used as a lubricant, so demand for whale oil continued to increase until the invention of processes to refine oil were developed in the mid-19th century. By the end of the 19th century, abiotic minerals (coal and crude oil) had replaced biotic resources (whales) as the primary sources of light and lubrication, thereby reducing pressure on those biotic resources, which might otherwise have been driven to extinction.109 Perhaps in part due to its controversial nature, only two of the LCAs (Nolan-ITU 2003 and Intertek) measured “abiotic depletion.” We have decided also to avoid the measure, providing instead—in Table 5—only estimates of consumption of non-renewable energy resources, for which there are existing, well-established, objective and relatively stable equivalency values (based on the energy content of the resource, whether represented in Joules, calories, British Thermal Units, or some proxy such as gallons of oil equivalent). As with the other tables, all measures are relative, so for example, the Nolan-ITU 2002 LCA implies that one NWPP bag requires 22.9 times as much energy as one HDPE bag.
Table 5: Consumption of Non-Renewable Energy Resources of Various Bags Relative to HDPE LCA Franklin Associates Bousted Ecobilan-PWC Nolan-ITU 2002
Bag
typ
e HDPE 1.0 1.0 1.0 1.0 LDPE 3.8 4.5 NWPP 22.9 Paper 2.5 1.3 1.4 2.5
Source: various LCAs cited in this report, adapted by authors (calculations available upon request)
Solid Waste Generated
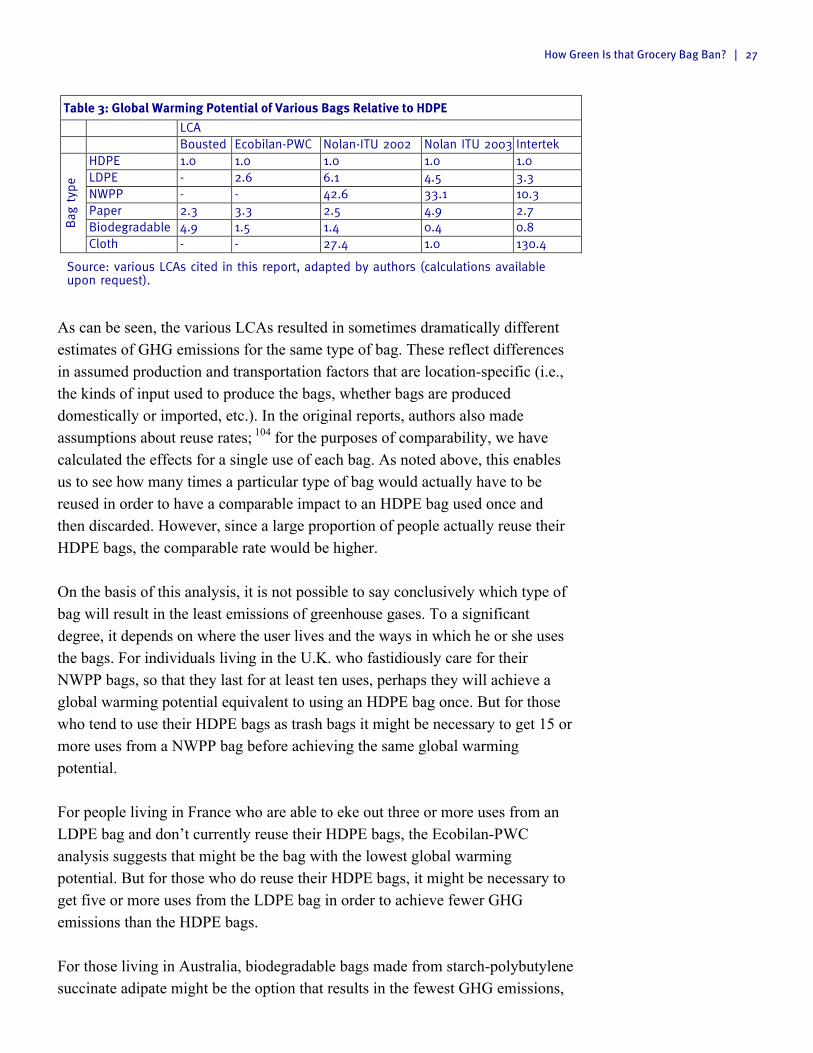
Three of the LCAs (Franklin Associates, Bousted, Ecobilan-PWC) included analysis of the solid waste generated during the life cycles of the bags evaluated. The common metric used was weight. The other LCAs typically included the impact of solid waste generated into other measures (abiotic depletion, air emissions, etc.). Since the generation of solid waste is not necessarily a concern in and of itself, it arguably makes more sense simply to include associated emissions elsewhere (as the LCAs presumably do). Most likely the LCAs that accounted for solid waste generation as a separate line item were responding to
How Green Is that Grocery Bag Ban? | 31
the perception that solid waste is somehow a distinct problem—a perception that has been fostered by decades of campaigning by activist groups. Table 6: Solid Waste Generated by Various Bags Relative to HDPE LCA Franklin Associates Bousted Ecobilan-PWC
Bag
type
HDPE 1.0 1.0 1.0 LDPE - - 2.8 Paper 5.0 4.8 2.7 Biodegradable - 2.7 1.1
Source: various LCAs cited in this report, adapted by authors (calculations available upon request)
Litter Generated
Given the paucity of well-designed surveys of litter composition (see Part 2), the inclusion of “litter” as a category in LCAs poses significant challenges. None of the LCAs actually attempted anything close to a systematic assessment of the amount of litter likely to be generated by each bag type, or its impact; relying instead on vague claims. Nolan-ITU 2002 is particularly egregious in this respect, since it was the source of the mistaken assertion that plastic bag litter results in 100,000 marine animal deaths per year. Nolan-ITU 2002 also simply assumes that 0.5% of all bags will become litter. Because of the lack of systematic empirical analysis underpinning this measure, we have not attempted to provide a comparison table. Much like the measure of solid waste generated, the attempt to measure “litter” from bags is most likely a response to the public perception of problems related to grocery bags, which, as noted in Part 2, has been driven by campaigns run by environmental pressure groups.
Water Consumption
Two of the LCAs (Bousted, Ecobilan-PWC) explicitly measured the water consumed over the life cycle of the bags they compared. A possible rationale for including such an assessment is that although water is not a globally scarce resource,110 in some places it is less readily available than in others. Everywhere, the production and delivery of water consume resources (energy and other resources are required to process and transport water). Meanwhile, clean water used for producing (or, in the case of reusable bags, cleaning) carrier bags is not immediately available for other purposes.

32 | Reason Foundation
These assessments are summarized in Table 7 below. Both Bousted and Ecobilan-PWC estimated that paper and biodegradable bags would consume more water than HDPE bags. However, the disparity in volumes of water consumed in each case is remarkable; Ecobilan-PWC estimates that one paper bag consumes 3.3 times as much water as an HDPE bag, while Bousted estimates that one paper bag consumers 25.1 times as much water as one HDPE bag. Table 7: Water Consumption During Life Cycle of Various Bags Relative to HDPE LCA Bousted Ecobilan-PWC
Bag
typ
e HDPE 1.0 1.0 LDPE - 2.6 Paper 25.1 3.3 Biodegradable 16.8 1.0
Source: various LCAs cited in this report, adapted by authors (calculations available upon request)
Water Pollution
All the LCAs except Nolan-ITU 2002 sought to measure the impact of carrier bags on water pollution. Franklin Associates used a very simple measure (pounds of emissions per 1,000 uses). Bousted used several potential measures; we chose their estimate of biochemical oxygen demand (BOD), which is considered a standard metric of water quality.111 The other LCAs all used eutrophication; Intertek also used ecotoxicity. In the widely used University of Leiden Institute for Environmental Sciences model LCA, toxicity (ecological and human) is measured in terms of “dichlorobenzene equivalents.” While such a common metric has the advantage of comparability, it is based on two presumptions of questionable validity. First, it presumes that it is possible to establish an equivalency between potential toxins with fundamentally different characteristics. In reality, it is difficult, if not impossible, to establish equivalency between potential toxins that have fundamentally different characteristics; for example, metals (such as arsenic) and organic molecules (such as benzene) vary significantly in their rate of decomposition.112 Second, it presumes that toxicity is always linear, independent and has no threshold effects. In most cases, however, the opposite is true: toxicity tends to be non-linear, interactive and have threshold effects.113 To take an extreme example: small amounts of vitamin C (L-ascorbic acid) play an important role in human defenses, preventing scurvy and generally supporting
How Green Is that Grocery Bag Ban? | 33
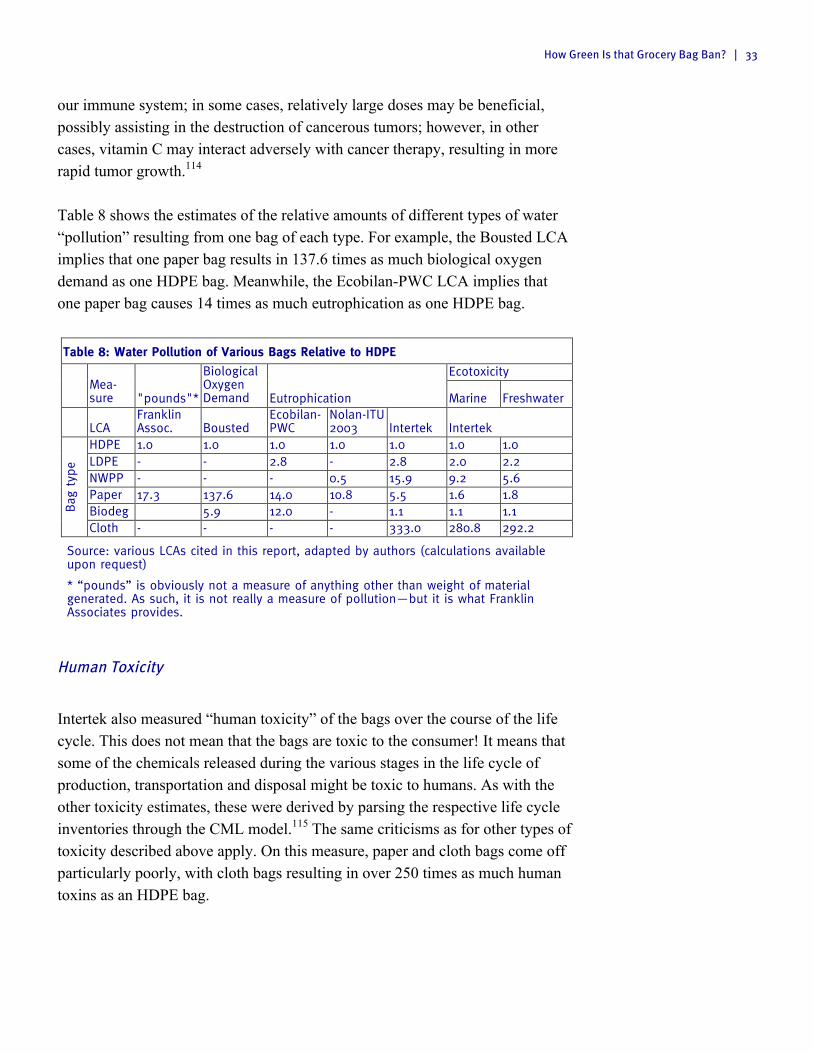
our immune system; in some cases, relatively large doses may be beneficial, possibly assisting in the destruction of cancerous tumors; however, in other cases, vitamin C may interact adversely with cancer therapy, resulting in more rapid tumor growth.114 Table 8 shows the estimates of the relative amounts of different types of water “pollution” resulting from one bag of each type. For example, the Bousted LCA implies that one paper bag results in 137.6 times as much biological oxygen demand as one HDPE bag. Meanwhile, the Ecobilan-PWC LCA implies that one paper bag causes 14 times as much eutrophication as one HDPE bag. Table 8: Water Pollution of Various Bags Relative to HDPE
Mea-sure "pounds"*
Biological Oxygen Demand Eutrophication
Ecotoxicity
Marine Freshwater
LCA Franklin Assoc. Bousted
Ecobilan-PWC
Nolan-ITU 2003 Intertek Intertek
Bag
typ
e
HDPE 1.0 1.0 1.0 1.0 1.0 1.0 1.0 LDPE - - 2.8 - 2.8 2.0 2.2 NWPP - - - 0.5 15.9 9.2 5.6 Paper 17.3 137.6 14.0 10.8 5.5 1.6 1.8 Biodeg 5.9 12.0 - 1.1 1.1 1.1 Cloth - - - - 333.0 280.8 292.2
Source: various LCAs cited in this report, adapted by authors (calculations available upon request)
* “pounds” is obviously not a measure of anything other than weight of material generated. As such, it is not really a measure of pollution—but it is what Franklin Associates provides.
Human Toxicity
Intertek also measured “human toxicity” of the bags over the course of the life cycle. This does not mean that the bags are toxic to the consumer! It means that some of the chemicals released during the various stages in the life cycle of production, transportation and disposal might be toxic to humans. As with the other toxicity estimates, these were derived by parsing the respective life cycle inventories through the CML model.115 The same criticisms as for other types of toxicity described above apply. On this measure, paper and cloth bags come off particularly poorly, with cloth bags resulting in over 250 times as much human toxins as an HDPE bag.

34 | Reason Foundation
Table 9: Human Toxicity of Various Bags Relative to HDPE According to Intertek LCA Bag type Human Toxicity HDPE 1.0 LDPE 2.7 NWPP 11.5 Paper 12.3 Biodegradable 1.1 Cloth 251.2
Source: various LCAs cited in this report, adapted by authors (calculations available upon request)
3.4 Comparing the Bags on the Basis of the LCAs
As previously noted, in the above analysis, we have sought to make comparable the various estimates of the environmental impact of each type of bag. We did this by estimating the impact of a single bag of each type (for which assessments were available) relative to the impact of a single HDPE bag. For most environmental concerns addressed, the single HDPE bag was estimated to have a lower impact than other single bags. The only exceptions were: first, in the case of emissions related to photochemical smog, which Interek assessed to be lower for LDPE bags; and second for global warming potential, which both Intertek and Nolan-ITU assessed to be lower for biodegradable bags. However, other assessments of the global warming potential of biodegradable bags found them to be significantly higher than HDPE bags. Part of the difference likely comes from differences in the type of bag being assessed, while part likely comes from differences in estimates of the impact of growing the feedstock for the biodegradable bag (Nolan presumably assumed significantly lower impacts from agriculture than Bousted, for example). Also note that an almost identical LCA, also produced by Nolan-ITU in 2003 for the Australian government, found that the same biopolymers had higher global warming potentials—with the lowest being almost identical to that of HDPE.116 These tables also enable us in principle to evaluate the impact of bags subjected to different reuse rates. So, for example, if our primary concern is a bag’s global warming potential, we can see that we would need to reuse a NWPP bag between 10 and 42 times in order to bring our impact down to the level of an HDPE bag used once. Meanwhile, if we tend to reuse our HDPE bags for trash or other purposes, the comparable reuse rates would likely be somewhere between 20 and 84 times. The situation is better for LDPE bags; these would

How Green Is that Grocery Bag Ban? | 35
require only three to six reuses in order to be comparable with HDPE bags. But LDPE bags are also less robust than bags made from NWPP, which is why Nolan-ITU assumes reuse rates of 10–12 times. Nonetheless, if one can achieve the implied reuse rates—either with NWPP or with LDPE—in principle one might reduce the amount of global warming associated with one’s shopping. But to put this in context, it is worth comparing the effect of transitioning to reusable bags with other actions that impact the environment. So, suppose one were to use the bag with the lowest global warming potential of all bags assessed in all the LCAs considered herein when reused the number of times assumed in the LCA. That would be the woven polyethylene bag used 104 times (that bag type was not included in the above tables because among the LCAs it was evaluated only by Nolan-ITU). How much of a reduction in global warming potential would one have? Nolan-ITU estimates the annual global warming potential of shopping all year using conventional HDPE bags at 6.08 kg of CO2 equivalent. Meanwhile, shopping all year with woven HDPE bags emits 0.628 kg—a saving of 5.752 kg. If you drive a car whose average fuel consumption is 25 miles per gallon, you will be emitting about 350g of carbon dioxide per mile.117 So, a consumer who travels five miles each way to the supermarket will emit approximately 0.35 x 5 x 2 = 3.5 kg of carbon dioxide per trip. In two shopping trips such a consumer will emit more carbon dioxide (7kg) than he would save over an entire year by switching from HDPE bags to reusable bags, using the most optimistic assumptions.
36 | Reason Foundation
P a r t 4
Evaluating the Impact of Plastic Bag Regulations
This section considers the impact of taxes, fees and bans on shopping bags. It begins by assessing the impact of taxes and fees on bag use. It then does the same for bag bans. Following these largely descriptive sections, an attempt is made to assess the benefits and costs of these bans, taxes and fees.
4.1 The Impact of Bag Taxes and Fees on Bag Use
Denmark: In 1994, the Danish government introduced a charge by weight on paper and plastic bags. In a 2007 study of bag taxes and mandatory fees commissioned by the government of Hong Kong, consulting firm GHK found that the tax did reduce bag use by about 60%, but that usage has increased since. GHK also found that retailers had passed on this charge to consumers “often at a rate in excess of the tax.”118 Taiwan: In 2002, Taiwan’s government introduced a requirement that retailers charge a fee for plastic bags at a rate chosen by the retailer. It also introduced a ban on thin plastic bags. GHK found that the measure resulted in consumers switching from plastic to paper and also to thicker plastic bags. GHK also notes that the ban resulted in “Very significant inspection/enforcement costs” and that the government of Taiwan had “Recently exempted restaurants/take-aways due to compliance problems.”119 Ireland: Also in 2002, Ireland’s government introduced a €0.15 (approx. $0.20) tax on plastic grocery bags. Initially, this resulted in a dramatic (some estimates suggest 94%) reduction in the use of plastic grocery bags.120 But use subsequently rose and by 2007 was about 70% below pre-tax levels. GHK notes that there has been “substantial increase in prepackaging of fresh foods and switching to paper shopping bags [and a] 77% increase in bin liners.” Tesco reported that purchases of HDPE bin liners, i.e., garbage bags, had increased by

How Green Is that Grocery Bag Ban? | 37
80%; meanwhile SuperQuinn reported that purchases of diaper sacks had risen by 84%. These changes reflect the fact that previously consumers were reusing HDPE bags for trash. Meanwhile, an analysis of imports into Ireland of “sacks and bags of polymer ethylene” shows that while the bag tax did result in an initial reduction, by 2007 consumption of polyethylene bags was higher than before the tax.121 Prior to the tax, 79% of HDPE bags were imported into Ireland. Although one of the domestic producers went out of business following the introduction of the tax, it seems plausible that the net consumption of polyethylene bags five years after the bag tax was similar to pre-tax levels. In response to the rebound in use of plastic bags, the Irish government increased the tax to €0.22 in 2007.122 Washington, DC: Under the auspices of the Anacostia River Clean-Up and Protection Act of 2009, Washington, D.C.’s Council introduced a five-cent tax on paper and plastic grocery bags, four cents of which was dedicated to a fund to clean up the Anacostia River; the other cent would be kept by retailers. The tax took effect on January 1, 2010. On the basis of tax receipts, the D.C. Office of Chief Financial Officer estimated that the tax reduced grocery bag consumption by 80% between 2009 and 2010.123 A study by the Beacon Hill Institute concluded that this estimate was too high because it failed to account for non-compliance by retailers, suggesting that a more realistic estimate would be 67%.124 In an analysis for the National Center for Policy Analysis, Sterling Burnett argues that even this figure is too high, noting that during the first two years of operation of the tax, more than half of retail establishments inspected were in violation, i.e., not charging the tax.125 Moreover, the Beacon Hill Institute suggests—on the basis of experience elsewhere—that use of grocery bags is likely to rise by 57% between 2011 and 2016. From this brief survey of the available evidence,126 it is clear that the impact that fees and taxes have on which bags shoppers choose and the quantities in which they use them is contingent on the size of the tax or fee (higher taxes/fees have a larger impact), the degree of uptake (in locations where more store owners refuse to comply, the impact is reduced), and the differential, if any, between fees on different types of bag (when the fees on paper bags are significantly lower, consumers typically switch to paper).

38 | Reason Foundation
4.2 The Impact of Plastic Bag Bans on Bag Use
San Francisco, California
In 2007, San Francisco City Council banned the distribution of plastic shopping bags by retailers with gross annual sales of $2 million or more and required them to charge $0.10 for each “allowed checkout bag” (i.e., compostable bags, paper bags with a minimum 40% post-consumer recycled content, or bags designed for a minimum of 125 reuses).127 From October 1, 2012, the plastic bag ban and other bag fee applied to all retailers and from October 1, 2013 to all food establishments.128 Prior to the ban, residents of San Francisco were estimated to be using between 180 million129 and 200 million130 plastic bags per year. If the ban is being rigorously enforced, that means the number of such bags (which are, presumably, nearly all HDPE) should have declined by at least 180 million/year. In 2011 (prior to the expansion of the ban and the introduction of the fee), San Francisco’s Office of the Controller estimated the number of paper and compostable bags distributed at 208 million.131 After the introduction of the $0.10 charge, it expected this number to fall to 107 million.132 At the same time, it estimated that the number of reusable bags would rise from near zero to 3.3 million per year. Unfortunately, there are no reliable estimates of the actual rates of use of different types of bag, so we cannot compare these expected effects with outcomes.
San Jose, California
On December 14, 2010, San Jose City Council adopted an ordinance banning the distribution of plastic bags by all retailers except restaurants and nonprofit “reusers” with effect from January 1, 2012. Retailers may distribute paper bags but such bags must contain a minimum of 40% recycled content and they must charge at least $0.10 per bag.133 (San Jose intended to increase the charge to $0.25 in 2014, but the Council amended the ordinance to keep the charge to $0.10 in October 2013.134) An analysis by ICLEI found that the San Jose ordinance, which prior to the ban was consuming 500 million plastic bags, would reduce the amount of waste produced by 1,140 tons.135 However, there do not appear to be any reliable estimates of the actual impact on waste generated.
How Green Is that Grocery Bag Ban? | 39
Los Angeles County, California
In 2010, L.A. County unincorporated passed an ordinance banning the distribution of plastic bags and requiring stores to charge $0.10 for each paper bag; the ordinance applied initially to stores with annual sales of over $2 million, with effect from July 1, 2011, and to smaller stores with effect from July 1, 2012.136 The environmental impact report prepared for L.A. County in relation to the ordinance to ban plastic carryout bags asserts that “According to research conducted by the Los Angeles County Department of Public Works (LACDPW), approximately six billion plastic carryout bags are consumed in the County each year, which is equivalent to approximately 1,600 bags per household per year.”137 In support of this assertion it cites (at footnote 6) “California Integrated Waste Management Board. 12 June 2007. Board Meeting Agenda, Resolution: Agenda Item 14. Sacramento, CA.” However, that Agenda item contains no mention of the number of plastic bags used by L.A. County residents. During an earlier agenda item (#13), Melissa Vargas asserted, “Each year, an estimated 500 billion to one trillion plastic bags are used worldwide … of which billions of bags end up as litter each year causing impact to the marine environment.”138 Ms. Vargas provides no source for her estimates or claims. But if it is true that a trillion bags are used worldwide, then it would be surprising if six billion of those, or more than half of 1% of the total were used in Los Angeles. Likewise, it would be surprising if households in L.A. were indeed using more than 30 plastic bags per week. Not worrying; just surprising: it implies some serious shopping. Suppose that the manufactured number of six billion bags per year were accurate for the whole of L.A. County, with a population in all of its incorporated cities and unincorporated regions of around 10 million.139 Meanwhile, the population of the unincorporated part of Los Angeles County is estimated at about 1.1 million.140 So, assuming bag use is evenly distributed throughout the county, the annual use of bags in unincorporated Los Angeles County would be 550 million. Initially, reported use of paper bags by shoppers in unincorporated Los Angeles County fell from 196,106 in 2009 to an annualized rate of 127,126 in the third quarter of 2012.141 Presumably, this reflects a combination of various factors including sudden sticker shock at having to pay $0.10 for a paper bag that was previously free, an initial resolve by shoppers to use reusable bags, and shoppers switching to shops outside the ban area. However, during the first two quarters of 2013, paper bag use had jumped to an annualized rate of over 170,000.142

40 | Reason Foundation
A survey in 2012 found that sales at retailers in unincorporated Los Angeles County fell by approximately 5.6% following the ban,143 suggesting that many shoppers previously using those retailers were choosing to shop in stores outside the ban area—and presumably would still be using the same number of bags (paper and/or plastic) and driving farther to make their grocery purchases. That would mean about 3.1 million plastic bags still being used annually and the total annualized number of paper bags at the end of 2013 being approximately 180,000. At the same time, consumers would be expected to be purchasing additional trash can liners to replace the plastic shopping bags they were previously using. In each of these Californian cities, prohibitions on the use of plastic bags presumably reduced the use of HDPE plastic shopping bags. However, where bans have not been accompanied by associated restrictions on the use of other types of bag, there has often been a significant substitution effect, with consumers typically switching to paper bags. Where taxes or fees have also been applied to paper and other shopping bags, consumers have typically reduced their use of such bags in favor of bags not subject to the restriction (which typically are heavier duty NWPP or cloth bags), as well as purchasing plastic (LDPE) bin liners.
4.3 Do Plastic Bag Bans, Taxes and Fees Benefit the Environment?
The primary stated objective of the restrictions on plastic bags that have been introduced around the country is to reduce the impact on the environment. As noted in Part 3, few alternative bags actually achieve much in the way of environmental improvements. Only reusable bags are in principle capable of achieving any overall improvements, and then the improvements are very modest and require reuse rates that most people don’t seem to achieve. (Biodegradable bags might achieve very modest improvements on some measures, if the plastic bags they were replacing were only used once then discarded, but would have a retrograde effect in other areas). Moreover, some alternatives, especially paper bags, have significantly greater impacts on the environment in most categories. The following analysis uses the LCAs discussed in Part 3, combined with the surveys of use rates of different types of bags, which are given in table 10, to assess the relative impact of different types of bags.

How Green Is that Grocery Bag Ban? | 41
Table 10: Actual Use Rates of Various Bag Types Bag type Actual use rates HDPE 1.6 LDPE 3.1 NWPP 14.6 Paper 1
Sources: Surveys by Edelman-Berland144 and APCO145
Impact on Consumption of Non-Renewable Resources
Figure 7 shows the relative amounts of non-renewable energy that would be consumed as a result of an average consumer exclusively using each of the bag types (HDPE, LDPE, NWPP and paper). It is clear that using HDPE bags exclusively would result in the consumption of far fewer non-renewable energy resources than if one of the alternative bag types were used. Any policy restricting the use of HDPE plastic bags would thus increase the total amount of non-renewable energy associated with shopping bag use.
Source: authors’ calculations
Impact on Water Consumption
Unfortunately, as noted in Part 3, only two of the full LCAs calculated water consumption and neither included estimates for NWPP bags. Moreover, neither LCA included water consumed during the washing of reusable bags. Fortunately, however, we were able to use other estimates to infer water usage
0
0.5
1
1.5
2
2.5
3
HDPE LDPE NWPP Paper
Figure 7: Consumption of Non-Renewble Energy by Various Bags Relative to HDPE

42 | Reason Foundation
for NWPP bags and to estimate usage for washing of both NWPP and LDPE bags. Specifically, we relied upon an analysis by the Chico Research Foundation to make inferences regarding the water used during the “cradle to gate” stages of NWPP bags, namely that NWPP bags would consume approximately twice the amount of water during these stages as LDPE bags.146 We also used the Chico Research Foundation’s evaluation of the per-wash consumption of water for LDPE bags (0.5 gallons per hand wash) and NWPP bags (2 gallons per machine wash).147 Making the same assumptions as above regarding the number of reuses of each bag type, we calculated the relative amounts of water consumed by each bag type.148 These are given in Figure 8. The conclusion is clear: HDPE bags use far less water than other bag types. Compared with using only HDPE bags, a consumer who used only paper bags would result in the use of at least five times as much water, while using only LDPE bags would require about 10 times as much water, and using only NWPP would require about 40 times as much water. So, any policy restricting the use of HDPE plastic bags would cause a significant increase in the use of water. Moreover, if the policy results in a significant switch to reusable bags, that increase in water use will occur primarily in the vicinity of the ban location.
Source: authors’ calculations
0
5
10
15
20
25
30
35
40
45
HDPE LDPE NWPP Paper
Figure 8: Water Consumption of Various Bags Relative to HDPE

How Green Is that Grocery Bag Ban? | 43
Impact on Greenhouse Gas Emissions
Figure 9 shows the greenhouse gas emissions of the various shopping bags when used at the rates found in the surveys. It is immediately apparent that paper bags are responsible for considerably higher levels of GHG emissions. Meanwhile, the emissions of LDPE and NWPP bags vary considerably depending on the particular LCA chosen. But even the lowest emissions for LDPE and NWPP are slightly higher than the emissions for HDPE. But remember that the LCAs did not take into account washing of the reusable bags. If people use warm water to hand wash their bags, or if they use a washing machine for their NWPP bags, then the GHG emissions would rise significantly.
Source: authors’ calculations
From these assessments, it seems clear that for the main environmental effects of concern—i.e. non-renewable energy consumption, water consumption and greenhouse gas emissions—HDPE plastic bags are superior to the alternative options currently available.
0.00
1.00
2.00
3.00
4.00
5.00
6.00
7.00
8.00
HDPE LDPE NWPP Paper
Figure 9: Greenhouse Gas Emissions of Alternative Shopping Bags Relative to HDPE
Intertek Nolan-ITU 2002 Nolan-ITU 2003 Ecobilan-PWC
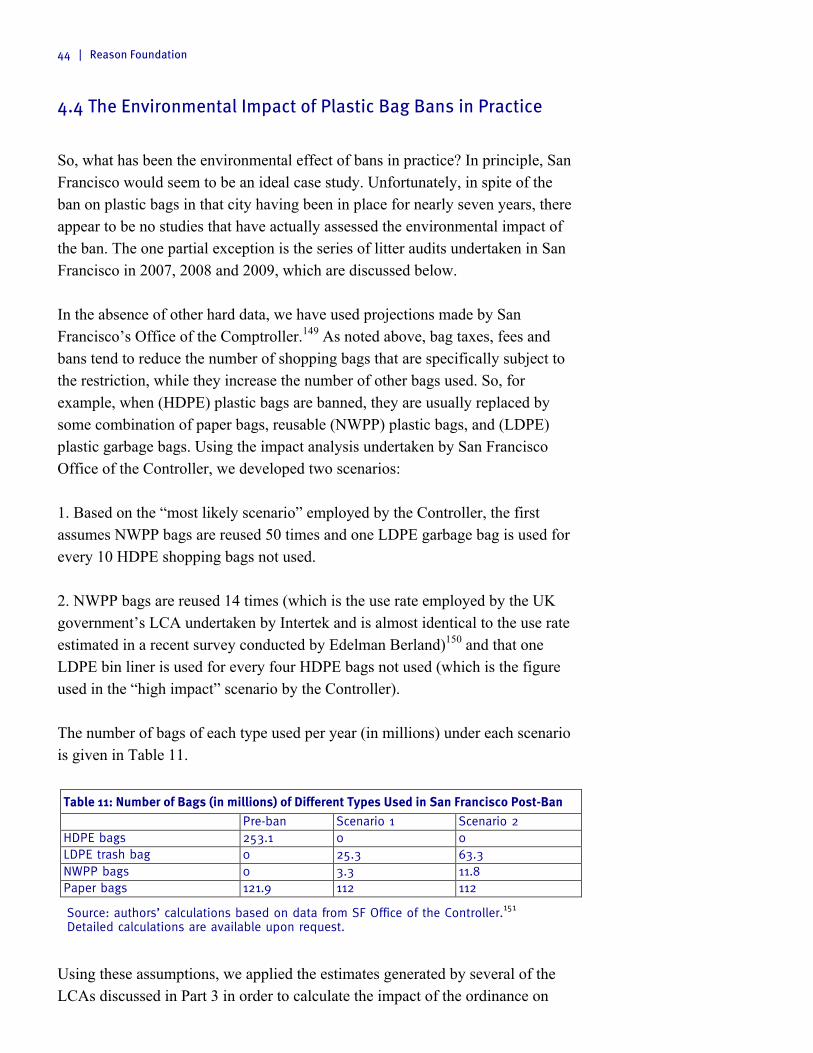
44 | Reason Foundation
4.4 The Environmental Impact of Plastic Bag Bans in Practice
So, what has been the environmental effect of bans in practice? In principle, San Francisco would seem to be an ideal case study. Unfortunately, in spite of the ban on plastic bags in that city having been in place for nearly seven years, there appear to be no studies that have actually assessed the environmental impact of the ban. The one partial exception is the series of litter audits undertaken in San Francisco in 2007, 2008 and 2009, which are discussed below. In the absence of other hard data, we have used projections made by San Francisco’s Office of the Comptroller.149 As noted above, bag taxes, fees and bans tend to reduce the number of shopping bags that are specifically subject to the restriction, while they increase the number of other bags used. So, for example, when (HDPE) plastic bags are banned, they are usually replaced by some combination of paper bags, reusable (NWPP) plastic bags, and (LDPE) plastic garbage bags. Using the impact analysis undertaken by San Francisco Office of the Controller, we developed two scenarios: 1. Based on the “most likely scenario” employed by the Controller, the first assumes NWPP bags are reused 50 times and one LDPE garbage bag is used for every 10 HDPE shopping bags not used. 2. NWPP bags are reused 14 times (which is the use rate employed by the UK government’s LCA undertaken by Intertek and is almost identical to the use rate estimated in a recent survey conducted by Edelman Berland)150 and that one LDPE bin liner is used for every four HDPE bags not used (which is the figure used in the “high impact” scenario by the Controller). The number of bags of each type used per year (in millions) under each scenario is given in Table 11.
Table 11: Number of Bags (in millions) of Different Types Used in San Francisco Post-Ban Pre-ban Scenario 1 Scenario 2 HDPE bags 253.1 0 0 LDPE trash bag 0 25.3 63.3 NWPP bags 0 3.3 11.8 Paper bags 121.9 112 112
Source: authors’ calculations based on data from SF Office of the Controller.151 Detailed calculations are available upon request.
Using these assumptions, we applied the estimates generated by several of the LCAs discussed in Part 3 in order to calculate the impact of the ordinance on
How Green Is that Grocery Bag Ban? | 45
global warming potential, air pollution and water consumption. The results of this analysis are given below.
Global Warming Potential
Under scenario 1, the global warming potential of San Francisco’s shopping bags might have fallen by as much as 28% (based on the Intertek LCA) but it might have risen by about 3% (based on Nolan’s 2002 LCA). Under scenario 2, however, the global warming potential of San Francisco’s bags rose regardless of which LCA was used; at the low end, it rose by 9% (based on the Intertek LCA) and at the high end it more than doubled (rising by 110% based on Nolan’s 2002 LCA).
Air Pollution
The San Francisco ordinance is estimated to result in a change in emissions of smog-inducing chemicals ranging from a reduction of 43% (scenario 1 applying the Intertek LCA) to an increase of 118% or more (scenario 2 applying the Ecobilan-PWC LCA152).
Water Consumption
None of the LCAs estimated water consumption for NWPP. This is problematic because health experts strongly recommend that consumers clean reusable bags between shopping trips in order to avoid contaminating food with harmful bacteria. Since such washing is likely to consume considerable amounts of water, the impact on water consumption of increased NWPP bag use is likely to be significant. (In his assessment of the impact of different bags, engineer Joseph Greene assumes that a consumer who exclusively uses NWPP shopping bags might wash 20% of their bags each week. Using this assumption, Greene then estimates that the water consumption of such bags if reused 52 times over the course of a year would be equivalent to about four times the water consumed by 1,500 HDPE plastic bags.153) However, it is still possible to estimate the maximum reduction in water consumption (since leaving NWPP bags out of the equation entirely inevitably results in lower water consumption post-ban). So, without considering the impact of increased use of NWPP bags, the plastic bag ban results in a reduction in water use of between 50% (Bousted) and 55% (Ecobilan-PWC). If the impact of increased NWPP use were included, the actual

46 | Reason Foundation
reduction is likely to be significantly less—so much so that it is possible overall water use could increase.
Water Pollution
Under all scenarios and all LCAs, the impact of the ban on plastic bags on water pollution is relatively small. Applying the Bousted LCA, it is possible only to evaluate the effect resulting from reduced paper bag use, since Bousted did not assess the impact of LDPE or NWPP bags. But because paper bags have a relatively large biochemical oxygen demand (BOD) in the Bousted LCA, the approximately 10% reduction in paper bag use leads to a similar (10%) reduction in total BOD. The estimates for the impact on eutrophication range from a reduction of 23% (using Nolan’s 2003 LCA) to an increase of about 6.5% (scenario 2 under both the Intertek LCA and the Ecobilan-PWC LCA).
Impact on Litter
While there is very little data on the broad impact of the San Francisco ban, there is some data on the impact on litter. San Francisco City Council commissioned a series of litter “audits” in 2007, 2008 and 2009.154 These audits detail the amount and types of litter at over 100 sites around the city.155 As can be seen in Table 12, the proportion of litter from plastic retail bags appears to have increased after the implementation of the ban on distribution of plastic bags at large retail stores took effect, while the proportion of paper retail bags appears to have remained constant. One possible explanation for this is that the plastic retail bags that were being littered did not come from large retail stores, so when the plastic bag ban came into effect, some consumers switched to making a larger number of small purchases at smaller retailers—and some larger proportion of those bags then entered the litter stream. (Another explanation is that the audits were not well conducted.) Table 12: Litter from Retail Paper and Plastic Bags
Year 2007 2008 2009
Plastic retail bags 0.6% 0.6% 1.5%
Paper retail bags 0.4% 0.4% 0.5%
Source: The City of San Francisco Streets Litter Re-Audit, 2009
Unfortunately, we don’t even have survey data for litter after 2009, so cannot say what happened when the ban was applied to smaller retailers and

How Green Is that Grocery Bag Ban? | 47
restaurants. Presumably, litter from both plastic and paper will have declined in similar proportion to the decline in use of the bags (i.e., plastic bag litter should have fallen almost to zero while paper bag litter might have declined by 8–10%). In other words, the number of large litter items might have fallen by 0.5 to 1.0%.
Impact of an Alternative Policy
Given the strong possibility that the current plastic bag ban in San Francisco has had the opposite effect to that intended—at least with regard to global warming potential, air and water pollution—it is worth considering whether there are alternatives that might be more effective. One such alternative is suggested by the significant role of reducing paper bags in estimates of the environmental effects of the current ban and tax regime, namely: ban paper bags. Using the same framework as above, if the city of San Francisco had banned paper bags instead of plastic bags:156
§ Greenhouse gas emissions from carrier bags would have fallen by between 35 and 56%.
§ Emissions of smog-inducing chemicals would also fall under a paper bag ban, regardless of which LCA were deemed appropriate and would range from an 8% reduction (Ecobilan-PWC) to a 39% reduction (Intertek).
§ Water use would have fallen by between 50% (Ecobilan-PWC) and 96% (Bousted). (The dramatic reduction estimated by Bousted is a consequence of the very large amounts of water presumed to be used in the manufacture of paper bags in that LCA.)
The relative impact of banning plastic and banning paper is summarized in Table 13. Overall, when considering the impact on emissions of greenhouse gases, photochemical smog-inducing emissions and water use, a ban on paper bags seems superior to a ban on plastic bags in San Francisco. Given the scale of these effects, it seems probable that the same would apply in other cities and towns in California and across the U.S. Table 13: Estimated Impact of Bans on Plastic and Paper in San Francisco Ban plastic Ban paper Global warming potential -28% to + 110% -56% to -32% Air pollution (smog) -43% to +118% -39% to -9% Water use -30% to -10%* -49% to -96% Water pollution -23% to +6% -98% to -60%
Source: authors’ calculations (details available on request)
*Note: does not include impact of additional NWPP bags.
48 | Reason Foundation
4.5 Do Plastic Bag Bans, Regulations and Taxes Save Taxpayers Money?
In addition to the intended direct impact on the environment of reducing the use of plastic bags, another touted aim is to reduce expenditures on waste disposal and litter cleanup, thereby saving taxpayers money. In a recent study, Sterling Burnett assessed the budgetary impact of plastic bag bans in three Californian cities.157 The analysis below draws heavily on Burnett’s assessment.
San Francisco
Prior to the 2007 ban, City Supervisor Ross Mirkarimi claimed that disposing of and cleaning up plastic bags cost San Franciscans $8.49 million per year—or approximately 17 cents per bag. Burnett notes that this cost was made up of: (1) recycling contamination costs, of which $494,000 was to pay individuals manually to sort and remove plastic bags; $100,000 was to clear jams caused by bags that were not removed and $100,000 resulting from reduced value of recyclable materials due to contamination; (2) $400,000 associated with contamination of composting; (3) $3.6 million to cover the costs of collecting and disposing of bags in the municipal waste stream (2% of $180 million); (4) $2.6 million to cover the costs of litter collection and transportation (10% of $26 million); (5) $1.2 million to cover the costs of future liabilities associated with the landfilling of waste. However, as Burnett notes, many of these costs are highly suspect; for example, the estimated recycling contamination costs likely overestimate the degree to which plastic bags are the problem. Burnett cites a presentation by the Association of Oregon recyclers which concluded that plastic materials represented only 18% of materials clogging the machinery, of which plastic bags were only a small part. Given the small proportion of the problem caused by plastic bags, it seems unlikely that much savings, if any, could be achieved by banning plastic bags. At the same time, the assumption that removing 2% by weight of the waste produced in San Francisco will reduce the disposal costs by 2% is likely incorrect. As Burnett points out, most of that 2% is due to paper bags—only 0.5% is due to plastic—so unless the plastic bag ban and paper bag fee resulted in a dramatic reduction in paper bag use, it would be inappropriate to include savings from reduced paper bag disposal. Moreover, the fixed costs of collection are unlikely to change, so only the direct costs associated with final disposal
How Green Is that Grocery Bag Ban? | 49
(landfill or incineration charges) will be affected. As noted above, prior to the ban, residents of San Francisco were alleged to be consuming between 180 million and 200 million plastic bags per year. Assuming the higher figure for the sake of argument, it is possible to estimate the saving in disposal costs from removing all those bags from the waste stream as follows:
§ Number of bags = 200 million
§ Weight of each bag in pounds = 12.39/1000 lbs158
§ Cost of landfilling each pound = $147.13/2000159
§ Implying a saving of $182,300 (or $0.001 per bag). The same general observation applies to the cost of collecting litter; given that plastic bags represent a relatively tiny proportion of litter (approximately 0.6%), the cost of litter collection and disposal is unlikely to be materially affected. (The Office of the Controller claims that it will save $600,000 on waste disposal and $100,000 on litter, both of which seem on the high side.160) At the same time, the 2011 analysis by San Francisco City Council’s Office of the Controller found that from July 2012 to July 2014 consumers would suffer a net loss of $10–$12 million as a result of the full implementation of the plastic bag ban and fee, and this assumes that retailers pass on savings from reduced expenditures on bags.161 Burnett points out that in practice, the amount San Franciscans spend on garbage collection and disposal seems to have increased dramatically: the rate charged for collection of a 32 gallon garbage can has risen from $19.08 in 2005 to $34.08 in 2013—an increase of nearly 80%.
San Jose, California
As noted above, the analysis by ICLEI found that the San Jose ordinance, which prior to the ban was consuming 500 million plastic bags, would reduce the amount of waste produced by 1,140 tons.162 Since San Jose pays $180/ton to landfill its waste, that would save the city $205,200, which would represent approximately 0.17% of the city’s budgeted 2013–14 expenditure on garbage and recycling services.163 Unsurprisingly, this hasn’t had much impact on household garbage and recycling charges, which in the three years since the ordinance have been on
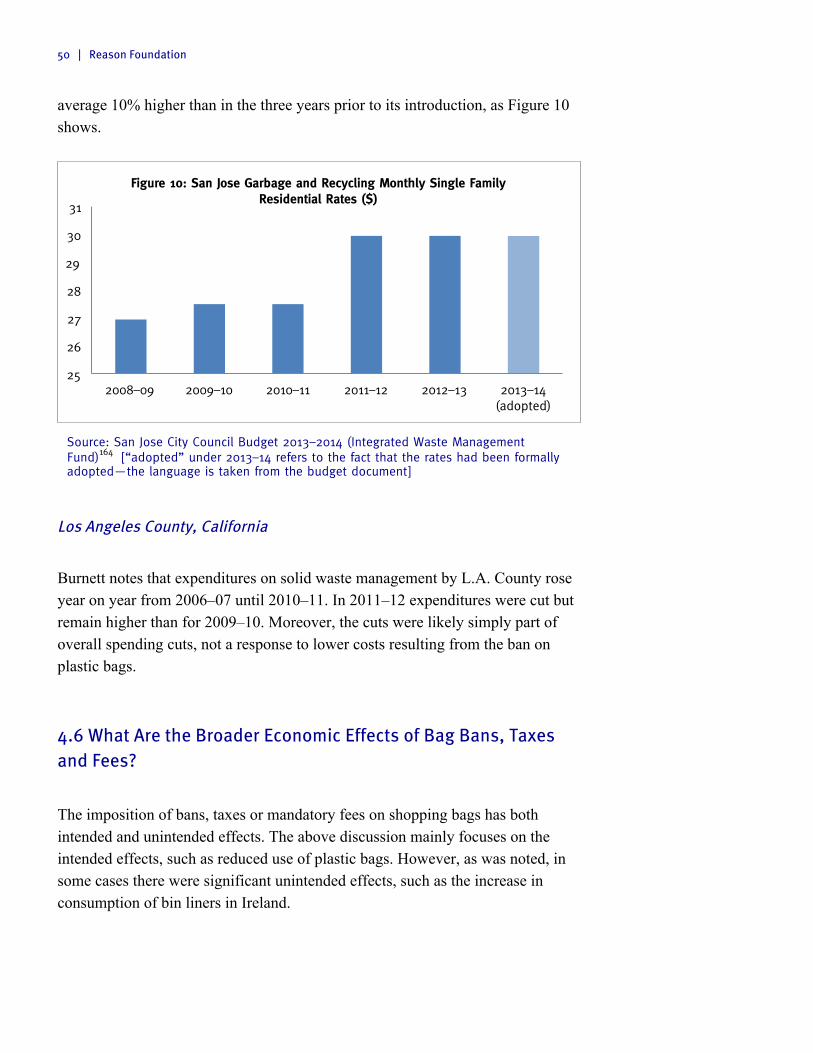
50 | Reason Foundation
average 10% higher than in the three years prior to its introduction, as Figure 10 shows.
Source: San Jose City Council Budget 2013–2014 (Integrated Waste Management Fund)164 [“adopted” under 2013–14 refers to the fact that the rates had been formally adopted—the language is taken from the budget document]
Los Angeles County, California
Burnett notes that expenditures on solid waste management by L.A. County rose year on year from 2006–07 until 2010–11. In 2011–12 expenditures were cut but remain higher than for 2009–10. Moreover, the cuts were likely simply part of overall spending cuts, not a response to lower costs resulting from the ban on plastic bags.
4.6 What Are the Broader Economic Effects of Bag Bans, Taxes and Fees?
The imposition of bans, taxes or mandatory fees on shopping bags has both intended and unintended effects. The above discussion mainly focuses on the intended effects, such as reduced use of plastic bags. However, as was noted, in some cases there were significant unintended effects, such as the increase in consumption of bin liners in Ireland.
25
26
27
28
29
30
31
2008–09 2009–10 2010–11 2011–12 2012–13 2013–14 (adopted)
Figure 10: San Jose Garbage and Recycling Monthly Single Family Residential Rates ($)

How Green Is that Grocery Bag Ban? | 51
Washington, D.C.
Using the State Tax Analysis Modelling Program, the Beacon Hill Institute estimates that by 2016 the D.C. bag tax will have cost D.C. consumers $5.74 million, raised $4.59 million in taxes, caused the loss of 136 jobs, reduced employment income by $13.73 per year, reduced investment by $1.58 million, and reduced real disposable income by $8.08 million.165
Los Angeles County, California
A 2012 study found that 80% of retailers in areas that had implemented the ban experienced a decline in sales averaging 5.7%, whereas 60% of retailers in areas that had not implemented a ban experienced increases in sales averaging 9%.166 In addition, stores inside the ban area reduced their employment by more than 10%, whereas stores outside the ban area increased their employment by 2.4%. It is difficult to escape the conclusion that the ban resulted in mobile shoppers switching from stores inside the ban area to stores outside the ban area. As noted above, during the first two quarters of 2013 paper bag use had jumped to an annualized rate of over 170,000.167 That represents an annual transfer from consumers to retailers in the order of $17,000 at $0.10 per bag. Nonetheless, at present many (perhaps most) retailers are likely net losers as a result of customers switching to stores outside of ban areas. That would change if ban proponents got their way and single use plastic bags were banned throughout the entire L.A. area. Retailers would likely benefit significantly from such a ban, while consumers would lose.
San Francisco, California
In its assessment of the effect of extending the ban on distribution of plastic bags and the charge for “allowable bags,” San Francisco City Council’s Office of the Controller concluded that consumers would suffer a net loss of $10–$12 million. In spite of this, it claimed that the ban and tax will result in a net increase of around 10 private sector jobs per year. But it is difficult to see how a regulation that imposes a net cost on consumers could result in sustainable job creation. In addition to spending additional resources on various types of bags, many consumers will spend additional time washing out reusable bags, which at the margin is likely to reduce the amount of time they spend being productive. As a result, the economy will grow less fast and total employment income will be
52 | Reason Foundation
lower than it otherwise might be. So the dynamic loss in wealth is likely to be considerably larger than $12 million.
Health impact
In addition to the environmental and economic impact of restrictions on the provision of plastic bags, some researchers have raised concerns regarding the potential impact on health. In 2010, nine members of a soccer team in Oregon were infected with norovirus—a severe but usually non-fatal stomach virus—as a result of eating food from a reusable bag that had become contaminated with the virus.168 Numerous other instances of food-borne illnesses have been traced to contaminated bags.169 David Williams and colleagues assessed reusable bags “collected at random from consumers as they entered grocery stores in California and Arizona,” and found that “Large numbers of bacteria were found in almost all bags and coliform bacteria in half.”170 They note that “In interviews, it was found that reusable bags are seldom if ever washed and often used for multiple purposes.” A recent survey by Edelman Berland found that only 16% of shoppers cleaned their reusable NWPP bags “once a week or more.” To address these risks, there is clearly a great need for public education on the importance of washing reusable bags before using them to carry food. Such public education clearly has a cost and would need to be factored in to the evaluation of the economic costs and benefits of imposing restrictions on the use of other types of shopping bags. An illustration of what consumers ought probably to be doing if they reuse shopping bags (and what departments of public health ought to be doing in terms of public education), has been offered by the California Department of Public Health, which recently issued the following advice concerning the use of reusable shopping bags: At home:
§ Reusable grocery bags should be machine or hand-washed frequently! Dry the bags in a clothes dryer or allow them to air dry.
§ After putting groceries away, clean the areas where the bags were placed while un-bagging your groceries, especially the kitchen counter and the kitchen table where food items may later be prepared or served.
§ If food residues from any food products have leaked into the bag, make sure to wash and dry the bag thoroughly before reuse.

How Green Is that Grocery Bag Ban? | 53
§ If reusable grocery bags have been used to transport non-food items, such as detergents, household cleaners, and other chemicals, wash and dry the bags before using them to transport food items. Alternatively, you may wish to use bags of one color for food items and bags of a different color for non-food items.
§ Store grocery bags away from sources of contamination, such as pets, children, and chemicals. Storing reusable grocery bags in the trunk of cars is not recommended. During the warmer months, the increased temperatures can promote the growth of bacteria that may be present on the bags.
At the store:
§ Place reusable bags on the bottom shelf of the grocery cart (below the cart basket where food products are placed).
§ When selecting packages of meat, poultry, or fish, consider putting the packages in clear plastic bags (often available in the meat and produce sections) to prevent leaking juices from contaminating other food items and the reusable grocery bags.171
If every user of reusable bags followed these instructions, the risk of food-borne disease being transmitted by such bags would likely be eliminated, or at least drastically reduced. However, if even a small proportion of users fail to undertake such measures, bacteria can be spread from dirty bags to clean bags as well as directly onto food via shopping carts and checkout counters.
Cost to Consumers
The above list of actions necessary to reduce the risk of food-borne diseases from reusable bags more or less speaks for itself but, in case it is not obvious, relying on reusable plastic bags involves: time and resources, which must be devoted to cleaning; additional space at home, which must be devoted specifically to storing the bags; and the use of additional lighter weight (LDPE) plastic bags for meat and produce. It also means consumers will have to buy large numbers of reusable bags, especially if the bags are washed and dried by machine. By making a few reasonable assumptions, these costs can be quantified. In California, in 2012, there were 12.4 million households, with a median household income of approximately $61,400. If each household spends an
54 | Reason Foundation
additional five minutes per week managing its shopping due to the need to wash, dry and organize its reusable bags, the average “opportunity cost” (i.e., the value of time spent undertaking these activities) is approximately $2.56 per week per household.172If the entire state were to switch to reusable bags only, the opportunity cost would be approximately $1.66 billion per year. Shoppers in the U.S. on average make around two visits to a grocery store each week. A recent survey by Edelman Berland suggests that each household typically reuses each bag 14.6 times.173 Assuming shoppers use six NWPP per grocery store visit, that would mean each household will on average use about 43 bags per year.174 If a NWPP bag costs $1.15 (the number used by the San Francisco controller), the cost per household will be $49 per year. That adds approximately $613 million per year. In addition, the main purpose for which households currently reuse HDPE bags is as garbage bin liners and for the disposal of animal litter and waste. Survey data suggest that about half of all NWPP bags are used for those purposes. Where plastic bags have been banned, consumers have instead bought alternative plastic bags (typically, small LDPE bags) for those purposes. It seems reasonable to assume that households would on average use about 5 such bags per week (i.e., about one third the number of HDPE bags consumed by an average household) at a cost of about $12 per household per year. That would add approximately $78 million statewide. So, counting only the direct cost of shopping bags and the opportunity cost of consumers’ time (not including the cost of water, electricity and detergent used in cleaning the bags), the cost to California’s consumers of switching to reusable bags would be approximately $2.35 billion. In practice, the experience of San Francisco suggests that many (perhaps most) consumers are unlikely to switch to reusable bags. One explanation for this is that a significant proportion of shoppers realize the likely cost—especially including the opportunity cost necessary to avoid contamination—associated with reusable bags. At 10 cents per paper bag, an average week’s shop might cost $1.50 in bags for a typical household.175 That’s a saving of about $2 per week for the median household compared to the total cost of reusable bags. Even shoppers who intend to use reusable bags are likely often to end up using other types of bags: In a recent survey by Edelman Berland, 40% of shoppers forgot their reusable bags,176 though this rate would be expected to be smaller in places where consumers are charged for every plastic or paper bag they use.
How Green Is that Grocery Bag Ban? | 55
But averages often hide important details. Plastic bag bans are likely to have a disproportionate impact on lower income households. For such households, the cost of paper bags would represent a relatively larger proportion of income. At the same time, the opportunity cost of cleaning bags would be lower for such households and the cost of forgetting reusable bags higher, so they might be more likely to reuse such bags. By contrast, middle- and high-income households would be less likely to use reusable bags, especially once they realize the measures necessary to prevent contamination. However, some higher-income households may seek to use reusable bags in order to signal their environmental credentials. Given the high opportunity costs of manually washing and drying bags, such households are likely to use cloth bags that can be machine washed. That would, ironically, be among the worst environmental outcomes, especially in California, due to the relatively large amounts of water used during washing. Of course, it is possible that consumers in general, and lower-income consumers in particular, might increase their use of reusable bags in response to plastic bag bans without increasing the frequency with which they wash the bags. That would then likely result in a significant increase in food-borne diseases. If that were to happen, bag bans could be considered highly regressive.
Cost to Retailers
In principle, retailers might experience lower costs as a result of consumers switching to reusable bags, since their expenditures on other shopping bags would be reduced. In addition, where mandatory fees on paper bags are introduced, retailers’ revenue is likely to increase, both through sales of paper bags and through increased sales of garbage can liners. However, this would likely be offset in part by the need to change bagging systems and also likely increases in the amount of time taken to bag items. Moreover, for many retailers reusable bags represent a security risk, a theft risk and a liability risk. The security risk arises from the potential for reusable bags to be used to hide weapons. The theft risk arises from the potential to use such bags to hide stolen goods. These risks mean stores will likely have to increase expenditures on security and theft prevention.177 The liability risk arises from the possibility that inadequately washed bags will contaminate food purchased by other customers, who then sue the store. (Another potential liability issue

56 | Reason Foundation
pertains to the risk of injury to customers and store workers from lifting heavy, fully laden reusable bags.178)
4.7 Conclusions
Bans, charges and taxes on HDPE plastic shopping bags have in all the cases studied herein resulted in a reduction in the use of HDPE plastic shopping bags. However, in most cases, such restrictions have been met with off-setting behavior, ranging from an increase in the use of paper bags to an increase in the purchase of plastic garbage bags. In a detailed case study of San Francisco’s plastic bag ban and paper bag tax, we found that the impact on the environment was not necessarily unambiguously positive; there seem to be numerous environmental trade-offs, with benefits in one area being off-set by costs in others. Moreover, there is considerable uncertainty regarding the impact for several of the effects under investigation, including global warming potential. Given that a significant impetus for the ban was the claim that it would reduce emissions of greenhouse gases, it is surely worrying that the ban may in fact have resulted in an increase in emissions of such gases. The finding that a ban on paper bags would have done far more to reduce the majority of significant environmental effects suggests that plastic bag bans, with or without associated fees and taxes on paper bags, are an irrational policy. Advocates of restrictions on plastic bags frequently assert that their preferred option is for people to use reusable bags. When the impact of washing such bags is taken into account, the environmental effect of such bags is likely worse than HDPE plastic bags—especially in places such as California where fresh water is relatively scarce. Widespread use of such bags would be expensive for consumers and might also result in an increase in foodborne diseases.

How Green Is that Grocery Bag Ban? | 57
P a r t 5
Conclusions
Proponents claim that banning plastic shopping bags will benefit the environment. Yet, as this study has shown, there is very little empirical support for such claims. Indeed, the evidence seems to point in the other direction for most environmental effects. Some of the alleged benefits are simply false, such as the claim that eliminating plastic bags will reduce oil consumption. An assessment of the San Francisco ban on plastic bags suggests that while there may have been a very small reduction in the amount of litter generated, some emissions—such those of greenhouse gases—may well have increased as a result of the ban. At the same time, concern about the environment is only one of many issues affecting consumption choices. When it comes to shopping bags, the look, feel, and—likely most important for the majority of consumers—function are very important. HDPE plastic bags are strong, light and highly convenient (there is no need to remember to take them along when shopping, since they are supplied by the store). Also, they are typically reused for various purposes.179 These features have made them very attractive to consumers. By contrast, reusable NWPP bags are bulky (causing inconvenience when shopping), must be washed between shops if they may have come into contact with harmful bacteria, and must be remembered prior to going shopping (making them far less convenient); moreover, households using NWPP bags will typically purchase more garbage bin liners. In spite of widespread media attention to the largely false claim that plastic bags are environmentally harmful, bans on the use of plastic bags are not popular: A recent Reason-Rupe poll showed that 60% of Americans oppose plastic bag bans, while only 37% are in favor.180 Opposition is non-partisan, though it is stronger among independents (64%) and Republicans (71%) than Democrats (52%). Environmental groups that really care about the problem of litter, such as Keep America Beautiful, have generally promoted solutions that substantially reduce the amount of litter generated, such as public information campaigns focused on
58 | Reason Foundation
litter reduction, and facilitating clean-up operations. In other words, they target littering behavior, which is the actual cause of litter, rather than opposing the existence of certain types of product that might become litter. Meanwhile, environmental groups that really care about the protection of marine animals know that litter is not the prime culprit of diminished marine life and generally focus on other issues, such as policies that promote overfishing. Unfortunately, policymakers have been cajoled into passing ordinances that ban plastic bags. That is bad news for consumers. It is also bad news for the environment, since the public has been misled into believing that by restricting the use of plastic bags, the problems for which those bags are allegedly responsible will be dramatically reduced. As a result, they are less likely to undertake activities—such as reducing littering and supporting policies that would lead to better protection for marine animals—that would actually benefit the environment.
How Green Is that Grocery Bag Ban? | 59
About the Authors
Julian Morris is vice president of research at Reason Foundation, a nonprofit think tank advancing free minds and free markets. Julian graduated from the University of Edinburgh with a master’s degree in economics. Graduate studies at University College London, Cambridge University and the University of Westminster resulted in two further master’s degrees and a Graduate Diploma in Law (equivalent to the academic component of a JD). Morris is the author of dozens of scholarly articles on issues ranging from the morality of free trade to the regulation of the Internet, although his academic research has focused primarily on the relationship between institutions, economic development and environmental protection. He has also edited several books and co-edited, with Indur Goklany, the Electronic Journal of Sustainable Development. Morris is also a visiting professor in the Department of International Studies at the University of Buckingham (UK). Before joining Reason, he was executive director of International Policy Network (www.policynetwork.net), a London-based think tank that he co-founded. Before that, he ran the environment and technology program at the Institute of Economic Affairs, also in London. Brian Seasholes is director of the endangered species project at Reason Foundation. His work deals with wildlife and land-use issues, especially the Endangered Species Act, property rights, wildlife conservation, the effects of wind energy on wildlife, and oil sands. Mr. Seasholes received his bachelor’s degree, with honors, from Wesleyan University, and his master’s degree in Geography from the University of Wisconsin Madison, where his research focused on the institutional aspects of wildlife conservation, and his thesis was on the Bubiana Conservancy in Zimbabwe. His writings have appeared in the Forbes, National Review Online, Christian Science Monitor, Houston Chronicle, Orange County Register, The Washington Times, and the Endangered Species Update.
60 | Reason Foundation
Endnotes
1 Primary sources were: “Californians Against Waste,” http://www.cawrecycles.org/issues/plastic_campaign/plastic_bags/national; “Plastic Bans and Fees” Surfrider Foundation, http://www.surfrider.org/pages/plastic-bag-bans-fees; “Plastic Bag Ban Report,” http://plasticbagbanreport.com/; “Phase-Out of Lightweight Plastic Bags,” Wikipedia, http://en.wikipedia.org/wiki/Phase-out_of_lightweight_plastic_bags; “Plastic Bag Laws: State and Local Laws,” http://plasticbaglaws.org/legislation/state-laws/; “Retail Bag Report,” Florida Department of Environmental Protection, http://www.dep.state.fl.us/waste/retailbags/pages/list_USA.htm, Accessed 5/2/2014.
2 Primary sources were: “Plastic Bag Bans” Factory Direct Promos, http://www.factorydirectpromos.com/plastic-bag-bans; “Phase-Out of Lightweight Plastic Bags,” Wikipedia, http://en.wikipedia.org/wiki/Phase-out_of_lightweight_plastic_bags; “Track the Movement,” ChicoBag, http://www.chicobag.com/track-movement; “Retail Bag Report: Maps and Lists,” Florida Department of Environmental Protection, http://www.dep.state.fl.us/waste/retailbags/pages/mapsandlists.htm; “Plastic Bag Ban Report: Map of the Philippines,” http://plasticbagbanreport.com/plastic-bag-ban-map-of-philippines/, accessed 5/2/2104.
3 Polyethylene. Wikipedia <http://en.wikipedia.org/wiki/Polyethylene#History>, accessed September 10, 2013.
4 Karl Ziegler was awarded the 1963 Nobel Prize for Chemistry for his invention. See: Lester H. Gabriel, History and Physical Chemistry of HDPE. Chapter 1 in Corrugated Polyethylene Pipe Design Manual & Installation Guide, Plastics Pipe Institute, not dated. Available at http://plasticpipe.org/pdf/chapter-1_history_physical_chemistry_hdpe.pdf, accessed September 10, 2013.
5 History of the Plastic Bag, not dated, SPI (the plastics industry trade association). Available at http://www.plasticsindustry.org/IndustryGroups/content.cfm?ItemNumber=521, accessed September 9, 2013.
6 For example, Wendel Withrow, chair of the Sierra Club Dallas is reported to have stated: “We have become a throwaway society and a part of that throwaway society is the use of plastic bags for everything,” Andrew Tanielian, “Plastic Bags Could Get Boot from Big D,” NBC News, Dallas-Fort Worth, August 13, 2012, available at http://www.nbcdfw.com/news/green/Plastic-Bags-Could-Get-Boot-From-Big-D-166043556.html, accessed October 7, 2013. Meanwhile, the United States Environmental Protection Agency published a report in 1994 entitled Germany, Garbage, and the Green Dot: Challenging the Throwaway Society (Washington, DC: U.S. EPA/600/R-94/179, 1994).
7 Or perhaps it would be more accurate to call the restrictions on plastic bags a crucial second step. Prior to their ban, there were widespread restrictions on the use of polystyrene containers—especially the clamshells used by fast food chains. That campaign, led by the Environmental Defense Fund during the 1980s, resulted in a decision by McDonald’s in 1989, and subsequently many other fast food restaurants, to abandon the polystyrene clamshell. Connie Koenen, “Chalk One Up to Impulse: Environment: Normally, Fred Krupp would have sued McDonald’s to get the company to quit using its foam packaging. This time he simply said, ‘Let’s talk.’ It worked,” Los Angeles Times, November 12, 1990.
8 Joel Gray, “Town Bag Paper or Plastic Query,” Anchorage Daily News, May 2, 2003

How Green Is that Grocery Bag Ban? | 61
9 Charlie Goodyear, “S.F. First City to Ban Plastic Shopping Bags,” San Francisco Chronicle, March 28, 2007. Available at http://www.sfgate.com/green/article/S-F-FIRST-CITY-TO-BAN-PLASTIC-SHOPPING-BAGS-2606833.php, accessed May 7, 2014.
10 For examples of these points see: Sierra Club Florida. The Problem With Plastic Bags, available at florida.sierraclub.org/suncoast/documents/TheProblemwithPlasticBags.pdf , accessed May 7, 2014; Sheryl Eisenberg, “Plastic Bags Lose Their Luster,” This Green Life (an e-journal by Sheryl Eisenberg), November 2008, available at http://www.nrdc.org/thisgreenlife/0811.asp, September 14, 2013.
11 Ned Potter, “Saving the World, One Plastic Bag at a Time,” ABC News, March 8, 2007. Available at http://abcnews.go.com/Technology/story?id=2935417, accessed May 7, 2014.
12 Jesse McKinley, “San Francisco Board Votes to Ban Some Plastic Bags,” The New York Times, March 28, 2007. Available at: http://www.sfgate.com/green/article/S-F-FIRST-CITY-TO-BAN-PLASTIC-SHOPPING-BAGS-2606833.php, accessed May 7, 2014.
13 U.S. Energy Information Administration, 2012, U.S. Gas Plant Production of Ethane-Ethylene. Available at http://www.eia.gov/dnav/pet/hist_xls/METFPUS1a.xls, accessed October 29, 2013.
14 Jared Spaniol, Jack Rulander and Mike Leo, “Polypropylene,” February 2007. Available at: http://www.personal.psu.edu/users/j/m/jms5157/Polypropylene%20Paper%20Part%20I.pdf, accessed May 7, 2014.
15 California Coastal Commission, Eliminating Land-based Discharges of Marine Debris in California, A Plan of Action from The Plastic Debris Project, California Water Boards, 2006. Available at http://www.plasticdebris.org/CA_Action_Plan_2006.pdf, accessed 4/26/2014
16 “Memorandum to: The Honorable Mayor and Members of the City Council, Subject: Update on Dealing with Carryout Bags,” City of Dallas, August 16,2013, Available at: http://www.dallascityhall.com/council_briefings/briefings0813/Update-DealingwithCarryoutBags_082113.pdf, accessed 4/26/2014
17 California Ocean Protection Council in consultation with California Marine Debris Steering Committee and Gordon Environmental Consulting, “An Implementation Strategy for the California Ocean Protection Council Resolution to Reduce and Prevent Ocean Litter,” November 20, 2008, http://www.opc.ca.gov/webmaster/ftp/pdf/opc_ocean_litter_final_strategy.pdf, accessed 4/26/2014
18 He has been mentioned or appeared in that capacity by The New York Times, National Geographic, Time magazine, Good Morning America, and on NPR.
19 Steven R. Stein, City of Dallas Memo, September 6, 2013, Environmental Resources Planning, LLC.
20 California Coastal Commission, Eliminating Land-based Discharges of Marine Debris in California, A Plan of Action from The Plastic Debris Project, page 16.
21 Steven R. Stein, “ER Planning Report Brief: Plastic Retail Bags in Litter,” Environmental Resources Planning, LLC., 2013. Available at: http://www.erplanning.com/uploads/Plastic_Retail_Bags_in_Litter.pdf, accessed May 7, 2014.

62 | Reason Foundation
22 “2009 National Visible Litter Survey And Litter Cost Study, Final Report,” September 2009, Midatlantic Solid Waste Consultants for Keep America Beautiful, Inc. Stamford, Connecticut. Available at http://www.kab.org/site/DocServer/Final_KAB_Report_9-18-09.pdf?docID=4561, accessed May 7, 2014.
23 The KAB study also notes that while metal, glass, paper and beverage carton litter decreased significantly, litter from plastic increased. This likely reflects a shift to the use of plastic in everyday products in place of glass, metal and paper. Since neither glass nor metal is readily biodegradable and they can also cause problems when lodged in storm drains, it is not clear that there is any reason to be specifically concerned about the increase in plastic litter relative to those items. (One caveat: plastic tends to be lighter than the metal and glass materials it replaces, which has obvious merits in terms of reducing transportation costs, but may also increase the likelihood of it being transported into storm drains and generally away from highways.) Meanwhile, to the extent that plastic has replaced paper for certain uses (such as grocery bags), there would seem to be an obvious trade-off, since, as noted, HDPE bags are particularly useful as repositories for litter, in a way that paper bags are not (since paper bags are ill-suited to contain items that are damp or may leak, such as half-eaten cartons of yogurt and unfinished drink cans).
24 Michelle Allsopp, Adam Walters, David Santillo and Paul Johnson, “Plastic Debris in the World’s Oceans,” Greenpeace International, 2006, p.6. Available at http://www.unep.org/regionalseas/marinelitter/publications/docs/plastic_ocean_report.pdf, accessed May 7, 2014.
25 U.S. Environmental Protection Agency, “More Information on Marine Debris: Sources of Marine Debris,” not dated. Available at http://water.epa.gov/type/oceb/marinedebris/moreinfo.cfm, accessed September 23, 2013.
26 World Wildlife Fund, “Marine problems: Pollution.” Available at http://wwf.panda.org/about_our_earth/blue_planet/problems/pollution/, accessed September 23, 2013.
27 National Oceanic and Atmospheric Administration, “Frequently Asked Questions: All about Marine Debris,” October 2009, p.2.
28 World Wildlife Fund, “Marine problems.” 29 http://www.mbari.org/news/news_releases/2011/containers/containers-release.html,
accessed 6/6/2014 30 http://www.worldshipping.org/industry-issues/safety/Containers_Overboard__Final.pdf,
accessed 6/6/2014 31 Dani Tinker, “Declare Your Independence From Plastic,” Wildlife Promise Blog, National
Wildlife Federation, July 3 2013. Available at http://blog.nwf.org/2013/07/declare-your-independence-from-plastic/, accessed September 12, 2013.
32 Greenpeace International, “The Trash Vortex.” Available at http://www.greenpeace.org/international/en/campaigns/oceans/fit-for-the-future/pollution/trash-vortex/, accessed on May 7, 2014.
33 Caitlin Leutwiler, “We Can’t Make This Stuff Up,” September 5, 2011, Defenders of Wildlife, Washington, D.C. Available at http://www.defendersblog.org/2011/09/we-cant-make-this-stuff-up-6, accessed September 21, 2013.
34 National Audubon Society, “Billions of Birds Wing Their Way North: Audubon Tips on How To Help Migrating Birds,” press release, May 2, 2013. Available at:

How Green Is that Grocery Bag Ban? | 63
http://www.audubon.org/newsroom/press-releases/2013/billions-birds-wing-their-way-north, accessed on May 7, 2014.
35 Editorial, “Banning plastic grocery bags,” Los Angeles Times, June 24, 2000. 36 Kenneth R. Weiss, “Plague of Plastic Chokes the Seas,” Los Angeles Times, August 2, 2006,
http://www.latimes.com/news/la-me-ocean2aug02-story.html#page=1, Accessed 5/21/2014 37 Oprah Winfrey, Oprah Winfrey Show, April 22, 2009. 38 Katherine Cooney, “The Great Pacific Garbage Patch Poses New Threat to Marine Life,”
Time, May 11, 2012. Available at http://newsfeed.time.com/2012/05/11/the-great-pacific-garbage-patch-poses-new-threat-to-marine-life/, accessed September 18, 2013.
39 National Oceanic and Atmospheric Administration, “What We Know About the ‘Garbage Patches’,” July 2011. Available at http://marinedebris.noaa.gov/sites/default/files/gpposter.pdf, accessed May 7, 2014.
40 National Oceanic and Atmospheric Administration, “How Big is the ‘Great Pacific Garbage Patch’?” Sciences vs. Myth, February 7, 2013. Available at http://response.restoration.noaa.gov/about/media/how-big-great-pacific-garbage-patch-science-vs-myth.html, accessed September 14, 2014.
41 Miriam Goldstein, “ ‘Recycled Island’ not a cure for plastic trash in ocean,” Deep Seas News, August 9, 2010. Available at http://deepseanews.com/2010/08/recycled-island-not-cure-for-plastic-in-ocean/, accessed September 18, 2013.
42 “Oceanic ‘garbage patch’ not nearly as big as portrayed in media,” Oregon State University News & Research Communications, January 4, 2011. Available at http://oregonstate.edu/ua/ncs/archives/2011/jan/oceanic-%E2%80%9Cgarbage-patch%E2%80%9D-not-nearly-big-portrayed-media, accessed September 23, 2013.
43 Ibid. 44 Brennon Novak, “A Convenient Misconception: Industry Tactics for Misinformation,” 5
Gyres Institute, January 3 2012. Available at http://5gyres.org/posts/2012/01/03/a_convenient_misconception_industry_tactics_for_misinformation/, accessed September 18, 2013.
45 Carl Bialik, “How Big is that Widening Gyre of Floating Plastic?” The Wall Street Journal, March 25, 2009. Available at http://online.wsj.com/news/articles/SB123793936249132307, accessed May 7, 2014.
46 Algalita Marine Research Institute, “Biography of Captain Charles Moore,” not dated. Available at http://www.algalita.org/about-us/bios/charles.html, accessed September 18, 2013.
47 Charles Moore, “Trashed: Across the Pacific Ocean, Plastics, Plastic, Everywhere,” Natural History 112(9):46-51, 2003. Available at http://www.naturalhistorymag.com/htmlsite/master.html?http://www.naturalhistorymag.com/htmlsite/1103/1103_feature.html, accessed May 7, 2014.
48 Ibid. 49 C.J. Moore et al, “A Comparison of Plastic and Plankton in the North Pacific Central
Gyre,” Marine Pollution Bulletin 42(12):1297-1300, 2001. Available at http://5gyres.org/media/Moore_2001_plastic_in_North_Pacific_Gyre.pdf, accessed May 7, 2014.

64 | Reason Foundation
50 “Oceanic ’garbage patch’ not nearly as big as portrayed in media,” Oregon State University News & Research Communications.
51 Miriam Goldstein, “Does the ‘Great Pacific Garbage Patch’ exist?” January 10, 2011, available at http://seaplexscience.com/2011/01/10/does-the-great-pacific-garbage-patch-exist/, accessed September 20, 2013.
52 H.S. Carson et al., “The plastic-associated microorganisms of the North Pacific Gyre,” Marine Pollution, Bulletin 2013, http://dx.doi.org/10.1016/j.marpolbul.2013.07.054
53 Ibid. 54 Miriam C. Goldstein, Marci Rosenberg and Lanna Cheng, “Increased oceanic microplastic
debris enhances oviposition in an endemic pelagic insect,” Biological Letters, 2012, available at http://rsbl.royalsocietypublishing.org/content/early/2012/04/26/rsbl.2012.0298, accessed 5/21/2014.
55 Monterey Bay Aquarium, Laysan Albatross & Plastics: Trash Travels, Available at: http://www.montereybayaquarium.org/conservation/research/laysan-albatross-and-plastics#trash-travels accessed May 7, 2014.
56 The 100,000 figure is parroted by Emily Utter, advocacy and community partnerships director for Chico Bags, a manufacturer of reusable bags and a very active advocate of efforts to ban plastic bags, who asserts, “As we’ve heard, plastic bags pose a huge environmental threat to our marine environment, 100,000 marine deaths per year due to plastic bags.” (Emily Utter. Comments at the Meeting of the Los Angeles County Board of Supervisors, January 22, 2008, p.43.) And again by the Sierra Club of Massachusetts: “Hundreds of thousands of birds and marine animals are killed each year by plastic bags and other plastic debris floating in the world’s oceans due to ingestion and entanglement.” (Sierra Club of Massachusetts, Plastic Bags: which do you choose, paper or plastic? Available at http://www.sierraclubmass.org/issues/conservation/plasticbags/plasticbags.html, accessed September 16, 2013.) Meanwhile, the National Audubon Society claims, “Every year the floating ‘bladders’ of these bags kill hundreds of thousands of seabirds—along with sea turtles and marine mammals—which mistake them for jellyfish and squid, and then starve to death after filling their guts with plastic,” National Audubon Society, “Billions of Birds Wing Their Way North: Audubon Tips on How To Help Migrating Birds.” Available at http://www.audubon.org/newsroom/press-releases/2013/billions-birds-wing-their-way-north, accessed May 7, 2014.
57 Nolan-ITU, “Plastic Shopping Bags—Analysis of Levies and Environmental Impacts,” Final Report, Department of the Environment and Heritage, Government of Australia, 2004, at p. 30. The original study can be found on this archived version: http://web.archive.org/web/20041111133541/http://www.deh.gov.au/industry/waste/plastic-bags/pubs/analysis-final.pdf, accessed May 7, 2014. A corrected version of that Australian report uploaded to the Web in 2006 states: “A figure of 100,000 marine animals killed annually has been widely quoted by environmental groups; this figure was from a study in Newfoundland which estimated the number of animals entrapped by plastic debris in that area from a four-year period from 1981–84” (emphasis added).
58 The reference (footnote 12 in the Nolan-ITU study) is: “Environment Canada, www.ec.gc.ca/marine/debris/ENG/facts.htm”
59 Environment Canada, “Marine Debris in Canada: Facts and Figures,” December 2002. Available at http://web.archive.org/web/20021218022816/ http://www.ec.gc.ca/marine/debris/ENG/Facts.htm, accessed September 16, 2013.

How Green Is that Grocery Bag Ban? | 65
60 John F. Piatt and David N. Nettleship, “Incidental catch of Marine Birds and Mammals in Fishing Nets off Newfoundland, Canada” in Marine Pollution Bulletin, Volume 18 no.6B 344–349, 1989, at p. 348.
61 Alexi Mostrous, Series of Blunders Turned the Plastic Bag into a Global Villain, The Times, March 8, 2008. Available at: http://www.thetimes.co.uk/tto/environment/article2143689.ece, accessed May 7, 2014.
62 Ibid. 63 Ibid. 64 Steven R. Stein, City of Dallas Memo, September 6, 2013, Environmental Resources
Planning, LLC. 65 “Don't Mess wth Texas: About the Campaign,” Texas Department of Transportation.
Available at http://www.dontmesswithtexas.org/about/the-campaign.php accessed January 31, 2014
66 Tim McClure and Roy Spence, “Don't Mess with Texas: The Story Behind the Legend,” Idea City Press, 2006, p. 15.
67 Pierre Desrochers, “Freedom versus Coercion in Industrial Ecology: A Reply to Boons,” EconJournalWatch Vol. 9(2), 2012, pp. 78–99, available at: http://econjwatch.org/articles/freedom-versus-coercion-in-industrial-ecology-a-reply-to-boons, accessed March 11, 2014.
68 Ibid. and Pierre Desrochers, “Does It Pay to Be Green? Some Historical Perspectives,” in Julian Morris (ed.) Sustainable Development: Promoting Progress or Perpetuating Poverty? (London: Profile Books, 2002).
69 Robert C. Allen, “Economic structure and agricultural productivity in Europe, 1300–1800,” European Review of Economic History, Vol. 3, 2000, pp. 1–25.
70 For a detailed account of peasant life in medieval England, see e.g. Barbara A, Hanawalt, The Ties that Bound: Peasant Families in Medieval England, (Oxford: Oxford University Press, 1988).
71 See e.g. Maryanne Kowleski, Local Markets and Regional Trade in Medieval Exeter, (Cambridge: Cambridge University Press, 2003).
72 Wim Blockmans and Peter Hoppenbrouwers, Introduction to Medieval Europe 300–1500, (London: Routledge, 2014).
73 Edward Wrigley, R. S. Davies, James Oeppen and Roger Schofield, English Population History from Family Reconstitution: 1580–1837, (Cambridge: Cambridge University Press, 1997).
74 National Center for Health Statistics, Health, United States, 2012, (Hyattsville, MD: National Center for Health Statistic, 2013), p. 76 (Table 18). Available at http://www.cdc.gov/nchs/data/hus/hus12.pdf#018, accessed March 11, 2014.
75 A.R Sutin et al. “The effect of birth cohort on well-being: the legacy of economic hard times,” Psychological Science, Vol. 24(3), 2013, pp. 379–85.
76 WorldWatch Institute, “New Bans on Plastic Bags May Help Protect Marine Life.” Available at http://www.worldwatch.org/node/5565, accessed October 7, 2013.

66 | Reason Foundation
77 EPA, Municipal Solid Waste Generation, Recycling, and Disposal in the United States Tables and Figures for 2010, (Washington, D.C.: U.S. Environmental Protection Agency, 2011), Table 7. Available at: http://www.epa.gov/waste/nonhaz/municipal/pubs/2010_MSW_Tables_and_Figures_508.pdf, accessed 3/12/2014.
78 Ibid. 79 Ibid. 80 Ibid., Table 4. 81 Joe Eskenazi, “Baggage: The city’s politicos made the enviros happy by banning plastic
bags, but left us with more pollution and cost,” SF Weekly, January 7, 2009. Available at http://www.sfweekly.com/content/printVersion/1297386/, accessed September 12, 2013.
82 Some modern, highly engineered landfills have been constructed as “bioreactors,” with impermeable liners, intentionally promoting decomposition and methane production (with the objective of capturing and burning the methane to produce heat and power). But these are the exception rather than the rule in the U.S.
83 Quoted in: Aviya Kushner, “Paper or Plastic? What’s the Environmental Choice?” December 14, 2004. Available at http://www.bankrate.com/brm/news/cheap/20041215a1.asp, accessed October 31, 2013.
84 Use Less Stuff Report, March 2008, “Review of Life Cycle Data Relating to Disposable, Compostable, Biodegradable, and Reusable Grocery Bags,” p.3. Available at http://www.use-less-stuff.com/Paper-and-Plastic-Grocery-Bag-LCA-Summary-3-28-08.pdf, accessed September 6, 2013.
85 As of 1998 (the most recent data available), only 16% of surveyed municipalities had unit-based pricing: Jonathan Burgiel and Raymond Randall, “National Unit-Based Pricing Survey Results,” R. W. Beck, Inc, 1998. Available at: http://www.epa.gov/waste/conserve/tools/payt/pdf/paytsurv.pdf, accessed March 6, 2014.
86 David H. Folz and Jacqueline N. Giles, “Municipal Experience with ‘Pay-as-You-Throw’ Policies: Findings from a National Survey,” State & Local Government Review, Vol. 34 (2), 2002, pp. 105–115. Version available at: http://web.utk.edu/~dfolz/payt.pdf, accessed March 7, 2014.
87 Don Fullerton and Thomas C. Kinnaman, "Garbage, Recycling, and Illicit Burning or Dumping," Journal of Environmental Economics and Management Vol. 29, 1995, pp. 78–91. Available at: http://www.nber.org/papers/w4374, accessed May 7, 2014.
88 Ibid. 89 Teasley subsequently joined the Board of Reason Foundation and is now Chairman
Emeritus. 90 Arsen Darnay and Gary Nuss, “Environmental Impact of Coca Cola Beverage Containers,”
Executive Summary Volume 1, Midwest Research Institute, July 1971. Available at http://www.lcacenter.org/Data/Sites/1/SharedFiles/History/Environmental%20Impacts%20of%20Coca-Cola%20Beverage%20Containers%20Vol%201.pdf, accessed February 1, 2014.
91 See e.g.: “Life Cycle Assessment: An operational guide to the ISO standards,” Centre of Environmental Science, Leiden University, May 2001. Available at http://media.leidenuniv.nl/legacy/new-dutch-lca-guide-part-1.pdf, accessed May 7, 2014.
How Green Is that Grocery Bag Ban? | 67
92 Resource and Environmental Profile Analysis of Polyethylene and unbleached paper grocery sacks, Final Report, Prepared for The Council for Solid Waste Solutions by Franklin Associates, Ltd., June 1990. Available at: http://www.dpw.co.santa-cruz.ca.us/www.santacruzcountyrecycles/Law/DocList/SC021-Franklin_report.pdfAvailable at: http://www.dpw.co.santa-cruz.ca.us/www.santacruzcountyrecycles/Law/DocList/SC021-Franklin_report.pdf, accessed Februaryccessed 2, /2/2014.
93 Bousted Consulting, Life Cycle Assessment for Three Types of Grocery Bags—Recyclable Plastic; Compostable, Biodegradable Plastic; and Recycled, Recyclable Paper, Final Report prepared by Chet Chaffee and Bernard R. Yaros, Bousted Consulting and Associates, Ltd. for the Progressive Bag Alliance, 2007. Available at: http://www.bousteadusa.com/news/ACCPlasticBags.pdfhttp://www.bousteadusa.com/news/ACCPlasticBags.pdf, accessed February 2, /2/2014
94 Nolan ITU, Centre for Design (RMIT), and Eunomia Research and Consulting Ltd, Plastic Shopping Bags—Analysis of Levies and Environmental Impacts, Final Report for Environment Australia, 2002, available at: http://www.environment.gov.au/archive/settlements/publications/waste/plastic-bags/pubs/analysis.pdf, accessed May 7, 2014.
95 Chris Edwards and Jonna Meyhoff Fry, Life Cycle Assessment of Supermarket Carrier Bags, Intertek Expert Services for the Environment Agency, 2011. Available at http://www.biodeg.org/files/uploaded/Carrier_Bags_Report_EA.pdf, accessed May 7, 2014.
96 “Proposed Plastic Bag Levy—Extended Impact Assessment: Volume 1: Main Report,” The Scottish Government, August 2005. Available at http://www.scotland.gov.uk/Publications/2005/08/1993154/32004 accessed February 2, 2014.
97 California State University Chico Research Foundation, “Life Cycle Assessment of Reusable and Single-use Plastic Bags in California,” January 2011, available at http://www.truereusablebags.com/pdf/lca_plastic_bags.pdf, accessed May 7, 2014.
98 The RMIT LCA is no longer available on Victoria’s website, but was accessed here: http://web.archive.org/web/20090705232744/http://www.sustainability.vic.gov.au/resources/documents/lca_shopping_bags_full_report%5B2%5D.pdf, accessed February 6, 2014). It appears to be a simplified version of earlier LCAs produced by the RMIT team, such as Nolan-ITU 2002 and Nolan-ITU 2003.
99 Even for those contaminants for which reliable health impact data are available, it is often not possible to know what is the actual impact on health, since that would require data on the demographics of the local population affected by any particular emission. This problem applies both to point sources and to mobile sources, though is obviously worse for the latter.
100 See the description here: “CML-IA Characterization Factors,” Institute of Environmental Sciences at the University of Leiden in the Netherlands. Available at http://cml.leiden.edu/software/data-cmlia.html, accessed/February 5,2014
101 See: Mark Huijbregts, “Life-Cycle Impact Assessment of Acidifying and Eutrophying Air Pollutants, DRAFT VERSION,” University of Amsterdam, December 2009. Available at http://media.leidenuniv.nl/legacy/Life-cycle%20impact%20assessment.pdf, accessed February 5, 2014.
102 “Climate Change 2007: Working Group I: The Physical Science Basis,” Intergovernmental Panel on Climate Change. Available at

68 | Reason Foundation
https://www.ipcc.ch/publications_and_data/ar4/wg1/en/ch2s2-10.html accessed February 6, 2014.
103 See e.g.: Keith P. Shine, “The global warming potential—the need for an interdisciplinary retrial,” Climatic Change, 2009, Vol. 96, pp. 467–472. Available at: http://link.springer.com/article/10.1007%2Fs10584-009-9647-6, accessed on May 7, 2014.
104 So, for example, Nolan-ITU 2002 assumes that HDPE, biodegradable bags and and paper bags are used only once, while LDPE is used 12 times, calico 52 times, and NWPP 104 times. (Nolan-ITU 2002, p. 35); Nolan-ITU 2003 makes the same assumptions except for LDPE which is assumed to be used 10 times. (Nolan-ITU 2003, p.78)
105 “National Plastic Shopping Bag Recycling Signage Testing: A Survey of the General Population,” March 2007, available at: http://www.bagtheban.com/assets/content/bag-recycling-signage-testing.pdf, accessed April 27, 2014.
106 Ammonia is a base, but is included because at high concentrations it can cause damage to ecosystems.
107 See for example, this review: A. Cunha, et al. “Whole Ecosystem Nitrogen Manipulation: An Updated Review,” JNCC Report, No. 331. December 2002. http://jncc.defra.gov.uk/pdf/jncc331.pdf, accessed May 7, 2014.
108 See e.g. Bengt A. Steen, “Abiotic Resource Depletion Different perceptions of the problem with mineral deposits,” The International Journal of Life Cycle Assessment, January 2006, Volume 11, Issue 1 Supplement, pp 49–54. Available at: http://link.springer.com/article/10.1065%2Flca2006.04.011, accessed on May 7, 2014.
109 See e.g. Lance E. Davis, Robert E. Gallman and Karin Gleiter, The Pursuit of Leviathan: Technology, Institutions, Productivity, and Profits in American Whaling, 1816–1906, (Chicago: University of Chicago Press, 1997).
110 Water covers approximately two thirds of the surface area of the planet: clearly it is not scarce.
111 See e.g.: “Water Monitoring & Assessment,” U.S. Environmental Protection Agency. Available at: http://water.epa.gov/type/rsl/monitoring/vms52.cfm, accessed May 7, 2014.
112 See e.g.: “Improvement of LCA Characterization Factors and LCA Practice for Metals,” TNO Environment, Energy and Process Innovation, August 2004. Available at http://www.leidenuniv.nl/cml/ssp/projects/finalreportmetals.pdf, accessed May 7, 2014.
113 See e.g. Edward Calabrese, “Hormesis: Toxicological foundations and role in aging research,” Experimental Gerontology Vol. 48(1), 2013, pp. 99–102. Abstract available at: http://www.ncbi.nlm.nih.gov/pubmed/22525590, accessed March 12, 2014.
114 See e.g. the summary at: “High-Dose Vitamin C,” National Cancer Institute. Available at http://www.cancer.gov/cancertopics/pdq/cam/highdosevitaminc/patient/page2, accessed May 7, 2014.
115 Centre for Environmental Studies (CML), CML Impact Assessment Characterisation Factors, University of Leiden, 2001.
116 “The Impacts of Degradable Plastic Bags in Australia,” Centre for Design at RMIT, September 2003, p. 85. Available at http://www.environment.gov.au/archive/settlements/publications/waste/degradables/impact/pubs/degradables.pdf, accessed May 7, 2014.

How Green Is that Grocery Bag Ban? | 69
117 U.S. Department of Energy and U.S. Environmental Protection Agency, Model Year 2013 Fuel Economy Guide, Updated April 22, 2014. Available at: https://www.fueleconomy.gov/feg/pdfs/guides/FEG2013.pdf, accessed May 7, 2014.
118 GHK (Hong Kong) Ltd. “Assessment of Benefits and Effects of the Plastic Shopping Bag Charging Scheme,” May 2007, Available at: http://www.epd.gov.hk/epd/english/environmentinhk/waste/prob_solutions/files/GHK_study.pdf, accessed May 7, 2014.
119 Ibid. 120 Ibid. 121 “About Plastics,” Plastics Industry Trade Association. http://www.plasticbagfacts.org/Case-
Study-Ireland/Case_Study_Ireland.pdf, accessed May 7, 2014. 122 “Irish Carrier Bag Tax” INCPEN, July 2008.
http://www.incpen.org/displayarticle.asp?a=55&c=2, accessed May 7, 2014. 123 Government of the District of Columbia, Office of the Chief Financial Officer, “2010
District of Columbia Citizen’s Financial Report,” http://cfo.dc.gov/sites/default/files/dc/ sites/ocfo/publication/attachments/ocfo_pafr_2010.pdf; “Citizens Financial Report 2011”, accessed May 7, 2014. June 2012, available at: http://cfo.dc.gov/sites/default/files /dc/sites/ocfo/publication/attachments/ocfo_2011_dcocfo_cfr_web.pdf, accessed May 7, 2014. ; FY 2012: Office of the Financial Officer, “Monthly OCFO Cash Report” June 2012, http://cfo.dc.gov/sites/default/files/dc/sites/ocfo/publication/attachments/ ocfo_cash_report_june_fy2012.pdf, accessed May 7, 2014.
124 Two Years of the Washington, D.C. Bag Tax: An Analysis, The Beacon Hill Institute at Suffolk University, August 2012, available at: http://s3.amazonaws.com/atrfiles/files/files/BHI_Report.pdf, accessed March 8, 2014.
125 H. Sterling Burnett, Do Bans on Plastic Grocery Bags Save Cities Money? (Dallas: National Center for Policy Analysis, December 2013), Policy Report No. 353, p. 11. Available at: http://www.ncpa.org/pdfs/st353.pdf, accessed March 12, 2014.
126 Taxes and fees have been introduced in many other locations (see Appendix) but the authors were unable to locate reliable analyses of their impact.
127 “Checkout Bag Ordinance” http://www.sfenvironment.org/article/prevent-waste/checkout-bag-ordinance, accessed May 7, 2014.
128 Ibid. noting that there are exceptions for various items, including loose foods and leftover food items. (the revised ordinance is available at http://www.sfenvironment.org/sites/default/files/policy/sfe_zw_extended_bag_ban.pdf, accessed May 7, 2014.
129 This figure is widely cited but does not seem to have a firm empirical basis. An example is: Wyatt Buchanan, “Starting Tuesday, plastic bags illegal at big S.F. grocery stores,” San Francisco Chronicle, Nov. 19, 2007, at D1. Available here: http://www.sfgate.com/bayarea/article/Starting-Tuesday-plastic-bags-illegal-at-big-3236322.php, accessed March 12, 2014.
130 Jesse McKinley “San Francisco Board Votes to Ban Some Plastic Bags,” The New York Times, 3/28/2007. Available at http://www.nytimes.com/2007/03/28/us/28plastic.html, accessed May 7, 2014.

70 | Reason Foundation
131 San Francisco Office of the Controller, “Checkout Bag Charge: Economic Impact Report,“ Office of Economic Analysis, Item #101055, November 30, 2011. Available at: http://sfcontroller.org/Modules/ShowDocument.aspx?documentid=2721, accessed April 22, 2014.
132 Ibid. 133 “Case Study: San Jose, CA's Single-Use Bag Ban,” ICLEI USA. Available at
http://www.icleiusa.org/action-center/learn-from-others/ICLEI_San%20Jose%20case%20study.pdf, accessed May 7, 2014.
134 Ordinance No. 29314, City of San Jose, California, 10/11/2013. Available at http://www.sanjoseca.gov/DocumentCenter/View/23916, accessed May 7, 2014.
135 “Case Study: San Jose, CA's Single-Use Bag Ban,” ICLEI USA. Available at http://www.icleiusa.org/action-center/learn-from-others/ICLEI_San%20Jose%20case%20study.pdf, accessed March 14, 2014.
136 L.A. County Ordinance amending Title 12: Environmental Protection of the Los Angeles County Code, 11/16/2010. Available at http://ladpw.org/epd/aboutthebag/pdf/BagOrdinance_final.pdf, accessed May 7, 2014.
137 Sapphos Environmental, “Ordinances to ban plastic carryout bags in Los Angeles County final environmental impact report (sch # 2009111104), Volume III,” October 28, 2010, at p. 2-2. Available at: http://dpw.lacounty.gov/epd/plasticbags/pdf/DEIR.pdf, accessed May 7, 2014.
138 “Board Meeting, State of California Integrated Waste Management Board, Joe Serna, Jr., Cal/EPA Building, 1001 I Street 2nd Floor, Coastal Hearing Room, Sacramento, California, Tuesday, June 12, 2007, 9:40 A.M,” Available at: http://www.calrecycle.ca.gov/Archive/IWMBMtgDocs/MtgDocs/2007/06/00022212.pdf, accessed May 7, 2014.
139 The U.S. Census Bureau puts the current population of L.A. County at 9,962,789. Available at http://quickfacts.census.gov/qfd/states/06/06037.html, accessed March 14, 2014.
140 County of Los Angeles, Estimated Population—Unincorporated Areas County of Los Angeles, Available at: http://ceo.lacounty.gov/forms/Estimate%20Unincorp.pdf, accessed March 14, 2014.
141 “L.A. County Carryout Bag Ordinance,” Department of Public Works. Available at http://dpw.lacounty.gov/epd/aboutthebag/, accessed March 13, 2014.
142 Ibid. 143 Pamela Villareal and Baruch Feigenbaum, A Survey on the Economic Effects of Los Angeles
County’s Plastic Bag Ban, (Dallas, TX: National Center for Policy Analysis, August 2012), Study no. 340. Available at: http://www.ncpa.org/pub/st340, accessed March 11, 2014.
144 http://www.edelmanberland.com/our-studies/survey-shows-reusable-shopping-bags-are-minimally-reused/
145 http://www.bagtheban.com/assets/content/bag-recycling-signage-testing.pdf 146 Joseph Greene, Life Cycle Assessment of Reusable and Single-use Plastic Bags in
California, California State University Chico Research Foundation, January 2011, available at http://www.truereusablebags.com/pdf/lca_plastic_bags.pdf (accessed May 7, 2014).

How Green Is that Grocery Bag Ban? | 71
147 Ibid. at p. 18. 148 The estimates of non-washing water consumed assume the base amount estimated by
Bousted Consulting’s LCA for HDPE but use the relative amounts found by Ecobilan-PWC’s LCA.
149 San Francisco Office of the Controller, “Checkout Bag Charge: Economic Impact Report,“ Office of Economic Analysis, Item #101055, November 30, 2011. Available at: http://sfcontroller.org/Modules/ShowDocument.aspx?documentid=2721, accessed April 22, 2014.
150 See: http://www.slideshare.net/EdelmanBerland/reusable-bag-study-results, accessed 5/21/2014. Note also that this is a lower reuse rate than under the “high impact” scenario adopted by the Office of the Controller, which gave a minimum reuse rate of 25.
151 Among other things, we assume that the proportion of paper bags to plastic bags pre-ban for supermarkets and chain pharmacies is the same as the proportion for “other retailers” as of November 2011 (before the ban went into effect for those retailers).
152 The Ecobilan-PWC LCA did not estimate the impact of NWPP, so this does not include the impact of NWPP bags.
153 Joseph Greene, Life Cycle Assessment of Reusable and Single Use Plastic Bags in California, (Chico, CA: California State University Institute for Sustainable Development, January 2011), p. 20. Available at: http://www.truereusablebags.com/pdf/lca_plastic_bags.pdf, accessed May 7, 2014.
154 See the overview in The City of San Francisco Streets Litter Re-Audit, 2009, prepared for the City of San Francisco, available at: http://www.cawrecycles.org/files/SF2009LitterReportFINAL-Sep15-09.pdf, accessed 5/19/2014.
155 The precise number of sites included in the audit varied by year: in 2007, 105 sites were included; in 2008, 130 sites; in 2009, 132 sites.
156 In line with the assumption made by the Office of the Controller of San Francisco, we assume that one plastic bag would be used in place of one paper bag.
157 H. Sterling Burnett, “Do Bans on Plastic Grocery Bags Save Cities Money?” Dallas: National Center for Policy Analysis, Policy Report No. 353, December 2013. Available at: http://www.ncpa.org/pdfs/st353.pdf, accessed March 12, 2014.
158 Using the heaviest (13 micron) standard size t-shirt bag listed by Interplast here: http://temp.inteplast.com/ibs/retail/TSHIRT.pdf, accessed March 12, 2014.
159 This is likely a significant overestimate based on the published cost of disposing of domestic refuse at Recology’s San Francisco transfer station of $147.13 per ton. Available at http://www.recologysf.com/index.php/for-homes/transfer-station-residential, accessed May 7, 2014..
160 San Francisco Office of the Controller, “Checkout Bag Charge: Economic Impact Report, “ Office of Economic Analysis, Item #101055, November 30, 2011, p. 11. Available at: http://sfcontroller.org/Modules/ShowDocument.aspx?documentid=2721, accessed April 22, 2014.
161 Ibid, p. 10.

72 | Reason Foundation
162 ICLEI USA “Case Study: San Jose, CA's Single-Use Bag Ban,” http://www.icleiusa.org/action-center/learn-from-others/ICLEI_San%20Jose%20case%20study.pdf, accessed March 14, 2014.
163 Government of San Jose, Integrated Waste Management Fund, appendix to 2013–2014 budget, at p. X-13. Available at: http://www.sanjoseca.gov/DocumentCenter/View/22885, accessed March 14, 2014.
164 San Jose City Council Budget 2013–2014. Integrated Waste Management Fund. http://www.sanjoseca.gov/DocumentCenter/View/22885, accessed May 7, 2014, at p. X-10
165 Beacon Hill Institute, Two Years of the Washington, D.C. Bag Tax: An Analysis, (Suffolk University: The Beacon Hill Institute for Public Policy Research, August 2012). Available at http://s3.amazonaws.com/atrfiles/files/files/BHI_Report.pdf, accessed May 7, 2014.
166 Villareal and Feigenbaum, A Survey on the Economic Effects of Los Angeles County’s Plastic Bag Ban.
167 Ibid. 168 Kimberly Repp and William Keene, “A Point Source Norovirus Outbreak Caused by
Exposure to Fomites,” Journal of Infectious Diseases, 2012, pp. 1639–1641, available at: http://jid.oxfordjournals.org/content/205/11/1639.full.pdf+html, accessed 5/27/2014
169 See e.g.: http://www.usatoday.com/story/news/nation/2014/01/06/reusable-grocery-bag-germs/4341739/, accessed 5/27/2014.
170 David L. Williams, Charles P. Gerba, Sherri Maxwell and Ryan G. Sinclair, “Assessment of the Potential for Cross-contamination of Food Products by Reusable Shopping Bags,” Food Protection Trends, Vol. 31(8), 2011, pp. 508–513. Available at http://www.foodlegal.com.au/uploads/Cross%20contamination%20of%20reusable%20shopping%20bags_i171.pdf, accessed April 24, 2014.
171 Ron Chapman, “Practical tips for the use and care of reusable grocery shopping bags,” California Department of Public Health, no date. Available at: http://www.cdph.ca.gov/pubsforms/Documents/fspnu04ReusableBags.pdf, accessed May 13, 2014.
172 Assuming the household income is derived from the household working for 40 hours per week, 50 weeks per year, average hourly household income is $30.70.
173 http://www.slideshare.net/EdelmanBerland/reusable-bag-study-results, accessed 5/21/2014. 174 6x2x52/14.6=42.74. 175 Assuming the average shopper would need 15 paper bags to carry the same amount as 12
reusable NWPP bags. 176 http://www.slideshare.net/EdelmanBerland/reusable-bag-study-results, accessed 5/21/2014. 177 Safeway has already introduced some additional security measures, such as receipt checkers
at the exit of some of its stores in locations where plastic bags have been restricted. See: http://www.washingtoncitypaper.com/blogs/housingcomplex/2011/11/01/safeway-bag-tax-causes-theft/
178 Anthony van Leeuwen, “Negative Health and Environmental Impacts of Reusable Shopping Bags,” December 2012, Available at:

How Green Is that Grocery Bag Ban? | 73
http://fighttheplasticbagban.files.wordpress.com/2013/04/negative_health_and_environmental_impacts_of_reusable_shopping_bags.pdf, accessed 6/5/2014.
179 For example, a survey of the adult U.S. population by APCO Insight in 2007 found that 92% of people interviewed reused plastic shopping bags, with 65% saying they used the bags for trash of various kinds. APCO Insight, National Plastic Shopping Bag Recycling Signage Testing: A Survey of the General Population, March 2007, available at: http://www.bagtheban.com/assets/content/bag-recycling-signage-testing.pdf, accessed 4/27/2014.
180 Emily Ekins. “60 Percent of Americans Oppose Plastic Bag Ban,” August 19, 2013. Available at http://reason.com/poll/2013/08/19/60-percent-of-americans-oppose-plastic-b, accessed May 7, 2014.
5737 Mesmer Ave.Los Angeles, CA 90230310-391-2245reason.org