How does the setting shape the main character in “Rikki Tikki Tavi”?

Mai Hua
WAGENINGEN
UNIVERSITY
HOW DOES THE ENVIRONMENT SHAPE
AN INDIVIDUAL’S MARKET
ORIENTATION AND ENTREPRENEURIAL
PROCLIVITY?

Wageningen University & Research Center
Department of Social Sciences
Marketing and Consumer behavior (MCB) Chair group
Thesis
HOW DOES THE ENVIROMENT SHAPE
INDIVIDUAL’S MARKET ORIENTATION
AND ENTREPRENEURIAL PROCLIVITY?
MCB80433
Student: Mai Hua (830607370060)
Supervisor: Dr Ir Ing F.J.H.M. (Frans) Verhees
9/2011 – 3/2012

i
Preface
After a long time working and writing this thesis, I have been reaching my final destination in
master program of Management, Economics and Consumer studies. Over the period time of doing
thesis, I have learned about Dutch agriculture which I had not been familiar with, how to run
statistical analysis in hierarchical regression which I had never heard about, and how to write an
academic paper in English.
This report could not be finished without many helps from my supervisor Dr. Frans
Verhees – an assistant professor of MCB chair group. I would like to thank him for his
enthusiastic supervising, and his great knowledge which guided me how to conduct data analysis
and interpreted results in Dutch agricultural contexts. I really appreciate his comments and
remarks on my paper. For me, this is the first time I have written a thesis in English so mistakes
could not be avoided. With his careful correction to my paper, I have improved my English
writing and grammar, especially in academic writing.
Besides, I would like to send my special thanks to my family and my dear friends. Thanks
for their spiritual supports and encouragements which always give me much power to overcome
difficulties during my study time in the Netherlands.
Last but not least, I would like to thank Vietnam Ministry of Education and Training for
its scholarship. It has provided me not only financial support but also an opportunity to study
here.

ii
Table of Contents
Preface................................................................................................................................................ i
Table of Contents .............................................................................................................................. ii
List of tables ..................................................................................................................................... iv
List of figures .................................................................................................................................... v
Abstract ............................................................................................................................................ vi
1. Introduction ................................................................................................................................... 1
2. Literature review ........................................................................................................................... 3
2.1 Entrepreneurship and entrepreneur ....................................................................................... 3
2.2 Firm owner’s Entrepreneurial Proclivity .............................................................................. 3
2.3 Classification of entrepreneurial activities............................................................................ 5
2.4 Firm owner’s Market Orientation ........................................................................................ 6
2.5 The difference between Entrepreneurial Proclivity and Market Orientation ...................... 7
2.6 Firm environment ................................................................................................................ 8
2.7 Characteristics of farms and horticulture (SMEs) ............................................................... 8
3. Conceptual model and hypotheses .............................................................................................. 10
3.1 Research model .................................................................................................................. 10
3.2 Hypotheses ......................................................................................................................... 10
4. Methodology ............................................................................................................................... 13
4.1 Sample and data collection ................................................................................................ 13
4.2 Variables and measurements ............................................................................................. 13
4.3 Regression analysis and hierarchical linear modeling (HLM) .......................................... 15
5. Results ......................................................................................................................................... 17
6. Conclusion .................................................................................................................................. 22
7. Discussion ................................................................................................................................... 24
7.1 Limitation .......................................................................................................................... 24
7.2 Implication for the literature .............................................................................................. 24
7.3 Implication for practice ...................................................................................................... 25
7.4 Suggestions for further research ........................................................................................ 27

iii
References ....................................................................................................................................... 28
Appendix A ..................................................................................................................................... 33

iv
List of tables
Table 1. Difference between MO and EP ......................................................................................... 7
Table 2. Measurement scale properties ........................................................................................... 14
Table 3. Hierarchical linear model regression ................................................................................ 15
Table 4. Environmental dynamics, EP and MO’s average scores across agriculture industries .... 17
Table 5. Relationship between Environmental dynamism/EP and MO ......................................... 18
Table 6. Level 1 – Effect of EP and different agricultural industries on MO................................. 19
Table 7. Interaction between EP and agricultural industries .......................................................... 20
Table 8. Level 2 - Effect of different environmental dynamism on MO across industries ............ 21

v
List of figures
Figure 1. The conceptual model and hypothesized relationships ................................................... 10
Figure 2. Hypotheses testing result ................................................................................................. 23

vi
Abstract
Nowadays, agricultural environment has been changing fast such as changing agricultural policy,
intense competition, and fluctuating demand from consumers. As a result, farmers and
horticultural growers need to adapt with this changing. Entrepreneurial proclivity (EP) and market
orientation (MO) can lead farmers to better performance. However, the relationships between
EP/MO and the environment are ambiguous. Therefore, this study aims to investigate how three
underlying elements (Market dynamics, Competition, and Technological dynamics) of
environmental dynamism shape Dutch farmers and horticultural growers’ MO and EP. These
relationships were hypothesized in conceptual model and tested with regression statistical
methods afterwards.
According to data analysis, Customer dynamics, Competition, and Technological
dynamics do not have any influence on Dutch farmers and horticultural growers’ EP. Similarly,
Customer dynamics have no influence on MO. EP and Competition, however, have positive
effects on MO while Technological dynamics have a negative relationship with MO.
Consequently, some practical implementations are recommended. First, farmers and
horticultural growers should be provided more business knowledge skills and marketing tools to
respond with the changing of competition. Furthermore, to help small farms improve both MO
and innovative technology, an effective agricultural social-economical-technical network needs to
be implemented and developed among all stakeholders. Finally, their EP can be enhanced by
entrepreneurial skill training courses.
For further research, the dominant suggestion is that more sub types of agriculture
industries should be distinguished and analyzed in details. These subtypes will provide better
understanding about the relationship between the environmental dynamics, farmers and
horticultural growers’ MO and EP
This thesis includes 6 chapters as follows. First, chapter 1 introduces the context and
background of the research while Chapter 2 presents mostly relevant literature. Based on chapter
1 and chapter 2, chapter 3 hypothesizes a conceptual model with seven hypotheses. Furthermore,
chapter 4 describes the research methodology including sampling, measures and analysis. Chapter
5 shows the research results, which are afterwards concluded in chapter 6. Finally, chapter 7
discusses the results including limitation, implications for literature and practice; and gives further
research suggestions.
Key words: Market orientation (MO), Entrepreneurial proclivity (EP), environmental dynamics,
farmers and horticultural growers, Market dynamics (MD), Competition (CD), Technological
dynamics (TD)

1
1. Introduction
Many scholars have conducted researches about the consequences of Market Orientation
(MO) and Entrepreneurial Proclivity (EP) for business organizations. Some researches prove
the positive relationship either between MO (Jaworski & Kohli, 1993; Kirca et al., 2005;
Narver & Slater, 1990; Rodriguez Cano et al., 2004) or EP (Matsuno et al., 2002; Rauch et
al., 2009; Wiklund & Shepherd, 2003, 2005) and business performance. However, the role of
environmental dynamism in these researches is ambiguous, which calls for further research
(Grinstein, 2008; Rauch et al., 2009).
Product and business model life cycles are getting shorter in the business environment
today (Hamel, 2000). Accordingly, profit from existing operations is uncertain, and
businesses need to seek out new opportunities. This trend also applies to agriculture business.
Since agricultural industries are shifting from protected and subsidized to more self-
supported and open environment (Ondersteijn et al., 2006), agricultural business is facing
continuing challenges such as changing agricultural policy, intense competition, and
fluctuating demand from consumers (Clark, 2009). An example is the situation for dairy
farmers whose income has been reduced significantly by reforming commodity specific
support programs in the European Union’s Common Agricultural Policy (CAP). Moreover,
increasing concern from the general public and consumers about issues which rarely occurred
in the past such as food safety crises, animal welfare issues, animal health issues, and health
promoting products puts new pressure on farmers (Bergevoet, 2005; De Lauwere, 2005).
Hence, the modern agriculture business needs to adapt to meet all these requirements.
Under this changing of organizational environment, the Policy Commission on the
Future of Farming and Food (2002, p16, p20) also stated the urgent need to reform
agricultural business (Commission, 2002). Consequently, farmers who often manage their
farms by their own experience and (inherited) common sense have to adapt quickly to the
changing business environment. Otherwise they will lose their profit and be defeated by
competitors. Farmers are encouraged to focus more on entrepreneurial and management
activities (Ondersteijn et al., 2006). They are required to deepen their businessman's mind
and marketing skills. They should explore market opportunities quickly to survive in a
liberalized world (Report of the Policy Commission on the Future of Farming and Food,
2002, p16, p20). Farms should be considered as firms to face these situations while farmers
are encouraged to obtain a more entrepreneurial business model and perceive themselves as
entrepreneurs (Phillipson et al., 2004).

2
Some researches state that EP and MO are already spread gradually over farmers and
horticultural growers (Bergevoet et al., 2004; Knudson et al., 2004; Verhees et al., 2011b).
Although it is shown that EP and MO positively influences agricultural business performance
(Verhees et al., 2011b), it is not clear how the environment shapes the MO and EP of Dutch
farmers. This research investigates how the business environment influences the MO and EP
of Dutch farmers and horticultural growers. In particular, specific environmental dimensions
are hypothesized to influence their MO and EP. Empirical data analyses are applied to
explore these relationships.
When the relationship between environment and EP/MO is identified, it will gain
insight about how environmental instabilities and uncertainties have shaped farmers and
horticultural growers’ EP and MO. Are they really influenced by the business environment
and what should they do in a certain context? In the manner of evolution theory and natural
selection, environments select organizations for survival on the basis of the fit between
organization structure and environmental characteristics (Aldrich & Pfeffer, 1976).
Therefore, an adjustment in farmers’ behavior and mindset is necessary to help them adapt to
environmental changes. The more firms adapt to the environmental changes, the more
probability they survive.

3
2. Literature review
Theories have been developing to explore the interactions between EP, MO and firm
environment. This review focuses on seven themes which are related mostly to the research
topic: entrepreneurship and entrepreneur definitions; firm owners’ EP and MO concepts and
their differences; firm environment; classification of entrepreneurial activities; and lastly the
characteristics of farmers and horticulture growers’ EP/MO. Although literature explained
these themes in general and in various contexts, this paper primarily focuses on its
application to farmers and horticultural growers.
2.1 Entrepreneurship and entrepreneur
What is entrepreneurship? Entrepreneurship is a field which involves study of the sources,
discovery process, evaluation and exploitation of opportunities. It includes a set of
individuals who discover, evaluate, and exploit opportunities to introduce new goods,
services or processes. However, entrepreneurship does not require, but can include, the
creation of new organizations (Shane & Venkataraman, 2000) because it can occur within an
existing organization and opportunities can be sold to other individuals or organizations
(Amit et al., 1993).
Who is an entrepreneur? In general, an entrepreneur is an individual who is
responsible for creating new value (an innovation and/or a new organization). Along with this
definition, entrepreneurship is the connection between individual and new value creation
within an ongoing process and within an environment. Entrepreneurs are also defined as
“individuals who manage a business with the intention of expanding that business with the
leadership and managerial capabilities for achieving their goals” (Wolf & Schoorlemmer,
2007). This definition is considered as the most suitable and relevant to farm sector
(McElwee, 2005).
2.2 Firm owner’s Entrepreneurial Proclivity
In integration of management strategy and entrepreneurship literature, there are several
different terms such as Entrepreneurial Proclivity (EP), Entrepreneurial Orientation (EO)
and Entrepreneurial Management (EM) which can be used interchangeably to describe
equivalent concept (Matsuno et al., 2002). In this research, I use mainly the term
Entrepreneurial Proclivity (EP). However, in some parts of this literature review, EO or EM
is used as an interchangeable replacement of EP.

4
EP is defined as “the organization's predisposition to accept entrepreneurial processes,
practices, and decision making, characterized by its preference for innovativeness, risk
taking, and proactiveness” (Matsuno et al., 2002). In this definition, three salient dimensions
which are innovativeness, risk taking and proactiveness are defined and used consistently in
the literature. These dimensions are originally derived from Miller’s suggestion (1983) which
shows that an entrepreneurial firm engages in product market innovation, risky ventures, and
proactive innovations to defeat competitors (Miller, 1983). Accordingly, innovativeness, risk
taking, and proactiveness are adopted by many researchers to characterize entrepreneurship
(Lumpkin & Dess, 1996).
The first dimension - innovativeness reflects a firm's tendency to be involved in and
support new ideas, novelty, experimentation, and creative processes. This tendency may
result in new products, services, or technological processes (Lumpkin & Dess, 1996; Rauch
& Frese, 2009). The innovativeness represents a basic willingness to move away from
existing technologies or practices to new ones. For example, 3M Company sends its 9000
technical employees in 34 countries into customers’ workplaces to explore what problem
customer usually meet with. And these employees are allowed to spend 15% working time
for the goal of creating new innovations for 3M (Certo et al., 2009).
The second dimension - risk taking refers to the degree of managers’ willingness to
make large and risky resource commitment (Miller & Friesen, 1978). Along with this
definition, risk taking involves taking adventurous actions by exposing to the unknown,
borrowing heavily, and/or committing significant resources to investments in uncertain
environments (Rauch et al., 2009). Risk has various meanings when putting it in different
contexts. In the strategy context, there are three types of strategic risk: venturing into
unknown; committing a relative large portion of assets; and borrowing heavily (Baird &
Thomas, 1985). In financial context, risk is used as a risk-return trade-off and reflects the
probability of a loss or negative outcome. Thus, firms with EP are often identified by risk
taking behavior, e.g. investing in high risky project (Lumpkin & Dess, 1996). For example,
Jeroen van der Veer, CEO of Royal Dutch Shell PLC, took the risky investment in Russia’s
Far East - a natural gas and crude oil reserving area. At that time, it was unknown that van
der Veer‘s move would be successful. If Russian politics had been instable and pipeline
construction had failed, Shell would have lost its 27.5% stake in the venture (Certo et al.,
2009).
The third dimension - proactiveness refers to a forward looking perspective. Proactive
firms initially anticipate and pursue new opportunities in the market (Lumpkin and Dess

5
1996, p.146). Proactiveness aims to seek new opportunities, which may or may not be related
to the present line of operations. Proactive firms introduce new products and services ahead
of competition, eliminate strategically operations which are in the mature or declining stages
of life cycle (Venkatraman, 1989). Therefore, a proactive firm is often a market leader rather
than a follower, and acting in foresight of market demand. An example is Proactive
Communications (PC) - a small firm located in Killeen, Texas. From its beginning in 2001,
PC has provided communications in hostile environments, such as Iraq and areas impacted by
Hurricane Katrina. Being proactive in this case means being willing to put communication
device on a military helmet or sleep outdoors. These activities are often avoided by other
telecommunications firms. As a result, information that once took days to reach Iraq
government offices is now delivered instantaneously. With annual growth of 18%, PC has
been successful in other areas - Africa, South America, and Eastern Europe, where
infrastructure deficiencies have prompted governments to leapfrog into satellite and wireless
communication. By possessing the capability of being a first mover, PC has created a niche
that may be sustainable in a technologically, environmentally, and dynamic world (Certo et
al., 2009).
Together, three dimensions of EP (innovativeness, risk taking and proactiveness)
contribute to renew the organizations and offer potentially superior value for customer
(Matsuno et al., 2002). To some extent, all firms have EP because they have some levels of
innovativeness, risk taking, and proactiveness, even if their levels are quite low (Schindehutte
et al., 2008).
Farmer and horticultural growers’ EP is defined as their routines, decision making and
practices through innovativeness, risk taking, and proactiveness. EP stimulates farmer and
horticulturists to renew their businesses by offering an alternative and potentially superior
customer value proposition (Verhees et al., 2011b).
2.3 Classification of entrepreneurial activities
Entrepreneurship scholars have developed a few typologies to describe alternate perspectives
of entrepreneurship. These classifications describe the differences in entrepreneurship as the
combination of various individual, organizational, or environmental factors (Lumpkin &
Dess, 1996). Dimensions of EP may vary independently under the influence of the external
environment.
Firms in different environments emphasize different relationships between corporate
entrepreneurship activities and financial performance (Zahra, 1993). Furthermore, the

6
differences among firms imply that EP dimensions may be combined in unique ways that
vary from one firm to the next (Certo et al., 2009).
Baumol (1986) suggested that entrepreneurial activities fall into two primary
categories: (1) initiating and (2) imitative EP. In one hand, initiating entrepreneurship refers
to introduction of products, productive techniques, and other procedures that were not
available before. In the other hand, imitative entrepreneurship deals with the diffusion of
these innovations after their utilities have been demonstrated by the initiators (Baumol,
1986).
2.4 Firm owner’s Market Orientation
The term “MO” refers the implementation of the marketing concept. Therefore, market
oriented firms have consistent actions with the marketing concept (Kohli & Jaworski, 1990).
There are three emerging MO perspectives: culture, behavior, and resource capabilities
(Schindehutte et al., 2008).
From the cultural perspective, Narver & Slater (1990) focus on organization’s values
and norms. These authors define MO as the most effective and efficient organizational culture
which creates the necessary behavior to offer superior value to buyers, and therefore leads to
superior performance for the business. These authors concentrate on three behavioral
components: customer orientation, competitor orientation, and inter functional coordination.
First, customer orientation is firms’ sufficient understanding of target customers and
providing customers continuously with superior value (Narver & Slater, 1990). In other
words, customer orientation is defined as “the set of beliefs that puts the customer interest
first” (Deshpandé et al., 1993). Second, competitor orientation infers that a seller understands
short-term strengths and weaknesses as well as long term capabilities and strategies of both
current and potential competitors. Third, inter functional coordination requires corporation
efforts of different department in organization. Marketing function does not only belong to a
marketing department. To sum up, customer and competitor orientation are involved in
acquiring information about the buyers and competitors while inter functional coordination is
based on this information to create superior value for buyers (Narver & Slater, 1990).
From the behavioral perspective, Kohli and Jaworski (1990) emphasized
organizational activities as the generation, dissemination and responsiveness to market
intelligence (Kohli & Jaworski, 1990). It reflects organization‘s market intelligence to
explore current and future customer needs. Hence, market oriented firms continuously collect

7
target-customer needs and competitor capabilities information then use this information to
create enduring superior customer value (Schindehutte et al., 2008).
From the view of resource capabilities, MO is a level of firm’s capability, which links
a firm to its external environment (Kyriakopoulos & Moorman, 2004). It allows firm to
compete by anticipating market requirements ahead of competitors, and by creating durable
relationships with customers, channel members, and suppliers (Schindehutte et al., 2008).
Based on either perspective, MO leads organizations to inspired performance and
competitive advantage by creating superior value for consumers. In other words, by assessing
their needs continuously MO is a set of activities and cross functional processes aiming to
create and satisfy consumers (Deshpandé & Farley, 1998). Consequently, market oriented
firms always attempt to improve their offerings for its customers relative to competitors.
MO may be especially important for small firms because these firms can leverage
their potential advantages (flexibly, and close to their customer) to provide individualized
service (Pelham, 1999).
2.5 The difference between Entrepreneurial Proclivity and Market Orientation
Although MO and EP are closely connected, they are different constructs. Table 1 shows the
differences between them.
Table 1. Difference between MO and EP
MO EP/EO
Literature
origin
Marketing literature (Atuahene-Gima
& Ko, 2001).
Management literature (Atuahene-
Gima & Ko, 2001).
Market
information
Put a lot of efforts on market
intelligence (Kohli & Jaworski, 1990)
Engage in a wider level of
information scanning activities to
seek out new opportunities
(Barringer & Bluedorn, 1999).
Responsiveness
to environment
Response to market dynamics by
concentrating on marketing concept,
customer and competitor (Verhees et
al., 2011b)
Response to a wider range of
environmental forces, including new
technology, legislation and societal
concerns (Verhees et al., 2011b)
Innovation and
new products
Enrich and adapt current innovations
to meet current needs rather than the
development of new products
(Atuahene-Gima & Ko, 2001)
Foster initiation of product
innovation with high levels of
financial uncertainty and risk
(Atuahene-Gima & Ko, 2001)

8
2.6 Firm environment
The environment is considered as one of the critical contingencies in organization
theory and strategic management. In conceptualization of environment, there are three basic
dimensions: dynamism (stability-instability, turbulence), complexity (homogeneity –
heterogeneity, concentration - dispersion), and munificence (or hostility as obverse).
Dynamism and complexity reflect degree of uncertainty an organization faces. Munificence
indicates a firm’s dependence on those environments for resources (Lumpkin & Dess, 2001).
Development of these dimensions are based on two commonly approach to environment: (1)
as a source of information and/or (2) as a stock of resources (Dess & Beard, 1984; Lumpkin
& Dess, 2001).
Along with these dimensions, their subdivisions are developed. Dynamism
subdivisions are market or technical turbulence; Munificence subdivisions include market
growth, profitability, and competitive intensity; and Complexity subdivisions include product
and customer differentiation (Pelham, 1999).
In this research, I focus on Dynamism dimension for two reasons. First, most research
suggests that EO leads to better performance under dynamic conditions (Casillas et al., 2011;
Lumpkin & Dess, 2001; Zahra, 1993). Second, markets for agricultural produce have been
relatively stable, but are becoming more dynamic (Verhees et al., 2011a).
Dynamism pressures companies to renew themselves through innovation and also
creates opportunities for a firm within its markets. A firm may locate a new niche in its
existing market by modifying its products and processes. Moreover, it may locate an
attractive niche outside its traditional markets by expanding the scope of its markets, by
launching new product or process ventures. Therefore, dynamism prompts a company to
exploit opportunities in current or new markets (Zahra, 1993).
Dynamic environments are linked with high unpredictability of customers’ demand,
and competitors’ behavior. It is also characterized by rapid changes and high level of
uncertainty in market trends and technological innovations (Atuahene-Gima & Ko, 2001;
Dess & Beard, 1984; Miller, 1987a, b; Miller & Friesen, 1978; Zahra, 1993). Hence, in this
research, I examine customer (market) dynamics, competition and technological dynamics as
constructions of dynamic business environment.
2.7 Characteristics of farms and horticulture (SMEs)
Entrepreneurship concept has been mentioned mostly in small and medium sized businesses
(SME) research (Bergevoet, 2005). In farm and horticulture business, the role of

9
owner/entrepreneur can be compared to SME’s because most of farms are micro-firms with
fewer than 10 employees or without employees (European-Commission, 2000). Hence,
farmer’s and horticultural growers’ MO/EP share some similarities with SMEs’.
SMEs have some limitations and advantages dominated by competence of the
entrepreneurs/firm owners to overcome those limitations.
Limitations are: (1) lack of economics of scale; (2) experience severe resource
constraints; (3) limited geographic marketplace and market image; (4) little brand loyalty or
market share; (5) little specialized management; (6) make decision under more imperfect
information conditions; (7) limited time per major management task; (8) rarely have
professional managers; (9) and have a mixture of business and personal goals (Verhees et al.,
2011b).
In contrast, some advantages are (1) superior understanding of customer needs,
market trends positioning; (2) prefer to create value adding differences for their market (3)
exploit and create turbulent markets; (4) constantly adapt to opportunities to improve
customer value; (5) pursue opportunities through innovation of products, processes, or
strategy; (6) identify opportunities intuitively and subjectively; (7) and highly integrated
decision making (Verhees et al., 2011b).
In agricultural industry, farmer entrepreneur is divided into five groups: (1)
economical entrepreneur who focus mostly upon monetary cost management; (2) social
responsible entrepreneur who has social orientation; (3) traditional growers who try to highest
yield against lowest cost; (4) new grower who wants to establish large company with
renewals; (5) and doubting entrepreneur who has uncertain strategies (McElwee, 2005).

10
3. Conceptual model and hypotheses
This chapter aims to introduce the research model with hypotheses. They are built up and
tested in the next chapter.
3.1 Research model
Our model applies to farmers and horticultural growers. It specifies causal (effect)
relationships among three building blocks. They are: Environmental dynamism, EO and MO.
In this model, I hypothesize that environmental dynamism affects farmers’ EO and MO. In
addition EP simultaneously influences farmers’ MO. Finally, I demonstrate the hypothetical
relationships in the model below.
Figure 1. The conceptual model and hypothesized relationships
Environmental dynamism
Customer dynamics
Competition
Technological dynamics
Entrepreneurial proclivity
Innovativeness
Risk taking
Proactiveness
Market orientation
3.2 Hypotheses
a) Environmental dynamism and Entrepreneurial proclivity (EP)
The principal characteristics of the environmental dynamism are creating new opportunities,
requiring firms to innovate and renew themselves. Hence, EP should be positively associated
with this environment because it focuses on approaching new business opportunities
proactively (Rauch & Frese, 2009).
Adopting and learning EP may help businesses respond to uncertainties in the
environment. It does not only help them to react quickly to new market opportunities but also
requires them to renew themselves. Therefore, successful business in dynamic environment
H1, H2, H3
H4, H5, H6
H7
11
should have high EP. Firms also learn that the higher their EP the higher the probability of
surviving in dynamic environments. In other words, dynamic environments create more EP
firms or push firms toward a more entrepreneurial orientation. As illustration, more proactive
and aggressively competitive firms achieve better results in dynamic environments; family
firms emphasizing innovativeness and risk taking perform better in dynamic environmental
conditions (Lumpkin & Dess, 2001).
Farmers’ business environment is dynamic as well. Agricultural market is changing
rapidly, moving from supplier markets to customer markets, from national and international
markets to global markets (Verhees et al., 2011a). Hence, farmers need to adapt to these
changes. To demonstrate, some farmers diversify their business activities such as tourism
activities or farm shops to exploit opportunities from dynamic business environments outside
agriculture (Clark, 2009; Pyysiäinen et al., 2006).
Environmental dynamism also enhances farmers’ innovation to offer premium value
for customers (Casillas et al., 2011; Verhees et al., 2011a).
Therefore, I expect positive relationships between the dimensions of dynamic
environment and EP of farmers and horticultural growers.
H1: Customer dynamics have a positive influence on the entrepreneurial proclivity of
farmers and horticultural growers.
H2: Competition has a positive influence on the entrepreneurial proclivity of farmers
and horticultural growers.
H3: Technological dynamics have a positive influence on the entrepreneurial
proclivity of farmers and horticultural growers.
b) Environmental dynamism and market orientation (MO)
In a stable environment with customers with stable preferences, firm’s level of MO is lower
because fewer adjustments in the marketing mix are necessary (Kohli & Jaworski, 1990). In
contrast, the dynamic environment raises a lot changes in consumer needs and preferences.
Therefore, firms should be customer oriented in uncertain and dynamic market (McElwee,
2005).
Increasing dynamics in environment could directly influence small firms. The small
firm managers must increase emphasis on the externally oriented activities designed to
understand, and satisfy customers as well as monitor competition (Pelham & Wilson, 1996).
Moreover, higher competition will lead firm to be more market oriented because customers
have many alternatives to satisfy their demands. In addition, by applying technological
innovation to create new solutions to meet their customers’ demands, firms obtain a

12
competitive advantage (Jaworski & Kohli, 1993) (McElwee, 2005). In a study, perceived
environmental dynamism is positively associated with large firms’ MO due to their
expectations to reduce uncertainty (Davis et al., 1991).
In this research, the MO is operationalized on customer orientation and focuses on
SMEs because of 2 reasons. First, to gain maximum benefit in dynamic environment, SMEs
marketing have to include a customer orientation. (O'Dwyer et al., 2009). Second, MO in
SMEs is a personal activity related directly to firm owners/managers. A customer orientation
is their effective way to understand target customer, respond sufficiently to customer’s needs
afterwards by adding value to different marketing programs (Verhees et al., 2011b).
As presented in previous parts, farmers’ business environment is dynamic. Dynamism
of farmers’ business environment could enhance their MO. Therefore, I offer the following
hypotheses basing on three conceptual dimensions of dynamic environment.
H4: Customer dynamics have a positive influence on the market orientation of farmers
and horticultural growers.
H5: Competition has a positive influence on the market orientation of farmers and
horticultural growers.
H6: Technological dynamics have a positive influence on the market orientation of
farmers and horticultural growers.
c) Entrepreneurial proclivity (EP) and market orientation (MO)
MO is strongly correlated with EO (Grinstein, 2008). Three underlying elements of EP
together lead to a firm’s market orientation, show the greater level of firm’s EP the greater
level of firm’s MO is (Matsuno et al., 2002). Particularly, it is believed that business
innovation enhances and promotes firm’s customer orientation (Deshpandé et al., 1993).
Farmers and horticultural growers with higher EP will offer alternative and potentially
superior value for customers, which lead up to higher level of MO. Therefore, I hypothesize
there is positive relationship between them.
H7: The entrepreneurial proclivity of farmers and horticultural growers has a positive
influence on their market orientation

13
4. Methodology
This chapter presents the research sample and data collection. The reliability of the
measurement scales is tested by Factor analysis and Cronbach Alpha. Later (in chapter 5),
regression analysis and hierarchical linear modeling are applied to test the hypotheses.
4.1 Sample and data collection
A sample of 1359 firms was drawn from the Dutch Farm Accountancy Data Network
(FADN). This sample presents the population of Dutch farmers and horticultural growers in
different sectors (e.g. greenhouse horticulture, arable farming, dairy farming and intensive
livestock farming)
The respondents received the questionnaires with an introductory letter to motivate
them and a return envelope with postage and return address via regular mail. Another option
for them is an online questionnaire. All questionnaires were sent in April 2010. After one
month, 391 questionnaires were returned. A reminder was sent in June 2010. After 3 months,
621 questionnaires were returned and 575 questionnaires did not have any missing values.
These questionnaires are used for the data analyses.
Furthermore, 18 agricultural experts were interviewed to evaluate the market dynamics,
competition and technological dynamics of each agricultural industry. They are agricultural
economists, bankers, government officials, farmers’ representatives, and management
consultants. Each expert rated all 6 agricultural industries hence each scale was completed
108 times.
4.2 Variables and measurements
All the concepts in my model were measured by questionnaires. Most scales in the
questionnaire were originally developed in English. Then, the questionnaire was translated by
a native Dutch person. To test whether the questionnaire was understandable for farmers and
horticultural growers in different sectors, two rounds of personal interviews were conducted.
Questions were adjusted based on comments from respondents and preliminary quantitative
analyses to test dimensionality and reliability of the measures. Appendix A shows the
measurement statements. Respondents rated all statements on a 7-point Likert scale which
showed their levels of agreement or disagreement.

14
Measurement properties are assessed by Principal Component Analysis (PCA) and
reliability analysis (Cronbach’s Alpha). All scales were checked for normal distribution by
Q-Q plot beforehand.
Table 2 describes the measurement scale properties. The PCA of each measure should
support a one-component solution. The first component’s eigenvalue must be larger than 1.0
while others are smaller than 1. A scree plot can indicate for one component solution by
showing a sharp decline in Eigenvalue from the first to the second component and a gradual
decrease in Eigenvalues from the second component onwards. Moreover, the first component
solution should account for a minimum of 50% of the variance in the items (Hair, 2010). All
items should have a loading on the first component (before rotation) higher than 0.6. Finally,
to assess for reliability of the scale, Cronbach’s Alpha scores should be higher than 0.6.
Table 2. Measurement scale properties
Scale # of items Eigen value
second
component
Variance
account for
Lowest
items
loading
Cronbach
Alpha
Entrepreneurial proclivity
Innovativeness
Risk taking
Proactiveness
3
6
9
9
0.38
0.60
1.25
0.73
82%
67%
57%
69%
0.86
0.76
0.66
0.78
0.86
0.90
0.91
0.94
Market orientation 9 0.91 62% 0.61 0.92
Environmental dynamics
Market dynamics
Competition1
Competition2
Technological
dynamics
3
3
2
4
0.77
0.95
0.45
0.77
60%
54%
78%
56%
0.64
0.37
0.88
0.64
0.66
0.53
0.71
0.73
1: before removing one item
2: after removing one item
All measures met the criteria stated above except risk taking and one item in the
competition scale. One item in the competition scale loaded very low (0.37) so it was

15
rejected. Risk taking had a second component’s Eigen value that was slightly larger than 1.
However, it met all other criteria so all items were maintained for further analysis.
4.3 Regression analysis and hierarchical linear modeling (HLM)
Regression analysis is a way of predicting an outcome variable from one (simple regression)
or several predictor variables (multiple regressions). Normally, regression is useful to test
causal-effect relationships.
Hierarchical linear modeling (HLM) is a more advanced form of simple regression
and multiple regressions because it allows testing outcome variable at multiple hierarchical
levels (Field, 2009; Raudenbush & Bryk, 2002). In this method, either the intercepts or
slopes, or both, vary across different contexts. It is appropriate to use with nested data.
In my data, farmers are nested in agricultural industries. For HLM method, 2-step
(level) regression is implemented.
This hierarchical linear modeling is represented in table 3 below.
Table 3. Hierarchical linear model regression
EP, MO and environmental dynamism
across industry
EP and environmental dynamism across
industry
Level 1 (Farm level)
MOij = b0jindustryj + b1jEPij + ij EPij = b2jindustryj + ij
Level 2 (Industry level)
[1] b0j = 00 + 01MDj + 02CDj + 03TDj + u0j
[2] b1j = 10 + 11MDj + 12CDj + 13TDj + v0j
[3] b2j = 20 + 21MDj + 22CDj +
23TDj + w0j
Combined model is
MOij = ( 00 + 01MDj + 02CDj + 03TDj +
u0j)*industryj + ( 10 + 11MDj + 12CDj
+ 13TDj + v0j)*EPij + ij
EPij = ( 20 + 21MDj + 22CDj + 23TDj
+ w0j)*industryj + ij
(With i = farmer, j = agricultural industry)
The first step (Level 1) corresponds to the farm level in which the relationship
between farmers and horticultural growers’ MO and EP is tested. The second step (Level 2)
corresponds to the agricultural industry level in which EP and industry’s coefficients are
explained by levels of three environmental dynamism’s components. In level 2, the effect of
industries and EP on farmer and horticultural growers’ MO might vary because each industry

16
has different environmental dynamism. Industry and EP variable are level-2 variables. The
relationship between environmental dynamism and EP is analyzed simultaneously and
similarly. However, for this relationship, only industry’s coefficients vary.
In this study, regression analysis and hierarchical linear modeling are applied
simultaneously to check each other’s results.

17
5. Results
Table 4 illustrates average scores for each environmental dynamism component (market
dynamics, competition and technological dynamics) of each agricultural industry (arable
farming, dairy farming, intensive livestock, greenhouse horticulture, and fruit orchards) based
on the assessment of 18 agricultural experts. Average scores of farmers and horticultural
growers’ EP and MO across industries are presented as well.
Table 4. Environmental dynamics, EP and MO’s average scores across agriculture
industries
Arable
farming
Dairy
farming
Intensive
livestock
Greenhouse
horticulture
(flowers
and plants)
Greenhouse
horticulture
(vegetables)
Fruits
orchards
Market
dynamics
2.55 2.35 2.53 4.08 3.57 3.29
Competition 3.33 2.86 3.83 3.89 4.06 3.53
Technological
dynamics
3.13 3 3.21 4.1 4.06 3.21
EP 4.20 3.89 4.00 4.13 4.08 4.20
MO 4.29 3.61 4.43 4.34 4.26 4.33
Running ANOVA analysis, it is showed that average scores between industries are
significantly different for market dynamics (F = 17.9, p < 0.05), competition (F = 4.18, p <
0.05), technological dynamics (F = 4.2, p < 0.05) and market orientation (F = 6.6, p < 0.05).
In contrast, EP (F = 1.6, p > 0.1) has no significant difference among industries. It is clearly
seen that EP’s average scores are similar (they vary in small range from 3.89 – 4.2).
Accordingly, regression [3] (in level 2 of the hierarchical regression) is not tested further; and
H1, H2, H3 are rejected as well.
For environment dynamism, market dynamics are higher in horticultural industries
(greenhouse and fruits horticulture) than farming industries (arable, dairy farming, and

18
intensive livestock). Competition in horticulture is more intensive than arable and dairy
farming. Technological dynamics are highest in greenhouse horticulture while lowest in dairy
farming. Dairy farming also gets lowest scores (3.61) for MO while others varies from 4.29
to 4.43. In general, horticultural growers get highest scores while dairy farmers get lowest
scores for all of environment components, MO and EP.
For testing hypothesis H4, H5, H6 and H7, two models are examined. First model
included EP as independent variable while second model added MD, CD, and TD as more
three independent variables. Table 5 provides the results of ordinary least squares (OLS)
regression of MO on market dynamics (MD), competition (CD), technological dynamics
(TD), and entrepreneurial proclivity (EP).
Initial model is able to predict MO but the second model (with extra MD, CD, TD) is
even better because Fchange (Fchange = 11.05) is significant (p = 0.00). Competition has a
positive influence on farmers and horticultural growers’ MO (b = 0.944, p = 0.000) in line
with hypothesis 5. Similarly, entrepreneurial proclivity is positively and directly related to the
level of market orientation (b = 0.554, p = 0.000). Hence, hypothesis 7 is confirmed.
Table 5. Relationship between Environmental dynamism/EP and MO
MO Model 1
MO Model 2
EP 0.572** 0.554**
Fchange = 11.05
p = 0.00*
MD - 0.381 n.s
CD - 0.944**
TD - - 0.987*
R2 0.223 0.266
F 164.615** 51.606**
N 575
* = p< 0.05; ** = p< 0.1; n.s. = not significant p > 0.1
However, market dynamics (MD) show no effect on MO, which rejects hypothesis 4.
Hypothesis 6 is also rejected. Although technological dynamics (TD) have a relationship to
market orientation, it has a negative influence on MO of farmers and horticultural growers (b
= - 0.987, p = 0.095), which contradicts hypothesis 6. Moreover, examining VIF values in
multicollinearity diagnostics shows that there is no multicollinearity among CD (VIF = 3.17),
EP (VIF = 1.01), and TD (VIF = 3.16). Based on standardized coefficients, Competition

19
(bstandardized = 0.314, p = 0.000) has less influence on MO compared to EP (bstandardized = 0.554,
p = 0.000).
Before accepting these results, hierarchical linear model is done simultaneously
through 2-level regression.
In level 1, through block regression two models are examined with MO as dependent
variable. First model included independent EP variable while second model added 6
agricultural industries as more independent variables. Agricultural industries are dummies so
dairy farming was chosen as baseline category.
The results from table 6 show ordinary least squares (OLS) regression of MO on EP
and agricultural industries. Both model 1 and model 2 are significant, model 2 with added
variables is better because Fchange (Fchange = 6.89, p = 0.00) is significant and EP (b = 0.551, p
= 0.00) has significantly positive relationship with MO, which confirms hypothesis H7.
4/5 industries (except fruit orchards) have significant t-tests. It means that these
industries are more market oriented than dairy industry. Therefore in level 2, industry’s
coefficients might vary and should be tested (Regression [1]).
Table 6. Level 1 – Effect of EP and different agricultural industries on MO
MO Model 1
MO Model 2
EP 0.572** 0.551**
Fchange = 6.89
p = 0.00
Arable farming - 0.504**
Intensive livestock - 0.760**
Greenhouse horticulture (flowers and plants) - 0.599**
Greenhouse horticulture (vegetables) - 0.543**
Fruit orchards - 0.553, p=0.18n.s
R2 0.223 0.268
F 164.615** 34.585**
N 575
** = p < 0.05; * = p < 0.1; n.s. = not significant p > 0.1
However, it was unclear whether there was interaction between EP and the
agricultural industries so 5 interaction (EP- industry) variables were created and put in other
regression models. Similar to previous block regression, 2 models are tested with MO as
dependent variable. Model 1 has EP and industry dummies as independent variables while
20
model 2 added 5 interaction variables. Again, dairy farming was decided as baseline
category.
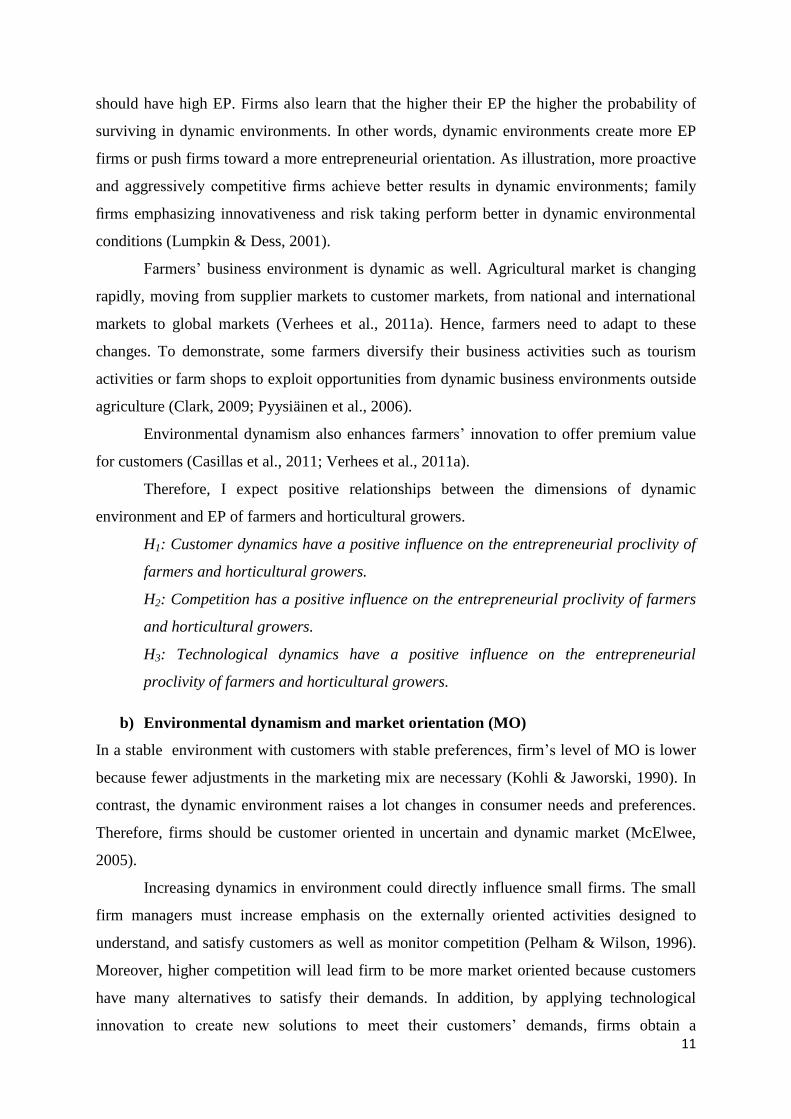
Table 7 shows results of ordinary least squares (OLS) regression of MO on
entrepreneurial proclivity (EP), agricultural industries and EP - industry interactions. Both
models have ability to predict outcome variable (MO) but the first model is better because
Fchange (Fchange = 1.29, p=0.27 > 0.1) is not significant. Therefore, the influence of EP on MO
does not vary across different agricultural industries and regression [2] is not tested in level 2.
Table 7. Interaction between EP and agricultural industries
MO Model 1
MO Model 2
EP 0.551** 0.450**
Arable farming 0.504** 0.153, p=0.77n.s
Intensive livestock 0.760** 0.189, p=0.71n.s
Greenhouse horticulture (flowers and plants) 0.599** - 0.237, p=0.72n.s
Greenhouse horticulture (vegetables) 0.543** - 0.882, p=0.18n.s
Fruit orchards 0.553, p=0.18n.s
- 0.663, p=0.72n.s
EP x Arable farming 0.091, p=0.45n.s
EP x Intensive livestock 0.146, p=0.24n.s
EP x Greenhouse horticulture (flowers and plants) 0.208, p=0.17n.s
EP x Greenhouse horticulture (vegetables) 0.354*
EP x Fruit orchards 0.297, p=0.5n.s
R2 0.268 0.276
F 34.585** 19.499**
N 575
** = p< 0.05; * = p< 0.1; n.s. = not significant
Next, regression [1] of level 2 is conducted. In this level, industry’s coefficients are
predicted by three environmental dynamism’s components.

21
Table 8. Level 2 - Effect of different environmental dynamism on MO across industries
Agricultural industries’ coefficients
MD 0.129 n.s
CD 0.815 *
TD - 0.535 n.s
R2 0.911
F 6.799 n.s
N 6
** = p< 0.05; * = p< 0.1; n.s. = not significant
Table 8 provides ordinary least squares (OLS) regression of Agricultural industries’
coefficients on market dynamics (MD), competition (CD) and technological dynamics (TD).
Only competition (CD) has significantly positive relationship (b = 0.815, p = 0.05) with MO.
This result shares similarity to the previous multiple regressions, which confirms hypothesis
H5.

22
6. Conclusion
This chapter summarizes the results. It also gives conclusion to the research problem and
research hypotheses.
In this study, 7 hypotheses are tested. For hypothesis 1 to 6 (H1- H6), it is assumed
that 3 dimensions of environmental dynamism have positive influence on Dutch farmers’ MO
and EP while the last hypothesis assumed that Dutch farmers’ EP has a positive influence on
the MO.
According to data analysis, Customer dynamics, Competition, and Technological
dynamics do not have any influence on farmers and horticultural growers’ EP. Similarly,
Customer dynamics have no influence on the MO. Therefore, hypotheses H1-H4 are rejected.
Hypothesis H5, which hypothesized that Competition has a positive influence on the
farmers and horticultural growers’ MO, is confirmed. Thus a change in competition in
environmental dynamism leads to a change in MO in the same direction. Likewise,
hypothesis H7 is confirmed that changing in the Dutch farmers and horticultural growers’ EP
is associated with changing in MO in the same direction.
Although Hypothesis H6 is rejected, it reveals another side of the relationship between
Technological dynamics and MO. Technological dynamics have negative influence on MO.
Consequently, a change in technological dynamics leads to an inverse change in market
orientation.
In short, this empirical study examined the relationships among three underlying
components of environmental dynamism (market dynamics, competition and technological
dynamics), on Dutch farmers and horticultural growers’ EP, and MO. Seven hypotheses are
tested but only 2 hypotheses are confirmed. EP and competition have positive effects on MO.
One hypothesis, however, got reverse result. Technological dynamics have a negative
relationship with MO.
Answering to research problem stated in chapter 1 (Introduction), Dutch farmers’ EP
is not shaped by environmental dynamism. In contrast, their MO is shaped by two of three
environmental dynamism’s elements, which are competition and technological dynamics, in
different directions. While more intensive competition in the market brings more market
orientation of Dutch farmers and horticultural growers, increase of technological dynamics in
environment dynamism decreases level of their market orientation. Simultaneously, EP also
enhances the level of their market orientation. The more entrepreneurial Dutch farmers get,

23
the more market oriented they are. With EP, firms become more proactive, risk taking and
innovative in creating superior values that meet customers’ needs. Hence, this leads firms to
be more market orientation.
Figure 2 below summarizes the study results.
Figure 2. Hypotheses testing result
Competitive Dynamics
Technological dynamics
Entrepreneurial Proclivity
Market Orientation
+
+_
24
7. Discussion
This chapter presents limitation, managerial and practical implications of the findings in
previous chapter. Suggestion for further research is also included.
7.1 Limitation
This study only classified Dutch farms into some main types as arable farming, dairy
farming, intensive livestock, greenhouse horticulture, and fruit orchards. However, more
specific classification should be needed within the main types. Because each agricultural
subtype operates in different environments, it might lead to different farmers and horticultural
growers’ MO and EP. The subtypes will provide better understanding for the relationship
between the environmental dynamics, farmers and horticultural growers’ MO and EP. They
also provide more data for analyze specific differences among industries. Moreover, they
enhance power of statistical analysis because with only 6 industries, level 2 of hierarchical
regression method has limited degree of freedom.
7.2 Implication for the literature
The result of this study is in line with the finding of Matsuno (Matsuno et al., 2002) which
investigated 364 U.S. manufacturing companies. Although the sample sizes and research
contexts are different, both researches share similar results that EP has positive influence on
MO. In particular, this research contributes to entrepreneurial and market oriented knowledge
for Dutch agricultural study.
For competition, the finding shows that there is a direct relationship between
environment and MO. Due to an increasing number of international competitors in the free
market, satisfying customers better than competitors is firms’ compulsory strategic option.
Under high intensive competition, firms face more challenge to keep their customers or steal
them from competitors (Jaworski & Kohli, 1993).
Across 6 agricultural industries, dairy farming has lowest score of MO and
environmental dynamism. A possible explanation is that dairy farming always gets most
subsidies from CAP many years1. Switching to free market products is really a new
phenomenon for dairy farmers due to long time working under market protection, while
horticultural and intensive livestock farmers get used to running a non-subsidized farm
business (Wolf & Schoorlemmer, 2007). Moreover, dairy farmers are not familiar with
market orientation and marketing activities because they are outsourcing marketing activities
1 http://www.farmsubsidy.org/NL/scheme/?page=1

25
to a few large dairy cooperatives (e.g. Friesland Campina). Therefore, dairy farmers
compared to others do not have much powerful motivation to be more market oriented which
focuses on customer and market demands. On the contrary, farmers who do not work in
protected industries, have to react to competition by themselves, try to reach their customers,
exploring customers’ needs and satisfy them.
The result of relationship between technological dynamics and market orientation is
somewhat surprising because it contradicts the hypothesis. Turning to Dutch farm
characteristics, Dutch farm is normally small and family-owned with a few working people
on farm. Number of farmers working has been decreasing over years (Wolf & Schoorlemmer,
2007). Hence, they have to manage everything on the farm such as growing, harvesting,
feeding cattle, and selling farm products; and have limited time and labor to focus
simultaneously on technological innovation and market orientation. Consequently, they have
to choose one of two business strategic options to invest time and labor. In addition, it is
noted that only 12.9% of farmers are younger than 40 years old, 66.7% are in range of 40-64
years old and 20.4% are older than 64 years old. Older farmers, on the one hand, have more
experience than others; on the other hand, they are more conservative to new things and
tightly bound to traditions (Wolf & Schoorlemmer, 2007). For these possible reasons, higher
changes of technology in agricultural business environment decrease level of farmers and
horticultural growers’ MO.
7.3 Implication for practice
In the Netherlands, the triangular relationship among the government, farm and agricultural
university (Food Valley2 in Wageningen is an illustration) has been in existence for over
years. This relationship was established through the Dutch OVO system (Research, Extension
and Education). The OVO system has built the Dutch agricultural knowledge infrastructure
for decades and used to be a key element for the success of Dutch agriculture. However, this
system tends to be weakened due to the new concerns, options and priorities such as
ecological and environmental concerns. Accordingly, a trajectory privatization of research
and extension institutions have been developing (Leeuwis et al., 2006). Currently, some large
corporations that specialize in agriculture either have their own research center e.g. Nestle,
Unilever, Heinz or Heineken, or have engaged with some independent R&D centers
(outsource R&D). Conversely, farmers and horticultural growers cannot afford their own
2 http://www.foodvalley.nl/English/default.aspx

26
researches. In order to help small farms improve both MO and innovative technology, an
effective agricultural social-economical-technical network needs to be implemented and
developed among all stakeholders such as decision makers, farmer, scientists, public
organizations, etc. Last but not least, the government should have suitable policy to bridge
distance between farms and research laboratory.
The innovation results from laboratory must be practical and applicable so that
farmers can produce innovative products for their agribusiness. Additionally, researchers in
R&D centers and farmers should have a powerful cooperation in exploring and fulfilling
requirements of the market. For instance, transgenic potato breeding was introduced a few
years ago in the Netherlands. For farmers, this research brings lower pesticide cost but higher
starting material costs3. Moreover, its growth depends on public acceptance mostly derived
from environmental and consumer organizations. Environmental organization considers its
long term environmental impact while consumer organization worries about its safety for
human consumption.
EP, which has positive impact on MO, can be enhanced by entrepreneurial skill
training courses. In addition to professional and management skills equipping farmers how to
manage farms, some important entrepreneurial skills should be provided through education.
These entrepreneurial skills are opportunities recognizing, strategic developing, cooperating
and networking skills. They are not only necessary for farmers to identify both existing and
new opportunities in the market, but also find ways to develop and improve a profitability
business (Wolf & Schoorlemmer, 2007).
Farmers’ market orientation is also influence positively by changing of competition in
dynamic environment. Recognizing the changes in time is very important with farmers.
Therefore, an appropriate vocational education programs or consultative service help
enterprise to set right goals in right times. Accordingly, farmers and horticultural growers
should be provided more business knowledge skills and marketing tools to respond with the
changing of competition. Moreover, training programs in entrepreneurship may support
farmers in seizing the opportunities created by environment changes to compete with others.
E-learning is a very good way of distance learning to support farmer in their study. Internet
also provides up-to-date competitor information for them (Ban, 2002).
3 http://www.accessexcellence.org/RC/AB/BA/Potatos_in_Netherlands.php

27
For dairy farms in future, dairy farmers should improve MO if they do not want to
depend on the cooperatives anymore, or follow differentiation strategy (e.g. organic farmers
or farmers who sell their products directly to the consumers). One way of improving MO is
improving entrepreneurial competency which can be developed through the use of study
groups as training program (Bergevoet & Woerkum, 2006).
7.4 Suggestions for further research
For industry classification, more dominant and specific agricultural subtypes should be
distinguished and analyzed in details. A detail classification digs up further information on
farmers’ behavior and its relationship with the environment. For example, intensive livestock
can be divided into pig, veal, chicken, egg; arable farming divided into different crop
rotations; and dairy farming divided into organic and regular milk.
In the methodology, this study is cross sectional which is not suitable enough to test
the causal-effect relationships in the conceptual model. Thus an experimental or time series
research design could test the causality of these relationships better.

28
References
Aldrich, H. E., & Pfeffer, J. 1976. Environments of Organizations. Annual Review of
Sociology, 2(ArticleType: research-article / Full publication date: 1976 / Copyright ©
1976 Annual Reviews): 79-105.
Amit, R., Glosten, L., & Muller, E. 1993. CHALLENGES TO THEORY DEVELOPMENT
IN ENTREPRENEURSHIP RESEARCH*. Journal of Management Studies, 30(5):
815-834.
Atuahene-Gima, K., & Ko, A. 2001. An Empirical Investigation of the Effect of Market
Orientation and Entrepreneurship Orientation Alignment on Product Innovation.
Organization Science, 12(1): 54-74.
Baird, I. S., & Thomas, H. 1985. Toward a Contingency Model of Strategic Risk Taking. The
Academy of Management Review, 10(2): 230-243.
Ban, v. d. A. W. 2002. Increasing the ability of farmers to compete in the market. The
Journal of Agricultural Education and Extension, 8(2): 101-106.
Barringer, B. R., & Bluedorn, A. C. 1999. The relationship between corporate
entrepreneurship and strategic management. Strategic Management Journal, 20(5):
421-444.
Baumol, W. J. 1986. Entrepreneurship and a century of growth. Journal of Business
Venturing, 1(2): 141-145.
Bergevoet, R. H. M. 2005. Entrepreneurship of Dutch dairy farmers. PhD-Thesis
Wageningen University
Bergevoet, R. H. M., Ondersteijn, C. J. M., Saatkamp, H. W., van Woerkum, C. M. J., &
Huirne, R. B. M. 2004. Entrepreneurial behaviour of dutch dairy farmers under a milk
quota system: goals, objectives and attitudes. Agricultural Systems, 80(1): 1-21.
Bergevoet, R. H. M., & Woerkum, C. V. 2006. Improving the Entrepreneurial Competencies
of Dutch Dairy Farmers through the Use of Study Groups. The Journal of
Agricultural Education and Extension, 12(1): 25-39.
Casillas, J. C., Moreno, A. M., & Barbero, J. L. 2011. Entrepreneurial orientation of family
firms: Family and environmental dimensions. Journal of Family Business Strategy,
2(2): 90-100.
Certo, S. T., Moss, T. W., & Short, J. C. 2009. Entrepreneurial orientation: An applied
perspective. Business Horizons, 52(4): 319-324.

29
Clark, J. 2009. Entrepreneurship and diversification on English farms: Identifying business
enterprise characteristics and change processes. Entrepreneurship and Regional
Development, 21(2): 213-236.
Commission, P. 2002. Report of the Policy Commission on the Future of Farming and Food.
UK.
Davis, D., Morris, M., & Allen, J. 1991. Perceived Environmental Turbulence and Its Effect
on Selected Entrepreneurship, Marketing, and Organizational Characteristics in
Industrial Firms. Journal of the Academy of Marketing Science, 19(1): 43-51.
De Lauwere, C. C. 2005. The role of agricultural entrepreneurship in Dutch agriculture of
today. Agricultural Economics, 33(2): 229-238.
Deshpandé, R., & Farley, J. U. 1998. Measuring Market Orientation: Generalization and
Synthesis. Journal of Market-Focused Management, 2(3): 213-232.
Deshpandé, R., Farley, J. U., & Webster, F. E., Jr. 1993. Corporate Culture, Customer
Orientation, and Innovativeness in Japanese Firms: A Quadrad Analysis. The Journal
of Marketing, 57(1): 23-37.
Dess, G. G., & Beard, D. W. 1984. Dimensions of Organizational Task Environments.
Administrative Science Quarterly, 29(1): 52-73.
European-Commission. 2000. The European Observatory for SMEs: Sixth Report, European
Commission. Luxembourg.
Field, A. 2009. Discovering statistics using SPSS: Sage Publications ltd.
Grinstein, A. 2008. The relationships between market orientation and alternative strategic
orientations - A meta-analysis. European Journal of Marketing, 42(1-2): 115-134.
Hair, J. F., W.F.Black, B,J.Babin, and R.E. Anderson. 2010. Multivariate data analysis: a
global perspective: Pearson, Upper Saddle River, N,J.
Hamel, G. 2000. Leading the revolution. Cambridge, MA: Harvard University Press.
Jaworski, B. J., & Kohli, A. K. 1993. Market Orientation: Antecedents and Consequences.
The Journal of Marketing, 57(3): 53-70.
Kirca, A. H., Jayachandran, S., & Bearden, W. O. 2005. Market Orientation: A Meta-
Analytic Review and Assessment of Its Antecedents and Impact on Performance. The
Journal of Marketing, 69(2): 24-41.
Knudson, W., Wysocki, A., Champagne, J., & Peterson, H. C. 2004. Entrepreneurship and
Innovation in the Agri-Food System. American Journal of Agricultural Economics,
86(5): 1330-1336.
30
Kohli, A. K., & Jaworski, B. J. 1990. Market Orientation: The Construct, Research
Propositions, and Managerial Implications. The Journal of Marketing, 54(2): 1-18.
Kyriakopoulos, K., & Moorman, C. 2004. Tradeoffs in marketing exploitation and
exploration strategies: The overlooked role of market orientation. International
Journal of Research in Marketing, 21(3): 219-240.
Leeuwis, C., Smits, R., Grin, J., Klerkx, L. W. A., Mierlo, B. C. v., & Kuipers, A. 2006.
Equivocations on the post privatization dynamics in agricultural innovation systems,
The design of an innovation-enhancing environment.: Transforum Agro & Groen.
Lumpkin, G. T., & Dess, G. G. 1996. Clarifying the Entrepreneurial Orientation Construct
and Linking It to Performance. The Academy of Management Review, 21(1): 135-
172.
Lumpkin, G. T., & Dess, G. G. 2001. Linking two dimensions of entrepreneurial orientation
to firm performance: The moderating role of environment and industry life cycle.
Journal of Business Venturing, 16(5): 429-451.
Matsuno, K., Mentzer, J. T., & Özsomer, A. 2002. The Effects of Entrepreneurial Proclivity
and Market Orientation on Business Performance. The Journal of Marketing, 66(3):
18-32.
McElwee, G. 2005. A Literature review of entrepreneurship in agriculture Developing
entrepreneurial skills of farmers Vol. D2: 78: University of Lincoln
Miller, D. 1983. The Correlates of Entrepreneurship in Three Types of Firms. Management
Science, 29(7): 770-791.
Miller, D. 1987a. Strategy Making and Structure: Analysis and Implications for Performance.
The Academy of Management Journal, 30(1): 7-32.
Miller, D. 1987b. The structural and environmental correlates of business strategy. Strategic
Management Journal, 8(1): 55-76.
Miller, D., & Friesen, P. H. 1978. Archetypes of Strategy Formulation. Management
Science, 24(9): 921-933.
Narver, J. C., & Slater, S. F. 1990. The Effect of a Market Orientation on Business
Profitability. The Journal of Marketing, 54(4): 20-35.
O'Dwyer, M., Gilmore, A., & Carson, D. 2009. Innovative marketing in SMEs. European
Journal of Marketing, 43(1/2): 46 - 61.
Ondersteijn, C. J. M., Giesen, G. W. J., & Huirne, R. B. M. 2006. Perceived environmental
uncertainty in Dutch dairy farming: The effect of external farm context on strategic
choice. Agricultural Systems, 88(2-3): 205-226.

31
Pelham, A., & Wilson, D. 1996. A longitudinal study of the impact of market structure, firm
structure, strategy, and market orientation culture on dimensions of small-firm
performance. Journal of the Academy of Marketing Science, 24(1): 27-43.
Pelham, A. M. 1999. Influence of Environment, Strategy, and Market Orientation on
Performance in Small Manufacturing Firms. Journal of Business Research, 45(1):
33-46.
Phillipson, J., Gorton, M., Raley, M., & Moxey, A. 2004. Treating farms as firms? The
evolution of farm business support from productionist to entrepreneurial models.
Environment and Planning C-Government and Policy, 22(1): 31-54.
Pyysiäinen, J., Anderson, A., McElwee, G., & Vesala, K. 2006. Developing the
entrepreneurial skills of farmers: some myths explored. International Journal of
Entrepreneurial Behaviour & Research, 12(1): 21-39.
Rauch, A., & Frese, M. 2009. Entrepreneurial Orientation. In A. Bausch, & B. Schwenker
(Eds.), Handbook Utility Management: 89-103: Springer Berlin Heidelberg.
Rauch, A., Wiklund, J., Lumpkin, G., & Frese, M. 2009. Entrepreneurial Orientation and
Business Performance: An Assessment of Past Research and Suggestions for the
Future. Entrepreneurship Theory and Practice, 33(3): 761-787.
Raudenbush, S. W., & Bryk, A. S. 2002. Hierarchical Linear Models: Applications and
Data Analysis Methods: Sage Publication, Inc.
Rodriguez Cano, C., Carrillat, F. A., & Jaramillo, F. 2004. A meta-analysis of the relationship
between market orientation and business performance: evidence from five continents.
International Journal of Research in Marketing, 21(2): 179-200.
Schindehutte, M., Morris, M. H., & Kocak, A. 2008. Understanding Market-Driving
Behavior: The Role of Entrepreneurship. Journal of Small Business Management,
46(1): 4-26.
Shane, S., & Venkataraman, S. 2000. The Promise of Enterpreneurship as a Field of
Research. The Academy of Management Review, 25(1): 217-226.
Venkatraman, N. 1989. Strategic Orientation of Business Enterprises: The Construct,
Dimensionality, and Measurement. Management Science, 35(8): 942-962.
Verhees, F. J. H. M., Kuipers, A., & Klopcic, M. 2011a. Entrepreneurial proclivity and farm
performance. The cases of Dutch and Slovenian farmers. International Journal of
Entrepreneurship and Small Business, 12(3): 169-177.
Verhees, F. J. H. M., Lans, T., & J.A.A.M, V. 2011b. Entrepreneurial proclivity Market
orientation and Performance of Dutch Farmers and Horticulturalists. Paper

32
presented at the EAAE 2011 Congress change and Uncertainty, ETH Zurich, Zurich,
Switzerland.
Wiklund, J., & Shepherd, D. 2003. Knowledge-based resources, entrepreneurial orientation,
and the performance of small and medium-sized businesses. Strategic Management
Journal, 24(13): 1307-1314.
Wiklund, J., & Shepherd, D. 2005. Entrepreneurial orientation and small business
performance: a configurational approach. Journal of Business Venturing, 20(1): 71-
91.
Wolf, P. d., & Schoorlemmer, H. 2007. Exploring the Significance of Entrepreneurship in
Agriculture, Developing Entrepreneurial Skills of Farmers, Vol. 3: 131. Frick,
Switzerland: Research Institute of Organic Agriculture.
Zahra, S. A. 1993. Environment, corporate entrepreneurship, and financial performance: A
taxonomic approach. Journal of Business Venturing, 8(4): 319-340.

33
Appendix A
Measurement statement used in the questionnaire for each element
Innovativeness
1. If I see opportunities, I am willing to start activities that are new to me
2. I look for opportunities to work on something new
3. If I see opportunities, I am good at starting activities that are new to me
4. I see opportunities to work on something new
5. If I see opportunities, I start activities that are new to me
6. I am always working on something new
Risk taking
1. If I see opportunities, I am willing to take great risks (with chances for very high profits)
2. I want to have the courage to seize opportunities
3. If I see opportunities, I am good at taking great risks (with chances for very high profits)
4. I belief I have to take great financial risks to seize opportunities
5. I can have the courage to seize opportunities
6. I know how to take great financial risks to seize opportunities
7. If I see opportunities, I am starting to take great risks (with chances for very high profits)
8. I have the courage to seize opportunities
9. I take great financial risks to seize opportunities
Proactiveness
1. I am willing to start activities that other firms do not do, yet
2. If I see opportunities, I like to respond before other firms do
3. If there are opportunities, I belief I have to be one of the first firms to use them
4. I am good at starting activities that other firms do not do, yet
5. If I see opportunities, I can respond before other firms do
6. If there are opportunities, I know how I can be one of the first firms to use them
7. I start activities that other firms do not do, yet
8. If I see opportunities, I respond before other firms do
9. If there are opportunities, I am one of the first firms to use them
Market Orientation
1. I regularly ask my customers whether they are satisfied
2. I regularly check whether my products correspond with what my customers want
3. I try to find out what my customers want in the future
4. I understand my customers’ problems

34
5. I know what other customers than my current customers (i.e. potential customers) want
6. I know where and to whom my customers sell their products
7. I have information about the consumers of my products
8. I know how societal trends influence my firm
9. I regularly check whether it’s better to sell my products to another customer than my
current customer
Market dynamics
1. Customer wishes constantly change.
2. Customers constantly search for new products.
3. At one time customers are very price sensitive and next time they are not.
4. Firms in this industry constantly supply the same customers.
Competition
1. Competition is killing
2. Everything a company can deliver can almost immediately be delivered also by another
company.
3. Competition is mainly focused on price.
Technological dynamics
1. Technology is changing fast
2. Technological advances offer great opportunities
3. Technological advances offer great opportunities for new products
4. Technological advances are not spectacular


![In Perfect Shape: Certifiably Optimal 3D Shape ......ing graduated non-convexity [3]. The resulting algorithm, named Shape#, is robust against 70% outliers and does not require an](https://static.fdocuments.in/doc/165x107/5f6c11534a676641c836ca0b/in-perfect-shape-certifiably-optimal-3d-shape-ing-graduated-non-convexity.jpg)