Does the Quality of the Judiciary Shape Economic Activity...
48
Does the Quality of the Judiciary Shape Economic Activity? Evidence from India. ∗ Matthieu Chemin † Department of Economics, LSE October 11, 2004 Abstract There were 3.1 million cases pending in India’s 21 High Courts and 20 million in its subordinate courts in 2000. This paper examines the consequences of a slow ju- diciary on the contracting behaviour of firms in India. I develop a game theoretical model which allows me to study how the judiciary’s efficiency affects the contract- ing behaviour of firms. I then examine how the case pendency rate in state courts in India affects the contracting behaviour of 170,000 small non-agricultural informal firms from the 55th round of the National Sample Survey of 2000. My estimates suggest that a slow judiciary implies more breaches of contract, discourages firms from undertaking relationship-specific investments, impedes the access of firms to formal financial institutions, and favours inefficient dynasties. The negative impli- cations of having an inefficient judiciary are large - moving a firm from the highest to the lowest pendency state would result in a 10% improvement in firm perfor- mance. Keywords: Law and economics, Institutions, Courts, Contracts, Industrial Organisation, Economic Growth, Industrial Performance JEL Classification: K0, K12, K40, K42,O12, O17, L14, D23, C72. ∗ I am indebted to my advisors Robin Burgess and Tim Besley for their many comments and fine guidance. I would like to thank Wolfgang Koehling for his kind help, Francesco Caselli, Simeon Djankov, Maitreesh Ghatak, Markus Goldstein, Juan Ramon De Laiglesia, the participants of LSE/EOPP semi- nars for numerous useful comments. Financial support form ESRC, STICERD, Royal Economic Society is gratefully acknowledged. I would also like to thank the National Sample Survey Organisation for providing the data. † Correspondence: London School of Economics, Houghton Street, London WC2A 2AE, United Kingdom. Email adress: [email protected] 1
Transcript of Does the Quality of the Judiciary Shape Economic Activity...

Does the Quality of the Judiciary Shape EconomicActivity? Evidence from India.∗
Matthieu Chemin†
Department of Economics, LSE
October 11, 2004
Abstract
There were 3.1 million cases pending in India’s 21 High Courts and 20 million inits subordinate courts in 2000. This paper examines the consequences of a slow ju-diciary on the contracting behaviour of firms in India. I develop a game theoreticalmodel which allows me to study how the judiciary’s efficiency affects the contract-ing behaviour of firms. I then examine how the case pendency rate in state courts inIndia affects the contracting behaviour of 170,000 small non-agricultural informalfirms from the 55th round of the National Sample Survey of 2000. My estimatessuggest that a slow judiciary implies more breaches of contract, discourages firmsfrom undertaking relationship-specific investments, impedes the access of firms toformal financial institutions, and favours inefficient dynasties. The negative impli-cations of having an inefficient judiciary are large - moving a firm from the highestto the lowest pendency state would result in a 10% improvement in firm perfor-mance.Keywords: Law and economics, Institutions, Courts, Contracts, Industrial
Organisation, Economic Growth, Industrial PerformanceJEL Classification: K0, K12, K40, K42,O12, O17, L14, D23, C72.
∗I am indebted to my advisors Robin Burgess and Tim Besley for their many comments and fineguidance. I would like to thank Wolfgang Koehling for his kind help, Francesco Caselli, Simeon Djankov,Maitreesh Ghatak, Markus Goldstein, Juan Ramon De Laiglesia, the participants of LSE/EOPP semi-nars for numerous useful comments. Financial support form ESRC, STICERD, Royal Economic Societyis gratefully acknowledged. I would also like to thank the National Sample Survey Organisation forproviding the data.
†Correspondence: London School of Economics, Houghton Street, London WC2A 2AE, UnitedKingdom. Email adress: [email protected]
1

1 Introduction
In this paper, I examine both theoretically and empirically whether the quality of thejudicial system has implications for the contracting behaviour and economic performanceof firms. Standard neoclassical economics assumes that the judiciary is perfect, fair,immediate. There always exists a set of prices such that contracting can achieve Paretoefficiency, as in the First Welfare Theorem. It is therefore not clear from a theoreticalstandpoint why the quality of the judiciary impacts on the economy.Indeed even if the judiciary is defective, a number of recent papers have suggested
that informal mechanisms of contract enforcement might fill the gap. An efficient judicialsystem is still a rarity in the developing world although business has been conductedfor a very long time. Greif (1993) in particular presents an example of an informalinstitution, a coalition of Maghribi traders from the 11th century, where the commitmentproblem is surmounted by a multilateral punishment mechanism. A series of theoreticalpapers try to explain the stylised fact of relational contracting in a business networkas an endogenous response to an inadequate legal framework. Kranton (1996) developsan explanation of reciprocal exchange as a self-sustaining system. Dixit (2003) builds amodel about self-governance as an alternative to official law. Even if people do not createbusiness networks to avoid a clogged judiciary, they could resort to settlements beforeeven using the judiciary. This group of papers suggest that informal contract enforcementmight mitigate the impact that courts may have in shaping economic activity.A number of recent papers, however, suggest that institutions may exert a funda-
mental impact on the contracting behaviour of firms and hence on aggregate economicperformance. Knack and Keefer (1995) relate some professional country risk measuresprovided by business experts to their measure of the quality of the judiciary which isthe amount of contract-intensive money (the difference between M2 and cash). Theintuition is that in a country with a better judiciary, we should see more complicatedcontracts involving that type of money. However, there is a problem of endogeneity:richer countries can afford better institutions. Three papers deal with the endogeneityof the institutions using an instrumental variables approach. Mauro (1995) instrumentscorruption with ethno-linguistic fragmentation. Hall and Jones (1999) use distance fromthe equator as an instrument for social infrastructure because, they argue, latitude iscorrelated with "western influence", which leads to good institutions. Finally, Acemogluet al (2001) use differences in the mortality rates faced by European colonialists to esti-mate the effect of institutions on economic performance. The intuition is that in placeswhere Europeans faced high mortality rates, they could not settle and were more likelyto set up extractive institutions. These institutions persisted to the present. They findthat the risk of expropriation, instrumented by settler’s mortality, negatively affectseconomic growth today in a cross section countries.To date, the literature on the links between institutions, contract enforcement and
economic performance has been largely macroeconomic. In contrast, I try to move
2
this literature in a more microeconomic direction. I focus on one specific measure ofinstitutional quality, the speed of the judiciary, which I can evaluate in an objectivefashion. I then examine how this measure affects the contracting behaviour and theeconomic performance in a large representative sample of small non-agricultural firmsin India. This dataset is unique in the sense that an array of questions are askedof firm owners concerning breaches of contract, nature of the contracts signed, accessto credit, corporate ownership. This type of information is typically not available infirm-level datasets. Also, by working within a single country, I am able to controlfor a range of factors and influences which cannot be as convincingly controlled forin cross country data. In this sense, my paper is in the spirit of recent papers whichexploit policy differences across Indian states. Besley and Burgess (2004), for example,examine how differences in the industrial relations climate across Indian states affectsmanufacturing performance. However, in my case, I have disaggregated information onboth the contracting behaviour and performance of small firms in India.The structure of this paper is as follows. Section 2 explores the channels through
which the quality of the judiciary impacts on firms’ economic performance. I introduceexplicitly the role of the judiciary in simple models of four prominent aspects in the lifeof a firm: breaches of contract, use of relationship-specific investments, access to creditmarkets and corporate ownership. Section 3 provides a background on the functioningof the judiciary in India and on the 55th round of the National Sample Survey of Indiaon non-agricultural informal enterprises. Section 4 presents my method, and resultspertaining to the contracting behaviour of firms. Section 5 discusses the effects on theperformance of firms. Section 6 concludes.
2 Theory
2.1 Breaches of Contract
The first intuitive consequence of an imperfect judiciary would be the modification ofthe willingness of economic agents to cooperate in a previously signed contract. Weknow that the judiciary acts as an important deterrent to any fraud that might bemore economically attractive in the short run. The probability of a harsh punishment inmonetary or non-monetary terms would heavily dissuade opportunistic agents to defaultex-post on a previous agreement.However, that seemingly simple result calls for some explanation. Indeed, the neo-
classical framework guarantees that a contract will not be signed if a breach of contractis expected. An even more insightful result states that it is possible to find a price suchthat both agents will find it profitable to cooperate, if not in the short run at least in thelong run. The endogeneity of the price makes it even possible for two economic agentsto take into account the quality of the judiciary. For example, it is often claimed that if
3

the judiciary is very slow and, as a consequence, the probability of compensation in theevent of a breach of contract distant in time, the seller of a good could ask for a mark-upon the price to reward his risk-taking attitude. The judiciary becomes then irrelevant,at least as the number of breaches of contract are concerned.The flaw in the above reasoning resides in the implicit assumption that the agents
have perfect information about their partners, in particular about their tastes concerningthe future. In a repeated game framework, if the seller knows the tastes of his partnerconcerning the future, he can suggest the price that will give him an incentive to coop-erate. However, if partners are matched randomly in an anonymous market and if thereis imperfect information, then breaches of contract might occur.It is interesting to formalise this idea with a simple game theoretic model. In order to
analyse the consequences of a slow judiciary on the contracting behaviour of economicagents, we have to model the sensitivity to time of any agent. An agent who doesnot foresee the consequences of his present actions is likely to be insensitive to anypunishment from a third party that might happen at a distant time. A key parameterin our model will therefore be the intertemporal discount factor δ of agents.Consider a trade relationship between two agents, a buyer and a seller. These two
individuals are playing a typical Prisoner’s Dilemma game. A good is traded, of valuationvs to the seller and vb to the buyer. The two players have two possible strategies: C willdenote cooperation (payment for the buyer, delivery for the seller) and D indicates adeviant behaviour (non-payment after delivery for the buyer, non-delivery after paymentfor the seller). We also consider that agents are risk-neutral. In the event of a default,the agent can sue his partner and regain a fraction φ of the price p of the good1. Thisfraction φ is a measure of the speed of the judicial system and a value close to 1 indicatesa very speedy judiciary (see appendix for proof). The payoffs for this game are therefore:
BuyerC (pay) D (do not pay)
Seller C (deliver) p− vs,vb − p φp− vs, vb − φpD (do not deliver) p− φp, φp− p 0, 0
The only dominant strategy for the buyer in the short run is to deviate. Therefore,no trade is possible in the short run. However, trade is possible in an infinitely repeatedgame framework where players discount the future at rate δ where 0 < δ < 1. The
1We could argue that the buyer could get vb but the court does not observe that value and cantherefore only compensate the buyer by the amount observed on the market. This claim follows in factexactly the India’s Sale of Goods Act (1930), chapter 6, article 55: "Where under a contract of salethe property in the goods has passed to the buyer and the buyer wrongfully neglects or refuses to payfor the goods according to the terms of the contract, the seller may sue him for the price of the goods"(italics added). Moreover, if the claimant could get a compensation more than vb, the claimant wouldbe better off by becoming a professional claimant, earning more than he would have got without thebreach of contract. We will not consider this perverse effect here.
4
intertemporal discount factor δ is a key element in my model. It determines the tastesof agents concerning the future, and therefore their propensity to cooperate in a repeatedgame framework. It also determines their sensitivity to a punishment by a court in thefuture. I assume that agents are heterogeneous with respect to δ and will specify itsdistribution in the population later. Suppose that the players play according to a GrimTrigger strategy which consists in playing C until the other player defaults and then inplaying D as a punishment for the rest of the game. Let s be the seller, b the buyer;all indices s or b indicate that we refer to the seller or the buyer. Let us start with thesimple case of perfect information: the buyer knows the discount rate δs of the buyer,and conversely for the seller. The aim is to determine the set of prices giving an incentiveto cooperate.
2.1.1 Game with perfect information
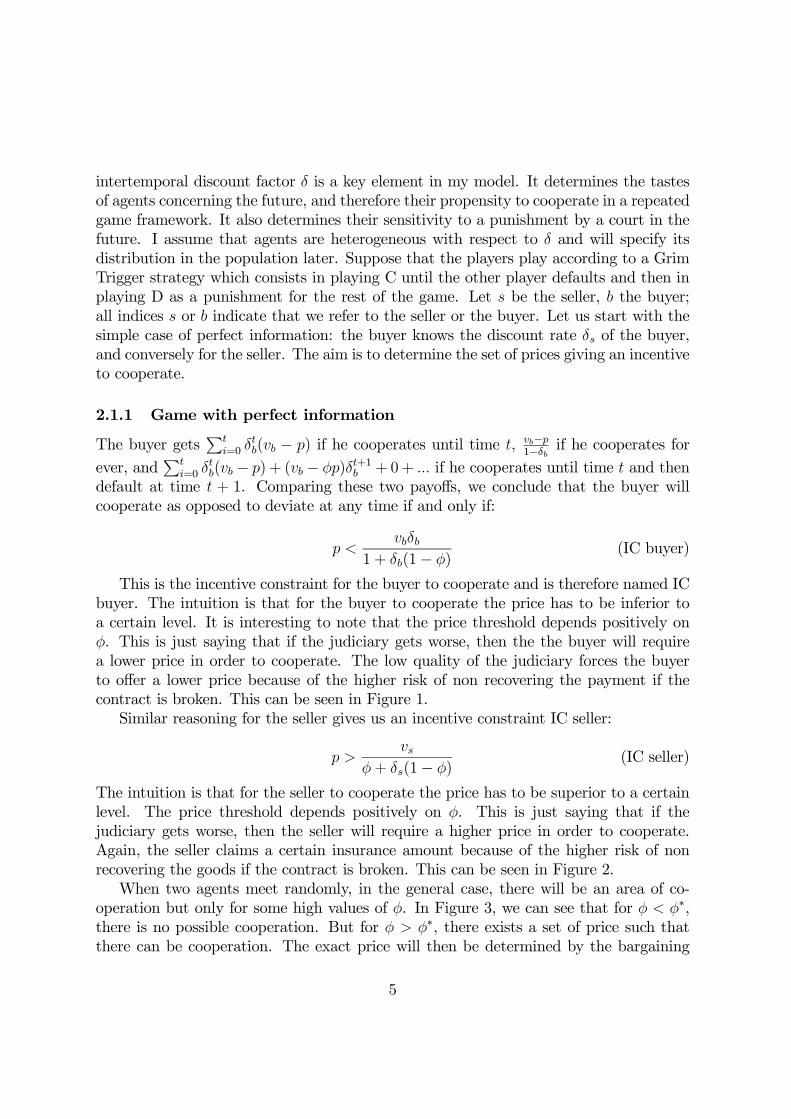
The buyer getsPt
i=0 δtb(vb − p) if he cooperates until time t, vb−p
1−δb if he cooperates forever, and
Pti=0 δ
tb(vb − p) + (vb − φp)δt+1b + 0+ ... if he cooperates until time t and then
default at time t + 1. Comparing these two payoffs, we conclude that the buyer willcooperate as opposed to deviate at any time if and only if:
p <vbδb
1 + δb(1− φ)(IC buyer)
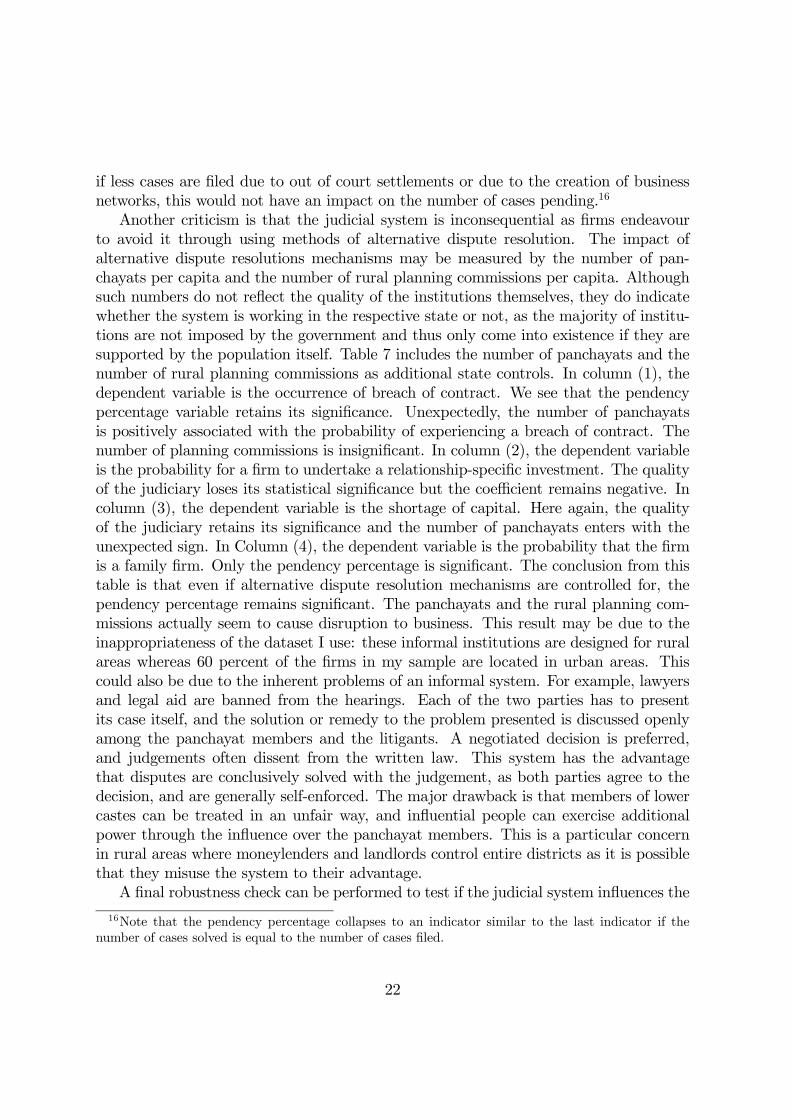
This is the incentive constraint for the buyer to cooperate and is therefore named ICbuyer. The intuition is that for the buyer to cooperate the price has to be inferior toa certain level. It is interesting to note that the price threshold depends positively onφ. This is just saying that if the judiciary gets worse, then the the buyer will requirea lower price in order to cooperate. The low quality of the judiciary forces the buyerto offer a lower price because of the higher risk of non recovering the payment if thecontract is broken. This can be seen in Figure 1.Similar reasoning for the seller gives us an incentive constraint IC seller:
p >vs
φ+ δs(1− φ)(IC seller)
The intuition is that for the seller to cooperate the price has to be superior to a certainlevel. The price threshold depends positively on φ. This is just saying that if thejudiciary gets worse, then the seller will require a higher price in order to cooperate.Again, the seller claims a certain insurance amount because of the higher risk of nonrecovering the goods if the contract is broken. This can be seen in Figure 2.When two agents meet randomly, in the general case, there will be an area of co-
operation but only for some high values of φ. In Figure 3, we can see that for φ < φ∗,there is no possible cooperation. But for φ > φ∗, there exists a set of price such thatthere can be cooperation. The exact price will then be determined by the bargaining
5

power of the two agents. The important result is that there is no breach of contract inthis framework. Both agents internalise the quality of the judiciary in the contract theysign.2 These results are based on the crucial assumption of perfect information. I nowexamine the consequences of imperfect information.
2.1.2 Game with imperfect information
I now consider the situation of a seller matched randomly with a buyer whose intertem-poral discount factor δb is unknown. Figure 5 represents the uncertainty about the typeof the buyer: his incentive constraint could be the curve 1or 2 in Figure 5 correspondingto different δ’s. Arbitrarily, and to simplify the analysis, I assume that the seller hasno bargaining power in the negotiation of the contract. The immediate consequence isthat the seller offers the price p corresponding to the speed of the judiciary φ accordingto his incentive constraint.3
The outcome of the trade is now predictable: individual 1 will default (the price pfor that φ is outside his participation constraint) and individual 2 will cooperate (theprice p for that φ is inside his participation constraint). Some breaches of contract areobservable here. In a more rigorous way, I could calculate the threshold δ∗b above whichthe buyer cooperates for that price and below which the buyer would default. Theincentive constraint of the seller IC seller gives us a relationship between the speed ofthe judiciary and the price offered by the seller:
p =vs
φ+ δs(1− φ)
I than plug this price into the incentive constraint of the buyer (IC buyer) to seewhich buyers would cooperate at that price. This yields a condition on δb, the type ofthe buyer:
δb >vs(1− φ)
(vb − vs)φ+ vbδs(1− φ)= δ∗b
Only the buyers with δb > δ∗b would cooperate at that price under that judiciary. Itis easy to check that the threshold δ∗b is a decreasing function of φ.
2It is interesting to note the special case where vbδb > vsδs. In that case, the two agents can always
find a price where they both want to cooperate, even without a judiciary (φ = 0), as visible in Figure4. I argue that this case corresponds to a business network, defined as a market where agents shareinformation and do not resort to a judicial system. This is a special case of the Folk Theorem becausethis says that for sufficiently patient players (high δb and δs), cooperation is possible in an infinitelyrepeated game.
3A reason for that assumption 1 would be that the buyer wants to maximise the likelihood of acooperation with any seller possibly out of moral concerns or just because going to the judiciary iscostly in monetary terms or time spent in courts (although this is not modelled explicitly in the model).
6

Proposition 1 The number of breaches of contract increases as the quality of the judi-ciary decreases.
Indeed, we saw that with a worse judiciary, the threshold δ∗b above which buyers wouldcooperate increases. With a worse judiciary, the condition for the buyer to cooperatebecomes more stringent. Less buyers would have a δb > δ∗b and therefore more peopledefault with a worse judiciary. The key insight form this model is that the legal systemaffects all entities that fall under its jurisdiction, even if they do not engage its services.
2.2 Relationship-Specific Investment
The previous section demonstrated that more contracts are breached if the judiciaryis of low quality. But one could also expect the quality of the judiciary to impacton the degree of specificity in the relationships between firms. A relationship-specificinvestment is defined as an investment made by an agent in order to supply anotherwith a specialised asset. A specialised asset is itself defined as an asset whose value inthe current use exceeds its value in alternative use. A relationship-specific investment ispreferred by firms for obvious reasons of economic specialisation. However, as Klein etal (1978) emphasized, the possibility of post-contractual opportunistic behaviour arises.Indeed, to induce the supplier to realise a relationship-specific investment, a firm caneither write a long-term contract with favourable terms for the supplier or guaranteeexclusivity rights. But once the costs of the investment are sunk, there is an immediateincentive for the firm to renege on the contract and capture the rents of the supplier.Alternatively, if the search costs to find a new supplier are high, there is an immediateincentive for the supplier to use its monopoly power to impose higher prices. Thesefrictions could reduce the incentive to invest in specialised assets; Klein et al (1978)conclude that vertical integration will supersede market systems in those cases. Butanother way to limit post-contractual opportunistic behaviour is a strong judicial systemto enforce contracts properly. I develop now a simple model based on the previous gamewhere the judiciary is explicitly modelled to evaluate the impact of the quality of thejudiciary on the incentive to invest in specialised assets.Consider the game described earlier. There are two possibilities for a seller of a
good: either realise a relationship-specific investment (RSI) of value i with a particularfirm, or produce a good of more widespread use (the opposite of a relationship-specificinvestment, RSI) with no or little appropriable rents. The drawback of a relationship-specific investment is that there is a risk of post-contractual opportunistic behaviourbut its advantage is the possibility of higher rents. As my analysis is focused arbitrarilyon the seller, I model this as a decrease in the costs of production for the seller if arelationship-specific investment is undertaken. The valuation of the good for the buyeris vs with a relationship-specific investment and Vs without, where Vs > vs. We cancalculate the payoffs associated with each strategy and compare them.
7

I still consider a game of imperfect information, performing a similar analysis as inthe previous section. In the case of a relationship-specific investment, the seller gets−i+Pt
i=0 δts(p−vs) if he cooperates until time t, −i+ p−vs
1−δs if he cooperates for ever, and−i+Pt
i=0 δts(p− vs) + (vb− vs− φp)δt+1s +0+ ... if he cooperates until time t and then
deviates at time t+1. The payoff in the case of deviation is different since I assume thatthe seller would abuse his monopoly power and asks for the maximum price vb instead ofp. The buyer then goes to the courts and is compensated by the amount φp. Comparingthese two payoffs, we obtain as before the incentive constraint of the seller which is theminimum price that makes the seller cooperate in such an agreement. This incentiveconstraint is similar in shape to that in the previous section, and the reasoning is similar.The buyer also has an incentive constraint. Suppose a seller wonders about undertakinga relationship-specific investment. He does not know the preferences of the buyer he israndomly faced with. Based on the observation of the quality φ of the judiciary, he onlyknows that buyers with a discount factor δb > δ∗b
4 will cooperate. We now have to makean assumption about the distribution of δb in the population to calculate the expectedpayoff of the seller in a random matching with a buyer:Assumption 1: I assume that the intertemporal discount factor of the buyers δb is
uniformly distributed on [0,1].This assumption describes a continuum of agents with equiprobability of having a
certain discount rate δb.Therefore, we can now say that a proportion δ∗b of the sellers would default when
faced with this offer and a proportion 1− δ∗b would cooperate. We can now calculate theexpected utility Us(RSI) to the seller s of a trade with a buyer in a relationship-specificinvestment (RSI):
Us(RSI) = −i+ (1− δ∗b)p− vs1− δs
+ δ∗b (φp− vs + δsUs(RSI))
The first term corresponds to the fixed-cost investment i. The second term corre-sponds to what happens in the case of cooperation: 1 − δ∗b of the sellers cooperate. Inthat case, the payoff is the payoff corresponding to an infinitely repeated game. Butδ∗b of the buyers post-contractually default. In this case, the seller still incurs the costof production vs and is compensated only by the amount φp thanks to the courts, andstarts over the game at period t+ 1 with a new randomly matched buyer.The expected utilityUs(RSI) to the seller of a trade with a buyer without a relationship-
specific investment (RSI)is:
Us(RSI) = (1− δ∗b)p− Vs1− δs
+ δ∗b¡φp− Vs + δsUs(RSI)
¢4The threshold δ∗b does not have the exact same form as the previous one because as we said earlier
the payoffs are different, but δ∗b retains the same characteristics. In particular, δ∗b is still a decreasing
function of φ.
8
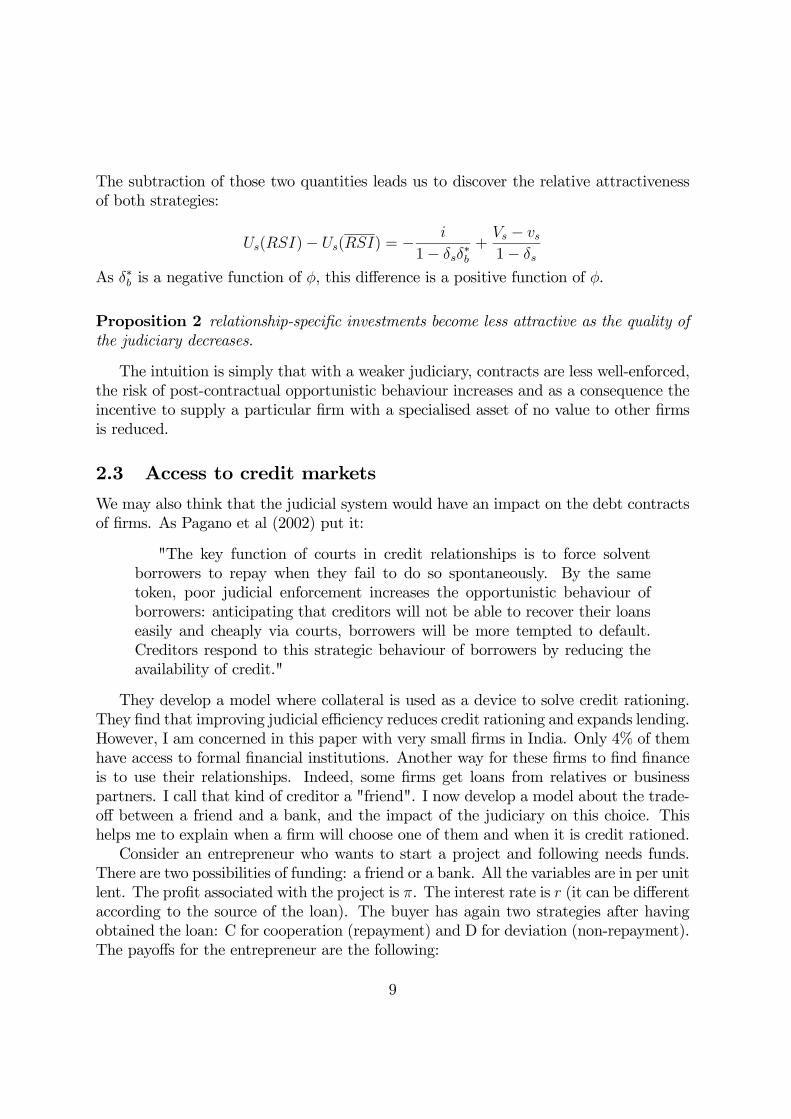
The subtraction of those two quantities leads us to discover the relative attractivenessof both strategies:
Us(RSI)− Us(RSI) = − i
1− δsδ∗b
+Vs − vs1− δs
As δ∗b is a negative function of φ, this difference is a positive function of φ.
Proposition 2 relationship-specific investments become less attractive as the quality ofthe judiciary decreases.
The intuition is simply that with a weaker judiciary, contracts are less well-enforced,the risk of post-contractual opportunistic behaviour increases and as a consequence theincentive to supply a particular firm with a specialised asset of no value to other firmsis reduced.
2.3 Access to credit markets
We may also think that the judicial system would have an impact on the debt contractsof firms. As Pagano et al (2002) put it:
"The key function of courts in credit relationships is to force solventborrowers to repay when they fail to do so spontaneously. By the sametoken, poor judicial enforcement increases the opportunistic behaviour ofborrowers: anticipating that creditors will not be able to recover their loanseasily and cheaply via courts, borrowers will be more tempted to default.Creditors respond to this strategic behaviour of borrowers by reducing theavailability of credit."
They develop a model where collateral is used as a device to solve credit rationing.They find that improving judicial efficiency reduces credit rationing and expands lending.However, I am concerned in this paper with very small firms in India. Only 4% of themhave access to formal financial institutions. Another way for these firms to find financeis to use their relationships. Indeed, some firms get loans from relatives or businesspartners. I call that kind of creditor a "friend". I now develop a model about the trade-off between a friend and a bank, and the impact of the judiciary on this choice. Thishelps me to explain when a firm will choose one of them and when it is credit rationed.Consider an entrepreneur who wants to start a project and following needs funds.
There are two possibilities of funding: a friend or a bank. All the variables are in per unitlent. The profit associated with the project is π. The interest rate is r (it can be differentaccording to the source of the loan). The buyer has again two strategies after havingobtained the loan: C for cooperation (repayment) and D for deviation (non-repayment).The payoffs for the entrepreneur are the following:
9
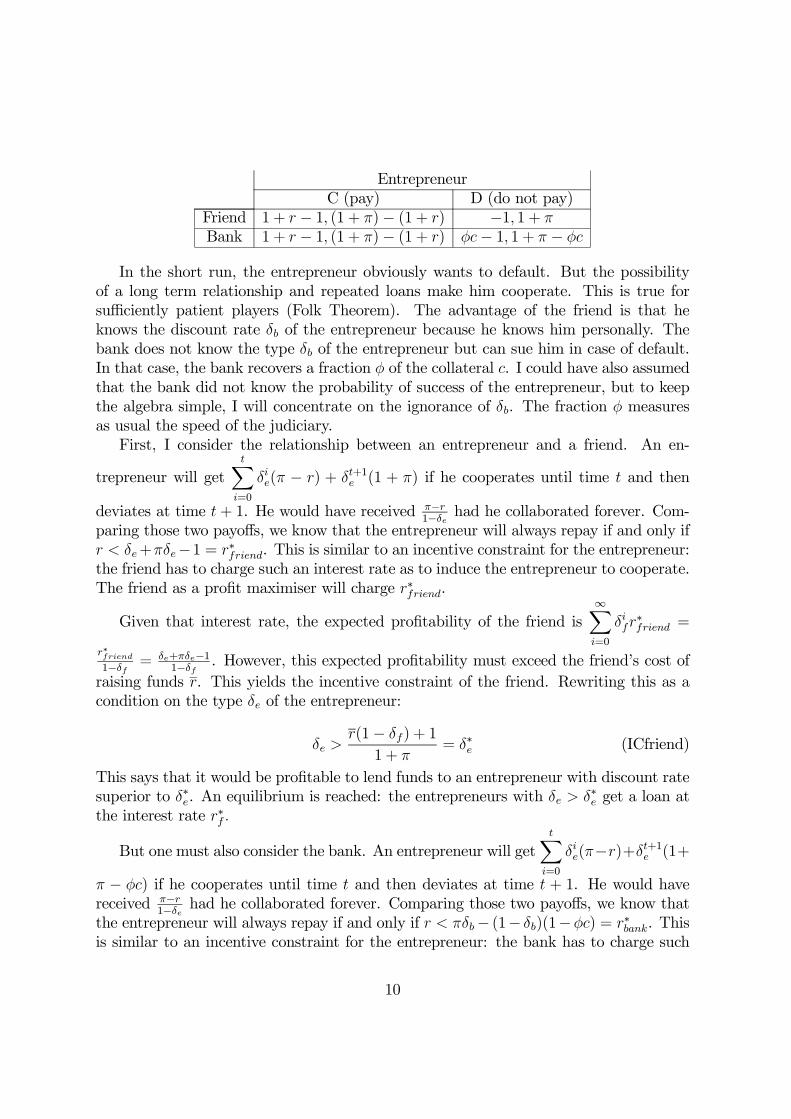
EntrepreneurC (pay) D (do not pay)
Friend 1 + r − 1, (1 + π)− (1 + r) −1, 1 + πBank 1 + r − 1, (1 + π)− (1 + r) φc− 1, 1 + π − φc
In the short run, the entrepreneur obviously wants to default. But the possibilityof a long term relationship and repeated loans make him cooperate. This is true forsufficiently patient players (Folk Theorem). The advantage of the friend is that heknows the discount rate δb of the entrepreneur because he knows him personally. Thebank does not know the type δb of the entrepreneur but can sue him in case of default.In that case, the bank recovers a fraction φ of the collateral c. I could have also assumedthat the bank did not know the probability of success of the entrepreneur, but to keepthe algebra simple, I will concentrate on the ignorance of δb. The fraction φ measuresas usual the speed of the judiciary.First, I consider the relationship between an entrepreneur and a friend. An en-
trepreneur will gettX
i=0
δie(π − r) + δt+1e (1 + π) if he cooperates until time t and then
deviates at time t+ 1. He would have received π−r1−δe had he collaborated forever. Com-
paring those two payoffs, we know that the entrepreneur will always repay if and only ifr < δe+πδe−1 = r∗friend. This is similar to an incentive constraint for the entrepreneur:the friend has to charge such an interest rate as to induce the entrepreneur to cooperate.The friend as a profit maximiser will charge r∗friend.
Given that interest rate, the expected profitability of the friend is∞Xi=0
δifr∗friend =
r∗friend1−δf = δe+πδe−1
1−δf . However, this expected profitability must exceed the friend’s cost ofraising funds r. This yields the incentive constraint of the friend. Rewriting this as acondition on the type δe of the entrepreneur:
δe >r(1− δf) + 1
1 + π= δ∗e (ICfriend)
This says that it would be profitable to lend funds to an entrepreneur with discount ratesuperior to δ∗e. An equilibrium is reached: the entrepreneurs with δe > δ∗e get a loan atthe interest rate r∗f .
But one must also consider the bank. An entrepreneur will gettX
i=0
δie(π−r)+δt+1e (1+
π − φc) if he cooperates until time t and then deviates at time t + 1. He would havereceived π−r
1−δe had he collaborated forever. Comparing those two payoffs, we know thatthe entrepreneur will always repay if and only if r < πδb− (1− δb)(1−φc) = r∗bank. Thisis similar to an incentive constraint for the entrepreneur: the bank has to charge such
10
an interest rate to induce the entrepreneur to cooperate. It is interesting to note thatthe bank can charge a higher interest rate r∗bank than the friend (r
∗friend). This is because
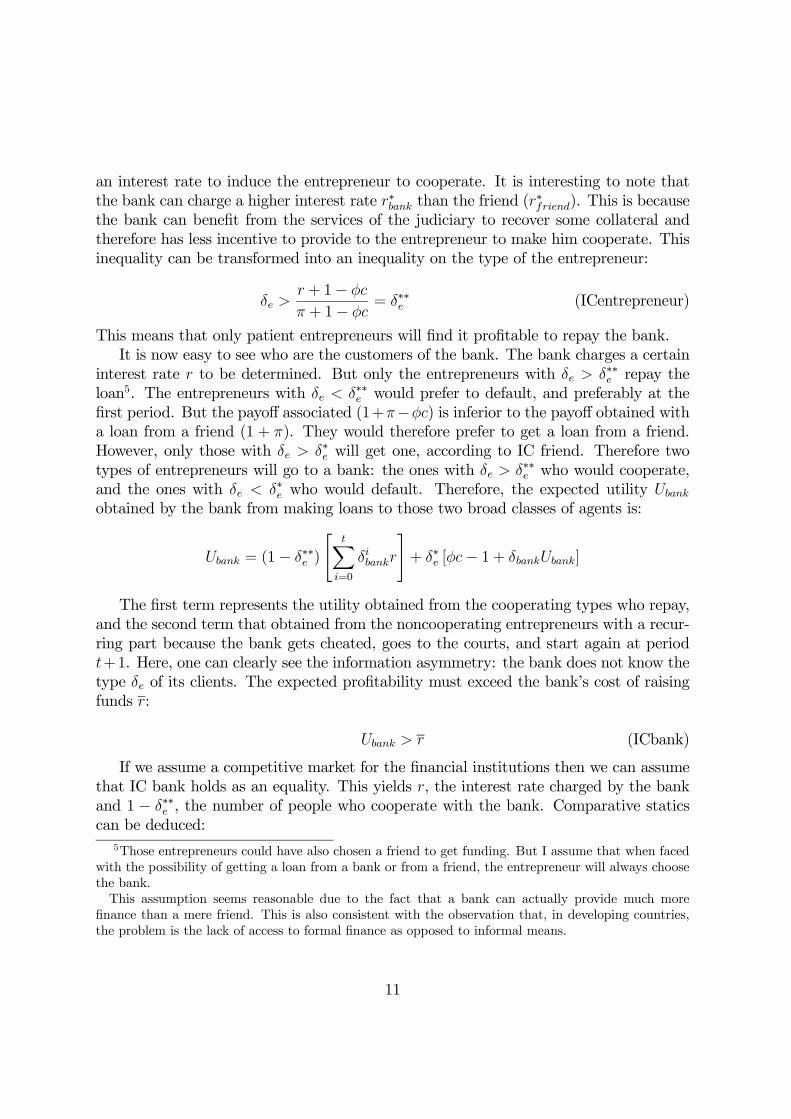
the bank can benefit from the services of the judiciary to recover some collateral andtherefore has less incentive to provide to the entrepreneur to make him cooperate. Thisinequality can be transformed into an inequality on the type of the entrepreneur:
δe >r + 1− φc
π + 1− φc= δ∗∗e (ICentrepreneur)
This means that only patient entrepreneurs will find it profitable to repay the bank.It is now easy to see who are the customers of the bank. The bank charges a certain
interest rate r to be determined. But only the entrepreneurs with δe > δ∗∗e repay theloan5. The entrepreneurs with δe < δ∗∗e would prefer to default, and preferably at thefirst period. But the payoff associated (1+π−φc) is inferior to the payoff obtained witha loan from a friend (1 + π). They would therefore prefer to get a loan from a friend.However, only those with δe > δ∗e will get one, according to IC friend. Therefore twotypes of entrepreneurs will go to a bank: the ones with δe > δ∗∗e who would cooperate,and the ones with δe < δ∗e who would default. Therefore, the expected utility Ubank
obtained by the bank from making loans to those two broad classes of agents is:
Ubank = (1− δ∗∗e )
"tX
i=0
δibankr
#+ δ∗e [φc− 1 + δbankUbank]
The first term represents the utility obtained from the cooperating types who repay,and the second term that obtained from the noncooperating entrepreneurs with a recur-ring part because the bank gets cheated, goes to the courts, and start again at periodt+1. Here, one can clearly see the information asymmetry: the bank does not know thetype δe of its clients. The expected profitability must exceed the bank’s cost of raisingfunds r:
Ubank > r (ICbank)
If we assume a competitive market for the financial institutions then we can assumethat IC bank holds as an equality. This yields r, the interest rate charged by the bankand 1 − δ∗∗e , the number of people who cooperate with the bank. Comparative staticscan be deduced:
5Those entrepreneurs could have also chosen a friend to get funding. But I assume that when facedwith the possibility of getting a loan from a bank or from a friend, the entrepreneur will always choosethe bank.This assumption seems reasonable due to the fact that a bank can actually provide much more
finance than a mere friend. This is also consistent with the observation that, in developing countries,the problem is the lack of access to formal finance as opposed to informal means.
11
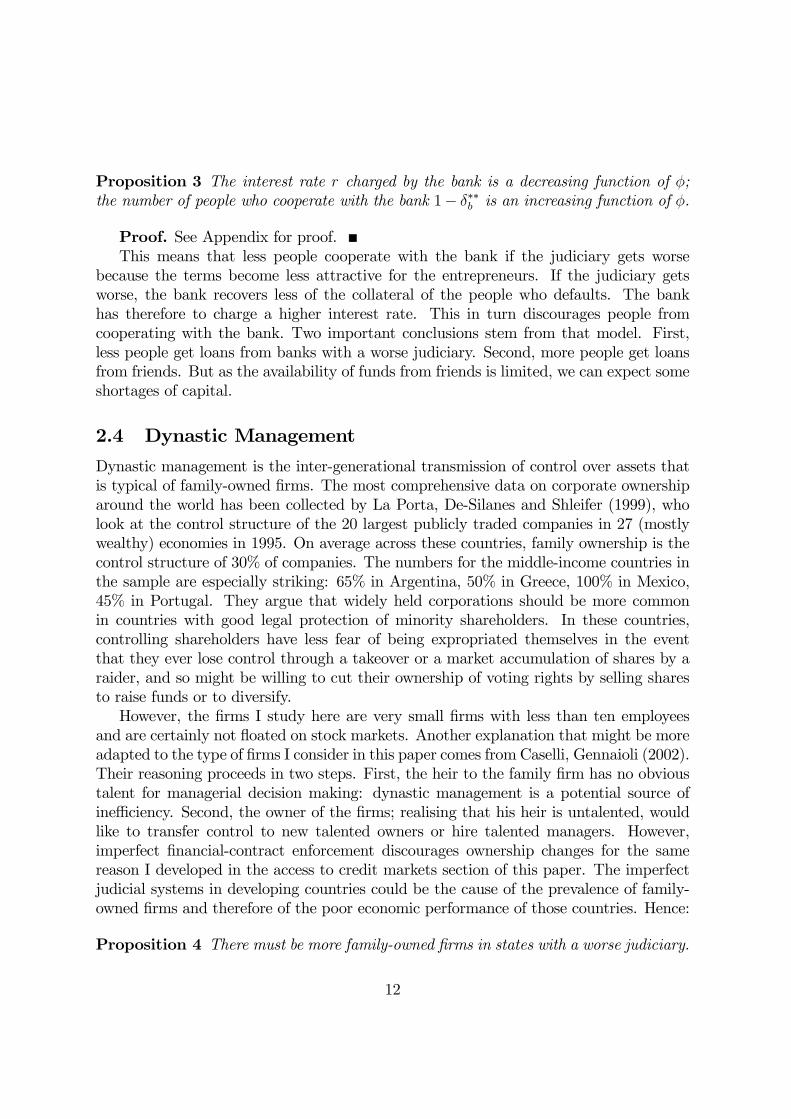
Proposition 3 The interest rate r charged by the bank is a decreasing function of φ;the number of people who cooperate with the bank 1− δ∗∗b is an increasing function of φ.
Proof. See Appendix for proof.This means that less people cooperate with the bank if the judiciary gets worse
because the terms become less attractive for the entrepreneurs. If the judiciary getsworse, the bank recovers less of the collateral of the people who defaults. The bankhas therefore to charge a higher interest rate. This in turn discourages people fromcooperating with the bank. Two important conclusions stem from that model. First,less people get loans from banks with a worse judiciary. Second, more people get loansfrom friends. But as the availability of funds from friends is limited, we can expect someshortages of capital.
2.4 Dynastic Management
Dynastic management is the inter-generational transmission of control over assets thatis typical of family-owned firms. The most comprehensive data on corporate ownershiparound the world has been collected by La Porta, De-Silanes and Shleifer (1999), wholook at the control structure of the 20 largest publicly traded companies in 27 (mostlywealthy) economies in 1995. On average across these countries, family ownership is thecontrol structure of 30% of companies. The numbers for the middle-income countries inthe sample are especially striking: 65% in Argentina, 50% in Greece, 100% in Mexico,45% in Portugal. They argue that widely held corporations should be more commonin countries with good legal protection of minority shareholders. In these countries,controlling shareholders have less fear of being expropriated themselves in the eventthat they ever lose control through a takeover or a market accumulation of shares by araider, and so might be willing to cut their ownership of voting rights by selling sharesto raise funds or to diversify.However, the firms I study here are very small firms with less than ten employees
and are certainly not floated on stock markets. Another explanation that might be moreadapted to the type of firms I consider in this paper comes from Caselli, Gennaioli (2002).Their reasoning proceeds in two steps. First, the heir to the family firm has no obvioustalent for managerial decision making: dynastic management is a potential source ofinefficiency. Second, the owner of the firms; realising that his heir is untalented, wouldlike to transfer control to new talented owners or hire talented managers. However,imperfect financial-contract enforcement discourages ownership changes for the samereason I developed in the access to credit markets section of this paper. The imperfectjudicial systems in developing countries could be the cause of the prevalence of family-owned firms and therefore of the poor economic performance of those countries. Hence:
Proposition 4 There must be more family-owned firms in states with a worse judiciary.
12

To conclude the theoretical component of this paper, I expect in states with a higherpendency rate more breaches of contract, less relationship-specific investments, moredifficulty accessing credit market, and more family firms. These predictions are testableusing the dataset I analyse in the following sections.
3 Background
The purpose of the paper is to relate the quality of the judiciary to the contractingbehaviour of firms. To do this, I make use of a state-level dataset of the courts. Thejudicial institutions are the same across courts and states. The Indian judiciary operatesat three levels: a unique Supreme Court at the federal level; High Courts in each state;and, at lower levels, district judges for civil cases and sessions judges for criminal cases.India operates under a common law system which implies that the actions of High Courtjudges set precedents for the functioning of subordinate courts in that Indian state.Data on cases pending in courts indicate that there are 3.1 million cases pending in
21 High Courts and 20 million in subordinate courts in 2000.6 Some examples of theslowness of the judiciary are striking:
"the highest court in the country, the Supreme Court, took 11 years toacquit the headmaster of a school on the charge of taking a bribe for signingthe salary arrears bill of his school. In another case of judicial delay, thevictim was former Union Law Minister, Dr. B.R.Ambedkar. The judgementcame in his lifetime but it took 47 years for the Maharashtra government toexecute the decree passed in his favour against illegal encroachment of hisland by Pakistani refugees. By then he was dead".7
One of the reasons for judicial delays is the shortage of judges. As Videh Upadhyay,a lawyer in the Supreme Court of India, states,
"the imperative for clearing the burgeoning judicial backlog, and hence formore judges and Courts, needs to be fully understood. Any lawyer practisingin the Delhi High Court - undoubtedly one of the most important High Courtsof the country - can testify that, on an average 60-70 cases are listed before aDelhi High Court Judge per day. The sheer quantum of cases forces a judgeto adjourn most of the matters leading to further backlogs. The inevitableoutcome: normal adjournments are for 4-6 months, the trial dates are notavailable before 2 years and settlement of suit takes place over 15 years."8
6Law’s Delays: Arrears in Courts, 85th Report, Department-related parlia-mentary standing committee on Home affairs Parliament of India, Rajya Sabha.http://rajyasabha.nic.in/book2/reports/home_aff/85threport%20.htm
7Krishnamoorty, Dasu, Judicial Delays, Indolink, editorial analysis, 20038Upadhyay Videh, "More cases, more judges, more courts", India Together, 2003.
13
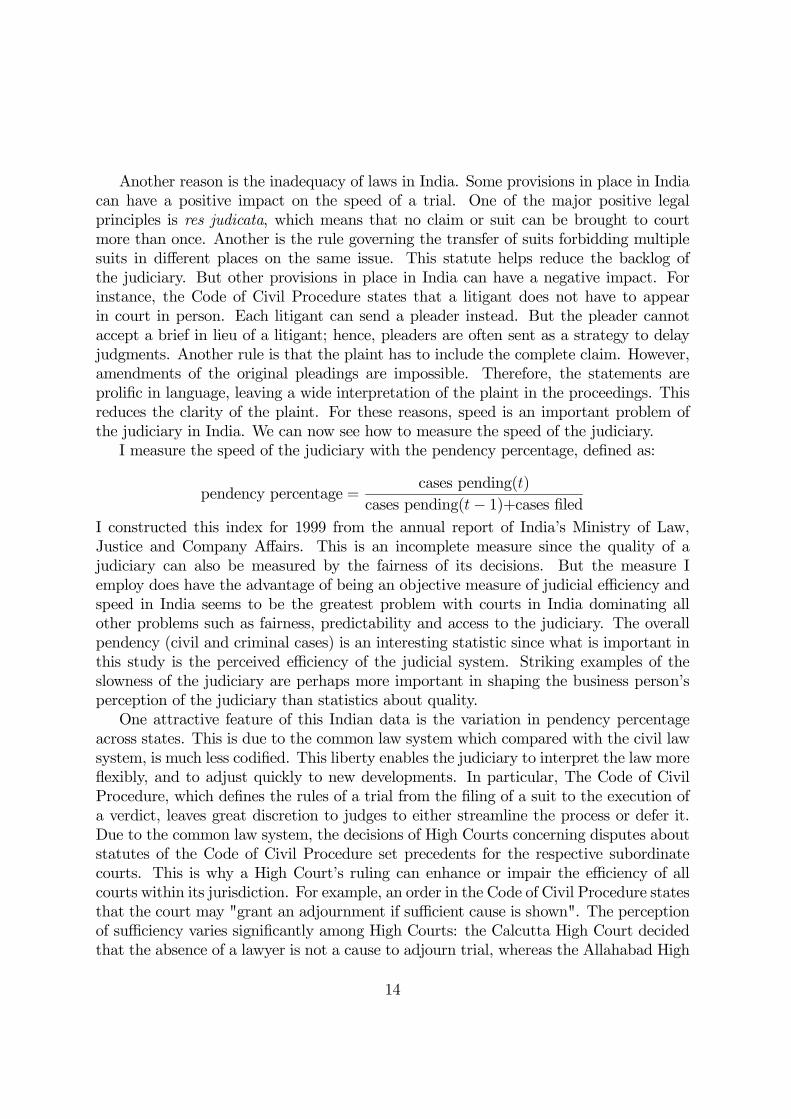
Another reason is the inadequacy of laws in India. Some provisions in place in Indiacan have a positive impact on the speed of a trial. One of the major positive legalprinciples is res judicata, which means that no claim or suit can be brought to courtmore than once. Another is the rule governing the transfer of suits forbidding multiplesuits in different places on the same issue. This statute helps reduce the backlog ofthe judiciary. But other provisions in place in India can have a negative impact. Forinstance, the Code of Civil Procedure states that a litigant does not have to appearin court in person. Each litigant can send a pleader instead. But the pleader cannotaccept a brief in lieu of a litigant; hence, pleaders are often sent as a strategy to delayjudgments. Another rule is that the plaint has to include the complete claim. However,amendments of the original pleadings are impossible. Therefore, the statements areprolific in language, leaving a wide interpretation of the plaint in the proceedings. Thisreduces the clarity of the plaint. For these reasons, speed is an important problem ofthe judiciary in India. We can now see how to measure the speed of the judiciary.I measure the speed of the judiciary with the pendency percentage, defined as:
pendency percentage =cases pending(t)
cases pending(t− 1)+cases filedI constructed this index for 1999 from the annual report of India’s Ministry of Law,Justice and Company Affairs. This is an incomplete measure since the quality of ajudiciary can also be measured by the fairness of its decisions. But the measure Iemploy does have the advantage of being an objective measure of judicial efficiency andspeed in India seems to be the greatest problem with courts in India dominating allother problems such as fairness, predictability and access to the judiciary. The overallpendency (civil and criminal cases) is an interesting statistic since what is important inthis study is the perceived efficiency of the judicial system. Striking examples of theslowness of the judiciary are perhaps more important in shaping the business person’sperception of the judiciary than statistics about quality.One attractive feature of this Indian data is the variation in pendency percentage
across states. This is due to the common law system which compared with the civil lawsystem, is much less codified. This liberty enables the judiciary to interpret the law moreflexibly, and to adjust quickly to new developments. In particular, The Code of CivilProcedure, which defines the rules of a trial from the filing of a suit to the execution ofa verdict, leaves great discretion to judges to either streamline the process or defer it.Due to the common law system, the decisions of High Courts concerning disputes aboutstatutes of the Code of Civil Procedure set precedents for the respective subordinatecourts. This is why a High Court’s ruling can enhance or impair the efficiency of allcourts within its jurisdiction. For example, an order in the Code of Civil Procedure statesthat the court may "grant an adjournment if sufficient cause is shown". The perceptionof sufficiency varies significantly among High Courts: the Calcutta High Court decidedthat the absence of a lawyer is not a cause to adjourn trial, whereas the Allahabad High
14

Court granted a similar request. This example is particularly interesting as it showsthat different interpretations of the same law in different states can have an impact onthe speed of the judiciary.It is often claimed that the judicial system has only a limited impact on the economy
because people resort to alternative dispute resolution institutions, in particular informalones. In India two types of such informal institutions exist: Panchayats and ruralplanning commissions. Both institutions play a crucial role in settling and avoidingrural disputes. The Panchayats, with their limited judicial authority, are used to settledisputes about land usage, tenure and commons. As locally-bound institutions, theyare highly efficient since they are familiar with the situation and the litigants at thevillage level. Correspondingly, the level of acceptance among the population is high. Inthe case of dispute resolutions, Panchayats can impose very limited sanctions, but thesocial pressure created by a judgement serves as a strong incentive to comply with thejudgement. Rural planning commissions submit proposals for infrastructure projectssuch as water dwelling, road improvement to the respective state’s authorities. Theirinvolvement ensures broad participation of the affected population, and provides thebasis for a distribution of public goods and services according to the needs of the poor.They are the first contact point for administrative complaints, and thus do preventdisputes before the projects are implemented. I therefore collect information on thenumber of these entities, and use this as a control in my regressions.My aim in this paper is to relate these measures of judicial efficiency to firm’s contract
behaviour. In this regard, I turn to a representative sample of 170,000 small informalfirms in India. This dataset is the 55th round of the National Sample Survey in Indiacollected in 1999/2000 for small non-agricultural firms.9 There are several characteristicsof this dataset that make it appropriate for use in identifying the impact of judicial delayson contracting behaviour. First, a detailed list of problems experienced by the firm wascollected. Each firm reported if it found that the non-recovery of service charges, feesor credit was a major obstacle to its operation. I interpret this problem as a breachof contract. Second, a detailed questionnaire about the type of contracts used is alsoavailable. I know if the firm operated on a contract basis, and if so, the type of contractit used. For example, I know if the equipment and raw materials were self-procured,supplied by the master unit/contractor, or both. I also know if the design was specifiedby the contractor. Third, I have information about the access to credit markets. Eachfirm was asked if it found that the shortage of capital was a major problem to itsoperation. Related to this, a wealth of information on the source of loans is reported. Iknow if the loan was granted from a central and state-level term lending institution, agovernment (central, state, local bodies), public sector banks, commercial banks, otherinstitutional agencies, money lenders, business partners, suppliers/contractors, or friendsand relatives. Fourth, we have information on the type of ownership of the firm, whether
9See Data Appendix for details of variables and an outline of the sampling design.
15

it is a partnership with members of the same household or not. Finally, a wide range ofmore conventional information is also available for each firm: the full characteristics ofall employees, the firm’s capital stock, and factor incomes, the source and destinationof the firm’s final product, and the sector in which the firm is operating (to the 5-digitlevel in the National Industry Classification).
4 Methods and Results
To relate judicial efficiency to contracting behaviour, I perform regressions of the form:
yijs = α0 + βps + δsZs + γijsXijs + αjdj + εijs
where i corresponds to the firm, j to the sector studied, and s to the state. The variableyijs represents the outcome variable of interest; first this will be the firm’s contractingbehaviour, and later its performance. In this specification, determinants of the outcomeinclude a constant (α0), the pendency percentage (ps), a vector of state-level controls(Zs), a vector of firm-level controls (Xijs) and sector-fixed effects (dj). The coefficientof interest is therefore β.My research design begins with a simple examination of the correlation between the
contracting behaviour outcomes and the pendency percentage, and then incrementallyadds control variables to that regression in order to check the robustness of the result.The state-level controls (Zs)10 consist of the following: state gross domestic product
per capita and per capita income growth rate, to control for overall economic devel-opment; the state school enrolment and literacy rates, to control for educational at-tainment; state amount of credit per capita, to control for overall development of thefinancial sector; state expenditure on the organs of state and the unit cost per policemen,to control for the part of the state budget devoted to the enforcement of law and order;the state length of roads per capita and access to safe drinking water, to control for thequality of infrastructure; and finally, the state death rate and state male life expectancyto control for health sector development.The firm-level variables (Xijs)11 consist of the following: indebtedness, to control for
the disciplinary effect that an increase in indebtedness has on the use of available funds;level of interest payments as a proportion of firms’ profits, to control for the likelihoodof bankruptcy; amount of capital accruing from financial institutions, to control for thefirm’s ability to gain access to sources of financing; proportion of temporary to totalemployment in the firm, to control for for labour productivity12; gender of the owner, to
10See Data Appendix for exact definition and sources of the variables.11See Data Appendix for exact definition and sources of the variables.12The expected effect of this variable on productivity is ambiguous. It is possible that the incentives
16

control for any gender-specific effects on firm performance13; number of unrelated otheractivities undertaken by the owner, to control for time spent on the firm’s activities; andfinally, whether or not the firm is registered, to control for the level of informality of thebusiness.I also include sector dummies (dj) to control for sector-specific effects. I use sim-
ple probit regressions when the outcome is a dummy variable. I do not expect muchendogeneity because there is no reverse causality between a small firm of less than tenemployees14 and the quality of the judiciary. I use robust standard errors and a clusteredsampling strategy at the level of the state because I include state-level variables in amicro-econometric survey (Moulton, 1990).
4.1 Basic Results
Table 1 examines the relationship between contracting behaviour and the quality of thejudiciary. The dependent variable is the occurrence of breach of contract and the soledeterminant is the pendency percentage. The dependent variable was obtained from alist of problems commonly experienced by the firms. One such problem is defined as:‘non-recovery of service charges/ fees/ credit’. This relates to cases where there hasbeen a breach of contract. I therefore construct a dummy variable equal to 1 if the firmexperienced this type of problem as one of its main problems, and 0 if not. I calculatein column (1) a simple correlation between these two variables. I incrementally addstate-level control variables in column (2), firm-level control variables in column (3) andsector dummy variables in column (4). The results are all statistically significant and thefact that the coefficient β of the pendency percentage remains constant when we includefirm-level variables is an indication that the firm-level variables do not cause much con-cern of endogeneity. Moreover, this result is consistent with proposition 1. Column (4)of Table 1 indicates that if the pendency percentage increases by one percentage point,then the probability that the firm will experience a breach of contract will increase by0.1 percent. This result is quite weak and although statistically significant seems eco-nomically insignificant. However, the ranges of pendency percentages in India must beborne in mind. In 1999, the pendency percentage varied across states between 45% and90%. The following interpretation of the coefficient β can therefore be devised. Basedon the coefficients of the regression and using the standard cumulative normal function,
for the firm to earmark resources to investment in human capital are greater in the case of a full-timeworking relationship. Alternatively, temporary labour might provide a firm with increased flexibility toadapt to changes in its environment. Furthermore, it could be argued that temporary workers have anincentive to make a greater effort with the aim of becoming permanent.13The impact of female ownership on firm performance is ambiguous. Many studies indicate that
businesses owned by women underperform those of men. One of the difficulties faced by women inoperating their own small business is family responsibilities which limit the hours they are able tospend working in their small businesses.1455% of the firms in the dataset used in this paper have one worker.
17

which is the definition of the probit function, the probability that an average firm inthe average state will experience a breach of contract, where the pendency percentageis 45%, can be estimated. I estimated the same quantity for the average firm in theaverage state with a pendency percentage of 90%. The difference between these twoprobabilities is 5 percentage points. The results can be interpreted in the following way:the probability that the average firm in the average state will experience a breach ofcontract is 5 percentage points higher if the pendency percentage varies from the lowestrate to the highest rate in India.Table 2 looks at the nature of contracts as a function of the quality of the judiciary.
The dependent variable represents whether or not a firm is operating on a contractualbasis and the explanatory variable is the pendency percentage. As discussed earlier, thedataset contains detailed information about the contractual environment under whichthese firms are operating. I therefore constructed a dummy variable equal to 1 if the firmwas working on a contract basis and 0 if not. Column (1) of Table 2 does not indicateany relationship between the quality of the judiciary and that variable. This may bedue to the fact that only 7 percent of the firms in the dataset operate on a contractualbasis. However, instead of evaluating the impact that the judiciary has on the number ofcontracts entered into, it is more instructive to assess the impact that the judiciary hason contract design. The dataset contains additional information on the nature of thesecontracts. In particular, three questions were asked to the firms: was the design of theproduct specified entirely by the contractor, was the equipment provided by the masterunit, and were the raw materials provided by the master unit. I define the contract asa relationship-specific investment contract if these three questions were answered in theaffirmative. Indeed, the definition of a relationship-specific investment is an investmentof capital that could not be used in another activity, or if so used would result in a greatloss of value. In column (2) of Table 2, I keep only the firms working on a contract basis,amongst which some signed a relationship-specific investment contract. By reducingthe size of the sample, I hope to be able to pinpoint a significant relationship betweenthe quality of the judiciary and the likelihood to sign a relationship-specific investmentcontract. Column (5) illustrates that fewer relationship-specific investment contractsare signed in states with higher pendency rates. This provides support for proposition2. An economic interpretation of this result is that the average firm in the average stateis 4 percentage points less likely to undertake a relationship-specific investment if thejudiciary is the slowest of India as opposed to the fastest.Table 3 examines the influence of the judiciary on firm’s access to credit markets.
The dependent variable is information on loans and the explanatory variable of interestis the pendency percentage. The dependent variable used in the regression of column(1)is a dummy variable equal to 1 if the firm experienced a shortage of capital as one of itsproblems, and 0 otherwise. A higher pendency means more problems of that type. Thisresult can be interpretated in the following way: the probability that the average firm inthe average state will experience a shortage of capital increases by 7 percentage points
18

if the judiciary is the slowest as opposed to the fastest. In column (2), the dependentvariable represents whether or not the firm had an outstanding loan at the time of thesurvey. I find that fewer firms have outstanding loans where the rate of pendency ishigher. The average firm in the average state will find it 3.5 percentage points harderto get a loan with the slowest judiciary in India, relative to the fastest. An interestingtest is to refine the analysis to factor in the exact source of the loan. Column (3)demonstrates that it is 2 percentage point harder to obtain a loan from formal financialinstitutions in states with a slow judiciary. As predicted, column (4) shows that it isharder to secure a loan from strangers (suppliers, contractors, moneylenders) althoughthe statistical significance of this result is not very high. Turning to loans from friends,relatives and business partners (column (5)), there are very few firms in this categoryso I restrict attention to the sample of firms that obtained a loan. Among this subset offirms, column (5) demonstrates that loans are more likely to come form friends, relatives,and business partners when the judiciary is slow. This agrees with the notion that peopletend to operate in small business networks in areas where the pendency rate is higher.The average firm to have obtained a loan will be 16 percentage points more likely tohave obtained it from a relative than from other sources if the judiciary is the slowestin India as opposed to the quickest. This result is consistent with Proposition 3, whichholds that agents should obtain more loans from friends and less from banks in situationswhere there is a slow judiciary.Table 4 looks at the nature of the ownership of the firm as a function of the quality of
the judiciary. I restrict the sample to firms engaged in partnerships as opposed to single-ownership firms, as the partnerships firms have further data on the relationships betweenpartners. There are two possible types of partnership: partnership with members ofthe same household and partnership between members not all from the same household.Dynastic management corresponds to the first category of partnership. Control variablesare added incrementally in the four columns. Column (4) illustrates that there are morepartnerships with members of the same household in states with a slow judiciary. Theaverage firm engaged in a partnership in the average state is 9 percentage points morelikely to be a family firm if the judiciary is the slowest of India as compared to thefastest. This is consistent with Proposition 4 which says that family firms should bemore prevalent in states with a slower judiciary.
4.2 Robustness checks
To lend support to the previous set of estimates, I now perform a series of robustnesschecks. In particular, questions can be raise about the dependency of the results to theparticular measure used, and the pertinence of the pendency percentage as a measureof the efficiency of the judiciary.The first robustness check concerns the efficiency measure of the judicial system. It
19
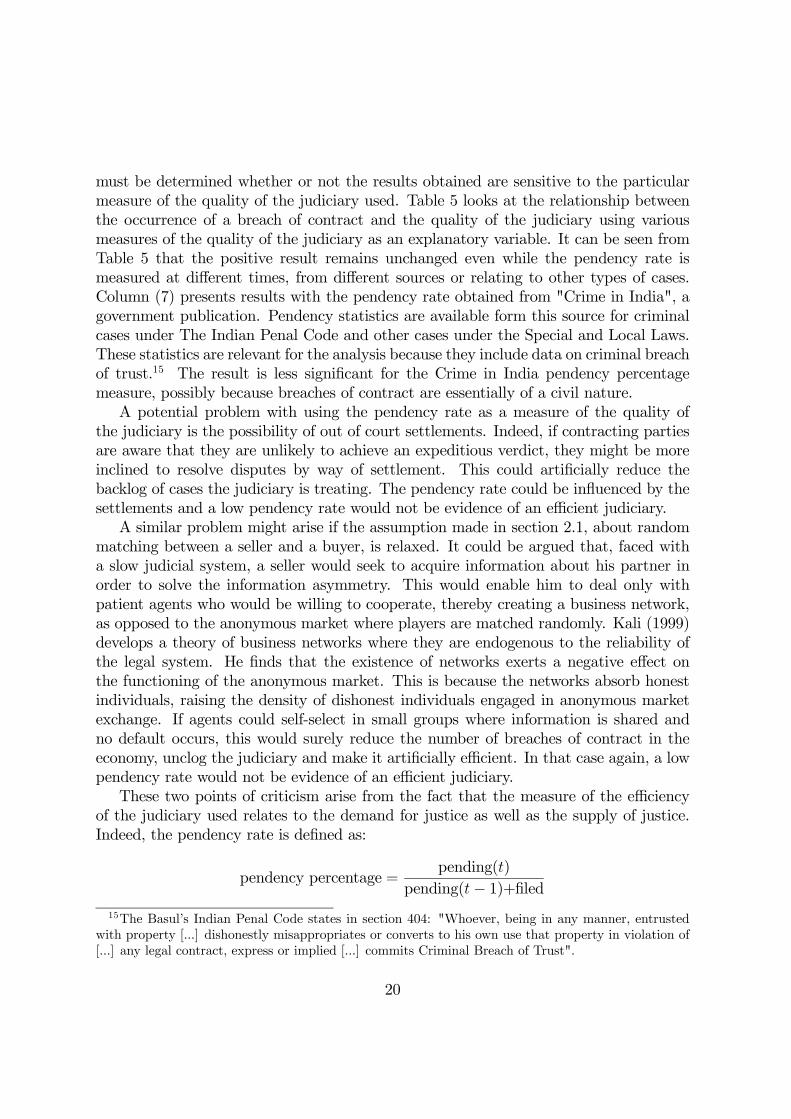
must be determined whether or not the results obtained are sensitive to the particularmeasure of the quality of the judiciary used. Table 5 looks at the relationship betweenthe occurrence of a breach of contract and the quality of the judiciary using variousmeasures of the quality of the judiciary as an explanatory variable. It can be seen fromTable 5 that the positive result remains unchanged even while the pendency rate ismeasured at different times, from different sources or relating to other types of cases.Column (7) presents results with the pendency rate obtained from "Crime in India", agovernment publication. Pendency statistics are available form this source for criminalcases under The Indian Penal Code and other cases under the Special and Local Laws.These statistics are relevant for the analysis because they include data on criminal breachof trust.15 The result is less significant for the Crime in India pendency percentagemeasure, possibly because breaches of contract are essentially of a civil nature.A potential problem with using the pendency rate as a measure of the quality of
the judiciary is the possibility of out of court settlements. Indeed, if contracting partiesare aware that they are unlikely to achieve an expeditious verdict, they might be moreinclined to resolve disputes by way of settlement. This could artificially reduce thebacklog of cases the judiciary is treating. The pendency rate could be influenced by thesettlements and a low pendency rate would not be evidence of an efficient judiciary.A similar problem might arise if the assumption made in section 2.1, about random
matching between a seller and a buyer, is relaxed. It could be argued that, faced witha slow judicial system, a seller would seek to acquire information about his partner inorder to solve the information asymmetry. This would enable him to deal only withpatient agents who would be willing to cooperate, thereby creating a business network,as opposed to the anonymous market where players are matched randomly. Kali (1999)develops a theory of business networks where they are endogenous to the reliability ofthe legal system. He finds that the existence of networks exerts a negative effect onthe functioning of the anonymous market. This is because the networks absorb honestindividuals, raising the density of dishonest individuals engaged in anonymous marketexchange. If agents could self-select in small groups where information is shared andno default occurs, this would surely reduce the number of breaches of contract in theeconomy, unclog the judiciary and make it artificially efficient. In that case again, a lowpendency rate would not be evidence of an efficient judiciary.These two points of criticism arise from the fact that the measure of the efficiency
of the judiciary used relates to the demand for justice as well as the supply of justice.Indeed, the pendency rate is defined as:
pendency percentage =pending(t)
pending(t− 1)+filed15The Basul’s Indian Penal Code states in section 404: "Whoever, being in any manner, entrusted
with property [...] dishonestly misappropriates or converts to his own use that property in violation of[...] any legal contract, express or implied [...] commits Criminal Breach of Trust".
20

Considering the following identity:
pending(t− 1)+filed=pending(t)+solved
the pendency percentage can be rewritten as:
pendency percentage =pending(t− 1)+filed-solvedpending(t− 1)+filed
This expression of the pendency percentage includes the quantity of cases filed. Thependency rate depends both on how many cases were resolved (the supply of justice)and the number of new cases brought (the demand for justice). I am interested in theeffect of the supply of justice on contracting behaviour of firms, but that effect here isconfounded by the demand for justice. In particular, if the number of new cases increases,the pendency rate goes up. An increasing pendency rate would not be evidence of anincreasingly inefficient judiciary but would merely reflect the litigious nature of agents.To solve this particular problem, a measure of the efficiency of the judiciary that
focuses more on the supply side of justice can be employed. I considered the followingindicator:
solvedpending
This indicator would only reflect the capacity of judges to solve cases. A high ratiowould indicate that many pending cases are being treated. Column (8) of Table 5 showsthat this indicator is positively correlated with breach of contract. Indeed, I find thatall results presented in this paper are robust to the use of this alternative measure ofjudicial efficiency.In order to explain the similarity of the results, it is necessary to look at the determi-
nants of cases filed and cases pending in India. Column (2) of Table 6 demonstrates thatthe number of cases pending per judge does not depend on the number of cases filed perjudge. This result would be characteristic of a judicial system where a judge solves morecases as the number of cases filed increases in order to keep constant the amount of casespending. This is confirmed in Column (1) of Table 6 where the number of cases disposedper judge is positively correlated, by a one-to-one ratio, with the number of cases filedper judge. The number of cases pending cannot be explained by the number of casesregistered. Other operational factors such as scarceness of means are more importantin determining the amount of cases pending. An indicator of the scarceness of meansis the number of judges that would be required for a well-functioning judiciary in anystate. This indicator is positively correlated with the number of cases pending as can beseen in column (3) of Table 6. The conclusion that can be drawn from Table 6 is thatthe number of cases pending does not depend on the number of cases filed. Therefore,
21
if less cases are filed due to out of court settlements or due to the creation of businessnetworks, this would not have an impact on the number of cases pending.16
Another criticism is that the judicial system is inconsequential as firms endeavourto avoid it through using methods of alternative dispute resolution. The impact ofalternative dispute resolutions mechanisms may be measured by the number of pan-chayats per capita and the number of rural planning commissions per capita. Althoughsuch numbers do not reflect the quality of the institutions themselves, they do indicatewhether the system is working in the respective state or not, as the majority of institu-tions are not imposed by the government and thus only come into existence if they aresupported by the population itself. Table 7 includes the number of panchayats and thenumber of rural planning commissions as additional state controls. In column (1), thedependent variable is the occurrence of breach of contract. We see that the pendencypercentage variable retains its significance. Unexpectedly, the number of panchayatsis positively associated with the probability of experiencing a breach of contract. Thenumber of planning commissions is insignificant. In column (2), the dependent variableis the probability for a firm to undertake a relationship-specific investment. The qualityof the judiciary loses its statistical significance but the coefficient remains negative. Incolumn (3), the dependent variable is the shortage of capital. Here again, the qualityof the judiciary retains its significance and the number of panchayats enters with theunexpected sign. In Column (4), the dependent variable is the probability that the firmis a family firm. Only the pendency percentage is significant. The conclusion from thistable is that even if alternative dispute resolution mechanisms are controlled for, thependency percentage remains significant. The panchayats and the rural planning com-missions actually seem to cause disruption to business. This result may be due to theinappropriateness of the dataset I use: these informal institutions are designed for ruralareas whereas 60 percent of the firms in my sample are located in urban areas. Thiscould also be due to the inherent problems of an informal system. For example, lawyersand legal aid are banned from the hearings. Each of the two parties has to presentits case itself, and the solution or remedy to the problem presented is discussed openlyamong the panchayat members and the litigants. A negotiated decision is preferred,and judgements often dissent from the written law. This system has the advantagethat disputes are conclusively solved with the judgement, as both parties agree to thedecision, and are generally self-enforced. The major drawback is that members of lowercastes can be treated in an unfair way, and influential people can exercise additionalpower through the influence over the panchayat members. This is a particular concernin rural areas where moneylenders and landlords control entire districts as it is possiblethat they misuse the system to their advantage.A final robustness check can be performed to test if the judicial system influences the
16Note that the pendency percentage collapses to an indicator similar to the last indicator if thenumber of cases solved is equal to the number of cases filed.
22

contracting behaviour of firms using the methodology of Rajan and Zingales (1998). Theintuition is that a good judicial system should disproportionately help firms typicallydependent on the judicial system for their growth. I will construct the test as follows. Asector’s need for the judicial system is identified from data on U.S. firms. The need forthe judicial system will be measured by the vertical integration of the firms. Indeed, ahighly vertically integrated firm does not rely on the judicial system since all activities areinternalized. On the contrary, a non vertically integrated firm relies on many suppliersor customers and therefore is more dependent on the judicial system. The verticalintegration of the firms will be measured by the ratio of the value added generated inthe firm to the total sales. If that indicator is 1, then it means that all the creationof value comes from within the firm. If that indicator is 0, it means that a firm is nothighly vertically concentrated. Here I make two very important assumptions. First,it is considered that the judicial system is optimal in the United States. This methodallows us to identify a sector’s technological demand for a judicial system. Second, itis assumed that such a technological demand carries over to other countries. I thenexamine whether industries that are more dependent on the judicial system experiencemore problems of breach of contract, undertake fewer relationship-specific investments,suffer from shortages of capital or are more likely to be family firms.Data for vertical integration in the US was gathered from the Industrial Statistics
Database 2003 at the 3- and 4-digit level of ISIC Code (Revision 3) put together bythe United Nations Statistical Division.17 I then construct the interaction between thedemand for justice (defined as 1 minus the vertical integration) at the NIC2 level andthe pendency percentage.In Table 8 column (3), the dependent variable is the occurrence of a shortage of
capital. It can be seen that a firm operating in a sector which is dependent on thejudicial system in the USA suffers more from a slow judiciary than a firm operating ina sector not dependent on the judiciary. In column (4), the dependent variable is thelikelihood of being a family firm. We see that a firm in a sector that would be dependenton the judicial system in the USA is more likely to be a family firm than a firm in asector not dependent on the judiciary. I tested if my results did not depend on the choiceof the benchmark country by gathering the data for Canada. The last four columns oftable 8 show that the result is comparable.
5 Effects on Firm Performance
This paper seeks to determine whether pendency rates affect not only firm-level con-tracting behaviour but also firm-level performance. The dependent variable is now thegrowth status of the firm. It is a subjective measure since it was asked directly to the
17I restrict the sample to manufacturing firms following Rajan and Zingales
23

firm owner. It is a dummy variable equal to one if the firm is expanding or constant, tozero if the firm is shrinking.As described earlier, a slow judiciary gives less incentives to respect contracts. Col-
umn (1) of Table 9 shows that a breach of contract is negatively correlated with eco-nomic growth. It is not likely that the explanatory variable corresponding to a breachof contract is endogenous. Indeed, it is defined as a problem of non-recovery of servicecharges/fees/credit. This means that the other contracting party, not the firm itself, isresponsible for the breach of contract. The results concerning the impact on the sta-tus of the firm of a relationship-specific investment, a shortage of capital or a dynasticmanagement are not displayed, as these variables are likely to be endogenous to the per-formance of the firm. However, a relationship specific investment can be expected to bepositively correlated with growth and a shortage of capital and dynastic management tobe negatively correlated with growth. For all these reasons, column (2) of Table 9 showsa significant negative relationship between the pendency rate and the performance ofthe firm. Based on Table 9 column (2), we find that the effect on economic performanceis large. The average firm in the average state will be less likely by 10 percentage pointsto be expanding if the judiciary is the slowest as opposed to the quickest one of India. InColumn (3), I included the variables corresponding to the alternative dispute resolutionmechanisms. We see that the pendency percentage remains significant and that theother variables are insignificant. I have also carried out the robustness checks of section4. I have used different measures of the pendency percentage, different measures for theefficiency of the judiciary (solved/pending) and found similar results.I also applied the methodology of Rajan and Zingales (1998) to the performance of
the firm. The intuition is that a good judicial system should disproportionately helpfirms typically dependent on the judicial system for their growth. Indeed, we can seein Table 10 column (1) that firms in India in sectors that would depend more on thejudiciary in the USA grow less in states with a bad judiciary. Another possibility isthat firms simply move states or that people decide not to undertake an activity whichis not dependent on the judiciary. Column (2) of Table 10 investigates the relationshipbetween the number of firms in a particular sector depending on their demand for justicecalculated in the USA interacted with the quality of the judiciary. There are significantlyless firms of a sector that requires a good judicial system in a state with a bad judicialsystem. Unfortunately this does not allowme to discriminate between the two hypothesisof occupational choice or mobility. Having no data on migration, I do not know if peopledecide not to undertake judiciary-dependent activities or if they move to another state,but a bad judicial system certainly has an impact on the firms through their industrialorganization. As in section 4, these findings are robust to the use of Canadian data(columns (3) and (4)).
24

6 Conclusion
This paper shows that the quality of judicial institutions in Indian states matter both forthe contracting behaviour and economic performance of small firms. My findings are inline with an emerging, largely macroeconomic literature which suggests that institutionsmatter for economic performance ( for example, Acemoglu et al, 2001). My firm-leveldata is somewhat unique in the sense that it contains a great deal of information onnon-recovery of service charges/fees/credit, design of contracts, whether a firm is capitalconstrained, source of borrowing and the form of ownership. This type of informationis typically not available in most firm-level databases.When I relate these specific measures to the state pendency rate, I find that having
a slower judiciary is associated with more breaches of contract, less relationship-specificinvestments, a greater shortage of capital, less access to formal financial institutions anda preference for family ownership of firms. These results indicate that the quality of thejudiciary across Indian states plays an important role in shaping economic activity inthis important sector of the economy. Moreover, I find that having slower courts in anIndian state is negatively associated with firm performance. My results are consistentwith a simple game theoretic model which illustrates how having a slower judiciarywill affect the behaviour of agents in a contracting relationship. The key insights fromthe theory are that firm owners in slow judiciary environments are more likely to breakcontracts, less likely to engage in relationship-specific investment, more likely to be creditconstrained, less likely to have access to formal credit and more likely to keep the firmunder family ownership.This research leaves important questions open. The first is that we would like to
know more about what determines the speed of the judiciary. In particular, we wouldlike to identify specific policy measures which would enhance judicial efficiency. This is aproblem both for India and for large number of other countries which would suffer fromslow courts (Shleifer et al, 2003). A key implication emerging from this paper is thatthe quality of the judiciary has large effects on economic performance. Finding specificmeans of speeding up courts is therefore an important area for future work. In India, thefact that there is a common law system in place would suggest that the actions of HighCourt judges may be an important determinant of the speed of the judiciary. Linking therulings of these judges to court functioning is an area of research that I plan to take upin the future. The second key question that remains open concerns whether the effectsof a slow judiciary vary across sectors of an economy. One can imagine for examplethat firms in the registered or formal manufacturing sector in India may have fewercontracting problems than the informal firms that I examine in this paper. In futurework, I plan to extend my analysis to firms in other sectors of the Indian economy as ameans of testing this hypothesis.
25

References
[1] Acemoglu, Daron, Johnson, Simon and James Robinson, [2001], "The ColonialOrigins of Comparative Development: An Empirical Investigation", The AmericanEconomic Review, V.91, 1369-1401.
[2] Barro, Robert, [1991], "Economic Growth in a Cross Section of Countries", Quar-terly Journal of Economics, V.106, N.2, 407-43.
[3] Becker, Gary S., [1968], "Crime and Punishment: an Economic Approach", TheJournal of Political Economy, V.76(2), 169-217.
[4] Besley, Timothy and Robin Burgess, [2004], "Can Labor Regulation Hinder Eco-nomic Performance? Evidence From India", The Quarterly Journal of Economics,V.119(1), 91-134.
[5] Blanchard, Olivier and Michael Kremer, [1997], "Disorganization", The QuarterlyJournal of Economics, V.112(4), 1091-1126.
[6] Botero, Juan, Djankov, Simeon, La Porta, Rafael, Lopez-de-Silanes, Florencio andAndrei Shleifer, [2002], "The Regulation of Labor".
[7] Burkart, Mike, Panunzi, Fausto and Andrei Shleifer, [2002], "Family Firms", NBERWorking Paper No. w8776.
[8] Caselli, Francesco and Nicola Gennaioli, [2003], "Dynastic Management", NBERWorking Paper No. w9442.
[9] Dixit, Avinash, [2003], "Trade Expansion and Contract Enforcement", PrincetonUniversity.
[10] Djankov, Simeon, La Porta, Rafael, Lopez-de-Silanes, Florencio and Andrei Shleifer,[2003], "Courts", The Quarterly Journal of Economics, V.118(2), 453-517
[11] Djankov, Simeon, La Porta, Rafael, Lopez-de-Silanes, Florencio and Andrei Shleifer,[2002], "The Practice of Justice".
[12] Ellison, Glenn, [1994], "Cooperation in the Prisoner’s Dilemma With AnonymousRandom Matching", The Review of Economic Studies, V.61(3), 567-588.
[13] Ghosh, Parikshit and Debraj Ray, [1996], "Cooperation in Community Interactionwithout Information Flows", The Review of Economic Studies, V.63(3), 491-519.
[14] Greif, Avner, [1993], "Contract Enforceability and Economic Institutions in EarlyTrade: The Maghribi Trader’s Coalition", The American Economic Review,V.83(3), 525-548.
26

[15] Hall, R. E. and C.I. Jones, [1997], “Levels of Economic Activity Across Countries”,American Economic Review, V.87(2), 173—77.
[16] Hall, R. E. and C.I. Jones, [1999], “Why Do Some Countries Produce so Much MoreOutput per Worker than Others?", Quarterly Journal of Economics, V.114(1), 83-116.
[17] Johnson, Simon, McMillan, John and Christopher Woodruff, [1999], "Contract En-forcement in Transition", European Bank, Working Paper N.45.
[18] Johnson, Simon, McMillan, John and Christopher Woodruff, [2002], "Courts andRelational Contracts", Oxford University Press.
[19] Kali, Raja, [1999], "Endogenous Business Network", Journal of Law and EconomicOrganizations, V.15, N.13.
[20] Kali, Raja, [2002], "Contractual Governance, Business Groups and Transition",Economics of Transition, V.10(2), 255-272.
[21] Klein, Benjamin, Crawford, Robert and Armen Alchian, [1978], "Vertical Integra-tion, Appropriable Rents, and the Competitive Contracting Process", Journal ofLaw & Economics, V.21(2), 297-326.
[22] Knack, Stephen and Philip Keefer, [1995], "Institutions and Economic Performance:Cross Country Tests Using Alternative Institutional Measures", Economics andPolitics, V.7(3).
[23] Koehling, Wolfgang, [2002], "The Economic Consequences Of A Weak Judiciary:Insights From India", Law and Economics 0212001, Economics Working PaperArchive at WUSTL.
[24] Kranton Rachel, [1996], "Reciprocal Exchange: A Self-Sustaining System", TheAmerican Economic Review, V.86(4), 830-851.
[25] La Porta, Rafael, Lopez-De-Silanes, Florencio and Andrei Shleifer, [1999], "Corpo-rate Ownership Around the World", The Journal of Finance, V,LIV(2).
[26] Mauro P., [1995], “Corruption and Growth”, Quarterly Journal of Economics,V.110(3), 681—712.
[27] Moulton, Brent, [1990], "An Illustration of a Pitfall in Estimating the Effects ofAggregate Variables on Micro Units", The Review of Economics and Statistics,V.72(2), 334-338.
27

[28] North, Douglass C., [1990], "Institutions, Institutional Change, and Economic Per-formance", Cambridge University Press, New York.
[29] Pagano, Marco, Bianco, Magda and Tullio Jappelli, [2002], “Courts and Banks:Effects of Judicial Enforcement on Credit Markets” CEPR Discussion Paper no.3347, forthcoming in the Journal of Money, Credit and Banking.
[30] Przeworski, A. and F. Limongi, [1993], “Political Regimes and Economic Growth”,Journal of Economic Perspectives, V.7(3), 51—69.
[31] Rajan, Raghuram and Luigi Zingales, [1998], "Financial Dependence and Growth",The American Economic Review, V.88(3), 559-586.
[32] Rodrik, Dani, Subramanian, Arvind and Francesco Trebbi, [2002], "Institutionsrule: The Primacy of Institutions over Geography and Integration in EconomicDevelopment".
[33] Sachs, J. D., and A.M. Warner, [1997], “Fundamental Sources of Long-RunGrowth”, American Economic Review, V.87(2), 184—88.
28

Appendix
A1. Why is φ a measure of the speed of the judiciary?
Let us call Ucourt the utility a buyer can retrieve from taking the seller to court. Ecorresponds to the expected value.
Ucourt = E(net gain) = E(gain)−E(cost of litigation)
E(gain) = E(δT−1b G)
G corresponds to the gross gain:
G : gross gain =½
p with probability w0 with probability 1− w
¾T being the time at which decision is reached (random variable), and pt the probabilitythat the decision is reached at t.Therefore, E
¡δT−1b
¢=P∞
t=1 ptδt−1b , and the expected gain is:
E(gain) = wp∞Xt=1
ptδt−1b
Here I make two assumptions. The first is that w, the probability of winning, isindependent of time; hence, the predictability of the decision is not affected by time. Iwill not focus in this model on predictability and will therefore later equate w to 1 forthe buyer. The second assumption is that the value of punishment pn is independent oftime. I could also consider the judicial system correcting for the time spent in court,but for simplicity I will ignore this aspect. Now for the cost of litigation:
E(cost of litigation) = E(ca +t=TXt=1
ctδt−1b + CδT−1b )
with ca representing the cost of access to justice, ct regular expenses during the processof a trial (fee of the lawyer). During the rest of the paper, I consider this cost ct asaconstant c, with a gross cost C incurred at the end of the trial. I introduce these threetypes of cost to emphasize some common features of the judicial system. First, a fixedcost which represents the initial barrier due to the information of the claimant. Second,a fixed cost per period for regular expenses. This cost is decreasing with the speed ofthe judiciary: a speedy justice would lower those costs. Third, a cost that occurs at theend of the trial. This last cost is a consequence of local legislations, which says that
29

the loser and/or the winner must pay the cost of the trial. That cost increases with theefficiency of the judiciary. A slow justice will make the occurrence of those costs appearso distant as to be almost irrelevant. The second and third costs illustrate the trade-offin any trial: the defendant wants to terminate the trial quickly to avoid paying high feesto his lawyer but also wants to slow down the process to avoid paying the fine. Usingthese refinements:
E(cost of litigation) = E(ca + ct=TXt=1
δt−1b + (wcw + (1− w)cl) δT−1b )
with cw cost if the individual in question wins and cl cost if he loses. Thus:
E(cost of litigation) = ca +c
1− δb(1− δb
∞Xt=1
ptδt−1b ) + (wcw + (1− w)cl)
∞Xt=1
ptδt−1b
and therefore:
Ucourt = wpn
∞Xt=1
ptδt−1b − ca − c
1− δb(1− δb
∞Xt=1
ptδt−1b )− (wcw + (1− w)cl)
∞Xt=1
ptδt−1b
I now make some simplifying assumptions. First I will assume a distribution for thetime at which the decision is reached. Specifically, I assume a geometric law with factorθ. Thus θ is the probability that the decision is reached at t had it been not reachedat t − 1. Under that assumption, pt = θ(1 − θ)t−1. The intuition for that distributionwould be that a high θ would correspond to a very speedy justice. In the extreme case,where θ = 1, the decision is reached immediately. A low θ would indicate a slow justice.Then: ∞X
t=1
ptδt−1b =
θ
δbθ + 1− δb
with (1 − θ)δb < 1, the sum therefore converges. Note that a very patient player(δb = 1) will have θ
δbθ+1−δb = 1, meaning that no matter how the justice performs, he willget his compensation. A very impatient player (δb = 0) will have θ
δbθ+1−δb = θ, meaningthat his compensation is discounted by the speed of the judicial system.I also assume, in order to simplify matters even more, that ca = 0, cw = 0 (the
winner does not pay anything), w = 1 (the claimant, or buyer, wins for sure: the justiceis fair), and c = 0 (no cost of trial). Therefore:
Ucourt(θ) = E(netgain) =pθ
δbθ + 1− δb
If φ is defined as θδbθ+1−δb , Ucourt(θ) can then be rewritten as:
Ucourt(θ) = pφ
30

The intuition for this expression is that if θ = 1 (the ideal instantaneous judicialsystem) then Ucourt(1) = p which is the exact amount the buyer has had taken fromhim. If θ = 0 (never ending justice system) then Ucourt(0) = 0. Note that Ucourt(θ) is anincreasing function of θ. To be completely rigorous in section 2, I should consider thefact that φ depends also on δb . The intuition for this being that a very patient playerwill be rewarded even if the judiciary is slow. However, to simplify the algebra in thispaper, I will only consider φ.
A2. Proposition 3:Proposition 3: The interest rate r charged by the bank is a decreasing function of
φ; the number of people who cooperate with the bank 1− δ∗∗e is an increasing function ofφ.Proof. We have:
Ubank = (1− δ∗∗e )
"tX
i=0
δibankr
#+ δ∗e [φc− 1 + δbankUbank] = r
So, Ubank =1
1−δ∗eδbank
³(1−δ∗∗e )r1−δbank + δ∗e [φc− 1]
´We can plug in here the expression of δ∗∗e (we will keep δ∗e as it is then it depends
only on r, δf , π), to yield:
Ubank =1
1− δ∗eδbank
µ(π − r)r
(1− δbank)(π + 1− φc)+ δ∗e [φc− 1]
¶So Ubank = r ⇔ (π − r)r = (1− δbank)(π + 1− φc) [(1− δ∗eδbank)r − δ∗e [φc− 1]]The right hand side is a function of φ and not r. I denote this A(φ). Hence r2 −
πr + A(φ) = 0. This defines a function g such that g(r, φ) = 0. The implicit functiontheorem states that there exists a function f such that r = f(φ) with f 0(φ) = −∂g/∂φ
∂g/∂r.
I assume that ∂g∂r= 2r − π < 0 since it is reasonable to expect the expected returns
on projects conducted by the small firms in my sample to be quite large. Turning to∂g/∂φ:
∂g∂φ= ∂A(φ)
∂φ= (1− δbank) [−c[(1− δ∗eδbank)r − δ∗e(φc− 1)] + (π + 1− φc)(−δ∗ec)] < 0
Indeed, if c is small enough, this term will be negative (as the right-hand side is anegative function of c).Overall, we find that ∂r
∂φ= f 0(φ) < 0 as expected. The interest rate r charged by the
bank is a decreasing function of φ as suggested.I can now study the number of people 1− δ∗∗e of people that will cooperate with the
bank as in the second part of the proposition:δ∗∗e =
r+1−φcπ+1−φc
∂δ∗∗e∂r
=∂r∂φ(π + 1− φc)− c(π − r)
(π + 1− φc)2< 0
31
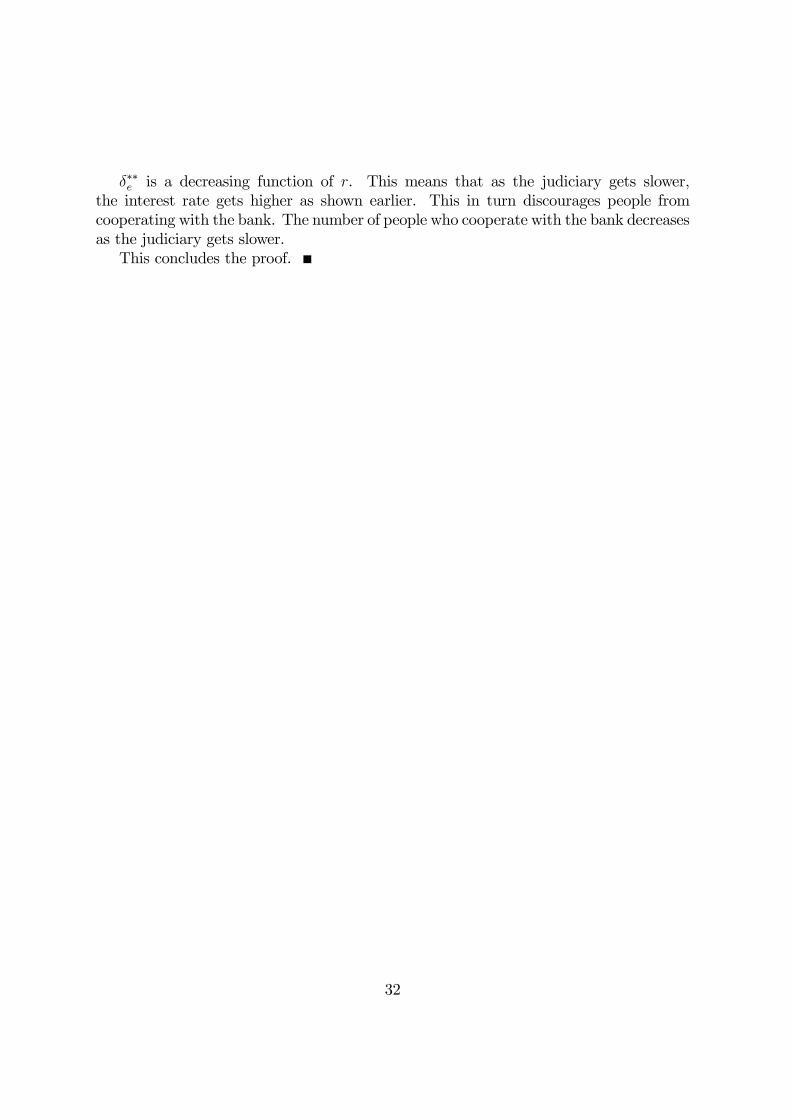
δ∗∗e is a decreasing function of r. This means that as the judiciary gets slower,the interest rate gets higher as shown earlier. This in turn discourages people fromcooperating with the bank. The number of people who cooperate with the bank decreasesas the judiciary gets slower.This concludes the proof.
32
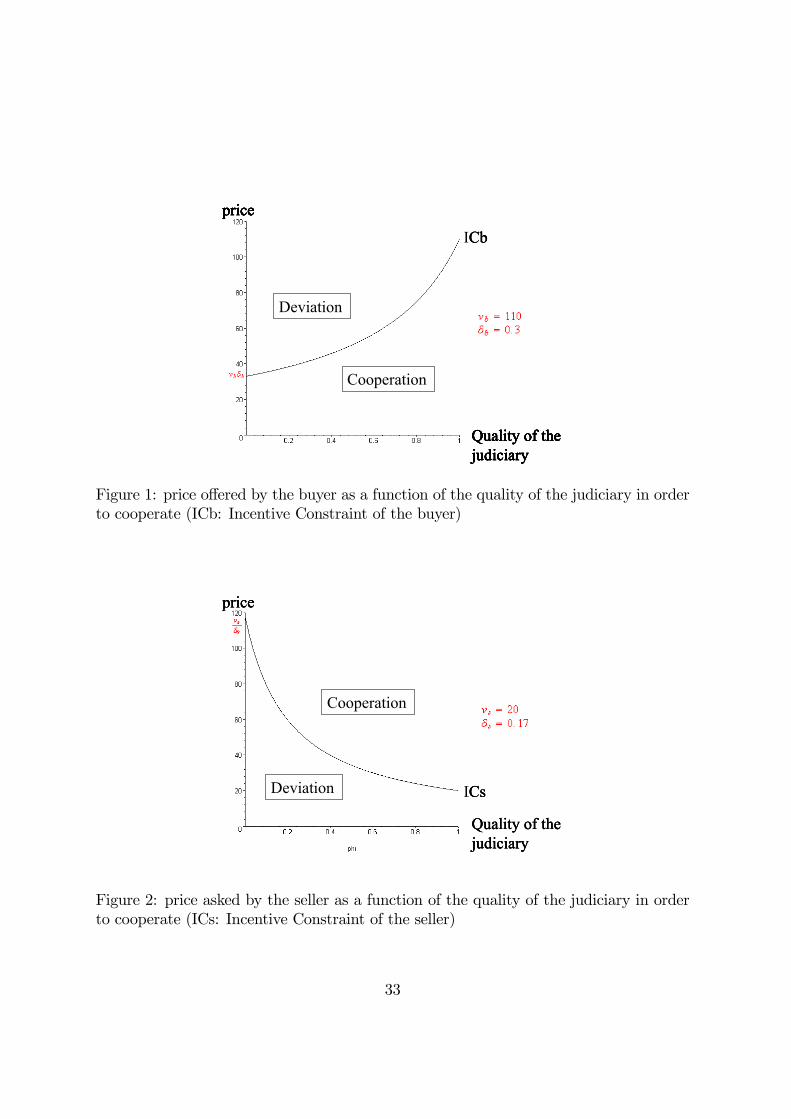
Cooperation
Deviation
price
Quality of the judiciary
ICb
Cooperation
Deviation
price
Quality of the judiciary
ICb
Cooperation
Deviation
price
Quality of the judiciary
Cooperation
Deviation
price
Quality of the judiciary
Cooperation
Deviation
price
Quality of the judiciary
Cooperation
Deviation
price
Quality of the judiciary
ICb
Figure 1: price offered by the buyer as a function of the quality of the judiciary in orderto cooperate (ICb: Incentive Constraint of the buyer)
ICs
Cooperation
Deviation
price
Quality of the judiciary
ICs
Cooperation
Deviation
price
Quality of the judiciary
ICs
Cooperation
Deviation
price
Quality of the judiciary
Figure 2: price asked by the seller as a function of the quality of the judiciary in orderto cooperate (ICs: Incentive Constraint of the seller)
33
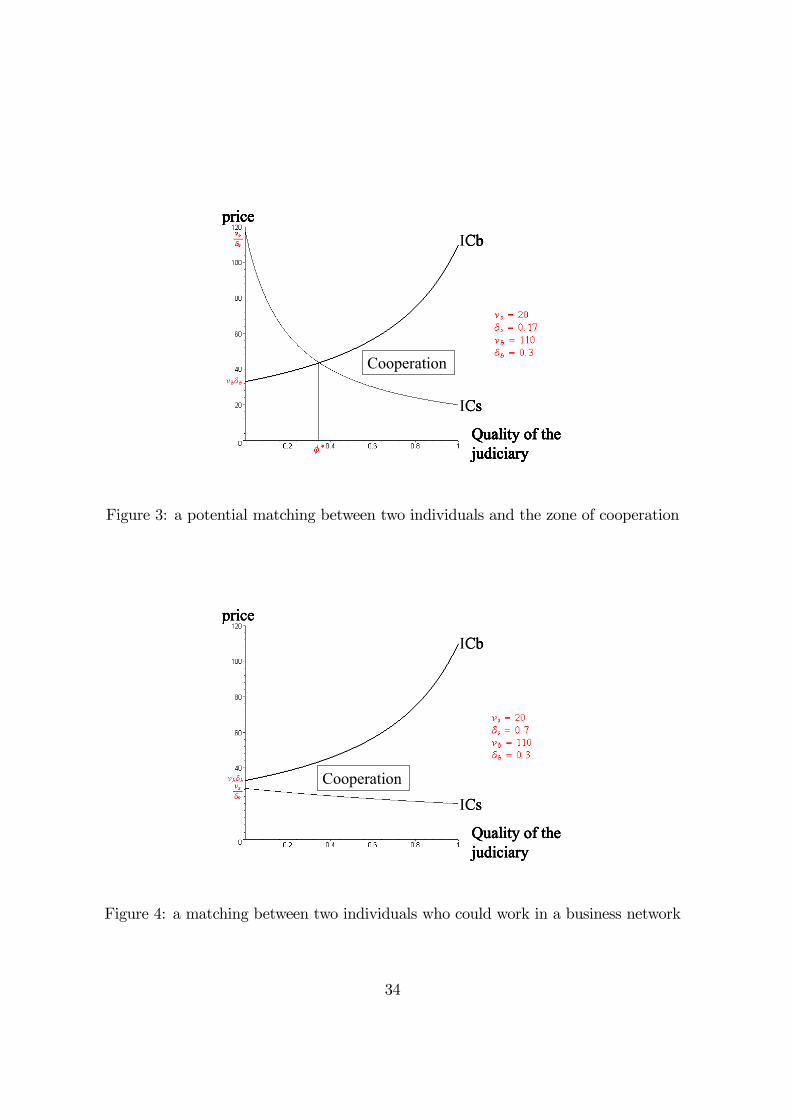
price
Cooperation
Quality of the judiciary
ICs
ICbprice
Cooperation
Quality of the judiciary
ICs
ICbprice
Cooperation
Quality of the judiciary
ICs
ICbprice
Cooperation
Quality of the judiciary
price
Cooperation
Quality of the judiciary
price
Cooperation
Quality of the judiciary
ICs
ICb
Figure 3: a potential matching between two individuals and the zone of cooperation
price
Quality of the judiciary
CooperationICs
ICb
price
Quality of the judiciary
CooperationICs
ICb
price
Quality of the judiciary
Cooperation
price
Quality of the judiciary
CooperationICs
ICb
Figure 4: a matching between two individuals who could work in a business network
34

price
Quality of the judiciary
ICb
ICs
2
1
price
Quality of the judiciary
ICb
ICs
2
1
Figure 5: the potential partners of a seller
35
Data Appendix
Variable Unit Definition Source Court Data
Pendency percentage in High Courts in 1999 and 1998
% (number of cases pending trial at the end of the year)/(number of cases filed+number of cases pending at the beginning of the year)
Annual Report, Ministry of Law, Justice and Company Affairs
Expected duration of a case in High Court in 1996 and 1995
years number of pending cases at the beginning of the period plus number of filed cases within the year divided by the number of cases disposed of within the year
Law commission reports, Annual Reports of the Ministry of Law and Justice.
Pendency percentage in 2000 of criminal cases
% (number of cases pending trial at the end of the year)/(number of cases filed+number of cases pending at the beginning of the year)
governmental publication "Crime in India", 2000.
State-level data State GDP per Capita*
Rupees net state domestic product per capita at current prices, 1999-2000
Directorate of Economics and Statistics of respective State Governments and Union Territories
State Per Capita Income Growth Rate
% For 1997-2001 Lok Sabha Unstarred Question No. 1528, dated, 27.11.2002.
State Enrolment*
% Gross enrolment ratio in classes I-VIII (6-14 years) per state
Selected Educational Statistics, 2000-01, Ministry of Human Resource Development, Government of India.
State literacy* % for 2001 Office of the Registrar General of India
State Credit per Capita*
Rupees crore per thousand persons
Total credit of public banks divided by state population in 2002
Credit: Reserve Bank of India, population: Office of the Registrar General of India, Ministry of Home Affairs
State Expenditure for the Organs of State
Rs. Lakhs at 2002 prices
Organs of State: Administration of Justice, State Legislature, Governer, Council of Ministers, and Elections.
www.statesforum.org
State Unit Cost per Policemen (per annum)
Rs. Total Police Expenditure divided by Actual Police Strength (civil and armed)
Crime in India, Table 92, 2001, Governmental Publication.
State length of roads per capita
Km per thousand persons
State length of roads divided by state population in 2001
Statistical Abstract 2001
State Access to Safe Drinking Water in Households in India*
% Rural and Urban combined in 1991 Housing and Amenities, Pa1.r 2 of 1993; Census of India 1993.
State Death Rate*
Per 1000 Death Rate in 2000. Ministry of Health and Family Welfare, Govt. of India
State Male Life Expectancy*
years State Male Life Expectancy in 2000
Ministry of Health and Family Welfare, Govt. of India
Percentage of seats won by Bharatyia Janata Party in 2000 (or at the last previous election) per state
% Number of seats won by the Bharatyia Janata Party in 2000, (including Akhil Bharatiya Ram Rajya Prishad for Madhya Pradesh) divided by the Number of seats in the state legislature Vidhan Sabha, the Lower House.
Election Commission of India.
Firm-level data Indebtedness Total amount of loans outstanding
divided by the amount of capital (=total assets owned+ total assets hired); assets=tools+transport+land+plant)
Interest Payment
Total Interest Payments due divided by the total year receipts.
Loan from Financial Institutions
Rupees Amount of loan coming from a central and state level term lending institutions; the government (central, state, local Bodies); public sector banks and other commercial banks; cooperative banks and societies; other institutional agencies
Temporary job in the Enterprise
Share of the temporary work (male or female) in the total number of hours worked in the enterprise
Cost of labour per employee
Rupees per employee
Total salary (=salary+group benefits) divided by the number of hours worked
Number of other activities
Number of other activities taken up during the last 365 days
registered Act of registration Female owner 1=the owner is a female, 0=male
NSS, 55th round, 1999-2000, Schedule2: Informal Non-Agricultural Enterprises
Sector-level data Output Current US
dollars Industrial Statistics
Database 2003 at the 3- and 4-digit level of ISIC Code (Revision 3)

Value added Current US dollars
Industrial Statistics Database 2003 at the 3- and 4-digit level of ISIC Code (Revision 3)
*Collected on http://indiabudget.nic.in/es2002-03/tables.htm An outline of the sampling design of the 55th round of the NSS of 2000.
The 55th round of NSS is an integrated survey on informal non-agricultural enterprises (other than those covered by the Annual Survey of Industries and other industrial categories of `mining & quarrying' & `electricity, gas and water supply'). The survey covers the whole of the Indian Union. The fieldwork of 55th round of NSS is from 1st July, 1999 to 30th June, 2000.
A stratified sampling design has been adopted for selection of the sample first-stage units (FSU's). The FSU's are villages (Panchayat wards for Kerala) for rural areas and Urban Frame Survey (UFS) blocks for urban areas. List of villages (Panchayat wards for Kerala) as per 1991 Census and latest lists of UFS blocks are respectively used for selection of rural and urban sample FSU's. A total number of 10,384 FSU's are selected randomly for survey in the central sample at all-India level (rural & urban combined) in the 55th round. The Ultimate stage units (USU's) are enterprises which are selected by the method of circular systematic sampling from the corresponding frame in the FSU. Large FSU's are subdivided into hamlet groups (rural)/ sub-blocks (urban), which are grouped into two segments, and USU's are selected independently from each of these segments: All the eligible enterprises in a segment (both rural & urban) are stratified into 12 strata by jointly considering their broad industry group (manufacturing; construction; trade & repair services; hotels & restaurants; transport, storage & communication; other service sector).and enterprise class (hired worker or not). Approximate number of enterprises of each strata in the hamlet/sub-block are gathered, as well as the proportion of enterprises in the FSU. Multipliers, defined as the inverse of the probability that the observation is included due to the sampling design, are therefore constructed. I take into account these multipliers in my empirical analysis and can therefore conclude that the sample is representative.

(1) (2) (3) (4)Dependent Variablependency percentage of total cases in High Courts in 1999 0.1546 0.0948 0.1012 0.1113
(3.03)*** (2.82)*** (3.00)*** (4.28)***state-level controls no yes yes yesfirm-level controls no no yes yessector dummies (NIC2) no no no yesObservations 176130 176130 172533 172484
• non-recovery of service charges, fees, credit: =1 if the entreprise experienced a major problem of non-recovery of service charges, fees, credit; =0 otherwise• Probit regressions. Robust z-statistics in parentheses, clustered at the level of the state• * significant at 10%; ** significant at 5%; *** significant at 1%• Rather than the coefficients, we report the change in the probability for an infinitesimal change in each independent, continuous variable and, by default, the discrete change in the probability for dummy variables.• Multipliers defined as the inverse of the probability that the observation is included due to the sampling design are used as weights in the regressions.
non-recovery of service charges, fees, credit
Table 1: The impact of pendency on the occurrence of breach of contract

(1) (2) (3) (4) (5)Dependent Variable contract1
pendency percentage of total cases in High Courts in 1999 0.1080 -0.0231 -0.1255 -0.1837 -0.1144(1.63) (0.18) (2.45)** (3.61)*** (1.89)*
state-level controls yes no yes yes yesfirm-level controls yes no no yes yessector dummies (NIC2) yes no no no yesObservations 166085 12295 12295 12011 11989
• 1 =1 if the entrepise works on a contract basis; =0 otherwise• 2 =1 if the entreprise undertakes a relationship-specific investment contract; =0 otherwise (restricted to the entreprises working on a contract basis) • a relationship-specific investment contract is defined as a contract where the design is specified by the contractor and when the equipment/raw material is supplied by the master unit/contractor • Probit regressions. Robust z-statistics in parentheses, clustered at the level of the state• * significant at 10%; ** significant at 5%; *** significant at 1%• Rather than the coefficients, we report the change in the probability for an infinitesimal change in each independent, continuous variable and, by default, the discrete change in the probability for dummy variables.• Multipliers defined as the inverse of the probability that the observation is included due to the sampling design are used as weights in the regressions.
relationship-specific investment contract2
Table 2: The impact of pendency on the probability of working on a contract basis

(1) (2) (3) (4) (5)Dependent Variable shortage of capital1 loan2 formal loan3 business loan4 "relative" loan5
pendency percentage of total cases in High Courts in 1999 0.4105 -0.0519 -0.0406 -0.0189 0.3347(4.53)*** (3.26)*** (4.19)*** (1.03) (9.12)***
state-level controls yes yes yes yes yesfirm-level controls yes yes yes yes yessector dummies (NIC2) yes yes yes yes yesObservations 172533 176127 175792 175709 15641
• 1shortage of capital:=1 if the entreprise experienced a major problem of shortage of capital; =0 otherwise
the sources of the loan are : central and state level term lending institutionsgovernment (central, state, local bodies)public sector banks and other commercial banksco-operative banks and societiesother institutional agenciesmoney lendersbusiness partner(s)suppliers/contractorsfriends and relativesothers
• 2loan:=1 if the entreprise got a loan; =0 otherwise• 3formal loan: =1 if the entreprise got a loan from lending institutions, government, banks; =0 otherwise• 4business loan: =1 if the entreprise got a loan from suppliers/contractors and moneylenders; =0 otherwise• 5"relative" loan: =0 if the entreprise got a loan from friends and relatives or the business partner; =0 otherwise (among the entreprises which got a loan; this restriction is imposed because we observed too few loans of that type)• Probit regressions. Robust z-statistics in parentheses, clustered at the level of the state• * significant at 10%; ** significant at 5%; *** significant at 1%• Rather than the coefficients, we report the change in the probability for an infinitesimal change in each independent, continuous variable and, by default, the discrete change in the probability for dummy variables.• Multipliers defined as the inverse of the probability that the observation is included due to the sampling design are used as weights in the regressions.
Table 3: The impact of pendency on shortage of capital

(1) (2) (3) (4)Dependent Variablependency percentage of total cases in High Courts in 1999 0.2937 0.4487 0.3118 0.2937
(1.04) (2.92)*** (1.97)** (2.14)**state-level controls no yes yes yesfirm-level controls no no yes yessector dummies (NIC2) no no no yesObservations 3619 3619 3540 3535
• There are two possible types of partnership: partnership with members of the same household and partnership between members not all from the same household.• 1dynasty=1 if the type of partnership is the one with members of the same household; =0 otherwise• Probit regressions. Robust z-statistics in parentheses, clustered at the level of the state• * significant at 10%; ** significant at 5%; *** significant at 1%• Rather than the coefficients, we report the change in the probability for an infinitesimal change in each independent, continuous variable and, by default, the discrete change in the probability for dummy variables.• Multipliers defined as the inverse of the probability that the observation is included due to the sampling design are used as weights in the regressions.
Table 4: The impact of pendency on the type of ownership
dynasty1

(1) (2) (3) (4) (5) (6) (7) (8)pendency percentage of total cases in High Courts in 1999 0.1113 (from Annual Report, Ministry of Law, Justice and Company Affairs) (4.28)***pendency percentage of total cases in High Courts in 1998 0.1350
(7.41)***expected duration of a trial in High Court in 19961 0.0169
(8.98)***pendency rate in 962 0.0568
(5.86)***expected duration of a trial in High Court in 19951 0.0184
(8.70)***pendency rate in 952 0.0553
(5.65)***pendency percentage in 2000 of criminal cases3 0.0008
(1.64)number of cases solved divided by number of cases pending in1999 -0.0513
(4.78)***state-level controls yes yes yes yes yes yes yes yesfirm-level controls yes yes yes yes yes yes yes yessector dummies (NIC2) yes yes yes yes yes yes yes yesObservations 172484 172484 172484 172484 172484 172484 172484 172484• Dependent Variable: non-recovery of service charges, fees, credit: =1 if the entreprise experienced a major problem of non-recovery of service charges, fees, credit; =0 otherwise• 1expected duration of a case in High Court, measured in number of pending cases at the beginning of the period plus number of filed cases within the year divided by the number of cases disposed of within the year. Unit=years. Source: Law commission reports, Annual Reports of the Ministry of Law and Justice.• 2the pendency rate is therefore defined as 1-1/durationNote: pending beginning+filed=pending end+solved• 3obtained from the governmental publication "Crime in India"• Probit regressions. Robust z-statistics in parentheses, clustered at the level of the state• * significant at 10%; ** significant at 5%; *** significant at 1%• Rather than the coefficients, we report the change in the probability for an infinitesimal change in each independent, continuous variable and, by default, the discrete change in the probability for dummy variables.• Multipliers defined as the inverse of the probability that the observation is included due to the sampling design are used as weights in the regressions.
Table 5: The impact of different measures of pendency on the occurrence of breach of contract

Table 6: The Judiciary's Technology(1) (2) (3)
number of cases disposed in High Courts number of cases pending in High Courtsin 1998 per judge (in 1996) in 1998 per judge (in 1996)
number of cases registered in High Courts 1.0839 -0.7998 -0.2181 in 1998 per judge (in 1996) (3.63)** (0.78) (0.26)state gdp per capita -0.3084 1.8708 1.3234
(0.91) (1.93) (1.89)state literacy 82.8499 -427.4482 -292.9959
(0.63) (1.41) (1.03)state credit per capita 1,466.0724 -15,832.4875 -10,424.1992
(0.99) (3.33)** (2.54)state length of roads per capita 100.9783 -1,453.6618 -1,265.7511
(0.33) (1.82) (1.92)unit cost per policemen 0.0395 -0.0777 -0.0046
(1.18) (0.93) (0.08)state expenditure on organs of state in 1990 0.0078 -0.0413 -0.4511
(0.28) (0.43) (3.71)*state per capita income growth rate -145.2128 1,965.3133 1,548.9773
(0.61) (2.66)* (2.25)state enrolment 0.3154 232.9765 257.3264
(0.01) (3.24)** (7.24)**state death rate -1,065.7910 11,582.0552 9,608.4421
(0.85) (2.96)* (4.01)*state male life expectancy -317.2449 3,867.5349 3,389.6623
(0.77) (3.15)* (4.06)*state access to safe drinking water 39.1450 -99.1148 -102.7529 in households in India (0.90) (0.86) (1.25)number of judges required (based on a ratio 2.7870 of 5 judges for 100,000 inhabitants (3.11)*Constant 20,335.4241 -334973.7834 -302459.5812
(0.69) (3.38)** (5.57)**Observations 16 16 16R-squared 0.95 0.95 0.99Robust t statistics in parentheses * significant at 10%; ** significant at 5%; *** significant at 1%

(1) (2) (3) (4)dependent variable breach of contract1 RSI contract2 shortage of capital3 dynasty4
pendency percentage of total cases in High Courts in 1999 0.3266 -0.3609 1.6541 2.0902(3.45)*** (1.52) (3.29)*** (2.80)***
number of panchayats per million inhabitants5 0.0007 -0.0012 0.0042 0.0047(2.04)** (1.40) (2.29)** (1.74)
number of planning commissions per million inhabitants5 0.0005 -0.0070 0.0144 0.0106(0.20) (3.70)*** (1.56) (0.96)
state-level controls yes yes yes yesfirm-level controls yes yes yes yessector dummies (NIC2) yes yes yes yesObservations 160476 11619 160523 3280
• 1non-recovery of service charges, fees, credit: =1 if the entreprise experienced a major problem of non-recovery of service charges, fees, credit; =0 otherwise• 2=1 if the entreprise undertakes a relationship-specific investment contract; =0 otherwise (restricted to the entreprises working on a contract basis) • 3shortage of capital:=1 if the entreprise experienced a major problem of shortage of capital; =0 otherwise• 4dynasty=1 if the type of partnership is the one with members of the same household; =0 otherwise• 5Obtained from the statistical abstracts of the CSO (Central Statistical Organisation) of the Department of Statistics within the Ministry of Planning• Probit regressions. Robust z-statistics in parentheses, clustered at the level of the state• * significant at 10%; ** significant at 5%; *** significant at 1%• Rather than the coefficients, we report the change in the probability for an infinitesimal change in each independent, continuous variable and, by default, the discrete change in the probability for dummy variables.• Multipliers defined as the inverse of the probability that the observation is included due to the sampling design are used as weights in the regressions.
Table 7: The impact of alternative dispute resolution on the contracting behaviour of the enterprise

(1) (2) (3) (4) (5) (6) (7) (8)
Dependent variable breach1 RSI contract2 shortage3 dynasty4 breach1 RSI contract2 shortage3 dynasty4
interaction between the pendency percentage 0.0132 0.2783 0.4549 0.6008 0.1721 -0.2006 0.2676 0.5649 in 1999 and the demand for justice5 (0.07) (1.12) (2.38)** (1.82)* (1.62) (1.91)* (1.74)* (1.61)state-level controls yes yes yes yes yes yes yes yesfirm-level controls yes yes yes yes yes yes yes yessector dummies (NIC2) yes yes yes yes yes yes yes yesObservations 50063 8655 50112 936 44490 7944 44506 797
• 1non-recovery of service charges, fees, credit: =1 if the entreprise experienced a major problem of non-recovery of service charges, fees, credit; =0 otherwise• 2=1 if the entreprise undertakes a relationship-specific investment contract; =0 otherwise (restricted to the entreprises working on a contract basis) • 3shortage of capital:=1 if the entreprise experienced a major problem of shortage of capital; =0 otherwise• 4dynasty=1 if the type of partnership is the one with members of the same household; =0 otherwise• 5the interaction term is calculated as the product of the pendency percentage in High Courts in 1999 (at the level of the state) and the demand for justice of the firm (at the level of the sector). The demand for justice is calculated for each sector of manufacturing in United States (or in Canada) as one minus the vertical integration of the sector; the vertical integration being measured as the ratio of value added to total sales. • Probit regressions. Robust z-statistics in parentheses, clustered at the level of the state• * significant at 10%; ** significant at 5%; *** significant at 1%• Rather than the coefficients, we report the change in the probability for an infinitesimal change in each independent, continuous variable and, by default, the discrete change in the probability for dummy variables.• Multipliers defined as the inverse of the probability that the observation is included due to the sampling design are used in the regressions.
demand for justice calculated in the USA demand for justice calculated in Canada
Table 8: The impact of the interaction between pendency and the demand for justice on the contracting behaviour of the firm
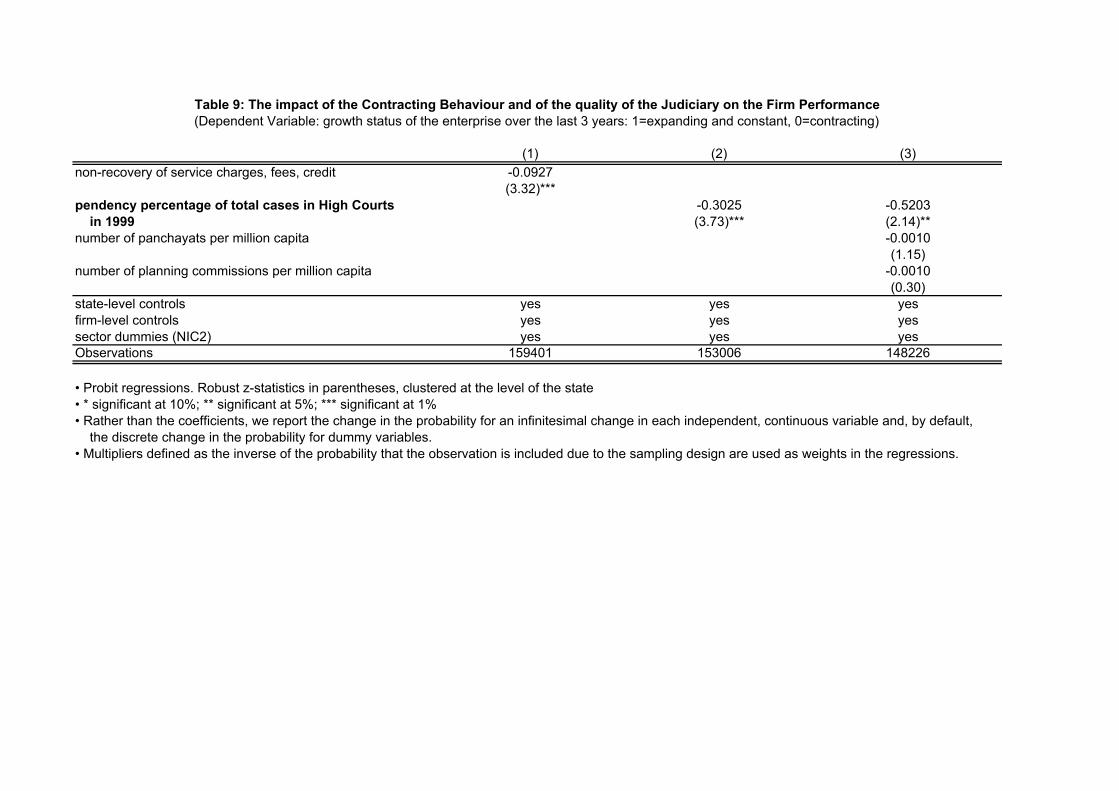
(1) (2) (3)non-recovery of service charges, fees, credit -0.0927
(3.32)***pendency percentage of total cases in High Courts -0.3025 -0.5203 in 1999 (3.73)*** (2.14)**number of panchayats per million capita -0.0010
(1.15)number of planning commissions per million capita -0.0010
(0.30)state-level controls yes yes yesfirm-level controls yes yes yessector dummies (NIC2) yes yes yesObservations 159401 153006 148226
• Probit regressions. Robust z-statistics in parentheses, clustered at the level of the state• * significant at 10%; ** significant at 5%; *** significant at 1%• Rather than the coefficients, we report the change in the probability for an infinitesimal change in each independent, continuous variable and, by default, the discrete change in the probability for dummy variables.• Multipliers defined as the inverse of the probability that the observation is included due to the sampling design are used as weights in the regressions.
Table 9: The impact of the Contracting Behaviour and of the quality of the Judiciary on the Firm Performance(Dependent Variable: growth status of the enterprise over the last 3 years: 1=expanding and constant, 0=contracting)

(1) (2) (3) (4)
dependent variable status of the firm2 number of firms3 status of the firm2 number of firms3
interaction between the pendency percentage -0.1731 -214.2002 -0.1431 -87.6315 in 1999 and the demand for justice1 (2.77)*** (4.76)*** (3.02)*** (1.73)state-level controls yes yes yes yesfirm-level controls yes no yes nosector dummies (NIC2) yes yes yes yesObservations 46925 597 41610 527
• 1the interaction term is calculated as the product of the pendency percentage in High Courts in 1999 (at the level of the state) and the demand for justice of the firm (at the level of the sector). The demand for justice is calculated for each sector of manufacturing in United States (or in Canada) as one minus the vertical integration of the sector; the vertical integration being measured as the ratio of value added to total sales. • 2growth status of the enterprise over the last 3 years: 1=expanding and constant, 0=contracting• 3number of firms per sector per state• Probit regressions. Robust z-statistics in parentheses, clustered at the level of the state• * significant at 10%; ** significant at 5%; *** significant at 1%• Rather than the coefficients, we report the change in the probability for an infinitesimal change in each independent, continuous variable and, by default, the discrete change in the probability for dummy variables.• Multipliers defined as the inverse of the probability that the observation is included due to the sampling design are used as weights in the regressions.
demand for justice calculated in the USA demand for justice calculated in Canada
Table 10: The impact of the interaction between pendency and the demand for justice on the status of the firm