How do animals persist/increase in an area?. y.
60
How do animals persist/increase in an area?
-
date post
22-Dec-2015 -
Category
Documents
-
view
218 -
download
2
Transcript of How do animals persist/increase in an area?. y.

How do animals persist/increase in an area?


y
If the biota in the course of eons, has built something we like but do not understand, then who but a fool would discard seemingly useless parts? To keep every cog and To keep every cog and wheel is the first wheel is the first precaution of intelligent precaution of intelligent tinkeringtinkering
A. Leopold

Variation
Within a species, there is variation• Ex. Morphology (size, shape, color), behavior
Some of this is linked to genetic variation• Heritable
Different variations are better suited for certain conditions• Those that are better suited for conditions do better (more
food/different food; new nest sites, danger avoidance, etc…)• When this variation is heritable, it is passed on to offspring
and, if conditions remain the same, they gain an advantage.

Where does variation come from?
• Mutation – errors – Most are harmful or neutral
• Gene flow – migration followed by breeding– Add new alleles to population pool or change frequencies
of alleles present
• Genetic drift – chance alterations in small populations– bottlenecks and founder effects
• Accumulates over time

Natural Selection
• Individuals within populations are variable for nearly all traits
• Individuals pass on their genes to offspring• More offspring are produced than can survive• Individuals that survive and go on to reproduce (the
most) are those with the varieties (alleles) that best adapt them to their environment
• Outcome: alleles associated with higher fitness increase in frequency from one generation to the next
Evolution
• Any cumulative change in the characteristics of organisms or populations from generation to generation
• Evolutionary agents – Mutation
– Gene flow
– Genetic drift
– Natural selection

It is not the strongest of the species that survive, nor the most intelligent, but the ones most responsive to change.
C. Darwin

Dangers in context of our world today
• Losing large numbers of animals, can lose variation as well
• May limit individual’s ability to persist under current conditions
• Or future conditions . . .

Individuals belong to populations
What is a population?• a group of organisms of the same species
occupying a defined area (habitat patch) at the same time
Ostrich in the savannahs of the Loeli area, Sudan. Photo by Paul Elkan ©2007 Nat. Geo./ WCS

Density: amount per unit area (hectare, square kilometer, etc.)
Example: 7 frogs/hectare (ha)
100 m
100 m
(1 ha = 10,000 m2 = 0.01 km2 = 2.5 ac)
Density

Niche: an n-dimensional hypervolume which includes the range of biological and physical conditions under which an organism can exist, including the resources that an animal must exploit for growth and reproduction
A portion of the feeding niche of the Blue-gray Gnatcatcher (Smith & Smith 1998)
Prey length (mm)
Fo
rag
ing
he
igh
t (m
)
Niche

“BIDE”
Population size:
Nt = population size at time t
Nt+1 = population size at time t+1
Nt+1 = Nt + Births + Immigration – Deaths -Emigration
Growth rates:
r = exponential growth rate
λ (‘lambda’) = intrinsic population growth rate
Population size and rates of growth

Population
Reproduction, births, natality (B)
Mortality, death (D)
Emigration (E)Immigration (I)
“BIDE”
Population growth

Study Area
From 1999 to 2007, we studied songbird communities and populations within forest patches from 3 landscape types:
•Forest reserves (5)
•Developed Subdivisions (9)
•Changing landscapes (13)

Reserve sites are primarily forested.
Changing sites are undergoing residential development during the study
Developed sites are older residential areas built prior to the onset of study.

Closed System: r = (b - d)
r = actual growth rate of populationb = birth rated = death rate
Open System: r = (b - d) + (i - e)
i = immigratione = emigration
Population growth

Population
Reproduction, births, natality (B)
Mortality, death (D)
Emigration (E)Immigration (I)
Population growth

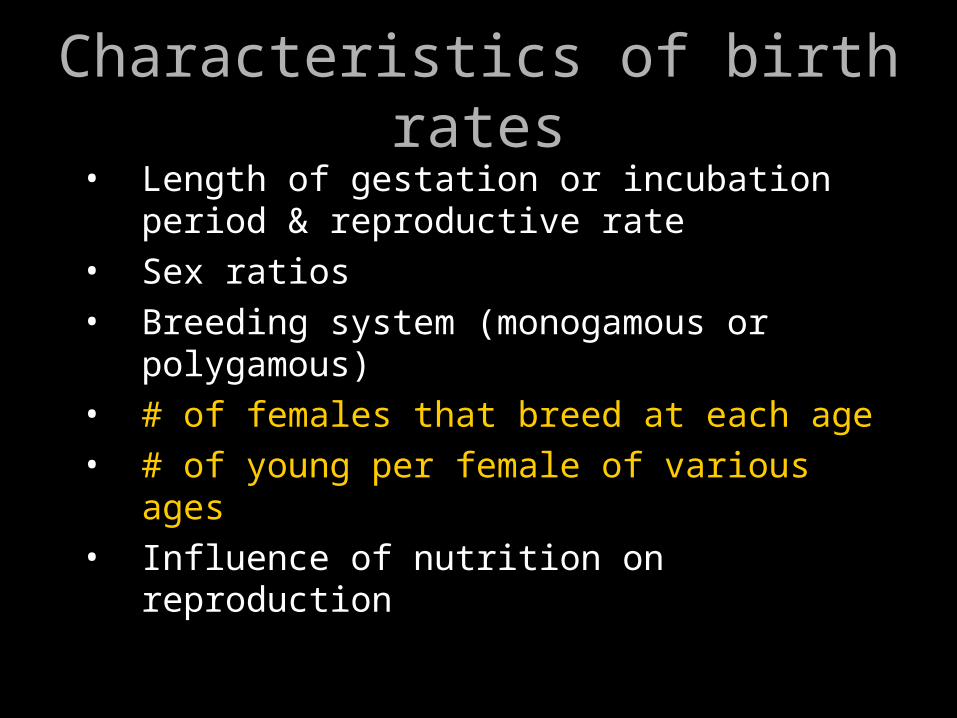
• Length of gestation or incubation period & reproductive rate
• Sex ratios• Breeding system (monogamous or
polygamous)• # of females that breed at each age• # of young per female of various ages• Influence of nutrition on reproduction
Characteristics of birth rates

r-selected species (fast species) : • shorter gestation period• reproduce more frequently• produce many offspring at a time
K-selected species (slow species): • longer gestation period• reproduce less frequently• produce few offspring at a time
Reproductive rates

• Length of gestation or incubation period & reproductive rate
• Sex ratios• Breeding system (monogamous or
polygamous)• # of females that breed at each age• # of young per female of various ages• Influence of nutrition on reproduction
Characteristics of birth rates
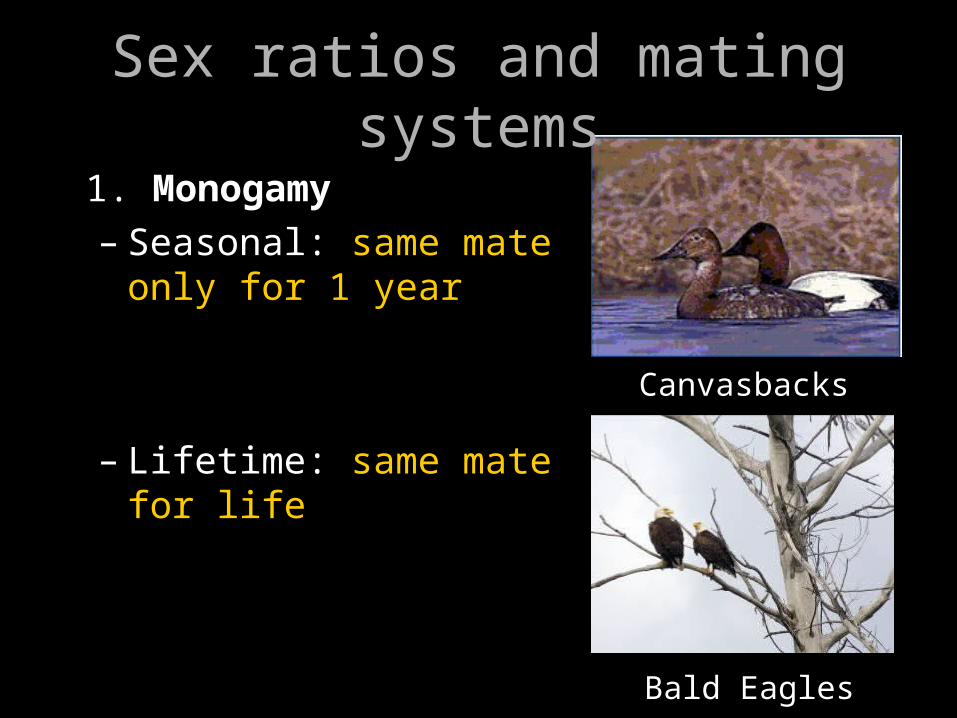
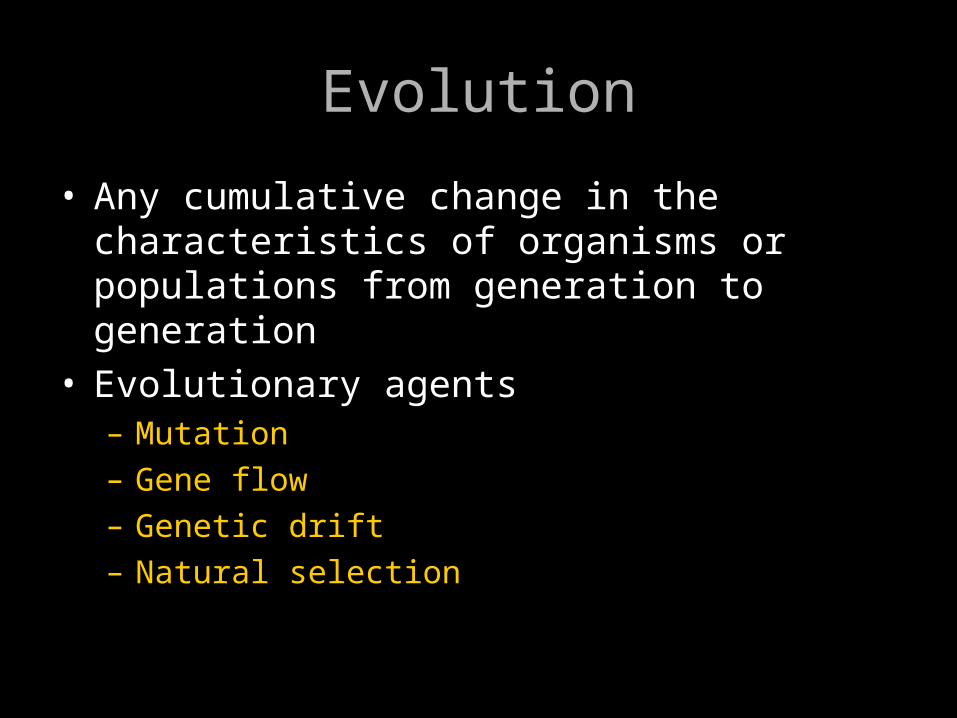
1. Monogamy– Seasonal: same mate
only for 1 year
– Lifetime: same mate for life
Canvasbacks
Bald Eagles
Sex ratios and mating systems

2. Polygamy
- polyandry: one female mates with several males
- polygyny: one male mates with several females
Red Phalaropes
Fur Seals
Sex ratios and mating systems

3. Promiscuity: no pair bonds
Sex ratios and mating systems
• Length of gestation or incubation period & reproductive rate
• Sex ratios• Breeding system (monogamous or
polygamous)• # of females that breed at each age• # of young per female of various ages• Influence of nutrition on reproduction
Characteristics of birth rates

Age (yrs) N # Female births perpregnant female
_____________________________________________0 - - 0.0001 60 2 0.0172 36 14 0.1943 70 52 0.3714 48 45 0.4695 26 19 0.3656 19 16 0.4217 6 5 0.417>7 10 7 0.350___________________________________________
A fecundity schedule for Chamois from New Zealand.
Age-specific birth rates

Monitoring Songbird Productivity
Productivity---Territory success and estimates of fledglings produced via spot mapping and nest monitoring.
Monitored and color-banded individuals of 7 species: # Colorbanded
Individuals# Territories/Nests
Monitored
American Robin 289 375
Bewick’s Wren 160 210
Dark-eyed Junco 141 339
Song Sparrow 1177 867
Spotted Towhee 533 848
Swainson’s Thrush 647 433
Winter Wren 195 552
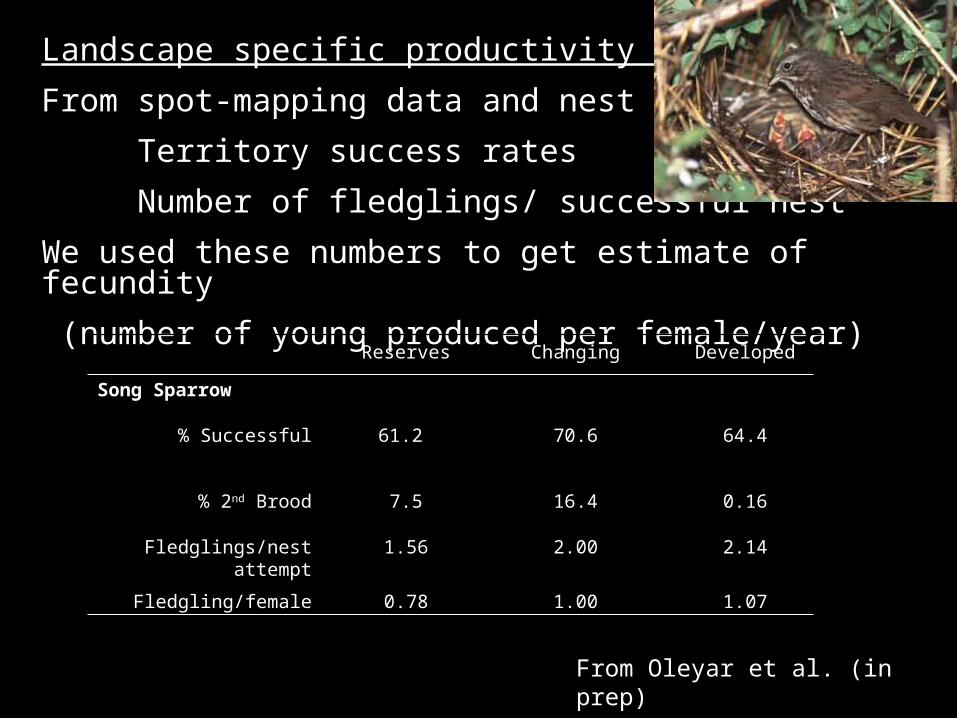
Landscape specific productivity estimates :
From spot-mapping data and nest monitoring
Territory success rates
Number of fledglings/ successful nest
We used these numbers to get estimate of fecundity
(number of young produced per female/year)
Reserves Changing Developed
Song Sparrow
% Successful 61.2 70.6 64.4
% 2nd Brood 7.5 16.4 0.16
Fledglings/nest attempt 1.56 2.00 2.14
Fledgling/female 0.78 1.00 1.07
From Oleyar et al. (in prep)

Landscape Species Fecundity var Adult se Juv se λ Upper λ *Developed American Robin 0.59 0.08 0.4 0.15 0.13 0.08 0.5416 0.962
Bewick's Wren 0.92 0.88 0.29 0.14 0.08 0.05 0.4526 0.9243Dark-eyed Junco 1.37 0.15 0.5 0.17 ** 0.7543 1.158Song Sparrow 1.13 0.46 0.54 0.03 0.21 0.04 0.827 1.022Spotted Towhee 0.57 0.12 0.5 0.06 0.18 0.05 0.6563 0.8795Swainson's Thrush 0.40 0.07 0.46 0.07 0.16 0.05 0.5719 0.7886Winter Wren 1.23 0.08 0.35 0.19 0.11 0.08 0.5823 1.207
Changing American Robin 0.89 0.16 0.55 0.12 0.18 0.08 0.7606 1.102Bewick's Wren 0.78 1.33 0.32 0.08 0.08 0.03 0.4566 0.7325Dark-eyed Junco 1.10 0.38 0.47 0.09 0.14 0.05 0.6924 0.9812Song Sparrow 1.23 0.21 0.54 0.02 0.18 0.03 0.8125 0.9273Spotted Towhee 0.82 0.46 0.55 0.03 0.18 0.03 0.7475 0.9013Swainson's Thrush 0.40 0.07 0.53 0.04 0.17 0.04 0.6368 0.7744Winter Wren 0.61 0.33 0.38 0.08 0.1 0.03 0.5016 0.7522
Reserve American Robin 0.80 0.13 0.71 0.22 0.31 0.23 0.9666 1.443Bewick's Wren 0.84 0.16 0.14 0.06 0.03 0.02 0.2435 0.4885Dark-eyed Junco 0.55 0.50 0.5 0.17 0.15 0.09 0.6308 1.176Song Sparrow 0.81 0.37 0.51 0.06 0.16 0.04 0.6962 0.9349Spotted Towhee 0.74 0.15 0.54 0.06 0.18 0.04 0.724 0.9245Swainson's Thrush 0.50 0.06 0.59 0.1 0.21 0.08 0.7332 0.9873Winter Wren 0.61 0.09 0.54 0.12 0.18 0.08 0.6974 1.057
* Upper 95% CI Limit of parameters used for calculating λ
** Changing Juv survival estimate used in calculating λ
Apparent Survival
From Oleyar et al. (in prep)
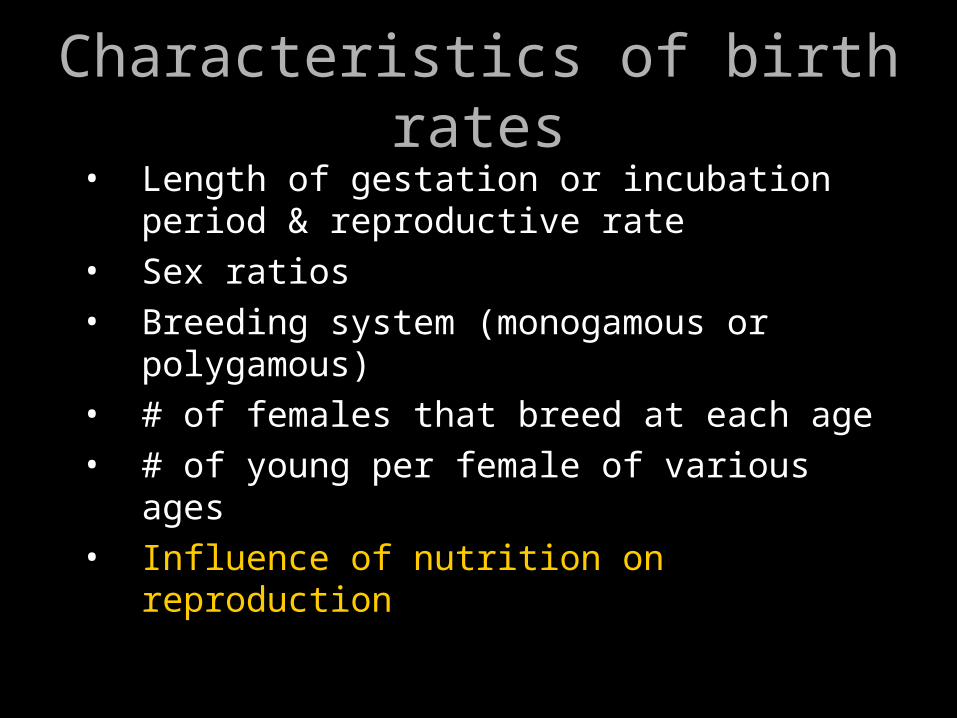
• Length of gestation or incubation period & reproductive rate
• Sex ratios• Breeding system (monogamous or
polygamous)• # of females that breed at each age• # of young per female of various ages• Influence of nutrition on reproduction
Characteristics of birth rates

Reindeer(caribou)
Bighorn sheep
Population density (top) or size (bottom)
# youngproduced

Population
Reproduction, births, natality (B)
Mortality, death (D)
Emigration (E)Immigration (I)
Population growth

2 4 6 8 10 12 14 16 18 20
males
females
Age at Death (years)
Survivors (lx)
Survivorship curves for male & female moose on Isle Royale

Estimating survival in different landscapes:
Mark and recapture:
Capture, mark, and release individuals in a population.
Recapture or re-sight individuals at regular intervals (yearly)
From this can estimate apparent survivorship and encounter rates.
Photo by T. Unfried
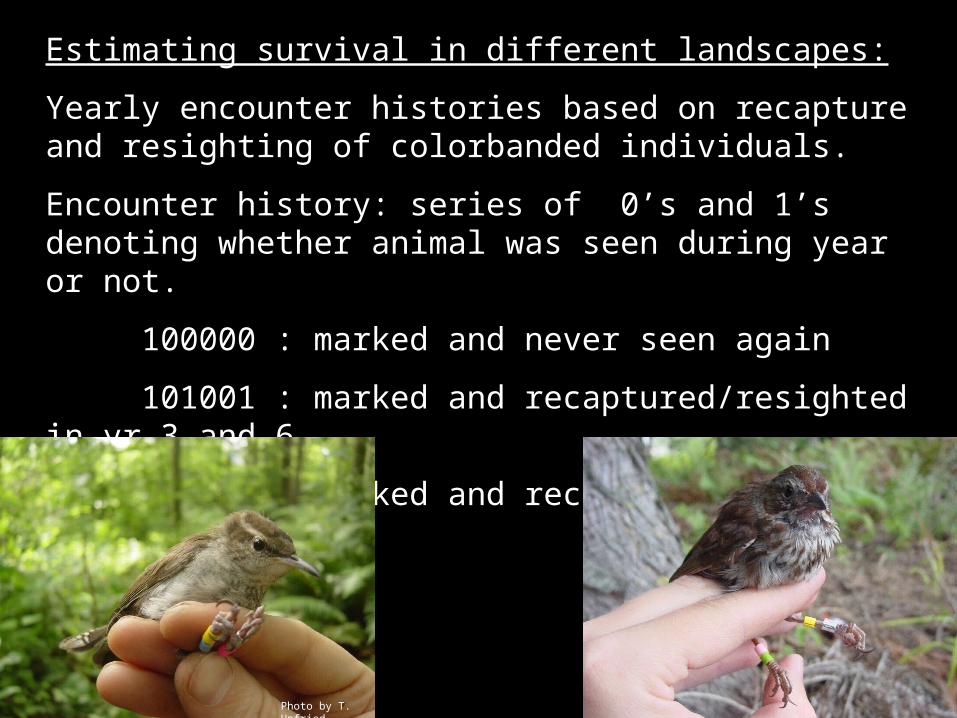
Estimating survival in different landscapes:
Yearly encounter histories based on recapture and resighting of colorbanded individuals.
Encounter history: series of 0’s and 1’s denoting whether animal was seen during year or not.
100000 : marked and never seen again
101001 : marked and recaptured/resighted in yr 3 and 6
111111 : marked and recaptured/resighted in every yr
Photo by T. Unfried

Landscape Species Fecundity var Adult se Juv se λ Upper λ *Developed American Robin 0.59 0.08 0.4 0.15 0.13 0.08 0.5416 0.962
Bewick's Wren 0.92 0.88 0.29 0.14 0.08 0.05 0.4526 0.9243Dark-eyed Junco 1.37 0.15 0.5 0.17 ** 0.7543 1.158Song Sparrow 1.13 0.46 0.54 0.03 0.21 0.04 0.827 1.022Spotted Towhee 0.57 0.12 0.5 0.06 0.18 0.05 0.6563 0.8795Swainson's Thrush 0.40 0.07 0.46 0.07 0.16 0.05 0.5719 0.7886Winter Wren 1.23 0.08 0.35 0.19 0.11 0.08 0.5823 1.207
Changing American Robin 0.89 0.16 0.55 0.12 0.18 0.08 0.7606 1.102Bewick's Wren 0.78 1.33 0.32 0.08 0.08 0.03 0.4566 0.7325Dark-eyed Junco 1.10 0.38 0.47 0.09 0.14 0.05 0.6924 0.9812Song Sparrow 1.23 0.21 0.54 0.02 0.18 0.03 0.8125 0.9273Spotted Towhee 0.82 0.46 0.55 0.03 0.18 0.03 0.7475 0.9013Swainson's Thrush 0.40 0.07 0.53 0.04 0.17 0.04 0.6368 0.7744Winter Wren 0.61 0.33 0.38 0.08 0.1 0.03 0.5016 0.7522
Reserve American Robin 0.80 0.13 0.71 0.22 0.31 0.23 0.9666 1.443Bewick's Wren 0.84 0.16 0.14 0.06 0.03 0.02 0.2435 0.4885Dark-eyed Junco 0.55 0.50 0.5 0.17 0.15 0.09 0.6308 1.176Song Sparrow 0.81 0.37 0.51 0.06 0.16 0.04 0.6962 0.9349Spotted Towhee 0.74 0.15 0.54 0.06 0.18 0.04 0.724 0.9245Swainson's Thrush 0.50 0.06 0.59 0.1 0.21 0.08 0.7332 0.9873Winter Wren 0.61 0.09 0.54 0.12 0.18 0.08 0.6974 1.057
* Upper 95% CI Limit of parameters used for calculating λ
** Changing Juv survival estimate used in calculating λ
Apparent Survival
From Oleyar et al. (in prep)
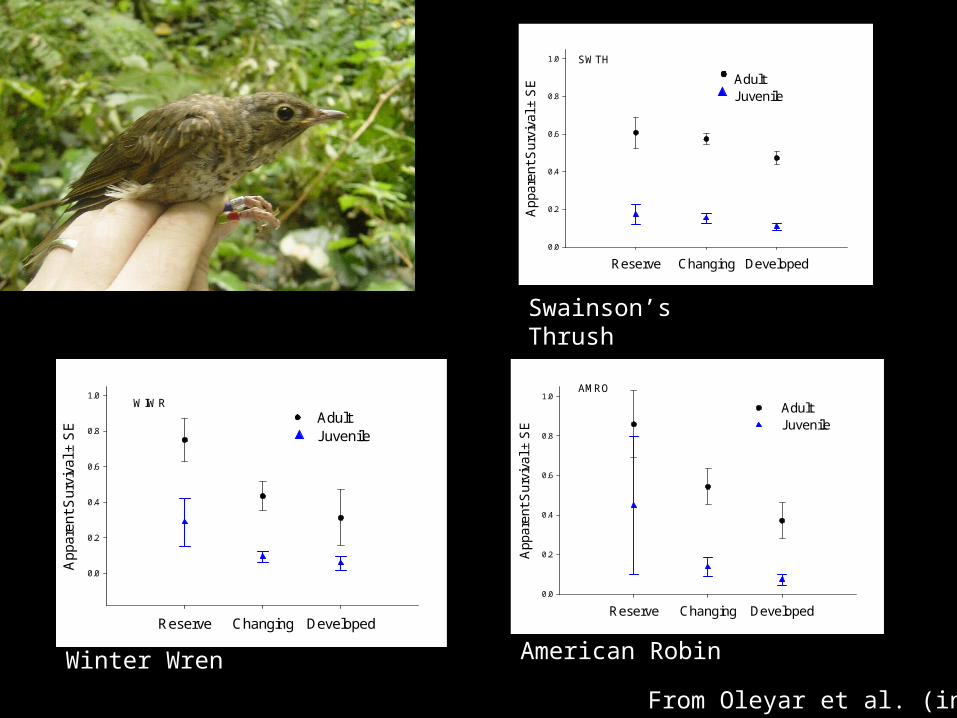
SWTH
Reserve Changing Developed
App
aren
t S
urvi
val ±
SE
0.0
0.2
0.4
0.6
0.8
1.0
AdultJuvenile
WIWR
Reserve Changing Developed
App
aren
t S
urvi
val ±
SE
0.0
0.2
0.4
0.6
0.8
1.0
AdultJuvenile
AMRO
Reserve Changing Developed
App
aren
t S
urvi
val ±
SE
0.0
0.2
0.4
0.6
0.8
1.0
AdultJuvenile
Winter Wren American Robin
Swainson’s Thrush
From Oleyar et al. (in prep)
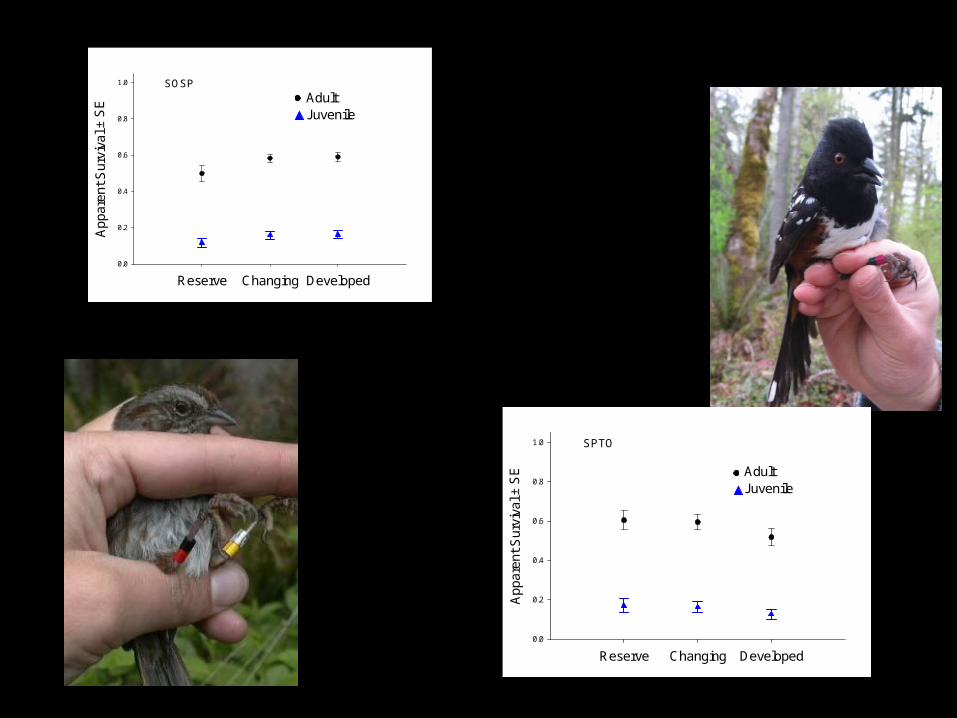
SPTO
Reserve Changing Developed
App
aren
t S
urvi
val ±
SE
0.0
0.2
0.4
0.6
0.8
1.0
AdultJuvenile
SOSP
Reserve Changing Developed
App
aren
t S
urvi
val ±
SE
0.0
0.2
0.4
0.6
0.8
1.0
AdultJuvenile

Population
Reproduction, births, natality (B)
Mortality, death (D)
Emigration (E)Immigration (I)
Population growth

• Juvenile dispersal: movement from place of birth to place of breeding
• Breeding dispersal: movement by adults from one place of breeding to another– Birds: Female dispersing sex– Mammals: Male dispersing sex
Emigration and Immigration

############ #
#
#
#####
#
##
#
#
#
#
##
##
#
#
#
#
##
#
#
#
##
#
#
#
###
#
# ##
#
##
#
## # #
#
0 500 1000 1500 2000 2500 3000 3500 4000 Meters
American Robinpost-fledging movements

Adult survival, juvenile survival, and fecundity are what we need to estimate λ, the intrinsic population growth rate.
Winter Wren
Reserve Changing Developed
La
mb
da
0.0
0.2
0.4
0.6
0.8
1.0
1.2
1.4
1.6
1.8
Sink / declining
Stable population
Source/ growing populations

Landscape Species Fecundity var Adult se Juv se λ Upper λ *Developed American Robin 0.59 0.08 0.4 0.15 0.13 0.08 0.5416 0.962
Bewick's Wren 0.92 0.88 0.29 0.14 0.08 0.05 0.4526 0.9243Dark-eyed Junco 1.37 0.15 0.5 0.17 ** 0.7543 1.158Song Sparrow 1.13 0.46 0.54 0.03 0.21 0.04 0.827 1.022Spotted Towhee 0.57 0.12 0.5 0.06 0.18 0.05 0.6563 0.8795Swainson's Thrush 0.40 0.07 0.46 0.07 0.16 0.05 0.5719 0.7886Winter Wren 1.23 0.08 0.35 0.19 0.11 0.08 0.5823 1.207
Changing American Robin 0.89 0.16 0.55 0.12 0.18 0.08 0.7606 1.102Bewick's Wren 0.78 1.33 0.32 0.08 0.08 0.03 0.4566 0.7325Dark-eyed Junco 1.10 0.38 0.47 0.09 0.14 0.05 0.6924 0.9812Song Sparrow 1.23 0.21 0.54 0.02 0.18 0.03 0.8125 0.9273Spotted Towhee 0.82 0.46 0.55 0.03 0.18 0.03 0.7475 0.9013Swainson's Thrush 0.40 0.07 0.53 0.04 0.17 0.04 0.6368 0.7744Winter Wren 0.61 0.33 0.38 0.08 0.1 0.03 0.5016 0.7522
Reserve American Robin 0.80 0.13 0.71 0.22 0.31 0.23 0.9666 1.443Bewick's Wren 0.84 0.16 0.14 0.06 0.03 0.02 0.2435 0.4885Dark-eyed Junco 0.55 0.50 0.5 0.17 0.15 0.09 0.6308 1.176Song Sparrow 0.81 0.37 0.51 0.06 0.16 0.04 0.6962 0.9349Spotted Towhee 0.74 0.15 0.54 0.06 0.18 0.04 0.724 0.9245Swainson's Thrush 0.50 0.06 0.59 0.1 0.21 0.08 0.7332 0.9873Winter Wren 0.61 0.09 0.54 0.12 0.18 0.08 0.6974 1.057
* Upper 95% CI Limit of parameters used for calculating λ
** Changing Juv survival estimate used in calculating λ
Apparent Survival
From Oleyar et al. (in prep)
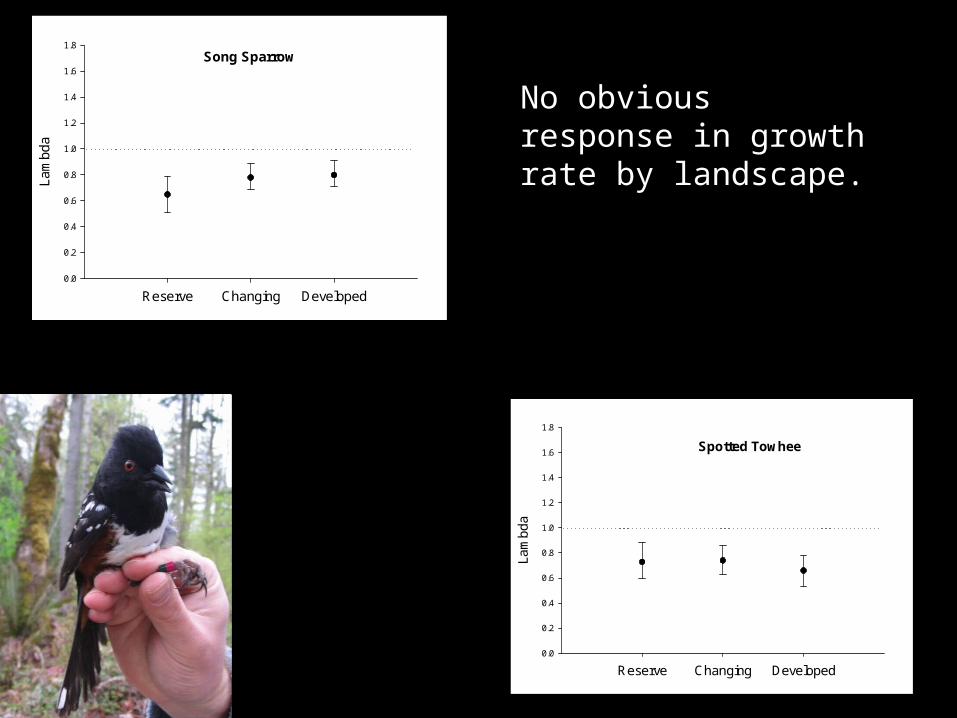
No obvious response in growth rate by landscape.
Spotted Towhee
Reserve Changing Developed
La
mb
da
0.0
0.2
0.4
0.6
0.8
1.0
1.2
1.4
1.6
1.8
Song Sparrow
Reserve Changing Developed
La
mbd
a
0.0
0.2
0.4
0.6
0.8
1.0
1.2
1.4
1.6
1.8

Declining λ outside of reserves?American Robin
Reserve Changing Developed
La
mb
da
0.0
0.2
0.4
0.6
0.8
1.0
1.2
1.4
1.6
1.8
Swainson's Thrush
Reserve Changing Developed
La
mb
da
0.0
0.2
0.4
0.6
0.8
1.0
1.2
1.4
1.6
1.8
Winter Wren
Reserve Changing Developed
La
mb
da
0.0
0.2
0.4
0.6
0.8
1.0
1.2
1.4
1.6
1.8

Possible sink during development for some species followed by recovery as subdivision ages?
Dark-eyed Junco
Reserve Changing Developed
La
mb
da
0.0
0.2
0.4
0.6
0.8
1.0
1.2
1.4
1.6
1.8
Bewick's Wren
Reserve Changing Developed
La
mb
da
0.0
0.2
0.4
0.6
0.8
1.0
1.2
1.4
1.6
1.8

Num
ber
dete
cted
with
in
50m
dur
ing
10m
ins
0.0
0.5
1.0
1.5
2.0 Winter WrenAmerican RobinSwainson's Thrush
Num
ber
det
ect
ed
with
in
50
m d
uri
ng
10
min
s
0.0
0.5
1.0
1.5
2.0
1999 2000 2001 2002 2003 2004 2005 2006 2007
Num
ber
det
ect
ed
with
in
50
m d
uri
ng
10
min
s
0.0
0.5
1.0
1.5
2.0
Year
Reserves
Developed
Changing
How do these projections match up with what we see out there?
•Winter Wren numbers high and ‘stable’ in reserves, low and/or declining elsewhere
•Robin numbers ‘stable’ but low in reserves, highest in developed residential areas
•Are developed landscapes ecological traps for Robins?
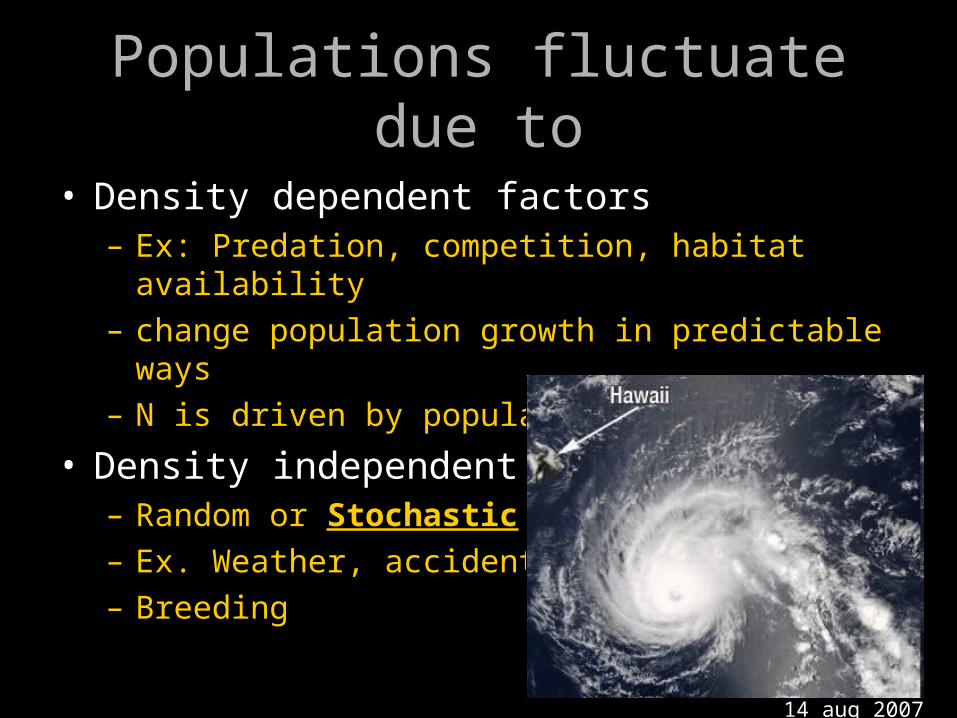
Populations fluctuate due to
• Density dependent factors– Ex: Predation, competition, habitat availability
– change population growth in predictable ways
– N is driven by population density
• Density independent factors– Random or Stochastic events
– Ex. Weather, accidents
– Breeding
14 aug 2007

time
# ofAnimals
(N)
Definitions
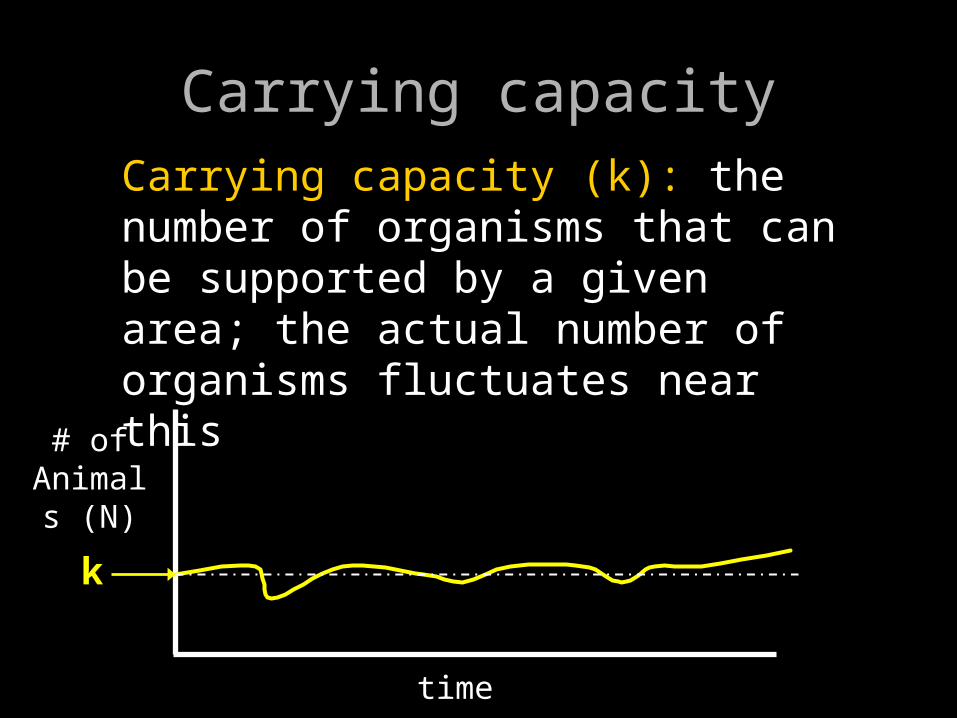
• Population regulation: the tendency of population sizes to stay within a certain range
time
# ofAnimals
(N)
k
Carrying capacity (k): the number of organisms that can be supported by a given area; the actual number of organisms fluctuates near this
Carrying capacity

Population fluctuationsCarrying capacity (k)
Classic growth curve,unlimited resources
Classic growth curve,limited resources (k)
time time
N N
k

Example of unlimited growth:Australian rabbit (European hare)
• 1859: 24 hares introduced (for human food?)• 1865: over 20,000 hares were harvested, actual population much greater.• Mid-1800’s to mid-1900’s: major problem with too many hares; caused habitat destruction and reduction in native mammals• 2000: still present, local problems
Population fluctuations
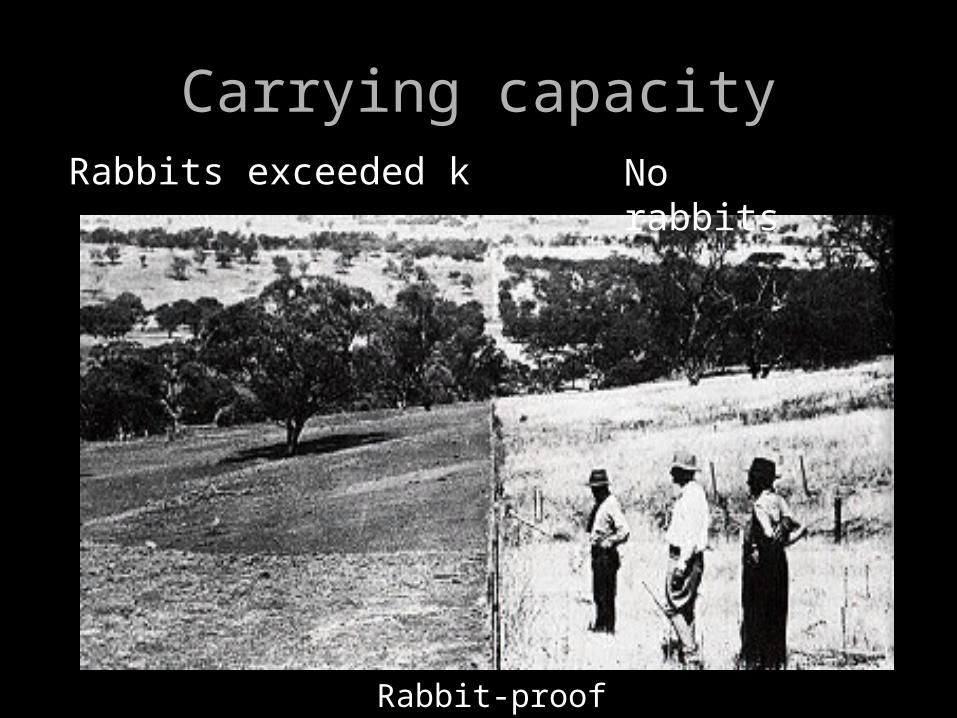
No rabbitsRabbits exceeded k
Rabbit-proof fence
Carrying capacity
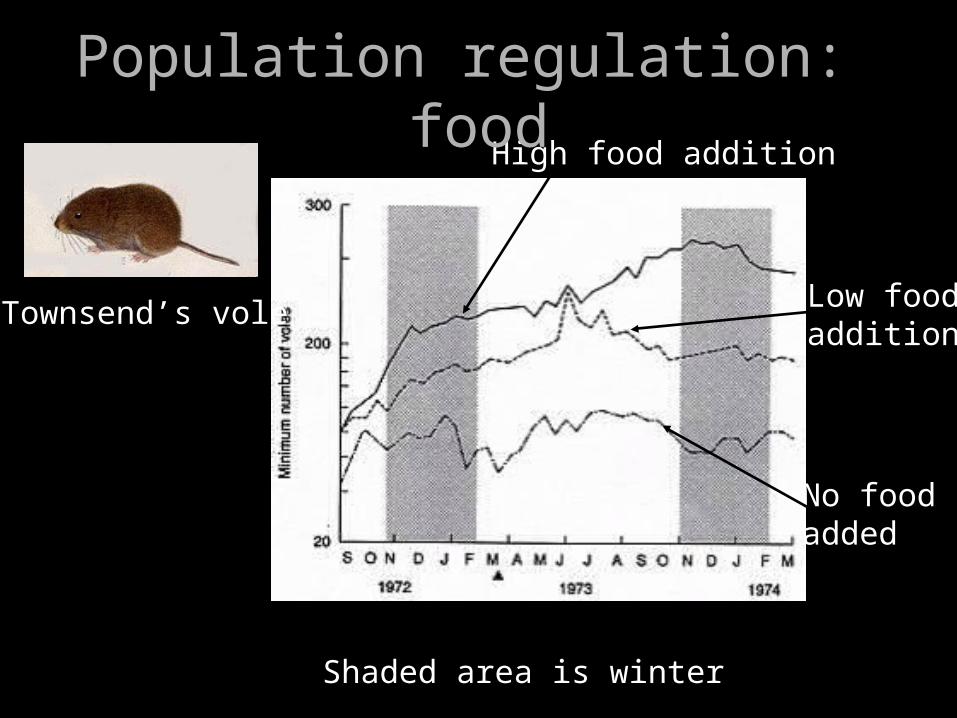
High food addition
Low food addition
No food added
Shaded area is winter
Townsend’s vole
Population regulation: food
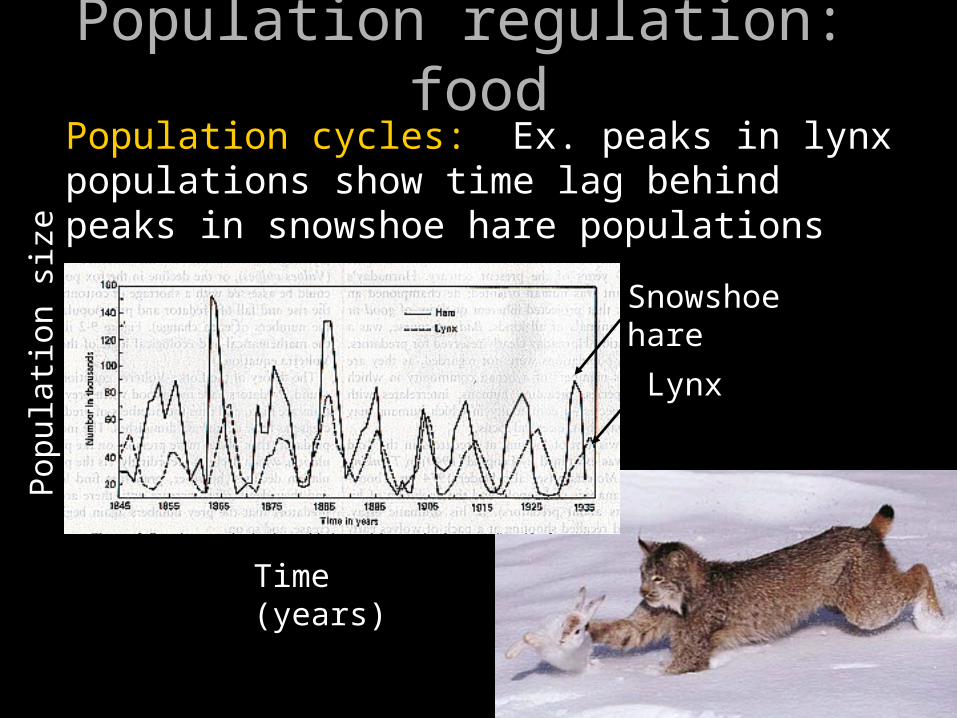
Population cycles: Ex. peaks in lynx populations show time lag behind peaks in snowshoe hare populations
Pop
ulat
ion
size Snowshoe hare
Lynx
Time (years)
Population regulation: food

Population regulation: climate

• Competition – demand by 2 or more individuals of the same or different species for a common resource
• Between 2 individuals of same species: Intraspecific• Between 2 individuals of different species: Interspecific
• Limited supply of resource: Exploitation• Not limited but interaction detrimental: Interference
Population regulation: competition

Inter- or Intraspecific competition?Exploitation or Interference competition?

Population regulation: competition