
How Do Accounting Estimate Bias and Method Similarity ...
41
How Do Accounting Estimate Bias and Method Similarity Influence Investors’ Reliability Judgment and Investment Decisions? Yao Yu * University of Massachusetts Amherst 121 Presidents Drive, Amherst, MA 01003 [email protected] Hun-Tong Tan Nanyang Technological University Nanyang Avenue, Singapore 639798 [email protected] January 2021 * Corresponding author We appreciate helpful comments from Jeremy Bentley, Wei Chen, Chi-Yue Chiu, Bin Ke, Terrence Ng, Elaine Wang, Tu Xu, three anonymous thesis examiners, and workshop participants at Nanyang Technological University, the University of Alberta, and the University of Massachusetts Amherst.
Transcript of How Do Accounting Estimate Bias and Method Similarity ...

How Do Accounting Estimate Bias and Method Similarity Influence Investors’
Reliability Judgment and Investment Decisions?
Yao Yu*
University of Massachusetts Amherst
121 Presidents Drive, Amherst, MA 01003
Hun-Tong Tan
Nanyang Technological University
Nanyang Avenue, Singapore 639798
January 2021
* Corresponding author
We appreciate helpful comments from Jeremy Bentley, Wei Chen, Chi-Yue Chiu, Bin Ke,
Terrence Ng, Elaine Wang, Tu Xu, three anonymous thesis examiners, and workshop
participants at Nanyang Technological University, the University of Alberta, and the University
of Massachusetts Amherst.
How Do Accounting Estimate Bias and Method Similarity Influence Investors’
Reliability Judgment and Investment Decisions?
ABSTRACT
In a multi-firm setting, we examine how accounting estimate bias and accounting method
similarity jointly influence investors’ reliability and investment judgments. Applying
psychology research on the similarity effect, we predict and find that the similarity of
accounting method amplifies the effect of accounting estimate bias on investors’ reliability
judgment. Specifically, while investors are able to detect the negative impact of a favorably-
biased (versus unfavorably-biased) accounting estimate on financial reporting reliability when
firms use the same accounting method, investors lose such ability when firms use different
accounting methods. This finding suggests that using different accounting methods among peer
firms hinders investors’ ability to make appropriate reliability judgment. We also find that
favorable (versus unfavorable) accounting estimate bias has a positive direct effect on
investment, and a negative indirect effect on investment via perceived reliability. Our study
highlights the importance of cross-firm reporting features, such as accounting method
similarity, in shaping investors’ reliability and investment judgments.
Key Words: Accounting Estimates; Bias; Method Similarity; Reliability; Comparability; Fair
Value Accounting
Data Availability: Contact the authors.
1
I. INTRODUCTION
Reliability of financial reporting (hereafter, reliability) is a fundamental qualitative
characteristic of financial reporting (FASB 1980, 2010) that influences investors’ investment
decisions (Song et al. 2010; Riedl and Serafeim 2011; Kadous et al. 2012; Chung et al. 2017;
Elliott et al. 2020). Research shows that investors are concerned about the reliability of
companies’ financial reporting that relies heavily on accounting estimates (Song et al. 2010;
Riedl and Serafeim 2011; Chung et al. 2017). It is important to study whether investors can
properly incorporate the biases in accounting estimates in their reliability judgment because
failing to do so can result in security mispricing (Richardson et al. 2005). Prior experimental
research has documented that individual investors react to accounting estimate disclosures
when they evaluate a stand-alone firm (Koonce et al. 2005; Eilifsen et al. 2020).1 However,
investors’ judgments in a single-firm setting could be different from their judgments in a multi-
firm setting, where peer firms provide additional benchmarks for investors to assess the focal
firm. In this study, we examine how such cross-firm comparisons alter investors’ judgments.
Specifically, we examine how biases in accounting estimates influence investors’ reliability
judgment, and importantly, how this effect is moderated by the similarity in accounting
methods across firms.
Considering investors’ judgments in a multi-firm setting is important as individual
investors increasingly rely on cross-firm comparisons via investing apps and online brokerages
to make investment decisions (Osipovich 2020).2 Many of such investing apps and online
brokerages provide cross-firm comparisons of financial information (see Appendix A for an
1 Eilifsen et al. (2020) finds that investors react more favorably to accounting estimate disclosures when the
quantitative sensitivity analysis indicates greater precision of the accounting estimates, and that this effect is
significant only when the auditor’s materiality threshold is also disclosed. In addition, Koonce, Lipe, and
McAnally (2005) show that investors are better able to identify a firm’s underlying risk exposure when accounting
estimate disclosures show both upside and downside risks compared to showing the downside risk only. 2 According to the Wall Street Journal article (Osipovich 2020), trading activities from individual investors via
investing apps and online brokerages accounted for around 20% of the total trading volume for the year 2020. The
boom of individual investors’ trading activities is likely caused by the brokerage industry’s shift to free stock
trades, as well as by the stay-at-home situation due to the coronavirus pandemic.

2
example), made possible by the growing availability of the eXtensible Business Reporting
Language (XBRL) data (Toppan Merrill 2019). When making such comparisons, investors are
likely to make the reliability judgment by comparing the focal firm’s accounting estimates with
a benchmark, which often comes from a peer firm (De Franco et al. 2015; Du and Shen 2018;
Young and Zeng 2015; Bourveau et al. 2020). Prior research shows that investors use peer firm
information to value targeted firms (Young and Zeng 2015; Bourveau et al. 2020).
A comparison across peer firms can be especially helpful when investors access how
biases in accounting estimates impact the reliability of a firm’s financial reporting. Accounting
estimates usually involve unobservable inputs that are unverifiable and highly subjective to
management's discretion (PwC 2019). Thus, it is difficult for investors to assess the bias in
accounting estimates, and hence, the firm’s reporting reliability, without comparing it to a
benchmark. A benchmark or a reference point helps individuals to better comprehend
quantitative information (Kahneman and Tversky 1979; Kida and Smith 1995; Thaler 1999).
We posit that with a proper benchmark from peer firms, investors are able to judge a firm’s
financial information to be more reliable when it uses an unfavorably-biased estimate (i.e., an
estimate that results in less favorable financial performance) than a favorably-biased estimate
(i.e., an estimate that results in more favorable financial performance). This is because using
an unfavorably-biased estimate goes against managers’ incentives for misreporting, and
incentive-inconsistent messages are generally considered to be more credible (Watts 2003;
Kelley 1987; Williams 1996).
However, a comparison with peer firms may not always help investors with their
decisions. Cross-firm reporting features, such as the similarity of firms’ accounting methods,
influences the outcome of peer firm comparisons. According to psychology research on the
similarity effect, when individuals compare objects, similarity along one dimension enhances
perceived differences on other dimensions (Tversky and Russo 1969; Mellers 1982; Mellers

3
and Biagini 1994; Pleskac 2012). Applying this theory to our study, we predict that the negative
effect of using a favorably-biased (versus unfavorably-biased) accounting estimate on
investors’ reliability judgment will be stronger when the focal firm and its peer use the same
than different accounting methods. In other words, using different accounting methods can
make it difficult for investors to assess the relative level of bias in the focal firm’s accounting
estimates, which hinders their ability to judge the focal firm’s reporting reliability accordingly.
We employ an experimental method to test our prediction. In the main experiment,
participants assume the role of a potential investor and evaluate a focal firm and its peer.
Participants make investment decisions and assess the reliability of the financial reporting of
the focal firm. We manipulate accounting estimate bias (favorable versus unfavorable) and
method similarity (same versus different) in a fair value reporting setting. In the favorable
(unfavorable) bias condition, the focal firm decreases (increases) the discount rate from the
previous year, which favorably (unfavorably) biases its financial performance. In the same
(different) method condition, the focal firm and its peer use the same (different) accounting
methods to calculate the fair value of their assets.
Results support our predictions. We find a significant interaction between bias and
method similarity. Specifically, when firms use the same method, investors perceive the focal
firm’s financial reporting to be significantly more reliable when it uses an unfavorably-biased
than favorably-biased accounting estimate; when firms use different methods, however, the
effect of bias on investors’ reliability judgment is no longer significant. We also find that
favorable (versus unfavorable) accounting estimate bias has a positive direct effect on
investment, and a negative indirect effect on investment via perceived reliability.
In the additional analysis, we examine how method similarity and accounting estimate
bias jointly influence investors’ ability to compare the two firms’ financial performance
(“ability to compare”). Although accounting method similarity greatly influences investors’

4
ability to compare financial performance across firms (FASB 1980, 2010), this effect is likely
to be weaker if investors perceive the focal firm’s financial reporting to be unreliable via using
a favorably-biased accounting estimate. This is because investors may feel uncomfortable
comparing two firms when one of them has low reporting quality, even if they use the same
accounting method. Our results are consistent with this expectation.
We conduct a series of supplementary experiments to further support our theory and to
rule out alternative explanations. An assumption in our theory is that investors use peer firms’
accounting estimates as a reference point to judge the relative level of bias in accounting
estimates. Supplementary Experiment 1 tests this assumption by removing the between-firm
contrast in accounting estimate bias present in the main experiment; that is, both the focal firm
and its peer choose an accounting estimate that is biased in the same direction and to the same
extent (i.e., both favorably biased or both unfavorably biased). If our theory holds, we would
observe no effect of bias because without the between-firm contrast, investors may simply
attribute a firm’s choice of accounting estimate to environmental factors (e.g., changes of
market/industry conditions) rather than to firm-specific factors (e.g., strategic reporting
choices). Consistent with our prediction, bias no longer influences investors’ reliability
judgment or investment decisions when such contrast is removed.
We conduct Supplementary Experiment 2 to rule out an alternative explanation that
investors may use method similarity as a substitute for their reliability judgment—an attribute
substitution heuristic in psychology research (Kahneman and Frederick 2002). If this
explanation holds, we would expect that using the same (versus different) accounting method
increases perceived reliability even in the absence of any potential biases. Results show that
when both the focal firm and its peer use neutral accounting estimates (i.e., no bias), same
versus different accounting method does not influence investors’ reliability judgment nor
investment decisions. This result rules out attribute substitution as an alternative explanation.

5
To distinguish our theory from the norm theory (Gilbert et al. 1995; Koonce et al. 2010;
Koonce et al. 2015) and the expectation violation theory (EVT) (Burgoon and Burgoon 2001;
Clor-Proell 2009), we conduct Supplementary Experiment 3 to test whether our theory still
holds in the presence of industry norm and/or investor expectations. Setting all cells in the same
method condition, we manipulate whether the focal firm uses a favorably- or unfavorably-
biased accounting estimate (favorable vs. unfavorable), and whether participants are informed
that most other firms in the industry make the same choices as the peer firm does (norm present
vs. absent). We find a significant main effect of bias and an insignificant interaction between
bias and norm presence, suggesting that our theory holds whether industry norm/expectation is
present or absent.
Finally, we conduct Supplementary Experiment 4 to test the situation where investors
evaluate the focal firm alone, without a comparison with any peer firms. Results show that
investors do not perceive a favorably-biased accounting estimate to harm reporting reliability;
on the contrary, investors invest more in the firm when the accounting estimate is favorably
than unfavorably biased. This result shows that a peer comparison is important for investors to
properly assess the biases in accounting estimates and to make the reliability judgment
accordingly.
Our paper has practical implications to regulators and standard-setters. First, in their
efforts to promote reliability of financial reporting, regulators and standard setters often focus
on a firm’s stand-alone disclosures of accounting estimates (SEC 2003, 2011, 2019; FASB
2018). However, our study shows that investors’ reliability judgment is influenced not only by
a firm’s stand-alone disclosure of an accounting estimate, but also by the similarity of
accounting methods across firms. Our study highlights the importance of considering such
cross-firm reporting features in setting accounting regulation and standards. Second, our study
reveals how the variations of accounting methods across firms can harm investors’ ability to
6
make a proper reliability judgment, leading to potential security mispricing. Our finding
provides further support to the FASB’s standard updates that aim at enhancing financial
reporting comparability (e.g., FASB 2013; FASB 2014). Third, our additional analysis shows
that investors’ ability to compare firms’ financial performance depends not only on accounting
method similarity but also on biases in accounting estimates. This finding highlights the
importance of considering financial reporting quality in promoting comparability.
Our paper has theoretical contributions. First, we extend prior research on investors’
reliability judgment (Kadous et al. 2012; Eilifsen et al. 2020) from a single-firm setting to a
multi-firm setting. Our study shows that investors’ reliability judgment is influenced not only
by legitimate factors from a stand-alone firm (e.g., favorability of the bias in an accounting
estimate) but also by cross-firm reporting features such as accounting method similarity. Our
results show that cross-firm comparisons can help investors to properly assess bias and
reliability when firms use the same accounting method; however, cross-firm comparisons can
also hinder investors’ reliability judgment when firms use different accounting methods.
Second, our study answers the call for research to examine financial reporting
comparability on a more granular level (Hopkins 2019). The earnings-return based proxies for
comparability that are widely used in archival research (e.g., De Franco et al. 2011; Barth et al.
2012) can be noisy proxies because they are also influenced by other reporting attributes such
as relevance, faithful representation, timeliness, and so forth (Hopkins 2019). Employing an
experimental approach, we examine how investors’ judgments and interpretation of financial
information are influenced by a specific reporting feature that contributes to comparability—
accounting method similarity among peer firms. Our finding shows that comparability
influences investors’ judgments via providing a clear contrast between peer firms.
Third, our study sheds lights on a potential explanation for a finding in prior research.
Archival studies find that adopting a uniform set of accounting standards (e.g., IFRS) increases

7
cross-border investments (DeFond et al. 2011; Yu and Wahid 2014; Francis et al. 2016). Since
the adoption of a uniform set of accounting standards enhances both similarity of accounting
methods and reporting quality (Brochet et al. 2013; Cascino and Gassen 2015), it is unclear
from prior research whether the positive effect of IFRS adoption on cross-border investments
is caused by the increase of accounting method similarity or by the increase of reliability, or
by both. Our study disentangles these two factors by separately manipulating them, and provide
evidence that both factors matter.
We discuss our theory and develop hypotheses in the following section. Section III
describes our main experiment. Section IV reports the experimental results and supplementary
experiments. Section V concludes the paper.
II. THEORY AND HYPOTHESES
Accounting Estimates and the Reliability of Financial Reporting
Reliability is one of the two fundamental qualitative characteristics of financial
information that affect its decision usefulness (FASB 1980, 2010). 3 Reliable financial
information needs to be free from material error and bias (FASB 1980). Prior research has
examined factors that influence investors’ perceptions of reliability. Kadous et al. (2012) show
that the competence of the measurement source (e.g., whether the measurement is provided by
a more or less competent consultant) and fair value model (e.g., Level 2 versus Level 3)
influence investors’ judgment of reliability. Recently, Eilifsen et al. (2020) find that investors
judge the reliability of a reported estimate to be higher when a quantitative sensitivity analysis
indicates greater than lower precision of the accounting estimates. They find that this effect is
significant only when the auditor’s materiality threshold is also disclosed; this effect disappears
without the presence of auditor’s materiality threshold. We add to this line of research by
3 To avoid confusions about the term “reliability” while retaining its intended meaning, the FASB (2010) replaces
“reliability” with the term “faithful representation,” which describes whether a firm’s financial reporting faithfully
represents its underlying economic phenomenon. We use the term “reliability” in this paper to be consistent with
prior literature.

8
examining investors’ judgment of reliability in a multi-firm setting, where investors’ reliability
judgment can be influenced by reporting practices of both the focal firm and its peer.
Examining how biases in accounting estimates influence perceived reliability is
important because research shows that low reliability leads to lower earnings persistence, and
investors do not fully anticipate the lower earnings persistence, resulting in significant security
mispricing (Richardson et al. 2005). We examine the impact of accounting estimate bias on
perceived reliability in a fair value setting, where a small change in fair value estimates can
result in huge impact on asset value and income. Prior research finds that companies often
deliberately use biased fair value estimates to manipulate their financial reporting (Christensen
et al. 2012). Due to the complexity and high subjectivity in fair value estimates, investors have
been concerned about the negative consequence of an extensive use of fair value estimates on
financial reporting reliability (Chung, Lee, and Mitra 2016). This is evidenced by research
showing that the market discounts the stocks of companies holding a high proportion of fair-
valued assets (Song et al. 2010; Riedl and Serafeim 2011). This discount is likely due to
investors’ concerns about the reliability of fair value estimates as the discount diminishes in
companies that make a reliability disclosure (Chung et al. 2017).
However, it is not easy for investors to detect the biases in fair value estimates and
assess reporting reliability accordingly because fair value estimates usually involve
unobservable inputs that are highly subjective to management's discretion (PwC 2019).
Besides, accounting estimates are often influenced by both firm-specific factors (e.g., risks
unique to the firm, managers’ opportunistic reporting behaviors, etc.) and economy-wide
factors (Lev et al. 2010). 4 Therefore, it can be difficult for investors to evaluate bias and
reliability on a single-firm basis. We posit that investors will use peer firms’ accounting
4 Due to these firm-specific and economy-wide factors, a mere change in discount rate is not necessarily a signal
of bias. In fact, our supplementary experiment shows that when both firms change discount rates in the same
direction and to the same extent, it is not obvious to investors that the discount rates are biased.

9
estimates as a reference point to judge the relative level of bias in accounting estimates, as
psychology research suggests that individuals tend to make judgments and decisions with
respect to certain reference points (Tversky and Kahneman 1981; Gregory, Lichtenstein, and
MacGregor 1993; Boles and Messick 1995; Sullivan and Kida 1995; Blount, Thomas-Hunt,
and Neale 1996). Investors likely use peer firms’ accounting estimates as the reference point
because peer firms are often used as an important benchmark in performance assessment (Cao
et al. 2018; Du and Shen 2018; Gao and Zhang 2019) and stock valuation (De Franco et al.
2015; Easton et al. 2018). We discuss below how investors compare the focal firm’s accounting
estimate to that of a peer firm.
Similarity Effect
Psychology research finds that when individuals compare objects, the similarity along
one dimension enhances perceived differences on other dimensions (Tversky and Russo 1969;
Mellers 1982; Mellers and Biagini 1994). For example, when asked to compare a pair of
geometric figures that differ in area or shape, or both, individuals are better able to tell the
differences in area when the figures have the same shape (e.g., both are circles), compared to
when the figures have different shapes (e.g., one is a circle and the other is a triangle) (Tversky
and Russo 1969). Mellers (1982) shows that this similarity effect is not limited to
psychophysics. She finds that salary differences lead to stronger perceived unfairness when the
two individuals under comparison have similar than dissimilar merit ratings. Mellers and
Biagini (1994) propose a contrast-weighting theory to explain the similarity effect; that is,
individuals place less weight on attributes with similar levels than on attributes with dissimilar
levels (Mellers and Biagini 1994). A later study supports this theory by showing that in a
probability judgment task, similarity of the hypotheses on one dimension increases the weight
that individuals allocate to differences on the other dimensions (Pleskac 2012).

10
The similarity effect also extends to social comparison judgments. Research shows that
social comparisons tend to occur among people who are similar to each other (Tesser 1988;
Gilbert et al. 1995; Pickett 2001). Aarts and Dijksterhuis (2002) find that the similarity between
the target individual and the standard to be compared with determines whether the comparison
yields a contrast effect (i.e., the target is rated away from the standard) or an assimilation effect
(i.e., the target is rated toward the standard). Specifically, Aarts and Dijksterhuis (2002) find
that a contrast effect occurs when the target and the standard are perceived to be similar; an
assimilation effects occurs when the target and the standard are perceived to be dissimilar. In
summary, the social comparison research lends support to our argument that similarity
enhances the contrast between the target and its standard to be compared with.
Joint Effect of Accounting Estimate Bias and Accounting Method Similarity on
Reliability Judgment
The FASB describes a neutral reporting (i.e., without bias) as a depiction that is not
manipulated to “increase the probability that financial information will be received favorably
or unfavorably by users” (FASB 2010, QC14). A firm can choose an accounting estimate that
either favorably (e.g., a lower discount rate) or unfavorably (e.g., a higher discount rate) biases
its financial performance. Although both types of biases deviate from neutrality (FASB 1980),
the directional nature of the bias may have asymmetrical impacts on perceived reliability.
Investors likely perceive financial information with an unfavorably-biased estimate to be more
reliable because such a bias goes against managers’ general motivation of overstating financial
performance for either compensation or reputation purposes (Watts 2003). Prior research in
both psychology (Kelley 1987) and accounting (Williams 1996) finds that individuals perceive
a message to be more credible when the message is inconsistent with the source’s incentives.
On the contrary, financial information with a favorably-biased estimate can be perceived to be
less reliable because management can use the favorably-biased estimate to boost financial
performance (Christensen et al. 2012).

11
We define accounting method as the manner in which accounting information is
produced to report an economic phenomenon. 5 Differences in accounting methods can arise
either from discrepancies between different sets of accounting standards (Bae et al. 2008; Tan
et al. 2011; Yu and Wahid 2014) or from variations in firms’ reporting practices applying the
same set of accounting standards (FASB 2008, 2013, 2014). Although prior research has shown
that a peer firm’s information disclosure influences investors’ reactions to the focal firm (e.g.,
Baginski 1987; Han et al. 1989; Pyo and Lustgarten 1990; Kim et al. 2008), it is unclear
whether, controlling for information content, the mere similarity in accounting methods still
influences investors’ judgments of the focal firm.
In our setting, we posit that the similarity in accounting method determines how similar
two firms’ financial reporting are in general as an accounting method governs how accounting
information is produced. Research shows that firms’ financial reporting becomes more
comparable when they adopt the same set of accounting standards (e.g., De Franco, Kothari,
and Verdi 2011; Barth, Landsman, Lang, and Williams 2012; Yip and Young 2012). Following
psychology research (Tversky and Russo 1969; Mellers 1982; Mellers and Biagini 1994;
Pleskac 2012), we predict that the perceived differences in accounting estimates between firms
is greater when the firms use similar rather than dissimilar accounting methods.
When firms use the same accounting method, it is easier for investors to attribute the
difference in accounting estimates to management’s discretion and subjectivity, rather than to
the accounting method itself (as accounting methods are the same). As a result, the difference
in accounting estimates will have a stronger effect on investors’ reliability judgment when
firms use the same accounting method. On the contrary, when firms use different accounting
5 The current FASB conceptual framework is not clear regarding the objectives or conceptual definitions of
accounting methods, making it difficult for users to assess the strengths or weaknesses of using different
accounting methods (Baker 2013; Barth 2014). The FASB recently initiated a project to clarify the concepts
related to accounting measurement (FASB 2020), including discussions of how using different accounting
methods affects both the initial and subsequent measurement stages (FASB 2019).
12
methods, it will be less clear to investors whether the differences in accounting estimates come
from management’s discretion and subjectivity or from the inherent differences between
different methods. Hence, the difference in accounting estimates will have a weaker effect on
investors’ reliability judgment when firms use different accounting methods. We formally state
our predictions in H1. 6
H1: Investors will perceive the focal firm’ financial reporting to be more reliable when
it uses an unfavorably-biased than favorably-biased accounting estimate; this effect
will be stronger when the focal firm and its peer use the same than different
accounting methods.
Investment Decisions
Prior research finds that investors’ assessment of reliability heavily influences their
valuation of the firm (Kadous et al. 2012; Elliott et al. 2020). Studies show that the reliability
concern of fair value estimates makes investors to discount stock prices (Song et al. 2010; Riedl
and Serafeim 2011; Chung et al. 2017). Therefore, we predict that investors will invest more
in the focal firm when the firm’s financial reporting is perceived to be more reliable. Given our
earlier prediction in H1 of an interaction effect between bias and method similarity on
perceived reliability, we predict a moderated mediation where perceived reliability mediates
the joint effect of bias and method similarity on investment. We state this prediction in H2a.
H2a: Perceived reliability mediates the joint effect of method similarity and bias on
investors’ investment decisions.
6 Prior accounting studies employ the two-firm design in their experiments, but their research purposes are
different from ours. For example, Hodge, Kennedy, Maines (2004) examine how the searchable presentation
format facilitates investors’ acquisition and integration of financial information. They use the two-firm design to
create an optimal investment choice (i.e., if investors fully acquire and process firms’ financial information, they
should choose one firm over the other), rather than to examine how across-firm comparisons influence investor
judgments and decisions. Similarly, Elliott et al. (2020) also use the two-firm design to create an optimal
investment decision. Maletta and Zhang (2012) use the two-firm design to examine how investor reactions to one
firm’s earnings preannouncement are affected by the preannouncement of a peer firm. While Maletta and Zhang
(2012) examine how investors react to firms’ strategic reporting (i.e., the percentage of the total earnings news
disclosed in the preannouncement), our study examines a different context where investors assess firms’ choices
of accounting estimates and methods.
13
However, financial reporting reliability is not the only consideration when investors
make investment decisions. Investors also consider non-accounting factors such as business
risks, which can be captured by accounting estimates (Sharpe 1964; Lintner 1965; Fama and
French 1993, 1996). For example, although using an unfavorably-biased discount rate signals
a greater level of reliability, which has a positive effect on investment decision, it may also
signal a greater level of business risk, which has a negative effect on investment decision. Thus,
we expect accounting estimates to influence investors’ investment decisions through two
separate paths. In the first path, accounting estimates influence investment decisions via
perceived reliability (indirect path). In the second path, accounting estimates directly influence
investment decisions as the favorableness of accounting estimates also indicates the level of
risks associated with the firm (direct path). We hypothesize this prediction in H2b.
H2b: Favorable (versus unfavorable) accounting estimate bias has a positive direct effect
on investment, and a negative indirect effect on investment via perceived reliability.
III. METHOD
Participants
We recruited participants from Amazon Mechanical Turk (MTurk). Prior research
shows that MTurk participants demonstrate greater financial literacy compared to the general
U.S. population and are willing to exert effort to do online tasks (Farrell et al. 2017). To make
sure the MTurk participants are a reasonable proxy for non-professional investors, we follow
Krische’s (2019) recommendation to screen MTurk participants based on investment
experience and financial knowledge.7 Two hundred and ten participants completed the study.
On average, participants are 33.7 years old; 59.5% are male. Participants have average work
7 Specifically, we require participants to meet all three requirements to participate in this study: (1) they are native
English speakers, (2) they have taken at least one accounting course, and (3) they have bought or sold a company’s
common stock or debt securities.
14
experience of 13.2 years. They have taken an average of 2.7 accounting courses, 1.6 finance
courses, and 2.2 economic courses. Most participants have investment experience (95.7%).
Procedure
Participants start with a training session before reading the case material. The training
session introduces two fair value methods—rental capitalization and discounted cash flow.
Both methods generate Level 3 fair values that involved significant subjective inputs (e.g.,
estimates used to project the future cash flows and the discount rates). 8 The training session
explains that the two methods can generate the same or different fair values, depending on the
volatility of future cash flows/rental incomes, and that both methods are similarly reliable. The
training session also explicitly states that using a lower (higher) discount rate can result in a
higher (lower) fair value. To make sure that participants correctly understand the information
provided in the training session, they need to pass a quiz before proceeding with the study
(Bentley 2021).
After completing the training session, participants read general instruction and
background information about two firms, Firm A and its peer (Firm B). Participants are asked
to evaluate these two firms as potential investments. The firms operate in the same industry
and both own buildings for capital appreciation. These buildings are classified as “investment
properties” under IFRS (IAS 40) and are measured at fair values. 9 Changes in the fair values
8 If a firm uses a discounted cash flow method, the term used is “discount rate.” If a firm uses a rental capitalization
method, the term used is “capitalization rate.” For the purpose of simplicity, we use “discount rate” to refer to
both terms in the rest of the paper. 9 We choose an IFRS setting, which presumably is less familiar to participants in the U.S., to minimize the effect
of participants’ expectation of and familiarity with a particular accounting measurement on our dependent
variables. We specifically choose the investment property setting for two reasons. First, variations exist in the fair
value measurements of investment property. For example, some firms use the rental capitalization approach, and
other firms use the discounted cash flow approach. Both valuation models belong to the same level (i.e., Level 3)
in the fair value hierarchy, which allows us to examine the effect of method similarity while minimizing any other
differences between different accounting methods. Second, the valuation of investment properties frequently
involves highly subjective inputs, highlighting the issue of using biased estimates in fair value calculations
(Marshall et al. 2012). It is also of practical interest to examine an IFRS setting as financial reporting using IFRS
plays an important role in the investment decisions of U.S. investors. According to the SEC (2017), U.S. investors
have invested substantially in foreign companies that apply IFRS in filings with the SEC; U.S. investors also
routinely invest in companies based outside the U.S. (e.g., through U.S. mutual funds that hold debt and equity
securities issued by foreign companies), many of which use IFRS as their reporting standards.

15
of the investment properties are reported in the current period’s income statement. Hence, the
fair value changes affect both firms’ financial performance.
Participants read a side-by-side presentation of both firms’ financial summaries. The
firms have the same operating profit. What distinguishes them is the item “gains in fair value
of investment properties.” Firm A has a higher gain than its peer ($14 million versus $12
million). This difference helps Firm A outperform its peer by $2 million in net income and by
3 cents in earnings per share. Next, participants read side-by-side notes on each firm’s fair
value changes of investment properties, where we manipulate our independent variables.
Depending on experimental condition, the two firms use either the same or different fair value
methods; Firm A uses either an unfavorably-biased or a favorably-biased discount rate in its
fair value calculation, relative to the discount rate used by the peer firm. After reading the case
material, participants make investment decisions and the reliability judgment. Finally,
participants answer a series of debriefing and demographic questions.
Independent Variables
We employ a 2 × 2 between-subjects design with method similarity (same versus
different) and bias (favorable versus unfavorable) as the independent variables. In the same
method condition, both firms use the same fair value method (i.e., rental capitalization) for
their investment properties. In the different method condition, the two firms use different
methods (i.e., rental capitalization versus discounted cash flow). The methods in the different
method condition are counterbalanced between the two firms to control for any potential
differences between the two methods.
We use changes in fair value estimates (e.g., discount rates) to operationalize bias. In
the favorable condition, Firm A uses a discount rate that favorably biases its financial
performance relative to its peer (e.g., Firm A decreases their discount rate by 0.7% from the
previous year while the peer firm’s discount rate remains unchanged). In the unfavorable

16
condition, Firm A uses a discount rate that unfavorably biases its financial performance relative
to its peer (e.g., Firm A increases their discount rate by 0.7% from the previous year while the
peer firm’s discount rate remains unchanged).10, 11 We keep the current year’s discount rate at
6.7% across all conditions for both firms; only the discount rates used in the previous year vary
with conditions.12 In all conditions, we tell participants that the overall economic and market
conditions are similar over the two years. Therefore, changes in the discount rates are more
likely be attributed to firm-specific factors than to economic and market factors.
Dependent Variables
Participants are asked to allocate $10,000 between Firm A and its peer. We measure
participants’ investment decision by the amount in thousands participants invest in Firm A. On
a separate page, we measure perceived reliability of Firm A’s financial reporting by asking
participants to indicate the extent to which they think Firm A’s information about the fair value
change in investment properties is reliable (-7 = extremely not reliable; 0 = moderately reliable;
7 = extremely reliable;).
IV. RESULTS
Manipulation Checks
To check our manipulation of bias, we ask participants to indicate the extent to which
each firm biased its fair value change of investment properties on a 15-point scale (-7 =
10 We counterbalance the firm that changes the discount rate between the focal and peer firms. Specifically, half
of the participants read the case where Firm A is the firm that changes discount rate, and the other half of the
participants read the case where the peer firm is the changing firm whereas Firm A does not change discount rate.
That is, Firm A uses a relatively favorable discount rate when the peer firm increases the discount rate; Firm A
uses a relatively unfavorable discount rate when the peer firm decreases the discount rate. Since our results do not
differ between the two cases (F202 = 0.119, p = 0.730), we combine both cases in our subsequent analyses. 11 All p-values are two-tailed unless otherwise stated. 12 Our manipulation check results show that participants interpret this manipulation as intended; that is,
participants use the previous year’s discount rate as the baseline and judge a decrease in discount rate to be a
favorable rather than unfavorable bias (p < 0.001, one-tailed). We also conduct an out-of-sample study where we
keep the previous year’s rate constant at 6.7% for both firms and vary the current year’s rates to manipulate
favorability of bias (favorable vs. unfavorable). We set both cells in the same method condition. We collect ninety
responses from MTurk. As expected, results show that perceived reliability is lower in the favorable condition
than that in the unfavorable condition (means: 2.930 versus 3.936; F1, 88 = 3.313, p = 0.036, one-tailed), suggesting
that our finding in the main experiment is robust to this alternative design (i.e., keeping previous year’s rate
constant).
17
downward biased; 0 = no bias; 7 = upward biased). We provide a note to clarify that using a
higher (lower) discount rate leads to lower (higher) net income. This note is to make sure
participants have the same understanding of the “downward/upward biased” labels on the scale.
We use the rating for Firm A’s bias minus that for the peer firm to create a measure of relative
bias in Firm A’s fair value estimate, as our manipulation of bias is on a relative basis. Results
show that participants in the favorable condition perceive Firm A (relative to its peer) to
upwards bias its fair value reporting to a larger extent compared to participants in the
unfavorable condition (means: 1.617 vs. -0.431; p < 0.001, one-tailed). This effect does not
vary with method similarity (p = 0.146).13 Our manipulation of bias is successful.
To check the manipulation of method similarity, we ask participants whether the two
firms use the same or different method(s) in calculating the fair values of investment properties.
Seventy-one percent (150 out of 210) of participants answer this question correctly. 14 A Chi-
square test shows that significantly more people select “the same method” in the same method
condition than those in the different method condition (χ2 = 20.269, p < 0.001). We include all
participants in our subsequent analyses.15
Tests of Hypotheses
H1 predicts an interaction between bias and method similarity on perceived reliability.
We conduct an analysis of variance (ANOVA) with bias and method similarity as the
independent variables and perceived reliability as the dependent variable. Panel A (Panel B) of
Table 1 reports descriptive (inferential) statistics. Figure 1, Panel A illustrates the results.
Results show a significant interaction between bias and method similarity (F1, 206 = 8.557, p =
0.002, one-tailed equivalent), with the mean pattern consistent with our prediction. The simple
effects reported in Table 1, Panel C show that, when firms use the same method, perceived
13 This result holds regardless of whether the focal firm or the peer firm changes the discount rate (p = 0.439). 14 The pass rate does not vary between the same and different measurement conditions (χ2 = 0.071, p = 0.790) or
between the favorable and unfavorable conditions (χ2 = 0.115, p = 0.735). 15 Results are qualitatively similar if we exclude those who fail this manipulation check question.
18
reliability is significantly higher in the unfavorable condition than that in the favorable
condition (means: 3.481 vs. 1.885; F1, 206 = 8.988, p = 0.002, one-tailed equivalent). When firms
use different methods, however, perceived reliability is not significantly different between the
unfavorable and favorable conditions (means: 2.294 vs. 2.891; F1, 206 = 1.279, p = 0.259).16
These results show that while investors are able to judge reliability based on the relative bias
in accounting estimates when firms use the same accounting method, they are not able to do so
when firms use different accounting methods. H1 is supported. 17
(Insert Table 1 and Figure 1 about here)
H2a predicts that perceived reliability mediates the joint effect of method similarity and
bias on investors’ investment decisions. Figure 2, Panel A presents this mediation model, where
bias (0 = unfavorable, 1 = favorable) is the independent variable, perceived reliability is the
mediator, investment in the focal firm is the dependent variable, and method similarity is the
moderator. We use Hayes (2017) PROCESS macro in SPSS to test this moderated mediation
model. We conduct 10,000 bootstrapped samples with a 95% confidence level. In Figure 2,
Panel B reports the path coefficients and Panel C reports the direct and indirect effects, along
with the index of moderated mediation. Consistent with our prediction, the moderated
mediation is significant (index of moderated mediation = 0.325, 95% confidence interval
between 0.047 and 0.735). We also test the indirect effect of bias on investment through
perceived reliability at each level of method similarity. As shown in Figure 2, Panel C, this
indirect effect is significantly negative when firms use the same method (coefficient = -0.236,
95% confidence interval between -0.521 and -0.038), but is insignificant when firms use
16 In fact, perceived reliability in the favorable condition (2.891) is directionally higher than that in the unfavorable
condition (2.294), suggesting that investors could even prefer the focal firm to use a more favorably-biased
accounting estimate when it is not directly comparable with the peer firm. 17 The simple effects of method similarity are also consistent with our theory. As shown in Table 1, Panel C, when
the focal firm uses an unfavorably-biased accounting estimate, same (versus different) method significantly leads
to higher perceived reliability (means: 3.481 vs. 2.294; F1, 206 = 4.919, p = 0.014, one-tailed equivalent). When the
focal firm uses a favorable-biased accounting estimate, same (versus different) method leads to lower perceived
reliability (means: 1.885 vs. 2.891, F1, 206 = 3.673, p = 0.029, one-tailed equivalent).
19
different methods (coefficient = 0.088, 95% confidence interval between -0.071 and 0.306),
suggesting that perceived reliability mediates the effect of bias on investment when firms use
the same method, but not when firms use different methods. These results support H2a.
(Insert Figure 2 about here)
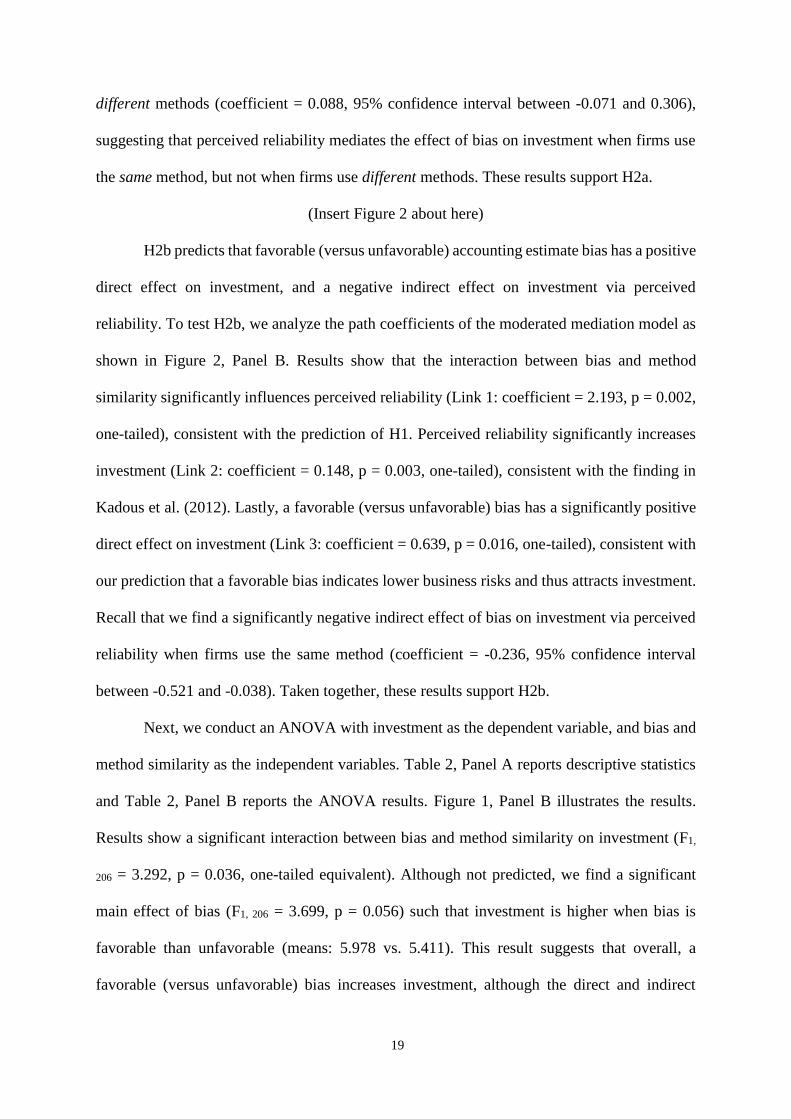
H2b predicts that favorable (versus unfavorable) accounting estimate bias has a positive
direct effect on investment, and a negative indirect effect on investment via perceived
reliability. To test H2b, we analyze the path coefficients of the moderated mediation model as
shown in Figure 2, Panel B. Results show that the interaction between bias and method
similarity significantly influences perceived reliability (Link 1: coefficient = 2.193, p = 0.002,
one-tailed), consistent with the prediction of H1. Perceived reliability significantly increases
investment (Link 2: coefficient = 0.148, p = 0.003, one-tailed), consistent with the finding in
Kadous et al. (2012). Lastly, a favorable (versus unfavorable) bias has a significantly positive
direct effect on investment (Link 3: coefficient = 0.639, p = 0.016, one-tailed), consistent with
our prediction that a favorable bias indicates lower business risks and thus attracts investment.
Recall that we find a significantly negative indirect effect of bias on investment via perceived
reliability when firms use the same method (coefficient = -0.236, 95% confidence interval
between -0.521 and -0.038). Taken together, these results support H2b.
Next, we conduct an ANOVA with investment as the dependent variable, and bias and
method similarity as the independent variables. Table 2, Panel A reports descriptive statistics
and Table 2, Panel B reports the ANOVA results. Figure 1, Panel B illustrates the results.
Results show a significant interaction between bias and method similarity on investment (F1,
206 = 3.292, p = 0.036, one-tailed equivalent). Although not predicted, we find a significant
main effect of bias (F1, 206 = 3.699, p = 0.056) such that investment is higher when bias is
favorable than unfavorable (means: 5.978 vs. 5.411). This result suggests that overall, a
favorable (versus unfavorable) bias increases investment, although the direct and indirect

20
effects of bias on investment are in opposite directions. The main effect of method similarity
is marginally significant (F1, 206 = 2.710, p = 0.101) such that investment is higher when the
method is the same than different (means: 5.936 vs. 5.468). As reported in Table 2, Panel C,
the simple effects show that favorable (versus unfavorable) bias increases investment in the
different method condition (means: 6.002 vs. 4.892; F1, 206 = 7.046, p = 0.005, one-tailed); this
effect is insignificant in the same method condition (means: 5.952 vs. 5.920; F1, 206 = 0.006, p
= 0.939). This pattern integrates our results for H2a and H2b. In the different method condition,
the impact of favorable bias on investment via reliability (i.e., the “indirect effect”) is
insignificant as shown in the moderated mediation, leaving only the significantly positive direct
effect; as a result, we observe that favorable (versus unfavorable) bias increases investment. In
the same method condition, favorable bias has both a significantly negative indirect effect via
reliability and a significantly positive direct effect. With these two effects offsetting each other,
we observe no significant overall effect of favorable (versus unfavorable) bias on investment.
(Insert Table 2 about here)
Additional Analysis
Ability to Compare Firms’ Financial Performance
We also examine how method similarity and bias jointly influence investors’ ability to
compare the financial performance between the focal firm and its peer. We instruct participants
that if they can make any one of the following three conclusions, they are able to compare these
two firms: (1) Firm A has better financial performance than its peer; (2) the peer firm has better
financial performance than Firm A; or (3) Firm A and its peer have very similar financial
performance. If participants are (not) able to make any one of these three conclusions, they are
(not) able to compare these two firms. Note that participants are not asked to select among the
three options; these options are merely guidelines to asses “being able to compare.” Following
this instruction, participants indicate the extent to which they are able to compare the two firms’

21
financial performance on a 15-point scale (-7 = completely unable to compare; 0 = moderately
able to compare; 7 = completely able to compare).
According to the FASB (1980, 2010), similar inputs and procedures are important
determinants of comparability, and permitting alternative accounting methods for similar
economic transaction diminishes comparability. Psychology research also suggests that
similarity between the target and its standard facilitates the comparison process (Tesser 1988;
Gilbert et al. 1995; Pickett 2001). Hence, we predict that same (versus different) accounting
method will improve investors’ ability to compare firms’ financial performance. However, this
effect is likely moderated by biases in accounting estimates. A favorably-biased estimate
indicates lower reliability (Song et al. 2010; Riedl and Serafeim 2011). When firms make
unreliable financial reporting, even if they use the same accounting method, investors may still
doubt their reporting quality and feel uncomfortable comparing their financial performance
based on what they report. Therefore, we predict that the effect of method similarity on
investors’ ability to compare firms’ financial performance will be greater in the unfavorable
condition than in the favorable condition.
To test this prediction, we conduct an ANOVA with investors’ ability to compare firms’
performance as the dependent variable and the manipulated variables as the independent
variables. Panel A (Panel B) of Table 3 reports descriptive (inferential) statistics. We find a
significant interaction between bias and method similarity (F1, 206 = 5.340, p = 0.011, one-tailed
equivalent). No main effects are significant (F1, 206 < 1.419, p > 0.234). As reported in Table 3,
Panel C, the simple effects show that same (versus different) method increases investors’
ability to compare firms’ performance in the unfavorable condition (means: 3.750 vs. 2.372;
F1, 206 = 6.019, p = 0.008, one-tailed equivalent); this effect is insignificant in the favorable
condition (same vs. different means: 2.923 vs. 3.363; F1, 206 = 0.639, p = 0.425). These results
are consistent with our prediction that bias moderates the effect of method similarity on

22
investors’ ability to compare firms’ financial performance. These results also suggest that
investors assess attributes of financial reporting with a hierarchy, wherein same (versus
different) accounting method improves investors’ ability to compare firms’ financial
performance only when a reasonable level of reliability is achieved (via using an unfavorably-
biased accounting estimate in our case).
Note that the mechanism for investors’ ability to compare firms’ financial performance
is different from our theory for reliability judgment because the first-order effect on each
dependent variable (ability to compare vs. perceived reliability) comes from different
independent variables (method similarity vs. accounting estimate bias). When the dependent
variable is investors’ ability to compare firms’ financial performance, method similarity is the
most important independent variable as it directly determines how easy or difficult to compare
the firms; accounting estimate bias moderates this effect by providing a boundary condition
where the comparison becomes less informative when a firm’s reporting is less reliable with a
favorably-biased estimate. When the dependent variable is perceived reliability, however,
accounting estimate bias becomes the most important independent variable as bias itself is a
component of reliability; method similarity moderates this effect by exaggerating (using the
same method) or weakening (using different methods) the perceived differences in accounting
estimates between firms.18
(Insert Table 3 about here)
Supplementary Experiments
Supplementary Experiment 1
18 Since a better differentiation between the two firms can make investors feel more confident in their choices, we
also ask participants how confident they are with their investment decision on a 15-poin scale (-7 = extremely
unconfident; 0 = moderately confident; 7 = extremely confident). We run an ANOVA with confidence as the
dependent variable and the two manipulated variables as the independent variables. Untabulated results show a
significant main effect of method similarity (F1, 206 = 7.589, p = 0.003, one-tailed equivalent) such that same
(versus different) method increases confidence (means: 3.308 vs. 2.377), consistent with our prediction. We do
not find a significant main effect of bias (F1, 206 = 1.010, p = 0.316) or an interaction between bias and method
similarity (F1, 206 = 1.248, p = 0.256), suggesting that the direction of the bias does not moderate the effect of
method similarity on investors’ confidence on their investment decisions.

23
In our main experiment, the focal firm and its peer make different changes in accounting
estimates, which creates a contrast between the focal firm’s accounting estimate and its
reference point (i.e., the peer firm’s accounting estimate). When such contrast disappears,
however, investors may not be able to identify the bias and assess the reliability of the focal
firm’s financial reporting. We conduct Supplementary Experiment 1 to test this prediction. This
experiment has a 2 × 2 between-subjects design with bias (favorable versus unfavorable) and
method similarity (same versus different) as the independent variables. Both Firm A and its
peer increase (decrease) discount rates by the same amount in the unfavorable (favorable)
condition, while the current year’s discount rates are kept the same across all conditions for
both firms. We manipulate method similarity in the same way as in the main experiment. Two
hundred participants from MTurk completed the study. Results show no significant main
effects nor interaction between method similarity and bias on either perceived reliability (F1,
196 < 0.880, p > 0.348) or investment (F1, 196 < 1.993, p > 0.159).
The results from this supplementary experiment, when viewed in conjunction with
results in the main experiment, suggest the following inferences. First, it suggests that investors
need a reference point to judge the relative degree of bias in firms’ accounting estimates and
draw inferences on reliability. Second, the null results of method similarity at both levels of
bias suggest that investors regard accounting estimate bias, rather than method similarity, as
the main determinants of reliability—when investors cannot judge the relative level of bias in
estimates, method similarity no longer affects investors’ reliability judgment.
Supplementary Experiment 2
Accounting research finds that investors tend to use a more accessible attribute as the
basis to judge a less accessible attribute (Kadous et al. 2012), consistent with the “attribute
substitution” heuristic in psychology (Kahneman and Frederick 2002). It is possible that
investors use “same accounting method” as a substitute for “greater reliability” because both
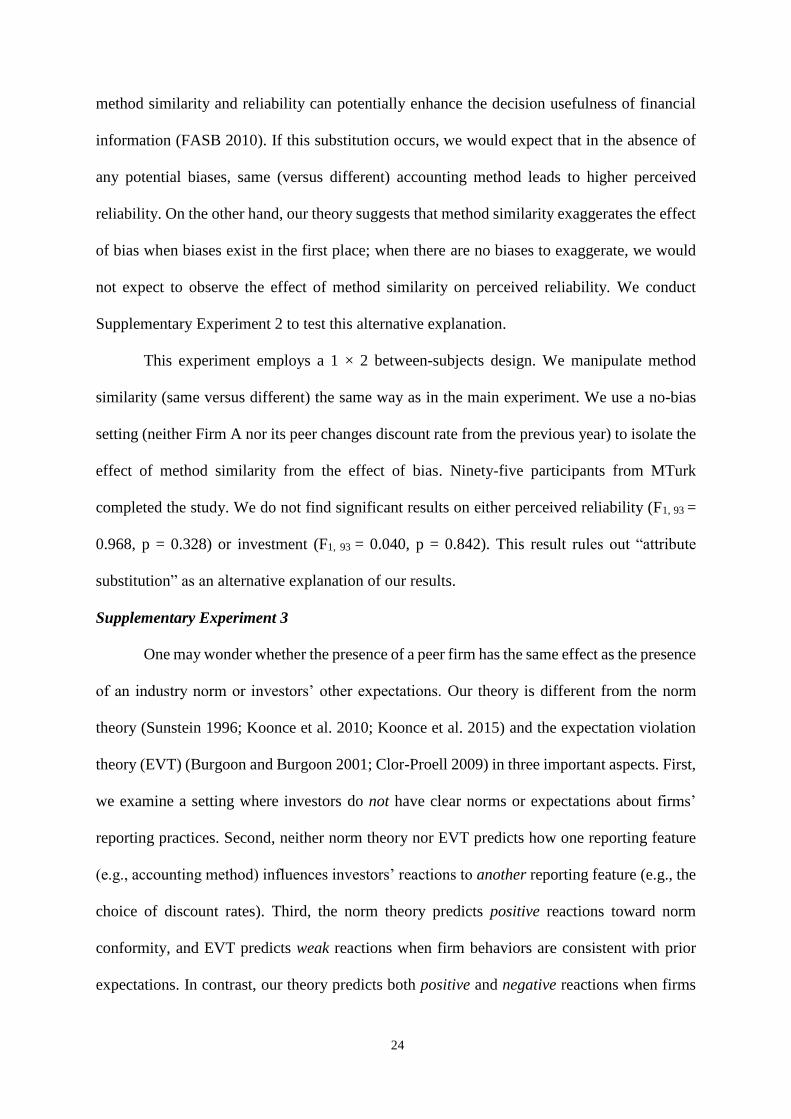
24
method similarity and reliability can potentially enhance the decision usefulness of financial
information (FASB 2010). If this substitution occurs, we would expect that in the absence of
any potential biases, same (versus different) accounting method leads to higher perceived
reliability. On the other hand, our theory suggests that method similarity exaggerates the effect
of bias when biases exist in the first place; when there are no biases to exaggerate, we would
not expect to observe the effect of method similarity on perceived reliability. We conduct
Supplementary Experiment 2 to test this alternative explanation.
This experiment employs a 1 × 2 between-subjects design. We manipulate method
similarity (same versus different) the same way as in the main experiment. We use a no-bias
setting (neither Firm A nor its peer changes discount rate from the previous year) to isolate the
effect of method similarity from the effect of bias. Ninety-five participants from MTurk
completed the study. We do not find significant results on either perceived reliability (F1, 93 =
0.968, p = 0.328) or investment (F1, 93 = 0.040, p = 0.842). This result rules out “attribute
substitution” as an alternative explanation of our results.
Supplementary Experiment 3
One may wonder whether the presence of a peer firm has the same effect as the presence
of an industry norm or investors’ other expectations. Our theory is different from the norm
theory (Sunstein 1996; Koonce et al. 2010; Koonce et al. 2015) and the expectation violation
theory (EVT) (Burgoon and Burgoon 2001; Clor-Proell 2009) in three important aspects. First,
we examine a setting where investors do not have clear norms or expectations about firms’
reporting practices. Second, neither norm theory nor EVT predicts how one reporting feature
(e.g., accounting method) influences investors’ reactions to another reporting feature (e.g., the
choice of discount rates). Third, the norm theory predicts positive reactions toward norm
conformity, and EVT predicts weak reactions when firm behaviors are consistent with prior
expectations. In contrast, our theory predicts both positive and negative reactions when firms
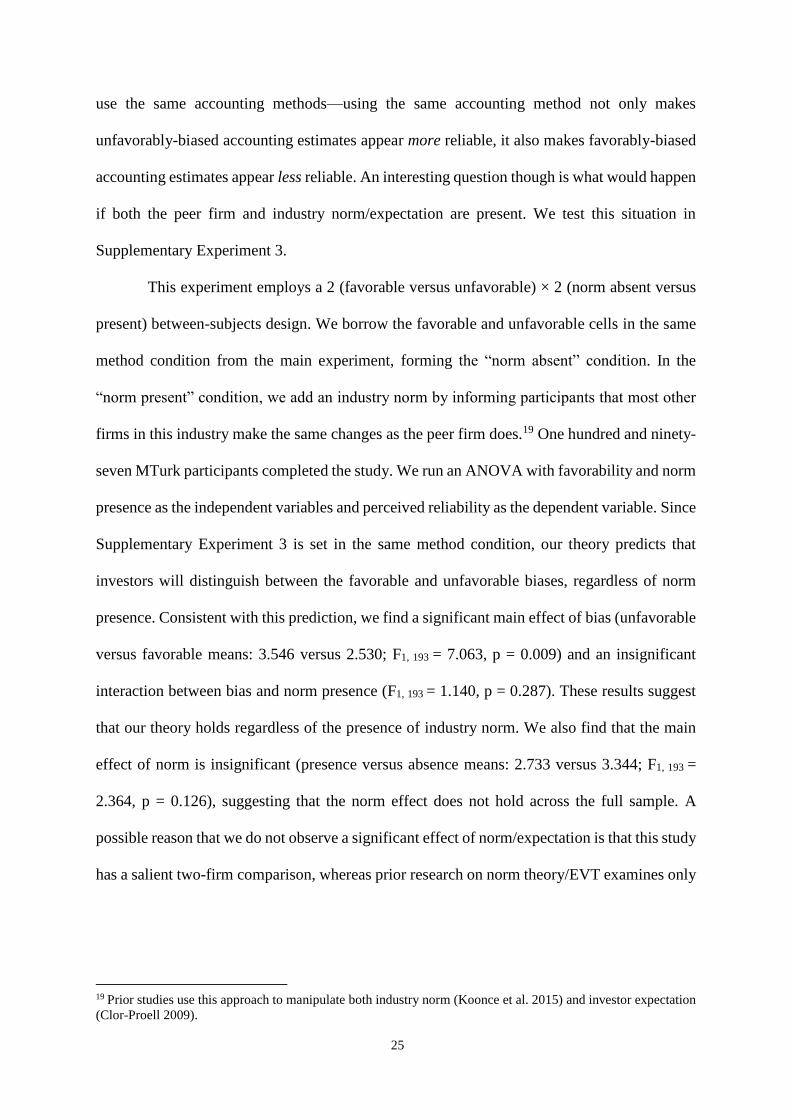
25
use the same accounting methods—using the same accounting method not only makes
unfavorably-biased accounting estimates appear more reliable, it also makes favorably-biased
accounting estimates appear less reliable. An interesting question though is what would happen
if both the peer firm and industry norm/expectation are present. We test this situation in
Supplementary Experiment 3.
This experiment employs a 2 (favorable versus unfavorable) × 2 (norm absent versus
present) between-subjects design. We borrow the favorable and unfavorable cells in the same
method condition from the main experiment, forming the “norm absent” condition. In the
“norm present” condition, we add an industry norm by informing participants that most other
firms in this industry make the same changes as the peer firm does.19 One hundred and ninety-
seven MTurk participants completed the study. We run an ANOVA with favorability and norm
presence as the independent variables and perceived reliability as the dependent variable. Since
Supplementary Experiment 3 is set in the same method condition, our theory predicts that
investors will distinguish between the favorable and unfavorable biases, regardless of norm
presence. Consistent with this prediction, we find a significant main effect of bias (unfavorable
versus favorable means: 3.546 versus 2.530; F1, 193 = 7.063, p = 0.009) and an insignificant
interaction between bias and norm presence (F1, 193 = 1.140, p = 0.287). These results suggest
that our theory holds regardless of the presence of industry norm. We also find that the main
effect of norm is insignificant (presence versus absence means: 2.733 versus 3.344; F1, 193 =
2.364, p = 0.126), suggesting that the norm effect does not hold across the full sample. A
possible reason that we do not observe a significant effect of norm/expectation is that this study
has a salient two-firm comparison, whereas prior research on norm theory/EVT examines only
19 Prior studies use this approach to manipulate both industry norm (Koonce et al. 2015) and investor expectation
(Clor-Proell 2009).

26
one firm with the presence of an industry norm/expectation. It is possible that the
norm/expectation effect would be stronger without the two-firm comparison.
Supplementary Experiment 4
Our last supplementary experiment is to test the situation where investors evaluate a
stand-alone firm. We adapt the experimental material from the main experiment by keeping
information only from the focal firm. This experiment has a 1 × 2 between-subjects design. As
in the main experiment, we manipulate favorability by increasing (unfavorable) or decreasing
(favorable) the firm’s discount rate. One hundred participants from MTurk completed this
study. Results show that although investors can correctly assess that the change of discount
rate in the favorable condition is more likely to upwards bias the firm’s financial performance
than the change in the unfavorable condition (means: 2.370 versus 0.500; F1, 98 = 9.689, p =
0.002), their perceptions of reporting reliability do not differ between the favorable and
unfavorable conditions (means: 3.130 versus 2.833; F1, 98 = 0.320, p = 0.573). Moreover,
investment in the firm is higher when bias is favorable than that unfavorable (means: $7,141
versus $4,935; F1, 98 = 11.246, p = 0.001), consistent with the notion that a favorable discount
rate indicates lower business risk, which leads to higher investment when its negative impact
on reliability no longer bothers investors. Results from Supplementary Experiment 4 suggest
that investors have difficulty assessing the impact of accounting estimate bias on reporting
reliability without a comparison with peer firms.
V. CONCLUSION
In a multi-firm setting, we examine how accounting estimate bias and accounting
method similarity jointly influence investors’ reliability judgment and investment decisions.
Applying psychology research on the similarity effect, we find that the similarity of accounting
method amplifies the effect of accounting estimate bias on investors’ reliability judgment.
Specifically, while investors are able to detect the negative impact of a favorably-biased (versus
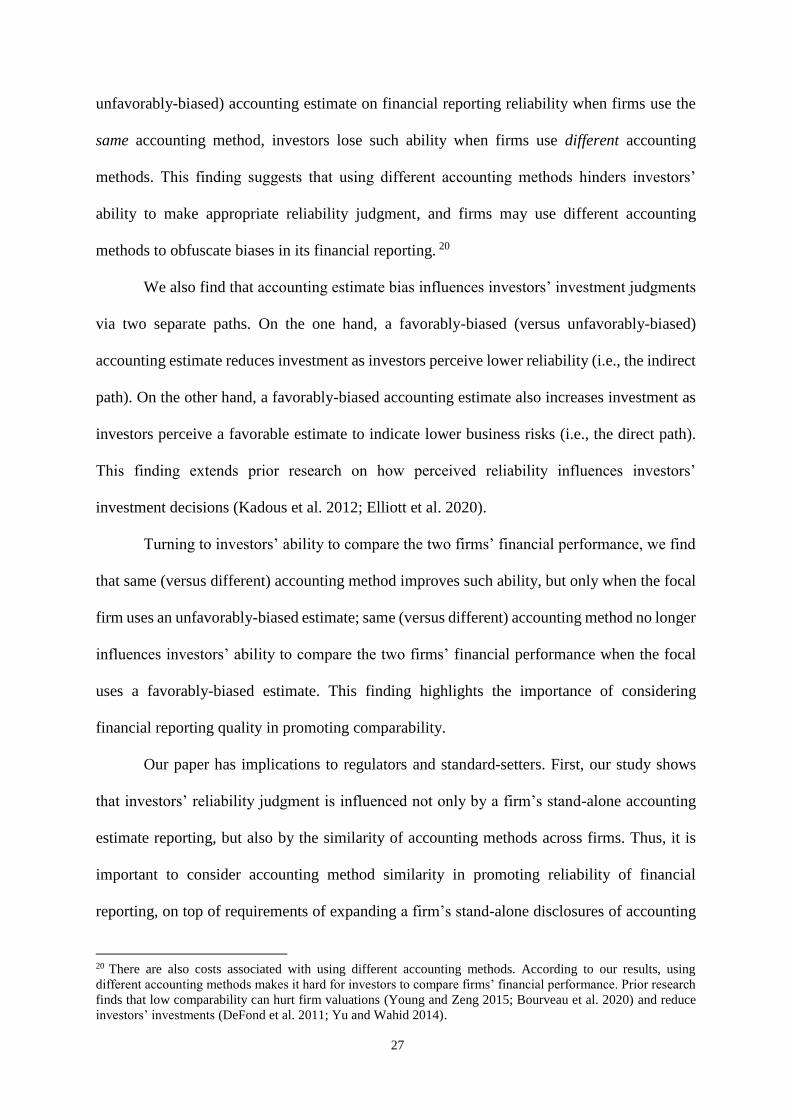
27
unfavorably-biased) accounting estimate on financial reporting reliability when firms use the
same accounting method, investors lose such ability when firms use different accounting
methods. This finding suggests that using different accounting methods hinders investors’
ability to make appropriate reliability judgment, and firms may use different accounting
methods to obfuscate biases in its financial reporting. 20
We also find that accounting estimate bias influences investors’ investment judgments
via two separate paths. On the one hand, a favorably-biased (versus unfavorably-biased)
accounting estimate reduces investment as investors perceive lower reliability (i.e., the indirect
path). On the other hand, a favorably-biased accounting estimate also increases investment as
investors perceive a favorable estimate to indicate lower business risks (i.e., the direct path).
This finding extends prior research on how perceived reliability influences investors’
investment decisions (Kadous et al. 2012; Elliott et al. 2020).
Turning to investors’ ability to compare the two firms’ financial performance, we find
that same (versus different) accounting method improves such ability, but only when the focal
firm uses an unfavorably-biased estimate; same (versus different) accounting method no longer
influences investors’ ability to compare the two firms’ financial performance when the focal
uses a favorably-biased estimate. This finding highlights the importance of considering
financial reporting quality in promoting comparability.
Our paper has implications to regulators and standard-setters. First, our study shows
that investors’ reliability judgment is influenced not only by a firm’s stand-alone accounting
estimate reporting, but also by the similarity of accounting methods across firms. Thus, it is
important to consider accounting method similarity in promoting reliability of financial
reporting, on top of requirements of expanding a firm’s stand-alone disclosures of accounting
20 There are also costs associated with using different accounting methods. According to our results, using
different accounting methods makes it hard for investors to compare firms’ financial performance. Prior research
finds that low comparability can hurt firm valuations (Young and Zeng 2015; Bourveau et al. 2020) and reduce
investors’ investments (DeFond et al. 2011; Yu and Wahid 2014).

28
estimates (SEC 2003, 2011, 2019; FASB 2018). Second, our finding that variations of
accounting methods can harm investors’ ability to make a proper reliability judgment supports
the FASB’s standard updates that aim at enhancing financial reporting comparability (e.g.,
FASB 2013; FASB 2014).
Our paper contributes to accounting literature in three aspects. First, we add to research
on investors’ reliability judgment. While Kadous et al. (2012) and Eilifsen et al. (2020)
examine how reporting features of a stand-alone firm influence perceived reliability, we show
that cross-firm reporting features such as accounting method similarity also influences
investors’ reliability judgment. Our results show that cross-firm comparisons can either help
or hinder investors’ assessment of reliability, depending on whether peer firms use the same or
different accounting methods. Second, our study answers the call for research to examine
financial reporting comparability on a more granular level (Hopkins 2019). Using a specific
reporting feature (i.e., accounting method similarity) as a proxy for comparability, we show
that comparability affects investors’ judgments by influencing the contrast in a peer
comparison. Lastly, our study contributes to research on how the adoption of IFRS increases
cross-border investments (DeFond et al. 2011; Yu and Wahid 2014; Francis et al. 2016) by
showing that both the increase of method similarity and the improvement in reporting reliability
contribute to the increased investment following the adoption of IFRS.
A limitation should be noted when interpreting our results. We measure investors’
ability to compare firms’ financial performance by asking participants to indicate the extent to
which they are able to judge the two firms’ relative performance. Following the FASB (2012),
we define “being able to compare” as being able to identify and understand similarities in and
differences among items. Thus, if investors perceive the two firms to have similar financial
performance, they are still able to make such comparison per our experimental instruction.

29
Future research can further examine this issue and investigate whether investors judge “being
similar” and “being different” in different ways.
30
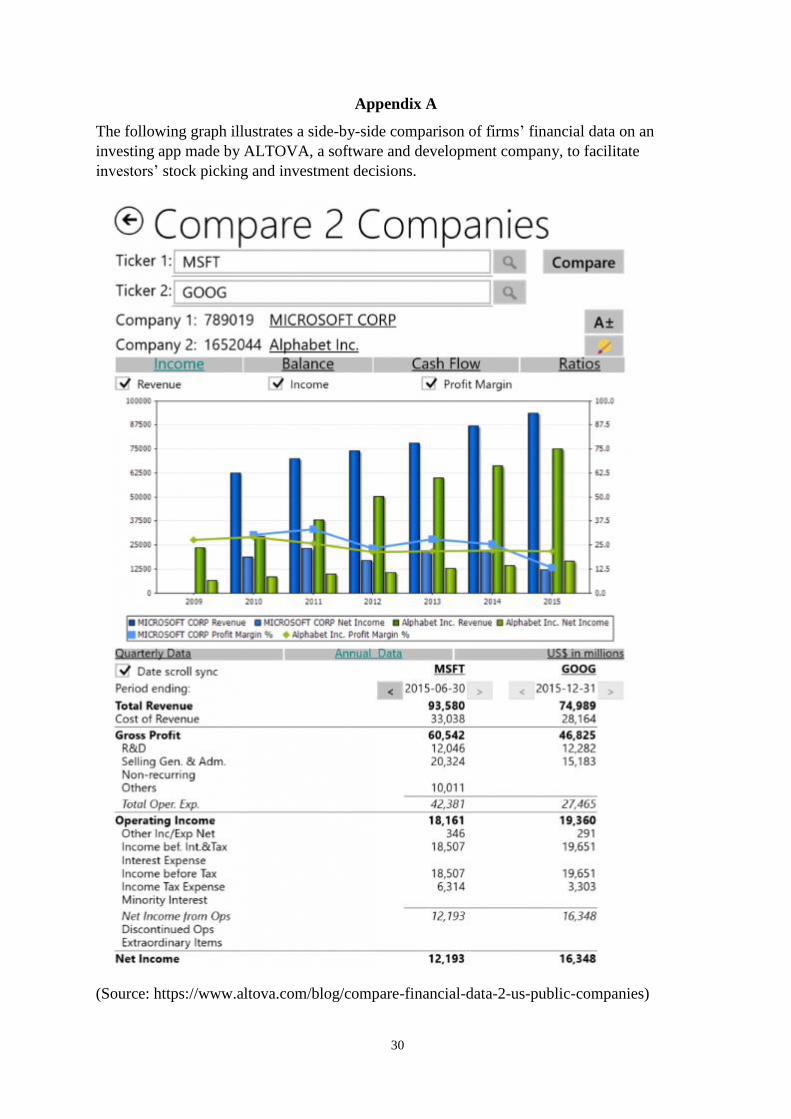
Appendix A
The following graph illustrates a side-by-side comparison of firms’ financial data on an
investing app made by ALTOVA, a software and development company, to facilitate
investors’ stock picking and investment decisions.
(Source: https://www.altova.com/blog/compare-financial-data-2-us-public-companies)
31
REFERENCES
Aarts, H., and A. Dijksterhuis. 2002. Category activation effects in judgment and behaviour: The
moderating role of perceived comparability. British Journal of Social Psychology 41 (1):
123–138.
Bae, K.-H., H. Tan, and M. Welker. 2008. International GAAP Differences: The Impact on Foreign
Analysts. The Accounting Review: 37.
Baginski, S. P. 1987. Intraindustry Information Transfers Associated with Management Forecasts of
Earnings. Journal of Accounting Research 25 (2): 196–216.
Barth, M. E., W. R. Landsman, M. Lang, and C. Williams. 2012. Are IFRS-based and US GAAP-
based accounting amounts comparable? Journal of Accounting and Economics 54 (1): 68–93.
Bentley, J. W. 2021. Improving the Statistical Power and Reliability of Research Using Amazon
Mechanical Turk. Working paper.
Blount, S., M. C. Thomas-Hunt, and M. A. Neale. 1996. The Price Is Right—Or Is It? A Reference
Point Model of Two-Party Price Negotiations. Organizational Behavior and Human Decision
Processes 68 (1): 1–12.
Boles, T. L., and D. M. Messick. 1995. A Reverse Outcome Bias: The Influence of Multiple
Reference Points on the Evaluation of Outcomes and Decisions. Organizational Behavior and
Human Decision Processes 61 (3): 262–275.
Bourveau, T., J. V. Chen, F. Elfers, and J. Pierk. 2020. Public Peers, Accounting Comparability, and
Value Relevance of Private Firms’ Financial Reporting. SSRN Electronic Journal.
Brochet, F., A. D. Jagolinzer, and E. J. Riedl. 2013. Mandatory IFRS Adoption and Financial
Statement Comparability. Contemporary Accounting Research 30 (4): 1373–1400.
Burgoon, J. K., and M. Burgoon. 2001. Expectancy Theories. In The New Handbook of Language and
Social Psychology, 79–99. edited by W. P. Robinson, and H. Giles. London, U.K.: John
Wiley & Sons, Ltd.
Cao, S. S., G. Ma, J. W. Tucker, and C. Wan. 2018. Technological Peer Pressure and Product
Disclosure. The Accounting Review 93 (6): 95–126.
Cascino, S., and J. Gassen. 2015. What drives the comparability effect of mandatory IFRS adoption?
Review of Accounting Studies 20 (1): 242–282.
Christensen, B. E., S. M. Glover, and D. A. Wood. 2012. Extreme Estimation Uncertainty in Fair
Value Estimates: Implications for Audit Assurance. AUDITING: A Journal of Practice &
Theory 31 (1): 127–146.
Chung, S. G., B. W. Goh, J. Ng, and K. O. Yong. 2017. Voluntary fair value disclosures beyond
SFAS 157’s three-level estimates. Review of Accounting Studies 22 (1): 430–468.
Chung, S. G., C. Lee, and S. Mitra. 2016. Fair Value Accounting and Reliability. The CPA Journal.
Clor-Proell, S. M. 2009. The Effects of Expected and Actual Accounting Choices on Judgments and
Decisions. The Accounting Review 84 (5): 1465–1493.
De Franco, G., O.-K. Hope, and S. Larocque. 2015. Analysts’ choice of peer companies. Review of
Accounting Studies 20 (1): 82–109.
De Franco, G., S. P. KOTHARI, and R. S. VERDI. 2011. The Benefits of Financial Statement
Comparability. Journal of Accounting Research 49 (4): 895–931.
DeFond, M., X. Hu, M. Hung, and S. Li. 2011. The impact of mandatory IFRS adoption on foreign
mutual fund ownership: The role of comparability. Journal of Accounting and Economics 51
(3): 240–258.

32
Du, Q., and R. Shen. 2018. Peer performance and earnings management. Journal of Banking &
Finance 89: 125–137.
Easton, P. D., M. L. McAnally, G. A. Sommers, and X.-J. Zhang. 2018. Financial Statement Analysis
& Valuation. 5th ed. Cambridge Business Publishers.
Eilifsen, A., E. L. Hamilton, and Jr. W. F. Messier. 2020. The importance of quantifying uncertainty:
Examining the effects of quantitative sensitivity analysis and audit materiality disclosures on
investors’ judgments and decisions. Accounting, Organizations and Society.
Elliott, W. B., K. Fanning, and M. E. Peecher. 2020. Do Investors Value Higher Financial Reporting
Quality, and Can Expanded Audit Reports Unlock This Value? The Accounting Review 95
(2): 141–165.
Fama, E. F., and K. R. French. 1993. Common risk factors in the returns on stocks and bonds. Journal
of Financial Economics 33 (1): 3–56.
———. 1996. Multifactor Explanations of Asset Pricing Anomalies. The Journal of Finance 51 (1):
55–84.
Farrell, A. M., J. H. Grenier, and J. Leiby. 2017. Scoundrels or Stars? Theory and Evidence on the
Quality of Workers in Online Labor Markets. The Accounting Review 92 (1): 93–114.
Financial Accounting Standards Board (FASB). 1980. Statement of Financial Accounting Concepts
No. 2. Norwalk, CT: FASB.
———. 2008. Statement of Financial Accounting Concepts No. 5--Recognition and Measurement in
Financial Statements of Business Enterprises. Norwalk, CT: FASB.
———. 2010. Statement of Financial Accounting Concepts No. 8--Conceptual Framework for
Financial Reporting. Statement of Financial Accounting Concepts No. 8. Norwalk, CT:
FASB.
———. 2013. IASB and FASB Propose Changes to Lease Accounting. News Release 05/16/13.
Norwalk, CT: FASB.
———. 2014. IASB and FASB Issue Converged Standard on Revenue Recognition. News Release
05/28/14. Norwalk, CT: FASB.
———. 2018. Fair Value Measurement (Topic 820): Disclosure Framework—Changes to the
Disclosure Requirements for Fair Value Measurement. Norwalk, CT: FASB.
Francis, J. R., S. X. Huang, and I. K. Khurana. 2016. The Role of Similar Accounting Standards in
Cross-Border Mergers and Acquisitions. Contemporary Accounting Research 33 (3): 1298–
1330.
Gao, P., and G. Zhang. 2019. Accounting Manipulation, Peer Pressure, and Internal Control. The
Accounting Review 94 (1): 127–151.
Gilbert, D. T., R. B. Giesler, and K. A. Morris. 1995. When comparisons arise. Journal of Personality
and Social Psychology 69 (2): 227–236.
Gregory, R., S. Lichtenstein, and D. MacGregor. 1993. The Role of Past States in Determining
Reference Points for Policy Decisions. Organizational Behavior and Human Decision
Processes 55 (2): 195–206.
Han, J. C. Y., J. J. Wild, and K. Ramesh. 1989. Managers’ earnings forecasts and intra-industry
information transfers. Journal of Accounting and Economics 11 (1): 3–33.
Hayes, A. F. 2017. Introduction to Mediation, Moderation, and Conditional Process Analysis, Second
Edition: A Regression-Based Approach. Guilford Publications.
Hopkins, P. E. 2019. Discussion of “Relative Effects of IFRS Adoption and IFRS Convergence on
Financial Statement Comparability.” Contemporary Accounting Research 36 (2): 618–625.

33
Kadous, K., L. Koonce, and J. M. Thayer. 2012. Do Financial Statement Users Judge Relevance
Based on Properties of Reliability? The Accounting Review 87 (4): 1335–1356.
Kahneman, D., and A. Tversky. 1979. Prospect Theory: An Analysis of Decision under Risk.
Econometrica 47 (2): 263–291.
Kelley, H. H. 1987. Attribution in social interaction. In Attribution: Perceiving the causes of
behavior, 1–26. Hillsdale, NJ: Lawrence Erlbaum Associates, Inc.
Kida, T., and J. F. Smith. 1995. The encoding and retrieval of numerical data for decision making in
accounting contexts: Model development. Accounting, Organizations and Society 20 (7):
585–610.
Kim, Y., M. Lacina, and M. S. Park. 2008. Positive and Negative Information Transfers from
Management Forecasts. Journal of Accounting Research 46 (4): 885–908.
Koonce, L., M. G. Lipe, and M. L. McAnally. 2005. Judging the Risk of Financial Instruments:
Problems and Potential Remedies. The Accounting Review 80 (3): 871–895.
Koonce, L., J. Miller, and J. Winchel. 2015. The Effects of Norms on Investor Reactions to Derivative
Use. Contemporary Accounting Research 32 (4): 1529–1554.
Koonce, L., M. G. Williamson, and J. Winchel. 2010. Consensus Information and Nonprofessional
Investors’ Reaction to the Revelation of Estimate Inaccuracies. The Accounting Review 85
(3): 979–1000.
Krische, S. D. 2019. Investment Experience, Financial Literacy, and Investment‐Related Judgments.
Contemporary Accounting Research 36 (3): 1634–1668.
Lev, B., S. Li, and T. Sougiannis. 2010. The usefulness of accounting estimates for predicting cash
flows and earnings. Review of Accounting Studies 15 (4): 779–807.
Lintner, J. 1965. The Valuation of Risk Assets and the Selection of Risky Investments in Stock
Portfolios and Capital Budgets. The Review of Economics and Statistics 47 (1): 13.
Maletta, M. J., and Y. M. Zhang. 2012. Investor Reactions to Contrasts Between the Earnings
Preannouncements of Peer Firms: Investor Reactions to Earnings Preannouncements.
Contemporary Accounting Research 29 (2): 361–381.
Marshall, J. N., C. Korologos, and L. Yagudayev. 2012. Valuation and pricing for private real estate.
Real Estate Alert, March 14.
Mellers, B. A. 1982. Equity judgment: A revision of Aristotelian views. Journal of Experimental
Psychology: General 111 (2): 242–270.
Mellers, B. A., and K. Biagini. 1994. Similarity and choice. Psychological Review 101 (3): 505–518.
Osipovich, A. 2020. Individual-Investing Boom Fuels Trading in Low-Price Stocks. The Wall Street
Journal, October 16.
Pickett, C. L. 2001. The Effects of Entitativity Beliefs on Implicit Comparisons between Group
Members. Personality and Social Psychology Bulletin 27 (5): 515–525.
Pleskac, T. J. 2012. Comparability Effects in Probability Judgments. Psychological Science 23 (8):
848–854.
PricewaterhouseCoopers LLP (PwC). 2019. Fair value measurements.
Pyo, Y., and S. Lustgarten. 1990. Differential intra-industry information transfer associated with
management earnings forecasts. Journal of Accounting and Economics 13 (4): 365–379.
Richardson, S. A., R. G. Sloan, M. T. Soliman, and İ. Tuna. 2005. Accrual reliability, earnings
persistence and stock prices. Journal of Accounting and Economics 39 (3): 437–485.
Riedl, E. J., and G. Serafeim. 2011. Information Risk and Fair Values: An Examination of Equity
Betas. Journal of Accounting Research 49 (4): 1083–1122.

34
Sharpe, W. F. 1964. Capital Asset Prices: A Theory of Market Equilibrium under Conditions of Risk.
The Journal of Finance 19 (3): 425–442.
Song, C. J., W. B. Thomas, and H. Yi. 2010. Value Relevance of FAS No. 157 Fair Value Hierarchy
Information and the Impact of Corporate Governance Mechanisms. The Accounting Review
85 (4): 1375–1410.
Sullivan, K., and T. Kida. 1995. The Effect of Multiple Reference Points and Prior Gains and Losses
on Managers′ Risky Decision Making. Organizational Behavior and Human Decision
Processes 64 (1): 76–83.
Sunstein, C. R. 1996. Social Norms and Social Roles. Columbia Law Review 96 (4): 903–968.
Tan, H., S. Wang, and M. Welker. 2011. Analyst Following and Forecast Accuracy After Mandated
IFRS Adoptions: analyst following and forecast accuracy. Journal of Accounting Research 49
(5): 1307–1357.
Tesser, A. 1988. Toward a Self-Evaluation Maintenance Model of Social Behavior. In Advances in
Experimental Social Psychology, edited by L. Berkowitz, 21:181–227. Academic Press.
Thaler, R. H. 1999. Mental accounting matters. Journal of Behavioral Decision Making 12 (3): 183–
206.
Toppan Merrill. 2019. Ten years of XBRL: Financial-reporting experts reflect on benefits, successes,
and remaining challenges (Part 1). Dimensions (June&July 2019).
Tversky, A., and D. Kahneman. 1981. The framing of decisions and the psychology of choice.
Science 211 (4481): 453.
Tversky, A., and E. J. Russo. 1969. Substitutability and similarity in binary choices. Journal of
Mathematical Psychology 6 (1): 1–12.
U.S. Securities and Exchange Commission (SEC). 2003. Commission Guidance Regarding
Management’s Discussion and Analysis of Financial Condition and Results of Operations.
Release Nos. 33-8350; 34-48960; FR-72. Washington, DC: SEC.
———. 2011. Roundtable Subject: Measurement Uncertainty in Financial Reporting. Transcript of
the Inaugural Public Roundtable for Financial Reporting Series (November 8). Washington,
D.C.: SEC.
———. 2017. A U.S. Imperative: High-Quality, Globally Accepted Accounting Standards.
Washington, D.C.: SEC.
———. 2019. Public Company Accounting Oversight Board; Order Granting Approval of Auditing
Standard 2501, Auditing Accounting Estimates, Including Fair Value Measurements, and
Related Amendments to PCAOB Auditing Standards. Release No. 34-86269; File No.
PCAOB-2019-02. Washington, D.C.: SEC.
Watts, R. L. 2003. Conservatism in Accounting Part I: Explanations and Implications. Accounting
Horizons 17 (3): 207–221.
Williams, P. A. 1996. The Relation between a Prior Earnings Forecast by Management and Analyst
Response to a Current Management Forecast. The Accounting Review 71 (1): 103–115.
Young, S., and Y. Zeng. 2015. Accounting Comparability and the Accuracy of Peer-Based Valuation
Models. The Accounting Review 90 (6): 2571–2601.
Yu, G., and A. S. Wahid. 2014. Accounting Standards and International Portfolio Holdings. The
Accounting Review 89 (5): 1895–1930.
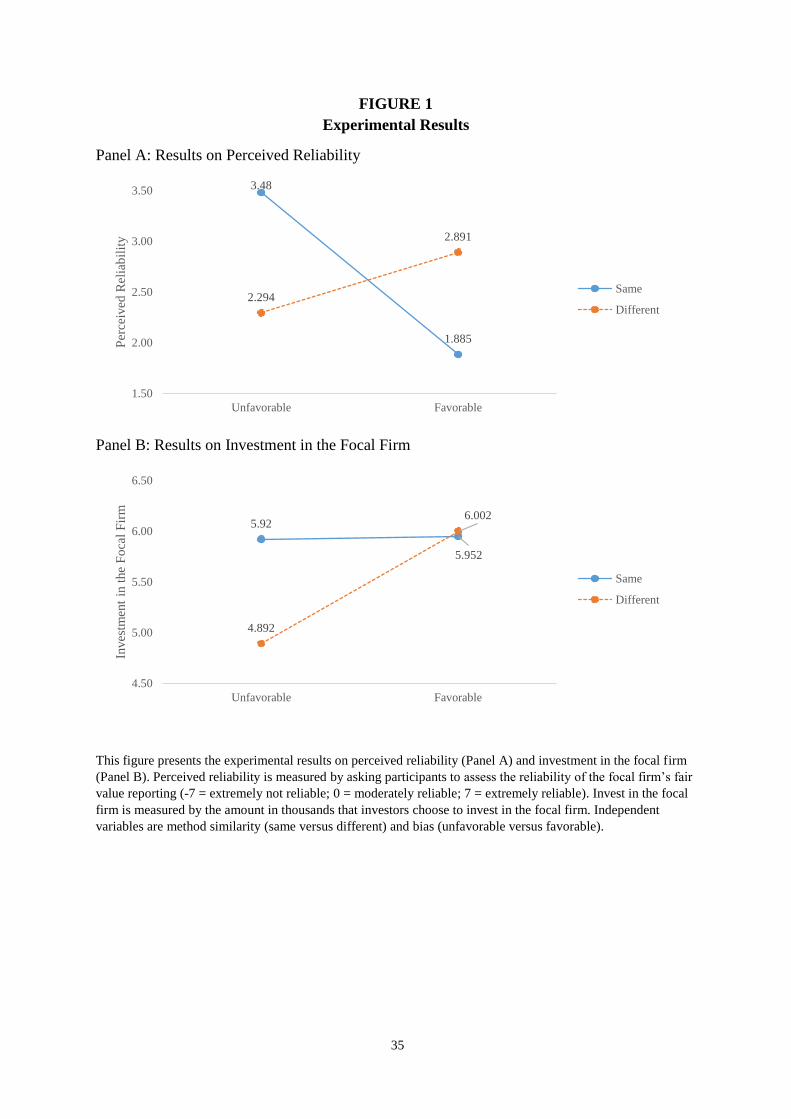
35
FIGURE 1
Experimental Results
Panel A: Results on Perceived Reliability
Panel B: Results on Investment in the Focal Firm
This figure presents the experimental results on perceived reliability (Panel A) and investment in the focal firm
(Panel B). Perceived reliability is measured by asking participants to assess the reliability of the focal firm’s fair
value reporting (-7 = extremely not reliable; 0 = moderately reliable; 7 = extremely reliable). Invest in the focal
firm is measured by the amount in thousands that investors choose to invest in the focal firm. Independent
variables are method similarity (same versus different) and bias (unfavorable versus favorable).
3.48
1.885
2.294
2.891
1.50
2.00
2.50
3.00
3.50
Unfavorable Favorable
Per
ceiv
ed R
elia
bil
ity
Same
Different
5.92
5.952
4.892
6.002
4.50
5.00
5.50
6.00
6.50
Unfavorable Favorable
Inves
tmen
t in
the
Fo
cal
Fir
m
Same
Different
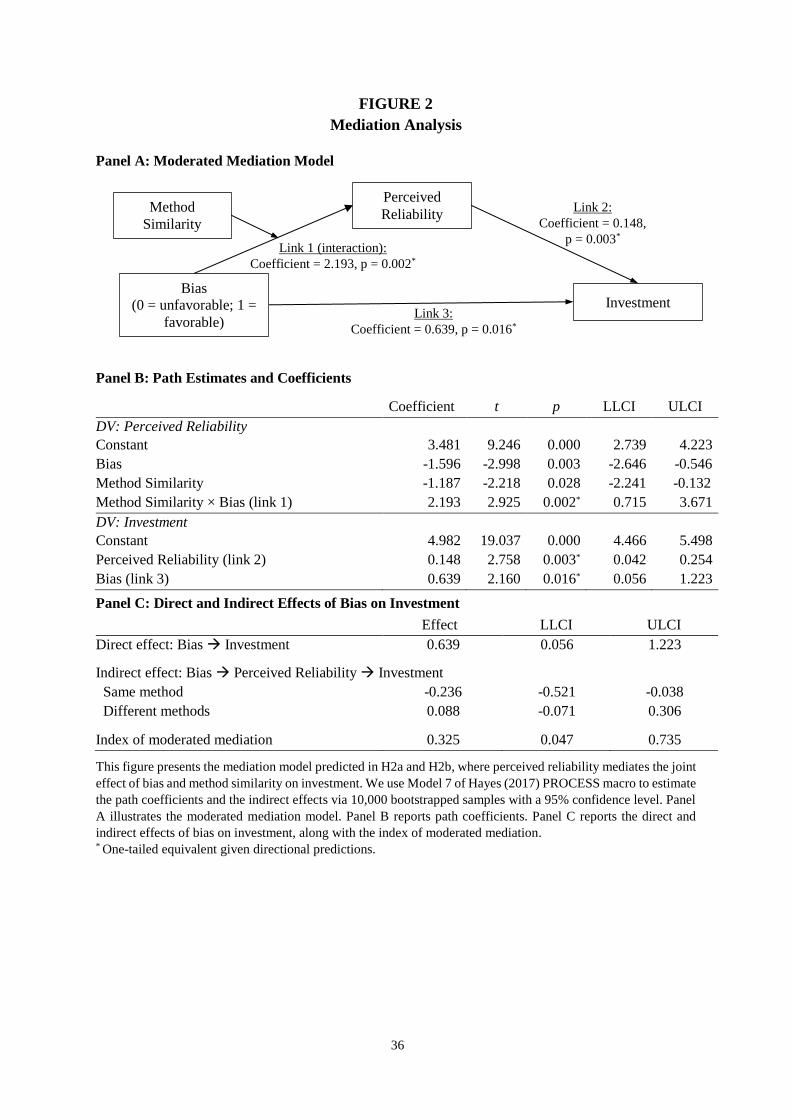
36
FIGURE 2
Mediation Analysis
Panel A: Moderated Mediation Model
Panel B: Path Estimates and Coefficients
Coefficient t p LLCI ULCI
DV: Perceived Reliability
Constant 3.481 9.246 0.000 2.739 4.223
Bias -1.596 -2.998 0.003 -2.646 -0.546
Method Similarity -1.187 -2.218 0.028 -2.241 -0.132
Method Similarity × Bias (link 1) 2.193 2.925 0.002* 0.715 3.671
DV: Investment
Constant 4.982 19.037 0.000 4.466 5.498
Perceived Reliability (link 2) 0.148 2.758 0.003* 0.042 0.254
Bias (link 3) 0.639 2.160 0.016* 0.056 1.223
Panel C: Direct and Indirect Effects of Bias on Investment
Effect LLCI ULCI
Direct effect: Bias Investment 0.639 0.056 1.223
Indirect effect: Bias Perceived Reliability Investment
Same method -0.236 -0.521 -0.038
Different methods 0.088 -0.071 0.306
Index of moderated mediation 0.325 0.047 0.735
This figure presents the mediation model predicted in H2a and H2b, where perceived reliability mediates the joint
effect of bias and method similarity on investment. We use Model 7 of Hayes (2017) PROCESS macro to estimate
the path coefficients and the indirect effects via 10,000 bootstrapped samples with a 95% confidence level. Panel
A illustrates the moderated mediation model. Panel B reports path coefficients. Panel C reports the direct and
indirect effects of bias on investment, along with the index of moderated mediation. * One-tailed equivalent given directional predictions.
Perceived
Reliability
Bias
(0 = unfavorable; 1 =
favorable)
Investment
Method
Similarity
Link 1 (interaction):
Coefficient = 2.193, p = 0.002*
Link 2:
Coefficient = 0.148,
p = 0.003*
Link 3:
Coefficient = 0.639, p = 0.016*
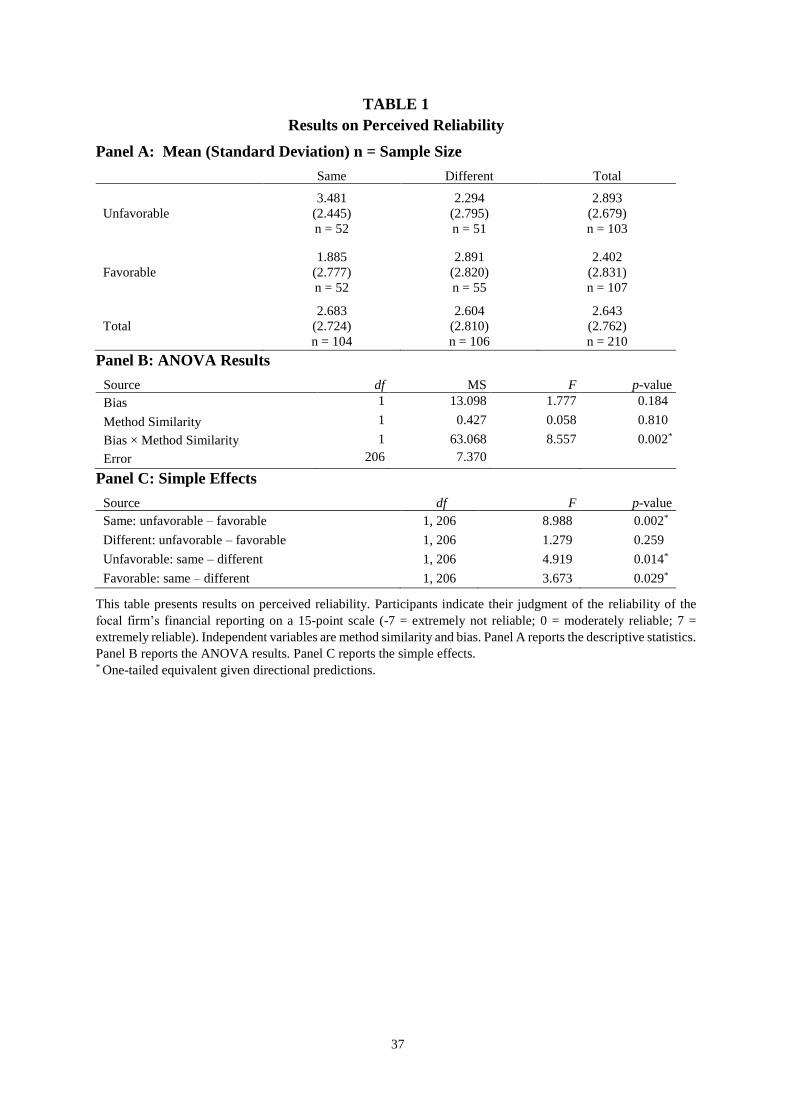
37
TABLE 1
Results on Perceived Reliability
Panel A: Mean (Standard Deviation) n = Sample Size
Same Different Total
Unfavorable
3.481
(2.445)
n = 52
2.294
(2.795)
n = 51
2.893
(2.679)
n = 103
Favorable
1.885
(2.777)
n = 52
2.891
(2.820)
n = 55
2.402
(2.831)
n = 107
Total
2.683
(2.724)
n = 104
2.604
(2.810)
n = 106
2.643
(2.762)
n = 210
Panel B: ANOVA Results
Source df MS F p-value
Bias 1 13.098 1.777 0.184*
Method Similarity 1 0.427 0.058 0.810*
Bias × Method Similarity 1 63.068 8.557 0.002*
Error 206 7.370
Panel C: Simple Effects
Source df F p-value
Same: unfavorable – favorable 1, 206 8.988 0.002*
Different: unfavorable – favorable 1, 206 1.279 0.259*
Unfavorable: same – different 1, 206 4.919 0.014*
Favorable: same – different 1, 206 3.673 0.029*
This table presents results on perceived reliability. Participants indicate their judgment of the reliability of the
focal firm’s financial reporting on a 15-point scale (-7 = extremely not reliable; 0 = moderately reliable; 7 =
extremely reliable). Independent variables are method similarity and bias. Panel A reports the descriptive statistics.
Panel B reports the ANOVA results. Panel C reports the simple effects. * One-tailed equivalent given directional predictions.
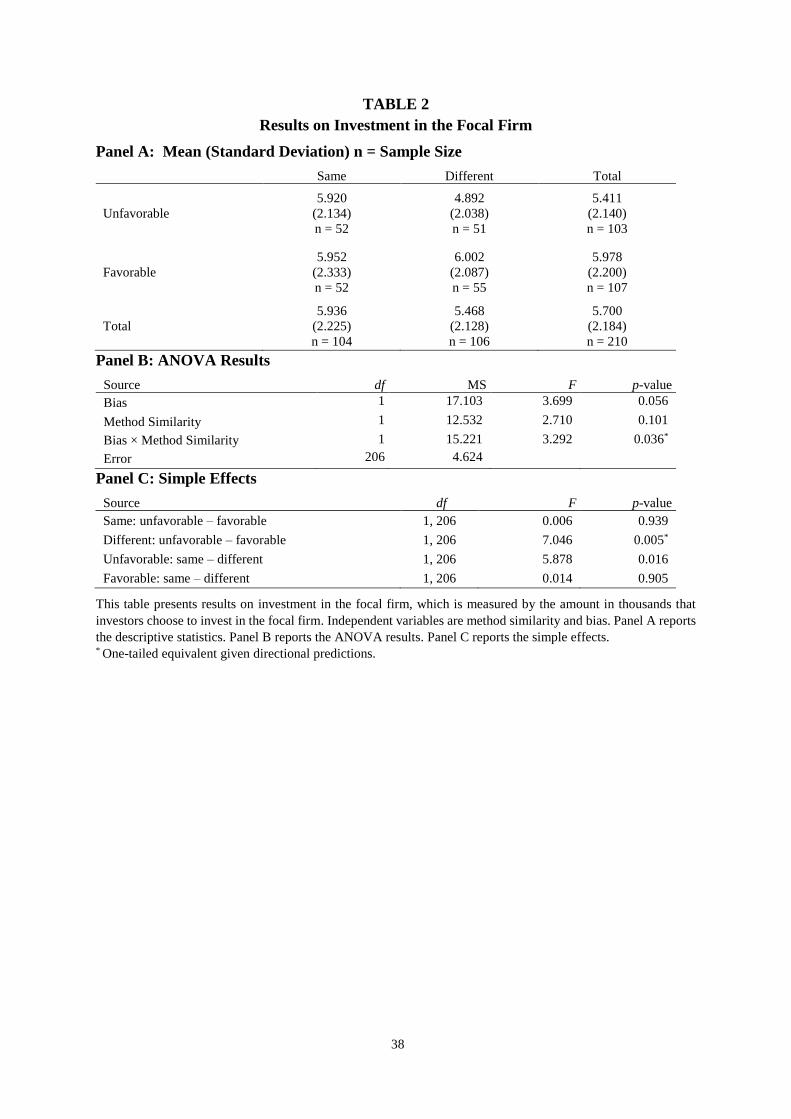
38
TABLE 2
Results on Investment in the Focal Firm
Panel A: Mean (Standard Deviation) n = Sample Size
Same Different Total
Unfavorable
5.920
(2.134)
n = 52
4.892
(2.038)
n = 51
5.411
(2.140)
n = 103
Favorable
5.952
(2.333)
n = 52
6.002
(2.087)
n = 55
5.978
(2.200)
n = 107
Total
5.936
(2.225)
n = 104
5.468
(2.128)
n = 106
5.700
(2.184)
n = 210
Panel B: ANOVA Results
Source df MS F p-value
Bias 1 17.103 3.699 0.056
Method Similarity 1 12.532 2.710 0.101
Bias × Method Similarity 1 15.221 3.292 0.036*
Error 206 4.624
Panel C: Simple Effects
Source df F p-value
Same: unfavorable – favorable 1, 206 0.006 0.939
Different: unfavorable – favorable 1, 206 7.046 0.005*
Unfavorable: same – different 1, 206 5.878 0.016
Favorable: same – different 1, 206 0.014 0.905
This table presents results on investment in the focal firm, which is measured by the amount in thousands that
investors choose to invest in the focal firm. Independent variables are method similarity and bias. Panel A reports
the descriptive statistics. Panel B reports the ANOVA results. Panel C reports the simple effects. * One-tailed equivalent given directional predictions.
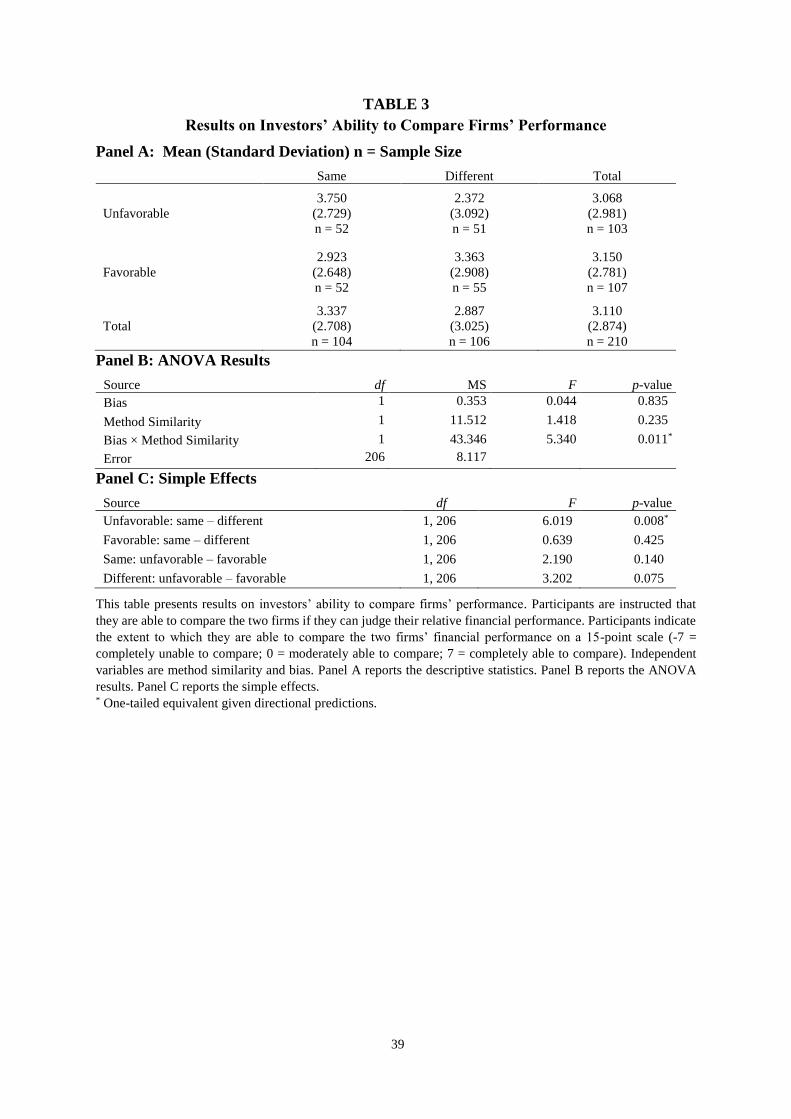
39
TABLE 3
Results on Investors’ Ability to Compare Firms’ Performance
Panel A: Mean (Standard Deviation) n = Sample Size
Same Different Total
Unfavorable
3.750
(2.729)
n = 52
2.372
(3.092)
n = 51
3.068
(2.981)
n = 103
Favorable
2.923
(2.648)
n = 52
3.363
(2.908)
n = 55
3.150
(2.781)
n = 107
Total
3.337
(2.708)
n = 104
2.887
(3.025)
n = 106
3.110
(2.874)
n = 210
Panel B: ANOVA Results
Source df MS F p-value
Bias 1 0.353 0.044 0.835*
Method Similarity 1 11.512 1.418 0.235*
Bias × Method Similarity 1 43.346 5.340 0.011*
Error 206 8.117
Panel C: Simple Effects
Source df F p-value
Unfavorable: same – different 1, 206 6.019 0.008*
Favorable: same – different 1, 206 0.639 0.425*
Same: unfavorable – favorable 1, 206 2.190 0.140*
Different: unfavorable – favorable 1, 206 3.202 0.075*
This table presents results on investors’ ability to compare firms’ performance. Participants are instructed that
they are able to compare the two firms if they can judge their relative financial performance. Participants indicate
the extent to which they are able to compare the two firms’ financial performance on a 15-point scale (-7 =
completely unable to compare; 0 = moderately able to compare; 7 = completely able to compare). Independent
variables are method similarity and bias. Panel A reports the descriptive statistics. Panel B reports the ANOVA
results. Panel C reports the simple effects. * One-tailed equivalent given directional predictions.