How are Air Service Trends Impacting Small Communities
50
How are Air Service Trends Impacting Small Communities Mike Maynard | Joe Beckendorf | Steve Brian| Shawn Burke
Transcript of How are Air Service Trends Impacting Small Communities
How are Air Service Trends Impacting
Small Communities
Mike Maynard | Joe Beckendorf | Steve Brian| Shawn Burke
Wyoming Air Service
Development Program
Air Service to Small Communities
3
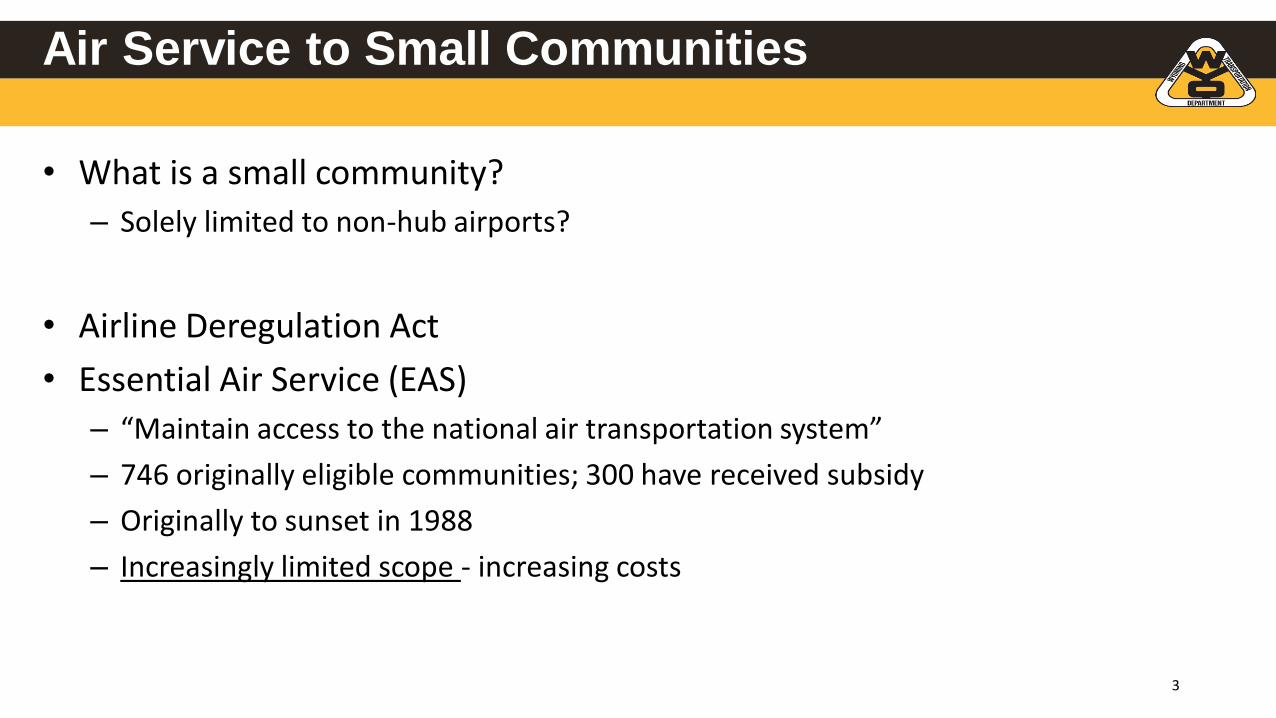
• What is a small community?
– Solely limited to non-hub airports?
• Airline Deregulation Act
• Essential Air Service (EAS)
– “Maintain access to the national air transportation system”
– 746 originally eligible communities; 300 have received subsidy
– Originally to sunset in 1988
– Increasingly limited scope - increasing costs
EAS in Wyoming
4
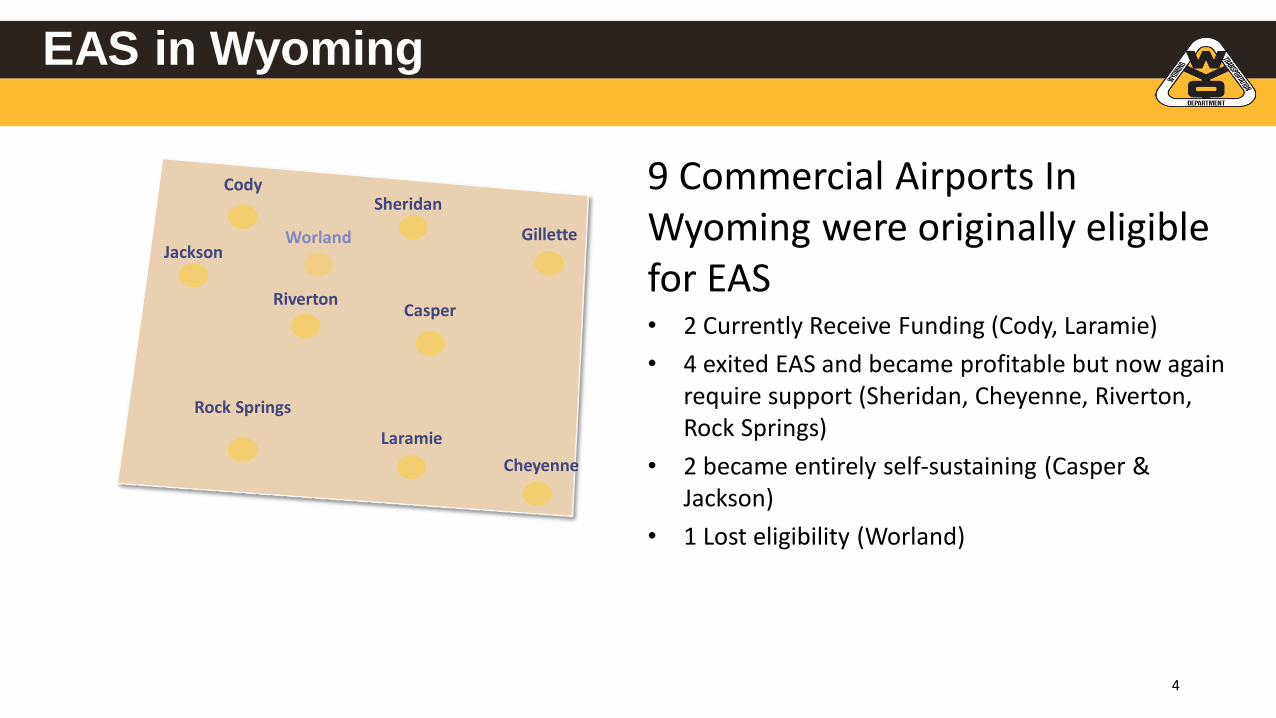
9 Commercial Airports In Wyoming were originally eligible for EAS• 2 Currently Receive Funding (Cody, Laramie)
• 4 exited EAS and became profitable but now again require support (Sheridan, Cheyenne, Riverton, Rock Springs)
• 2 became entirely self-sustaining (Casper & Jackson)
• 1 Lost eligibility (Worland)
Cheyenne
Laramie
Rock Springs
RivertonCasper
Gillette
SheridanCody
JacksonWorland

Small Community Air Service Development Program
SCASDP
5
• Allows airports to self-identify solutions to air service problems and apply for a grant
– No larger than a small hub
– Local match
– Variable projects
• Marketing
• Revenue Guarantees
• Fee waivers
• Travel Bank
• Limitations – Same project limitation

SCASDP in Wyoming
6
• 2002 Casper/Gillette – $500k
• 2005 WY Consortium – $800K “Fly Wyoming”
• 2012 Casper– $100K
• 2014 Cheyenne– $200K (LAS->DFW)
• 2014 Sheridan– $500K (DEN)
• 2015 Riverton – $481K (DEN)
• 2018 Casper– $500K (Western hub)

State Support for Air ServiceAir Service Enhancement Program (ASEP)
7
• In 2003 the WY state legislature found:
“an adequate and comprehensive system of air service in Wyoming is vital for economic development within Wyoming”.
W.S. § 10-3-601
• Originally appropriated $3M annually for granting purposes to improve air service– Revenue guarantees
– Marketing
– Improvement projects
– Consulting, data & analysis
• Later reduced to $1.5M annually and then $1.3M
• Grants required “a significant local contribution”

State Support for Air ServiceAir Service Enhancement Program (ASEP)
8
All 9 Commercial Airports In Wyoming have used ASEP funds at one point• Casper – MSP
• Cody – SLC, DEN, ORD
• Cheyenne – DFW
• Gillette – SLC, DEN
• Jackson – DFW, ORD, EWR, IAH, IAD
• Rock Springs – SLC, DEN
• Riverton and Sheridan – DEN

State Support for Air ServiceAir Service Enhancement Program (ASEP)
9
• Since 2004:
– $28M in state support
– $12M in local matches
– 1,000,000+ passengers
• 600,000 visitors
– $550M in economic output
Estimates through FY 2019 based on 2016 ROI
State Support for Air ServiceAir Service Enhancement Program (ASEP)
10
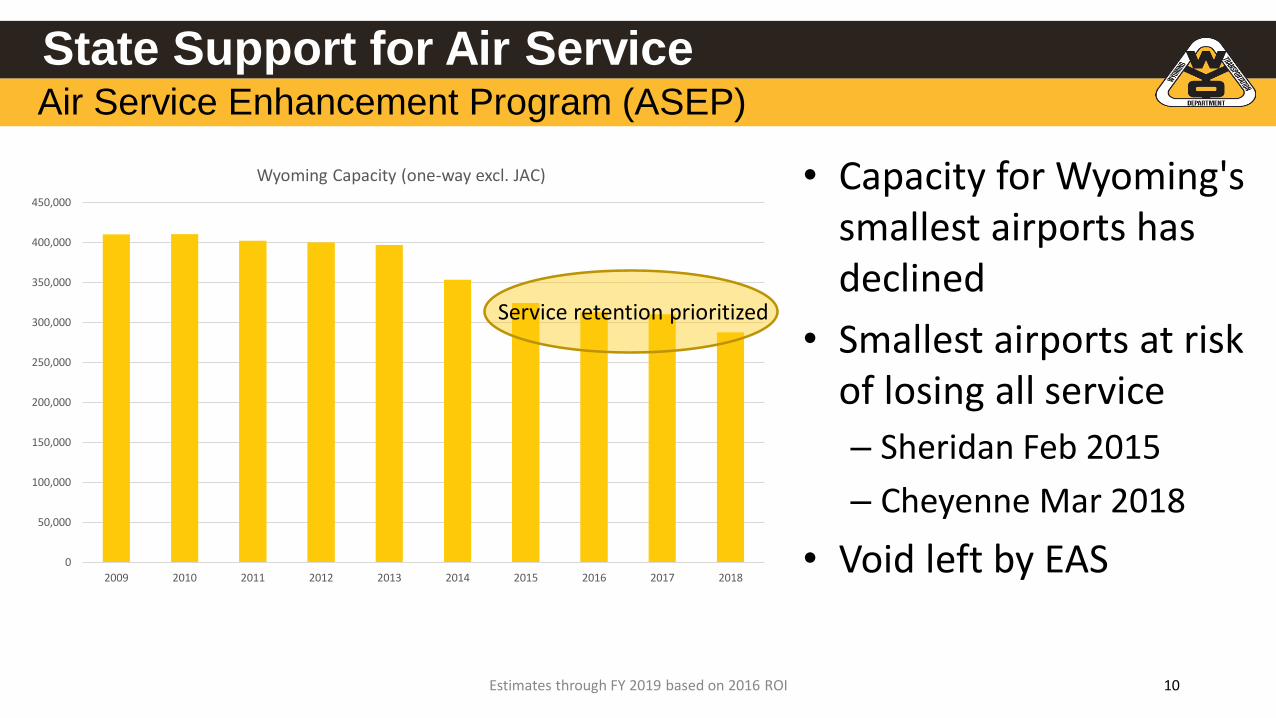
• Capacity for Wyoming's smallest airports has declined
• Smallest airports at risk of losing all service
– Sheridan Feb 2015
– Cheyenne Mar 2018
• Void left by EAS
Estimates through FY 2019 based on 2016 ROI
0
50,000
100,000
150,000
200,000
250,000
300,000
350,000
400,000
450,000
2009 2010 2011 2012 2013 2014 2015 2016 2017 2018
Wyoming Capacity (one-way excl. JAC)
Service retention prioritized

Air Service Enhancement ProgramFilling in for EAS
11
• ASEP divided into two categories
– Critical service
– Growth service
• 4 Communities are responsible for 70% of all ASEP funds
– The majority of ASEP funds shifted from developing new markets to retaining service
• Annual appropriation was not sufficient to sustain service in these communities
Cheyenne
Rock Springs
Riverton
Gillette*
Sheridan
WY Communities requiring guarantees to continue service

State Support for Air ServiceCapacity Purchase Agreement (CPA)
12
• Secure a long term commitment with an airline to provide air service to the state’s most at risk communities– Hedge against increasingly competitive market
– Enable communities to achieve full market potential
– Contractual provisions for schedule and fare influence
– Retain profits when applicable
• Provide reliable, on-time service
• More efficient use of state dollars– Leverage purchasing power of state
– Lower per passenger costs
– Improve stability of service
• Safety net for communities

State Support for Air ServiceCapacity Purchase Agreement (CPA)
13
• $15M in state appropriation
• WY Commercial Air Service Improvement Council created
– Stakeholder and public input
– Recommended to pursue CPA for “critical service”
– Use the ASEP for growth markets
• Request For Proposals
• Negotiations and contract award
+

State Support for Air ServiceCapacity Purchase Agreement (CPA)
14
• Rock Springs and Gillette gain additional flights
• Sheridan and Riverton transition to United Express operated by SkyWest January 11th
• State cost per passenger reduced by 25%
• 40,000 additional passengers annually
• Similar costs
Rock Springs
Riverton
GilletteSheridan
Denver

Selling Air ServiceTo your state and communites
• Economic Value
– A 1% increase in in air passenger traffic leads to a .12% increase in per capita income*
– WY realized a $24 return for every dollar invested in air service
– Leverage businesses
• Quality of life tool
• Investment is essential
• Long-term commitment
*I. Cagri Ozcan, Journal of Air Transport Managment 34 (2014) 24-29

What makes air service workIn small communities
• Correct type of service
– Proximity to other hubs
– Right size aircraft / distance
– Connectivity
• Reliability
• Population isn’t everything – Your market is smaller than you think
• Staying realistic – Don’t lose sight of your strategy
*I. Cagri Ozcan, Journal of Air Transport Managment 34 (2014) 24-29

Future of air service to small communities
17
• Changing economics
– Bigger aircraft
• 19>30>50>65+
– Higher volume
• Electric future?
• “Plane shame” and environmental concerns

WY Air Service Development
18
• Questions
Shawn Burke
307-777-3975

Wyoming Air Service UpdateTotal State Passenger Levels
19
714,
306
74
3,6
16
692,
700
677,
287
734,
595
782,
803
890,
724
963,
492
975,
277
1,03
2,16
4
963,
206
1,01
2,31
9
1,00
4,53
1
996,
733
1,04
8,09
1
1,06
1,42
8
1,03
7,10
1
1,09
4,99
0
1,10
3,92
4
1,17
3,47
1
1 9 9 9 2 0 0 0 2 0 0 1 2 0 0 2 2 0 0 3 2 0 0 4 2 0 0 5 2 0 0 6 2 0 0 7 2 0 0 8 2 0 0 9 2 0 1 0 2 0 1 1 2 0 1 2 2 0 1 3 2 0 1 4 2 0 1 5 2 0 1 6 2 0 1 7 2 0 1 8

2019 NASAO Annual Conference
How Are Air Service Trends
Impacting Small Communities?
September 10, 2019
Presented By
Steven V. Brian, Manager
Aviation Programs

State of Georgia Air Service Initiative
➢ Background on State Air Service Activity
• State Code Requires…the Department of Transportation to promote and encourage air commerce in the state, between states, and foreign countries…
➢ Air Service Headwinds and Concerns
➢ Relevant Small Community Air Service National Data
➢ Georgia’s Air Service Initiative (Jviation and Delta Airport Consultants)
• Objective of Air Service Study
➢ Request for Assistance on State Air Service Survey (NASAO)
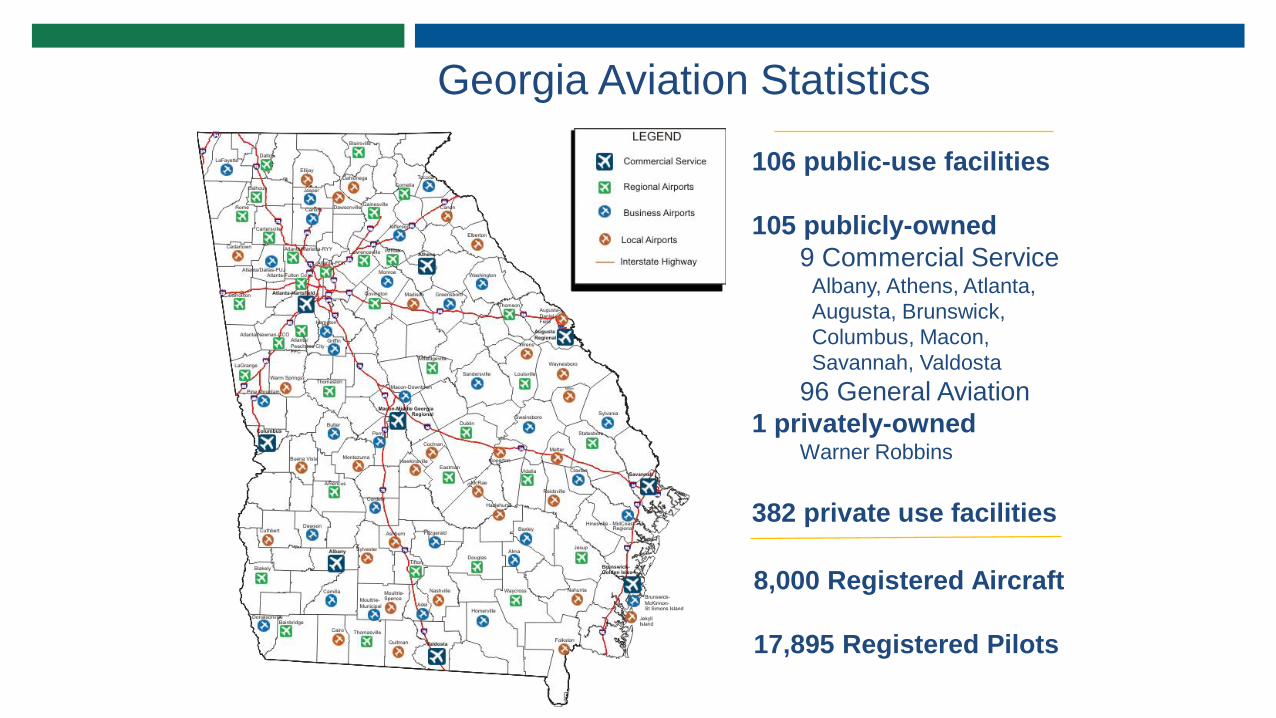
Georgia Aviation Statistics
106 public-use facilities
105 publicly-owned
9 Commercial ServiceAlbany, Athens, Atlanta,
Augusta, Brunswick,
Columbus, Macon,
Savannah, Valdosta
96 General Aviation
1 privately-ownedWarner Robbins
382 private use facilities
8,000 Registered Aircraft
17,895 Registered Pilots

CY17 vs. CY18 Enplanement Summary
National Rank
Airport NameCY 17
EnplanementsCY 18
Enplanements%
Change
1 Hartsfield – Jackson Atlanta Int. 50,251,964 51,866,464 3.21%
82 Savannah/Hilton Head Int. 1,192,340 1,357,478 13.85%
166 Augusta Regional 288,834 301,371 4.34%
276 Columbus 49,773 49,377 -0.8%
286 Valdosta Regional 43,738 44,609 1.99%
292 Brunswick Golden Isles 36,433 40,520 11.22%
295 Southwest Georgia Regional 37,920 34,226 4.27%
369 Middle Georgia Regional 4,857 15,431 217.71%
635 Athens/Ben Epps 1,161 1,412 21.62%
Total 51,907,020 53,710,888 3.48%
Source: https://www.faa.gov/airports/planning_capacity/passenger_allcargo_stats/passenger/media/preliminary-cy18-all-enplanements.xlsx
CY17 vs. CY18 Enplanement Summary

Airport FAA ID# of
Airlines Departure
Per Day # of
Destinations Destinations
Hartsfield-Jackson Atlanta International ATL18 1,365* 239*
Southwest Georgia Regional ABY 1 3 1 ATL
Augusta Regional Airport At Bush Field AGS2 22* 3 ATL, CLT, and DFW
Brunswick-Golden Isles BQK1 3* 1 ATL
Columbus CSG1 4* 1 ATL
Middle Georgia Regional MCN1 2 1 BWI
Savannah/Hilton Head International SAV8 56* 31*
Valdosta Regional VLD 1 3* 1 ATL
Total 33 1,458 48,172
Georgia Commercial ServiceAirports by the Numbers
* Varies per
day/month

Air Service Headwinds
• Pilot Supply
• Service reliability-particularly at the regional level
• Mainline pilot negotiations on scope cause constraints that stipulate the number of smaller jet aircraft that can be flown by regional operators
• Increase in aircraft size-not all small markets can support larger aircraft
• The volatility in the price of oil
• Macroeconomic indicators point to the fact that the economy has clearly peaked
• Trade tensions around the globe-primarily a large and medium hub airport issue
• Airport infrastructure-particularly large and medium Hub airport access
Georgia’s Concern for Air Service
• Georgia has a system of commercial service airports dominated by non-hub airports.
• Georgia is the largest land mass state east of the Mississippi and needs good air service to support business and commerce.
• The relationship between a local economy’s ability to maximize its economic potential can be linked to the level of commercial air service.
• Georgia endeavors to understand the vulnerabilities of its non-hub commercial airports and to prepare them to preserve and improve air service to the best of their ability.
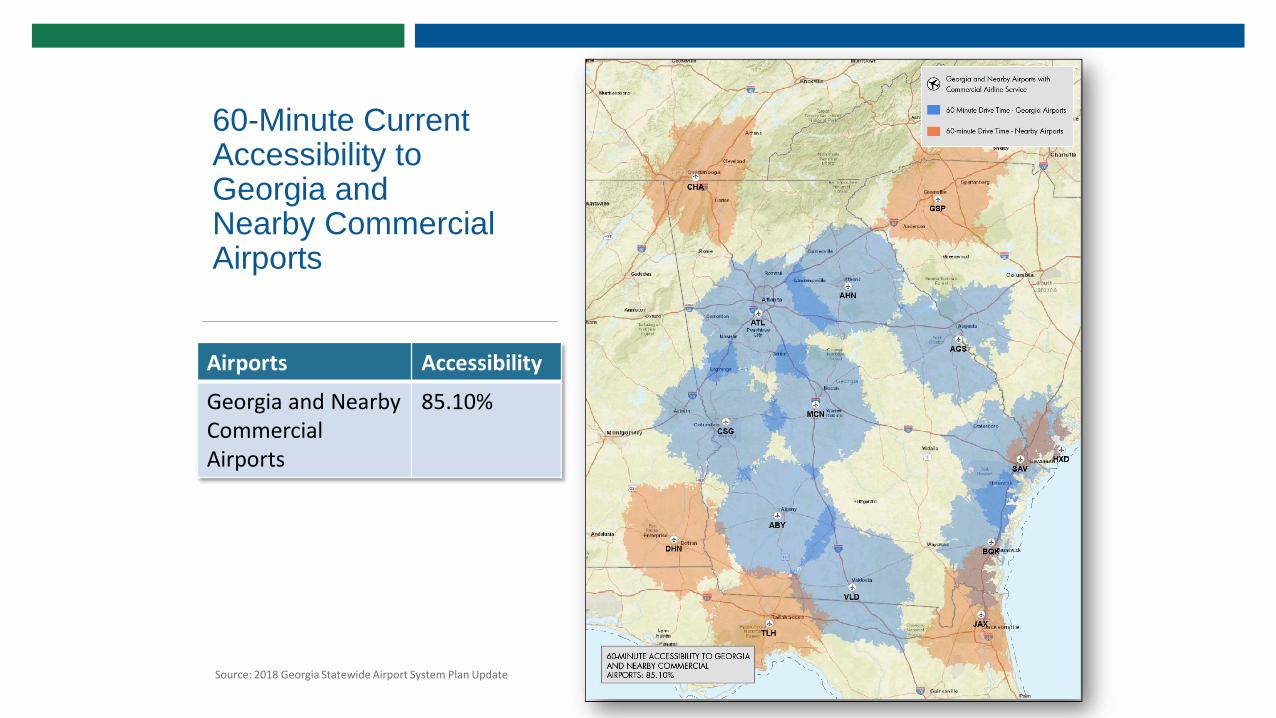
60-Minute Current Accessibility to Georgia and Nearby Commercial Airports
Airports Accessibility
Georgia and Nearby Commercial Airports
85.10%
Source: 2018 Georgia Statewide Airport System Plan Update

60-Minute Accessibility to a Georgia Commercial Airports with More than One Scheduled Carrier
Airports Accessibility
Georgia Commercial Airports with More than One Scheduled Carrier
58.27%
Source: 2018 Georgia Statewide Airport System Plan Update

State Survey of Air Service Activity
State 2014 2018 Chg 2018 v. 2014 % Chg: 2018 v. 2014
New Hampshire 27,952 54,788 26,836 96.0%
Oregon 279,736 449,775 170,039 60.8%
New Mexico 143,049 211,666 68,617 48.0%
Rhode Island 25,381 34,580 9,199 36.2%
Oklahoma 55,456 75,487 20,031 36.1%
Utah 219,690 295,811 76,121 34.6%
Iowa 99,597 132,890 33,293 33.4%
South Dakota 314,479 377,819 63,340 20.1%
Kansas 122,208 146,371 24,163 19.8%
Indiana 822,227 976,675 154,448 18.8%
North Carolina 595,847 702,563 106,716 17.9%
Georgia 427,285 500,620 73,335 17.2%
Pennsylvania 936,850 1,089,834 152,984 16.3%
California 1,263,108 1,455,465 192,357 15.2%
Connecticut 33,808 38,933 5,125 15.2%
Nebraska 228,725 262,268 33,543 14.7%
Maine 297,134 340,279 43,145 14.5%
Colorado 1,036,677 1,186,786 150,109 14.5%
Wisconsin 823,000 938,972 115,972 14.1%
Minnesota 383,795 437,623 53,828 14.0%
Florida 1,492,746 1,699,482 206,736 13.8%
Maryland 78,164 88,543 10,379 13.3%
Mississippi 417,648 472,213 54,565 13.1%
Idaho 362,620 408,393 45,773 12.6%
Wyoming 546,519 613,392 66,873 12.2%
Change in Domestic Enplanements – Nonhub Airports Only
State 2014 2018 Chg 2018 v. 2014 % Chg: 2018 v. 2014
Montana 1,363,463 1,524,699 161,236 11.8%
Missouri 180,185 199,695 19,510 10.8%
Hawaii 170,275 186,678 16,403 9.6%
Illinois 1,242,059 1,355,580 113,521 9.1%
Virginia 906,075 977,489 71,414 7.9%
New Jersey 388,292 416,251 27,959 7.2%
Vermont 5,410 5,672 262 4.8%
Alabama 515,905 534,905 19,000 3.7%
Alaska 2,405,805 2,415,111 9,306 0.4%
Michigan 1,278,944 1,270,303 -8,641 -0.7%
Arkansas 146,367 144,851 -1,516 -1.0%
Puerto Rico 487,436 471,432 -16,004 -3.3%
New York 792,802 765,299 -27,503 -3.5%
West Virginia 396,699 382,514 -14,185 -3.6%
Tennessee 219,070 210,299 -8,771 -4.0%
Kentucky 44,023 41,557 -2,466 -5.6%
Louisiana 1,291,397 1,205,436 -85,961 -6.7%
Arizona 456,432 424,819 -31,613 -6.9%
Washington 1,153,829 1,067,330 -86,499 -7.5%
North Dakota 1,257,997 1,111,972 -146,025 -11.6%
Texas 2,419,321 2,110,007 -309,314 -12.8%
Massachusetts 388,945 297,239 -91,706 -23.6%
Ohio 1,011,278 770,222 -241,056 -23.8%
South Carolina 114,477 80,644 -33,833 -29.6%
Nevada 141,191 97,437 -43,754 -31.0%
Delaware 105,303 768 -104,535 -99.3%
Source: Delta Airport Consultants

2018 Non-hub Airport Departures Grew For The First Time In 15 Years
975 961920 921
844792 779 751 726 712
661 632 604 603 618
2004 2005 2006 2007 2008 2009 2010 2011 2012 2013 2014 2015 2016 2017 2018
Status Quo
2004 - 2006
Rationalization
2007 - 2009
Capacity Discipline
2010 - 2014
Capacity
Regeneration
2015 - 2018
Number of Non -hub Airport Departures
(000)
N o t e : 4 8 c o n t i g u o u s s t a t e s o n l y .
Peak
Tro
ug
h
Source: Delta Airport Consultants

Non-hub Airport Seats Did Not Begin Growing Year-over-Year Until 2017
40 4239 40 39
36 36 36 34 35 34 33 33 3436
2004 2005 2006 2007 2008 2009 2010 2011 2012 2013 2014 2015 2016 2017 2018
Status Quo
2004 - 2006
Rationalization
2007 - 2009
Capacity Discipline
2010 - 2014
Capacity
Regeneration
2015 - 2018
Number of Outbound Seats (Mi l l ions)
N o t e : 4 8 c o n t i g u o u s s t a t e s o n l y .
Peak
Tro
ug
h
Source: Delta Airport Consultants

Along the Way, 35 Small Communities No Longer have Commercial Service
329
325
332334
321
327
316 317 318321
315318
309
302299
2004 2005 2006 2007 2008 2009 2010 2011 2012 2013 2014 2015 2016 2017 2018
Status Quo
2004 - 2006
Rationalization
2007 - 2009
Capacity Discipline
2010 - 2014
Capacity
Regeneration
2015 - 2018
N o t e : 4 8 c o n t i g u o u s s t a t e s o n l y .
Peak
Tro
ug
h
Source: Delta Airport Consultants

Two of the Three Majors are Demonstrating Growth Potential at Non-hub Airports
6
7
8
9
10
11
12
13
14
15
16
17
18
2004 2005 2006 2007 2008 2009 2010 2011 2012 2013 2014 2015 2016 2017 2018
MIL
LIO
NS
Domestic Capacity By Network Carriers
AA/US DL/NW UA/CO
Source: Delta Airport Consultants
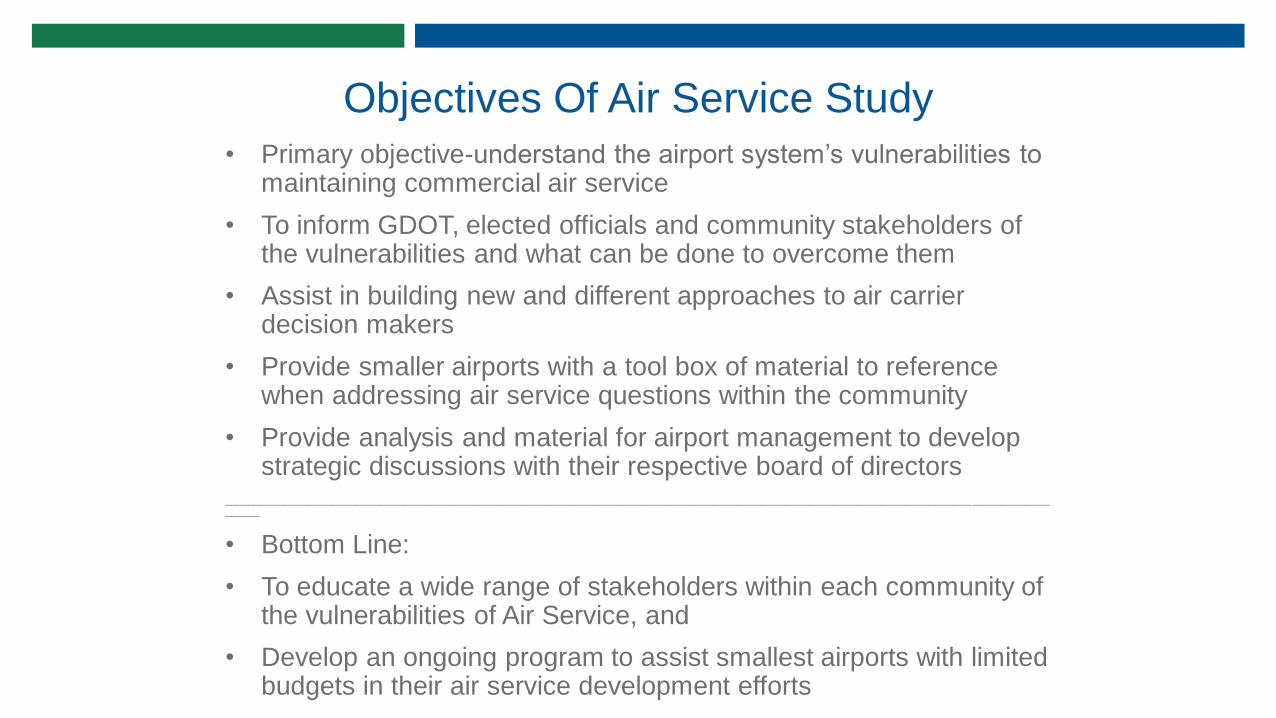
Objectives Of Air Service Study
• Primary objective-understand the airport system’s vulnerabilities to maintaining commercial air service
• To inform GDOT, elected officials and community stakeholders of the vulnerabilities and what can be done to overcome them
• Assist in building new and different approaches to air carrier decision makers
• Provide smaller airports with a tool box of material to reference when addressing air service questions within the community
• Provide analysis and material for airport management to develop strategic discussions with their respective board of directors
________________________________________________________________________________________________________________________________________________
• Bottom Line:
• To educate a wide range of stakeholders within each community of the vulnerabilities of Air Service, and
• Develop an ongoing program to assist smallest airports with limited budgets in their air service development efforts

Request For Assistance On Survey -Results Published Through NASAO
• A core component of our Study will be to conduct a survey of what each state is doing to support air service development efforts
o For example, Indiana is being aggressive in providing funding for incentives to lure air service at airports large and small – WE WANT TO KNOW WHAT YOUR STATE IS DOING IF ANYTHING
• NASAO has agreed to disseminate the survey
o We anticipate survey length on the shorter side so not to discourage participation
• THE BENEFIT TO YOU – WE WILL SHARE THE RESULTS SO THAT YOU CAN INFORM YOUR CONSTITUENT AIRPORTS

Questions
?Contact
Steve Brian
Aviation Programs Manager
Ph. (404) 347-0484
Email: [email protected]

Sun Country AirlinesNASAO Panel –
September 10, 2019

Background on Sun Country Airlines
timeline
fleet
destinations
product
strategy evolution
competitive edge
Network planning & scheduling process
network design
frequency assignment
schedule build, edit & distribution
Questions
Table of contents

Timeline
1982
Founded by small group of former Braniff International Airways pilots and flight attendants
1983
Sun Country (SY) begins operations
1986
1st wide-body aircraft in service (DC10-40)
1989
1999
2001
2004
2006
2008
2011
2018
2018
Becomes member of Civil Reserve Air Fleet; flies charters to support Desert Storm operation
Transforms from charter carrier to scheduled airline; First loyalty program
SY shuts down and declares bankruptcy
SY profitable again through combo of charter and scheduled
Acquired by Petters Group Worldwide and Whitebox Advisors
2nd
bankruptcy to separate from Petters Group
Davis family purchases SY out of bankruptcy. Marty Davis becomes Chairman
Acquired by Apollo Global Management
Record breaking year for passenger, traffic revenue, and earnings.
2019
Ongoing investment in fleet and technology
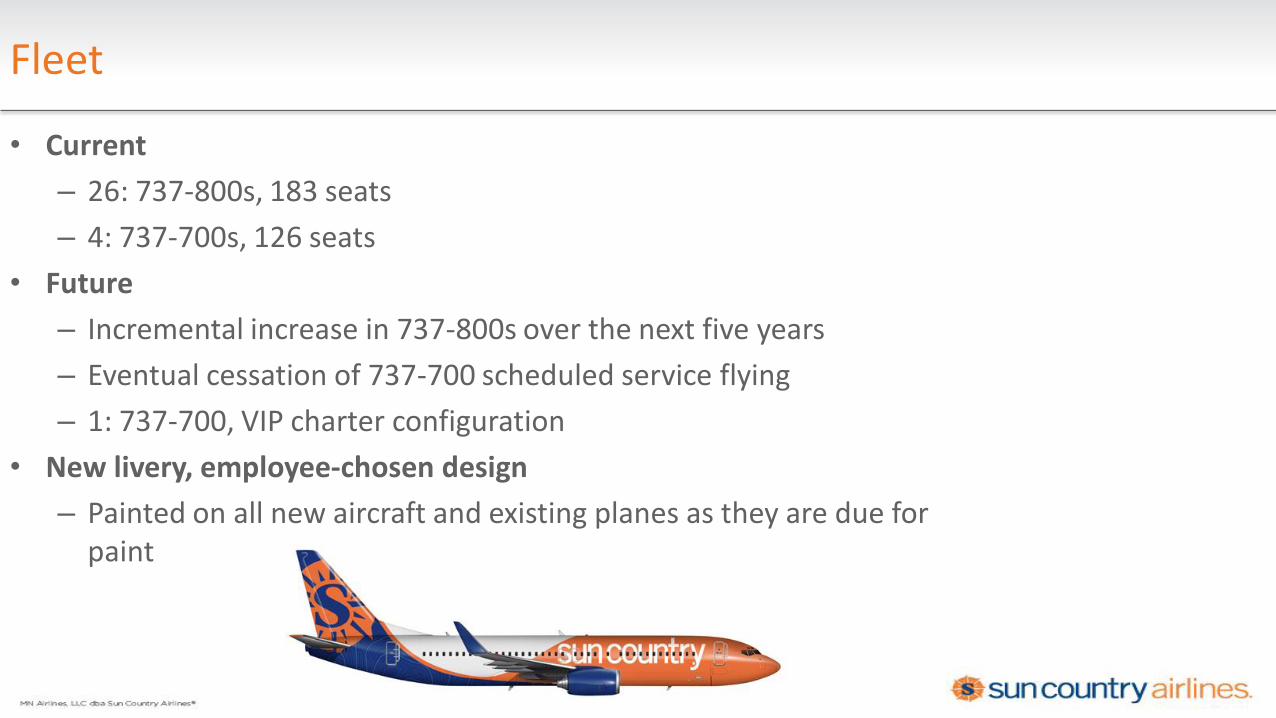
• Current
– 26: 737-800s, 183 seats
– 4: 737-700s, 126 seats
• Future
– Incremental increase in 737-800s over the next five years
– Eventual cessation of 737-700 scheduled service flying
– 1: 737-700, VIP charter configuration
• New livery, employee-chosen design
– Painted on all new aircraft and existing planes as they are due for paint
Fleet

Destinations
Rapid Growth: 53 new markets since Fall of 2018NonMSP Growth: LAS, MSN, PDXNetwork Summary: 86 markets, 53 stations

Product
• Seats (complimentary beverage for all seats)
– Best: 34-inch pitch, moveable headrest, additional recline, complimentary alcoholic beverage
– Better: 32-inch pitch
– Standard: 29 to 30-inch pitch
• In-flight entertainment and power
– Free streaming to personal devices including movies, TV shows, music and games
– Power at seats: full AC outlet for Best seats; USB outlet for Better and Standard

Strategy evolution
LCC
Legacy
Transition to LCC/ULCC Model
SY
ULCC
4
5
6
7
8
9
10
11
12
13
Q12014
Q22014
Q32014
Q42014
Q12015
Q22015
Q32015
Q42015
Q12016
Q22016
Q32016
Q42016
Q12017
Q22017
Q32017
Q42017
Q12018
Q22018
Q32018
Q42018
Q12019
CA
SM E
x-Fu
el (
¢)
Lowering Unit Costs
0%
5%
10%
15%
20%
Sun Mon Tue Wed Thu Fri Sat
Change in DOW Concentration
2017 2018 2019
• 1982 – 2017
– Full-service carrier
– Scheduled and charter flying
– MSP based schedule with limited NonMSP flying
– Captured business, vacation and VFR traffic
• 2018 – Present
– LCC/ULCC hybrid business model
– Greater emphasis on DOW sensitive and seasonal flying
– Growth in nonMSP flying
– Increased ownership of aircraft
– Continued charter & schedule service flying

Competitive edge
-4
-3
-2
-1
0
1
2
3
4
5
6
0
2
4
6
8
10
12
14
Q1 2017 Q2 2017 Q3 2017 Q4 2017 Q1 2018 Q2 2018 Q3 2018 Q4 2018 Q1 2019
Ch
ange
in L
F% Y
oY
CA
SM E
X-F
uel
(¢)
Costs are decreasing and LF% YoY is increasing
SY LF YoY
Comparison TableSY WN F9 G4 NK
Seat Pitch 29"-34" 32"-33" 28"-31" 30" 28"-36"
Seat Width 17" 17"-18" 18" 17" 18"-20"
Full Tray Table Yes Yes No No No
Complimentary Drink Yes Yes No No No
Streaming Service Yes Yes No No No
Inflight Power Yes No No No No
• Competitive unit costs
– Increased gauge through removal of first class and addition of economy seating
• Increased LF% YoY while adding seats
• Competitive product offering
– Only LCC/ULCC to offer inflight power

Network planning & scheduling process

Network design
Three distinct phases
Frequency assignment
Schedule build, edit & distribution

Inputs
Network design (1+ years out)
1. Discovery phase
Outputs
• Fleet growth
• Profitability drivers
• Travel & economic trends
• Strategic growth areas
• Opportunity set
2. Market Forecast & Selection Phase
• Costs
• Historical demand indices
• Frequency
• Revenue
• QSI estimation
• Forecasted opportunity set
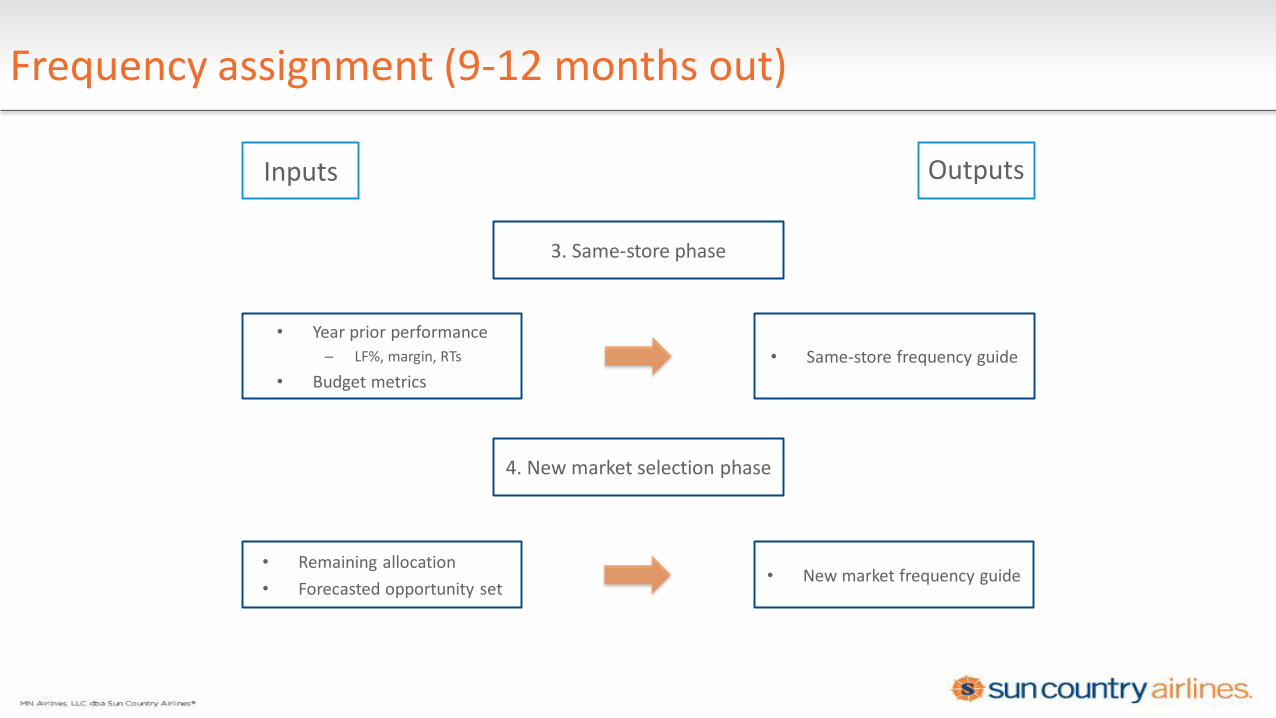
Frequency assignment (9-12 months out)
3. Same-store phase
• Year prior performance
– LF%, margin, RTs
• Budget metrics
• Same-store frequency guide
4. New market selection phase
• Remaining allocation
• Forecasted opportunity set• New market frequency guide
Inputs Outputs

Schedule build & distribution (1-9 months out)
5. Preliminary schedule
• Same-store and new frequency guide
• Operational parameters
• Flight schedule
6. Schedule distribution
• Flight schedule
• Price points
• Fare classes
• On sale schedule
Inputs Outputs
Questions