Agile Tour 2016 Pune - Innovation Agility with innovative Agile by Kshitij Nema
Upload
duongthuanCategory
view
222download
0
1 3 HOW AGILE IS AGILE ENOUGH? Toward a Theory of Agility in
Software Development
Kalle Lyytinen' Case Western Reserve Utziversitj
Cievelanrl. Ohio I1.S.A
Gregory M. Rose Washirzgton State Unlversitj3
Vancozrvei: Washington U S A
Abstract This paper outlines a theory ofsoftivare development agdrty that draws zrpon a inotiel oflTinnovations. We e.\-a~nine how both euplomrlon andexploitatiorz impact sofli.vare developmerlt agility. We propose a sequential nlodel of /earning in n ' h ~ h agility is drivefl by explorafiori versus exploirarion needs and developtnent agility is influenced by learning,focirs. Organizations need to balance rncrltiple corlflicting goals including speed, qlralitj, cost, rlslc atid iriiro~~ative content. The value of the model is ~llustrared 0). probing hoiv sojtware organizations controlled their agilitj~ in Intetxet computing between iile yews 1997 and 2003.
1 INTRODUCTION
In software, agility can be defined as developers' ability to sense and respond nimbly to techn~cal and business opportunities in order to stay innovative in a turbulent environment. A n agile software development organization has the capability to respond to unexpected environmental changes and increase its process speed. In the past, the Informat~on Systems literature sought to control the outcome quality and reliability by submitting to virtues of system engineering: the system must be flawless, user friendly,
'Author order is alphabetical; the authors contributed equally to this papel

or scalable. T h ~ s log~c pervaded debates around the "software crisis" and motivated the development of approaches such as structured nlethodologies and process improvement frameworks.
This worldv~ew faced a reality check when new economy rebels changed the idea of system development. Software had to be developed at, and for markets in, a fast pace (Baskerv~lle et al. 2001 ; Carstensen and Vogelsang 1999; Cusumano and Yoffie 1999; Lyytinen and Rose 2003: Pressman 1998). The key to competitiveness was agility and this echoed well with research in strategy on dynamic capability (D'Aveni 1994; Teece et al. 1997) and rapid product development (Kessler and Chakrabarti 1996). However; it is not clear what agllity in software means. Is it the speed at which some type of r~lnning system is ava~lable? Is it the change in ratio between delivered funct~onality and the elapsed t~tne? Or is ~t the c l~ent ' s increased velocity? All these speeds are distinct aspects of agility and d~ctate different ramifications on how to improve it. Another issue relates to antecedents of agility, and to what extent the organizations can man~pulate them. There is a huge difference in changing the speed in doing X when compared to changing the speed in which the organization moves from doing X to doing Z. Finally, we must better understand how agility relates to other process outcomes such as risk or how agility varies duringtechnology diffusion (Baskerville et al. 2001, Lambe and Speknian 1997).
This paper develops a model that accounts for differences in the relative change and types ofagility that organlzations can achieve at different stages oftechnology diffusion. We show that the need for agility must be balanced with other desirable process features such as innovatwe content, risk, quality, and cost and how process outcomes are valued in competitive environments. We validate the model by a multisite case study of sofhvare development in seven organizations that adopted Internet computing over a 5-year period. The study illustrates how organizations changed and controlled the11 agility over the study period by changing their perceptions of agility and the need for ~ t . These changes were o~~tcolnes of continued attempts to balance agility with other process f e a t ~ ~ r e s S L I C ~ as innovative content, cost, quality, and risk. The remainder ofthe paper is organized as follows. Section 2 formulates the development model and reviews the related I~teratnre. Sect~on 3 describes the field study, while section 4 reports the main findings of the study.
2 RELATED LITERATURE AND SOFTWARE DEVELOPMENT AGILITY MODEL
The goal of the software development agility model is to detect dependencies between specific environmental. organizational, and market factors that affect how agility and other process factors relate to one another. The model draws on Swanson's (1994; see also Lyytinen and Rose 2003) model of IT innovation and March's (1991) exploration-exploitation dichotomy. According to the model, software organ~zations are engaged in both explorat~on and exploitation while innovating with information technology. During periods of fast transition (e.g., the shift to Internet computing), the exploration speed (absorptive capability of technical potential) and development speed
IS De\e lopment IS Deplo! ing Organiznt io~~s
Adopt T!pe 0 Inno\at~oni Organizations
hIanul 'ac tu~-ers Produce T)pe 0 Produce and Adopt T>pe 1
SupplyiPush P r o d i m Tlpe I1 SupplyiPush innoi atloll
t--------- Dcmnnd Pull
- Demand Pull
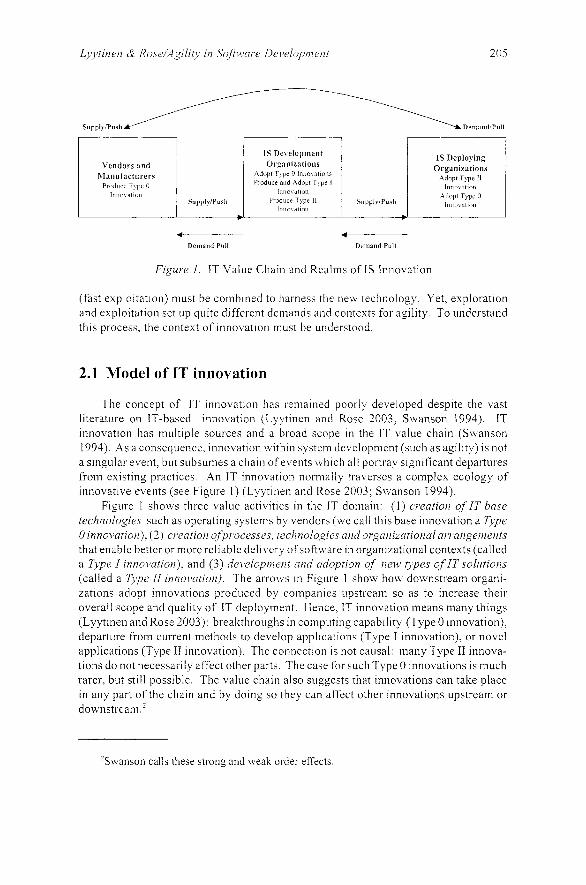
Figure I . IT Value Cham and Realms of IS Innovat~on
(fast exploitation) must be combmed to harness the new technology. Yet, exploration and exploitation set up q ~ ~ i t e different demands and contexts for agility. To understand this process, the context of innovation must be understood.
2.1 Model of IT innovation
The concept of IT innovation has remained poorly developed despite the vast literature on IT-based innovation (Lyytmen and Rose 2003; Swanson 1994). IT innovation has m~dtiple sources and a broad scope in the IT value chain (Swanson 1994). As a consequence, innovation withm system development (such as agility) is not a singular event, but subsumes a chain of events which all portray significant departures from existing practices. An IT innovation normally traverses a complex ecology of innovative rvents (see Figure I) (Lyytinen and Rose 2003; Swanson 1994).
Figlire 1 shows three value activities in the IT domain: (1) creation of IT base technologies s~ich as operating systems by vendors (we call this base innovation a Type 0 innovation), ( 2 ) creation ofproce.sses, technologies and or~ganizational arrangen~ents that enable better or more reliable delivery of soft\vare in organizational contexts (called a Type I innovation). and ( 3 ) developnzent and ~~clopfion of new types of IT solutions (called a Tjpe II innovation). The arrows in Figure 1 show how downstream organi- zations adopt innovations produced by companies upstream so as to increase their overall scope and quality of IT deployment. Hence, IT innovation means many things (Lyytinen and Rose 2003): breakthroughs in comp~~t ing capability (Type 0 innovation), depart~ire from c~lrrent methods to develop applications (Type I innovation), or novel applications (Type I1 innovation). The connect~on IS not ca~lsal: many Type I1 innova- tions do not necessarily affect other parts. The case for such Type 0 innovations is much rarer, but still possible. The value chain also s ~ ~ g g e s t s that innovations can take place in any part of the chain and by doing so they can affect other innovations upstream or downstream.?
2Swanson calls these strong and weak order effects
Due to the technology dependent nature ot s o h are rnno\atlon, organlzatlons adoptmg sign~ficant Type 0 and Type I Inno\ attons togctize~ can pi oduce rad~cally nen appl~cations (Type 11) and thereby engage in d151 ~ipril e IT ulizovatlom (Lyyt~ncn and Rose 2003) These d~s rup t~ons are outcomes of tad~cal breaks tn the IT base, \\ heic components In the comput~ng base ale reassembled (Hende~son and Clark 1990) For example, Internet comput~ng was a d t s ~ u p t n e innobatton cleated by (Type 0) arch~tec- t u ~ a l change (TCPIIP-based tools and n-tier comput~ng) h ~ c h was made ~ad ica l w ~ t h the addit~on of browsers, data formatt~ng standards m d softwa~ e platforms (J2EE, Net, etc ) T h ~ s enabled the development of radrcallq nen selvlces (Type 11) w h ~ c h were demanded by faster speed (Type I) (Lyyt~nen and Rosc 2003)
We can now InLestlgate the extent to a h ~ c h changes in Type 0 Innovation can lead to Innovations In Type I such as a g ~ l e de\ elopment and the consequent jast adoption of Type I1 lnnovatlons (business agrl~ty) We coiijccture that the a g ~ l e innovation IS
produced by two capab~l~tres (1) the capabrl~ty of softwale organ~zat~oiis to adopt Type 0 ~nnova t~ons and (2) then- c a p a b ~ l ~ t y to su~cessfully trcmsforin and hone these capabiht~es mto Type I Innovattons T h ~ s 1s dependent on the n i o b ~ l ~ z a t ~ o n of t u o related capacltles The first capab~l~ ty - tech~io lo~ ohsorptlon-reflects an organlza- t ~ o n ' s ab111ty to sense, acqutre, and absorb neu base technologres through e ~ p l o r atlor1 The second capabil~ty reflects a software or gan~zatton's ( I ) abrl~t] to use new IT deploy- ments for process ~mprovement and (2) to effect~x elv learn from such occasions In order to formalize process knowledge T h ~ s latter plocess L\ e call e~ploztatioiz Successf~tl software innovators need to effect~vely arid contrn~iouslv ident~fy and match strategic opportnnlt~es f o ~ their process improvement M rth enielglng techn~cal c a p a b ~ l ~ t ~ e s
2.2 Exploration and Exploitation
In the management literature, e.uplorntioil and e.\-ploitotioiz have been established as two fundamental responses to environmental challenge (March 1991). These arche- types help distinguish two distinct modes in which organizations compete and adapt, and how they organize, strategize, and execute. Through exploitatton, organizations refine by trial-and-error learning their competencies through repeated actions over of time. Exploitat~on is about harnessing "old certainties" through refinement, implementation, efficiency, production, and selection. Exploration, in contrast. is about discovering new opportunities where organizations create new competences through search, discovery, experimentation, risk taking, and innovat~on (Henderson and Clark 1990; March 1991; Tushman and Anderson 1986).
Exploration requires substantially different stritctures, processes, strategies, capa- bilities, and culture (Tushman and Anderson 1986). Exploration leans toward organic structures, loose couplings. improvisation, chaos, and emergence. Exploitation deals with mechanistic structures, tight coupling, routln~zation: bureaucracy, and stability. Ret~irns with exploration are uncertain, highly variable, and distant in time, while exploitation yields returns that are short term, have hrgher certainty and lower variance (March 1991). Due to their fundamental differences, exploration and exploitation pose a continuous tension for management (Levinthal and March 1993). These tensions create dysf~rnctional learning outcomes when either exploration or exploitation is
preferred (March 1991). Trial-and-error learning can blas management to foc~ls too m~lch on current capabilities-at the expense ofneu opportutiities--th~~s ca~lsing capac- ~t les to become core rlgzdztles, and creat~ng learn~ng myoplas and competency tlaps (Leblnthal and March 1993, March 1991) In contrast, when organ~zatlons engage In excesslbe exp lo~a t~on , cont~nued "fa~lure leads to search and change. \\ hich lead f a ~ l ~ l r e bhhich lead to even more search and so on" (Levlnthal and March 1993, p 98) Orgmlzat~ons' learning becomes chaot~c managers love to explore but fall to allocate resources to exploit their new competencies.
T h ~ s invites us to ~~nders tand how organizations learn to tack between exploratlon and evplo~tat~on and consequently change the11 resoulce bases through acqnlsltlon, Integration, recomblnat~on, and the remolal of capab~lttles (E~senhardt and Martm 2000) In domg so, they must relentlessly Integrate, reconfigule, galn, and release resources as a response to changes (D'Aveni 1994, Teece et a1 1997) Such dynam~c capablllt~ embod~es a learmng related metd-cdpablllty by mh~ch software organizations
learn to blend exploratlon and explo~tat~on across d~fferent stages of IT lnnovatlon
2.3 Exploration and Exploitation in Software Development Organizations
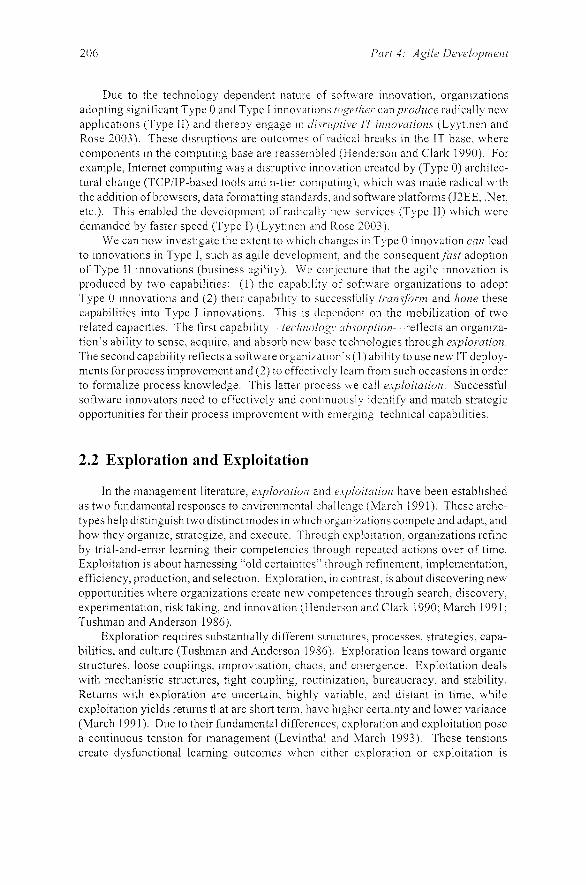
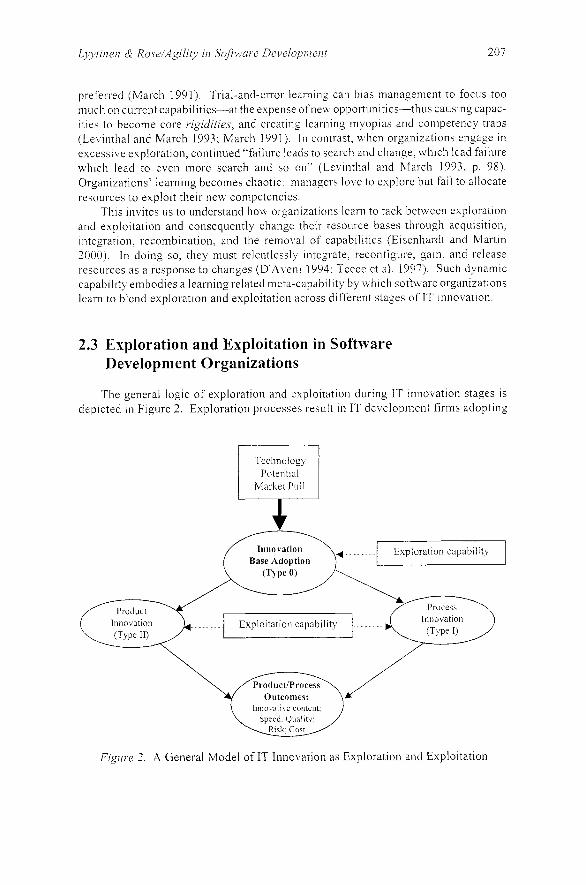
The general logic of exploration and exploitation during IT innovation stages is dep~cted in Fig~lre 2. Exploration processes result in IT development firms adopting
Technology Potential
Market Pull
Figure -3. A General Model of IT Innovation as Exploration and Exploitation
Tqpe 0 base inno\atlons that lead to p r o d ~ ~ c t ~ o n of neu Type I1 and Type I Inno\ atlons (Larnbe and Spekman 1997, Lyytmen and Rose 2003) An example of Type 11 Inno\ a- tions u o ~ ~ l d be the organ17atlons' a b ~ l ~ t y to create a c a p a b ~ l ~ t y to produce totally new tlpes ot applicat~ons while the lnnovatlon of Tvpe I uould be adopt~ng nen plocess tcchnolog~es that help del~ver the same software fitnct~onallty In half of the t ~ m e Explordt~on a g ~ l ~ t y as absolpt~ve capacltp (Cohen and Levlnthal 1991) means tb\o th~ngs ( I ) the software organlzatlon must adopt neb+ Type 0 and Type I technolog~es faster than its peers, and (2) ~t must use these technologies to develop Type I1 inno\ a t~ons (explorat~ve process ~ n n o ~ a t l o n ) fastel If the organlzatlon is s~~ccess f~ t l , t h ~ s L L I I I change the orgamzations' lnnovatlons In ~ t s products (Type I1 ~nno \a t~ons ) and processes (Type 1 ~nnovat~ons) The more the former deblate from the cllrrcnt product mlu the more lnizovatlve and agzle I S p~oduct Innovation The more the latter de\ lates from the s t d t ~ ~ s ~ L I O , the more znnovntlveprocess IS instantiated-and the more agile 1s process chdnge
Softwale organlzatlons need also to explolt \+hen technologies mature by stledm- Iin~ng standard~zing, automating, and scalmg up their processes foi euploltat~on capdb~l~ty Thrs can be defined as the organ~zat~ons' learnrng c a p a b ~ l ~ t y to improl e and change t h e ~ r dellvery processes over time in older to maxlmlze process o~ttcornes such as speed quallty, r~sk , or cost Clearly, t h ~ s learnlng mode is d ~ s t ~ n c t from exploratron dnd ag~lity In explo~tat~on can be viewed as lubr~ca t~ng a well-defined process
Lambe and Spekman (1997) descrlbe how explorat~on and explo~tat~on are tem- porally organized across d~ffereiit phases of IT innovation (adapted for F~gure 3) We late1 me thts model to explore how each phase affects process feat~ires such as agrl~ty Type 0 Innoh ations can be regaided as offermg general t ec lwzo lo~push to Impro\ e both softu at e products and processes Growth in the tnno\at~on base can lead to radical IT Inno~dt~ons (s~gn~ficant depart~ires of exlstlng behak~ors and solut~ons) cobering both de~elopment outcomes (new k~tzds of systems-I e product ~nnovations) and debelop- ment process (new ways of developmg systems) that enable new ~nnova t~ve solutions and piocesses Such explorations take place In short and Intense per~ods durmg which hyper-compet~t~on and fast lealnlng are valued When maln features ofthe nea product fam~ly have been fixed and become more or less standard~zed, organlzatlons mohe to product explo~tatlon by incrementally adding new features to the developed product platform When s~rch a stage IS ach~eved (01 soinetlnies when product explorations are b e ~ n g conducted), organlzat~ons move on to d~scover s~gn~f ican t and rad~cal uays to Impro\ e their product dellvery processes We call thls stage process explot irtlorz or Type I radical mnovation Such lnnovat~ons can include Investments In better cross- product platforms or development of innovat~ve process technolog~es (CASE tools softa are I~brarles, collaboratne tools) When the radlcal ~nnovatlon potential In process Improbements I S mostly exhausted, organ~zations w ~ l l move to what a e call pioceis e~plortntiot~ or ~ncremental Type I lnnovatlon
3This is called hyperlearning in Lyytinen et al. (2004).

Phaze I Product exploration ( I vpe I1 exploiintioii (Tkpe I1 radical mno\ at~on) ~ncremental
Type 11 IT lniio\atlon
Figure 3. Organizing Logics for Exploration and Explo~tation Across Different Types of IT Innovations
2.4 A Model of Process Features During Exploration and Exploitation
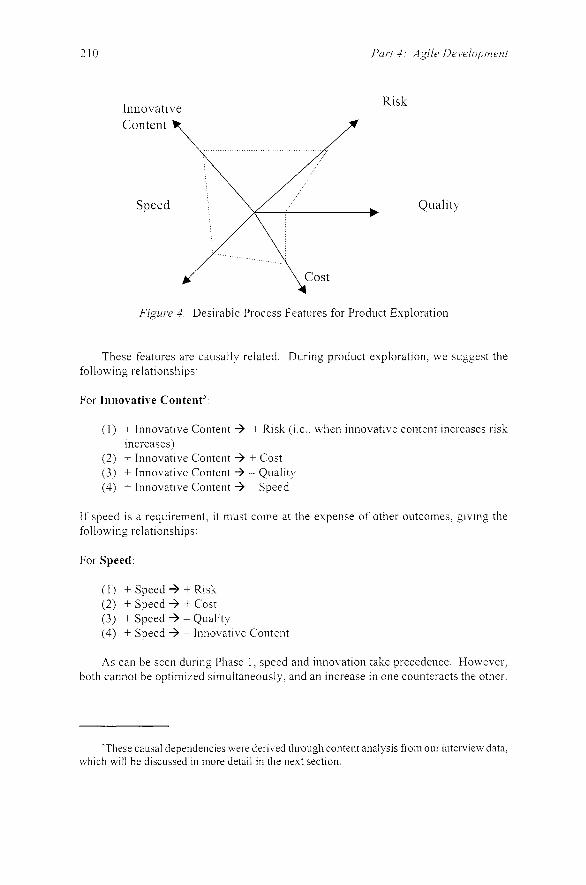
Relat~onsh~ps between process features (innovatwe content, speed, cost, qual~ty and r ~ s k ) arc complex It is impossible to optlmlze them all simultaneously Relat~on- shlps betu een them vary depend~ng on whether new Type I1 mnobations are d ~ s c o \ ered or ~ncremental Type I lnnovatlons are proposed We model plocess goals as d~rected graphs where each process goal 1s depicted as a separate vector and ~ t s relative slze shows to what extent this process f e a t ~ ~ r e IS bemg maxmi~zed ' An ~ l l i~s t ra t~on of s~ich a graph for Phase 1 IS shown in F i g u ~ e 4 In Phase 1, softmare organ~zatlons niaumiize mnokatnc content they tolerate relat~vely high risks, expect relat~vely fast product developn~ent and med~um cost, but do not expect h ~ g h qual~ty To speed up explorat~on, their capab~lity to deli\ er any w o ~ kable solution may be slowed down L~kewise ~ f t h e y want to be more nimble, they may have to paradoxically sacrifice t h e ~ r ~nnovatlkeness
'Van Kleijnen (1980) calls these Kiwiat graphs
Part 4. Agile De~~elopr~erzt
Innovative Risk
Quality
Figure 4. Desirable Process F e a t ~ ~ r e s for Product Exploration
These feat~lres are cailsally related D u r ~ n g product exploration, we suggest the fo l low~ng relat~onships
For Innovative Contenti:
(1 ) + Innovative Content 3 + R ~ s k (i.e., when innovative content increases risk ~ncreases)
(2) + Innovative Content 3 + Cost (3) + Innovative Content 3 - Quality (4) + Innovat~ve Content 3 - Speed
If speed IS a requirement, it must come at the expense of other outcomes, g ~ v i n g the following relationships:
For Speed:
(1) + Speed + + R ~ s k (2) + Speed 3 + Cost (3) + Speed 3 - Qual~ty (4) + Speed 3 - Innovat~ve Content
As can be seen during Phase 1, speed and innovation take precedence. However, both cannot be optimized sm~iltaneously, and an increase in one co~~nteracts the other.
'These causal dependencies were det-ived through content analysis from our interview data. which will be discussed In more detail in the next section.
Innovative Content Risk
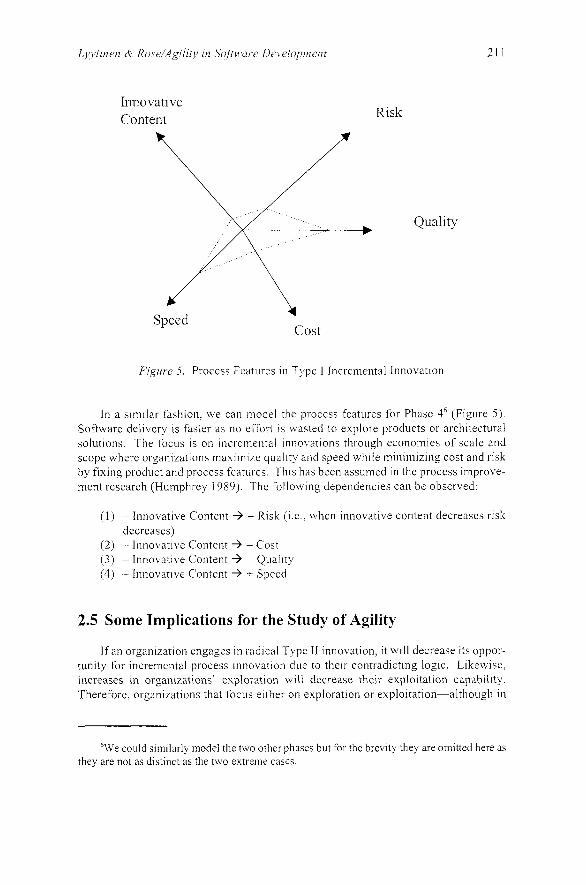
Figure 5 Process Features In Type I Incremental Innovat~on
In a similar fashion, we can model the process features for Phase 46 (Figure 5 ) . Software delivery is faster as no effort IS wasted to explore products or architectural solutions. The focus is on incremental innovat~ons through economies of scale and scope where organizations maximize qual~ty and speed whlle minimizing cost and risk by fixing product and process features. T h ~ s has been assumed in the process improve- ment research (Humphrey 1989). The following dependencies can be observed:
(1) - Innovative Content 3 - Risk (i.e., when innovative content decreases risk decreases)
(2) - Innovative Content 3 - Cost (3) - Innovative Content 3 + Qualtty (4) - Innovat~ve Content 3 Speed
2.5 Some Implications for the Study of Agility
If an organization engages in radlcal Type I1 innovation, it will decrease its oppor- tunity for incremental process innovation due to their contradicting logic. Likewise, increases in organizations' explorat~on 1~111 decrease their exploitation capability. Therefore, organizations that focus elther on exploration or exploitation-although in
'We could s~milarly model the two other phases but for the brevity they are omitted here as they are not as distinct as the two extreme cases.
2 12 Part 4 Agle Devclopmerzt
both modes they view agility as a desirable feature-have different mindsets abo~lt agility. Durlng exploration, the desire to explorc fast donimates, wl i~le during exploita- tion. the main focus IS to remove frlction from well-defined processes. Homever. the new technology (Type 0 innovat~on) per se can dramatically increase the speed by offering higher granularity (e.g.. ERP parameterization), powerfill abstraction mecha- nisms (e.g., Web services), standardized f~mctional~tles (e.g., browsers), or architectural ~ntegrat~on mechanisms (e.g., architect~lral patterns) Improvements here can be dra- matic and as important as radical ~nnovations in products. When an organization shifts its focus away from radical exploration, i t must increase its exploitation by fixing the product and, later, the process. It must change process measures as ~ t s focus is now on efficiency, economies of scale, and quality. This shift leads to increased trial-and-error learning (March 1991).
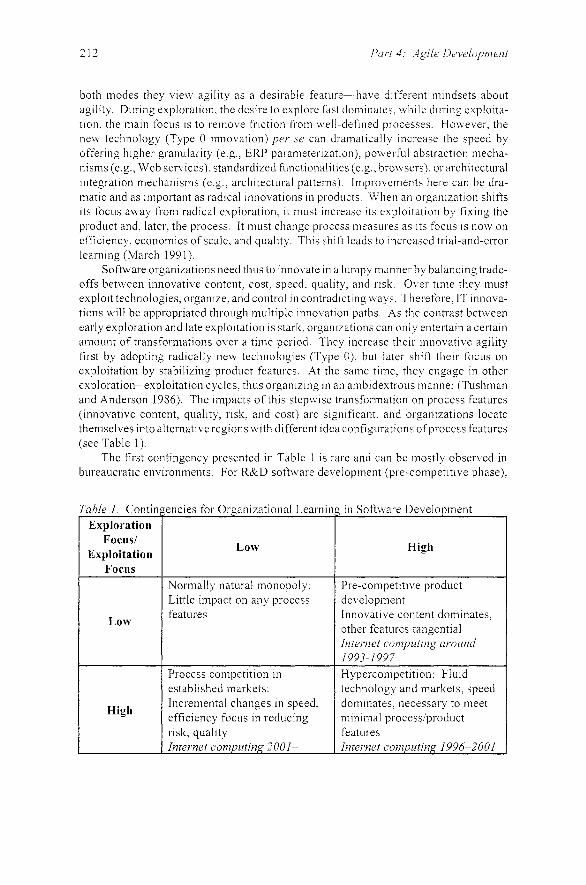
Software organizations need th~ l s to innovate in a lumpy manner by balancing trade- offs between innovative content, cost, speed, quality, and risk. Over time they must exploit technologies, organize, and control in contrad~cting ways. Therefore, IT innova- tions will be appropriated thro~lgh multiple ~nnovation paths. As the contrast between early exploration and late exploitation is stark. organizations can on1 y entertain a certain amount of transformations over a time period. They increase thelr Innovatwe agility first by adopting radically new technologies (Type 0). but later shift their focus on exploitation by stabilizing product features. At the same time, they engage in other exploration- exploitation cycles, t h ~ ~ s organizing in an ambidextrous manner (Tushman and Anderson 1986). The ~mpacts of this stepwise transformation on process features (innovative content, quality, rlsk. and cost) are significant, and organizations locate themselves into alternative regions with different idea config~lrations of process features (see Table 1).
The first contingency presented in Table 1 I S rare and can be mostly observed in bureaucratic environments. For R&D software development (pre-competitlve phase),
Exploration Focus/
Exploitation Low
Focus I Normally natural monopoly:
High
Table I Contingencies for Organizational Learnir
-
-
-
Process competition in established markets: Incremental changes in speed, efficiency focus in reducing risk, quality Internet computing 2001-
in Soft\+ are Deb elopment
High
Pre-compet~t~ve product development Inno~at lve content dommates, other feat~lres tangentla1 Internet cornputcng avourd (993-1 997 Hypercompetit~on F l u ~ d technology and markets, speed donmates. necessary to meet m ~ n ~ m a l processiprod~~ct features Internet conzpzttw~g 1996-2001
Ljj,tinerz & Kose/Agiliry in Software Dewlopment 213
only explorat~on focus IS h ~ g h When both explorat~on and exploltdt~on a1 e hlgh (I e , organvattons are fast osc~ l l a t~ng between tu o phases of ploduct ~nnobatron In F~gure 3) t h ~ s can be regarded as hyperlearn~ng-hyperconipet~t~on as has been obse~ved In software development organizdtlons betmeen the years 1997 and 2000 (Lyyt~nen et al 2004) The push toward h~gher explo~tat~on comes no~mally fioni competlti\ e demands created by the groulng m a ~ k e t slze, st~ffer competltron and neu \ alue proposltlons The olganlzatlon t ~ l t s towd~d process Improvement and starts to compete based on process rntegratlon Agl l~ty In s o f t u a ~ e thus relates to capablllty to be a fast explorc~ or to be an effectrve Integrator The jump betaeen these poslt~ons takes place when organ~zatlons recognize that the emergrng technology has become mainstream and they must dec~de whether they u ~ l l keep the11 focus on markets that \ d u e explordt~on or s p e c ~ a l ~ z e on explo~tat~on and start to manage process features such as qual~ty and cost
3 RESEARCH METHOD AND RESEARCH SITES
3.1 Research Goals and Design
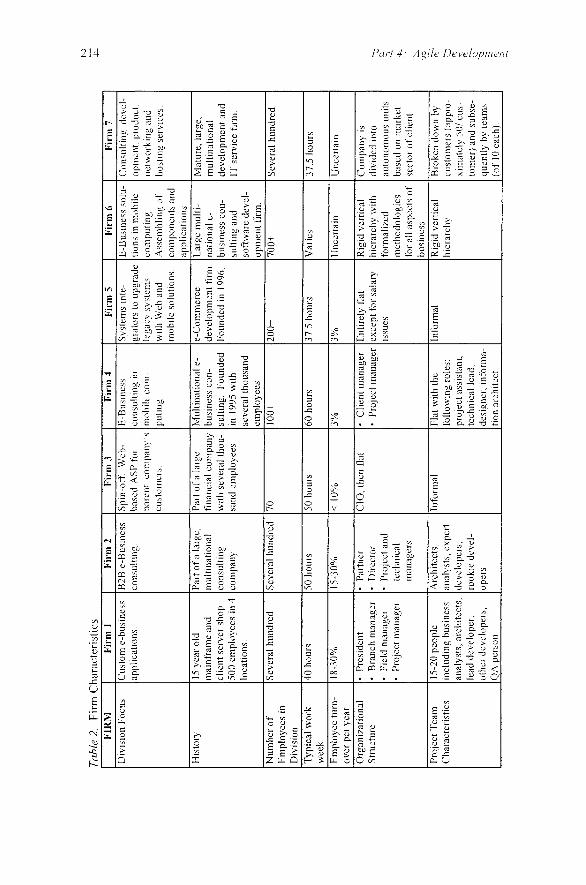
We uanted to explore the follow~ng questlolls Do perceptions of and need for a g ~ l ~ t y change dunng drfferent phases of IT ~nnobatron? Hou softnare organrzatlons manage contrad~ct~ng demands of evplo~atron and olganlze the11 Inno\ atlon for ag111ty7 Does the IT lnnovat~on model pred~ct how a g ~ h t y relates to other process features7 To address these questrons, we conducted a 5-year longrtudlnal field study (Yrn 1994) In Web development software companles (see Table 2) We chose m u l t ~ s ~ t e case study as ~t alloned a repl~catron by w h ~ c h we could test emerglng theoret~cal ~ n s ~ g h t s and tr rangu- late both theory and data (Elsenhardt 1989) To rnlmmlze btas, we sought to maxlmlze the \. arlatlons In order to Improx e external val~dlty (Ym 1994) Cornpanles had d~fferent sizes and operated In many ~ndus t r~es They had experlence using Web-based tech- nolog~es In several domams The geograph~cal scope o f t h e ~ r operations vaned, as some were local vvh~le others wele part of global companles The firms also had large varlatlon In t h e ~ r development experlence. langlng from as few as 4 years to 40+ ycars
3.2 Data Collection and Analysis
The data were gathered between June 2000 and Aprll 2003 at three different time points (2000, 2001, 2003-2004). The exact times of data collection are shown in Table 3. For all companies, the data is not complete due to mortality (some of the companies went out of the business or were bought or sold). For some data we had problems with poor tape qual~ty and were unable to transcribe then1 verbatim so only collected the main facts. We organrzed the data into three different temporal periods- pre-2000 (Period I), 2000-2001 (Period 2), and 2002-2004 (Period 3 t t h a t align with the different stages of the dot-com boon?. Here pre-2000 stands for market growth and period of fast innovation, Period 2000-2001 stands for the recession and crisis, and 2002-2004 stands for the recovery.
'abl
e 2.
Fi
rm C
hara
cter
isti
cs
FIR
M
I F
irm
1
clie
nt s
erve
1 sh
op
500
empl
oyee
s in
4
loca
tion
s.
Num
ber
of
Seve
ral
hund
red
Em
ploy
ees
in
Div
~s~
on
T
ypic
al w
ork
40 h
ours
w
eek
Em
ploy
ee tu
rn-
18-3
0%
over
per
yea
r O
rgan
izat
iona
l P
res~
dent
St
ruct
ure
Bra
nch
man
ager
F
~el
d man
ager
Pr
ojec
t m
anag
er
Proj
ect T
eam
15
-20
peop
le
Cha
ract
eris
tics
~
ncl
ud
~n
g
busi
ness
an
alys
ts,
arch
~te
cts,
le
ad d
evel
oper
, ot
her d
evel
oper
s,
OA
uer
son I
Part
of a
lar
ge
mul
trna
t~on
al
;ons
ullm
g ;o
mpa
ny
Seve
ral h
undr
ed
50 h
ours
Part
ner
Ellr
ecto
r Pr
ojec
t an
d te
chu~
cal
man
ager
s
Arc
h~te
cts,
in
all s
ts e
xper
t de
velo
pers
, ro
ok~
e dcv
el-
3pcr
s
IGrm
3
Spin
-off
W
eb-
base
d A
SP
for
pa
rent
co
mpa
ny's
~
usto
lner
s
Part
of
a la
rge
fina
nc~
al co
mpa
ny
w~
th seve
ral
thou
- sa
nd e
mpl
oyee
s
70
Fir
m 1
I--B
us~n
ess
co~i
sult
ln_r
II
I
nioh
rle
com
- pu
t~ng
Mul
tina
t~on
al e-
bus~
ncss
con-
su
ltin
g. F
ound
ed
~n 1
995
w~
th
seve
ral
thou
sand
I I
I I
empl
oyee
s I 0
0+
50 h
ours
I I
I I
Issu
es
form
aliz
ed
auto
nom
ous
unlts
Fir1
11 5
Sysl
cms
~nt
e-
grat
ors
to u
pgra
de
lega
cy s
yste
ms
w~
lh W
eb a
nd
~n
ob
~lc
so
lut~
uns
e-C
omm
erce
de
velo
pmen
t fir
m.
I7ou
nded
in 1
996.
< 10
%
I I
I I
busm
ess
Info
rmal
l~
lat w
~th
the
llnf
orm
al
1R1a
1d ve
rtic
al
I Bro
ken
dow
n bv
200+
60 li
ours
30
. the
n fl
at
foll
owin
g ro
les.
pr
ojec
t as
s~st
allt
~
tcch
nica
l le
ad,
Fir
m 6
I?
-Bus
mes
s so
lu-
tlon
s In
mo
b~
le
com
pu
tin
g
Ass
cmbl
~ng
ol'
com
ponc
nts
and
appl
icat
~on
s L
arge
mul
ti-
nat~
onal
e-
busm
ess
con-
su
llm
g an
d so
ftw
are
deve
l-
3 %
h~er
arch
y cu
stom
ers
(app
ro-
xlm
atel
y 50
1 cu
s-
toni
er) a
nd s
ubse
-
Firm
7
Con
sult
rng.
dev
cl-
opm
ent.
pro
duct
. ne
twor
k~ng
and
host
mg
sel-
v~cc
s
Mat
ure,
lar
ge,
~n
ult
~n
at~
on
al
deve
lopm
ent a
nd
17' s
ervi
ce f
irm
opm
ent
f~rm
70
0+
37 5
hou
rs
. Cli
ent
man
ager
Pr
ojec
t m
anag
er
Seve
ral
hund
red
3 %
Var
ies
Fint
irel
y fl
at
exce
pt f
or s
alal
y
desi
gnel
-, ~
nfor
ma-
tr
on a
rch~
tcct
37.5
hou
rs
Unc
erta
in
quen
tly
by t
eam
s (o
f 10
eac
h)
Unc
erla
~n
Rlg
~d
vert
ical
hi
erar
chy
wit
h C
ompa
ny I
S
tl~
v~
ded
In
to

hb
k 3
. D
a F
IRM
In
terv
iew
D
ate
1 nt
ervl
ewee
s n
T~
mc
I
Inte
rvie
w
Dat
e 2
nter
vlew
ees
n T
une
2
lnte
rvie
w
Dat
e 3
nter
vlew
ccs
n T
une
3
Col
lect
ion
Surn
rnar
y Fi
rm 1
Fi
rm 2
I
Fir
m 3
I
Firm
4
I Fi
rm 5
I
Firm
6
Jnne
Ju
ne
.Jun
e O
ctob
er
Sept
embe
r Se
ptem
ber
2000
20
00
2000
20
00
2000
20
00
SIX
senl
or e
m-
A s
enlo
r m
anag
el
ploy
ces
~nc
ludl
ng o
f an
dev
elop
men
t an
ex
ecu
tiv
e,
grou
p an
d on
e of
m
anag
ers.
and
h
~s
ke
y de
velo
pers
so
ftw
are
arch
l-
tect
s Oct
ober
I
Oct
ober
20
01
I 20
0 1
One
sof
twar
e IA
sen
lor
man
arer
',
arch
itec
t fr
om
of a
n IS
dev
elop
- fi
rst
inte
rv~
cw.
men
t gr
oup
and
one
of h
is k
ey
deve
lope
rs f
rom
li
rst
~nt
ervi
ew.
ccss
cs.
Oct
ober
A
ugus
t A
ugus
t A
ugus
t 20
01
2001
20
01
2001
T
wo
tech
nolo
gist
s T
wo
empl
oyee
s S
ame
Man
ager
who
fr
om f
irst
~nt
ervi
ew,
from
fir
st ~
nter
- in
terv
iew
ee f
rom
re
plac
ed
vlew
fi
rst
~n
tcrv
~ew
mnn
aoer
111
firs
t
Mar
ch
Mar
ch
Mar
ch
Apr
il 20
03
2003
N
o in
terv
iew
N
o in
terv
iew
20
03
2003
Tnn
e I.
the
fnn
e I
repl
acem
ent
of
excu
twe
In
Tnn
e 1.
and
a de
velo
per
not
in
Firm
abs
orhe
d by
F
inn
~sh
offi
ce
pare
nt c
ompa
ny a
nd
clos
ed.
Inte
r-
IT e
mpl
oyee
s ~r
cas-
vl
ewee
s no
t s~
gn
ed In
terv
iew
s av
aila
ble
not
ava~
labl
c In
- fo
rmat
ion
gath
ered
vi
a e-
mal
l w
~th
one
of th
e o
r~g
~n
al
Inte
r-
view
ees
and
revi
ew
of o
nlin
e do
cum
en-
tatl
on o
f pa
rent
fir
m
in M
arch
200
3
I Sam
e IM
anag
cr w
ho
Fir
m 7
N
ove~
n her
2000
F
our
seni
or e
m-
ploy
ees
lncl
udln
g a
syst
ems
arcl
il-
tect
, m
anag
cr, a
nd
soft
war
e en
gin
eer.
Aug
ust
2001
O
ne m
anag
er f
rom
fi
rst
inte
rvie
w.
Ap
ril
2003
O
ne m
anag
cr f
rom
fi
rst
inte
rv~
ew.
2 16 Part 4 Agde De~eloprurnt
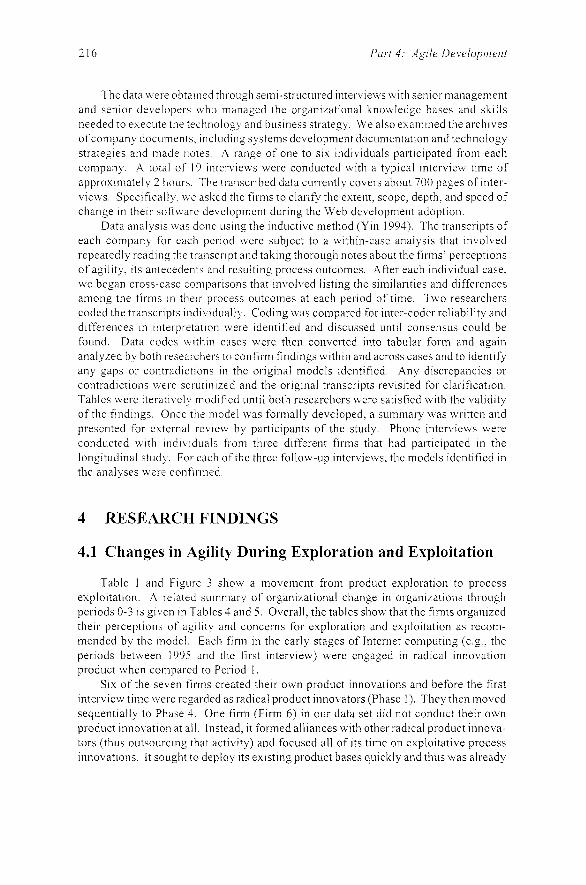
The data L\ ere obta~ned through semi-structured Inter! l eas ~ ~ t h semornianagement and senlo1 developels n h o managed the organ~zational knowledge bases dnd sk~ l l s needed to execute the technology and busrness strategy We also exammed the archives of company documents, lnclud~ng systems development doc~imentat~on and technology s t ~ a t e g ~ e s and made notes 4 lange of one to SIX rnd~v~duals partlcrpated fiom each company A total of 19 mtervleus were conducted w ~ t h a typlcal ~ n t e l v ~ e v tlme of approx~mately 2 hours The t r ansc~~bed data currently covers about 700 pages of ~nter- vleu s Spec~ficdlly \be asked the firms to clarlfy the extent, scope, depth, and speed of chdnge 111 their softmare de~elopment durmg the Web development adopt~on
Data analys~s ~ d s done nslng the l n d ~ ~ c t ~ v e method (Yln 1994) The trdnscrlpts of each company for each perlod n e t e subject to a w~thm-case analys~s that ~nkolved repeatedly I eadlng the trdnscrlpt and takmg thoro~igh notes about the firms' perceptlons of ag~llty, ~ t s antecedents and result~ng process outcomes Aftel each ~ n d ~ v ~ d u d l case, we began cross-case compdrtsons that ~ n \ olved llstlng the s ~ m ~ l a r ~ t ~ e s and d~ffeiences among the firms in their process outcomes at each pel~od of t ~ m e Two lesearchers coded the transcrlpts ~nd~\.lduall) Codlng L\ as compared for ~nter-coder r e l ~ a b ~ l ~ t y and differences In tnterpretatlon \\ere ~dentlfied and d~scussed until consensus could be found Data codes \ \~ th ln cases he re then conberted Into tabular form and agarn analyzed b) both I esearchers to confii ni findmgs wlth~n and across cases and to ~ d e n t ~ f y any gaps or contrad~ctlons In the o r ~ g ~ n a l models ~den t~f ied Any d~screpancles or cont~adlct~ons were scr ~ i t in~zed and the ollgmal transcrlpts r e v ~ s ~ t e d for clar~ficatlon Tables wele Iteratli el) mod~fied ~ ~ n t i l both researchers were satisfied \ \ ~ t h the vahd~ty of the find~ngs Once the model was formally developed, a summary mas wrltten and presented for external rexlew by par t~c~pants of the study Phone ~ n t e n l e w s were conducted w ~ t h ~ n d n id~idls fiom three d~fferent firms that had partmpated In the longltnd~nal study Fol each of the three follow-up inten lems, the models ~dentlfied in the analyses were confirmed
4 RESEARCH FINDINGS
4.1 Changes in Agility During Exploration and Exploitation
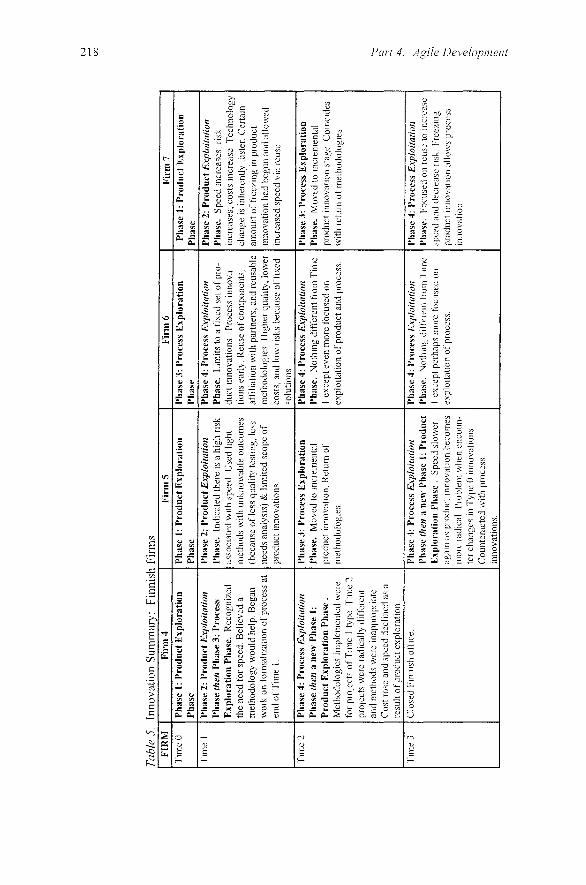
Table 1 and F l g ~ ~ r e 3 show a movement from prod~ict explorat~on to process exploitat~on A related summa1 y of organ~zational change In organrzatlons th~ough perlods 0-3 1s glben in Tables 4 and 5 Overall, the tables shon that the firms organved thelr perceptions of d g ~ l ~ t y and concerns for explorat~on and explortatlon as recom- mended by the model Each firm In the early stages of Internet computing (e g the perlods bet\\ een 1995 and the first ~ntervlew) mere engaged 111 rad~cal lnnovatlon product when compared to Pel ~ o d 1
SIX of the se\en firms created thelr own product InnoLations and before the first Interview tlme nere regal ded as rad~cal product mnovator s (Phase 1 ) They then mobed seq~~entlally to Phase 4 One firm ( F ~ r m 6) In our data set d ~ d not conduct thelr o u n p~oduc t tnnobatlon at all Instead, ~t formed allrances with other radlcal product Innova- tors (thus outsourcing that actlv~ty) and f o c ~ ~ s e d all of ~ t s tlme on explortatlve process mnovatlons It sought to deploy ~ t s exlstlng product bases qu~ckly and thus was already

Tab
le 4
. In
nova
tion
Su
mm
al~
: USA
Fir
ms
Incr
ease
, I-i
sk In
crea
se,
cost
s ln
crea
se
Bas
e te
ch-
nolo
gy 1
s ln
hcre
ntly
fas
ter
Ce~
laln
amou
nt o
f fr
eez~
ng prod
uct
innovat
ion h
ad a
l~ea
dy be
gun
and
allo
wed
tlm
e re
duct
ion
v!a
ieus
e Pr
ojec
ted
In T
~m
e
2 th
at th
ey iv
ould
foc
us o
n m
ore
reus
e to
~n
c~ea
se
spee
d an
d de
crea
se r
~sk
Indi
catio
n w
as th
at t
hey
plan
ned
to f
reez
e pr
oduc
t in
iiova
tlon
to a
llow
this
pr
oces
s ~n
nova
tlon
to o
cclir
FIR
M
Tlm
e 0
T~
me
I
I not
beca
use
they
sea
~cl
ied fo
r m
etho
ds
Tlm
e 3
1 l'ha
se
I: N
ew P
rodu
ct E
xplo
rati
on P
hase
. Sp
eed
17ir1
n 1
Pha
se 1
: Pro
duct
Exp
lora
tion
Pha
se
I'lia
se 2
: P1.
oduc
t E
.upl
oifa
tion
Pha
se
Spee
d
Tim
e 2
fol-
ISD
st11
1 an
~ss
ue b
ut n
ot u
rgen
t L
ooki
ng l
nto
rad~
cal ne
w B
ase
and
prod
uct
~n
no
\~at
~o
ns
Inhe
rent
In
the
ir m
~ss
lon s
tate
men
t (a
s~
ng
le sent
ence
ab
o~
~t
rnee
tlng
cl~
ent ne
eds
with
lea
d~ng
-edg
e IT
!:
lnov
at~o
ns)
Pha
se 3
Pro
cess
Ex
plo
rati
o~
~
I'has
e an
d th
en
Pha
se 4
: C
irct
~~
nst
al~
tial
P
roce
ss E
xplo
itntio
n Ph
ase.
Sp
eed
not a
pro
blel
n be
caus
e pr
ojec
t sco
pes
wer
e sm
alle
r as
cl~
ent de
man
d fo
r pr
oduc
t in
nova
- tlo
n st
oppe
d B
usln
ess
drop
ped
ofi's
ign~
fica
ntly
an
d re
qu~r
ed el
~m
niat
~on
of
man
y pr
ogra
mm
ers
F~
red
all s
low
est p
rogr
am~n
ers a
nd k
ept t
hose
with
un
ders
tand
ing
of e
ffec
tive
met
hods
(a
Dar
cvin
lan
mod
el)
Allo
wed
foi
rap
id d
evel
opm
ent,
but n
ot b
y de
slgn
Ila
d m
etho
ds a
s a
resu
lt of
mar
ket
requ
irem
ents
and
a n
atur
al s
clec
tlon
of
deve
lope
rs,
Fir
m 2
P
hase
I:
Pro
duct
Exp
lora
tion
Pha
se
Pha
se 2
: Pro
duct
Ex[
~/oi
tuti
un Ph
ase.
( sta
blli
~e an
d ge
t sp
eed
uplq
ual~
ty up
lrls
k do
wn
L
Fir
m 3
P
hase
1: P
rodu
ct E
xplo
rati
on P
hase
P
hase
2:
Pro
duct
Exp
loita
tion
I'has
e.
S~
un
of
f- bv
N
o rl
gld
rnet
hodo
log~
~s Had
fas
ter
deve
lopm
ent t
han
befb
re b
ut d
eem
ed to
be
wlth
poo
r qu
alit
y
pare
nt c
ompa
ny f
or m
etho
dolo
g~es
and
proc
ess
exp1
01-
tatlo
n R
ecog
nize
d a
new
erl
v~ro
nmcn
t and
~eq
u~
red
ra
dica
l pr
oduc
t in
nova
t~on
Qua
lity
requ
~red
Spe
ed
fast
er th
an I
n th
e pa
rent
fm
, bu
t afi
er 2
1 m
onth
s ~t
w
as c
ons~
dere
d una
ccep
tabl
e in
"ne
w e
cono
my
'' N
o fo
rmal
pro
cess
use
d L
ots
ofex
per~
men
tat~
on
1~
1th
pl
oduc
t Pr
oduc
t In
novat
ion w
as h
igh,
r~
sks w
ere
high
qi
lalit
y w
as l
ower
I'l
annr
ng
on t
reez
lng
p~od
uct
Inno
vatlo
n an
d be
ginn
~~
lg
proc
ess
Inno
\,atlo
n G
oal
wc~
s to I
ncre
ase
spee
d an
d qu
al~
ty D
id s
o at
li~
gh co
st
by b
uy ~
ng
ou
ts~
dc hc
lp (
giai
ting
) G
oal
was
to
rollo
uts
Com
prue
d to
T11
1it 1-
t-as
ter s
t~ll
. cost
s lo
we^
, qua
lity
high
er
Inno
vatlo
n e
late
d le
arn~
ng stop
ped
Proc
ess
~nno
vatr
on
occu
rrcd
In
Typ
e I
as a
resu
lt of
sta
b~
l~ty
11
1 P
I-od
i~ct
an
d in
crem
enta
l In
nova
tion.
vatlo
n fi
ozen
Pio
ccss
innovat
ion s
low
~ng
dow
n to
al
mos
t fi
o~
en po
lnt
Dev
elop
men
t sp
eed
was
way
III
I
Qua
l~ty
was
bet
ter
than
~n P
crio
d I
Stn
b~
l~ze
d
prod
uct
Sta
b~ll
zed p
roce
ss
Goa
l to
sho
re u
p pr
oces
s ~i
ietl
lods
to
mal
ntal
n hl
gh q
uali
ty a
nd i
ncre
ased
spe
ed l
or f
utur
e
Pha
se 4
: P
roce
ss E
xplu
itutio
n Ph
ase.
Pr
oces
ses
and
prod
uct
solu
tions
hav
e m
atur
ed a
nd s
tabi
lized
sin
ce T
~m
e 1 an
d T
imc
2 Sp
eed
up s
t111
as a
resu
lt of
ncw
T
ype
I In
no
vat
ion
s, s
tah~
llty
of s
olut
~on
s an
d kn
owle
dge
sets
. and
I-e
usl: (
stab
le b
ase
tool
s an
d ~
nc~
emen
tal ~n
nova
tion
In ba
se)
Pl~
ase 4
: Pr
oces
s E
xplo
itutiu
n Ph
ase.
ln
nova
t~on
fr
ozen
ent
lrel
y Q
ual~
ty high
er, r
isks
In I
SD a
nd c
osts
~n
ISD
dec
rcas
e IS
D I
'irln
is
s\va
llo\v
cd u
p by
the
pa
rent
com
pany
and
Iea
ders
hlp
give
n to
mar
keti
ng
team
O
~igl
nall
y ?pu
n ou
t of
pale
nt to
Inn
ovat
e ~
ap
~d
ly
and
I-ad
lcal
ly T
eam
dis
band
ed In
200
3 an
d fi
-ozr
n p~
oduc
ts an
d pr
occs
scs
(met
hods
) sw
allo
wed
up
able
5.
FIR
M
T~
mc 0
I'ini
e 1
Tm
e 2
Inno
vati
on S
umm
ary:
Fin
nish
Fir
ms
Fir
m 4
F
irm
5
Pha
se 1
: Pro
duct
Exp
lora
tion
I P
hase
1: P
rodu
ct E
xplo
rati
on
Pha
se
1 Pha
se
Pl ~
ase 2
: P
rodu
ct E
xplo
itntio
n I P
hase
2:
Pro
duct
Exp
loita
tion
Pha
se th
en P
hase
3:
Pro
cess
P
hase
. I ~
id~
cate
d ther
e I S
a h
~g
h rlsk
E
xplo
rati
on P
hase
. K
ecog
n~ze
d as
soci
ated
wlth
spe
ed
Use
d l ~
gh
t th
e ne
ed t
or s
peed
Bel
~ev
ed a
met
hods
w~
t h un
know
able
out
com
es
met
hodo
logy
wou
ld h
elp
Beg
an
(bec
ause
of
less
qua
l~ty
test
lng,
les
s w
ork
on l
brni
al~
zat~
on
of p
roce
ss a
t ne
eds
anal
ys~
s) & l
~n
i ~t c
d
scop
e of
en
d of
Tm
e 1
pl-o
tluct
lnno
val~
ons
Pha
se 4
: I'r
oces
s E
~l ~
/ oi t
ati o
n
Pha
se 3
: Pro
cess
Exp
lora
tion
P
hase
then
a n
ew P
hase
1:
Pha
se.
Mov
ed t
o ~n
crem
enta
l P
rodu
ct E
xplo
rati
on P
has
e.
prod
uct
~nno
vatl
on K
etum
of
Mel
hodo
log~
es ~m
plem
ente
d wer
e m
etho
dolo
g~es
fo
r pr
ojec
ts o
f T
une
I ty
pe
Tm
e 2
proj
ects
wer
e ra
dica
lly d
~lk
ren
t an
d m
etho
ds w
ere
map
prop
slat
e C
ost
rose
and
soe
ed d
ecln
ied
as a
~
esu
lt of p
rodu
ct e
splo
l-at
ion
Clo
sed
Pin
n~sh
ofl'i
ce
I Pha
se 4
: P
roce
ss E
lvvl
oitn
tion
Pha
se th
en a
new
I'h
ase
1: P
rodu
ct
Exp
lora
tion
I'h
ase
. Sp
ccd
slow
el
agam
as
pl-o
duct
Inno
vatio
n hz
com
es
mor
e ra
dica
l Pr
oble
m w
hen
cnco
un-
ter
chan
ges
In T
ype
0 In
nova
tlons
C
ount
erac
ted
wth
uro
cess
Firm
6
I'l~
ase 3
: P
roce
ss E
xplo
rati
ou
Pka
se
l'has
e 4:
Pro
cess
Exp
loitr
~tio
n P
hase
. 1.
1m1t
s to
a t'lx
ed s
et o
f p
~o
- du
ct I
nnov
atto
ns
Proc
ess
Inno
va-
tmns
ear
ly R
euse
of-
com
pone
nts,
af
lilm
tron
w~
t h pa
~tne
l-s,
and
leus
able
m
etho
dolo
g~es
H~
gher
quah
ty, l
ower
co
sts,
and
low
r~
sks b
eca~
lse o
f fi
sed
solu
t~on
s P
hase
4:
Pro
cess
Exp
loitn
tion
Pha
se.
Not
hlng
d~f
t'ere
nt fl-
om T
me
1
exce
pt e
ven
mor
e fo
cuse
d on
ex
plo~
tati
on of
pro
duct
and
pro
ccss
Pha
se 4
: I'
roce
ss E
xplo
itatio
n I'
hase
. N
otli
~ng d
~lf'e
rent
from
1 u
nz
I es
wpl
per
haps
mol
e Ib
cuse
d on
ev
plo~
lat~
on
of p
roce
ss
Pha
se I
: P
rodu
ct E
xplo
rati
ou
I'has
e P
hase
2:
Pro
duct
Exu
loitr
rtiu
n P
hase
. Sp
eed
Incr
ease
s, 1
1sk
Incr
ease
s; c
osts
rnc
l-ed
se T
echn
olog
y ch
ange
1s
mhe
rcnt
ly f
aste
r C
erta
r~i
amou
nt o
f fr e
ezm
g In
prod
uct
lnno
vatlo
n ha
d be
gun
and
allo
wed
r ~
~cr
ease
d spee
d vl
a re
use
Pha
se 3
: P
roce
ss E
xp
l o~
~t i
ou
P
hase
. M
ovcd
to
~ncr
emen
tal
p~od
uct ~
nnov
atr o
r stag
e C
o~
nc~
dzs
w
~th
~et
urn
of m
etho
dolo
gies
Pha
se 1:
Pro
cess
Ex/
~kO
iIflt
iOn
Pha
se.
Focu
sed
on ~
cusc
to ~
ncic
,~se
sp
ced
dnd
decl
rasc
11s
k F
rce
~~
ng
pr
oduc
t in
nova
tion
allo
ws
proc
css
Innovat
ion
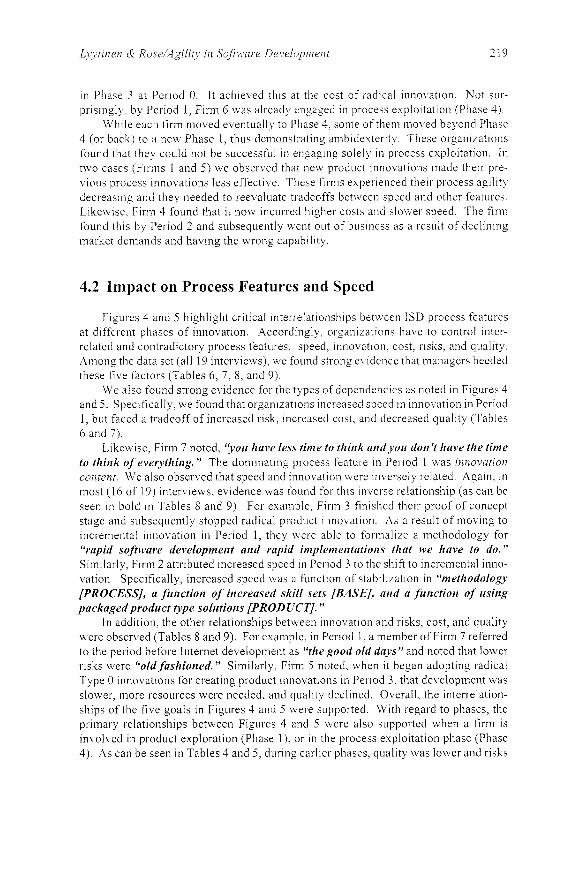
in Phase 3 at Per~od 0. It achieved this at the cost of rad~cal inno\.ation. Not sur- pris~nglj., by Period 1, Firm 6 was already engaged in process exploitation (Phase 4).
While each firm moved event~~al ly to Phase 4. some of them nioved beyond Phase 4 (or back) to a new Phase 1, thus denlonstrat~ng amb~dexter~ty. These organizations found that they could not be successf~~l in engaging solely in process exploitation. In two cases (F~rms 1 and 5 ) we observed that new p r o d ~ ~ c t ~nnovations made t h e ~ r pre- vious process ~nnovations less effective. These firms exper~enced their process agil~ty decreasmg and they needed to reevaluate tradeoffs between speed and other features. L~kewise, Flrm 4 found that it now incurred higher costs and slower speed. The firm found this by Period 2 and subsequently went out of b~ l s~ness as a result of declinmg market demands and having the wrong capability.
4.2 Impact on Process Features and Speed
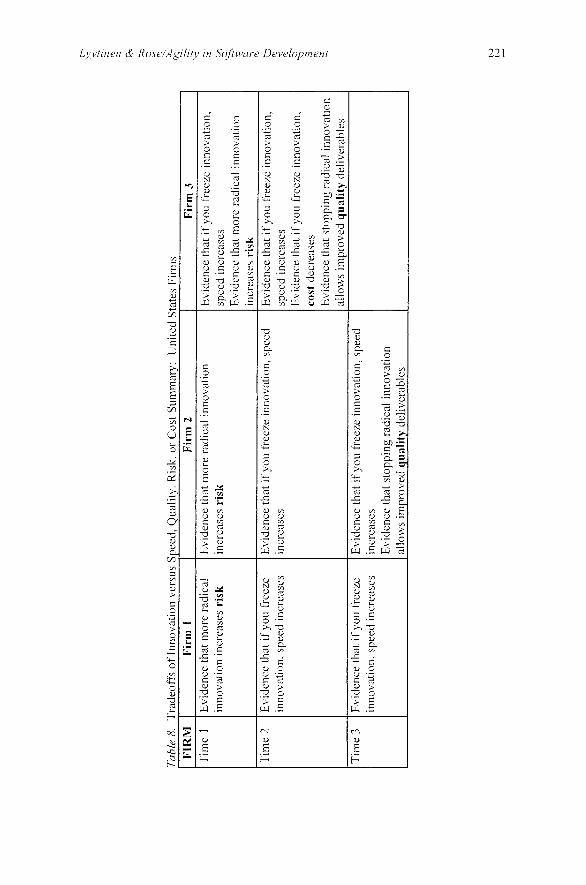
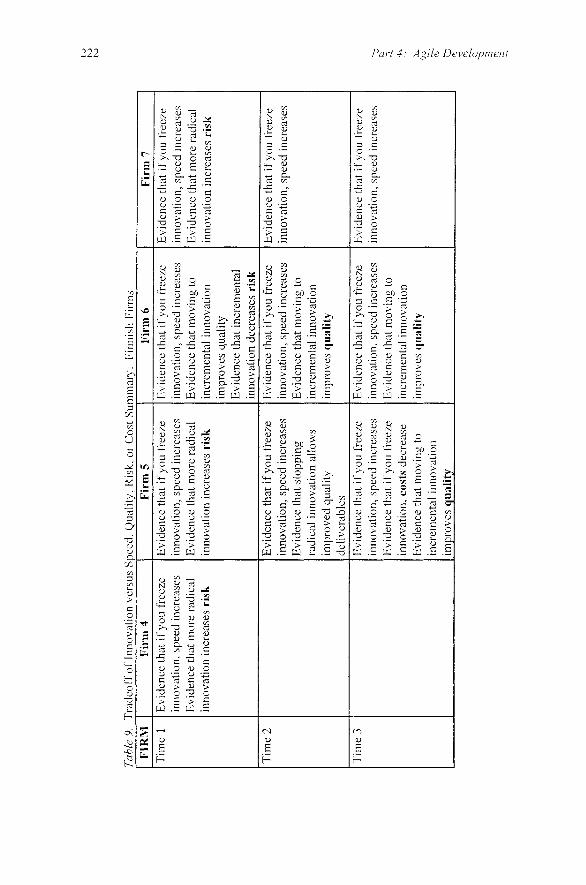
F~gures 4 and 5 h ~ g h l ~ g h t critical ~nterrelat~onsh~ps betnccn ISD process features at d ~ f f e ~ e n t phases of lnnovat~on Accordmglv, organlzatlons hale to control Inter- related and contrad~ctory process features speed inno\ation cost r~sks , and q ~ ~ a l l t y Among the data set (all 19 ~nterv~ems) , n e fo~md strong e\ ~dence that managers heeded these f i ~ e factors (Tables 6, 7, 8, and 9)
We also found strong evidence for the types of dependenc~es as noted In F ~ g ~ ~ r e s 4 and 5 Spec~fically, we found that organ~zat~ons increased speed In ~nnovatlon In Pel ~ o d I , but faced a tradeoff of Increased I I S ~ lncredsed cost and decreased quality (Tables 6 and 7)
L~kev, Ise, Firm 7 noted, "you have less time to think andyou don't have the time to think of everytlzing." The dominat~ng process feature In Period 1 was lrzuovntlon conterlt We also observed that speed and ~nnoca t~on were ~nversely related Agaln, In most (16 of 19) Inter\ lews, evtdence was found for thls inlersc re la t~onsh~p (as can be seen In bold In Tables 8 and 9) For example, F ~ r m 3 fin~shcd t h e ~ r proof of concept stage and subsequently stopped radical product lnnovatlon As a result of mo11ng to incremental ~nnovatlon In Period 1, the) were able to f o r n i a l ~ ~ e a nlethodology for "rapid software development and rapid inzplernerrtatiorzs that we have to do." S ~ m ~ l a r l ) , F ~ r m 2 attributed ~ncieased speed In Per~od 3 to the s h ~ f t to Incremental Inno- vatlon Spec~fically, Increased speed \\as a fimction of s t a b ~ l ~ z a t ~ o n In "inethodolog~ [PROCESS], a f~rrzction of increased skill sets (BASE], nrzd a firnction of using packaged product type solutions [PRODLTCT]. "
In a d d ~ t ~ o n , the other re la t~onsh~ps between innovatton and r~sks , cost, and quallty he re observed (Tables 8 and 9) F ~ I example, In Per~od 1 , a member of Flrm 7 referred to the period before Internet development as "thegood olddays" and noted that lower r ~ s k s were "old fashioned." S~mdarly , F I I ~ 5 noted, when ~t began adopting rad~cal Type 0 mnovat~ons for creatlng product Innovations In Per~od 3 that de\ elopnieut was sloaer, more resources were needed. and qual~ty decltned O\erall, the ~nterrelat~on- s h ~ p s of the five goals In Figures 4 anii 5 were supported With regard to phases, the prlmary relat~onships betheen F~gures 4 and 5 wele also s~~ppor ted when a firm IS
~nvolbed In product explorat~on (Phase I ) , or In the process explo~tat~on phase (Phase 4) As can be seen In Tables 4 and 5 , during earl~er phases, q ~ ~ a l ~ t y was lower and r ~ s k s

7bbl
e 6
Tra
deof
fs b
etw
een
Spe
ed v
ersu
b Q
uali
ty.
Cos
ts, a
nd I
iisk
s S
umm
ary:
Uni
ted
Stat
es F
irm
s
Tabl
e 7
Tra
deof
fk b
ehve
en S
peed
ver
sus
Qua
lity
. C
osts
, and
Ris
ks S
umrn
ar~
r Fin
nish
Fir
ms
FIR
M
l'im
e 1
Tim
e 2
Tim
e 3
Fir
m 1
E
vide
nce
of tr
adeo
ffs
betw
een
spee
d an
d qu
alit
y, c
osts
, an
d ri
sks
Evi
denc
e ol
'trad
eoff
s be
twee
n sp
eed
and
qual
ity,
cos
ts.
and
risk
s E
vide
nce
of tr
adeo
ff's
betw
een
spee
d an
d qu
alit
y. c
osts
, an
d ri
sks
FTR
M
Tim
e 1
Tim
e 2
Tim
e 3
Fir
m 2
E
vide
nce
of t
radc
offs
bet
wee
n sp
eed
and
qual
ity,
cos
ts,
and
risk
s E
vide
nce
of in
crea
ses
in s
peed
and
de
clin
e in
qua
lity
E
vide
nce
of t
rade
offs
bet
wee
n sp
eed
and
qual
ity.
cos
ts.
and
risk
s E
vide
nce
of tr
adeo
ffs
betw
een
spee
d an
d qu
alit
y, c
osts
, and
ris
ks
Fir
m 4
E
vide
nce
of tr
adeo
ffs
betw
een
spee
d an
d qu
alit
y,
cost
s, a
nd r
isks
E
vide
nce
of tr
adeo
ffs
betw
een
spec
d an
d qu
alit
y,
cost
s, a
nd r
isks
Fir
m 3
E
vide
nce
of tr
adeo
ffs
betw
een
spee
d an
d qu
alit
y, c
osts
, an
d ri
sks
Evi
denc
e of
trad
eoff
s be
twee
n sp
eed
and
qual
ity,
cos
ts, a
nd r
isks
Fir
m 5
E
vide
nce
of tr
adeo
fls
betlv
een
spee
d an
d qu
alit
y,
cost
s, a
nd r
isks
Evi
denc
e th
at s
low
ing
dow
n de
velo
pmen
t re
duce
s co
sts
and
impr
oves
qua
lity
Fir
m 6
Evi
denc
e of
trad
eoff
s be
twee
n sp
eed
and
qual
ity,
co
sts,
and
ris
ks
Fir
m 7
E
vide
nce
of tr
adco
ll's
betw
een
spee
d an
d qu
alit
y,
cost
s, a
nd r
isks
E
vide
nce
of tr
adeo
ils
betw
een
spce
d an
d qu
alit
y,
cost
s. a
nd r
isks
E
vide
nce
of tr
adeo
fl's
betw
een
spee
d an
d qu
alit
y,
cost
s, a
nd r
isks
Lyjtirlerr & Rose/Agility iil Software Development
Part 4. Agile Developr~zeiit
and costs were liigher In later phases the opposlte \\as true, although In all phases, speed was deemed ~tnportant As such the concern fol speed did not dlmmsh betu een phases, as the idea of speed u as different
The tradeoffs between tnno\ati\e content and the o the~ factors are most Lis~ble when Perlod 1 IS constdered In Pel iod I F ~ r m 6 mas already in Phase 3 They were alieady leaping the teuards of this and noted that their q ~ ~ a l l t y was higher, costs were louer, and risks wele lower as they had fio7en tnnovatlon and assembled "conzponertts" for "a set of solutions that [they knew] how to give and [could] give then1 quickly. " In contrast, other firms, while mo\ ing to Phase 2, saw Increased rlsks and costs, with decreased quallty
As each film moved Into other phases ~ t s market matured and stab~hzed T h e ~ r methodologies became refined M h ~ l e the~i risk, costs. and q ~ ~ a l ~ t y moved to a new trade- offpattern (F~gure 5 ) For example. Firm 2 entered Phase 4 dur~ng Perlod 3 The Inter- viewee noted that t h e ~ r "ntetlzorlologies and ~trategies are now ntature"and that quality mas ~mproved as "a filnction of better trained people, a tizetltodology ... and less innovation. "
4.3 Discussion and Conclusions
Software aglllty IS affected by the scope m d depth of Innovatwe activity In base technologies as well as in continued process lnnovatlons In complementary assets We explored the concept of ag~llty In terms of the fol lon~ng q~~es t ions Do percepttons of and need for agihty change durlng dlfferent phases of IT ~nnovation' How do soft^ are organlzatlons manage contrad~ctlng demands of explot atton and organize thelr Inno\ a- tlon for aglhty7 Does the IT innovatton model predlct how ag~l l ty relates to other process features? We observed the folloming ( I ) concern for both explorat~on speed and process development speed changed slgntficantly o le r the per~od of study, (2) softaare organ~zatlons tended to organlze themselves differently durmg d~fferent innovatton per~ods while they declde either to explore fast 01 deliver fast (process Integrators), and (3) the varlance In plocess features emphas~zed varied across phases and also between companies due to the valying focus on explorat~on 01 exploltat~on Software organlzatlons controlled their concern for agil~ty In how good they wanted to become In managing technolog~es during dlfferent lnnovatlon phases In domg so. they had to trade ag~llty agamst other crlteria includmg innovatwe content or r ~ s k How these trade-offs were made depended on competencies managerial focus, and competltlbe demands
There are several avenues for future research in t h ~ s fascinating area FII st we need to generalize the findings here u ~ t h a bettcl and more representati~e sample of organ~za- tions There is also a need to develop more c a r e f ~ ~ l constructs for agi l~ty and o the~ process features We need to explore other factors than just the organ~zat~ons ' learning focus to establish causal explanattons of agll~ty In organizational contexts Finally, ~t needs to be s en IS these findings ate general~zable beyond Internet computing, and ~i so, when and where
P a r t 4 Agile Development
REFERENCES
Agde Alliance. "Manifesto for Agile Softuare." 2001 (available online at l i t tp : / ' /w~w. ag~lenianifesto.org!: accessed September 4.2004).
Baskerville. R., Levine. L., Heje. J-P. Balasubramarian. R., and S la~~ghter . S. "How Internet Software Companies Negotiate Qual~ty." IEEE Sofl1var.e. May 2001, pp. 5 1-57.
Carstensen. P, and Vogelsang, L. "Deslgn of Web-Based Infonnat~on Systems: New Challenges for System Development." in Procrediiigs ofthe 9"'ECIS, Bled. Slovenia, June 27-29.2001, pp. 536-547.
Cohen, W. M.. and Levinthal, D. A. "Absor-pt~be Capacity: A New Perspective on Learning and Innovation," Administrative Science Q~~ar.fer-l\~ (35). 1990. pp. 128-152.
Cusurnano M.. and Yoffie, D. "Software development on Internet Time." IEEE Compztler (32: lo), 1999. pp. 60-69.
D'Aveni, R. A. Hypei.conzpetitio11: A~fanag~ng the D)~narnics of Strxtegic Maneuveiing. New York: The Free Press, 1994.
Eisenhardt, K. M. "Building Theones from Case Study Research." Acadeniy of Management Review (l4:4), 1989, pp. 532-550.
Eisenhardt, K. M.; and Maltin. J. A. "Dynam~c Capabihties: What Are They?." Strategic itfarzagernent Jo~rrnal(21), 2000, pp. 1 105-1 121
Henderson, R. M.. and Clark, K. B. "Architectural Innovat~on: The Reconfiguration of Existing Product Technologies and the Failure of Established Firms." Adnzinislrative Science Quarterly (35:1), 1990. pp. 9-30.
Humphrey, W. 12rfanaging the Sofiwaw Pi-ocec~. Reading, MA: Addrson-Wesley. 1989. Kessler E., and Chakrabarti. A. "Inno\.ation Speed- A Conceptual Model of Context,
Antecedents and Outcomes," Acade1?i~~of.2.In11~1ge111enf R e v v ( 2 1 :4), 1996.pp. 1 143-1 191. Lambe C., and Spekman, R. "Alliances. External Technology Acquisition. and Discontmuous
Technological Change," Jo~ir.nnl ofPivdzrct Irinovaiion Managenient (14), 1997, pp. 102- 116.
Levinthal. D., and March. J. "The Myopia of Leal-ning," Strategic ~Wanageinenf Jozrrnal ( l4) , 1993, pp. 95-1 12.
Lyytinen, K., and Rose, G. "The DisruptiveNature of Information Technology Innovations: The Case oflnte~net Computing in Systems De~elopment Organ~zations," MISQirarfer+(27:4). 2003, pp. 557-595.
Lyytinen, K.. Rose, G., and Yoo, Y. "Exploring and Exploiting in High Gear: Hyper-learning In Seven Software Firms." under rewew. 2004.
March, J . G. "Exploration and Explo~tation 111 Organizational Leal-ning," 01;oanization Science (2:l). 1991. pp. 71-87.
Pressman, R. "Can Internet-Based Applicat~ons Be Engineered?." IEEE Softurnre (155) September-October 1998, pp. 104-1 10.
Swanson, E. B. "lnfomiation Systems Innovation Among Organizations," Management Science (40:9), 1994, pp. 1069-1088.
Teece, D. J., Pisano, G.. and Shuen. A . "Dynamic Capabilities and Strategic Management," Strategic Management Journal (l8:7), 1997, pp. 509-533.
Tushman. M. L., and Anderson, P. "Technolog~cal Discontinuities and Organizational Environ- ments." Administrative Science Qzrnrterly (3 1). 1986, pp. 439-465.
Van Kleijnen, J. Computer and Profits. Qzrantl5,ing FinnnciaiBen~fits oflnfornmtior~ Sjsferns. Englewood Cliffs, NJ: Prentice-Hall, 1980.
Yin, R. K. Case Study Research: Design and Methods, Thousand Oaks, CA: Sage, 1994.
ABOUT THE AUTHORS
Kalle Lyytinen is Iris S. Wolstein Professor at Case Western Resene Uni~~ersi ty. He currently serves on the editorial boards ofseveral leading ~nformation systems journals including Jo~~rrzal o f the AILS (Editor-in-Chef). J o ~ n ~ n a l of Strategic I~! fo~mat ion Sjstems. I~?fbrn~atrorz & Organiznh'on, Requirements Engineernig Journni, Injornzntion Sj,srem .Joui.nal. Scandinnvian Jourxnl oj'lr2fomation Sys tem, and Ir~f'ormat~orz Technolos and People. He is the former chairperson of IFLP WG 8.2 and is a member of WG 8.6. He has published over 150 scientific articles and conference papers and edited or written eight books on topics related to system des~gn, method engineering. implementation. software r ~ s k assessrncnt, computer-assisted cooperative work, standardization. and ub~quitous computing. He is c u ~ ~ e n t l y ~nvolved in research projects that look at the IT-induced innovations in the software development. architecture, and construction industries. the design and use of u b i q ~ ~ i t o ~ ~ s applications in health care. high-level requirements models for large-scale systems. and the development and adoption of broadband wireless standards and services, where his recent s tud~es have focused on South Korea and the United States. Kalle can be reached [email protected]
Gregory M. Rose is an assistant professor at Washington State Un~versity. He received his Ph.D. in the CIS Department at Georgla State University. an MBA from B~nghaniton Un~versity. and a B.S. in business administration from the Unikersity of Vem~ont. Gregory has more than 20 publications including those in journals such as ILIIS Quarterly, IEEE T~msact ions or1 E~~girzeeringManngemenf, Accounting, Munagenlent ar2dlnfo1.matioi2 Teci~nolo,pies, Infornzntio~~ $,sterns Journal, Journal ofGloba1 Irzforn~nt~on n/fanagernerzi, P s y h o l o ~ and ~tlnricefing, and Conzrnurzicatior~s o f t h e AIS. A 1998 ICIS Doctoral Consort~um fellow, he has u o n inultiple teaching awards, apost-doctoral fellowsh~p from the University of Iyvaskyla (Finland), and was an invited scholar at the University of Pretoria (South Africa). He is currently working on research projects involvingelectronic commerce. innovation theory, organizational learning. and global issues in IT. He also serves on the editorial board of Journal ojGioba1 hfornlatiorl ,Mmzagement. Prior to entering the doctoral program at Georg~a State. he worked as a systems integrator. Greg can be reached at [email protected].