HOUSTON MULTIFAMILY - Houston Chapter MULTIFAMILY FebrUArY 2016 Market Watch ... Transwestern’s...
3
HOUSTON MULTIFAMILY FEBRUARY 2016 MARKET WATCH RECENT MULTIFAMILY SALES Brookhollow/Northwest Crossing :: Retreat on Rosslyn 364 units 5801 N Houston Rosslyn Rd Buyer: Rosslyn2016, LLC Seller: Westfield Capital Group Friendswood/Pearland East :: Emerson Park 354 units 1799 FM 528 Buyer: Milestone Apartments REIT Seller: Landmark Apartment Trust Katy/Cinco Ranch/Waterside :: Haven on Westgreen 225 units 510 Westgreen Buyer: CAF Capital Partners & Blue Vista Capital joint venture Seller: Guefen Development Monthly Statistics HOUSTON MSA FEBRUARY 2016 Occupancy 90.4% Price ($/Mo) $967 Rental Rate ($/SF/Mo) $1.10 Average Size (SF) 879 Number of Communities 2,611 Number of Units 607,605 Under Construction (units) 27,941 Units Absorbed (past 12 months) 11,749 % Offering Concessions 29% Average Concession Package 6.6% Source: Apartment Data Services, Inc. Multifamily Sales Statistics HOUSTON MSA UNITED STATES QUARTER TO DATE LAST QUARTER (Q4 2015) TRAILING 12 MONTHS LAST QUARTER (Q4 2015) TRAILING 12 MONTHS Volume ($ Mil) $293.6 $741.5 $4,229.6 $50,548.1 $149,050.2 No. of Properties 15 41 212 2,072 7,894 Total No. of Units 3,483 9,903 58,840 342,379 1,166,740 Avg. Price per Unit $154,733 $65,270 $85,477 $150,437 $136,429 Avg. Cap Rate N/A 6.8% 6.7% 5.8% 5.9% Source: Real Capital Analytics 2015 Houston MSA Overview SUBMARKET RENTABLE UNITS OCCUPANCY RENTAL RATE (PSF) CLASS A CLASS B CLASS C Montrose/Museum/Midtown 10,822 92.1% $1.94 $1.29 $0.72 Highland Village/Upper Kirby/West U 15,209 85.2% $1.79 $1.21 - Med Center/Braes Bayou 20,998 90.4% $1.64 $1.16 $0.95 Heights/Washington Ave 9,466 85.3% $1.74 $1.10 - Downtown 2,428 90.6% $1.99 - - I-10 East/Woodforest/Channelview 11,352 92.5% $1.14 $1.02 $0.88 I-69 North 3,503 91.5% $1.32 $0.99 $0.80 Northline 6,212 94.7% - $0.99 $0.83 Greenspoint/Northborough/Aldine 17,475 93.4% - $1.04 $0.86 FM 1960 East/IAH Airport 8,454 93.0% $1.26 $0.99 $0.82 Lake Houston/Kingwood 11,447 92.7% $1.25 $1.11 $0.86 Northeast Houston/Crosby 3,278 93.1% - $0.82 $0.81 Brookhollow/Northwest Crossing 19,421 93.8% $1.54 $1.08 $0.87 Memorial/Spring Branch 21,276 91.0% $1.49 $1.08 $0.86 Inwood/Hwy 249 6,030 94.7% - $0.80 $0.89 Willowbrook/Champions/Ella 38,773 92.2% $1.32 $1.06 $0.90 Jersey Village/Cypress 14,961 94.2% $1.23 $1.09 $0.91 Bear Creek/Copperfield/Fairfield 15,677 87.1% $1.17 $1.09 $0.93 Katy/Cinco Ranch/Waterside 22,311 80.7% $1.26 $1.09 $0.88 Tomball/Spring 8,864 82.2% $1.23 $1.09 $0.86 Woodlands/South Conroe 16,804 88.9% $1.38 $1.11 $0.88 Conroe North/ Montgomery 7,114 93.3% $1.12 $1.00 $0.84 Hwy 288/Pearland West 10,786 88.4% $1.31 $1.09 $0.78 U of H/I-45 South 17,014 92.4% $1.39 $1.05 $0.86 Beltway 8/I-45 South 13,004 93.6% - $1.04 $0.88 Pasadena/Deer Park/La Porte 22,646 90.6% $1.40 $1.02 $0.86 Friendswood/Pearland East 5,458 94.1% $1.31 $1.09 $0.93 Clear Lake/Webster/League City 23,345 90.9% $1.33 $1.13 $0.93 Baytown 9,397 93.7% $1.35 $1.03 $0.88 Dickinson/Galveston 11,100 93.1% $1.37 $1.04 $0.86 Alvin/Angleton/Lake Jackson 9,609 88.4% $1.42 $1.03 $0.90 Galleria/Uptown 22,983 88.7% $1.73 $1.14 $0.93 Woodlake/Westheimer 11,513 89.9% $1.51 $1.05 $0.95 Energy Corr./CityCentre/Briar Forest 30,700 83.1% $1.51 $1.13 $0.89 Westchase 14,653 89.3% $1.50 $1.14 $0.97 Alief 26,895 93.5% $1.19 $1.04 $0.90 Sharpstown/Westwood 25,538 93.5% $1.03 $0.89 $0.71 Westpark/Bissonnet 16,900 95.4% $1.35 - $0.90 Braeswood/Fondren SW 21,906 91.9% - $1.09 $0.88 Almeda/South Main 4,438 94.0% $1.17 $1.12 $0.82 Sugar Land/Stafford/Sienna 11,905 91.4% $1.38 $1.17 $0.84 Richmond/Rosenberg 4,766 94.2% $1.30 $1.04 $0.86 Total - HOUSTON 606,431 90.6% $1.53 $1.08 $0.88 Source: Apartment Data Services, Inc.
Transcript of HOUSTON MULTIFAMILY - Houston Chapter MULTIFAMILY FebrUArY 2016 Market Watch ... Transwestern’s...

HOUSTON MULTIFAMILYFebrUArY 2016
Market Watch
Recent multifamily sales
Brookhollow/Northwest Crossing :: Retreat on Rosslyn 364 units5801 N Houston Rosslyn RdBuyer: Rosslyn2016, LLC Seller: Westfield Capital Group
Friendswood/Pearland East :: Emerson Park354 units1799 FM 528Buyer: Milestone Apartments REITSeller: Landmark Apartment Trust
Katy/Cinco Ranch/Waterside :: Haven on Westgreen225 units510 WestgreenBuyer: CAF Capital Partners & Blue Vista Capital joint ventureSeller: Guefen Development
Monthly StatisticshOUStON MSa FebrUary 2016
Occupancy 90.4%
Price ($/Mo) $967
Rental Rate ($/SF/Mo) $1.10
Average Size (SF) 879
Number of Communities 2,611
Number of Units 607,605
Under Construction (units) 27,941
Units Absorbed (past 12 months) 11,749
% Offering Concessions 29%
Average Concession Package 6.6%Source: Apartment Data Services, Inc.
Multifamily Sales StatisticshOUStON MSa UNIteD StateS
QUarter tO Date
LaSt QUarter (Q4 2015)
traILING 12
MONthS
LaSt QUarter (Q4 2015)
traILING 12
MONthS
Volume ($ Mil)
$293.6 $741.5 $4,229.6 $50,548.1 $149,050.2
No. of Properties
15 41 212 2,072 7,894
Total No. of Units
3,483 9,903 58,840 342,379 1,166,740
Avg. Price per Unit
$154,733 $65,270 $85,477 $150,437 $136,429
Avg. Cap Rate
N/A 6.8% 6.7% 5.8% 5.9%
Source: Real Capital Analytics
2015 Houston MSA Overview
SUBMARKET RENTABLE
UNITSOCCUPANCY
RENTAL RATE (PSF)
CLASS A CLASS B CLASS C
Montrose/Museum/Midtown 10,822 92.1% $1.94 $1.29 $0.72
Highland Village/Upper Kirby/West U 15,209 85.2% $1.79 $1.21 -
Med Center/Braes Bayou 20,998 90.4% $1.64 $1.16 $0.95
Heights/Washington Ave 9,466 85.3% $1.74 $1.10 -
Downtown 2,428 90.6% $1.99 - -
I-10 East/Woodforest/Channelview 11,352 92.5% $1.14 $1.02 $0.88
I-69 North 3,503 91.5% $1.32 $0.99 $0.80
Northline 6,212 94.7% - $0.99 $0.83
Greenspoint/Northborough/Aldine 17,475 93.4% - $1.04 $0.86
FM 1960 East/IAH Airport 8,454 93.0% $1.26 $0.99 $0.82
Lake Houston/Kingwood 11,447 92.7% $1.25 $1.11 $0.86
Northeast Houston/Crosby 3,278 93.1% - $0.82 $0.81
Brookhollow/Northwest Crossing 19,421 93.8% $1.54 $1.08 $0.87
Memorial/Spring Branch 21,276 91.0% $1.49 $1.08 $0.86
Inwood/Hwy 249 6,030 94.7% - $0.80 $0.89
Willowbrook/Champions/Ella 38,773 92.2% $1.32 $1.06 $0.90
Jersey Village/Cypress 14,961 94.2% $1.23 $1.09 $0.91
Bear Creek/Copperfield/Fairfield 15,677 87.1% $1.17 $1.09 $0.93
Katy/Cinco Ranch/Waterside 22,311 80.7% $1.26 $1.09 $0.88
Tomball/Spring 8,864 82.2% $1.23 $1.09 $0.86
Woodlands/South Conroe 16,804 88.9% $1.38 $1.11 $0.88
Conroe North/ Montgomery 7,114 93.3% $1.12 $1.00 $0.84
Hwy 288/Pearland West 10,786 88.4% $1.31 $1.09 $0.78
U of H/I-45 South 17,014 92.4% $1.39 $1.05 $0.86
Beltway 8/I-45 South 13,004 93.6% - $1.04 $0.88
Pasadena/Deer Park/La Porte 22,646 90.6% $1.40 $1.02 $0.86
Friendswood/Pearland East 5,458 94.1% $1.31 $1.09 $0.93
Clear Lake/Webster/League City 23,345 90.9% $1.33 $1.13 $0.93
Baytown 9,397 93.7% $1.35 $1.03 $0.88
Dickinson/Galveston 11,100 93.1% $1.37 $1.04 $0.86
Alvin/Angleton/Lake Jackson 9,609 88.4% $1.42 $1.03 $0.90
Galleria/Uptown 22,983 88.7% $1.73 $1.14 $0.93
Woodlake/Westheimer 11,513 89.9% $1.51 $1.05 $0.95
Energy Corr./CityCentre/Briar Forest 30,700 83.1% $1.51 $1.13 $0.89
Westchase 14,653 89.3% $1.50 $1.14 $0.97
Alief 26,895 93.5% $1.19 $1.04 $0.90
Sharpstown/Westwood 25,538 93.5% $1.03 $0.89 $0.71
Westpark/Bissonnet 16,900 95.4% $1.35 - $0.90
Braeswood/Fondren SW 21,906 91.9% - $1.09 $0.88
Almeda/South Main 4,438 94.0% $1.17 $1.12 $0.82
Sugar Land/Stafford/Sienna 11,905 91.4% $1.38 $1.17 $0.84
Richmond/Rosenberg 4,766 94.2% $1.30 $1.04 $0.86
total - HOustOn 606,431 90.6% $1.53 $1.08 $0.88
Source: Apartment Data Services, Inc.
MARKET WATCH HOUSTON MULTIFAMILY MARKET FEbRUARY 2016
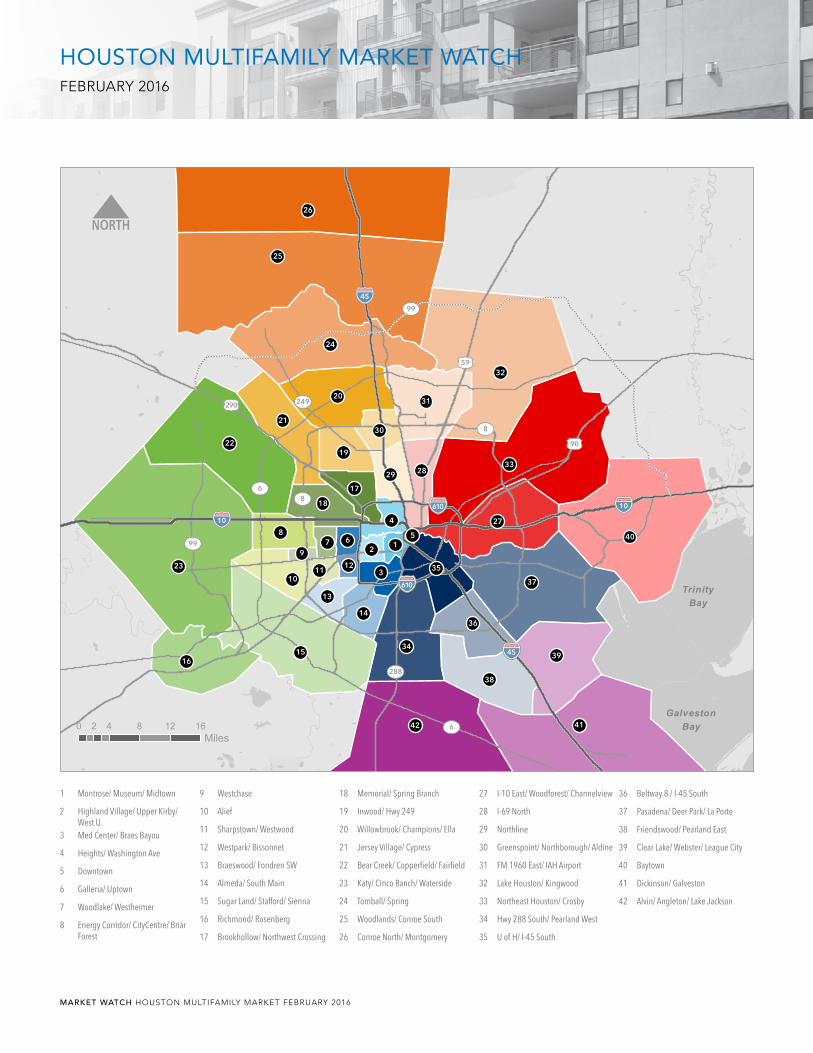
HOUSTON MULTIFAMILY MARKET WATCHFebrUArY 2016
42 41
39
38
37
40
27
33
32
31
2829
30
36
34
35
1516
23
10
13
14
8
97
18
22
21
20
24
25
26
19
17
1112
3
4
21
56
TrinityBay
GalvestonBay
59
290
90
288
249
99
99
6
6
8
8
610
10
45
610
10
45
0 4 8 12 162Miles
1 Montrose/ Museum/ Midtown
2 Highland Village/ Upper Kirby/ West U
3 Med Center/ Braes Bayou
4 Heights/ Washington Ave
5 Downtown
6 Galleria/ Uptown
7 Woodlake/ Westheimer
8 Energy Corridor/ CityCentre/ Briar Forest
9 Westchase
10 Alief
11 Sharpstown/ Westwood
12 Westpark/ Bissonnet
13 Braeswood/ Fondren SW
14 Almeda/ South Main
15 Sugar Land/ Stafford/ Sienna
16 Richmond/ Rosenberg
17 Brookhollow/ Northwest Crossing
18 Memorial/ Spring Branch
19 Inwood/ Hwy 249
20 Willowbrook/ Champions/ Ella
21 Jersey Village/ Cypress
22 Bear Creek/ Copperfield/ Fairfield
23 Katy/ Cinco Ranch/ Waterside
24 Tomball/ Spring
25 Woodlands/ Conroe South
26 Conroe North/ Montgomery
27 I-10 East/ Woodforest/ Channelview
28 I-69 North
29 Northline
30 Greenspoint/ Northborough/ Aldine
31 FM 1960 East/ IAH Airport
32 Lake Houston/ Kingwood
33 Northeast Houston/ Crosby
34 Hwy 288 South/ Pearland West
35 U of H/ I-45 South
36 Beltway 8 / I-45 South
37 Pasadena/ Deer Park/ La Porte
38 Friendswood/ Pearland East
39 Clear Lake/ Webster/ League City
40 Baytown
41 Dickinson/ Galveston
42 Alvin/ Angleton/ Lake Jackson

Copyright © 2016 Transwestern. All rights reserved. No part of this work may be reproduced or distributed to third parties without written permission of the copyright owner. The information contained in this report was gathered by Transwestern from CoStar and other primary and secondary sources believed to be reliable. Transwestern, however, makes no representation concerning the accuracy or completeness of such information and expressly disclaims any responsibility for any inaccuracy contained herein.
HOUSTON MULTIFAMILY MARKET WATCHFebrUArY 2016
SEATTLE
WALNUT CREEK
LOS ANGELES
SALT LAKECITY
DENVER
MINNEAPOLIS
MILWAUKEE
ST. LOUIS
CHICAGO
DETROIT GREENWICHNEW YORK
NEW JERSEY
BALTIMORENORTHERNVIRGINIA
BETHESDAWASHINGTON DC
DALLASFORTWORTH
HOUSTONAUSTIN
SAN ANTONIO
OKLAHOMACITY
NEW ORLEANS
ATLANTA
FORT LAUDERDALEORLANDO
MIAMI-DADE
SANFRANCISCO
PHOENIXORANGE COUNTY
SAN DIEGO
BOSTON
SILICONVALLEY
TRANSWESTERNLOCATIONS
HOustOn multifamily team
Ed CumminsSenior Vice [email protected]
Guadalupe OlivaresAssistant Vice [email protected]
MethODOLOGy
The information in this report is the result of a compilation of publicly available data from a variety of commercial and government sources.
cONtact
Rachel AlexanderDirector of Market [email protected]
t 713.270.7700 f 713.270.6285www.transwestern.net/houston
1900 West Loop South, Suite 1300Houston, Texas 77027
Ryan MendezSenior [email protected]
aBOut tR ansWesteRn
Transwestern is a privately held real estate firm specializing in agency leasing, property and facilities management, tenant advisory, capital markets, research and sustainability. The fully integrated global enterprise leverages competencies in office, industrial, retail, multifamily and healthcare properties to add value for investors, owners and occupiers of real estate. As a member of the Transwestern family of companies, the firm capitalizes on market insights and operational expertise of independent affiliates specializing in development, real estate investment management and research. Transwestern has 34 U.S. offices and assists clients through more than 180 offices in 37 countries as part of a strategic alliance with Paris-based BNP Paribas Real Estate.
Transwestern was founded in Houston, Texas in 1978, and Houston remains the corporate headquarters today. As one of the preeminent commercial real estate firms in Houston, we offer a comprehensive menu of real estate services designed to provide owners, tenants and investors with the optimum solutions for their unique requirements. Transwestern has seasoned veterans in every area of expertise with the integrity, experience and creativity to be the best partner for its clients. Transwestern’s Houston office currently employs over 400 team members and has been an innovator in the Houston market for 38 years.
Tim GregorySenior Vice [email protected]
Michael SnodgrassManaging Director - Structured [email protected]
Jan SparksManaging Director - Structured [email protected]
Kevin RobertsPresident, [email protected]
Kenady DavisVice [email protected]