Houston Community College Final Report
99
Prepared by: Division of Finance and Planning Department of Accounting and Finance Houston Community College System Houston Community College Financial Statements and Single Audit Reports August 31, 2013 and 2012
-
Upload
houstoncommunitycollege -
Category
Education
-
view
866 -
download
10
description
Transcript of Houston Community College Final Report

Prepared by:Division of Finance and Planning
Department of Accounting and FinanceHouston Community College System
Houston Community College Financial Statements and
Single Audit Reports
August 31, 2013 and 2012

HOUSTON COMMUNITY COLLEGE SYSTEM
TABLE OF CONTENTS
ORGANIZATIONAL DATA ............................................................................................ 3
Exhibit/Schedule/
Table
INDEPENDENT AUDITOR'S REPORT ......................................................................... 4
MANAGEMENT'S DISCUSSION AND ANALYSIS (Unaudited) ................................. 6
FINANCIAL STATEMENTS
Statements of Net Position ........................................................................................ 21
Statements of Revenues, Expenses, and Changes in Net Position ............................ 22
Statements of Cash Flows ......................................................................................... 23
Notes to the Financial Statements ............................................................................. 25
Exhibit 1Exhibit 2Exhibit 3
SUPPLEMENTARY SCHEDULES
Schedule of Operating Revenues .............................................................................. 54
Schedule of Operating Expenses by Object .............................................................. 55
Schedule of Non-operating Revenues and Expenses ................................................ 56
Schedule of Net Position by Source and Availability ............................................... 57
Schedule ASchedule BSchedule CSchedule D
STATISTICAL SECTION (Unaudited)
Net Position by Component .................................................................................... 60
Revenues by Source ................................................................................................ 61
Program Expenses by Fmaction ............................................................................... 62
Tuition and Fees ...................................................................................................... 63
Assessed Value and Taxable Assessed Value of Property ...................................... 66
State Appropriations per Full Time Student Equivalents
And Contact Hours ............................................................................................ 67
Principal Taxpayers (Taxable Value) ...................................................................... 68
Property Tax Levies and Collections ...................................................................... 70
Ratios of Outstanding Debt .................................................................................... 71
Table 1Table 2Table 3Table 4Table 5
Table 6Table 7Table 8Table 9

HOUSTON COMMUNITY COLLEGE SYSTEM
TABLE OF CONTENTS
Exhibit/Schedule/
TableSTATISTICAL SECTION (Unaudited) - CONTINUED
Legal Debt Margin Information .............................................................................. 72
Pledged Revenue Coverage ..................................................................................... 73
Demographic and Economic Statistics - Taxing District ........................................ 74
Principal Employers ................................................................................................ 75
Faculty, Staff, and Administrators Statistics ........................................................... 76
Enrollment Details .................................................................................................. 77
Student Profile ......................................................................................................... 78
Contact Hours .......................................................................................................... 79
Transfers to Senior Institutions ............................................................................... 80
Capital Asset Information ....................................................................................... 81
Table 10Table 11Table 12Table 13Table 14Table 15Table 16Table 17Table 18Table 19
SINGLE AUDIT REPORTS AND SCHEDULE OF EXPENDITURESOF FEDERAL AND STATE OF TEXAS AWARDS
Report on Internal Control over Financial Reporting and onCompliance and Other Matters Based on an Audit ofFinancial Statements Performed in Accordance with
Government Auditing Standards ........................................................................ 83
Independent Auditor's Report on Compliance for each Major Programand on Internal Control over Compliance in Accordance withOMB Circular A-133 and the State of Texas Single Audit Circular .................. 85
Schedule of Expenditures of Federal Awards ........................................................... 87
Notes to the Schedule of Expenditures of Federal Awards ....................................... 91
Schedule of Expenditures of State of Texas Awards ................................................ 93
Notes to the Schedule of Expenditures of State of Texas Awards ............................ 94
Schedule of Findings and Questioned Costs ............................................................. 96
Summary Schedule of Prior Audit Findings ............................................................. 98
Schedule E
Schedule F

HOUSTON COMMUNITY COLLEGE SYSTEMORGANIZATIONAL DATA
FOR THE YEAR ENDED AUGUST 31, 2013
BOARD OF TRUSTEES
OFFICERS OF THE BOARD OF TRUSTEES
Bruce A. AustinSandie MullinsEva L. Loreda
ChairmanVice ChairwomanSecretary
MEMBERS OF THE BOARD OF TRUSTEESTerm ExpiresDecember 31,
Yolanda Navarro FloresBruce A. Austin, ChairNeeta SaneHerlinda GarciaSandie Mullins, Vice ChairEva L. Loreda, SecretalyCarroll G. RobinsonLeila FeldmanChristopher W. Oliver
Houston TexasHouston TexasHouston TexasHouston TexasHouston TexasHouston TexasHouston TexasHouston TexasHouston Texas
201320132013201520152015201720172017
PRINCIPAL ADMINISTRATIVE OFFICERS
Renee Byas
Thomas Estes, Ph.D.
Charles M. Cook, Ed.D.
William Carter, Ph.D.
Janet May, M.AIrene Porcarello, Ed.D
William Harmon, Ph.D.
Betty Young, Ph.DMargaret Ford Fisher, Ed.D.
Zachary Hodges, Ed.D.Orfelina Garza, Ph.D.
Winston Dabse, MBADiana Pino, Ph.D.
Karla Bender, Ed.D.
Ronald Defalco, CPA
Acting ChancellorVice Chancellor/Finance & PlanningVice Chancellor, Academic AffairsVice Chancellor, Information TechnologyChief Human Resources Officer
President, Southeast College
President, Central College
President, Coleman College of Health Sciences
President, Northeast CollegePresident, Northwest College
President, Southwest CollegeChief Administration OfficerVice Chancellor, Student Services
ControllerTreasurer

CRI°ARRRIGGS &INGRAM
Carr, Riggs & Ingram, LLC
Two Riverway, 15th Floor
Houston, Texas 77056
CPAs and Advisors (713) 621-8090
(713) 621-6907 (fax)
www, cricpa,com
INDEPENDENT AUDITOR'S REPORT
Board of TrusteesHouston Community College SystemHouston, Texas
Report on the Financial Statements
We have audited the accompanying financial statements of Houston Community College System (the "System")as of and for the year ended August 31, 2013, and the related notes to the fmancial statements, which collectively
comprise the System's basic fmancial statements as listed in the table of contents.
Management's Responsibility for tit e Financial Statements
Management is responsible for the preparation and fair presentation of these fmancial statements in accordance
with accounting principles generally accepted in the United States of America; this includes the design,implementation, and maintenance of internal control relevant to the preparation and fair presentation of financialstatements that are free from material misstatement, whether due to fraud or error.
Auditor's Responsibility
Our responsibility is to express an opinion on these financial statements based on our audit. We conducted ouraudit in accordance with auditing standards generally accepted in the United States of America and the standards
applicable to financial audits contained in Government Auditing Standards, issued by the Comptroller Generalof the United States. Those standards require that we plan and perform the audit to obtain reasonable assurance
about whether the financial statements are free from material misstatement.
An audit involves performing procedures to obtain audit evidence about the amounts and disclosures in thefinancial statements. The procedures selected depend on the auditor's judgment, including the assessment ofthe risks of material misstatement of the financial statements, whether due to fraud or error. In making thoserisk assessments, the auditor considers internal control relevant to the entity's preparation and fair presentationof the financial statements in order to design audit procedures that are appropriate in the circumstances, but not
for the purpose of expressing an opinion on the effectiveness of the entity's internal control. Accordingly, weexpress no such opinion. An audit also includes evaluating the appropriateness of accounting policies used andthe reasonableness of significant accounting estimates made by management, as well as evaluating the overallpresentation of the financial statements.
We believe that the audit evidence we have obtained is sufficient and appropriate to provide a basis for our auditopinion.
Opinion
In our opinion, the fmancial statements referred to above present fairly, in all material respects, the fmancialposition of Houston Community College System as of August 31, 2013, and the respective changes in financialposition and its cash flows for the year then ended in accordance with accounting principles generally accepted inthe United States of America.
Other Matters
The financial statements of Houston Community College System as of August 30, 2012, were audited by otherauditors whose report dated November 8, 2012, expressed an unmodified opinion on those statements.
Required Supplementary Information
Accounting principles generally accepted in the United States of America require that the management'sdiscussion and analysis on pages 6 through 20 be presented to supplement the basic financial statements. Suchinformation, although not a part of the basic fmancial statements, is required by the Governmental AccountingStandards Board, who considers it to be an essential part of financial reporting for placing the basic financialstatements in an appropriate operational, economic, or historical context. We have applied certain limitedprocedures to the required supplementary information in accordance with auditing standards generally accepted inthe United States of America, which consisted of inquiries of management about the methods of preparing theinformation and comparing the information for consistency with management's responses to our inquiries, thebasic financial statements, and other knowledge we obtained during our audit of the basic financial statements. Wedo not express an opinion or provide any assurance on the information because the limited procedures do notprovide us with sufficient evidence to express an opinion or provide any assurance.
Other Information
Our audit was conducted for the purpose of forming an opinion on the financial statements that collectivelycomprise the System's basic financial statements. The supplementary schedules on pages 54 through 57 andstatistical section on pages 60 through 81 are presented for purposes of additional analysis and are not a required
part of the financial statements. The schedule of expenditures of federal awards and schedule of expenditures of
state of Texas awards are presented for purposes of additional analysis as required by U.S. Office of Management
and Budget Circular A-133, Audits of States, Local Governments, and Non-Profit Organizations and the Stateof Texas Single Audit Circular and are also not a required part of the basic fmancial statements.
The supplementary schedules, the schedule of expenditures of federal awards and the schedule of expenditures of
state of Texas awards are the responsibility of management and were derived from and relates directly to theunderlying accounting and other records used to prepare the basic financial statements. Such information has beensubjected to the auditing procedures applied in the audit of the basic financial statements and certain additionalprocedures, including comparing and reconciling such information directly to the underlying accounting and other
records used to prepare the basic financial statements or to the basic financial statements themselves, and otheradditional procedures in accordance with auditing standards generally accepted in the United States of America.
In our opinion, the supplementary schedules, schedule of expenditures of federal awards and schedule ofexpenditures of state of Texas awards are fairly stated in all material respects in relation to the basic financialstatements as a whole.
The statistical section has not been subjected to the auditing procedures applied in the audit of the basic financial
statements, and accordingly, we do not express an opinion or provide any assurance on it.
Other Reporting Required by Government Auditing Standards
In accordance with Government Auditing Standards, we have also issued our report dated November 14, 2013,on our consideration of the System's internal control over financial reporting and on our tests of its compliance
with certain provisions of laws, regulations, contracts, and grant agreements and other matters. The purpose ofthat report is to describe the scope of our testing of internal control over financial reporting and compliance andthe results of that testing, and not to provide an opinion on internal control over financial reporting or oncompliance. That report is an integral part of an audit performed in accordance with Government AuditingStandards in considering the System's internal control over financial reporting and compliance. That report is anintegral party of an audit performed in accordance with Gove#Tmwnt Auditing Standards in considering theSystem's internal control over financial reporting and compliance.
Houston, TexasNovember 14, 2013

HOUSTON COMMUNITY COLLEGE SYSTEMMANAGEMENT'S DISCUSSION AND ANALYSIS
(Unaudited)
This section of the Houston Community College System's ("HCC" or the "System") Annual Financial Reportpresents management's discussion and analysis. Management's Discussion and Analysis is included to provide anarrative introduction, overview and analysis of the financial position and changes in financial position of theSystem's financial activity during the fiscal years ended August 31, 2013 and 2012. Since management'sdiscussion and analysis is designed to focus on current activities, and currently known facts, please read this inconjunction with the System's basic financial statements and the notes thereto. Responsibility for thecompleteness and fairness of this information rests with the management of the System.
Financial Highlights
In fiscal year 2013, the System continued its efforts toward stabilization of its financial resources; identifying andimplementing transformational strategies at the institutional level to reduce spending and address the issuesbrought on due to the State funding shortfall. Also, on-going strategic plans have been formulated to lay thefoundation for further growth in enrollment and increased student success.
The System launched a three-year strategic plan, Creating Opportunities for Our Shared Future, with seveninitiatives that will guide us through 2015. These goals have been approved by the Board of Trustees for 20122015 and implemented as part of the System's strategy and focus on student success.
Goal 1: Increase Student Completion through Advanced Educational OpportunitiesHCC currently leads the state and is fifth in the nation in the number of students who completeassociate degrees. While we are proud of this fact, we can do better. We will strengthen our efforts andscale up those strategies that have been proven to increase the rates of students' persistence andcompletion. We will continue to serve as a national Achieving the Dream (ATD) Leader College andwork hand in hand with our high school partners to ensure more students enter our doors college-readyand leave well-prepared for successful transition to jobs, careers, and further education.
Goal 2: Respond to the Needs of Business and Industry for Skilled WorkersAs the supplier of skilled workers to business and industry, we have a responsibility to buildparmerships and to develop the means to respond quickly with the creation and design of programs andstudent-learning outcomes that meet their requirements. The employer is our customer. Our clearresponsibility to both employers and to students is to narrow the jobs gap and the skills gap for both ofthese stakeholders.
Goal 3: Ensure Instructional Programs Provide the Knowledge and Skills Required for 21st CenturyLearnersHCC must prepare our students to become citizens and workers capable of productive and meaningfulparticipation in the 21st century. Core competencies of critical thinking, effective communications,quantitative reasoning, teamwork, personal responsibility, and social responsibility must be taught inall of our instructional programs. All classrooms at HCC should meet minimum technology standards,and all faculty members must be trained and supported in using effective teaching and learningstrategies to promote success for students in their learning today as well as throughout their lifetime.
Goal 4: Enrich Institutional Capacity for Faculty and Staff Professional Development and StudentLeadership DevelopmentHCC has celebrated its 40th year by enrolling and graduating more students than ever before. Toensure we continue to thrive as an essential and relevant institution for the educational development ofour students and the economic development of our community, we must prepare students, faculty, andstaff for the leadership roles of tomorrow. We will do this in multiple ways - through the expansion ofexternal resources and support, purposeful mentoring of leadership candidates, infusion ofopportunities for leadership development in our instructional programs, student services,extracurricular activities, and human resources.

HOUSTON COMMUNITY COLLEGE SYSTEMMANAGEMENT'S DISCUSSION AND ANALYSIS
(Unaudited)
Goal 5: Support Innovation as a Means to Improve Institutional ResilienceHCC recognizes that in the near term there will be continuing economic turmoil to challenge thefunding and stability of the institution. We also recognize that continuous technical challenges willcreate disruptions and opportunities in the delivery and transfer of knowledge and data. To counter andovercome these difficulties, we must be an institution where innovation is valued and promoted.However, nothing will be accepted merely on the basis of custom, anecdote, or fad - everything we domust be proven to have long-term value in terms of strengthening our institutional resilience andcapacity to serve our students and our community.
Goal 6: Cultivate an Entrepreneurial Culture Across the InstitutionHouston is an entrepreneurial, "opportunity city" where taking a risk, failing, and starting over againare valued. HCC is the "Oppommity College" and is grassroots in its approach to serving itsconstituents. Therefore, HCC is committed to strategic thinking that not only respects studentswherever they are, but also inspires and gives them the tools and confidence to follow their dreams.HCC will commit to an entrepreneurial culture within the organization to serve as an example of the"spirit of Houston." For this institution, fostering a culture that encourages inspiration and dreaminghelps students actualize their potential.
Goal 7: Leverage Local and International Partnerships for Institutional and Community DevelopmentHouston is a global leader. The diversity of our economic structure and our willingness to embrace andvalue the parmerships encourage innovation. HCC is a principle partner for educational and economicopportunities, enhancing and advancing the community's quality of life. HCC is a catalyst for creatingjobs. According to an American Council on Higher Education Blue Ribbon Panel on GlobalEngagement (November, 2011), "It is important that college graduates, whatever their location, be notonly globally competitive but also globally competent, understanding their roles as citizens andworkers in an international context. While identifying common problems, we might also discovercommon solutions (p.6)."
These are all important to moving the institution to the next level; however the focus is on student success and isHCC's #1 priority.
HCC has become a leader and not a follower among its peers. The 2012-2015 Strategic Plan ensures institutionalresiliency to weather the budgetary storms that plague all governmental agencies and the looming crisis of humancapital due to an aging faculty and staff.
As the college takes on what is a bold and dramatic step in Houston's furore, there must be an equal commitmentto change or to break old molds and to reallocate resources to fit the priorities of the 21st century. These next threeyears will be critical to what HCC is to become - essential to this community, the global Houston.
All of these action steps are designed to aid the System in realizing its bold vision: "To become the most relevantcommunity college in the country."
HCC continues to experience positive progress in building and creating innovative ways to progress in theclassroom. That progress is measurable, meaningful, and making a dramatic impact on our community and thestudents we are entrusted to serve. With the support of the Board of Trustees, faculty, and staff, we have madeconsiderable strides in support of the institution's student recruitment, retention, and completion goals.
In conjunction with our efforts to align the institution around putting students first, there is no goal more visibleand important to the community and our students than the fiscal well-being and transparency ofHCC's fmancialpicture.

HOUSTON COMMUNITY COLLEGE SYSTEMMANAGEMENT'S DISCUSSION AND ANALYSIS
(Unaudited)
HCC is fiscally sound and financially prepared for the future. The demonstration is visible in our financialstatements herein which highlights the institution's total net position of $339 million; a net increase of $16.7million compared with the previous fiscal year. HCC also continues to maintain a Standard & Poor's bondrating of AA+; a rating that did not change with the last bond issuance.
In November 2012, a general election was held in which the public approved the issuance of $425 million ingeneral obligation bonds. In March 2013, the System issued $398,775,000 in Limited Tax General ObligationBonds, Series 2013 at a premium of approximately $55 million. The bonds will be used for the construction,maintenance, and equipment of school buildings in the System and the purchase of necessary sites.
Fiscal Planning and Budget
A successful budget development process involves two elements: (1) it aligns scarce resource allocation with themission, vision and planning of the organization using data and (2) it conducts the process in an open, transparentway such that members of the organization find it to be fair. Recognizing that planning and budgeting is aninterrelated process which requires continuous review, assessment, and improvement, in fiscal year 2010, HCCdeveloped an Institutional Effectiveness (IE) Model that shows how it is actually done. Phase I of the process, thestrategic review, was implemented in fiscal year 2011. Phase II commenced in January 2012; incorporating theannual planning and budget development process. In fiscal year 2013, Phase III was implemented to include anenhanced prioritization process. This exercise was designed to derive strategic investments across the colleges andadministrative units that are in the best interest of HCC as a whole.
The purpose of the integrated strategic planning and budgeting process is to create a standardized annual processthat links strategic priorities and goals with budget planning. The process is intended to provide a consistentapproach for instructional and administrative divisions and departments, to allow for timely preparation of thebudget, and to clearly link instructional, departmental, and college activities and initiatives with institutionalpriorities and goals.
As part of the process, college and administrative unit annual plans are developed and represent the strategicaspect of engaging in integrated and institution-wide research-based planning. Although the plans are on a fouryear cycle, there is an annual component that is in the Operational/Procedures Loop and is linked to budgeting. Anessential element for success within this process entails continuous communication, collaboration, andtransparency.
This document provides an over-view of the collaborative work of the administration in representing the financialhighlights of the institution.
Statement of Net Position
The Statement of Net Position represents the System's fmancial position at the end of the fiscal year and includesall assets and liabilities of the System. Net Position is the difference between assets and liabilities and serves as ageneral indicator of financial stability.
Current liabilities are generally those liabilities which are due within one year, and current assets are those assetswhich are available to satisfy current liabilities. Noncurrent assets include restricted cash and cash equivalents,capital assets, investments and other assets not classified as current. Noncurrent liabilities include bonds payableand other long-term commitments.

HOUSTON COMMUNITY COLLEGE SYSTEMMANAGEMENT' S DISCUS SION AND ANALYSIS
(Unaudited)
Statement of Net Position - Continued
The Statement of Net Position includes all assets and liabilities using the accrual basis of accounting. The accrualbasis of accounting is similar to the accounting basis utilized by most private-sector institutions. This statementdefines the financial position of the System and includes a comparison for fiscal years 2013, 2012 and 2011.
Change
ASSETS: 2013 2012" 2011 2012 to 2013 2011 to 2012
Other Assets $ 709,985,878 $ 321,739,059 $ 313,162,868 $ 388,246,819 $ 8,576,191
Capital Assets 782,119,403 726,798,884 696,519,999 55,320,519 30,278,885
TOTAL ASSETS $ 1,492,105,281 $ 1,048,537,943 $ 1,009,682,867 $ 443,567,338 $ 38,855,076
DEFEILRED OUT FLOWS
OF RESOURCES:
Advance Funding Valuation $ 8,681,035 $ 9,389,394 $ $ (708,359) 5; 9,389,394
LIABILITIES:
Current Liabilities 5; 113,309,337 5; 107,472,707 $ 123,995,933 $ 5,836,630 5; (16,523,226)
Noncurrent Liabilities 1,048,413,740 628,137,837 603,262,244 420,275,903 24,875,593
TOTAL LIABILITIES $ 1,161,723,077 $ 735,610,544 5; 727,258,177 $ 426,112,533 5; 8,352,367
NET POSITION:
Investment in Plant, Net 5; 230,705,769 $ 234,824,583 5; 207,976,763 $ (4,118,814) $ 26,847,820
Restricted-Expendable 1,215,548 488,477 488,477 727,071
Unrestricted 107,141,922 87,003,733 73,959,450 20,138,189 13,044,283
TOTAL NET POSITION 5; 339,063,239 5; 322,316,793 $ 282,424,690 5; 16,746,446 $ 39,892,103
*Fiscal Year 2012 has been restated
Assets
Fiscal Year 2013:
In comparing fiscal year 2013 to fiscal year 2012, there was an increase of $396 million in cash and cashequivalents, short-term investments, and long-term investments. This increase is due mainly due to investmentsresulting from the issuance of the Limited Tax General Obligation Bonds, Series 2013 of $454.2 million, net of$58.5 million spent on capital assets.
Overall returns on investments increased by .03% in fiscal 2013 to a weighted average interest rate of .38% atAugust 31, 2013. The investment portfolio is highly liquid with 92% of the assets invested in local governmentpools, money market funds and short-term certificates of deposit. All pools and money market funds are rated atthe highest level. Certificates of deposit, high yield savings and other bank deposits are secured with U.S.Treasuries or United States agencies which have the full faith and credit of the United States government. Thebalance of the portfolio is invested in government-sponsored entities/agencies with "AAA" credit ratings.

HOUSTON COMMUNITY COLLEGE SYSTEMMANAGEMENT' S DISCUSSION AND ANALYSIS
(Unaudited)
Statement of Net Position - Continued
Fiscal Year 2012:
In comparing fiscal year 2012 to fiscal year 2011, there was an increase of $14.3 million in cash and cashequivalents, short-term investments, and long-term investments. This increase is due mainly due to investmentsresulting from the issuance of the Maintenance Tax Notes, Series 2011A of $19.6 million, $8.6 million savingson defeasance of bonds, $24.2 million generated from operations, and net of $38.1 million spent on capitalassets.
Overall returns on investments increased by.08% in fiscal 2012 to a weighted average interest rate of .31%. Theinvestment portfolio is highly liquid with 92% of the assets invested in local government pools, money marketfunds and short-term certificates of deposit. All pools and money market funds are rated at the highest level.Certificates of deposit, high yield savings and other bank deposits are secured with U.S. Treasuries or UnitedStates agencies which have the full faith and credit of the United States government. The balance of theportfolio is invested in government-sponsored entities/agencies with "AAA" credit ratings.
Deferred Outflows of Resources
The System adopted GASB Statement No. 63, Financial Reporting of Deferred Outflows of Resources,Deferred Inflows of Resources, and Net Position during fiscal year 2013. The System's deferred charge onrefunding of debt is now reported as a deferred outflow of resources as the amount is deferred and amortizedover the life of the refunded debt. Prior to the adoption of GASB Statement No. 63, this amount was reportedwith long-term bonds payable.
Liabilities
Fiscal Year 2013:
Overall liabilities increased by approximately $425 million from fiscal 2012 to fiscal 2013. General obligationbonds increased by $459.6 million, due to the issuance of the Limited Tax General Obligation Bonds, Series2013 on March 19, 2013. Principal payments of $7.6 million were made on all maintenance tax notes. Therewere principal payments made on all revenue bonds of $13.3 million and principal payments of $3.9 millionwere made on PFC lease revenue bonds.
Fiscal Year 2012:
Overall liabilities decreased by approximately $1.5 million from fiscal 2011 to fiscal 2012. Notes payableincreased by $14.4 million due to the issuance of the Maintenance Tax Notes, Series 2011A of $19.6 million onOctober 12, 2011. Principal payments of $6.3 million were made on all maintenance tax notes. Revenue bondsincreased by approximately $3.4 million due to the issuance of Senior Lien Revenue Bonds, Series 2011T onNovember 15, 2011 of $16.0 million. There were principal payments made on all revenue bonds of $12.7million. Principal payments of $3.7 million were made on PFC lease revenue bonds. General obligation bondsdecreased by $4.4 million due to the issuance of the Limited Tax Refunding Bonds, Series 2011 on October 12,2011 of $109.5 million, net of the defeasance of the Limited Tax Bonds, Series 2003 of $112.2 million anddefeasance of the Limited Tax Building and Refunding Bonds, Series 2005 of $4.9 million. Capital leaseobligations decreased by $1.3 million due to principal payments. There was a decrease in accounts payable of$6.1 million and a decrease in accrued liabilities of $.7 million. Unearned revenues decreased by $3.2 million.
10

HOUSTON COMMUNITY COLLEGE SYSTEMMANAGEMENT'S DISCUSSION AND ANALYSIS
(Unaudited)
Statement of Revenues, Expenses and Chan es in Net Position
The Statement of Revenues, Expenses and Changes in Net Position present the System's results of operationsfor the fiscal year. Operating revenues are generated from the services provided to students and other customersof the System. Operating expenses include those costs incurred in the production of goods and services whichresult in operating revenues, as well as depreciation and amortization. All other activity is classified asnonoperating revenues, expenses, gains and losses. Since a large portion of the revenue including Ad valoremtaxes, State appropriations and Title IV funds are classified as nonoperating revenues; Texas public communitycolleges may reflect an operating loss with the increase or decrease in net position reflective of all activity.
Total revenues and total expenses should be considered in assessing the change in the System's financialposition. When total revenues exceed total expenses, the result is an increase in net position. When the reverseoccurs, the result is a decrease in net position. Further detail is presented in the Statements of Revenues,Expenses and Changes in Net Position and notes to the financial statements.
A summarized comparison of the System's revenues, expenses and changes in net position for the years endedAugust 31, 2013, 2012, and 2011 is presented in table below.
Change
2013 2012 2011 2012 to 2013 2011to 2012Operating Revenues $ 111,074,122 $ 112,435,472 $ 106,884,254 $ (1,361,350) $ 5,551,218
Operating Expenses 360,977,093 342,878,460 357,021,152 18,098,633 (t4,142,692)
Operating Los s (249,902,971) (230,442,988) (250,136,898) (19,459,983) 19,693,910
No no perating Revenue,Net 266,649,417 270,335,091 265,016,893 (3,685,674) 5,318,198
Increase (Decrease)
in Net Position $ 16,746,446 $ 39,892,103 $ 14,879,995 $ (23,145,657) $ 25,012,108
*Fiscal year 2012 has been restated
Revenues
Operating revenues decreased 1% in fiscal year 2013 as compared to fiscal year 2012 namely due to a decreasein Federal Grants and Contract revenue. Non-operating revenues decreased by 1.9% over the previous year dueto decreases in Title IV grants and a decrease in other nonoperating revenue. There was a $0.9 million decreasein investment income in fiscal 2013 related to unrealized losses of $1.6 million on the portfolio as of August 31,2013. Actual interest earned for fiscal 2013 was $1.5 million.
Operating revenues increased 5.2% in fiscal year 2012 as compared to fiscal year 2011 namely due to increasesin tuition and fee rates, in-district and out-of-district fees, and technology fees. Non-operating revenuesincreased by 5.6% over the previous year due to increases in Title IV grants and an increase in tax revenueresulting from the restructuring of debt service. Also, there was a $0.2 million increase in investment income infiscal 2012 related to a 0.31% increase in interest rates
11

HOUSTON COMMUNITY COLLEGE SYSTEMMANAGEMENT'S DISCUSSION AND ANALYSIS
(Unaudited)
Statement of Revenues Expenses and Changes in Net Position- Continued
Revenues - Continued
Revenue by SourceAugust 31, 2013
Title IV Grants22%
Gifts and Others
2%
Property
Taxes:
31%
Grants,
& Auxiliary9%
State19%
Tuition & Fees,
Net of Discounts17%
Revenue by SourceAugust 31, 2012
Title IV Grants
24%
Gifts and Others3%
PropertyTaxes:
29%
Grants, Contracts
& Auxiliary9%
State Fund19%
Tuition & Fees,
Net of Discounts
16%
12

HOUSTON COMMUNITY COLLEGE SYSTEMMANAGEMENT'S DISCUSSION AND ANALYSIS
(Unaudited)
Statement of Revenues, Expenses and Chan es in Net Position - Continued
Revenue by Source
2013
OPERATING REVENUES:Tuition & Fees, Net of Discounts $ 71,433,953 $
2012"
71,415,957 $
Change2011 2012 to 2013 2011 to 2012
67,907,897 $ 17,996 3,508,060
Grants, Contracts & Auxiliary
Federal 14,702,419 16,848,269 16,064,089 (2,145,850) 784,180State 6,156,585 5,152,251 6,448,589 1,004,334 (1,296,338)
LocaL Pr ate & Non-Govemmental 2,688,266 2,922,500 1,927,765 (234,234) 994,735
Auxqliary 16,092,899 16,096,494 14,535,914 (3,595) 1,560,580Total Grants, Contracts & Auxiliary 39,640,169 41,019,514 38,976,357 (1,379,345) 2,043,157
TO TAL OPERATING REVENUES 111,074,122 112,435,471 106,884,254 (1,361,349) 5,551,217
NONOPERATING REVENUES:State Funds:
Unrestricted 70,014,003 70,232,038 65,788,668 (218,035) 4,443,370
Restricted 12,091,225 11,607,788 19,049,647 483,437 (7,441,859)
Total State Funds 82,105,228 81,839,826 84,838,315 265,402 (2,998,489)
Local Property Taxes:
Maintenance and Operat ns 106,097,476 105,943,722 94,083,625 153,754 11,860,097
Debt Service 23,158,801 17,694,297 21,736,440 5,464,504 (4,042,143)
Total Local Prope y Taxes 129,256,277 123,638,019 115,820,065 5,618,258 7,817,954
Title IV Grants 94,423,841 102,023,662 96,171,936 (7,599,821) 5,851,726
Gifts and Others:
GiRs 1,591,888 2,053,638 1,573,601 (461,750) 480,037Other 6,417,420 10,145,084 6,588,259 (3,727,664) 3,556,825
Total Gifts and Other 8,009,308 12,198,722 8,161,860 (4,189,414) 4,036,862
TOTAL NONOPERATINGREVENUES 313,794,654 319,700,229 304,992,176 (5,905,575) 14,708,053
TOTAL REVENUES $ 424,868,776 $ 432,135,700 $ 411,876,430 $ (7,266,924) $ 20,259,270
* Operating and nonoperating revenues are restated for fiscal year 2012
13
HOUSTON COMMUNITY COLLEGE SYSTEMMANAGEMENT'S DISCUSSION AND ANALYSIS
(Unaudited)
Statement of Revenues, Expenses and Changes in Net Position -Continued
Expenses
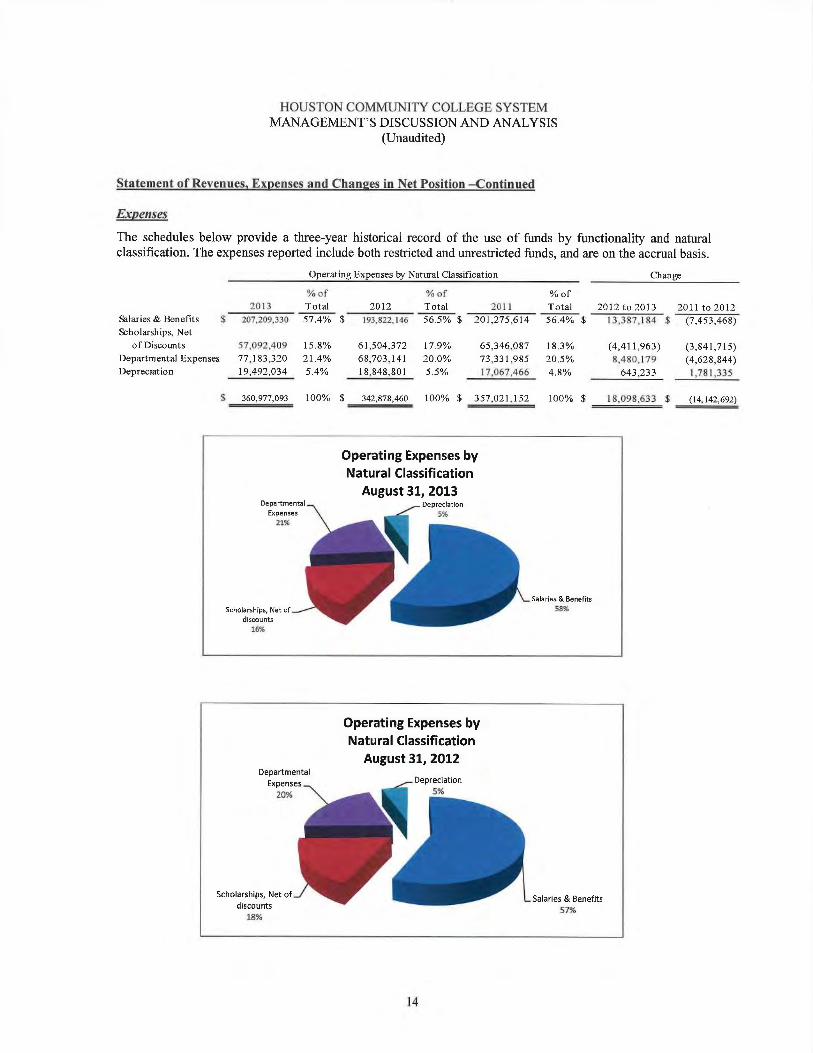
The schedules below provide a three-year historical record of the use of funds by functionality and naturalclassification. The expenses reported include both restricted and unrestricted funds, and are on the accrual basis.
2013
Salaries & Benefits $ 207,209,330
Scholarships, Net
of Discounts 57,092,409
Departmental Expenses 77,183,320
Depreciation 19,492,034
Operating Expenses by Natural Classification Change
% of % of % ofTotal 2012 Total 2011 Total 2012 to 2013 2011 to 201257.4% $ 193,822,146 56.5% $ 201,275,614 56.4% $ 13,387,184 $ (7,453,468)
15.8% 61,504,372 17.9% 65,346,087 18.3% (4,411,963) (3,8411715)
21.4% 68,703,141 20.0% 73,331,985 20.5% 8,480,179 (4,628,844)
5.4% 18,848,801 5.5% 17,067,466 4.8% 643,233 1,781,335
$ 360,977,093 100% $ 342,878,460 100% $ 357,021,152 100% $ 18,098,633 $ (14,142,692)
Operating Expenses byNatural Classification
August 31, 2013
Expenses2i%
5%
Scholarships,discounts
16%
& Benefits
58%
Departmental
20%
Operating Expenses byNatural Classification
August 31, 2012
Depreciation5%
Scholarships, Netdiscounts
18%
_ Salaries & Benefits57%
14

HOUSTON COMMUNITY COLLEGE SYSTEMMANAGEMENT'S DISCUSSION AND ANALYSIS
(Unaudited)
Statement of Revenues Expenses and Chan es in Net Position - Continued
Operating Expenses by Functional Classification Change
2013 Total 2012" Total 2011 Total 2012 to 2013 2011 to 2012
Instructional $ 107,489,818 29.8% $ 100,319,497 29.3% $ 112,617,878 31.5% $ 7,170,321 $ (12,298,381)
Public Service 11,532,590 3.2% 11,868,925 3.5% 11,766,675 3.3% (336,335) 102,250
Academic Support 23,946,350 6.6% 22,771,173 6.6% 19,616,391 5.5% 1,t75,177 3,154,782
Student Services 27,822,091 7.7% 24,906,487 7.3% 31,901,438 8.9% 2,915,604 (6,994,951)
Institutional Support 67,226,240 18.6% 58,952,631 17.2% 55,747,070 15.6% 8,273,609 3,205,561
Operation Management 27,614,804 7.7% 27,969,778 8.2% 28,350,817 7.9% (354,974) (381,039)
Scholarship/Fellowship 57,092,409 15.8% 61,504,372 17.9% 65,346,087 18.3% (4,411,963) (3,841,715)
Depreciation 19,492 034 5.4% 18,848,802 5.5% 17,067,466 4.8% 643,232 t,781,336
Auxiliary Enterprises 18,760,757 5.2% 15,736,795 4.6% 14,607,330 4.1% 3,023,962 t,129,465
TotalExpense $ 360,977,093 100% $ 342,878,460 100% $ 357,021,152 100% $ 18,098,633 $ (14,142,692)
* Fiscal year 2012 has been restated
Operating expenses increased in fiscal year 2013 by $18.1 million or 5.3% compared to fiscal year 2012namely due to the following:
• Increase in employee benefits costs related to the reduction in the State's contribution to TRS and ORPand an increase in health insurance premiums.
• Payment of the 2012 TRS contribution, in the amount of $2.5 million, which was withheld at theadvisement of TACC due to pending litigation.
• Increased new hires to enhance student services and investment in instructional materials and softwareneeded for online course improvements.
Operating expenses decreased in fiscal year 2012 by $14.1 million or 4% compared to fiscal year 2011 namelydue to a cost savings program implemented to help offset the decrease in state funding.
Statements of Cash Flows
The Statements of Cash Flows provide information about the sources of cash and the use of cash in theoperations of the System. The Statements of Cash Flows help determine the entity's ability to meet itsobligations as they come due and the impact of external financing. The Statement summarizes cash inflows andoutflows by operating activities, non-capital financing activities, capital financing activities and investingactivities.
15

HOUSTON COMMUNITY COLLEGE SYSTEMMANAGEMENT'S DISCUSSION AND ANALYSIS
(Unandited)
Capital Assets and Debt Administration
Fiscal Year 2013:
Changes in net capital assets are the result of acquisitions, improvements, deletions and changes in accumulateddepreciation and amortization. In accordance with GASB Statements No. 34 and 35, the System does notrecord the cost of capital assets as an expense at the time of acquisition or completion of the asset, but rathershows the expense systematically over the expected life of the asset as depreciation and amortization expense.The amount shown in the accounting records for the value of the asset will decrease each year until the asset isfully depreciated or removed from service. As a result, the amount of capital assets shown in the Statements ofNet Position may decrease from one year to another, even though new assets have been acquired during theyear. Capital assets subject to depreciation and amortization include improvements to land (such as parking lotsand signage), buildings, library books, furniture and equipment. Land is not depreciated.
There was a significant increase in net capital assets of approximately $55.3 million from fiscal 2012 to fiscal2013. This increase was due to primarily to a $43.2 million net increase in construction in progress, an increasein land of $3.9 million, an increase in building, real estate improvement and equipment of $8.2 million (net ofaccumulated depreciation) which were funded from various bond proceeds. See Footnote 6 of the financialstatements.
Fiscal Year 2012:
There was a significant increase in net capital assets of approximately $30.3 million from fiscal 2011 to fiscal2012. This increase was due primarily to an $11.7 million net increase in construction in progress, an increasein land of $11.0 million, and increases in buildings, real estate improvements and equipment of $9.0 million(net of accumulated depreciation) which were funded from various bond proceeds. See Footnote 6 of thefinancial statements.
Change
Capital Assets: 2013 2012" 2011 2012 to 2013 2011 to 2012Land $114,019,I47 $110,100,164 $99,081,861 $3,918,983 $11,018,303Construction in Progress 114,762,207 71,553,414 59,856,934 43,208,793 11,696,480
Buildings 457,973,817 452,033,580 449,363,928 5,940,237 2,669,652
Other Real Estate Improvements 58,068,902 55,615,624 47,797,506 2,453,278 7,818,118
Library Books 3,495,0t I 3,689,900 3,882,640 (194,889) (192,740)Furniture, Machinery, Vehicles
and Other Equipment 24,102,940 22,096,420 29,366,402 2,006,520 (7,269,983)
Telecommunications and
Peripheral Equipment 9,697,379 11,709,782 7,170,727 (2,012,403) 4,539,055
Total Capital Assets $782,119,403 $726,798,884 $696,519,999 $55,320,519 $30,278,884
* Totals for fiscal year 2012 have been restated
16

HOUSTON COMMUNITY COLLEGE SYSTEMMANAGEMENT'S DISCUSSION AND ANALYSIS
(Unandited)
Capital Assets and Debt Administration - Continued
Change
Outstanding debt: 2013 2012" 2011 2012 to 2013
Leases $ $ $ 1,304,824 $
Notes Payable 177,016,888 184,862,036 170,296,243 (7,845,148)
Revenue Bonds 215,574,705 230,326,639 225,485,223 (14,751,934)
PFC Lease Revenue Bonds 107,747,989 111,744,549 115,601,108 (3,996,560)
General Obligation Bonds 578,139,157 126,509 613 122,965,814 451,629,544
Total Outstanding Debt $ 1,078,478,739 $ 653,442,837 $ 635,653,212 $ 425,035,900
2011 to 2012
$ 0,304,824)
14,565,794
4,841,416
(3,856,560)
3,543,799
$ 17,789,625
* Fiscal year 2012 has been restated
Fiscal Year 2013:
Bonds and notes payable increased as follows:
,, Increase of $459,593,311 due to the issuance of Limited Tax General Obligation Bonds.• Decrease of $7,685,150 for principal payments on Maintenance Tax Notes.• Decrease of $13,326,306 due to principal payments on Revenue Bonds.
• PFC Lease Revenue Bonds decreased by $3,996,560 due to principal payments.
Fiscal Year 2012:
Leases decreased by $1,304,824 from fiscal year 2011 to fiscal year 2012 due to principal payments. Bondsand notes payable increased as follows:
• Increase of $22,057,247 due to the issuance of Maintenance Tax Notes.
• Decrease of $7,651,453 for principal payments on Maintenance Tax Notes.• Increase of $16,000,000 due to the issuance of Senior Lien Revenue Bonds.
• Decrease of $12,584,211 due to principal payments on Revenue Bonds.• PFC Lease Revenue Bonds decreased by $3,856,560 due to principal payments.
• General Obligation Bonds decreased by $4,419,967 due to principal payments.
Future Outlook
Houston Community College impacts students, the regional economy, and taxpayers in a number of significantways. Students benefit from improved lifestyles and increased earnings. Taxpayers benefit from a largereconomy and lower social costs. The community as a whole benefits from increased job and investmentoppommities, higher business revenues, greater availability of public funds, and an eased tax burden. HCCplays a vital role in training the region's workforce, ensuring that the area can compete in today's globalmarketplace.
17
HOUSTON COMMUNITY COLLEGE SYSTEMMANAGEMENT' S DISCUSSION AND ANALYSIS
(Unaudited)
Future Outlook - Continued
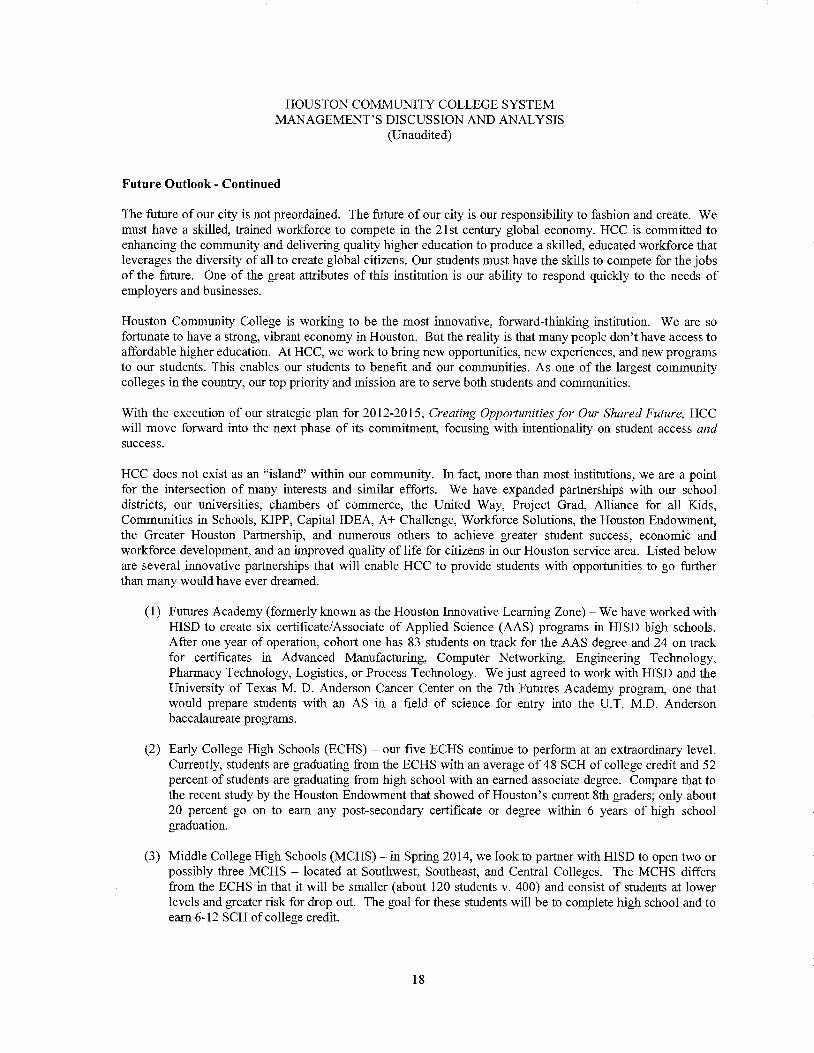
The future of our city is not preordained. The future of our city is our responsibility to fashion and create. Wemust have a skilled, trained workforce to compete in the 21st century global economy. HCC is committed toenhancing the community and delivering quality higher education to produce a skilled, educated workforce thatleverages the diversity of all to create global citizens. Our students must have the skills to compete for the jobsof the future. One of the great attributes of this institution is our ability to respond quickly to the needs ofemployers and businesses.
Houston Community College is working to be the most innovative, forward-thinking institution. We are sofortunate to have a strong, vibrant economy in Houston. But the reality is that many people don't have access toaffordable higher education. At HCC, we work to bring new opportunities, new experiences, and new programsto our students. This enables our students to benefit and our communities. As one of the largest communitycolleges in the country, our top priority and mission are to serve both students and communities.
With the execution of our strategic plan for 2012-2015, Creating Opportunities for Our Shared Future, HCCwill move forward into the next phase of its commitment, focusing with intentionality on student access andsuccess.
HCC does not exist as an "island" within our community. In fact, more than most institutions, we are a pointfor the intersection of many interests and similar efforts. We have expanded parmerships with our schooldistricts, our universities, chambers of commerce, the United Way, Project Grad, Alliance for all Kids,Communities in Schools, K1PP, Capital IDEA, A+ Challenge, Workforce Solutions, the Houston Endowment,the Greater Houston Partnership, and numerous others to achieve greater student success, economic andworkforce development, and an improved quality of life for citizens in our Houston service area. Listed beloware several innovative partnerships that wilt enable HCC to provide students with oppommities to go furtherthan many would have ever dreamed.
(1) Futures Academy (formerly known as the Houston Innovative Learning Zone) - We have worked withHISD to create six certificate/Associate of Applied Science (AAS) programs in HISD high schools.After one year of operation, cohort one has 83 students on track for the AAS degree and 24 on trackfor certificates in Advanced Manufacturing, Computer Networking, Engineering Technology,Pharmacy Technology, Logistics, or Process Technology. We just agreed to work with HISD and theUniversity of Texas M. D. Anderson Cancer Center on the 7th Futures Academy program, one thatwould prepare students with an AS in a field of science for entry into the U.T.M.D. Andersonbaccalaureate programs.
(2) Early College High Schools (ECHS) - our five ECHS continue to perform at an extraordinary level.Currently, students are graduating from the ECHS with an average of 48 SCH of college credit and 52percent of students are graduating from high school with an earned associate degree. Compare that tothe recent study by the Houston Endowment that showed of Houston's current 8th graders; only about20 percent go on to earn any post-secondary certificate or degree within 6 years of high schoolgraduation.
(3) Middle College High Schools (MCHS) - in Spring 2014, we look to partner with HISD to open two orpossibly three MCHS - located at Southwest, Southeast, and Central Colleges. The MCHS differsfrom the ECHS in that it will be smaller (about 120 students v. 400) and consist of students at lowerlevels and greater risk for drop out. The goal for these students will be to complete high school and toearn 6-12 SCH of college credit.
18
HOUSTON COMMUNITY COLLEGE SYSTEMMANAGEMENT'S DISCUSSION AND ANALYSIS
(Unaudited)
Future Outlook - Continued
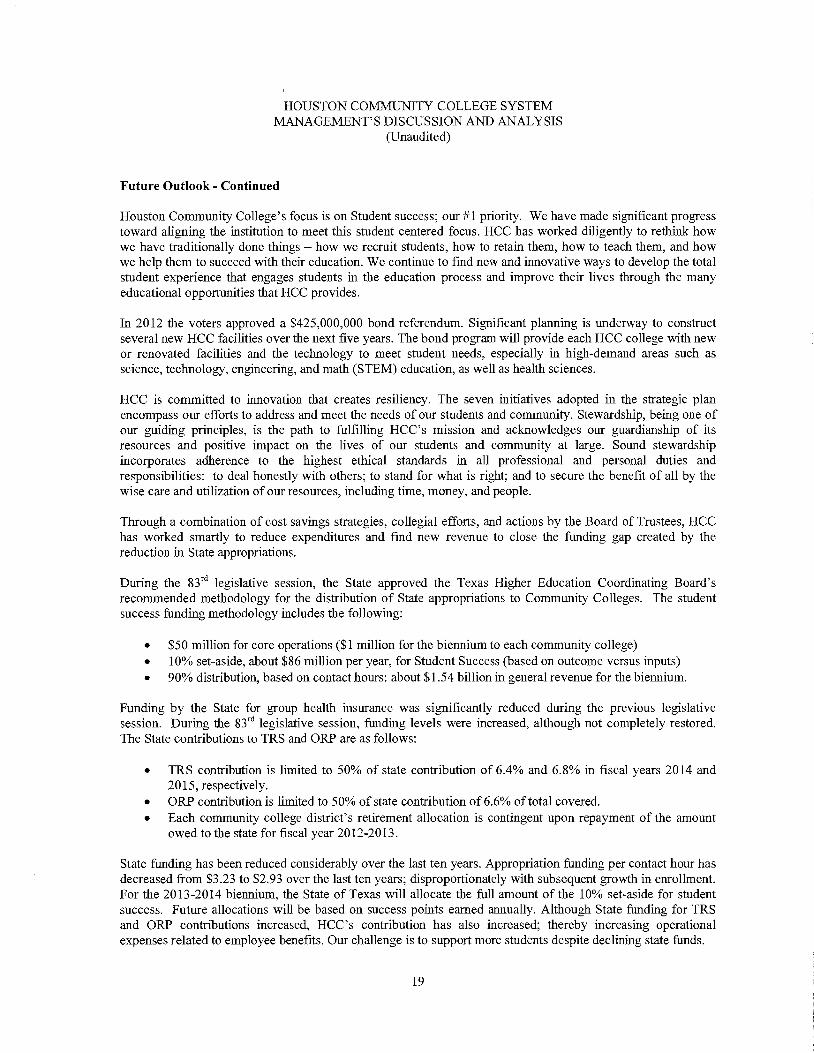
Houston Community College's focus is on Student success; our #1 priority. We have made significant progresstoward aligning the institution to meet this student centered focus. HCC has worked diligently to rethink howwe have traditionally done things - how we recruit students, how to retain them, how to teach them, and howwe help them to succeed with their education. We continue to fred new and innovative ways to develop the totalstudent experience that engages students in the education process and improve their lives through the manyeducational opportunities that HCC provides.
In 2012 the voters approved a $425,000,000 bond referendum. Significant planning is underway to constructseveral new HCC facilities over the next five years. The bond program will provide each HCC college with newor renovated facilities and the technology to meet student needs, especially in high-demand areas such asscience, technology, engineering, and math (STEM) education, as well as health sciences.
HCC is committed to innovation that creates resiliency. The seven initiatives adopted in the strategic planencompass our efforts to address and meet the needs of our students and community. Stewardship, being one ofour guiding principles, is the path to fulfilling HCC's mission and acknowledges our guardianship of itsresources and positive impact on the lives of our students and community at large. Sound stewardshipincorporates adherence to the highest ethical standards in all professional and personal duties andresponsibilities: to deal honestly with others; to stand for what is right; and to secure the benefit of all by thewise care and utilization of our resources, including time, money, and people.
Through a combination of cost savings strategies, collegial efforts, and actions by the Board of Trustees, HCChas worked smartly to reduce expenditures and find new revenue to close the funding gap created by thereduction in State appropriations.
During the 83rd legislative session, the State approved the Texas Higher Education Coordinating Board'srecommended methodology for the distribution of State appropriations to Community Colleges. The studentsuccess funding methodology includes the following:
• $50 million for core operations ($1 million for the biennium to each community college)• 10% set-aside, about $86 million per year, for Student Success (based on outcome versus inputs)
• 90% distribution, based on contact hours: about $1.54 billion in general revenue for the biennium.
Funding by the State for group health insurance was significantly reduced during the previous legislativesession. During the 83rd legislative session, funding levels were increased, although not completely restored.The State contributions to TRS and ORP are as follows:
• TRS contribution is limited to 50% of state contribution of 6.4% and 6.8% in fiscal years 2014 and2015, respectively.
• ORP contribution is limited to 50% of state contribution of 6.6% of total covered.• Each community college district's retirement allocation is contingent upon repayment of the amount
owed to the state for fiscal year 2012-2013.
State funding has been reduced considerably over the last ten years. Appropriation funding per contact hour hasdecreased from $3.23 to $2.93 over the last ten years; disproportionately with subsequent growth in enrollment.For the 2013-2014 biennium, the State of Texas will allocate the full amount of the 10% set-aside for studentsuccess. Future allocations will be based on success points earned annually. Although State funding for TRSand ORP contributions increased, HCC's contribution has also increased; thereby increasing operationalexpenses related to employee benefits. Our challenge is to support more students despite declining state funds.
19

HOUSTON COMMUNITY COLLEGE SYSTEMMANAGEMENT'S DISCUSSION AND ANALYSIS
(Unandited)
Future Outlook - Continued
The ad valorem tax rate for fiscal year 2012 was reduced to the effective tax rate, $0.097173. In October 2013,the Board of Trustees approved to maintain the current property tax rate of $.097173 for fiscal year 2014.
HCC anticipated the state budget shortfall and began conserving its resources through the Cost Savings programin place for the last five years. The Budget Task Force worked to address a focused, critical issue of identifyingtransformational strategies at the institutional level to reduce spending through one-time and on-going savingsand generate one-time and on-going revenue. To date the reports and recommendations for action have resultedin significant savings that have allowed the college to protect the integrity of our instructional program,maintain our course offerings and student services, and honor our commitment to retain jobs.
Despite the economic slowdown at both the national, state and local levels, HCC's outlook for the foreseeablefuture is positive as a result of its strategic leadership, fiscal management and stable local economy.
Contacting the System's Financial Management
This financial report is designed to provide the System's citizens, taxpayers, students, investors, and creditorswith a general overview of the System's fmances and to demonstrate the System's accountability for the moneyit receives. If you have questions about this report or need additional financial information, contact theBusiness Office at 3100 Main, Houston, Texas 77002.
20
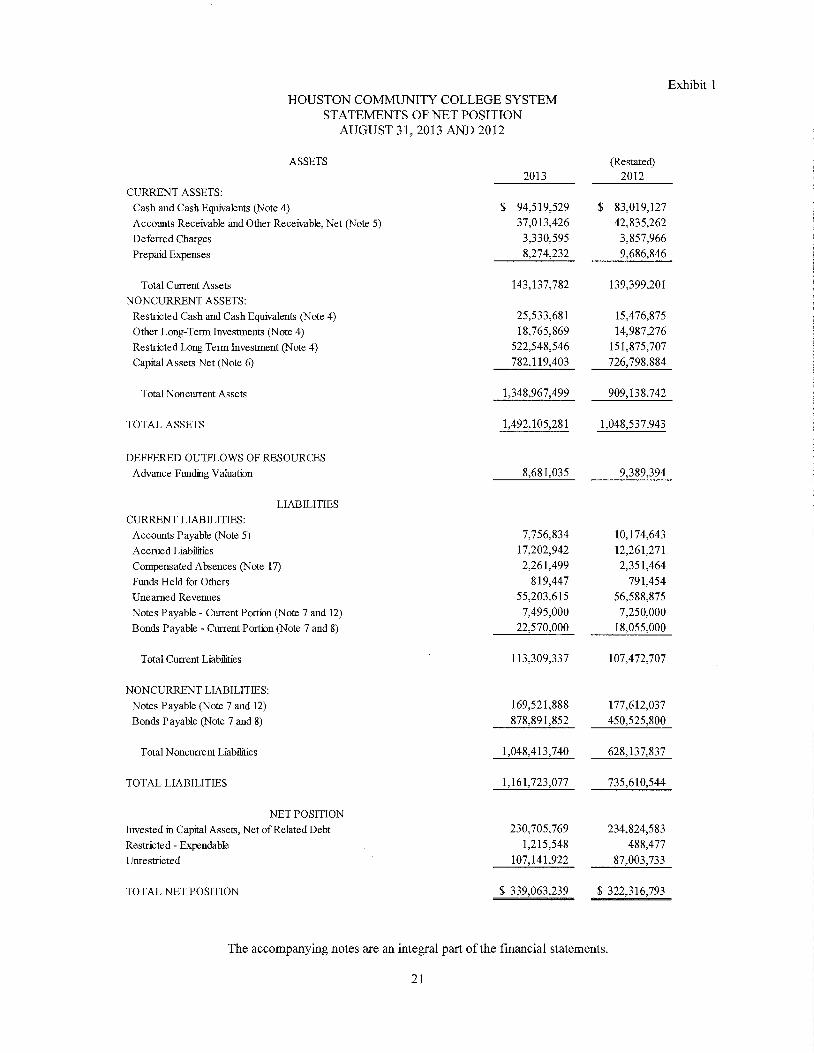
Exhibit 1HOUSTON COMMUNITY COLLEGE SYSTEM
STATEMENTS OF NET POSITIONAUGUST 31, 2013 AND 2012
2013ASSETS
Total Current Assets
NONCURRENT ASSETS:
Restricted Cash and Cash Equivalents (Note 4)
Other Long-Term Investments (Note 4)
Restricted Long Term Investment (Note 4)
Capital Assets Net (Note 6)
TOTAL ASSETS
Total Noncurrent Assets
$ 94,519,52937,013,426
3,330,595
8,274,232
143,137,782
25,533,681
18,765,869
522,548,546
782,119,403
1,348,967,499
1,492,105,281
8,681,035
CURRENT ASSETS:
Cash and Cash Equivalents (Note 4)
Accounts Receivable and Other Receivable, Net (Note 5)
Deferred Charges
Prepaid Expenses
83,019,127
42,835,262
3,857,966
9,686,846
139,399,201
15,476,875
14,987,276
151,875,707
726,798,884
909,138,742
1,048,537,943
9,389,394
(Restate 2012
DEFFERED OUTFLOWS OF RESOURCES
Advance Funding Valuation
LIABILITIES
CURRENT LIABILITIES:Accounts Payable (Note 5)
Accrued Liabilities
Compensated Absences (Note 17)
Funds Held for Others
Unearned Revenues
Notes Payable - Current Portion (Note 7 and 12)
Bonds Payable - Current Portion (Note 7 and 8)
Total Current Liabilities
NONCURRENT LIABILITIES:Notes Payable (Note 7 and 12)
Bonds Payable (Note 7 and 8)
Total Noncurrent Liabilities
TOTAL LIABILITIES
NET POSITION
Invested in Capital Assets, Net of Related Debt
Restricted- Expendable
Unrestricted
TOTAL NET PO SITION
7,756,834
17,202,942
2,261,499
819,447
55,203,615
7,495,000
22,570,000
113,309,337
169,521,888
878,891,852
1,048,413,740
1,161,723,077
230,705,769
1,215,548
107,141,922
$ 339,063,239
10,174,643
12,261,271
2,351,464
791,454
56,588,875
7,250,000
18,055,000
107,472,707
177,612,037
450,525,800
628,137,837
735,610,544
234,824,583
488,477
87,003,733
$ 322,316,793
The accompanying notes are an integral part of the financial statements.
21

Exhibit 2HOUSTON COMMUNITY COLLEGE SYSTEM
STATEMENTS OF REVENUES, EXPENSES, AND CHANGES IN NET POSITIONFOR THE YEARS ENDED AUGUST 31, 2013 AND 2012
2013
(Restated)
2012
OPERA T1NG REVENUES:
Tuition and Fees, Net of Discounts
Federal Crants and Contracts
State Crants and Contracts
Loca! Crants and Contracts
Non-Governmental Crants and Contracts
Sales and Services of EducationalActivities
Auxiliary Enterprises
Total Operating Revenues (Schedule A)
$ 71,433,953
14,702,419
6,156,585
81,407
2,413,531
193,328
16,092,899
111,074,122
107,489,818
11,532,590
23,946,350
27,822,091
67,226,240
27,614,804
57,092,409
18,760,757
19,492,034
360,977,093
(249,902,971)
82,105,228
106,097,476
23,158,801
1,591,888
(140,747)
(36,827,644)
94,423,841
111,309
40,887
6,393,540
(10,305,162)
266,649,417
16,746,446
322,316,793
339,063,239
OPERATING EXPENSES:
Instruction
Public Service
Academic Support
Student Services
Institutional Support
Operations and Maintenance
Scholarships and Fellowships
Auxiliary Enteq rises
Depreciation
Total Operating Expenses (Schedule B)
OPERATING LOSS
NONOPERAT1NG REVENUES (EXPENSES):
State Appropriations
Maintenance Ad Valorem Taxes
Debt Service Ad Valorem Taxes
GiRs
Investment Income (Loss), Net
Interest on Capital Related Debt
Title IV Grants
Nursing Shortage Reduction
Hurricane Ike Expenses (Net of Recoveries)
Other Nonoperating Revenues
Other Nonoperating Expenses
Net Nonoperating Revenues (Schedule C)
INCREASE IN NET POSITION
NET POSITION, BEGINNING OF YEAR, AS RESTATED (Note 25)
NET POSITION, END OF YEAR
$ 71,415,957
16,848,269
5,152,251
95,226
2,497,892
329,382
16,096,494
112,435,471
100,319,497
11,868,925
22,771,173
24,906,487
58,952,631
27,969,778
61,504,372
15,736,795
18,848,802
342,878,460
(230,442,989)
81,839,826
105,943,722
17,694,297
2,053,638
789,917
(28,498,392)
102,023,662
14,038
11,635
9,329,498
(20,866,749)
270,335,092
39,892,103
282,424,690
322,316,793
The accompanying notes are an integral part of the financial statements.
22

Exhibit 3HOUSTON COMMUNITY COLLEGE SYSTEM
STATEMENTS OF CASH FLOWSFOR THE YEARS ENDED AUGUST 31, 2013 AND 2012
2013 2012
CASH FLOWS FROM OPERAT1NGACTMTIES:
Receipts from Students and Other Customers
Receipts from Grants and Contracts
Payments to Suppliers for Goods and Services
Payments to or on BehalfofFarvployees
Payments for Scholarships and Fellowships
Other Receipts (Payments)
$ 88,845,895
23,153,269
(71,905,480)
(206,171,462)
(57,312,596)
$100,424,139
25,393,351
(73,631,760)
(196,791,005)
(62,242,741)
(460,152)
CASH FLOWS FROM NONCAPITAL FINANCING ACI'IVITIES:
Receipts fromAd Valorem Taxes
Receipts from State Allocations
Receipts fromPrivate Gifts
Received Federal Direct Student Loans
Disbursement of Federal Direct Student Loans
Other Non-Operating Revenue
Receipts t om Title IV Cxants
Receipts from Nursing
Receipts from IKE Relief
128,883,247
81,970,943
1,591,888
108,583,044
(108,426,338)
1,312,528
9 890,727
(93,490)
40,887
Net Cash Provided by Noncapital Financing Activities 308,753,436
CASH FLOWS FROM CAPITAL FINANCINGACF1VITIES:
Receipts from the Is s uan ce of Capital Debt
Bond Issue Cost Paid on New Capital Debt Issue
Purchases of Capital As sets
Payments of Expenses Relating to Capital Assets in Plant Funds
Payments on Capital Debt and Leases - Principal
Payments on Capital Debt and Leases - Interest and Fees
454,167,571
(2,570,661)
(46,213,517)
(6,278,325)
(25,305,000)
(36,275,743)
Net Cash Provided by (Used in) Financing Activities 337,524,325
CASH FLOWS FROM 1NVESTINGACTMTIES:
Proceeds from Sales and Maturities of Investments
Interest on Investments
Purchase of Investments
28,829,580
1,158,220
(431,317,978)
Net Cash Used in Investing Activities (401,330,178)
21,557,209
98,496,001
INCREASE IN CASH AND CASH EQUIVALENTS
CASH AND CASH EQUIVALENTS - BEGINNING OF YEAR
CASH AND CASH EQUIVALENTS - END OF YEAR $120,053,210
The accompanying notes are an integral part of the financial statements.
(223,390,374)Net Cash Used by Operating Activities (207,308,168)
122,375,914
8 102,978
2,053,638
82,489,952
(82,489,952)
1,295,274
102,023,662
14,038
11,635
311,877,139
164,314, 822
(1,317,537)
(39,942,481)
(7,483,194)
(141,976,408)
(28,496,958)
(54,901,756)
48,149,267
807,947
(89,435,804)
(40,478,590)
9,188,625
89,307,376
$ 98,496,001
23

Exhibit 3HOUSTON COMMUNITY COLLEGE SYSTEM
STATEMENTS OF CASH FLOWS - CONTINUEDFOR THE YEARS ENDED AUGUST 31, 2013 AND 2012
2013 2012
RECONCILIATION OF NET OPERATING LOSS TO NET CASH
USED IN OPERATING ACTIVITIES:Operating loss
Adjustments to Reconcile Operating Loss to Net Cash Used in Operating Activities:
Depreciation
Addback Non-Cash Charges (Add in the Reserve) for Doubtful Accounts
Changes in assets and liabilities
Accounts and Other Receivables, Net
Prepaids
Deferred Charges
Accounts Payables and Accruals
Unearned Revenues
Deposits Held for Others
$ (249,902,971)
19,492,035
1,007,341
5,821,836
(1,412,616)
527,371
2,433,897
(1,385,260)
27,993
26,512,597
$(223,390,374)Net Cash Used in Operating Activities
Total Adjustments
$ (230,442,988)
18,848,802
1,072,013
(6,452,755)
(1,384,941)
1,302,715
6,465,086
3,219,142
64,758
23,134,820
$ (207,308,168)
The accompanying notes are an integral part of the financial statements.
24

HOUSTON COMMUNITY COLLEGE SYSTEMNOTES TO THE FINANCIAL STATEMENTS
NOTE 1 - REPORTING ENTITY
Houston Community College System (the "System") was established on May 8, 1971, in accordance with thelaws of the State of Texas, to serve the educational needs of the Houston Independent School District, AliefIndependent School District, City of Stafford and City of Missouri City. The System also serves the schooldistricts of Katy, North Forest and Spring Branch at those districts' requests. The System is a comprehensivepublic two-year institution offering academic, general, occupational, development, and continuing adulteducation programs through a network of colleges.
Houston Community College System is considered to be a special purpose, primary government according tothe definition in Governmental Accounting Standards Board (GASB). While the System receives funding fromlocal, state and federal sources, and must comply with the spending, reporting, and record keeping requirementsof these entities, it is not a component unit of any other governmental entity.
GASB gives guidance in determining whether certain organizations for which the System is not financiallyaccountable should be reported as component units based on the nature and significance of their relationshipwith the primary government. It requires reporting as a component unit if the organization raises and holdseconomic resources for the direct benefit of the governmental m it and the component unit is significantcompared to the primary government. GASB guidance has been applied as required in the preparation of these
financial statements.
The Houston Community College System Public Facility Corporation ("PFC") was incorporated on January 18,2005. The PFC is a nonprofit public facility corporation and instrumentality formed by the System pursuant tothe Public Facility Corporation Act and a resolution of the Board of Trustees of the System. The PFC wasformed for the purpose of financing or providing for the acquisition, construction, rehabilitation, renovation,repair and equipment of public facilities for the benefit of the System. The PFC is reported as a blendedcomponent unit in the fmancial statements of the System. The PFC is a legally separate entity and is included inthe System's financial reporting entity because of the nature of its relationship to the System. Financialinformation for the PFC may be obtained from its administrative office.
The Houston Community College Foundation (the "Foundation") is a legally separate not-for-profit corporationcontrolled by a separate board of trustees, whose sole purpose is to advance and assist in the development,growth and operation of the System. The System does not appoint any of the Foundation's board members nordoes it fund or is it obligated to pay debt related to the Foundation. The financial position of the Foundation asof Augnst 31, 2013 and 2012 and the cost of services provided by the System to the Foundation during the yearsthen ended are not significant to the System. The Foundation has therefore not been included as a componentunit in the financial statements of the System. Financial information for the Foundation may be obtained fromits administrative office.
NOTE 2 - SUMMARY OF SIGNIFICANT ACCOUNTING POLICIES
Reporting Guidelines
The significant accounting policies followed by the System in preparing these financial statements are inaccordance with accounting principles generally accepted in the United States of America as prescribed byGASB. The accompanying financial statements are also in accordance with the Texas Higher EducationCoordinating Board's Annual Financial Reporting Requirements for Texas Public Community and JuniorColleges. The System is reported as a special-purpose government engaged in business-type activities.
25

HOUSTON COMMUNITY COLLEGE SYSTEMNOTES TO THE FINANCIAL STATEMENTS
NOTE 2 - SUMMARY OF SIGNIFICANT ACCOUNTING POLICIES - CONTINUED
Adoption of New Accounting Standards
Effective with the fiscal year ended August 31, 2013, the System adopted GASB Statement No. 63, FinancialReporting of Deferred OugTows of Resources, Deferred Inflows of Resources, and Net Position. With theimplementation of GASB 63, the Statement of Net Assets now becomes the Statement of Net Position. Alongwith the name change, the Standard requires that the Statement of Net Position now include two newclassifications separate from assets and liabilities. Amounts reported as deferred outflows of resources arerequired to be reported in Statement of Net Position in a separate section following assets. Likewise, amountsreported as deferred inflows of resources are required to be reported in Statement of Net Position in a separatesection following liabilities.
Effective with the fiscal year ended August 31, 2013, the System early adopted GASB Statement No. 65,Items Previously Reported as Assets and Liabilities. This Statement establishes accounting and financialreporting standards that reclassify, as deferred outflows of resources or deferred inflows of resources, certainitems that were previously reported as assets and liabilities.
Basis of Accounting
The fmancial statements of the System have been prepared on the accrual basis of accounting whereby allrevenues are recorded when earned and all expenses are recorded when they have been reduced to a legal orcontractual obligation to pay.
Encumbrance accounting, under which purchase orders, contracts and other commitments for the expendituresof funds are recorded in order to reserve that portion of the applicable appropriation, is employed as anextension of formal budgetary integration. Under Texas law, appropriations lapse at August 31 of each yearand encumbrances outstanding at that tilne are to be either canceled or appropriately provided for in thesubsequent year's budget.
Tuition Discounting
Texas Public Education Grants - Certain tuition amounts are required to be set aside for use as scholarships byqualifying students. This set-aside, called the Texas Public Education Grant (TPEG), is shown with tuition andfee revenue amounts as a separate set-aside amount (Texas Education Code §56.0333). When the award is usedby the student for tuition and fees, the amount is recorded as tuition discount. If the amount is dispersed directlyto the student, the amount is recorded as a scholarship expense.
Title IV, Higher Education Act (HEA) Program Funds - Certain Title IV Higher Education Act Program (HEA)funds are received by the System to pass-through to the student. These funds are initially received by theSystem and recorded as grant revenue. When the award is used by the student for tuition and fees, the amount isrecorded as tuition discount. If the amount is dispersed directly to the student, the amount is recorded as ascholarship expense.
Other Tuition Discounts - Student tuition and fees revenue are reported net of scholarship discounts in theaccompanying Statement of Revenues, Expenses, and Changes in Net Position. The scholarship discount is thedifference between the actual amount for tuition and fees charged by the System and the amount that is paid bystudents or by third parties on the students' behalf. Student financial assistance grants, such as Pell grants, andother federal, state or nongovernmental programs, are recorded as either operating or non-operating revenues inthe accompanying Statement of Revenues, Expenses, and Changes in Net Position. To the extent that revenuesfrom these programs are used to satisfy tuition, fees, and other charges, the System has recorded a scholarshipdiscount. Schedule A provides a detail of tuition discounts.
26

HOUSTON COMMUNITY COLLEGE SYSTEMNOTES TO THE FINANCIAL STATEMENTS
NOTE 2 - SUMMARY OF SIGNIFICANT ACCOUNTING POLICIES - CONTINUED
Budgetary Data
Each community college district in Texas is required by law to prepare an annual operating budget ofanticipated revenues and expenditures for each fiscal year beginning September 1. The System's Board ofTrustees adopts the budget, which is prepared on the accrual basis of accounting. A copy of the approvedbudget must be filed with the Texas Higher Education Coordinating Board, Legislative Budget Board,Legislative Reference Library, and Governor's Office of Budget and Planning by December 1 of the respectiveyear.
Cash and Cash Equivalents
Cash and cash equivalents are considered to be cash on hand and demand deposits with original maturities ofthree months or less from the date of acquisition. The System has classified public funds investment poolscomprised of Lone Star Investment Pool (First Public) and Texas Local Government Investment Pool (TexPool)to be cash equivalents.
Investments
Investments are reported at fair value. Fair values are based on published market rates. Short-term investmentshave an original maturity greater than three months but less than one year at the time of purchase. Long-terminvestments have an original maturity of greater than one year at the time of purchase. Investment funds relatedto bond issues set aside for construction of capital assets are classified as restricted long-term investments.
Deferred Charges
Expenses and costs paid in advance which pertain to the subsequent fiscal year(s), such as scholarshipsdisbursed to students before August 31 for fall semester classes are accounted for as deferred charges.
Capital Assets
Capital assets are stated at cost at the date of acquisition, or fair value at the date of donation. Assets undercapital leases are recorded at the lower of the present value of the minimum lease payments or the fair value ofthe asset. The assets are amortized over the lesser of their related lease terms or their estimated productive lives.The System reports depreciation under a single line-item, as would be done by an entity reporting as a businesstype unit. Depreciation is computed using the straight-line method over the estimated useful lives of the assetsand is not allocated to the functional expenditure categories. The threshold for capitalization of assets is $5,000.Renovations of $100,000 to buildings and infrastructure and land improvements that significantly increase thevalue or extend the useful life of the structure are capitalized. The costs of normal maintenance and repairs thatdo not add to the value of the asset or materially extend assets' lives are charged to operating expense in theyear in which the expense is incurred. The following estimated useful lives are used for depreciable assets:
BuildingsFacilities and Other ImprovementsFurniture, Machinery, Vehicles and Other EquipmentTelecommunications and Peripheral EquipmentLibrary BooksLeasehold Improvements
50 years20 years10 years5 years
15 yearsLease Term
27

HOUSTON COMMUNITY COLLEGE SYSTEMNOTES TO THE FINANCIAL STATEMENTS
NOTE 2 - SUMMARY OF SIGNIFICANT ACCOUNTING POLICIES - CONTINUED
Deferred Outflow of Resources
The Statement of Net Position includes a separate section for deferred outflows of resources which represents aconsumption of net position that applies to future periods and thus, will not be recognized as an outflow ofresources (expenses) until then. The System's deferred charge on refunding of debt results from the different incarrying value of refunded debt and its reacquisition price. This amount is deferred and amortized over theshorter of the life of the refunded or refunding debt.
Unearned Revenues
Tuition, fees, and other revenues received and related to the period after August 31 of any one year have beenreported as unearned revenues. Also reported as unearned revenues are public education grant revenues thatmust be matched to certain scholarship disbursements reported as deferred charges.
Income Taxes
The System is exempt from income taxes under Internal Revenue Code Section 115, Income of States,Municipalities, Etc., although unrelated business income may be subject to income taxes under InternalRevenue Code Section 511(a)(2)(B), Imposition of Tax on Unrelated Business Income of Charitable, etc.Organizations. The System had no unrelated business income tax liability for the years ended August 31, 2013
and 2012.
Management Estimates
The preparation of financial statements in conformity with accounting principles generally accepted in theUnited States of America requires management to make estimates and assumptions that affect certain reportedamounts and disclosures. Accordingly, actual results could differ from those estimates. Estimates that have themost impact on financial position and results of operations primarily relate to the collectability of tuition andtaxes receivable, the useful lives of property and equipment, certain accrued liabilities, and the allocation ofexpenses among functional areas. Management believes these estimates and assumptions provide a reasonablebasis for the fair presentation of the fmancial statements.
Operating and Nonoperating Revenues and Expenses
The System presents its revenues and expenses as operating or non-operating based on recognition definitionsfrom GASB. Operating revenues and expenses generally result from providing services in connection with theSystem's principal ongoing operations. The principal operating revenues are tuition and related fees andcontracts and grants. The major non-operating revenues are allocations from the State, property tax collectionsand Title IV financial aid funds. Property taxes are recognized as revenues in the year for which they are levied.Operating expenses include the cost of services, administrative expenses and depreciation on capital assets. Thebookstore and vending machine operations are owned and managed by third parties. Accordingly, no discountsor allowances related to these operations are recorded by the System.
Federal Financial Assistance Progams
The System participates in several federally-funded programs. Federal programs are audited in accordance withthe Single Audit Act Amendments of 1996, the U.S. Office of Management and Budget Circular A-133 Audit ofStates, Local Governments and Non-Profit Organizations, and the OMB Circular A-133 Compliance
Supplement.
28
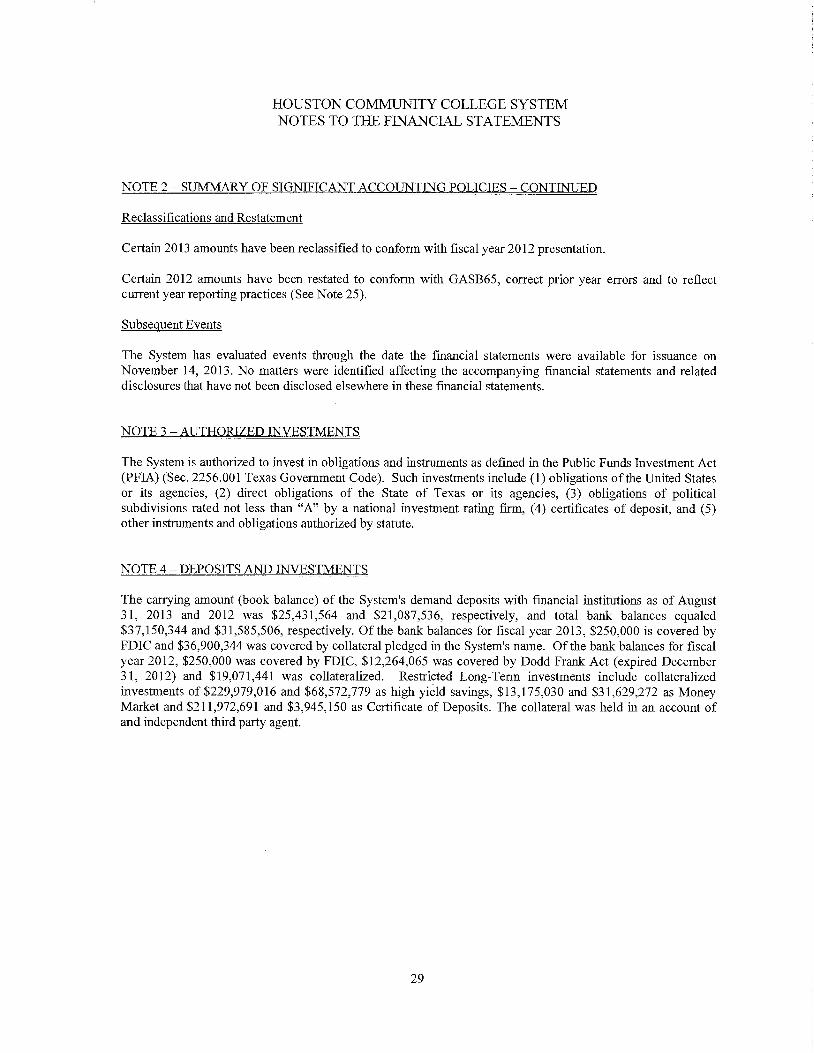
HOUSTON COMMUNITY COLLEGE SYSTEMNOTES TO THE FINANCIAL STATEMENTS
NOTE 2 - SUMMARY OF SIGNIFICANT ACCOUNTING POLICIES - CONTINUED
Reclassifications and Restatement
Certain 2013 amounts have been reclassified to conform with fiscal year 2012 presentation.
Certain 2012 amounts have been restated to conform with GASB65, correct prior year errors and to reflectcurrent year reporting practices (See Note 25).
Subsequent Events
The System has evaluated events through the date the financial statements were available for issuance onNovember 14, 2013. No matters were identified affecting the accompanying fmancial statements and relateddisclosures that have not been disclosed elsewhere in these financial statements.
NOTE 3 -AUTHORIZED INVESTMENTS
The System is authorized to invest in obligations and instruments as defmed in the Public Funds Investment Act(PFIA) (Sec. 2256.001 Texas Government Code). Such investments include (1) obligations of the United Statesor its agencies, (2) direct obligations of the State of Texas or its agencies, (3) obligations of politicalsubdivisions rated not less than "A" by a national investment rating firm, (4) certificates of deposit, and (5)other insmaments and obligations authorized by statute.
NOTE 4 - DEPOSITS AND INVESTMENTS
The carrying amount (book balance) of the System's demand deposits with fmancial institutions as of August31, 2013 and 2012 was $25,431,564 and $21,087,536, respectively, and total bank balances equaled$37,150,344 and $31,585,506, respectively. Of the bank balances for fiscal year 2013, $250,000 is covered byFDIC and $36,900,344 was covered by collateral pledged in the System's name. Of the bank balances for fiscalyear 2012, $250,000 was covered by FDIC, $12,264,065 was covered by Dodd Frank Act (expired December31, 2012) and $19,071,441 was collateralized. Restricted Long-Term investments include collateralizedinvestments of $229,979,016 and $68,572,779 as high yield savings, $13,175,030 and $31,629,272 as MoneyMarket and $211,972,691 and $3,945,150 as Certificate of Deposits. The collateral was held in an account ofand independent third party agent.
29

HOUSTON COMMUNITY COLLEGE SYSTEMNOTES TO THE FINANCIAL STATEMENTS
NOTE 4 - DEPOSITS AND INVESTMENTS - CONTINUED
Cash and deposits included on Exhibit 1, Statement of Net Position, consist of the items reported below:
2013 2012
Bank Deposits:
Demand Deposits $ 25,431,564 $ 21,087,536
Cash and Cash Equivalents:
Petty Cash on Hand
Money Market Funds
High Yield SavingsCertificates of Deposit
TexPool
Lonestar
50,710 51,114
34,709,335 7,164,35923,972,410 33,164,042
33,277,309 26,304,850
1,017,445 9,132,448
1,594,437 1,591,653
94,621,647 77,408,466
Total Cash and Deposits
Restricted Cash and Cash Equivalents
Cash and Cash Equivalents ( Exhibit 1)
120,053,210 98,496,002
(25,533,681) (15,476,875)
$ 94,519,529 $ 83,019,127
30

HOUSTON COMMUNITY COLLEGE SYSTEMNOTES TO THE FINANCIAL STATEMENTS
NOTE 4 - DEPOSITS AND INVESTMENTS - CONTINUED
Items consisting of cash and investments included on Exhibit 1, Statements of Net Position, continue as shownbelow:
Fair Value at August 31,
Type of Security 2013 2012
U.S. Agency Securities
Texpool, Money Market, CD's, High Yield Savings
Other securities and Checking Accounts
Total Investments
Total Cash and Deposits
Total Deposits and Investments
$ 52,817,630 $ 14,987,276
488,496,785 151,875,708
541,314,415 166,862,984
120,053,210 98,496,001
$ 661,367,625 $ 265,358,985
Cash and Cash Fquivalents (FNaibit 1)
Restricted Cash and Cash Equivalents (Exhibit 1)
Other securities & Checking Accounts (Exhibit 1)
Other Long-Term Investments (Exhibit 1)
Total Deposits and Investments
94,519,529 83,019,127
25,533,681 15,476,875
522,548,546 151,875,707
18,765,869 14,987,276
$ 661,367,625 $ 265,358,985
As of August 31, 2013 Houston Community College System had the following investments and maturities:
Weighted Average
Investment Type Fair Value Maturity(Years)
U.S. Agency Securities
Investment Pools
Certificates of Deposit
Cash and Money Market Funds
(excluding $449,553 of Operating Cash)
Total Fair Value
Portfolio weighted average maturity
$ 52,817,630 5.32
30,117,838 0.00
245,250,000 2.48
332,732,604 0.00
$ 660,918,072
1.36
31

HOUSTON COMMUNITY COLLEGE SYSTEMNOTES TO THE FINANCIAL STATEMENTS
NOTE 4 - DEPOSITS AND INVESTMENTS - CONTINUED
Interest Rate Risk - In accordance with state law and System policy, the System does not purchase anyinvestments with maturities greater than ten years. The System manages its exposure to declines in fair value bylimiting the weighted average maturity of its investment portfolio to two years or less. The System's philosophyis to hold all investments to their maturity.
Credit Risk and Concentration of Credit Risk - In accordance with state law and the System's investmentpolicy, investments in mutual funds and investment pools must be rated at least "AAA", commercial paper mustbe rated at least "A-I" or "P-I", and investments in obligations from other states, municipalities, counties, etc.must be rated at least "A". The System limits the amount it may invest in any one issuer to no more than 50 %of its total investment portfolio. In August 2011 Standard & Poor rating services downgraded the credit ratingof the United States to AA+.
The credit quality (ratings) and concentration of credit exposure of securities in excess of 5% of totalinvestments as of August 31, 2013 is as follows:
Fannie Mae ( Federal National Mortgage Association)
Freddie Mac ( Federal Home Loan Mortgage Corporation)
FHLB (Federal Home Bank)FFCB (Federal Farm Credit Bank)
Credit CreditRating ExposureAAA 2%AAA 1%AAA 4%AAA 1%
The State Comptroller of Public Accounts exercises oversight responsibility over the Texas Local GovernmentInvestment Pool (TexPool). Oversight includes the ability to significantly influence operations, designation ofmanagement and accountability for fiscal matters. Additionally, the State Comptroller of Public Accounts hasestablished an advisory board composed of both participants in TexPool and other persons who do not have abusiness relationship with TexPool. The Advisory Board members review the investment policy andmanagement fee structure. TexPool is rated AAAm by Standard & Poor's. As a requirement to maintain therating, weekly portfolio information is submitted to both Standard & Poor's and the Office of the StateComptroller of Public Accounts for review.
TexPool operates in a manner consistent with the Securities and Exchange Commission's Rule 2a7 of theInvestment Company Act of 1940. TexPool uses amortized cost rather than market value to report net assets tocompute share prices. Accordingly, the fair value of the position in Tex_Pool is the same value as the value inTexPool shares.
The Lone Star Investment Pool (Lone Star) is a public funds investment pool established in accordance with theInterlocal Cooperation Act, Chapter 791, Texas Government Code, and the Public Funds Investment Act,Chapter 225, Texas Government Code. Lone Star is governed by trustees comprised of active participants inLone Star. The board of trustees for Lone Star has the responsibility for adopting and monitoring compliancewith the investment policy, of appointing investment officers, of overseeing the selection of an investmentadvisor, custodian, investment consultant, administrator and other service providers.
32
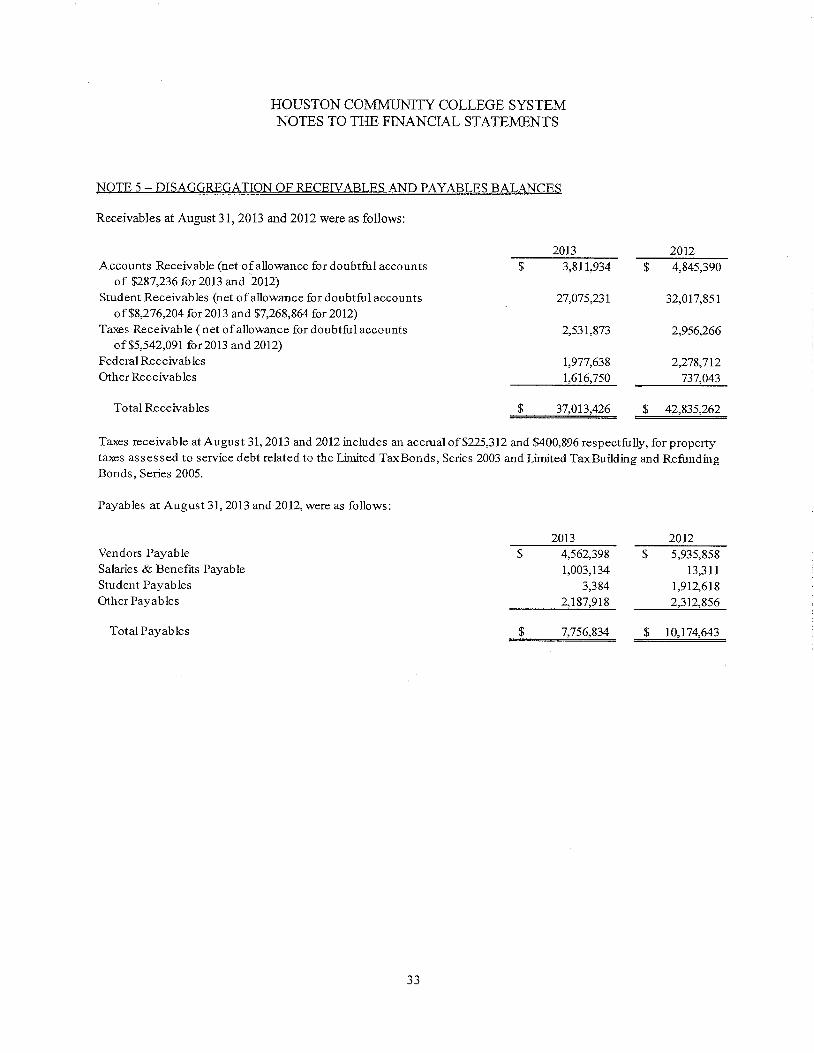
HOUSTON COMMUNITY COLLEGE SYSTEMNOTES TO THE FINANCIAL STATEMENTS
NOTE 5 - DISAGGREGATION OF RECEIVABLES AND PAYABLES BALANCES
Receivables at August 31, 2013 and 2012 were as follows:
Accounts Receivable (net of allowance for doubtful accountsof $287,236 for2013 and 2012)
Student Receivables (net of allowance for doubtful accounts
of $8,276,204 for 2013 and $7,268,864 for 2012)Taxes Receivable ( net of allowance for doubtful accounts
of $5,542,091 for 2013 and 2012)Federal Receivables
Other Receivables
2013 2012$ 3,811,934 $ 4,845,390
27,075,231 32,017,851
2,531,873 2,956,266
1,977,638 2,278,7t21,616,750 737,043
Tota! Receivables $ 37,013,426 $ 42,835,262
Taxes receivable at August 31, 2013 and 2012 includes an accrual of $225,312 and $400,896 respectfully, for propertytaxes assessed to service debt related to the Limited TaxBonds, Series 2003 and Limited TaxBuilding and Refunding
Bonds, Series 2005.
Payables at August 31, 2013 and 2012, were as follows:
2013 2012Vendors Payable $ 4,562,398 $ 5,935,858Salaries & Benefits Payable 1,003,134 13,311Student Payables 3,384 1,912,618
Other Payables 2,187,918 2,312,856
Total Payables $ 7,756,834 $ 10,174,643
33
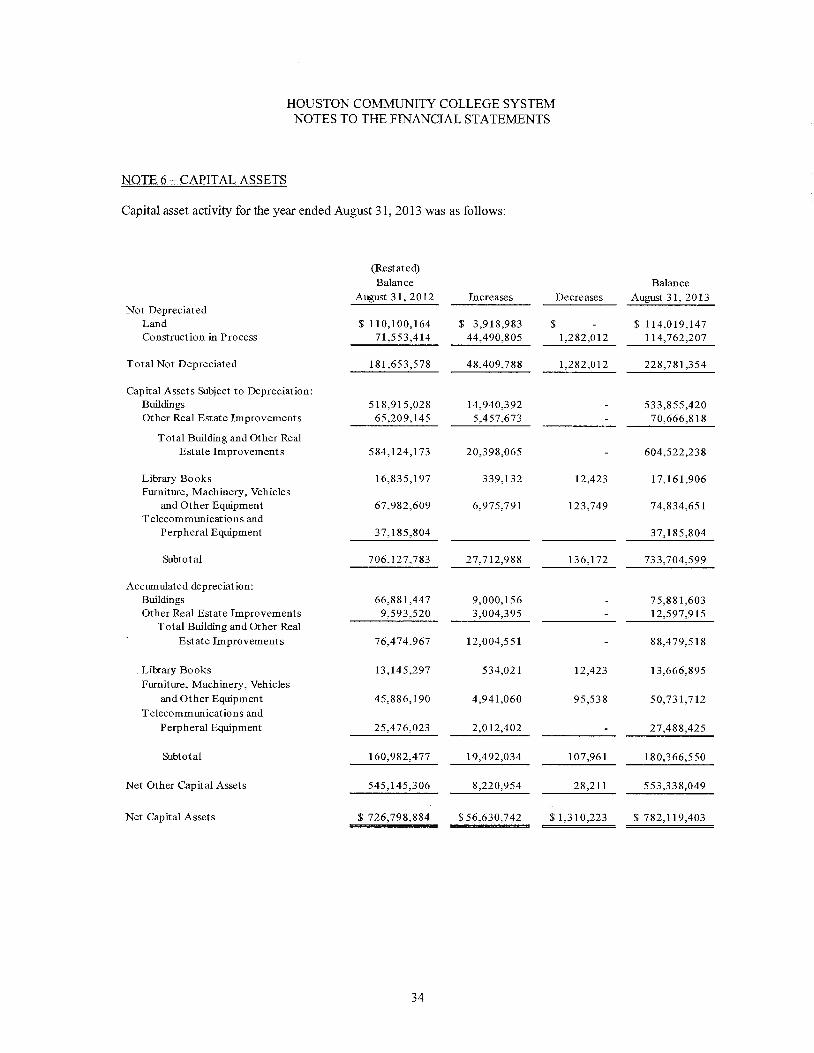
HOUSTON COMMUNITY COLLEGE SYSTEMNOTES TO THE FINANCIAL STATEMENTS
NOTE 6 - CAPITAL ASSETS
Capital asset activity for the year ended August 31, 2013 was as follows:
Not DepreciatedLandConstruction in Process
Total Not Depreciated
(Restated)
Balance Balance
August 31, 2012 Increases Decreases August 31, 2013
$ 110,100,164 $ 3,918,983 $ $ 114,019,14771,553,414 44,490,805 1,282,012 114,762,207
181,653,578 48,409,788 1,282,012 22 g,781,354
Capital Assets Subject to Depreciation:BuildingsOther Real Estate Improvements
Total Building and Other RealEstate Improvements
Library BooksFurniture, Machinery, Vehicles
and Other EquipmentTelecommunications mid
Perpheral Equipment
Subtotal
518,915,028 14,940,39265,209,145 5,457,673
584,124,173 20,398,065
16,835,197 339,132
67,982,609 6,975,791
37,185,804
706,127,783 27,712,988
Library Books
Furniture, Machinery, Vehiclesand Other Equipment
Telecommunications and
Perpheral Equipment
Subtotal
Net Other Capital Assets
Net Capital Assets
Accumulated depreciation:BuildingsOther Real Estate Improvements
Total Building and Other Real
Estate Improvements
66,881,447 9,000,156 75,881,6039,593,520 3,004,395 12,597,915
76,474,967 12,004,551 88,479,518
13,145,297 534,021 12,423 13,666,895
45,886,190 4,941,060 95,538 50,731,712
25,476,023 2,012,402 27,488,425
160,982,477 19,492,034 107,961 180,366,550
545,145,306 8,220,954 28,211 553,338,049
$ 726,798,884 $56,630,742 $1,310,223 $ 782,119,403
12,423
123,749
136,172
533,855,42070,666,818
604,522,238
17,161,906
74,834,651
37,185,804
733,704,599
34

HOUSTON COMMUNITY COLLEGE SYSTEMNOTES TO THE FINANCIAL STATEMENTS
NOTE 6 - CAPITAL ASSETS - CONTINUED
Capital asset activity for the year ended August 31, 2012 was as follows:
Not Depreciated:LandConstruction in Process
Total Not Depreciated
Capital Assets Subject to Depreciation:BuildingsOther Real Estate Improvements
Balance
August 31,2011 Increases
$ 99,081,861 $11,018,30359,856,934 11,696,480
158,938,795 22,714,783
507,427,899 11,487,12954,738,950 10,470,195
Decreases
$
(Re e Balance
August 31,2012
$110,100,16471,553,414
181,653,578
518,915,02865,209,145
Subtotal
Accumulated Depreciation:
BuildingsOther Real Estate Improvements
Total Building and Other RealEstate Improvements
Subtotal
Net Other Capital Assets
Net Capital Assets
Library BooksFurniture, Machinery, Vehicles
and Other EquipmentTelecommunications and
P erpheral Equipment
562,166,849 21,957,324
16,519,809 345,354
65,268,502 5,201,858
36,862,964 322,840
680,818,124 27,827,376
58,182,600 8,752,748
6,944,149 2,651,245
65,126,749 11,403,993
12,637,169 538,093
43,587,128 3,933,953
23,299,394 2,972,763
144,650,440 18,848,802
536,167,684 8,978,574
$ 695,106,479 $ 31,693,357
Library BooksFurniture, Machinery, Vehicles
and Other EquipmentT elecommunicat ions and
P erpheral Equipment
29,966
2,487,751
2,517,717
53,901
1,874
55,775
29,965
1,634,891
796,134
2,516,765
952
$ 952
Total Building and Other Real
Estate Improvements 584,124,173
16,835,197
67,982,609
37,185,804
706,127,783
66,881,447
9,593,520
76,474,967
13,145,297
45,886,190
25,476,023
160,982,477
545,145,306
$ 726,798,884
35
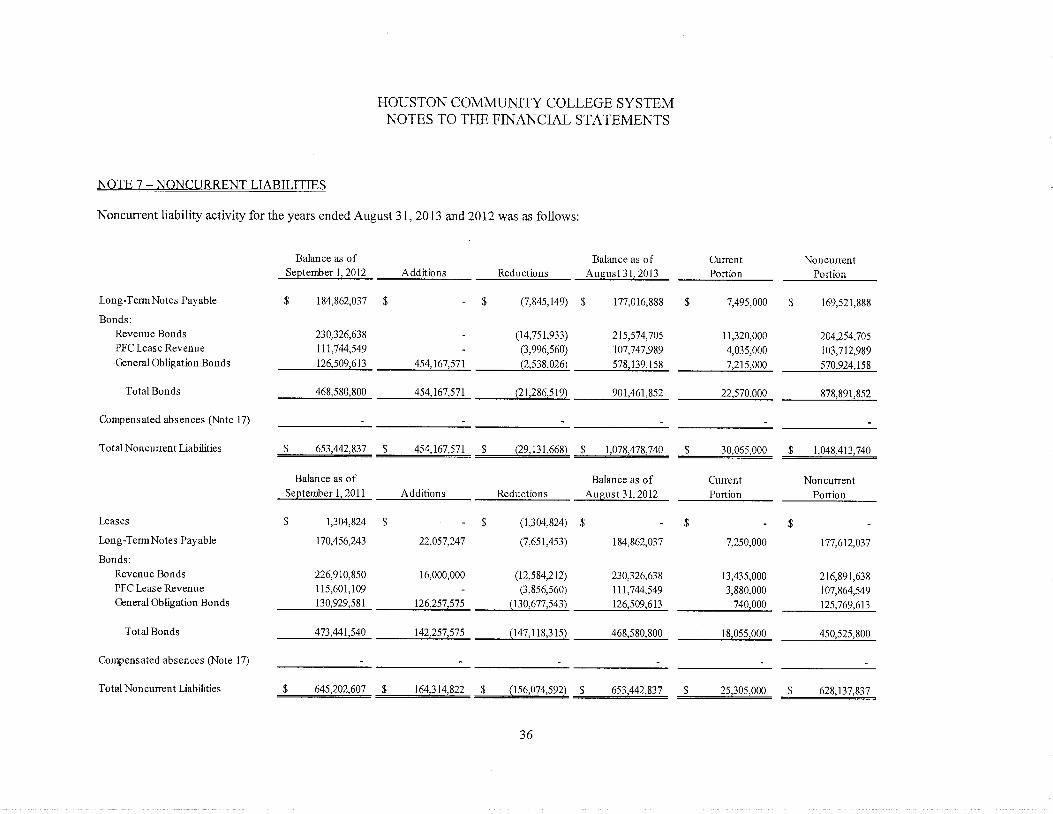
HOUSTON COMMUNITY COLLEGE SYSTEMNOTES TO THE FINANCIAL STATEMENTS
NOTE 7 - NONCURRENT LIABILITIES
Noncurrent liability activity for the years ended August 31, 2013 and 2012 was as follows:
Long-Term Notes Payable
Bonds:
Revenue Bonds
PFC Lease Revenue
General Obligation Bonds
Balance as of Balance as ofSeptember 1, 2012 Additions Reductions August 31, 2013
$ 184,862,037 $ $ (7,845,149) $ 177,016,888
CurrentPortion
$ 7,495,000 $
Total Noncurrent Liabilities
Total Bonds
Compensated absences (Note 17)
Total Noncurrent Liabilities
Leases
Long-Term Notes Payable
Bonds:
Revenue BondsPFC Leas e Revenue
General Obligation Bonds
230,326,638 (14,751,933) 215,574,705
111,744,549 (3,996,560) 107,747,989126,509,613 454,167,571 578,139,158
468,580,800 454,167,571 (21,286,519) 901,461,852
$ 653,442,837 $ 454,167,571 $ (29,131,668) $ 1,078,478,740
Balance as of Balance as of
September 1, 2011 Additions Reductions August 31, 2012
$ 1,304,824 $ $ (1,304,824) $
170,456,243 22, 057,247 (7, 651,453) 184, 862, 037
226,910,850 16,000,000 (12,584,212) 230,326,638 13,435,000 216,891,638
115,601,109 (3,856,560) 111,744,549 3,880,000 107,864,549
130,929,581 126,257,575 (130,677,543) 126,509,613 740,000 125,769,613
473,441,540 142,257,575 468,580,800
$ 645,202,607 $ 164,314,822 $ (156,074,592) $ 653,442,837
36
Compensated absences (Note 17)
Total Bonds
11,320,000
4,035,000
7,215,000
22,570,000
$ 30,065,000
CurrentPosen
$
7,250,000
18,055,000
$ 25,305,000
878,891,852
$ 1,048,413,740
NoncurrentPotion
450,525,800
$ 628,137,837
Noncurrent
Portion
169,521,888
2O4,254,705
103,712,989
570,924,158
177,612,037
HOUSTON COMMUNITY COLLEGE SYSTEMNOTES TO THE FINANCIAL STATEMENTS
NOTE 8 - BONDS PAYABLE
Student Fee Revenue Bonds:
The System issued several Student Fee Revenue Bonds during the fiscal years 1997 through 2011 with interestrates ranging from 3.0% to 5.62% and maturities ranging from 2008 through 2031 (see table below for details).Debt service requirements are payable solely from and secured by a first lien on certain pledged revenues whichinclude general fees, out-of-district fees and any other revenues or receipts of the System which may, in thefuture, be pledged to the payment of the bonds. Certain outstanding bonds may be redeemed at their par valueprior to their normal maturity dates in accordance with the terms of the related bond indenture. All authorizedbonds have been issued. The System has never defaulted on any bond or interest payment.
Public Facility Corporation Lease Revenue Bonds:
The Houston Community College System Public Facility Corporation (PFC) issued $58,885,000 in LeaseRevenue Bonds, Series 2007 on February 1, 2007 with interest rates ranging from 4.00% to 5.62%. The Bondswere issued at a premium of $3,094,498. Bond maturities range from April 15, 2009 through April 15, 2031.Bonds maturing on or after April 15, 2018 are subject to redemption prior to their scheduled maturities on April15, 2017. Bonds maturing in the years 2020, 2022, 2027 and 2031 are subject to mandatory redemption prior tomaturity on various dates. Proceeds of the Bonds were used to cons uct a four-story 112,000 square footbuilding for the System's Northline Mall Campus.
The System and the PFC entered into a Lease with an Option to Purchase effective February 1, 2007, wherebythe System will lease the facility from the PFC and will make semiannual lease payments to the PFC sufficientto pay principal and interest on the PFC Lease Revenue Bonds.
Under terms of a Security Agreement dated February 1, 2007 the PFC has granted a first mortgage lien on andfirst deed of trust title on the Northline Mall Campus Project (the Northline Project) to a bank trustee on behalfof the owners of the Bonds. The PFC has also granted a first priority security interest in the personal propertyassociated with the Northline Project.
The PFC issued $36,950,000 in Lease Revenue Bonds, Series 2006 on October 1, 2006 with interest ratesranging from 4.00% to 5.00%. The Bonds were issued at a discount of $546,238. Bond maturities range fromApril 15, 2008 through April 15, 2031. Bonds maturing on or after April 15, 2017 are subject to redemptionprior to their scheduled maturities on April 15, 2016. Bonds anamring in the years 2028 and 2031 are subject tomandatory redemption prior to maturity on various dates. Proceeds of the Bonds were used to acquire andrenovate a 285,000 square foot building for the System's Alief Campus.
The System and the PFC entered into a Lease with an Option to Purchase effective October 1, 2006, wherebythe System will lease the facility from the PFC and will make semiannual lease payments to the PFC sufficientto pay principal and interest on the PFC Lease Revenue Bonds.
Under terms of a Security Agreement dated October 1, 2006 the PFC has granted a ftrst mortgage lien on andfirst deed of trust title on the Alief Campus Project (the Alief Project) to a bank trustee on behalf of the ownersof the Bonds. The PFC has also granted a first priority security interest in the personal property associated withthe Alief Project.
37

HOUSTON COMMUNITY COLLEGE SYSTEMNOTES TO THE FINANCIAL STATEMENTS
NOTE 8 - BONDS PAYABLE - CONTINUED
The PFC issued $19,155,000 in Lease Revenue Bonds, Series 2005C on December 1, 2005 with interest ratesranging from 4.00% to 5.00%. The Bonds were issued at a discount of $170,064. Bond maturities range fromApril 15, 2007 through April 15, 2030. Bonds maturing on or after April 15, 2016 are subject to redemptionprior to their scheduled maturities on April 15, 2015. Bonds maturing in the years 2026, 2028 and 2030 aresubject to mandatory redemption prior to maturity on various dates. Proceeds of the Bonds were used to acquire39.03 acres of land at a cost of $3,658,550 on the Northeast campus for construction of a Public Safety Institute.The Public Safety Institute consists of three facilities: a six-story fire tower, a two-story burn building and ashooting range at an approximate cost of $13,000,000.
The System and the PFC entered into a Lease with an Option to Purchase effective December 1, 2005, wherebythe System will lease the facility from the PFC and will make semiannual lease payments to the PFC sufficientto pay principal and interest on the PFC Lease Revenue Bonds.
Under terms of a Security Agreement dated December 1, 2005 the PFC has granted a first mortgage lien on andfirst deed of trust title on the Public Safety Institute Project (the PSI Project) to a bank trustee on behalf of theowners of the Bonds. The PFC has also granted a first priority security interest in the personal propertyassociated with the PSI Project.
The PFC issued $11,605,000 in Lease Revenue Bonds, Series 2005A and 2005B on June 1, 2005 with interestrates ranging from 3.50% to 5.00%. The Bonds were issued at a premium of $492,931. Bond maturities rangefrom April 15, 2006 through April 15, 2028. Bonds maturing on or after April 15, 2016 are subject toredemption prior to their scheduled maturities on April 15, 2015. Proceeds of the Bonds were used to acquirethe land and building comprising the System's Westgate campus and 24.27 acres of land adjacent to thebuilding.
The System and the PFC entered into a Lease with an Option to Purchase effective June 1, 2005, whereby theSystem will lease the facility from the PFC and will make semiannual lease payments to the PFC sufficient topay principal and interest on the PFC Lease Revenue Bonds.
Under terms of a Security Agreement dated June 1, 2005 the PFC has granted a first mortgage lien on and firstdeed of trust title on the Westgate Campus Project (the Westgate P:roject) to a bank trustee on behalf of theowners of the Bonds. The PFC has also granted a first priority security interest in the personal propertyassociated with the Westgate Project.
Limited Tax Bonds:
The System issued $144,155,000 in Limited Tax Bonds, Series 2003 ("Series 2003") on December 1, 2003 withinterest rates ranging from 2.0% to 5.0%. The Bonds were issued at a premium of $6,593,497. Bond maturitiesrange from February 15, 2006 through February 15, 2028. Bonds maturing on or after February 15, 2014 aresubject to redemption prior to their scheduled maturities on February 15, 2013. On September 1, 2005 theSystem issued $1,825,000 in bonds as part of the $8,924,992 in Limited Tax Building and Refunding Bonds,Series 2005 (Series 2005). The Series 2003 Bonds are direct obligations of the System and are payable from advalorem taxes levied against all taxable property located within the System. The Series 2003 Bonds were usedfor the construction, maintenance and equipment of school buildings in the System and the purchase ofnecessary sites therefore, and to pay the costs of issuance related to the Bonds. The majority of the Series 2003bonds were defeased in 2012. See Note 9.
38

HOUSTON COMMUNITY COLLEGE SYSTEMNOTES TO THE FINANCIAL STATEMENTS
NOTE 8 - BONDS PAYABLE - CONTINUED
Limited Tax Bonds - Continued:
On September 1, 2005 the System issued $1,825,000 in bonds as part of the $8,924,992 in Limited TaxBuilding and Refunding Bonds, Series 2005 (Series 2005). The Series 2003 Bonds are direct obligations of theSystem and are payable from ad valorem taxes levied against all taxable property located within the System.The Series 2003 Bonds were used for the construction, maintenance and equipment of school buildings in theSystem and the purchase of necessary sites therefore, and to pay the costs of issuance related to the Bonds. TheSeries 2005 bonds were defeased in 2012. See Note 9.
The System issued $398,775,000 in Limited Tax General Obligation Bonds, Series 2013 ("Series 2013") onMarch 19, 2013 with interest rates ranging from 3.0% to 5.0%. The Bonds were issued at a premium of$55,392,571. Bond maturities range from February 15, 2015 through February 15, 2043. Bonds maturing on orafter February 15, 2024, except those maturing in 2027, 2036 and 2037 are subject to redemption prior to theirscheduled maturities on February 15, 2023. Bonds maturing on February 15, 2027 are subject to redemption onFebruary 15, 2015. Bonds maturing on February 15, 2036 are subject to redemption on February 15, 2020.Bonds maturing on February 15, 2037 are subject to redemption on February 15, 2017. The Series 2013 Bondsare direct obligations of the System and are payable from ad valorem taxes levied against all taxable propertylocated within the System. The Series 2013 Bonds will be used for the construction, maintenance andequipment of school buildings in the System and the purchase of necessary sites therefore, and to pay the costsof issuance related to the Bonds.
39

HOUSTON COMMUNITY COLLEGE SYSTEMNOTES TO THE FINANCIAL STATEMENTS
NOTE 8 - BONDS PAYABLE - CONTINUED_
Date SerEsIssued Par VaNe
Student Fee Revenue Bonds:
2005 $20062008
2010
2011
2011T
Maturity Date Interest Rate
51,285,000 04/15/2009 - 2020 3.250% - 5.250%
72,815,000 04/15/2007 - 2030 4.000% - 5.000%54,540,000 04/15/2009 - 2030 4.000% - 5.250%
27,250,000 04/15/2012 - 2031 3.000% - 5.250%
28,975,000 04/15/2012 - 2025 4.000% - 5.250%16,000,000 04/15/2015 - 2021 2.430% - 4.270%
OutstandingBalances at
August 31, 2013
OutstandingBahneesat
August31,2012
33,045,00053,930000
46,730,00025A750o0
28,975,00016,ooo0oo
Total Principal PayableUnamortized Premium and Discount, Net
Total Bonds Payable
Lim ed Tax Bonds:2003 $ 144,155,000 02/15/06- 2028 2.000%- 5.000%2011 109 90,000 02/15/14- 2028 4.000%-5.000%2013 398,775,000 02/15/15 - 2043 3.000%- 5.000%
PFC Lease Revenue Bonds (Blended Component Unit):2005A $ 11,605,000 04/15/2006 - 2028 3.500% - 5.000%2005C 19,155,000 04/15/2007 - 2030 4.000% - 5.000%2006 36,950,000 04/15/2008 - 2031 4.000% - 5.000%2007 58,885,000 04/15/2009 - 2031 4.000% - 5.625%
37,745,000
57A5500048N25,00026375,00031,590,000
16000,000
8,725,000
15f!00,00030,66000050,870,000
9,120,000
16,000,000
31,815,000
52,600,000
818,530,000
82,931,852
$ 901,461,852
455,000
109,490,000
398,775,000
1,195,000
109 90,000
437,810,00030,770,800
$ 468,580,800
40
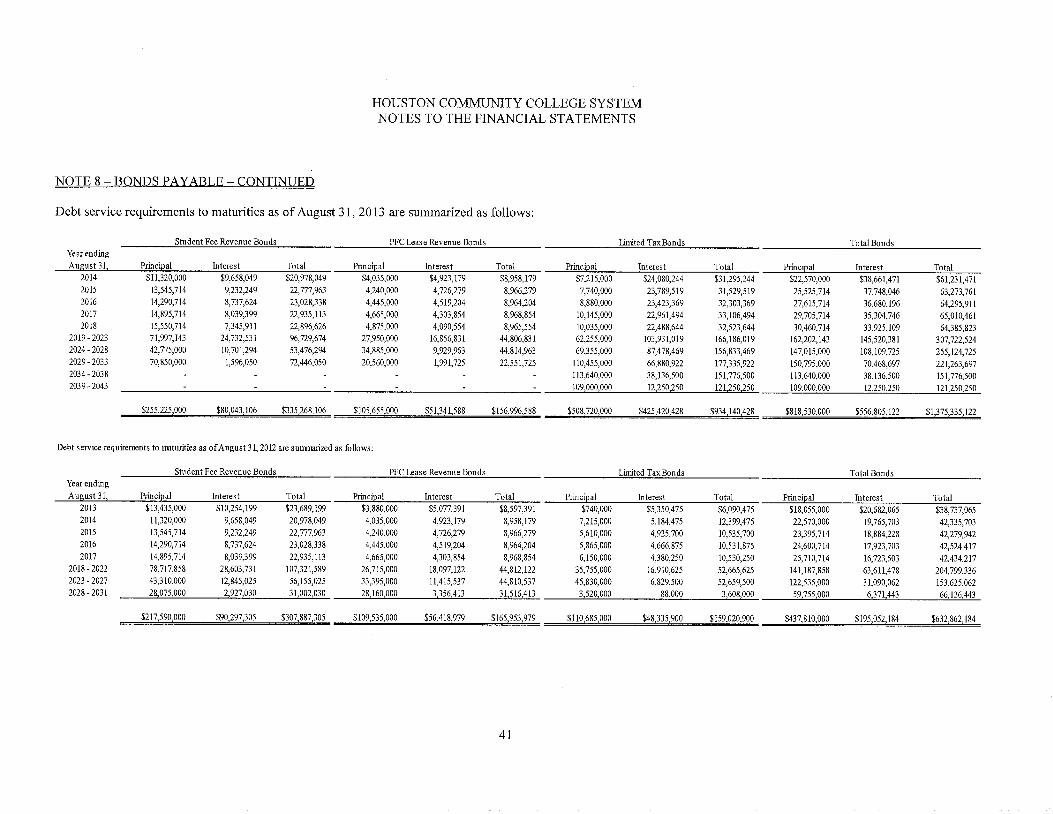
HOUSTON COMMUNITY COLLEGE SYSTEMNOTES TO THE FINANCIAL STATEMENTS
NOTE 8 - BONDS PAYABLE - CONTINUED
Debt service requirements to maturities as of August 31, 2013 are summarized as follows:
Student Fee Revenue Bonds PFC Lease Revenue BondsYear ending
Ausust 31 Principal Interest Total Principal Interest Total
Lin ited TaxBonds Total Bonds
Principal Interest Total Principal Interest Total2014 $11,320,000 $9,658,049 $20,978,049 $4,035,000 $4,923,179 $8,958,179 $7,215,000 $24,080,244 $31,295,244 $22,570,000 $38,661,471 $61,231,471
2015 13,545,714 9,232,249 22,777,963 4,240,000 4,726,279 8,966,279 7,740,000 23,789,519 31,529,519 25,525,714 37,748,046 63,273,761
2016 14,290,714 8,737,624 23,028,338 4,445,000 4,519,204 8,964,204 8,880,000 23,423,369 32,303,369 27,615,714 36,680,196 64,295,911
2017 14,895,714 8,039,399 22,935,113 4,665,000 4,303,854 8,968,854 10,145,000 22,961,494 33,106,494 29,705,714 35,304,746 65,010,4612018 15,550,714 7,345,9tl 22,896,626 4,875,000 4,090,554 8,965,554 10,035,000 22,488,644 32,523,644 30,460,714 33,925,109 64,385,823
2019 - 2023 71,997,143 24,732,531 96,729,674 27,950,000 16,856,831 44,806,831 62,255,000 103,931,019 166,186,019 162,202,143 145,520,381 307,722,524
2024 - 2028 42,775,000 10,701,294 53,476,294 34,885,000 9,929,963 44,814,963 69,355,000 87,478,469 156,833,469 147,015,000 108,109,725 255,124,725
2029-2033 70,850,000 1,596,050 72,446,050 20,560,000 1,991,725 22,551,725 110,455,000 66,880,922 177,335,922 150,795,000 70,468,697 221,263,697
2034 - 2038 113,640,000 38,136,500 151,776,500 113,640,000 38,136,500 151,776,500
2039 - 2043 i09 000,000 12,250 250 121,250 250 109 000 000 12,250,250 121,250 250
$508,720,000 $425,420,428 $934,140,428$255 225 000 $80 043,106 $335,268, i06 $105,655,000 $51,341,588 $156,996,588 $818,530,000 $556,805,122 $1,375,335,122
Debt service requirements to lmtufities as of August 3 l, 2012 are smramfized as follows:
Student Fee Revenue Bonds PFC Lease Revenue Bonds Linaited TaxBonds Total BondsYear ending
August 31 Ptineipal Interest Total Principal Interest Total Principal Interest Total Principal Interest Total
20t3 $13,435,000 $10,254,i99 $23,689,199 $3,880,000 $5,077,391 $8,597,39i $740,000 $5,350,475 $6,090,475 $18,055,000 $20,682,065 $38,737,0652014 11,320,000 9,658,049 20,978,049 4,035,000 4,923,179 8,958,179 7,215,000 5,184,475 12,399,475 22,570,000 19,765,703 42,335,7032015 13,545,714 9,232,249 22,777,963 4,240,000 4,726,279 8,966,279 5,610,000 4,925,700 10,535,700 23,395,714 18,884,228 42,279,942
2016 14,290,714 8,737,624 23,028,338 4,445,000 4,519,204 8,964,204 5,865,000 4,666,875 10,531,875 24,600,714 17,923,703 42,524,417
2017 14,895,714 8,039,399 22,935,113 4,665,000 4,303,854 8,968,854 6,150,000 4,380,250 10,530,250 25,710,714 16,723,503 42,434,217
2018 - 2022 78,717,858 28,603,731 107,321,589 26,715,000 18,097,122 44,812,122 35,755,000 16,910,625 52,665,625 141,187,858 63,61t,478 204,799,3362023 - 2027 43,310,000 12,845,025 56,155,025 33,395,000 11,415,537 44,810,537 45,830,000 6,829,500 52,659,500 122,535,000 31,090,062 153,625,0622028 - 2031 28 075,000 2,927,030 31,002,030 28,160,000 3,356,413 31,516 413 3,520,000 88,000 3,608 000 59,755,000 6,371 443 66,126,443
$217,590,000 $90 297,305 $307,887,305 $109,535,000 $56,418,979 $I65,953,979 $110,685,000 $48,335,900 $159 020 900 $437,810,000 $195,052,184 $632,862,184
41

HOUSTON COMMUNITY COLLEGE SYSTEMNOTES TO THE FINANCIAL STATEMENTS
NOTE 9 - DEFEASANCE OF LONG-TERM DEBT
The System issued $109,490,000 in Limited Tax Refunding Bonds, Series 2011 ("Series 2011 Bonds") onOctober 12, 2011 with interest rates ranging from 4.00% to 5.00%. The Series 2011 Bonds were used topartially refund $112,195,000 of outstanding Limited Tax Bonds, Series 2003 ("Series 2003 Bonds") withinterest rates ranging from 5.00% to 5.25%. The optional redemption date of the Series 2003 Bonds is February14, 2013. Additionally, the Series 2011 Bonds were used to totally refund $4,955,000 of outstanding LimitedTax Building and Refunding Bonds, Series 2005 ("Series 2005") with interest rates of 5.00%. The optionalredemption date of the Series 2005 Bonds was November 14, 2011.
Net proceeds of $125,612,347, after payment of $645,228 in underwriting fees were used as follows: 1)$125,221,930 for the purchase of U.S. government securities; and 2) $389,917 to pay insurance and otherissuance costs.
Proceeds of $125,221,930 of the Series 20011 Bonds were placed in an irrevocable trust with an escrow agentand were used to redeem the 2003 Bonds on the call date of February 14, 2013. The 2005 Bonds were calledand retired on November 14, 2011. The liability for these refunded bonds and the securities held by the escrowagent have been excluded from the Statement of Net Position.
The current refunding had the following results:
• $7,632,450 in future cash flow savings resulting fi:om a decrease in the aggregate debt servicepayments over the next seventeen years.
• Economic gain of $8,592,860, which is the difference between the present values of the old and newdebt service payments.
Advance funding valuation of $8,071,930 was created, which is the difference between thereacquisition price of $125,221,930 and the carrying amount of the refunded bonds of $117,150,000.The valuation is deferred and amortized as a component of interest expense over the term of thedefeased Series 2003 Bonds.
NOTE 10 - DEFEASED BONDS OUTSTANDING
The defeased bonds outstanding at August 31, 2013 and 2012 were as follows:
Bond issue
Series 2003 Limited TaxBondsSeries 2005 Limited TaxBonds
Total
Year Refunded
2006/2012
2012
Par Value OutstandingAugust 31, 2013 August 31, 2012
119,295,000
4,955,000
$ $ 124,250,000
42

HOUSTON COMMUNITY COLLEGE SYSTEMNOTES TO THE FINANCIAL STATEMENTS
NOTE 11 - FUNDS HELD 1N TRUST BY OTHERS
The balances of funds held in trust by others on behalf of the Public Facility Corporation are reflected in thefinancial statements. At August 31, 2013 and 2012, there were ten funds for the benefit of the Public FacilityCorporation. These trust assets represent bond proceeds to be utilized for construction purposes. The assets ofthese funds are reported by the trustee at values totaling $1,794,080 and $3,113,910 at August 31, 2013 andAugust 31, 2012, respectively.
NOTE 12 - NOTES PAYABLE
The System issued $19,590,000 in Maintenance Tax Notes, Series 2011A ("Notes") on October 12, 2011 withinterest rates ranging from 3.00% to 5.25%. The Notes were issued at a premium of $2,467,247. Note maturitiesrange from February 15, 2013 through February 15, 2031. Notes maturing on or after February 15, 2022 aresubject to redemption prior to their scheduled maturities on February 15,2021. The Notes are direct obligationsof the System and are payable from ad valorem taxes levied against all taxable property located within theSystem. The Notes will be used for the renovation and equipment of existing facilities and replacement ofinformation technology systems, and to pay the costs of issuance related to the Notes.
The System issued $41,560,000 in Maintenance Tax Notes, Series 2011 ("Notes") on March 10, 2011 withinterest rates ranging from 3.00% to 5.25%. The Notes were issued at a premium of $1,800,441. Note maturitiesrange from February 15, 2012 through February 15, 2031. Notes maturing on or after February 15, 2022 aresubject to redemption prior to their scheduled maturities on February 15, 2021. The Notes are direct obligationsof the System and are payable from ad valorem taxes levied against all taxable property located within theSystem. The Notes will be used for the renovation and equipment of existing facilities and replacement ofinformation technology systems, and to pay the costs of issuance related to the Notes.
The System issued $47,645,000, in Maintenance Tax Notes, Series 2010 ("Notes") on July 29, 2010 withinterest rates ranging from 2.00% to 5.00%. The Notes were issued at a premium of $4,925,575. Note maturitiesrange from February 15, 2012 through February 15, 2029. Notes maturing on or after February 15, 2021 aresubject to redemption prior to their scheduled maturities on February 15, 2020. The Notes are direct obligationsof the System and are payable from ad valorem taxes levied against all taxable property located within theSystem. The Notes will be used for the renovation and equipment of existing facilities, and to pay the costs ofissuance related to the Notes.
In 2009, the System entered into an agreement to finance the purchase of software licenses from Oracle CreditCorporation. The note is payable over three years and is non-interest bearing. The note was paid-off in 2012.
The System issued $13,830,000, in Maintenance Tax Notes, Series 2009 ("Notes") on September 1, 2009 withinterest rates ranging from 2.50% to 5.00%. The Notes were issued at a premium of $451,444. Note maturitiesrange from February 15, 2011 through February 15, 2025. Notes maturing on or after February 15, 2020 aresubject to redemption prior to their scheduled maturities on February 15, 2019. The Notes are direct obligationsof the System and are payable from ad valorem taxes levied against all taxable property located within theSystem. The Notes will be used to pay for rehabilitation and energy conservation renovations to existingfacilities, and to pay the costs of issuance related to the Notes.
43

HOUSTON COMMUNITY COLLEGE SYSTEMNOTES TO THE FINANCIAL STATEMENTS
NOTE 12 - NOTES PAYABLE - CONTINUED
The System issued $54,975,000 in Maintenance Tax Notes, Series 2008 ("Notes") on March 1, 2008 withinterest rates ranging from 3.00% to 5.00%. The Notes were issued at a premium of $1,937,320. Note maturitiesrange from February 15, 2009 through February 15, 2028. Notes maturing on or after February 15, 2019 aresubject to redemption prior to their scheduled maturities on February 15, 2018. The Notes are direct obligationsof the System and are payable from ad valorem taxes levied against all taxable property located within theSystem. The Notes will be used for the renovation and equipment of existing facilities, and to pay the costs ofissuance related to the Notes.
The System issued $12,000,000 in Maintenance Tax Notes, Series 2006 ("Notes") on February 1, 2006 withinterest rates ranging from 3.00% to 4.50%. The Notes were issued at a discount of $88,756. Note maturitiesrange from February 15, 2007 through February 15, 2026. Notes maturing on or after February 15, 2007 aresubject to redemption prior to their scheduled maturities on February 15, 2016. The Notes are direct obligationsof the System and are payable from ad valorem taxes levied against all taxable property located within theSystem. The Notes were used for the construction of a central utility plant on the Central campus, and to pay thecosts of issuance related to the Notes.
Maturities of notes payable at August 31, 2013 were as follows:
Central Utility
Year ending August 31 PlantCapital
Improvements Total
2014 $ 88 9502015 888,5502016 891,2502017 888,0502018 888,566
2019-2023 4,442,5692024-2028 2,666,2912029-2031
14,27 220 $ 15,169,170
14,272,383 15,160,933
14,264,983 15,156,233
14,257,958 15,146,00814,277,426 15,165,99271,240,328 75,682,897
67,425,744 70,092,03518,553,074 18,553,074
Total Payments
Less Amounts Representing Interest
Total Principal Payable
11,555,226 9.228,571,116 240,126,342(2,776,068) (60,333,386) (63,109,454)
$ 8,779,158 $ 168,23Z730 $ 17Z016,888
44
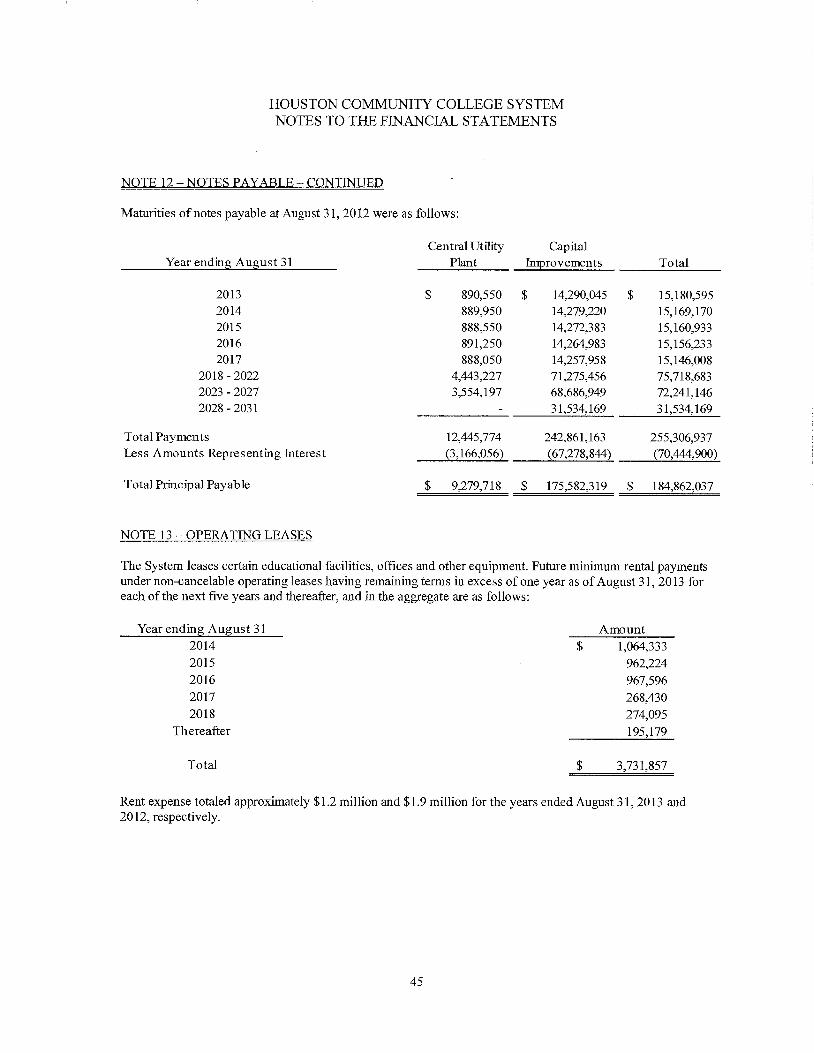
HOUSTON COMMUNITY COLLEGE SYSTEMNOTES TO THE FINANCIAL STATEMENTS
NOTE 12 - NOTES PAYABLE - CONTINUED
Maturities of notes payable at August 31, 2012 were as follows:
Year ending August 31Central Utility Capital
Plant Improvements Total
2013
2014
2015
2016
20172018 - 20222023 - 2027
2028 - 2031
890,550 $ 14,290,045 $ 15,180,595
889,950 14,279,220 15,169,170888,550 14,272,383 15,160,933
891,250 14,264,983 15,156,233
888,050 14,257,958 15,146,0084,443,227 71,275,456 75,718,6833,554,197 68,686,949 72,241,146
31,534,169 31,534,169
Total Payments
Less Amounts Representing Interest
Total Principal Payable
12,445,774 242,861,163 255,306,937(3,166,056) (67,278,844) (70,444,900)
$ 9,279,718 $ 175,582,319 $ 184,862,037
NOTE 13 - OPERATING LEASES
The System leases certain educational facilities, offices and other equipment. Future minimum rental paymentsunder non-cancelable operating leases having remaining terms in excess of one year as of August 31, 2013 foreach of the next five years and thereafter, and in the aggregate are as follows:
YearendingAugust31 Amount2014 $ 1,064,3332015 962,2242016 967,5962017 268,4302018 274,095
Thereafter 195,179
Total $ 3,731,857
Rent expense totaled approximately $1.2 million and $1.9 million for the years ended August 31, 2013 and2012, respectively.
45

HOUSTON COMMUNITY COLLEGE SYSTEMNOTES TO THE FINANCIAL STATEMENTS
NOTE 14 - LEASED FACILITIES
The System leases office space to other entities under operating leases. Minimum lease payments due to theSystem under these operating leases as of August 31, 2013 are as follows:
Year EndingAugust 31, Amount
2014 $ 4,523,320
2015 4,447,0612016 2,425,8142017 30,0002018 30,000
Total $ 11,456,195
The System received approximately $5.0 million in rental income for the years ended August 31, 2013 and2012, respectively.
NOTE 15 - RETIREMENT PLANS
The State of Texas has joint contributory retirement plans for almost all its employees. On-behalf payments ofthese benefits are recognized as restricted revenues and restricted expenses during the year. One of the primaryplans in which the system participates is administered by the Teacher Retirement System of Texas.
Teacher Retirement System of Texas
Plan Description. The System contributes to the Teacher Retirement System of Texas (TRS), a cost-sharingmultiple employer defined benefit pension plan. TRS administers retirement and disability annuities, and deathand survivor benefits to employees and beneficiaries of employees of the public school systems of Texas. Itoperates primarily under the provisions of the Texas Constitution, Article XVI, Sec. 67, and Texas GovernmentCode, Title 8, Subtitle C. The Texas state legislature has the authority to establish and amend benefit provisionsof the pension plan. TRS issues a publicly available fmancial report with required supplementary informationwhich can be obtained from www.trs.state.tx.us, under the TRS Publications heading.
Funding Policy. Contribution requirements are not actuarially determined but are established and amended bythe Texas state legislature. The state funding policy is as follows: (1) The state constitution requires thelegislature to establish a member contribution rate of not less than 6% of the member's annual compensationand a state contribution rate of not less than 6% and not more than 10% of the aggregate annual compensationof all members of the system; (2) A state statute prohibits benefits improvements or contribution reductions if,as result of a the- particular action, the time required to amortize TRS' unfimded actuarial liabilities would beincreased to a period that exceeds 31 years, or, if that amortization period already exceeds 31 years, the periodwould be increased by such action. State law provides for a member contrition rate of 6.4% for fiscal years2011 through 2013 and a state contribution rate of 6.4%, 6.0% and 6.664% for fiscal years 2013, 2012 and2011, respectively.
46

HOUSTON COMMUNITY COLLEGE SYSTEMNOTES TO THE FINANCIAL STATEMENTS
NOTE 15 - RETIREMENT PLANS - CONTINUED
Optional Retirement Plan
Plan Description. The state has also established an optional retirement programs for institutions of highereducation. Participation in the Optional Retirement Program is in lieu of participation in the TeacherRetirement System. The optional retirement program provides for the purchase of annuity contracts andoperates under the provisions of the Texas Constitution, Article XVI, Sec. 67, and Texas Government Code,Title 8, Subtitle C.
Funding Policy. Contribution requirements are not actuarially determined but are established and amended bythe Texas state legislature. The percentages of participant salaries currently contributed by the state and eachparticipant are 6.0% and 6.65%, respectively. As part of the College cost saving initiatives for fiscal year 2012,the College no longer provides subsidies for employees who participate in ORP. Benefits fully vest after oneyear plus one day of employment. Because these are individual annuity contracts, the state has no additional or
unfunded liability for this program.
Retirement Expense
The retirement expense to the State for the System was $4,407,127, $3,956,728 and $8,423,783 for the fiscalyears ended August 31, 2013, 2012 and 2011, respectively. This amount represents the portion of expendedappropriations made by the State Legislature on behalf of the System. The retirement expense to the State onbehalf of the System did not reflect a shortfall of $3,982,129 in fiscal year 2012 for Teacher Retirement Systemof Texas. However, in fiscal year 2013, the state legislator determined that the shortfall of $2,985,498 and$3,982,129 for the fiscal years 2012 and 2013 is an expense to the System. The shortfall for both years isexpensed in fiscal year 2013.
The total payroll for all System employees was $174,038,989 and $169,182,563 for fiscal years 2013 and 2012,respectively. The total payroll of employees covered by the Teacher Retirement System was $100,405,708 and$96,247,712 and the total payroll of employees covered by the Optional Retirement Program was $41,672,052and $42,254,561 for fiscal years 2013 and 2012, respectively.
NOTE 16 - DEFERRED COMPENSATION PROGRAM
The System's employees may elect to defer a portion of their earnings for income tax and investment purposespursuant to authority granted in Government Code 609.001. Both a 403(b) plan and a 457 plan are available.The plans are funded by employee contributions such that the employer is not liable for the diminution in valueor loss of all or part of the participating employees' deferred amounts or investment income due to marketconditions or the failure, insolvency or bankruptcy of a qualified vendor. The total number of employeesparticipating in the programs at August 31, 2013 and 2012 were 638 and 659, respectively.
During fiscal years ended August 31, 2013 and August 31, 2012, employee contributions amounting to$4,106,672 and $4,127,303 were invested in the plans respectively.
47

HOUSTON COMMUNITY COLLEGE SYSTEMNOTES TO THE FINANCIAL STATEMENTS
NOTE 17 - COMPENSATED ABSENCES
Full-time employees earn personal leave at the rate of 12 hours for every month of service in the System up to amaximum of 680 hours. Each pay period 4 sick leave hours and 2 catastrophic leave hours will be accrued.Leave hours are not available for use until accrued. After the 680 hour maximum is reached, the full-timeemployee will accrue catastrophic leave of 12 hours per month up to a maximum of 1000 hours. Earnedpersonal or catastrophic leave unused by employees is not under any circumstances compensated by the System.Earned personal or catastrophic days may be used by employees for sick leave.
Employees earn up to 160 vacation hours depending on the number of years employed with the System. Up to40 earned vacation hours may be carried forward by employees from one fiscal year to another, but must beutilized before the end of February of the following year or be lost. An employee is compensated for anyearned but unused vacation hours upon termination of employment with the System. Accrued compensableabsences of $2,261,498 and $2,351,464for earned but unused vacation hours in accordance with the vacationearning and carry-forward policy of the System has been included in the financial statements for the yearsended August 31, 2013 and 2012, respectively.
NOTE 18 - COMMITMENTS
The System has entered into contracts for the planning and construction of new facilities, as well as therenovation and repair of existing campuses. Commitments remaining under such contracts were $36,471,334 atAugust 31, 2013. The System has also entered into contracts for technology capital projects, with commitmentsof $8,417,333 remaining at August 31, 2013. Proceeds from the sales of various bonds and notes will fund thepurchase and construction of new facilities and the technology projects.
The Public Facility Corporation has entered into contracts for the planning and construction of new facilities, aswell as the renovation and repair of existing campuses. Commitments remaining under such contracts were$146,582 at August 31, 2013. Proceeds fi:om the sale of the Public Facility Corporation Lease Revenue Bondswill fund the construction of new facilities.
Community College of Qatar
In May 2010, the System entered into a five-year service agreement with The Community College of Qatar(CCQ) to develop the community college model to meet the educational needs of Qatar. The agreement for thefive-year period represents a $45.6 million commitment by the CCQ for HCC services plus other necessarycosts. Either party may terminate the agreement with a 180 calendar day notice provided that the 180 day noticeshall not end prior to the last day of the academic year. The System is developing a custom curriculum and will
institute a fully operational community college. HCC is also providing the faculty and staff while the CCQ is indevelopment. Classes at the CCQ began in Fall 2010. The CCQ will rehnburse the System in accordance withthe terms of the agreement. At August 31, 2013 and 2012, amounts due under this agreement totaled$1,352,007 and $1,999,842, respectively, and are included in other receivables in the accompanying Statementsof Net Position.
NOTE 19 - CONTINGENCIES
From time to time, the System is a defendant in legal proceedings related to its operations as a college. In thebest judgment of the System's management, after consultation with its legal counsel, the outcome of any presentlegal proceedings will not have a materially adverse effect on the accompanying financial statements.
48

HOUSTON COMMUNITY COLLEGE SYSTEMNOTES TO THE FINANCIAL STATEMENTS
NOTE 19 - CONTINGENCIES - CONTINUED
The System has received Federal, State, and other financial assistance in the form of contracts and grants thatare subject to review and audit by the grantor agencies. Such audits could result in requests for reimbursementby the grantor agency for expenditures disallowed under terms and conditions specified in the contract and grantagreements. In the opinion of the System's management, such disallowances, if any, would not be significant inrelation to the financial statements of the System.
January 2013, State of Texas House Bill Section m-Rider 21 mandated Junior Colleges to pay the retirementshortfall for the 2012-13 biennium by August 2013. Houston Community College paid $2,985,498 for fiscalyear 2012 and $3,982,129 for fiscal year 2013.
A penalty in the amount of $724,100 was accessed by IRS for incorrect filing of 1098's for the year of 2011.These filings violated Internal Revenue code (IRC) section 6721. The System has responded to IRS in anattempt to mitigate this matter and has included a contingent liability in the amount of $724,100 in the fiscalyear 2013 financial statements.
NOTE 20 - CONTRACT AND GRANT AWARDS
Contract and grant awards are accounted for in accordance with the requirements of the accounting principlesgenerally accepted in the United States of America. Funds received, but not expended during the reportingperiod, are recorded as unearned revenues. Revenues are recognized as funds are actually expended. ForFederal and State contract and grant awards, funds expended, but not collected, are reported as accountsreceivable. Contract and grant awards that are not yet funded and for which the System has not yet performedservices are not included in the f'mancial statements.
Revenues are disclosed on Exhibit 2. For Federal contract and grant awards, funds expended, but not collected,are reported as Federal Receivables on Exhibit 1. Non-federal contract and grant awards for which funds areexpended, but not collected, are reported as Accounts Receivable on Exhibit 1. Contract and grant awards thatare not yet funded and for which the institution has not yet performed services are not included in the fmancialstatements. Contract and grant awards funds already committed, e.g., multi-year awards, or funds awardedduring fiscal years 2013 and 2012 for which monies have not been received nor funds expended totaled$8,160,160 and $13,410,654 respectively. Of these amounts, $4,213,051 and $10,169,394 were from FederalContract and Grant Awards; $1,434,172 and $768,138 were from State Contract and Grant Awards; $87,379and $78,785 from Local Contract and Grant Awards; and $2,425,558 and $2,394,337 were from NonGovernmental Contract and Grant Awards for the fiscal years ended August 31, 2013 and 2012, respectively.
NOTE 21 -POST RETIREMENT HEALTH CARE AND LIFE INSURANCE BENEFITS
In addition to providing pension benefits, the State provides certain health care and life insurance benefits forboth active and retired employees. Almost all of the employees may become eligible for these benefits if theyreach normal retirement age while working for the State. These and similar benefits for active employees areprovided through a self-funded State plan which is administered by an insurance company. The premiums arebased on benefits paid during the previous year. The State's contribution per full-time employee ranged from$470.38 and $919.82 per month for the year ended August 31, 2013 ($438.30 and $856.94 per month for theyear ended August 31, 2012) and totaled $18,427,127, for the year ended August 31, 2013 ($16,791,073 for theyear ended August 31, 2012).
49

HOUSTON COMMUNITY COLLEGE SYSTEMNOTES TO THE FINANCIAL STATEMENTS
NOTE 21 - POST RETIREMENT HEALTH CARE AND LIFE INSURANCE BENEFITS - CONTINUED
The cost of premiums for 517 retirees in the year ended August 31, 2013 was $3,055,213 (retiree benefits for509 retirees cost $2,691,906 in the year ended August 31, 2012). For 2,261 active employees, the cost ofpremiums was $15,371,915 for the year ended August 31, 2013 (active employee benefits for 2,193 employeescost $14,099,170 for the year ended August 31, 2012). On behalf payments of these benefits were recognized asrestricted revenues and restricted expenses during the year.
NOTE 22 - POST EMPLOYMENT BENEFITS OTHER THAN PENSIONS
The System contributes to the State Retiree Health Plan (SRHP), a cost-sharing, multiple-employer, definedbenefit postemployment healthcare plan administered by the Employees Retirement System of Texas (ERS).SRHP provides medical benefits to retired employees of participating universities, community colleges andstate agencies in accordance with Chapter 1551, Texas Insurance Code. Benefit and contribution provisions ofthe SRHP are authorized by State law and may be amended by the Texas Legislature.
ERS issues a publicly available financial report that includes financial statements and required supplementaryinformation for SRHP. That report may be obtained from ERS via their website at http://www.ers.state.tx.us/.
Section 1551.055 of Chapter 1551, Texas Insurance Code provides that contribution requirements of the planmembers and the participating employers are established and may be amended by the ERS board oftrustees. Plan members or beneficiaries receiving benefits pay any premium over and above the employercontribution.
The employer's share of the cost of retiree healthcare coverage for the current year is known as the implicit ratesubsidy. It is the difference between the claims costs for the retirees and the amounts contributed by the retirees.The ERS board of trustees sets the employer contribution rate based on the implicit rate subsidy which isactuarially determined in accordance with the parameters of GASB statement 45.
The employer contribution rate represents a level of funding that, if paid on an ongoing basis, is projected tocover normal costs each year and amortize any unfunded actuarial liabilities (or funding excess) of the plan overa period not to exceed thirty years.
The System's contributions to SRHP for the years ended August 31, 2013 and 2012 were $3,049,496 and$2,683,786, respectively, which equaled the required contributions each year.
NOTE 23 - PROPERTY TAX
The System's property tax is levied each October 1 on the basis of assessed values listed as of the prior January1 for all real and business personal property located in System.
At August 31:
Assessed valuation of the System
Less: Exemptions
Net Assessed Valuation of the System
2013
$145,875,030,461
(12,890,703,534)
$132,984,326,927
2012
$159,141,889,758
(31,729,564,366)
$127,412,325,392
50

HOUSTON COMMUNITY COLLEGE SYSTEMNOTES TO THE FINANCIAL STATEMENTS
NOTE 23 - PROPERTY TAX - CONTINUED
Harris County's reporting methodology is that totally exempted properties are included at their fully appraisedvalue in the current year. Effective fiscal year 2013 (Tax year 2012), significant changes were made to categoryD, category G and totally exempt category. Due to the conversion property in the X category has been removedfrom the appraised value, this is the methodology that will be used going forward.
Taxes levied for the years ended August 31, 2013 and 2012, based on the certified rolls, as reported by thetaxing authorities amounted to $129,224,860 and $123,873,185, respectively, which includes any penalty andinterest assessed if applicable.
Taxes are due by January 31 of the year following the levy and are delinquent if not paid before February 1 ofthat year.
The authorized and assessed tax rate for the system were as follows:
August 31, 2013 August 31, 2012Current Debt Current Debt
Operations Service Total Operations Service Total
Authorized Rate per $ 0.50 $ 0.50 $ 1.00 $ 0.50$100 valuation
Assessed Rate per $ 0.079673 $0.017500 $ 0.097173 $ 0.083399$100 Valuation
$ 0.50 $ 1.00
$ 0.013823 $ 0.097222
Tax collections for the years ended August 31, 2013 and 2012 were as follows:
Current Taxes Collected
Delinquent Taxes Collected
Penalties and Interest Collected
2013 2012$ 126,900,573 $ 121,247,023
1,639,206 2,645,8211,496,150 1,371,984
Total $ 130,035,929 $ 125,264,828
For the years ended August 31, 2013 and 2012 tax collections represent 98% and 98% of the tax levy,respectively. Taxes assessed are recorded in the System's fmancial statements net of the related allowance foruncoltectable taxes, based upon the System' expected collection experience. The use of tax proceeds isrestricted to either maintenance and operations or interest and sinking expenditures.
The Harris County, City of Missouri City, and the Fort Bend Appraisal Districts (the Appraisal Districts),separate governmental entities, are responsible for the recording and appraisal of property for all taxing units intheir respective counties, including the System. The Appraisal Districts are required by State law to assessproperty at 100% of its appraised value. Further, real property must be reappraised at least every four years.Under certain circumstances, taxpayers and taxing units, including the System, may challenge orders of theappraisal review boards through various appeals and, if necessary, institute legal action.
The System has entered into agreements with the county tax assessors to bill and collect the System's propertytaxes, net of a collection fee.
51

HOUSTON COMMUNITY COLLEGE SYSTEMNOTES TO THE FINANCIAL STATEMENTS
NOTE 24 - RELATED PARTY TRANSACTIONS
The Houston Commtmity College Foundation (the "Foundation") is a nonprofit organization with the solepurpose of supporting the educational and other activities of the System. The Foundation solicits donations andacts as coordinator of gifts made to the System. The Foundation remitted $405,768 and $688,266 to the Systemfor scholarship awards during the years ended August 31, 2013 and August 31, 2012, respectively. TheFoundation remitted $1,752,006 and $2,380,823 to the System to fund grant programs during the years endedAugust 31, 2013 and August 31, 2012, respectively.
During the years ended August 31, 2013 and August 31, 2012, the System provided staff assistance to theFoundation at no cost. The System's management estimates the value of the services provided to theFoundation in fiscal years August 31, 2013 and August 3l, 2012 to be approximately $1,056,000 and$1,128,000, respectively. As of August 31, 2013 and 2012, no amounts were due to the System from theFoundation. In January 2011 the Foundation signed a lease with the System for rental of office space at $1,200per month. The Foundation paid the System $14,400 in rent during the years ended August 31, 2013 and 2012.
NOTE 25 - RESTATEMENTS
In March 2012, GASB issued Statement No. 65, Items Previously Reported as Assets and Liabilities. TheSystem implemented these changes for the year ended August 31, 2013. Accordingly, the System expensed theissuance costs of $2,570,661 for bonds issued in the current fiscal year, and also wrote-off to beginning netposition those capitalized bond issuance costs from prior years.
In addition, management of the System noted a capital asset correction was required for the year ended August31, 2012 and accordingly, a prior period adjustment was recorded..
The net position as of September 1, 2012 has been adjusted for the effect of the restatements of the prior years.The cumulative effect on the beginning net position is as follows:
Net Position as of August 31, 2012, as Previously Reported
Capitalized Bond Issuance Costs Written-Off
Capital As set Correction
Net Position as of August 31, 2012, as Restated
$ 331,926,824
(8,196,515)
(1,413,516)
$ 322.316.793
52

SUPPLEMENTARY SCHEDULES

Schedule AHOUSTON COMMUNITY COLLEGE SYSTEM
SCHEDULE OF OPERATING REVENUESFOR THE YEAR ENDED AUGUST 31, 2013
(With Memorandum Totals for the Year Ended August 31, 2012)
Unrestricted Restricted
Total
Educational Auxiliary August 31, 2013 August 31, 2012
Act iv it ies Enterprises Tot al Tot al
Tuition:
State Funded Courses:
In-District Resident Tuition
Out-of-District Resident Tuition
T PEG (Credit)State Funded Continuing Education:
TPEG (Non-Credit)Non-Resident Tuition
Non-State Funded Continuing Edncation
$22,286,600 $ $22,286,600 $ $ 22,286,600 $ 23,087,311
7,878,193 7,878,193 7,878,193 8,383,137
1,752,919 1,752,919 1,752,919 1,851,224
7,653,992 7,653,992 7,653,992 7,518,363
392,584 392,584 392,584 401,13015,008,933 15,008,933 15,008,933 15,508,306
630,500 630,500 630,500 917,193
55,603,721 55,603,721 55,603,721 57,666,664
1,056,555 1,056,555 1,056,555 1,270,570
139 139 139 11,i2435,068,637 35,068,637 35,068,637 36,609,903
4,486,634 4,486,634 4,486,634 4,585,556
11,265,617 11,265,617 11,265,617 11,626,671
15,872,087 15,872,087 15,872,087 16,673,190
1,964,786 1,964,786 2,061,020 4,025,806 3,880,923
69,714,455 69,714,455 2,061,020 71,775,475 74,657,937
Total Tuition
Fees:
Installment Plan Fees
Non-Instructional Contract Training Fees
General Fees
Laboratory FeesOther Fees
Out-of-District Fees
Student Service Fees
Total Fees
Scholarship Allowances and Discounts:
Remissions and Exemptions-State
Remissions and Exemptions-LocalT itle IV Federal Grant s
Other Federal Grants
T PEG Awards
Other State Grants
Other Local Grants
Total Scholarship Allowances
Total Net Tuition and Fees
(7,245,331) (7,245,331) (7,245,33 l ) (7,892,947)(1,881,166) (1,881,i66) (21,634) (1,902,800) (1,587,844)
(39,702,624) (39,702,624) (39,702,624) (44,061,830)(2,734,302) (2,734,302) (2,734,302) (2,744,115)(1,249,419) (1,249,419) (1,249,419) (1,607,786)(1,949,721) (1,949,721 (1,949,721) (1,813,665)(1,161,046) (1,161,046 (1,161,046) (1,200,457)
(55,923,609) (55,923,609 (21,634) (55,945,243) (60,908,644)
69,394,567 69,394,567 2,039,386 71,433,953 71,415,957
Other Operating Revenues:
Federal Grants and Contracts 14,702,419 14,702,419 14,702,419 16,848,269
State Grants and Contracts 6,156,585 6,156,585 6,156,585 5,152,251Local Grants And Contracts 81,407 81,407 81,407 95,226
Non-Governmental Grants And Contracts 2,413,531 2,413,531 2,413,531 2,497,892
Sales And Services 192,963 192,963 365 193,328 329,383
Total Other Operating Revenues I92,963 23,353,942 23,546,905 365 23,547,270 24,923,021
Auxiliary Enterprises:
Bookstore 2,732,804 2,732,804 2,864,738
Long-Term Parking 654,237 654,237 530,948
Qatar 7,082,446 7,082,446 6,682,193
Rental Of Facilities 4,939,220 4,939,220 5,365,882
Restaurant 507,256 507,256 510,315
Vending And Other Commissions 176,936 176,936 142,418
Total Auxiliary Enterprises
Total Operating Revenues
16,092,899 16,092,899 16,096,494
$69,587,530 $23,353,942 $92,941,472 $18,132,650 $ 111,074,122 $ 112,435,472
*In accordance with Education Code 50,033 $2,145,503 and $2,252,354 of tuition for fiscal years ended August 31. 2013 and 2012, respectively were set
aside for Texas Public Education Grants (TPEG).
See Independent Auditor's Report
54

Schedule BHOUSTON COMMUNITY COLLEGE SYSTEM
SCHEDULE OF OPERATING EXPENSES BY OBJECTFOR THE YEAR ENDED AUGUST 31, 2013
(With Memorandum Totals for the Year Ended August 31, 2012)
Unrestricted Educational Activities
Instruction
Public Smwice
Academic Support
Student Services
Institutional Support
Operation and Maintenance of Plant
Auxiliary Enterprises
Auxiliary Enterprises - Qatar Expenses
Depreciation - Buildings
Depreciation - Equipment
Depreciation - Library Books
Total Operating Expenses
Total Educational Activities
Total Um'estricted Educational Activities
Restricted Educational ActivitiesInstruction
Public Service
Academic SupportStudent Services
Institutional Support
Scholarship and Fellowship
Total Restricted Educational Activities
85,427,941 $ $10,185,667 $ 3,305,066
581,219 69,794 545,01916,614,679 1,980,835 2,335,66518,544,961 2,210,967 3,288,171
35,590,627 4,243,186 24,637,137
2,068,002 248,329 25,298,473
158,827,429 18,938,778 59,409,531 237,175,738 218,265,742
882,251 6,614,010 135,648 9392354,482,127 496,580 5,357,851
831,602 1,286,245 144,122 753,2021,808,114 1,435,680 35,361 498,837
2,755,290
- 57,092,409
8,004,094 12,091,225 811,711 64,641,534
166,831,523 12,091,225 19,750,489 124,051,065 322,724,302 308,292,863
1,663,204 339,906 9,908,1455,544,240 988,743 316,519
- 12,004,551
- 6,953,462
- 534,021
$ 174,038,967 $ 12,091,225 $21,079,138 $ 153,767,763
See Independent Auditor's Report
55
2013
Total
98,918,674
1,196,032
20,931,179
24,044,099
64,470,950
27,614,804
8,571,144
10,336,558
3,015,171
3,777,992
2,755,290
57,092,409
85,548,564
11,911,255
6,849,502
12,004,551
6,953,462
534,021
360,977,093
(Exh 2)
Operating ExpensesSalaries Benefits Other
and Wages State Local Expenses
Restated
2012
Total
92,216,858
1,165,261
19,399,649
21,255,300
56,258,896
27,969,778
8,102,639
10,703,664
3,371,524
3,651,187
2,693,735
61,504,372
90,027,121
9,608,219
6,128,576
11,403,994
6,906,714538,094
342,878,460
(Exhib 2)
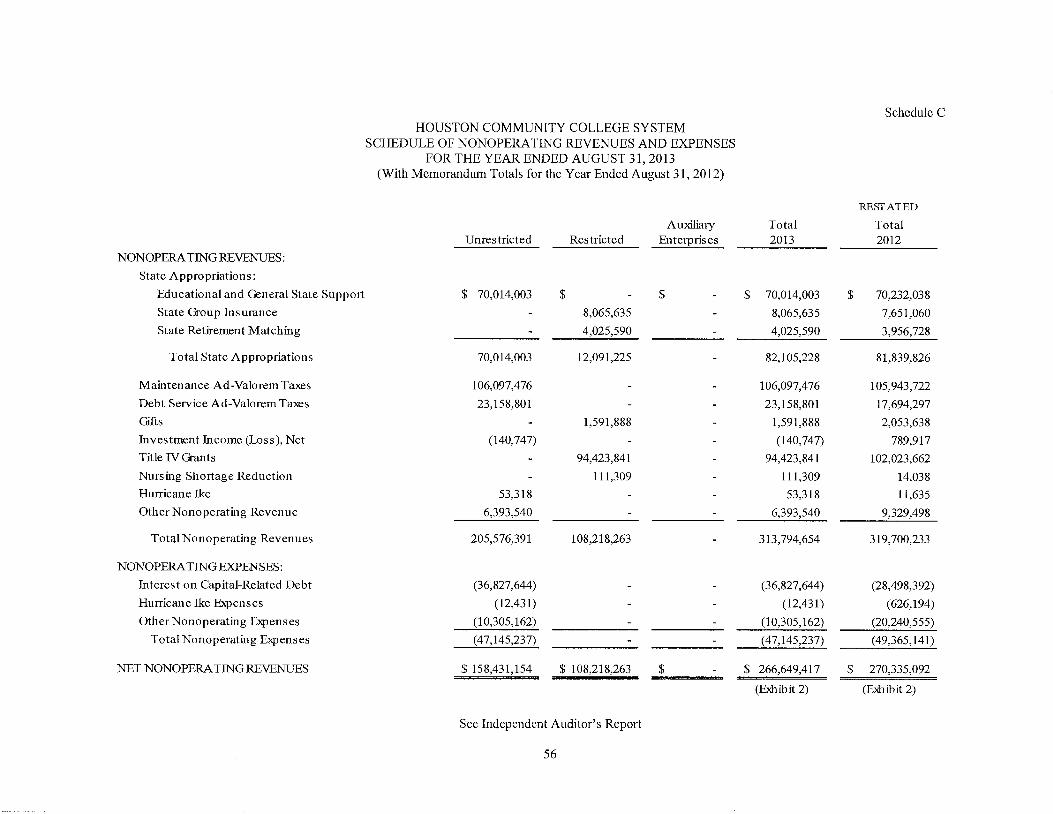
Schedule CHOUSTON COMMUNITY COLLEGE SYSTEM
SCHEDULE OF NONOPERATtNG REVENUES AND EXPENSESFOR THE YEAR ENDED AUGUST 31, 2013
(With Memorandum Totals for the Year Ended August 31, 2012)
NONOPERAT1NG REVENUFS:
State Appropriations :
Educational and General State Support
State Group Insurance
State Retirement Matching
Total Nonoperating Revenues
NONOPERAT1NG EXPENSES:
Interest on Capital-Related Debt
Hurricane Ike Expenses
Other Nonoperating Expenses
Total Nonoperating Expenses
NET NONOPERA TING REVENUES
Maintenance Ad-Valorem Taxes
Debt Service Ad-Valorem Ta es
Gifts
Investment Income (Loss), Net
Title IV Grants
Nursing Shortage Reduction
Hurricane Ike
Other Nonoperating Revenue
Total State Appropriations
AuxiliaryEnterprises
70,014,003
70,014,003
106,097,476
23,158,801
(140,747)
53,318
6,393,540
205,576,391
8,065,635
4,025,590
12,091,225
1,591,888
94,423,841
111,309
108,218,263
(36,827,644)
(12,431)
(10,305,162)
(47,145,237)
$ 158,431,154 $ 108,218,263
See Independent Auditor's Report
56
Total2013
$ 70,014,0038,065,635
4,025,590
82,105,228
106,097,476
23,158,801
1,591,888
(140,747)
94,423,841
111,309
53,318
6,393,540
313,794,654
(36,827,644)
(12,431)
(10,305,162)
(47,145,237)
$ 266,649,417
(ExhNR 2)
Unrestricted Restricted
RESTATED
Total2012
$ 70,232,038
7,651,060
3,956,728
81,839,826
105,943,722
17,694,297
2,053,638
789,917
102,023,662
14,038
11,635
9,329,498
319,700,233
(28,498,392)
(626,194)
(20,240,555)
(49,365,141)
$ 270,335,092
O xh 2)

Schedule D
HOUSTON COMMUNITY COLLEGE SYSTEMSCHEDULE OF NET POSITION BY SOURCE AND AVAILABILITY
FOR THE YEAR ENDED AUGUST 31, 2013(With Memorandum Totals for the Year Ended August 31, 2012)
I
Unrestricted
Detail by Source
Restricted Capital AssetsNet of Depreciation
Expendable Non-Expendable & Related Debt
Net Increase(Decrease) in Net Position $ 19,548,760
Total Net Position August 31, 2012,
as Restated
Total Net Position August 3 l, 2013 110,291,177 1,215,548 227,556,514
90,742,417 488,477 - 231,085,899
Current:
Unrestricted $ 98,037,161Auxiliary enterprises 9,104,761
Loan
Plant:
Unexpended 3,149,255Investment in Plant
$
1,215,548
227,556,514
$ 727,071 $ - $ (3,529,385)
Total Yes No
$ 98,03Z161
9,104,761
1,215,548
3,149,255
227,556,514
339,063,239
(Exhibit 1)
$ 16,746,446
(Exh it 2)
l[ Available for Current Operations ]
$ 98,037,161 $9,104,761
1,215,548
3,149,255
227,556,514
107,141,922 231,921,317
87,003,729 235,313,064
$ 20,138,193 $ (3,391,747)
See Independent Auditor's Report
57

STATISTICAL SECTION(Unaudited)

HOUSTON COMMUNITY COLLEGE SYSTEMSTATISTICAL SECTION NARRATIVE
Statistical Section
This part of the System's Annual Financial Report presents detailed information as a context forunderstanding what the information in the financial statements, note disclosures, and required supplementaryinformation says about the System's overall financial health.
Financial Trends
This segment contains trend information to help the reader understand how the System's fmancialperformance and well-being have changed over time.
Revenue Capacity
This segment includes information to help the reader assess the System's most significant local revenuesource, the property tax.
Debt Capacity
This segment presents information to help the reader assess the affordability of the System's current levels ofoutstanding debt and the System's ability to issue additional debt in the future.
Economic & Demographic Information
This segment depicts demographic and economic indicators to help the reader understand the environmentwithin which the System's financial activities take place.
Operating information
This segment displays service and capital asset data to help the reader understand how the information in theSystem's financial report relates to the services the System provides and the activities it performs.
Sources: Unless otherwise stated, the information in this section is derived from the annual financial reportsfor the relevant year.

Table 1HOUSTON COMMUNITY COLLEGE SYSTEM
NET POSITION BY COMPONENTLAST TEN FISCAL YEARS
(Amounts Expressed in Thousands)(Unaudited)
Invested in Capital Assets,
Net of Related Debt
Restricted - Expendable
Restricted - Nonexpendable
Unrestricted
FortheYear Ended August31,2013 2012" 2011 2010 2009 2008 2007 2006 2005 2004
$ 230,706 $ 23 825 $ 207,977 $ 197,013 $ 197,253 $ 190,084 $ 173,412 $ 146,493 $ 148,651 $ 130,356
1,216 488 488 449 449 449 449 582 450 449
107,142 87,004 73,959 70,083 62,731 62,334 55,872 60,092 42,439 47,880
Total Prhnary Government,
Net Position
Net Increase in Position
$ 339,063 $ 322,317 $ 282,424 $ 267,545 $ 260433 $ 252,867 $ 229,733 $ 207,166 $ 191,540 $ 178,685
$ 16,746 $ 39,893 $ 14,879 $ 7,112 $ 7,566 $ 23,134 $ 22,567 $ 15,626 $ 12,855
*FY2012 has been restated
See Independent Auditor's Report
60

Table 2HOUSTON COMMUNITY COLLEGE SYSTEM
PROGRAM REVENUES BY SOURCELAST TEN FISCAL YEARS
(Unaudited)
For the Year Ended August 31,
2013 2012 2011 2010 2009 2008 2007 2006 2005 2004
OPERATING :Tuition and Fees, Net of Discounts*
Federal Grants and Contracts
State Grants and Contracts
Local Grants and Contracts
Non-Governmental Grants and Contracts
Sales and Services of Fxlucational Activities
Other Operating Revenues
Au liary Fnterprises*
71,433,953 $ 71,415,957 $ 67,907,897 $ 65,655,752 $ 64,689,510 $ 58,939,437 $ 54,389,997 $ 50,027,656 $ 50,300,876 $ 50,673,972
14,702,419 16,848,269 16,064,089 16,243,394 I2,480,512 13,001,562 12,924,612 13,579,195 13,678,022 13,259,434
6,156,585 5,i52,251 6,448,589 5,157,058 3,695,688 2,988,267 2,796,870 2,349,662 2,322,147 2,920,100
81,407 95,226 275,085 79,055 77,955 81,761 77,116 90,392 84,962 85,978
2,413,531 2,497,892 1,283,150 1,286,822 854,759 467,151 605,832 705,186 305,459 625,785
193,328 329,382 369, 530 315, 835 261,861 203,207 208,228 470,021 161,349 162,254
527,125 589,409 717,187 664,457
16,092,899 16,096,494 14,535,914 10,493,233 8,709,724 7,937,176 7,351,627 5,294 890 5,519,502 4,671,611
Total Operating Revenues v 111,074,122 112,435,472 106,884,254 99,231,149 90,770,009 83,618,561 78,881,407 73,106,411 73,089,504 73,063,591
TOTAL REVENUES
NONOPERATING REVENUES:
State Appropriations 82,105,228 81,839,826 84,838,315 84,665,409 81,677,836 80,863,825 77,302,202 76,641,509 76,553,540 73,784,624
Ad Valorem Ta, s 129,256,277 123,638,019 115,820,065 119,273,809 107,746,487 97,214,316 88,882,876 82,580,297 72,873,881 70,731,329
Gifts 1,591,888 2,053,638 1,573,601 1,555,967 1,115,895 964,033 491,270 578,333 424,138 368,40l
Investment Income (140,747) 789,917 566,945 900,323 4,213,587 11,160,656 17,507,157 11,102,588 5,058,363 4,146,332
Disaster Relief Grants 1,415,592 1,525,6I 1
Title IV (Pell)* 94,423,841 102,023,662 96,171,936 75,639,561 41,239,311 31,591,860 30,325,297 26,288,282 26,445,601 26,868,509
Nursing Shortage Reduction 111,309 14,038 151,786 73,453 19,969 33,974 66,969 16,091
Other Nonoperating Revenues 6,446,858 9,341,129 6,153,631 3,455,364 2,241,061 7,768,434 3,866,533 2,438,678 1,717,391 2,567,407
Total Nonoperating Revenues 313,794,655 319,700,229 305,276,279 286,979,477 239,779,757 229,597,098 218,442,304 199,645,778 183,072,914 178,466,602
$ 424,868,777 $ 43Z135,701 $ 412,160,533 $ 386,210,626 $ 330,549,766 $ 313,215,659 $ 297,323,711 $ 272,752, t89 $ 256,162,418 $ 251,530,193
See Independent Auditor's Report
61

Table 3HOUSTON COMMUNITY COLLEGE SYSTEM
PROGRAM EXPENSES BY FUNCTIONLAST TEN FISCAL YEARS
(Unaudited)
2013 2012"OPERATING EXPENSES:
Instruction $
Public Se cice
Academic Support
Student Services
Institutional Support
Operation and Maintenance of Ptant
Scholarships and Fellowships
Auxiliary Enterprises
Depreciation
Total Non-Operating Expenses
TotMExpenses
NON-OPERATING EXPENSFS:
Interest on Capital Related Debt
Hurricane Ike Expense, Net
Other Non-Operating ENoenses
Total Op eratin g Expens es 360,977,093 342,878,460 357,021,152 342,882,673 288,375,601 257,617,114 249,914,635 234,326,420 222,142,858 217,724,993
36,827,644 28,498,392 29,424,886 25,379,834 25,375,863 20,640,888 21,187,768 17,201,531
12,431 626,194 284,103 561,861 297,616
10,305,162 20,240,555 10,550,397 10,274,777 8,934,397 7,768,434 3,682,262 5,597 748
47,145,237 49,365,141 40,259,386 36,216,472 34,607,876 28,409,322 24,870,030 22,799,279
408,122,330 $ 392,243,601 $ 397,280,538 $ 379,099,145 $ 322,983,477 $ 286,026,436 $ 274,784,665 $ 257,125,699 $
107,489,818
11,532,590
23,946,350
27,822,091
67,226,240
27,614,805
5 092,409
18,760,757
19,492,034
100,319,497
11,868,925
22,771,173
24,906,487
58,952,631
27,969,778
61,504,372
15,736,795
18,848,802
FortheYearEndedAugust31,2011 2010 2009 2008 2007 2006
112,617,877 $ 113,319,505 $ 105,158,760 $ 96,006,367 $ 92,249,139 $ 88,156,430 $ 86,655,657 $ 86,189,526
11,766,675 11,47Z787 9,988,399 9,868,65l 1t,362,415 11,435,129 11,199,015 11,464,838
19,616,391 23,449,473 20,632,551 19,645,603 1Z972,637 16,355,817 15,315,072 13,627,83t
31,901,438 30,902,922 27,473,142 25,822,223 24,659,370 24,919,075 24,754,156 22,014,138
55,747,071 53,302,151 4 880,656 44,359,869 43,t63,084 4 884,807 36,375,786 36,569,971
28,350,817 35,937,690 32,628,588 26,917,292 26,782,535 23,055,592 20,213,768 20,686,221
65,346,087 49,920,320 24,796,647 18,201,589 t6,474,485 15,634,651 15,426,494 16,330,334
14,607,330 9,740,078 8,718,772 6,698,807 6,726,829 3,9t9,787 2,454,330 1,756,611
1 067,466 14,832,747 11,098,086 I0,096,713 10,524,141 9,965,132 9,748,580 9,085,523
2005
17,168,453
4,290,908
21,459,361
243,602,219 $
2004
15,143,344
4,018,983
19,162,327
236,887,320
*FY2012 has been restated
See Independent Auditor's Report
62

Table 4HOUSTON COMMUNITY COLLEGE SYSTEM
TUITION AND FEESLAST TEN ACADEMIC YEARS
(Unaudited)
SEMESTER CRIiI)IT HOUR (SCH)
IN-DISTRICT
InDis trictTuition
372
372
372
300
300
300
300
300
300
300
276
276
276
276
228
228
Out-of
DistrictTuition
StudentTechno- Activity /
General logy ServicesFees Fees Fee
306 $ 117.60 $ 12306 116.40 12306 115.20 12264 103.20 12264 102.00 12
Semester
FallFall
Summer
FallFall
SplingFall
Fall
Fall
Spring
Fall
Fall
Fall
Summer
Fall
Fall
Recrea
tion Fee$ 6
6
6
6
6
Increase
Cost for 12 from PriorSCH Year-Fall
$ 813.60 0.15%812.40 18.56%811.20 n/a685.20 0.18%684.00 1.79%678.00 n/a672.00 2.28%
657.00 2.82%
639.00 8.67%
612.00 n/a
588.OO 0.OO%
588.00 4.26%
564.00 9.30%
564.00 n/a
516.00 10.26%
468.00 11.43%
264 96.00 12 6264 96.00 12 --
264 81.00 12 --
264 63.00 12 --
264 48.00 ......
264 48.00 ......
264 48.00 ......
240 48.00 ......
240 48.00 ......
240 48.00 ......
216 24.00 ......
Academic
Year
2012-2013
2011-20122010-2011"2010-2011
2009-20102008-2009*2008-2009
2007-2008
2006-2007
2005-2006*
2005-2006
2004-2005
2003-2004
2002-2003*
2002-2003
2001-2002
See Independent Auditor's Report
63

Table 4HOUSTON COMMUNITY COLLEGE SYSTEM
TUITION AND FEES - CONTINUEDLAST TEN ACADEMIC YEARS
(Unaudited)
SEMESTER CREDIT HOUR (SCIt)OUr-OF-DIS TRICT
StudentIn- Out-of- Techno- Activity / Increase
Academic District District General logy Services Recrea- Cost for 12 froraPriorYear Semester Tuition Tuition Fees Fees Fee tion Fee SCH Year-Fall
2012-2013 Fall $ 372 $ 768 $ 402 $ 117.60 $ 12 $ 6 $ 1,677.60 0.07%2011-2012 Fall 372 768 402 116.40 12 6 1,676.40 18.29%2010-2011" Summer 372 708 402 115.20 12 6 1,615.20 n/a2010-2011 Fall 300 672 324 103.20 12 6 1,417.20 6.40%2009-2010 Fall 300 648 264 102.00 12 6 1,332.00 0.91%2008-2009* Spring 300 648 264 96.00 12 6 1,326.00 n/a2008-2009 Fall 300 648 264 96.00 12 --- 1,320.00 1.15%
2007-2008 Fall 300 648 264 81.00 12 --- 1,305.00 1.40%2006-2007 Fall 300 648 264 63.00 12 --- 1,287.00 4.13%2005-2006* Spring 300 648 264 48.00 ...... 1,260.00 n/a
2005-2006 Fall 276 648 264 48.00 ...... 1,236.00 0.00%
2004-2005 Fall 276 648 264 48.00 ...... 1,236.00 1.98%
2003-2004 Fall 276 648 240 48.00 ...... 1,212.00 16.09%
2002-2003* Summer 276 528 240 48.00 ...... t,092.00 n/a
2002-2003 Fall 228 528 240 48.00 ...... 1,044.00 27.94%
2001-2002 Fall 228 348 216 24.00 ...... 816.00 l 5.25%
Note: After Spring 2011, Workforce students no longer pay extra $1 per hour tuition; Recreation Fee previously known as Athletic Fee.
In addition students may incur course related fees such as laboratory fees, testing fees, distance education fees and certification fees.
* Changes to Rates in Semester other than Fall.
See Independent Auditor's Report
64

Table 4HOUSTON COMMUNITY COLLEGE SYSTEM
TUITION AND FEES - CONTINUEDLAST TEN ACADEMIC YEARS
(Unaudited)
s EMES TER cR rr HOUR (S CH)our OF STATE/INTERNATIONAL
Out ofState / StudentInter- Techno- Activity /
Academic national General logy Services Recrea- Cost for 12Year Semester Tuition Fees Fees Fee tion Fee SCH
2012-2013 Fall $ 1,140 $ 600 $ 117.60 $ 12 $ 6 $ 1,875.602011-2012 Fall 1140 600 116.40 12 6 $ 1,874.402010-2011" Sunmaer 1080 600 115.20 12 6 1,813.202010-2011 Fall 972 600 103.20 12 6 1,693.202009-2010 Fall 912 540 102.00 12 6 1,572.002008-2009 Spring 912 540 96.00 12 6 1,566.00
2008-2009 Fall 912 540 96.00 12 --- 1,560.00
2007-2008 Fall 912 540 81.00 12 --- 1,545.00
2006-2007 Fall 912 540 63.00 12 --- 1,527.00
2005-2006* Spring 912 540 48.00 ..... 1,500.00
2005-2006 Fall 888 540 48.00 ...... 1,476.00
2004-2005 Fall 888 540 48.00 ...... 1,476.00
2003-2004 Fall 888 516 48.00 ...... 1,452.00
2002-2003* Summer 888 516 48.00 ...... 1,452.00
2002-2003 Fall 840 516 48.00 ...... 1,404.00
2001-2002 Fall 840 492 24.00 ...... 1,356.00
Increase
from PriorYear-Fall
0.06%10.70%
n/a7.71%0.77%
n/a
0.97%
1.18%
3.46%
n/a
0.00%
1.65%
3.42%
n/a
3.54%
3.67%
Note: After Spring201 i, Workforce students no longer pay extra $1 per hour tuition; Recreation Fee previously known as Athletic Fee.
In addition students may incur course related fees such as laboratory fees, testing fees, distance education fees and certification fees.
* Changes to Rates in Semester other than Fall.
See Independent Auditor's Report
65

Table 5
HOUSTON COMMUNITY COLLEGE SYSTEMASSESSED VALUE AND TAXABLE ASSESSED VALUE OF PROPERTY
LAST TEN FISCAL YEARS(Unaudited)
Ratio of Taxable Maintenanc
Assessed Taxable Assessed Assessed Value e Total
Fis eal Valuation of Less: Exemptions Value to A s s es sed & Debt Direct
Year Property & Abatements (TAV) Value Operations Se -cice Rate (a)
2013 $ 145,875,030,461 $ 12,890,703,534 $ 132,984,326,927 91.16% 0.079673 0.017500 0.0971732012 159,141,889,758 31,729,564,366 127,412,325,392 80.06% 0.083399 0.013823 0.0972222011 157,165,651,239 31,190,173,147 125,975,478,092 80.15% 0.074901 0.017319 0.0922202010 158,860,572,423 28,430,763,993 130,429,808,430 82.10% 0.077839 0.014381 0.0922202009 141,650,283,263 24,628,568,950 117,021,714,313 82.61% 0.077504 0.014926 0.0924302008 128,541,398,956 23,751,022,792 104,790,376,164 81.52% 0.077505 0.014926 0.0924332007 114,880,333,614 23,035,765,722 91,844,567,892 79.95% 0.081333 0.013842 0.0951752006 103,397,321,246 18,595,499,000 84,801,822,246 82.02% 0.081333 0.014436 0.095769
2005* 88,579,791,310 8,205,391,837 80,374,399,473 90.74% 0.081333 0.014644 0.0959772004 86,111,454,090 5,851,840,810 80,259,613,280 93.20% 0.081333 0.081333
* In 2005 Harris County changd their reporting methodology. Totally exempt properties are included at their fully appraised value and that
value was included in the exemptions. In the prior years these were reported at an appraised value of zero.
Source: Local Appraisal District
Notes: Property is as s es sed at full market value.(a) Total Dh'ect Rate is per $100 Taxable Assessed Valuation
See Independent Auditor's Report
66

Table 6HOUSTON COMMUNITY COLLEGE SYSTEM
STATE APPROPRIATION PER FSTE AND CONTACT HOURSLAST TEN FISCAL YEARS
(Unaudited)
State StateFiscal Appropriation AppropriationYear (Unrestricted) FTSE* * per FTSE
2012-2013 $ 70,014,003 49,824 $ 1,405
2011-2012 70,232,038 * 52,032 1,350
2010-2011 65,957,104 53,418 1,235
2009-2010 65, 791,457 50,445 1,304
2008-2009 63,627,432 43,835 1,452
2007-2008 63,627,433 39,602 1,607
2006-2007 61,312,488 38,641 1,587
2005-2006 61,312,368 36,922 1,661
2004-2005 61,423,796 37,790 1,625
2003-2004 58,896,561 37,939 1,552
StateState Academic Voc/Tech CEU Total Funded Appropriation
Fiscal Appropriation Contract Contract Contract Contract per ContactYear (Unrestricted) Hours Hours Hours Hours (1) Hour
2012-2013 $ 70,014,003 16,237,296 5,744,810 1,933,271 23,915,377 $ 2.93
2011-2012 70,232,038 * 17,354,256 5,822,072 1,798,940 24,975,268 2.81
2010-2011 65,957,104 17,802,080 5,924,078 1,914,445 25,640,603 2.57
2009-2010 65,791,457 16,652,752 5,680,164 1,880,857 24,213,773 2.72
2008-2009 63,627,432 14,345,992 4,883,890 1,810,761 21,040,643 3.02
2007-2008 63,627,433 12,739,232 4,422,336 1,847,195 19,008,763 3.35
2006-2007 61,312,488 12,077,904 4,378,250 2,091,365 18,547,519 3.31
2005-2006 61,312,368 11,487,128 4,260,486 1,974,799 17,722,413 3.46
2004-2005 61,423,796 11,406,432 4,613,888 2,118,738 18,139,058 3.39
2003-2004 58,896,561 11,009,608 4,894,274 2,306,953 18,210,835 3.23
Note:
The methodology used to calculate FTSE (Full-time Student Equivalent) has been revised for FY2012 and the total FTSE has been
restated for all years shown.
* Revised based on FY2011 AFt
** One FTSE is equal to 480 annual contact hours [30 semester credit hours (Fall 12SCH + Spring 12SCH + Stwnmer 6SCH) x 16
contact hours per SCH = 480 annual contact hours]. Total annual FT SE is equal to total funded contact hours divided by annual contacthours per student (480).
See Independent Auditor's Report
67

Table 7HOUSTON COMMUNITY COLLEGE SYSTEM
PRINCIPAL TAXPAYERS (Taxable Value)LAST TEN FISCAL YEARS
(Unaudited)
2013 2012 2011 2010 2009
Taxpayer Indus try Taxable As s es sed Value (TAV) by Tax Year
2008 2007 2006 2005 2004
CenterpointEnergyInc Utility $ 1,382,750,044 $ 1,153,697,187 $ 1,119,456,415 $ 1,122,000,954 $
Crescent Real Estate Real Estate 831,337,622 716,169,026 1,129,509,857 1,027,978,140
Cullen Allen Holdings Lp Real Estate 632,088,821
Hh es Interests Ltd Ptnrsp Real Estate - 1,163,749,277 967,638,791 855,622,627
AT&T Mobility Llc Utility 318,206,364 446,070,581 499,096,180
Tpg 2101 Citywest 1 & 2 Lp Real Estate 497,060,529 469,096,180
Clievron Chemical Co Oil & Gas 982,653,385 724,298,902 627,685,117 469,387,624
Anheuser Busch Inc Brewery 357,792,263 366,424,086 404,399,350
Houston Refining Oil & Gas
Valero Falergy Corp Oil & Gas 426,028,458 363,437,432
Teachers Insurance Insurmlce
Shell Oil Co Oil & Gas 334,605,330 331,875,591
Southwestern Bell Utility
HG Galleria I II HI LP Real Estate 385,054,953 363,274,752 319,442,735 315,388,094
Triaechalm Allen Ctr LP Real Es tate
Lyondetl Chemical Co Oil & Gas
HG Shopping Centers LP Real Estate
Block 98 Partners Lt D Real Estate
Exxon Mobil Corp Oil & Gas 317,979,103 305,020,231 305,281,064
Continental Airlhles Airline
1000 Louisiana LP Real Estate 426,551,193
Texas Tower LTD Real Estate 409,839,382
Four Oaks Place Operating Real Estate 401,202,733
BGHOLDCO LLC Real Estate 398,000,000
BUSYCON Propellies LLC Real Estate 453,269,103
1,155,200,888 $ 1,039,824,086 $ 1,020,251,119 $
1,136,315,715 1,378,543,156 1,213,068,497
679,738,613 740,183,451 597,559,584
649,533,262 962,302,817 982,519,591
573,892,778 584,854,404
520,865,513 576,224,151
460,639,86I 478,700,396 407,061,688
421,420,837 451,539,258 461,994,178
407,442,917
374,025,572 386,831,716 309,554,958
578,530,234 512,401,996
529,778,957
324,487,276
1,031,341,633 $ 926,349,501 $ 999,667,490
880,336,507 635,272,869 927,186,600
574,840,017 634,172,927 663,084,820
343,365,607 251,494,288 225,039,730
470,539,317 473,881,489 482,088,900
300,049,967
554,904,933 603,569,106 551,237,140
494,993,746 415,503,465 427,714,270
295,571,464
292,756,445 266,442,640 243,350,670
335,909,200
302,072,770 191,526,250
236,174,370
Totals $ 6,096,686,873 $ 5,813z209,636 $ 6,110,183,933 $ 6,100,339,034 $ 6 379,075,956 $ 7,177,533.669 $ 6,358,677,844 $ 5,238,699,636 $ 4,844,668,255 $ 4,947,070,240
TotalTaxable Assessed Value $ 132,984,326,927 $ 127,412,325 392 $ I25,975,478,092 $ 130,429,808,430 $ 117,021,714,313 $ 104,790,367,164 $ 91,844,567,892. .$ 84,801,822,246 $ 80,374,399,473 $__80,259,613,280
See Independent Auditor's Report
68

Table 7HOUSTON COMMUNITY COLLEGE SYSTEM
PRINCIPAL TAXPAYERS (Taxable Value)LAST TEN FISCAL YEARS
(Unaudited)
2013
Ta ayer Industry
Centerpoint Energy Inc Utility 1.04% 0.91%Crescent Real Estate Real Estate 0.63% 0.56%
Cullen Allen Holdings Lp Real Estate 0.00% 0.00%Hines Interests Ltd Ptnrsp RealEstate 0.00% 0.91%
AT&T Mobility Llc Utility 0.00% 0.25%Tpg 2101 Citywest 1 & 2 Lp Real Estate 0,00% 0.00%Chevron Chemical Co Oil & Gas 0.74% 0.57%Anheuser Busch Inc Brewery 0.00% 0.28%
Houston Refining Oil & Gas 0.00% 0.00%Valero Energy Corp Oil & Gas 0.32% 0.29%Teachers Insurance Insurance 0.00% 0.00%
Shell Oil Co Oil & Gas 0.00% 0.26%Southwestern Bell Utility 0.00% 0.00%HGGaUeria t II III LP Real Estate 0.29% 0.29%Triaechahn Allen Ctr LP Real Estate 0.00% 0.00%Lyondeil Chemical Co Oil & Gas 0.00% 0.00%HGShopping Centers LP Real Estate 0.00% 0.00%Block 98 Partners Lt D Real Estate 0.00% 0.00%Exxon Mobil Corp Oil & Gas 0.00% 025%Continental Airlines Airline 0.00% 0.00%1000 Louisiana LP Real Estate 0.32%
Texas Tower LTD Real Estate 0.31%Four Oaks Place Operating Real Estate 0.30%LP
BGHOLDCO LLC Real Estate 0.30%BUSYCON Properties LLC Real Estate 0.34% 0.00%
2011 2010 2009 2008
% of Taxable Assessed Value (TAV) by Tax Year
2007 2006 20052012
0.89% 0.86% 0.99% 0.99% 1.11% 1.22% 1.15% 1.25%
020% 0.79% 0.97% 1.32% 1.32% 1.04% 0.79% 1.16%0.00% 0.48% 0.58% 0.71% 0.65% 0.00% 0.00% 0.00%
0,77% 0,66% 0.56% 0.92% 1.07% 0.68% 0.79% 0.83%
0.35% 0.38% 0.49% 0.56% 0.00% 0.00% 0.00% 0.00%
0.39% 0.36% 0.45% 0.55% 0.00% 0.00% 0.00% 0.00%0.50% 0.36% 0.39% 0.46% 0.44% 0.40% 0.31% 0.28%0.29% 0.31% 0.36% 0.43% 0.50% 0.55% 0.59% 0.60%
0.00% 0.00% 0.35% 0.00% 0,00% 0.00% 0.00% 0.00%0.00% 0.00% 0.32% 0.37% 0.34% 0.00% 0.00% 0.00%
0.00% 0.00% 0.00% 0.55% 0.56% 0.35% 0.00% 0.00%
0.26% 0.00% 0.00% 0.00% 0.00% 0.00% 0.00% 0.00%
0.00% 0.00% 0,00% 0.00% 0.58% 0.65% 0.75% 0.69%
0.25% 0.24% 0.00% 0.00% 0.35% 0.00% 0.00% 0.00%
0.00% 0.00% 0.00% 0.00% 0.00% 0.58% 0.52% 0.53%
0.00% 0.00% 0.00% 0.00% 0.00% 0.35% 0.00% 0.00%0.00% 0.00% 0.00% 0.00% 0.00% 0.35% 0.33% 0.30%
0.00% 0.00% 0.00% 0.00% 0.00% 0.00% 0.42% 0.00%
0.24% 0.23% 0.00% 0.00% 0.00% 0.00% 0.38% 0.24%
0.00% 0.00% 0.00% 0.00% 0.00% 0.00% 0.00% 0.29%
0.00% 0.00% 0.00% 0.00% 0.00% 0.00% 0.00% 0.00%
2004
Totals 4.58% 4.56% 4.85% 4.68% 5.45% 6.85% 6.92% 6.18% 6.03% 6.16%
Source: Local County Appraisal District
See Independent Auditor's Report
69

Table 8HOUSTON COMMUNITY COLLEGE SYSTEMPROPERTY TAX LEVIES AND COLLECTIONS
LAST TEN TAX YEARS(Unaudited)
Collected within the FiscalYear of the Levy Total Collections to Date
Tax Rate Tax Base
Fiscal Year Per $100 (Assessed Value)2012-2013 0.097173 $ 132,984,326,927 $
2011-2012 0.097222 127,412,325,392
2010-2011 0.092220 125,975,478,092
2009-2010 0.092220 130,429,808,430
2008-2009 0.092430 117,021,714,313
2007-2008 0.092433 104,790,367,164
2006-2007 0.095175 91,844,567,892
2005-2006 0.095769 84,801,822,246
2004-2005 0.095977 80,374,399,473
2003-2004 0.081333 80,259,613,280
Actual
Collections per % ofTotal TaxLevy AFR Levy
129,224,860 $ 126,900,573 98.20% $
123,872,811 121,247,023 97.88%
116,179,580 113,187,929 97.42%
120,614,601 116,730,716 96.78%
108,163,171 105,021,974 97.10%
96,860,880 93,854,407 96.90%
87,413,067 85,811,200 98.17%
81,213,857 79,013,014 97.29%
77,140,937 74,102,498 96.06%
65,277,551 62,655,173 95.98%
Collections inSubsequent % of
Years * Amount Levy
3,135,356 $ 130,035,929 100.63%
4,017,805 125,264,828 101.12%
3,994,879 117,182,808 100.86%
3,995,418 120,726,134 100.09%
4,064,764 109,086,738 100.85%
4,164,454 98,018,861 101.20%
3,882,996 89,694,196 102.61%
3,882,996 82,896,010 102.07%
3,110,739 77,213,237 100.09%
2,821,758 65,476,931 100.31%
* "Collection in Subsequent Years" includes penalties and interest.
Source: Local TaxAssessor/Collector's and District records.
See Independent Auditor's Report
7O

Table 9HOUSTON COMMUNITY COLLEGE SYSTEM
RATIOS OF OUTSTANDING DEBTLAST TEN FISCAL YEARS
(Unaudited)
General Obligation Bonds
Notes
Less : Funds Res tricted
for Debt Service
FortheYear Ended August 312013 2012 2011 2010 2009* 2008* 2007* 2006*
$ 578,13 157 118,545,846 122,965,813 $ 128,335,993 $ 133,079,110 $ 137,982,325 $ 142,755,540 $ 147,393,756 $
177,016,887 184,862,037 169,764,659 129,970,994 65,596,500 67,968,928 11,595,000 12,000,000
2005* 2004*
150,308,930 $ 150,572,670
Net General Bonded Debt
Per CapitaPer FTSE
As a Percentage of
Taxable Assessed Value
755,156,045 303,407,883 292,730,472 258,306,987 198,675,610 205,951,253 154,350,540 159,393,756 150,308,930 150,572,670
333.59 $ 136.12 $ 134.63 $ 118.77 $ 92.82 $ 95.80 $ 72.86 $ 76.23 $ 72.84 $ 73.37
13,921.98 $ 5,370.91 $ 5,104.01 $ 4,723.11 $ 4,153.09 $ 4,711.77 $ 3,593.56 $ 3,904.89 $ 3,579.55 $ 3,554.68
0.57% 0.24% 0.23 % 0.20% 0.17% 0.20% 0.17% 0.19% 0.19% 0.00%
$
$
Revenue Bonds $ 215,574,705 340,645,560 341,086,330 $ 356,162,958 $ 338,468,001 $ 352,607,948 $ 304,517,738 $ 163,843,158 $ 151,122,041 $ 143,740,627
Notes 691,584 1,383,167 2,074,750 631,285 29,912,400 5,882,947 2,548,128
Capital Lease Obligations 1,304,824 3,914 472 6,524,120 34,395,970 35,436,616 37,523,860 39,895,534
Total OutstandingDebt $ 970,730,750 $ 644,053,443 $ 635,813,210 $ 619,767,584 $ 545,742,481 $ 558,559,201 $ 493,895,533 $ 388,585,930 $
Per Capita $ 429 $ 289 $ 292 $ 285 $ 255 $ 260 $ 233 $ 186 $PerFTSE $ 17,896 $ 11,401 $ 11,086 $ 11,332 $ 11,408 $ 12,779 $ 11,499 $ 9,520 $
As a Percentage of0.73% 0.51% 0.50% 0.48% 0.47% 0.53% 0.54% 0.46% 0.43% 0.42%
Taxable Assessed Value
344,837,778 $ 336,756,959
167 $ 1648,212 $ 7,950
*The methodology used to calculate FTSE (Full-tilne Student Equivalent) has been revised for FY2012 and the "Per FTSE" calculations has been restated for all years shown.
(FTSE includes both fundable & nun-fundable students)
See Independent Auditor's Report
71

Table 10
TAXABLE ASSESSED VALUE
HOUSTON COMMUNITY COLLEGE SYSTEMLEGAL DEBT MARGIN INFORMATION
LAST TEN FISCAL YEARS(Unaudited)
For the Year Ended August 312013 2012 2011
$ 132,984,326,927 $ 127,412,325,392 $ 125,975,478,092 $
Total Net General Obligation DebtCurrent Year Debt Service Requirements
Net Current Requirements as a %of Statutory Limit
Excess of Statutory Limit for DebtService over Current Requirements
664,921,635 637,061,627 629,877,207 652,149,042 585,108,572
664,921,635 637,061,62722,600,842 18,904,514
629,877,207 652,149,042
20,616,717 16,768,273
609,260,490 $ 635,380,769
3.27% 2.57%
642,320,793 $ 618,157,113 $
3.40% 2.97%
GENERAL OBLIGATION BONDS:Statutory TaxLevy Limit for Debt ServiceLess: Funds Restricted for Repayment of
General Obligation Bonds
TAXABLE ASSESSED VALUE
L OBLIGATION BONDS:Statutory TaxLevy Limit for Debt Service
Less: Funds Restricted for Repayment ofGeneral Obligation Bonds
Total Net General Obligation DebtCurrent Year Debt Service Requirements
Excess of Statutory Lhnit for DebtService over Current Requirements
Net Current Requirements as a %of Statutory Limit 2.11% 2.41% 2.42%
For the Year Ended August 312008 2007 2006 2005
$ 104,790,367,164 $ 91,844,567,892 $ 84,801,822,246 $ 80,374,399,473 $
523,951,836 459,222,839 424,009,111 401,871,997 401,871,997
523,951,836 459,222,839 424,009,111 401,871,997 401,871,99711,059,125 11,069,990 10,258,879 11,70 474 11,816,469
$ 512,892,711 $ 448,152,849 $ 413,750,232 $ 390,167,523 $ 390,055,528
2.91%
Note: Texas Education Code Section 130.122 limits the debt service taxlevy of corrnnunity colleges to $0.50 per hundred dollars taxable assessed valuation.
2010
130,429,808,430
2009
$ 117,021,714,313
585,108,572
11,034,759
574,073,813
1.89%
2004
80,259,613,280
2.94%
See Independent Auditor's Report
72

Table 11HOUSTON COMMUNITY COLLEGE SYSTEM
PLEDGED REVENUE COVERAGELAST TEN FISCAL YEARS
(Unaudited)
Fiscal Year
Ended
August 31 Total Tnition2013 $ 94,956,856 $ 11,731,661 $2012 98,214,059 12,206,1152011 89,655,895 10,549,5822010 81,401,974 9,587,9262009 74,049,779 8,304,454
2008 68,374,594 7,346,541
2007 63,047,174 6,782,289
2006 57,789,907 6,013,923
2005 57,041,008 5,782,906
2004 55,771,693 5,786,377
Pledged Revenues
Community
Technology Registration Laboratory Education Other
Fee Fees Fees Fees Fees
5,747,728 $ 50,940,723 $ 1,828,481 $ 9,136,539 $ 7,031,565 $
Fiscal Year Debt Service Requirements
Ended
August 31 PNleipal hlterest Total2013 $ 7,990,000 $ 14,610,842 $ 22,600,8422012 6,375,000 $ 12,529,514 18,904,5142011 11,335,000 10,712,486 22,047,4862010 10,770,000 10,325,724 21,095,7242009 10,430,000 10,408,632 20,838,6322008 7,520,000 8,402,868 15,922,8682007 7,015,000 6,608,404 13,623,4042006 5,750,000 6,867,244 12,617,2442005 5,500,000 7,316,450 12,816,4502004 4,300,000 7,516,469 11,816,469
5,998,853 53,283,093 1,974,359 9,330,828 7,234,999 303,384 151,8234,930,929 48,356,423 2,085,644 8,614,733 6,777,965 260,462 175,322
4,543,879 43,168,485 3,393,362 8,699,410 4,250,888 405,337 167,9303,902,031 38,912,692 2,890,446 8,136,071 3,550,828 1,344,876 156,180
3,485,805 35,489,400 2,434,803 7,982,248 2,700,926 2,636,536 167,813
3,322,933 33,609,081 2,185,444 7,320,576 2,251,444 2,321,875 180,620
3,173,494 32,368,441 2,026,721 5,287,298 1,297,184 2,697,279 181,235
3,139,240 32,197,058 2,451,068 5,659,908 1,369,459 1,472,249 101,290
3,122,539 31,344,052 3,092,399 5,259,843 1,931,520 920,095 226,488
Interest Vending Bookstore Rental
Income Corrnnis sion Commission Revenue
432,022 $ 129,999 $ 2,786,137 $ 5,192,0012,864,738 4,865,866
2,693,341 5,211,494
2,166,708 5,018,051
1,666,446 5,185,754
1,545,225 4,585,297
1,190,950 3,881,962
1,345,057 3,399,274
1,095,268 3,772,562
1,458,468 2,629,912
Coverage
Ratio
4.20
5.20
4.07
3.86
3.55
4.29
4.63
4.58
4.45
4.72
*Coverage Ratio for FY2010 & FY2011 have been restated.
See Independent Auditor's Report
73

Table 12HOUSTON COMMUNITY COLLEGE SYSTEM
DEMOGRAPHIC AND ECONOMIC STATISTICS - TAXING DISTRICTLAST TEN FISCAL YEARS
(Unaudited)
Calendar Year
Service Area Service Area
Service Area Service Area Personal Income Unemployment
Population Personal Income Per Capita Rate
2012 2,228,995 $ 64,750,075,755 29,049 4.8%
2011 2,174,361 61,960,591,056 28,496 5.1%
2010 2,174,919 60,334,427,979 27,74t 5.1%
2009 2,140,484 56,172, 721,612 26,243 5.1%
2008 2,149,766 51,992,090,710 24,185 5.8%
2007 2,118,315 52,815,947,895 24,933 6.3%
2006 2,091,041 51,383,150,493 24,573 4.7%
2005 2,063,673 45,089,191,377 21,849 4.8%
2004 2,052,110 50,424,446,920 24,572 4.6%
2003 2,034,592 46,901,414,784 23,052
Sources: HCCS MapInfo Files with 2000 Board Redistricthlg Boundaries, PCensus v9.0, TETRAD Computer
Applications, Inc., 2009; and Applied Geographic Solutions (AGS) on PCensus CD-ROM, TETRAD Computer
Applications, Inc., Oct. 2012.
See Independent Auditor's Report
74

Table 13HOUSTON COMMUNITY COLLEGE SYSTEM
PRINCIPAL EMPLOYERSFiscal Years 2010-2013
(Unaudited)
Houston-Sugar Land-Baytown MSA (Austin,Bmzoria, Chambers, Fort Bend, C lveston, Harris,
Liberty Montgomery, San Jacinto, Waller)June June June June
2013 (p) 2012" 2011 2010Number of Employees
Total NonagriculturalTrade, Transportation, & UtilitiesProfessional, & Business Services
Government
Education & Health ServicesMining/Logging & ConstructionManufacturingLeisure & HospitalityFinancial ActivitiesOther ServicesIn fomaation
569 800422 000372 100340 500294 900251 600277 60014400095,80032,300
547,800 527,800 515,800410,900 383,900 363,600359,300 372,400 381,800327,000 314,700 308,900279,600 261,000 252,800244,600 228,200 217,500264,300 250,400 241,100141,000 137,100 136,20096,900 93,600 92,70031,500 31,900 32,500
Total 2,800,600 2,702,900 2,601,000 2,542,900
Percent of FanployeesTotal NonagriculturalTrade, Transportation, & UtilitiesProfessional, & Business Services
Government
Education & Health ServicesNatural Resources, Mining & Construction
ManufacturingLeisure & HospitafityFinancial ActivitiesOther Services
Information
20.35% 20.27% 20.29% 20.28%15.07% 15.20% 14.76% 14.30%13.29% 13.29% 14.32% 15.01%12.16% 12.10% 12.10% 12.15%10.53% 10.34% 10.03% 9.94%8.98% 9.05% 8.77% 8.55%9.91% 9.78% 9.63% 9.48%5.14% 5.22% 5.27% 5.36%3.42% 3.59% 3.60% 3.65%1.15% 1.17% 1.23% 1.28%
Total 100.00% 100.00% 100.00% 100.00%
(p) preliminary* Revise: use actuals.
Source: http://www.bls .gov/ro 6ifax/ho us to n_ces .htm
Note: Employees on nonfarm payrolls by industry supersector, not seasonally adjusted
See Independent Auditor's Report
75

Table 14HOUSTON COMMUNITY COLLEGE SYSTEM
FACULTY, STAFF AND ADMINISTRATORS STATISTICSLAST TEN FISCAL YEARS
(Unaudited)
2013 2012 2011 2010 2009 2008 2007 2006 2005 2004FacuRy
FuH-Time 789 809 910 848 829 821 810 814 799 743Pal -Time 1,715 2,781 2,921 2,345 2,049 2,499 2,513 2,391 2,329 2,023Total 2,504 3,590 3,831 3,193 2,878 3,320 3,323 3,205 3,128 2,766
Percent
Full-Time 31.5% 22.5% 23.8% 26.6% 28.8% 24.7% 24.4% 25.4% 25.5% 26.9%Part-Time 68.5% 77.5% 76.2% 73.4% 71.2% 75.3% 75.6% 74.6% 74.5% 73.1%
Staff and Administrators
Full-Time 1,350 1,327 1,272 1,185 1,102 1,079 1,080 1,053 1,049 1,067Part-Time 1,443 1,088 1,169 1,323 1,259 1,504 1,408 1,226 1,288 1,301Total 2,793 2,415 2,441 2,508 2,361 2,583 2,488 2,279 2,337 2,368
Percent
Full-Time 48.3% 54.9% 52.1% 47.2% 46.7% 41.8% 43.4% 46.2% 44.9% 45.1%Part-Time 51.7% 45.1% 47.9% 52.8% 53.3% 58.2% 56.6% 53.8% 55.1% 54.9%
Students per Full-time
Faculty 71.0 71.2 62.2 57.1 53.6 53.0 55.3 51.6 55.1Staff Member 41.5 43.4 44.5 40.9 40.3 40.3 41.5 39.9 42.0
55.638.7
Average Annual 9/12 Month
Faculty Sala12¢* $ 63,366 $ 63,473 $ 62,533 $ 62,833 $ 60,378 $ 56,047 $ 54,766 $ 55,228 $ 54,264 $ 51,928
* Prior to 2009, average annual 9 month faculty salary reported.
See Independent Auditor's Report
76
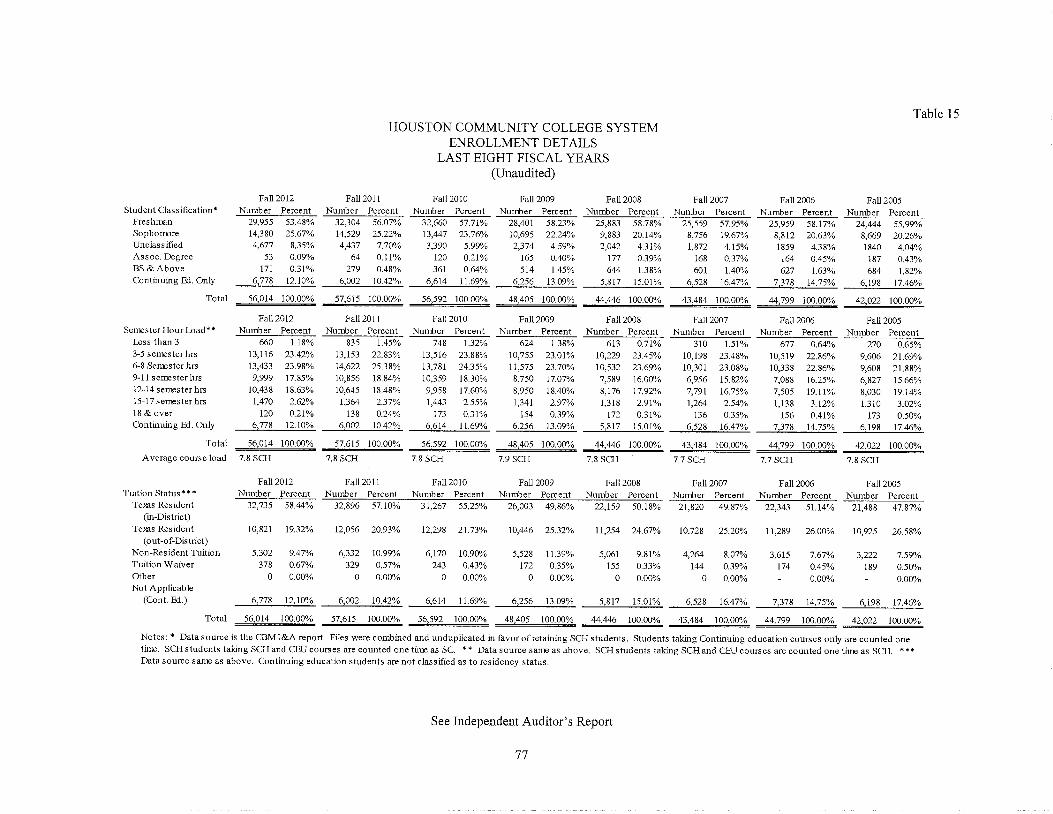
Table 15HOUSTON COMMUNITY COLLEGE SYSTEM
ENROLLMENT DETAILSLAST EIGHT FISCAL YEARS
(Unaudited)
Fall 2012 Fall 20i 1 Fall 2010 Fall 2009 Fall 2008 Fall 2007 Fall 2006 Fall 2005Student Classification* Number Percent Number Percent Number Percent Number Percent Number Percent Number Percent Number Percent Number Percent
Freshman 29,955 53.48% 32,304 56.07% 32,660 57.71% 28,401 58.23% 25,883 58.78% 25,559 57.95% 25,959 58.17% 24,444 55.99%Sophomore I4,380 25.67% 14,529 25.22% i3,447 23.76% 10,695 22.24% 9,883 20.14% 8,756 19.67% 8,812 20.63% 8,669 20.26%Unclassified 4,677 8.35% 4,437 7.70% 3,390 5.99% 2,374 4.59% 2,042 4.31% 1,872 4.15% 1859 4.38% 1840 4.04%Assoc. Degree 53 0.09% 64 0.11% 120 0.21% 165 0.40% 177 0.39% 168 0.37% 164 0.45% t87 0.43%
BS & Above 17I 0.31% 279 0.48% 361 0.64% 514 1.45% 644 1.38% 601 1.40% 627 1.63% 684 1.82%Continuing Ed. Only 6,778 12.10% 6,002 10.42% 6,614 11.69% 6,256 13.09% 5,817 15.01% 6,528 16.47% 7,378 t4.75% 6,198 17.46%
Total 56,014 100.00% 57,615 I00.00% 56,592 100.00% 48,405 100.00% 44,446 100.00% 43,484 100.00% 44,799 100.00% 42,022 100.00%
Fail 2012 Fall 2011 Fall 2010 Fall 2009 Fall 2008 Fall 2007 Fall 2006 Fall 2005SemesterHourLoad** Nmzaber Percent Number Percent Number Percent Number Percent Number Percent Number Percent Number Percent Number Percent
Less than 3 660 1.18% 835 1.45% 748 1.32% 624 1.38% 613 0.71% 310 1.51% 677 0.64% 270 0.65%3-5 semester hrs 13,116 23.42% 13,153 22.83% 13,516 23.88% 10,755 23.0I% 10,229 23.45% 10,198 23.48% 10,519 22.86% 9,606 21.69%6-8 Semester hrs 13,433 23.98% 14,622 25.38% 13,781 24.35% 11,575 23.70% i0,532 23.69% 10,301 23.08% 10,338 22.86% 9,608 21.88%9-11 semester hrs 9,999 17.85% 10,856 I8.84% 10,359 18.30% 8,750 17.07% 7,589 16.00% 6,956 15.82% 7,088 16.25% 6,827 15.66%12-t4 semester hrs 10,438 18.63% 10,645 18.48% 9,958 17.60% 8,950 18.40% 8,176 17.92% 7,791 16.75% 7,505 19.1t% 8,030 19.14%15-17 semester hrs 1,470 2.62% 1,364 2.37% 1,443 2.55% 1,341 2.97% 1,318 2.91% 1,264 2.54% 1,138 3.12% 1,310 3.02%18 & over 120 0.21% I38 0.24% 173 0.31% 154 0.39% 172 0.31% 136 0.35% 156 0.41% 173 0.50%Continuing Ed. Only 6 778 12.I0% 6,002 10.42% 6 614 11.69% 6 256 13.09% 5,817 15.01% 6,528 16.47% 7 378 14.75% 6,198 17.46%
Total 56,014 100.00% 57 615 100.00% 56,592 100.00% 44,446 100.00% 43,484 100.00% 44 799 100.00% 42,022 100.00%
Average course load 7.8 SCH 7.8 SCH 7.8 SCH 7.9 SCH 7.8 SCH 7.7 SCH 7.7 SCH 7.8 SCH
Tuition Status* **Te s Res ident
(in-District)Te:,as Resident
(out-of-District)Non-Resident TuitionTuition WaiverOther
Not Applicable(Cont, Fxl.)
Fall 2012 Fall 2011 Fall 2010 Fail 2009 Fall 2008 Fall 2007 Fall 2006 Fall 2005Number Percent Number Percent Number Percent Number Percent Number Percent Number Percent Number Percent Number Percent
32,735 58.44% 32,896 57.10% 31,267 55.25% 26,003 49.86% 22,159 50.18% 21,820 49.87% 22,343 51.14% 21,488 47.87%
10,821 19.32% 12,056 20.93% 12,298 21.73% 10,446 25.32% 11,254 24.67% 10,728 25.20% 11,289 26.00% 10,925 26.58%
5,302 9.47% 6,332 10.99% 6,170 10.90% 5,528 11.39% 5,061 9.81% 4,264 8.07% 3,615 7.67% 3,222 7.59%378 0.67% 329 0.57% 243 0.43% 172 0.35% 155 0.33% 144 0.39% 174 0.45% 189 0.50%
0 0.00% 0 0.00% 0 0.00% 0 0.00% 0 0.00% 0 0.00% 0.00% 0.00%
6,778 12.10% 6 002 10.42% 6,614 11.69% 6,256 13.09% 5,817 15.01% 6,528 16.47% 7 378 14.75% 6,198 17.46%
Total 56,014 100.00% 57,615 100.00% 56,592 100.00% 48,405 100.00% 44,446 100.00% 43,484 100.00% 44,799 100.00% 42,022 100.00%
Notes : * Data source is the CBMI&A report. Files were combined and unduplicated in favor of retaining SCH students. Students taking Continuing education courses only are counted onetime. SCH students taking SCH and CEU courses are counted one tinze as SC. ** Data source same as above. SCH students taking SCH and CEU courses are counted one time as SCH. ***Data source same as above. Continuing education students are not classified as to residency status.
See Independent Auditor's Report
77

Table 16HOUSTON COMMUNITY COLLEGE SYSTEM
STUDENT PROFILELAST EIGHT FISCAL YEARS
(Unaudited)
GenderFemale
Male
Fall 2012 Fall 2011 Fall 2010 Fall 2009 Fall 2008 Fall 2007 Fall 2006 Fall 2005Number Percent Number Percent Number Percent Number Percent Number Percent Number Percent Number Percent Number Percent
30,881 55.13% 31,985 55.52% 30,865 54.54% 26,452 54.65% 24,173 54.39% 23,603 54.28% 23,825 53.18% 22,505 53.56%
25,133 44.87% 25,630 44.48% 25,727 45.46% 21,953 45.35% 20,273 45.61% 19,881 45.72% 20,974 46.82% 19,517 46.44%
Total 56,014 100.00% 57,615 100.00% 56,592 100.00% 48,405 100.00% 44,446 100.00% 43,484 100.00% 44,799 100.00% 42,022 100.00%
Fall 2011" Fall 2010" Fall 2010 Fall 2009 Fall 2008 Fall 2007 Fall 2006 Fall 2005Ethnic Origin Number Percent Number Percent Number Percent Number Percent Number Percent Number Percent Number Percent Number Percent
White 10,242 18.28% 10,912 18.94% 11,393 20.13% 9,506 19A0% 8,623 21.40% 9,307 23.80% 10,663 24.26% 10,193 27.73%
African American 16,085 28.72% I7,346 30.11% 15,685 27.72% 11,558 22.85% 10,156 22.85% 9,938 23.18% 10,386 22.56% 9,480 22.82%
Hispanic 18,266 32£1% 17,812 30.92% 17,721 31.31% i4,160 29.83% 13,257 28A5% 12,371 27.94% 12,518 26.98% 11,337 28.03%Asian 5,64i 10.07% 6,107 10.60% 5,881 10.39% 4,832 10.52% 4,676 10.85% 4,718 10.63% 4,762 12.17% 5,116 10.53%
Native American 110 0.20% 131 0.23% 138 0.24% 121 0.23% 10i 0.21% 91 0.24% 108 0.24% 101 0.30%Foreign 3,884 6.93% 4,086 7.09% 4,270 7.55% 3,875 8.22% 3,654 7.34% 3,190 6.40% 2,867 10.77% 4,527 8.43%
Unknown 1,786 3.I9% 1,221 2.12% 1,504 2.66% 4,353 8.95% 3,979 8.90% 3,869 7.80% 3,495 3.02% 1,268 2.16%
Total 56,014 100.00% 57,615 100.00% 56,592 100.00% 48,405 100.00% 44,446 100.00% 43,484 100.00% 44,799 100.00% 42,022 100.00%
Age
Under 18
18 -21
22 - 24
25 - 35
36 - 50
51 & over
Unknown
Fall 2012 Fall 2011 Fall 2010 Fal! 2009 Fall 2008 Fall 2007 Fall 2006 Fall 2005Number Percent Number Percent Number Percent Number Percent Number Percent Number Percent Number Percent Number Percent
4,639 8.28% 2,908 5.05% 3,046 5.38% 1,886 4.00% 1,778 6.50% 2,826 6.00% 2,687 4.94% 2,075 4.02%
16,027 28.61% 17,222 29.89% i7,205 30.40% 15,275 31.93% 14,191 30.26% 13,157 29.03% 13,007 28.68% 12,051 27.19%8,962 16.00% 9,760 16.94% 9,328 16.48% 8,303 17.43% 7,745 i6.56% 7,203 16.62% 7,444 17.24% 7,245 17.44%
15,842 28.28% 17,194 29.84% 16,569 29.28% 14,186 28.49% 12,663 27.91% 12,137 28.05% 12,564 29.14% 12,247 29.93%
7,862 14.04% 8,055 I3.98% 7,957 14.06% 6,749 13.99% 6,219 14.25% 6,198 15.57% 6,974 15.61% 6,558 16.80%2,664 4.76% 2,464 4.28% 2,468 4.36% 1,967 4.01% 1,783 4.24% 1,842 4.40% 1,973 4.06% 1,704 4.39%
18 0.03% 12 0.02% 19 0.03% 39 0.15% 67 0.28% 121 0.33% 150 0.34% 142 0.24%
Total
Average Age
56,014 100.00% 57,615 100.00% 56,592 100.00% 48,405 100.00% 44,446 100.00% 43,484 100.00% 44,799 100.00% 42,022 100.00%
27.4 ** 27.5 ** 27.4 27.3 27.2 27.2 28.4 27.6
*The methodology for indicating ethnicity change in Fall 2010 to comply with federal guidelines.
**Remove q.Jnknown' age before calculating average.All figures are calculated fromthe CBM001&A reports combined.
See Independent Auditor's Report
78

Table 17HOUSTON COMMUNITY COLLEGE SYSTEM
CONTACT HOURSLAST TEN FISCAL YEARS
(Unaudited)
Funded Contact Hours
Fiscal Year Academic* Voc Tech* Total CEU * *
2012-2013 16,237,296 5,744,810 21,982,106 1,933,271
2011-2012 17,354,256 5,822,072 23,176,328 1,798,940
2010-2011 17,802,080 5,924,078 23,726,158 1,914,445
2009-2010 16,652,752 5,680,164 22,332,916 1,880,857
2008-2009 14,345,992 4,883,890 19,229,882 1,810,761
2007-2008 12,739,232 4,422,336 17,161,568 1,847,195
2006-2007 12,077,904 4,378,250 16,456,154 2,091,365
2005-2006 11,487,128 4,260,486 15,747,614 1,974,799
2004-2005 11,406,432 4,613,888 16,020,320 2,118,738
2003-2004 11,009,608 4,894,274 15,903,882 2,306,953
Note:
In FY2012, the data in the table has been revised to reflect all fundable contact hours. Thecontact hours has been restated to reflect the change for all year shown.
Source: CBM 001 & 00A.
See Independent Auditor's Report
79

Table 18HOUSTON COMMUNITY COLLEGE SYSTEM
TRANSFERS TO SENIOR INSTITUTIONS2011-2012 GRADUATES*
(Includes Only Public Senior Colleges in Texas)
1 Angelo State University2 Baylor College of Medicine3 Lamar University4 Midwestem State University5 Prairie View A&M University6 SamHouston State University7 Stephen F. Austin State University8 Sul Ross State University9 Tarleton State University 9
10 Texas A&M International University 111 Texas A&M University 94912 Texas A&M University - Central Texas 413 Texas A&M University - Conmaerce 814 Texas A&M University - Corpus Christi 4915 Texas A&M University - Kingsville 1616 Texas A&M University - San Antonio 117 Texas A&M University at Galveston 3418 Texas A&M University SystemHealth Science 3
19 Texas Southern University 73420 Texas State University - San Marcos 32921 Texas Tech University 25622 Texas Tech University Health Sciences Center 4123 Texas Woman's University 15324 The University of Texas - Pan American 1025 The University of Texas at Arlington 11526 The University of Texas at Austin 1,12427 The University of Tez¢as at Brownsville 128 The University of Texas at Dallas 5329 The University of Texas at El Paso 1030 The University of Texas at San Antonio 30631 The University of Texas at Tyler 2332 The University of Texas Health Science Center at 11833 Tile University of Texas Health Science Center at 1834 The University of Texas M.D. Anderson Cancer 50
35 The University of Texas Medical Branch at 85
36 The University of Texas of the Permian Basin 1737 University of Houston 3,64038 University of Houston - Clear Lake 21439 University of Houston - Downtown 1,48540 University of Houston - Victoria 31541 University of North Texas 8142 University of North Texas Health Science Center 1043 West Texas A&M University 7
Total StudentCount
Academic8
3
164
20
301
323
227
Total TotalStudent StudentCount Count
Technical Tech-Prep
5
1 130 315 18
1
9
2
2
1
53
25
4
18
1
2
18
1
9
4
1
130
25
114
244
1
1
1
3
l
1
1
1
16
1
9
5
Total ofaU % of allSample Sample
Transfer Transfer
Students Students8 0.07%3 0.03%
169 1.42%22 O. 19%334 2.82%339 2.86%235 1.98%
0 0.OO%9 0.08%2 0.02%
959 8.08%6 0.05%9 0.08%
49 0.41%18 0.15%2 0.02%35 0.29%3 0.03%
790 6.66%331 2.79%262 2.21%41 0.35%161 1.36%10 0.08%119 1.00%
1,142 9.62%2 0.02%56 0.47%10 0.08%
313 2.64%24 0.20%137 1.15%19 0.16%59 0.50%
89 0.75%
18 0.15%3,786 31.91%240 2.02%1,608 13.55%344 2.90%85 0.72%10
7 0.06%
11,315 503 47 11,865 100.00%
Source: T exas Higher Education Coordinating Board http://www.txhighereddata.org/reports!performance/ctcasalf/ctcaddI/
*Latest information available.
See Independent Auditor's Repolt
80

Table 19HOUSTON COMMUNITY COLLEGE SYSTEM
CAPITAL ASSET INFORMATIONFISCAL YEARS 2010 - 2013
(Unaudited)
Fiscal Year Fiscal Year Fiscal Year Fiscal Year2013 v 2012 2011 2010
Academic buildings *
Number of Academic BuildingsSquare footage
56 56 63 723,100,787 3,117,169 3,164,033 3,122,289
Libraries
Number o f Libraries 15 15 15 14Square footage 148,020 148,020 148,020 147,058Number of Volumes
Circulating books 241,382 231,099 206,784 193,635Reference books 24,299 24,190 24,553 24,674Media items 28,016 21,886 27,471 27,068Magazines, Journals, Newspapers 230 210 276 274
Electronic books (Digital video) 69,609 46,195 60,897 37,407Electronic Journals 23,535 19,136 21,935 35,848
Total 387,071 342,716 341,916 318,906
Administrative and support buildingsNumber o fAdministrative
and support buildingsSquare footage
4 4 3 3656,124 656,124 628,674 601,000
Transportation
Bus 2 2 2 2Cars 31 31 31 28Golf Cart 28 29 19 19Motorcycle/Segway 4 4 5Motor Home/Mobile Unit 3 3 2 2SUV 2 2 4 2Tank 2 2 2 2Tractors 29 29 35 36Trailers 49 49 45 46Truck 14 13 11 14Truck, Heavy (Fire Truck) 4 4 6 0Vans 21 20 23 21Utility Vehicles 1 1 6 4
Total 190 189 191 176
*Buildings include academic, workforce, administrative, central chiller plants, and warehouses. Not including parkinglots. Also, include both capital and operating leases.
See Independent Auditor's Report
81

SINGLE AUDIT

CRICARR Carr, Riggs & Ingrain, LLCRIGGS & Two Riverway, 15th FloorI N G RAM Houston, Texas 77056
CPAs and Advisors (713) 621-8090
(713) 621-6907 (fax)
www, criclaa,comREPORT ON INTERNAL CONTROL OVER FINANCIAL REPORTING AND ON COMPLIANCE AND
OTHER MATTERS BASED ON AN AUDIT OF FINANCIAL STATEMENTS PERFORMED INA CCORDANCE WITH GO VERNMENT AUDITING STANDARDS
Board of TrusteesHouston Community College SystemHouston, Texas
We have audited, in accordance with the auditing standards generally accepted in the United States of Americaand the standards applicable to financial audits contained in Government Auditing Standards issued by theComptroller General of the United States, the financial statements of Houston Community College System (the"System") as of and for the year ended August 31, 2013, and the related notes to the financial statements, whichcollectively comprise the System's basic financial statements, and have issued our report thereon datedNovember 14, 2013.
Internal Control Over Financial Reporting
In planning and performing our audit of the financial statements, we considered the System's internal controlover fmancial reporting (internal control) to determine the audit procedures that are appropriate in thecircumstances for the purpose of expressing our opinion on the financial statements, but not for the purpose ofexpressing an opinion on the effectiveness of the System's internal control. Accordingly, we do not express anopinion on the effectiveness of the System's internal control.
A deficiency in internal control exists when the design or operation of a control does not allow
management or employees, in the normal course of performing their assigned functions, to prevent, ordetect and correct, misstatements on a timely basis. A material wealmess is a deficiency, or a combination ofdeficiencies, in internal control, such that there is a reasonable possibility that a material misstatement of theSystem's fmancial statements will not be prevented, or detected and corrected on a timely basis. A
significant deficiency is a deficiency, or a combination of deficiencies, in internal control that is less severethan a material weakness, yet important enough to merit attention by those charged with governance.
Our consideration of internal control was for the limited purpose described in the first paragraph of thissection and was not designed to identify all deficiencies in internal control that might be material weaknesses
or significant deficiencies. Given these limitations, during our audit we did not identify any deficiencies ininternal control that we consider to be material weaknesses. However, material weaknesses may exist thathave not been identified.
Compliance and Other Matters
As part of obtaining reasonable assurance about whether the System's financial statements are flee from
material misstatement, we performed tests of its compliance with certain provisions of laws, regulations,
contracts, and grant agreements, noncompliance with which could have a direct and material effect on thedetermination of financial statement amounts. However, providing an opinion on compliance with thoseprovisions was not an objective of our audit, and accordingly, we do not express such an opinion. The resultsof our tests disclosed no instances of noncompliance or other matters that are required to be reported tinder
Government Auditing Standards.

Texas Public Funds Investment Act
We also performed tests of the System's compliance with the requirements of the Texas Public FundsInvestment Act (the Act). The results of our tests disclosed no instances of noncompliance with the Act.However, providing an opinion on compliance with the Act was not an objective of our audit and accordingly,we do not express an opinion.
Purpose of this Report
The purpose of this report is solely to describe the scope of our testing of internal control and compliance andthe results of that testing, and not to provide an opinion on the effectiveness of the organization's internalcontrol or on compliance. This report is an integral part of an audit performed in accordance with GovernmentAuditing Standards in considering the organization's internal control and compliance. Accordingly, thiscommunication is not suitable for any other purpose.
Houston, TexasNovember 14, 2013

CRIcARRRIGGS &INGRAM
Carr, Riggs & Ingrain, LLC
Two Riverway, 15th Floor
Houston, Texas 77056
CPAs and Advisors (713) 621-8090
(713) 621-6907 (fax)
www.cricpa.com
INDEPENDENT AUDITOR' S REPORT ON COMPLIANCE FOR EACH MAJOR PROGRAM AND ONINTERNAL CONTROL OVER COMPLIANCE IN ACCORDANCE WITH OMB CIRCULAR A-133 AND
THE STATE OF TEXAS SINGLE AUDIT CIRCULAR
Board of TrusteesHouston Community College SystemHouston, Texas
Report on Compliance for Each Major Federal and State of Texas Program
We have audited Houston Community College System (the "System") compliance with the types of compliance
requirements described in the OMB Circular A-133 Compliance Supplement and The State of Texas SingleAudit Circular that could have a direct and material effect on each of System's major Federal and State ofTexas programs for the year ended August 31, 2013. The System's major federal and state of Texasprograms are identified in the summary of auditor's results section of the accompanying schedule of findingsand questioned costs.
Management's Responsibility
Management is responsible for compliance with the requirements of laws, regulations, contracts, andgrants applicable to its federal and state of Texas programs.
Auditor's Responsibility
Our responsibility is to express an opinion on compliance for each of the System's major federal and state ofTexas programs based on our audit of the types of compliance requirements referred to above. We conducted
our audit of compliance in accordance with auditing standards generally accepted in the United States ofAmerica; the standards applicable to financial audits contained in Government Auditing Standards, issuedby the Comptroller General of the United States; OMB Circular A-133, Audits of States, LocalGovernments, and Non-Profit Organizations; and The State of Texas Single Audit Circular. Those standards,
OMB Circular A-133 and The State of Texas Single Audit Circular require that we plan and perform the auditto obtain reasonable assurance about whether noncompliance with the types of compliance requirementsreferred to above that could have a direct and material effect on a major federal or state of Texas programoccurred. An audit includes examining, on a test basis, evidence about the System's compliance with those
requirements and performing such other procedures as we considered necessary in the circumstances.
We believe that our audit provides a reasonable basis for our opinion on compliance for each major federal andstate of Texas program. However, our audit does not provide a legal determination of the System's
compliance.
Opinion on Each Major Federal and State of Texas Program
In our opinion, the System complied, in all material respects, with the types of compliance requirementsreferred to above that could have a direct and material effect on each of its major federal and state of Texasprograms for the year ended August 31, 2013.

Report on Internal Control Over Compliance
Management of the System is responsible for establishing and maintaining effective internal control overcompliance with the types of compliance requirements referred to above. In planning and performing our audit
of compliance, we considered the System's internal control over compliance with the types of requirementsthat could have a direct and material effect on each major federal and State of Texas program to determine the
auditing procedures that are appropriate in the circumstances for the purpose of expressing an opinion oncompliance for each major federal and state of Texas program and to test and report on internal control overcompliance in accordance with OMB Circular A-133 and The State of Texas Single Audit Circular, but not forthe purpose of expressing an opinion on the effectiveness of internal control over compliance. Accordingly,we do not express an opinion on the effectiveness of the System's internal control over compliance.
A deficiency in internal control over compliance exists when the design or operation of a control overcompliance does not allow management or employees, in the normal course of performing their assignedfunctions, to prevent, or detect and correct, noncompliance with a type of compliance requirement of a federa 1or state of Texas program on a timely basis. A material weakness in internal control over compliance is adeficiency, or combination of deficiencies, in internal control over compliance, such that there is a
reasonable possibility that material noncompliance with a type of compliance requirement of a federal or stateof Texas program will not be prevented, or detected and corrected, on a timely basis. A significant deficiencyin internal control over compliance is a deficiency, or a combination of deficiencies, in internal control over
compliance with a type of compliance requirement of a federal or state of Texas program that is less severethan a material weakness in internal control over compliance, yet important enough to merit attention by thosecharged with governance.
Our consideration of internal control over compliance was for the limited purpose described in the firstparagraph of this section and was not designed to identify all deficiencies in internal control over compliancethat might be material weaknesses or significant deficiencies. We did not identify any deficiencies in internalcontrol over compliance that we consider to be material weaknesses. However, material weaknesses may existthat have not been identified.
The purpose of this report on internal control over compliance is solely to describe the scope of our testingof internal control over compliance and the results of that testing based on the requirements of OMB CircularA-133 and The State of Texas Single Audit Circular. Accordingly, this report is not suitable for any otherpurpose.
Houston, TexasNovember 14, 2013

Schedule EHOUSTON COMMUNITY COLLEGE SYSTEM
SCHEDULE OF EXPENDITURES OF FEDERAL AWARDSFOR THE YEAR ENDED AUGUST 31, 2013
Federal GrantorPass-through Grantor
Program Title
Pass-ThroughFederal Pass-Through DisbursementsCFDA Grantor's and
Number Number Expenditures
U. S. Department of EducationDirect Programs:Student Financial Aid Cluster
Federal Supplemental Educational Opportunity GrantsFederal Work-Study ProgramFederal Pell Grant ProgramFederal Direct Student LoansTeacher Education Assistance for College and Higher
Education Grants (TEACH Grants)
84.007 $ 1,397,120
84.033 802,902
84.063 93,026,72184.268 108,426,338
84.379
Total Student Financial Aid Cluster
52,500
203,705,581
TRIO ClusterTRIO - Student Support ServicesTRIO - Upward Bound
Total TRIO Cluster
84.042 410,82284.047 833,243
1,244,065
84.031A 128,21984.120A 209,71884.407A 431,428
84.002A 134100017110481 5,363,18584.002A 134100087110487 126,596
5,489,781
University of St. Thomas
Higher Education - Institutional AidUST HSI STEM
84.031C Art# 1- HCCS 781,265
Texas Higher Education Coordinating Board
Career and Technical Education - Basic Grants to States
Career and Technical Education - Basic Grants to States
Total Career and Technical Education
College Access Challenge Grant ProgramCollege Access Challenge Grant ProgramCollege Access Challenge Grant Program
Total College Access Challenge Grant Program
84.048 124246 4,745
84.048 134235 824r843
829,588
84.378 06020 15,00084.378A 11253 5,46284.378 09220 144,140
164,602
Total U.S. Department of Education
Pass-Through From:Texas Educational Agency
Adult Education - Basic Grants to StatesAdult Education - Basic Grants to States
Total Adult Education - Basic Grants to States
Higher Education - Institutional AidMinority Science and Engineering ImprovementTransition Programs for Students with Intellectual Disabilities
into Higher Education
212,984,247
See Independent Auditor's Report and accompanying notes to Schedule of Expenditures of Federal Awards.
87
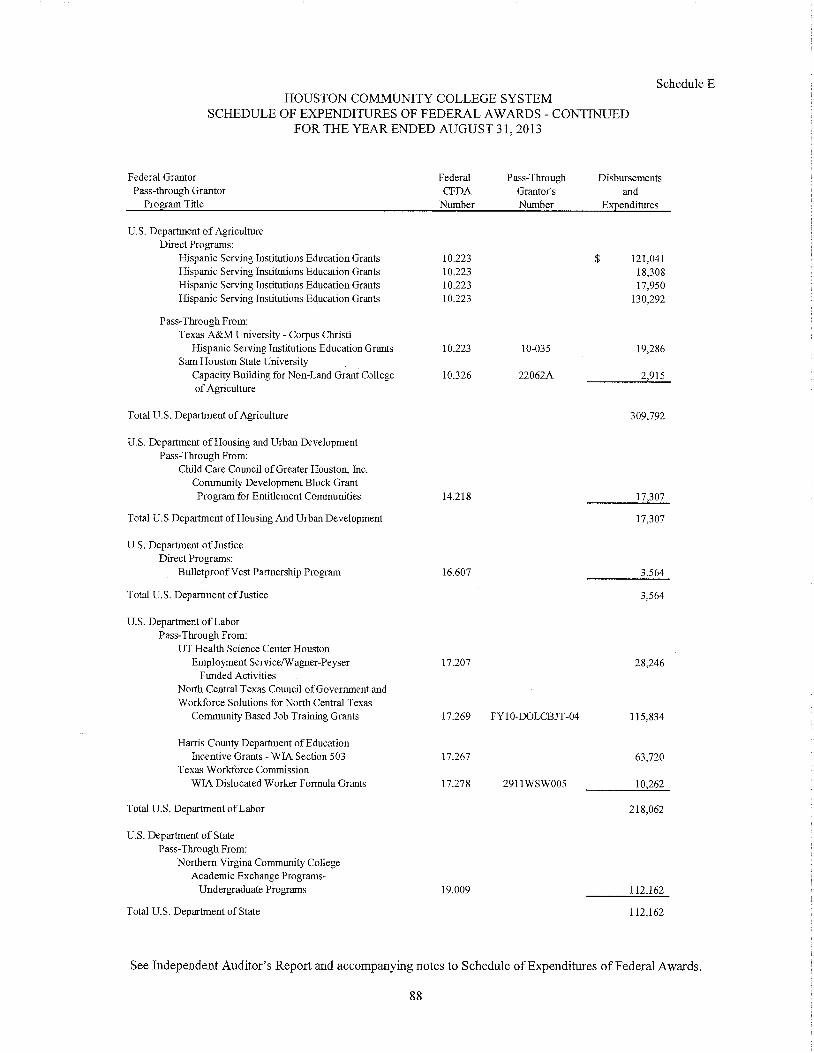
Schedule EHOUSTON COMMUNITY COLLEGE SYSTEM
SCHEDULE OF EXPENDITURES OF FEDERAL AWARDS - CONTINUEDFOR THE YEAR ENDED AUGUST 31, 2013
Federal GrantorPass-through Grantor
Program Title
Federal Pass-Through DisbursementsCFDA Grantor's and
Number Number Expenditures
U.S. Department of AgricultureDirect Programs:
Hispanic Serving Institutions Education GrantsHispanic Serving Institutions Education GrantsHispanic Serving Institutions Education GrantsHispanic Serving Institutions Education Grants
10.223 $ 121,041
10.223 18,30810.223 17,95010.223 130,292
Pass-Through From:Texas A&M University - Corpus Christi
Hispanic Serving Institutions Education GrantsSam Houston State University
Capacity Building for Non-Land Grant Collegeof Agriculture
Total U.S Department of Housing And Urban Development
U.S. Department of JnsticeDirect Programs:
Bulletproof Vest Partnership Prograna
Total U.S. Department of Jnstice
U.S. Department of LaborPass-Through From:
UT Health Science Center HoustonEmployment Service/Wagner-Peyser
Funded ActivitiesNorth Central Texas Council of Goverument andWorkforce Solutions for North Central Texas
Community Based Job Training Grants
Harris County Department of EducationIncentive Grants - WIA Section 503
Texas Workforce CommissionWIA Dislocated Worker Formula Grants
Total U.S. Department of Labor
U.S. Department of StatePass-Through From:
Northern Virgina Community CollegeAcademic Exchange Programs
Undergraduate Programs
Total U.S. Department of State
U.S. Department of Housing and Urban DevelopmentPass-Through From:
Child Care Council of Greater Houston, Inc.Cormnanity Development Block GrantProgram for Entitlement Communities
Total U.S. Department of Agriculture
10.223 10-035 19,286
10.326 22062A 2,915
14.218
17.269 FY10-DOLCBJT-04 115,834
17.267 63,720
17.278 2911WSW005 10,262
218,062
19.009
16.607
17.207 28,246
309,792
17,307
17,307
3,564
3,564
112,162
112,162
See Independent Auditor's Report and accompanying notes to Schedule of Expenditures of Federal Awards.
88

Schedule EHOUSTON COMMUNITY COLLEGE SYSTEM
SCHEDULE OF EXPENDITURES OF FEDERAL AWARDS - CONTINUEDFOR THE YEAR ENDED AUGUST 31, 2013
Federal GrantorPass-through Grantor
Program Title
Pass-ThroughFederal Pass-Through Disbursements
CFDA Grantor's andNumber Number Expenditures
U.S. Department of TransportationCommercial Motor Vehicle Operator Tranining Grants
Total U.S. Department of Transportation
20.235 $ 14,633
14,633
National Endowment for the Humanities
P ass-Through From:American Library Association
Promotion of the Humanities Public- Programs 45.164 2219
Total National Endowment of the Humanities
2,659
2,659
45.310 479-13004 54,50845.310 7,500
National Science FoundationDirect Programs:
Education and Human ResourcesPass-Through From:
University of HoustonEducation and Human Resources
47.076 55,702
47.076 R-09-0170
Total National Science Foundation
U. S. Depamnent of Veterans AffairsDirect Programs:
Post 9/11 Veterans Educational Assistance
Total U.S. Department of Veterans Affairs
64.028
U.S. Department of EnergyDirect Programs:
Renewable Energy Research and Development 81.087 220,653
Pass-Through From:Texas Comptroller of Public Accounts
State Energy Conservation Office (SECO)State Energy Program
City Of San AntonioEnergy Efficiency and Renewable Energy
Information Dissemination Outreach,Training and Technical Analsis/Assistance
81.041 CS0106 37,180
81.117
Total U.S. Department of Energy
Total Institute ofMuseunl & Library Services
Institute of Museum & Library ServicesPass-Through From:
Texas State Library Archive Con nission
Grants to StatesGrants to States
62,008
41,191
96,893
2,253,406
2,253,406
13,972
271,805
See Independent Auditor's Report and accompanying notes to Schedule of Expenditures of Federal Awards.
89

Schedule EHOUSTON COMMUNITY COLLEGE SYSTEM
SCHEDULE OF EXPENDITURES OF FEDERAL AWARDS - CONTINUEDFOR THE YEAR ENDED AUGUST 31, 2013
Federal Grantor
Pass-through Grantor
Program Title
Pass-ThroughFederal Pass-Through Disbursements
CFDA Grantor's and
Number Number Expenditures
U. S. Department of Health and Human Services
Direct Programs:
Head Start Cluster
Head Start 93.600 $ 174,881
Pass-Through From:
University of Texas at Austin
Substance Abuse and Mental Health Services - Projects
of Regional and National Significance93.243 UTA12-001074 13,587
YMCA of Greater Houston
Refugee and Entrant Assistance - Targeted Assistance Grants
Refugee and Entrant Assistance - Targeted Assistance Grants
Total Refugee and Entrant Assistance - Targeted Assistance Grants
93.584 529-08-0181-00010C
93.584 529-08-0181-00010D
Pitt Community College
ARRA - Health Information Technology Professionals in Health Care 93.721 90CC0078/02-05
Total U.S. Department of Health and Human Services
Corporation for National and Community Service
Direct Programs:
AmefiCorps
Total Corporation for National and Commtmity Service
94.006
Department of Homeland Security
Direct Programs:
Scientific Leadership Awards 97.062
Total Department of Homeland Security
93.558 12362501711039093.558 113625017110454
Pass-Through from Texas Education Agency:TANF Cluster
Temporary Assistance for Needy Fanailies
Temporary Assistance for Needy Families
Total Temporary Assistance for Needy Families
i0,178238,349
248,527
19,869269,370
289,239
381,598
1,107,831
81,73I
81,731
16,497
16,497
$ 217,552,598TOTAL EXPENDITURES OF FEDERAL AWARDS
See Independent Auditor's Report and accompanying notes to Schedule of Expenditures of Federal Awards.
90

HOUSTON COMMUNITY COLLEGE SYSTEMNOTES TO THE SCHEDULE OF EXPENDITURES OF FEDERAL AWARDS
NOTE 1 - SIGNIFICANT ACCOUNTING POLICIES USED IN PREPARING THE SCHEUDLE
The Schedule of Expenditures of Federal Awards presents the federal grant activity of the Houston CommunityCollege System ( the "System") for the year ended August 31, 2013. The information in this schedule ispresented in accordance with the requirements of OMB Circular A-133, Audits of States, Local Government,and Non-Profit Organizations, and includes awards received directly from federal agencies, as well as federalawards passed through other government agencies.
The accompanying Schedule of Expenditures of Federal Awards is presented using the accrual basis ofaccounting. Revenue is recognized when earned and expenditures are recognized when incurred. Revenues arereported only to the extent of expenditures for the current year. Federal receivables represent amountsexpended in excess of revenues received.
NOTE 2 - FEDERAL ASSISTANCE RECONCILIATION
Federal Grants and Contracts Revenue - per Schedule A
Reconciling items:
Schedule C - Title IV GrantsFederal Direct Student Loans
Total Federal Revenues per Schedule of Expenditures of Federal Awards
14,702,419
94,423,841
108,426,338
217,552,598
NOTE 3 - SUBRECIPIENTS
The following were suhrecipients of the Adult Education - Basic Grants to States (Adult Education and FamilyLiteracy Act), CFDA 84.002. These amounts are included as expenditures in the accompanying Schedule ofExpenditures of Federal Awards.
Alliance for Multiculmral Cormnunity ServicesAssociation for the Advancement of Mexican Americans
AVANCEChinese Community Center
Community Family CenterGulf Coast Community Services
Harris County Community Supervision and Correction
Houston Center for Literacy
Houston International UniversityHouston Read Commission
Neighborhood Centers, Inc.
SEARCH
192,066
968,656
141,566
174,139
920,425
51,719
64,789
647,528
84,100
51,530208,007
21,300
Total Passed-through to Subrecipients $ 3,525 825
91

HOUSTON COMMUNITY COLLEGE SYSTEMNOTES TO THE SCHEDULE OF EXPENDITURES OF FEDERAL AWARDS
NOTE 3 - SUBRECIPIENTS - CONTINUED
The following were subrecipients of Hispanic Serving Institutions Education Grants, CFDA 10.223. Theseamounts are included as expenditures in the accompanying Schedule of Expenditures of Federal Awards.
Del Mar College $ 22,000E1 Centro College 19,815Texas A&M University 23,790University of Houston 9,269
Total Passed-through to subrecipients $ 74,874
The following were subrecipients of the Renewable Energy Research and Development, CFDA 81.087. Theseamounts are included as expenditures in the accompanying Schedule of Expenditures of Federal Awards.
Central New Mexico State UniversityOntilitySam Houston State University
SUL Ros State University
Texas State Technical College
1,250
54,963
1,4382,590
4,603
Total Passed-through to subrecipients $ 64,844
92

Schedule FHOUSTON COMMUNITY COLLEGE SYSTEM
SCHEDULE OF EXPENDITURES OF STATE OF TEXAS AWARDSFOR THE YEAR ENDED AUGUST 31, 2013
State Grantor
Program TitleTexas Education Agency
ABE - GEl)ABE - GEDDropout Recovery Pilot Program CycleTemporary Assistance for Needy FamiliesTemporary Assistance for Needy Families
Total ABE - GED
Grantor's
Number
2121 1201000171104152122 1301000171104812243 1010455871100082231 1123625017110390
2232 133625017110454
Total Texas Education Agency
2142 03472 158,3112332/2333 N/A 19,139
2407 06838 5,577
2305 N/A 7,2002301 N!A 37,147
2303 N!A 74,1622291 N/A 4,800
5454/5455 N/A 101,8975463/5465 N/A 975,659
5462/5464 N/A 2,011,380
Texas Higher Education Coordinating BoardAdult Basic Education hmovation GrantCollegiate G-Force Work-Study Mentorship ProgramFirst Year ExperienceHouston Pathways Initiative - College for Readiness
Nursing Shortage Reduction Program
Nursing Shortage Under 70 Program
Rider 58 Funds
Texas College Work Study Program
Texas Educational Opportunity Grant
Texas Grant Program
Pass-ThroughFrom:University of Texas Health Science Center at Houston
Online Navigational Assessment Vehicle InterventionGuidance and Training of Risks (NAVIGATOR) forUndergraduate Minority Student Success
Total Texas Higher Education Coordinating Board
Texas Workforce CommissionSkills for Small Business ProgramBen E. Keith Co.The Methodist HospitalVITAS
Pass-Through From:Texas State Technical College
TYCO Valves and Controls GP Holdings Inc.
Total Texas Workforce Commission
Texas State Board of Public Accountancy
2440 0007828A
2372
5471 N/A
TOTAL EXPENDITURES OF STATE OF TEXAS AWARDS
2408 2812SSD0012370 2813SDF003
2415 2112SDF006
2371 2813SDF002
Pass-Through
Disbursements
and
Expenditures
$ 24,6181,811,991
65,543
16,311
118,953
2,037,416
28,522
3,423,794
4O9
61,051
579,459
114,833
41,383
797,135
9,549
$ 6,267,894
See Independent Auditor's Report and accompanying notes to Schedule of Expenditures of State OF Texas Awards.
93
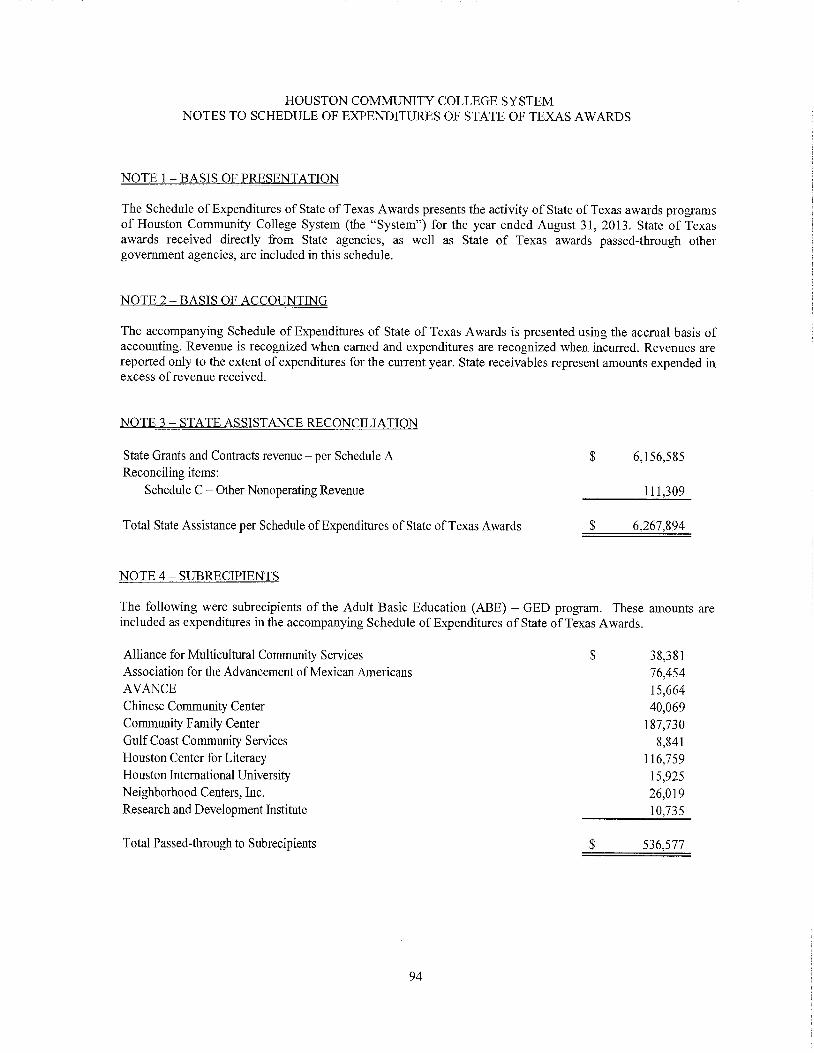
HOUSTON COMMUNITY COLLEGE SYSTEMNOTES TO SCHEDULE OF EXPENDITURES OF STATE OF TEXAS AWARDS
NOTE 1 - BASIS OF PRESENTATION
The Schedule of Expenditures of State of Texas Awards presents the activity of State of Texas awards programsof Houston Community College System (the "System") for the year ended August 31, 2013. State of Texasawards received directly om State agencies, as well as State of Texas awards passed-through othergovernment agencies, are included in this schedule.
NOTE 2 - BASIS OF ACCOUNTING
The accompanying Schedule of Expenditures of State of Texas Awards is presented using the accrual basis ofaccounting. Revenue is recognized when earned and expenditures are recognized when incurred. Revenues arereported only to the extent of expenditures for the current year. State receivables represent amounts expended inexcess of revenue received.
NOTE 3 - STATE ASSISTANCE RECONCILIATION
State Grants and Contracts revenue - per Schedule A
Reconciling items:
Schedule C - Other Nonoperating Revenue
Total State Assistance per Schedule of Expenditures of State of Texas Awards
6,156,585
111,309
6,267,894
NOTE 4 - SUBRECIPIENTS
The following were subrecipients of the Adult Basic Education (ABE) - GED program. These amounts areincluded as expenditures in the accompanying Schedule of Expenditures of State of Texas Awards.
Alliance for Multicultural Community Services
Association for the Advancement of Mexican Americans
AVANCEChinese Community Center
Community Family Center
Gulf Coast Community Services
Houston Center for Literacy
Houston International University
Neighborhood Centers, Inc.
Research and Development Institute
38,381
76,454
15,664
40,069
187,730
8,841
116,759
15,925
26,019
10,735
Total Passed-through to Subrecipients $ 536,577
94

HOUSTON COMMUNITY COLLEGE SYSTEMNOTES TO SCHEDULE OF EXPENDITURES OF STATE OF TEXAS AWARDS
NOTE 4 - SUBRECIP1ENTS - CONTINUED
The following were subrecipients of the ABE Innovation Grant program. These amounts are included asexpenditures in the accompanying Schedule of Expenditures of State of Texas Awards.
Alliance for Multicultural Community Services
Chinese Community Center
Literacy Advance of Houston
12,800
10,600
1,000
Total Passed-through to Subrecipients $ 24,400
The following were subrecipients of the Skills Development program. These amountsexpenditures in the accompanying Schedule of Expenditures of State of Texas Awards.
are included as
Gannett Satellite Information Network
The Methodist Hospital
Vitas Healthcare of Texas
155,490
112,159
23,750
Total Passed-through to Subrecipients $ 291,399
95

HOUSTON COMMUNITY COLLEGE SYSTEMSCHEUDLE OF FINDINGS AND QUESTIONED COSTS
FOR THE YEAR ENDED AUGUST 31, 2013
SECTION I - SUMMARY OF AUDITOR'S RESULTS
Financial Statements
Type of anditors' report issued:
Internal control over financial reporting:
Material weakness(es) identified?
Significant deficiencies identified that are not
considered to be material weaknesses?
Noncompliance material to financial statements noted?
Federal and State of Texas Awards
Internal control over major programs:
Material weakness(es) identified?
Significant deficiencies identified that are not
considered to be material weaknesses?
Type of auditors' report issued on compliance for major
programs:
Any audit findings disclosed that are required to be reported
in accordance with
Section 510(a) of Circular A-133 and the
State of Texas Single Audit Circular ?
Unmodified
yes X no
yes
yes
none
X reportedX no
Unmodified
yes X no
none
yes X reported
yes X no
Identification of Majopr Programs:
Federal - CFDA Number
Cluster of Programs - Student Financial Aid:Name of Federal Programs
84.007
84.033
84.063
84.268
84.375
84.379
Federal Supplemental Educational Opportunity
Grants
Federal Work Study Program
Federal Petl Grant Program
Federal Direct Loan Program
Academic Competitiveness GrantsTeacher Education Assistance for College and
Higher Education Grants (TEACH Grants)
96

HOUSTON COMMUNITY COLLEGE SYSTEMSCHEUDLE OF FINDINGS AND QUESTIONED COSTS - CONTINUED
FOR THE YEAR ENDED AUGUST 31, 2013
SECTION I - SUMMARY OF AUDITOR'S RESULTS - CONTINUED
Federal - CFDA Number Name of Federal Programs
Clus rofPrograms- TRIO:84.042
84.047
Student Support ServicesUpward Bound
84.031 Higher Education - Instiutional Aid
84.407ATransition Program for Students with Intellectual
Disabilities into Higher Education
93.584Refugee and Entrant Assistance - Targeted
Assistance Grants
93.721ARRA - Health Information Technology
Professionals in Healthcare
State - Contract Nuanber Program Title
N/AN/AN/A2415
Texas Grant Prograna
Texas Educational Opportunity GrantTexas College Work Study ProgramThe Methodist Hospital
Dollar threshold used to distinguish between
Type A and type B programs:
Federal $415,411
State of Texas $300,000
Auditee qualifted as low-risk auditee?
Federal X yes no
State of Texas X yes no
SECTION II - FINANCIAL STATEMENT FINDINGSNone
SECTION III- FEDERAL AWARD FINDINGS AND QUESTIONED COSTS - MAJOR FEDERAL ANDSTATE OF TEXAS AWARD PROGRAMS AUDIT
None
97

HOUSTON COMMUNITY COLLEGE SYSTEMSUMMARY SCHEDULE OF PRIOR AUDIT FINDINGS
FOR THE YEAR ENDED AUGUST 31, 2013
U.S. DEPARTMENT OF EDUCATION
Finding 2012-1
Programs: Federal Supplemental Educational Opportunity Grants, Federal Pell Grant Program and FederalDirect Student Loans, and Academic Competitiveness Grants (Student Financial Aid Cluster)
CFDA: 84.007, 84.063, 84.268, 84.375
Condition: The System incorrectly calculated the return of unearned funds to Title IV.
Recommendation: It was recommended that the System develop and implement formalized changemanagement processes and controls over the PeopleSoft Campus Solutions Financial Aid System to ensure thatchanges to the application are appropriate, authorized, tested, tracked, documented, and monitored
Current Status: The recommendations were adopted during fiscal year ended August 31, 2013. No similarfindings were noted in the 2013 audit.
Finding 2012 -2
Programs: Federal Pell Grant Program and Federal Direct Student Loans (Student Financial Aid Cluster)
CFDA: 84.063 and 84.268
Condition: During fiscal year 2011, we reported a finding whereby award adjustments were applied to thestudent's accounts after tuition and fees were assessed and credit balances were disbursed to the students. Dueto increase in the number of students applying and receiving financial aid awards, the System experienceddelays in performing timely reconciliations to ensure student's eligibility was verified prior to disbursement tothe student's account. In addition, components of the financial aid process were not fully automated whichwould enable the System to ensure that funds are not refunded until a review and recalculation was performedto ensure continued eligibility. The System began corrective action to ensure compliance with applyingfinancial aid awards to eligible students in fiscal year 2012.
Recommendation: It was recommended that the System continue to develop automated processes.
Current Status: The recommendation was fully adopted during fiscal year ended August 31, 2013. No similarfindings were noted in the 2013 audit.
98