Welcome to the Open Sky Webinar The webinar starts at 6pm, see you soon!
Upload
businessforwardCategory
view
348download
0
US HOUSING MARKET CONDITIONS
March 6, 2015
Edward Golding, Senior Advisor, U.S. Department of Housing and Urban Development Frank Nothaft, Senior Vice President and Chief Economist, CoreLogic
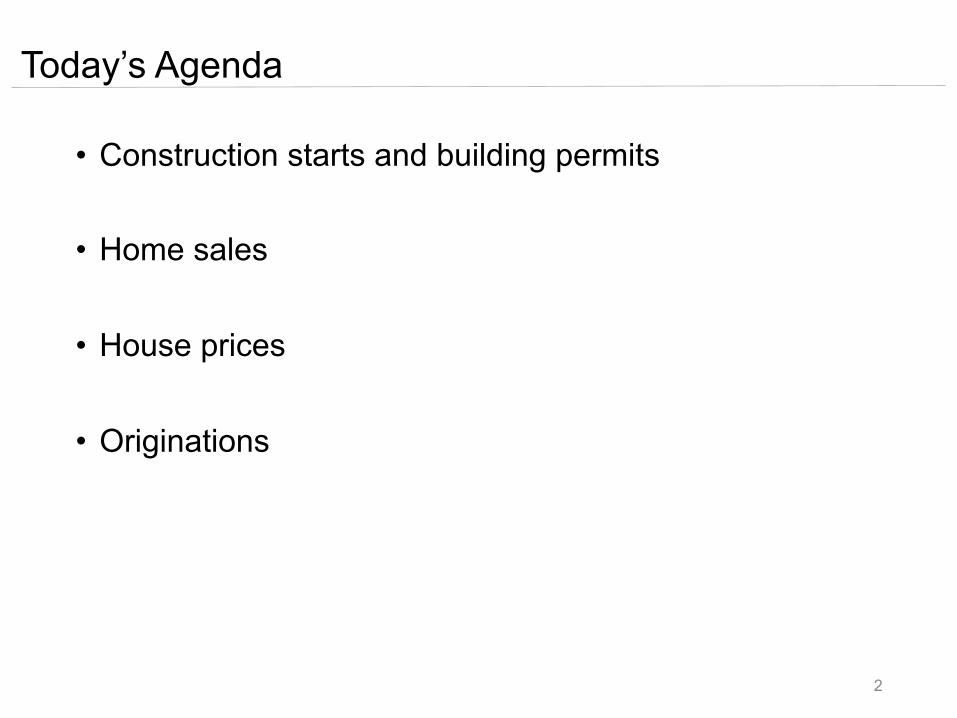
• Construction starts and building permits
• Home sales
• House prices
• Originations
Today’s Agenda
2

Housing Starts
0 50 100 150 200 250 300 350 400 450 500
0 200 400 600 800
1,000 1,200 1,400 1,600 1,800 2,000
Single-Family Housing Starts Continued To Climb, But Multifamily Housing Starts Fell in the 4th Quarter
National Housing Starts (Thousands)
Seasonally Adjusted Annual Rate Sources: Census Bureau and HUD.
Year and Quarter
Multifamily Starts (right axis)
Single-Family Starts
(left axis)
3
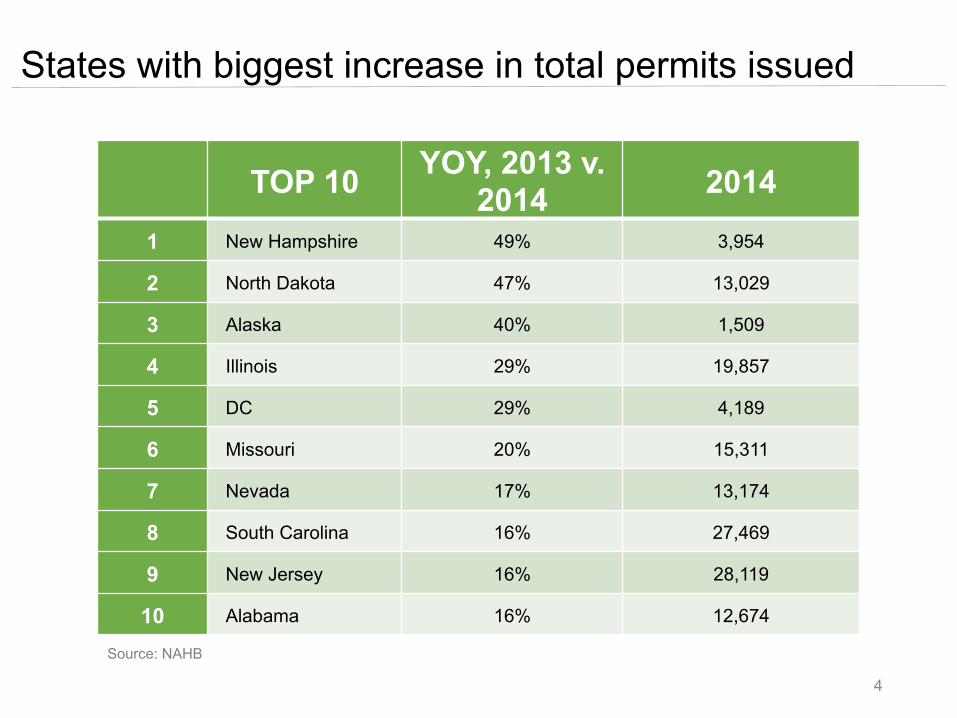
States with biggest increase in total permits issued
TOP 10 YOY, 2013 v. 2014 2014
1 New Hampshire 49% 3,954
2 North Dakota 47% 13,029
3 Alaska 40% 1,509
4 Illinois 29% 19,857
5 DC 29% 4,189
6 Missouri 20% 15,311
7 Nevada 17% 13,174
8 South Carolina 16% 27,469
9 New Jersey 16% 28,119
10 Alabama 16% 12,674
Source: NAHB
4
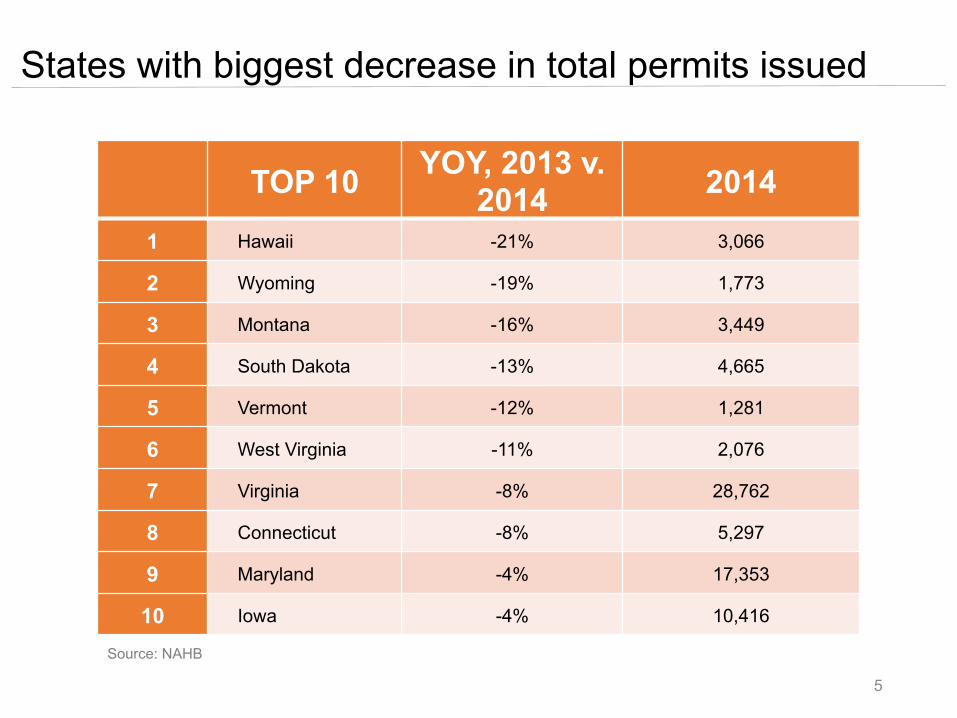
States with biggest decrease in total permits issued
TOP 10 YOY, 2013 v. 2014 2014
1 Hawaii -21% 3,066
2 Wyoming -19% 1,773
3 Montana -16% 3,449
4 South Dakota -13% 4,665
5 Vermont -12% 1,281
6 West Virginia -11% 2,076
7 Virginia -8% 28,762
8 Connecticut -8% 5,297
9 Maryland -4% 17,353
10 Iowa -4% 10,416
Source: NAHB
5

Home Sales: 2015 Projected Up 4% from 2014 (2015 Expected to Have Most Sales Since 2007)
200
500
800
1,100
1,400
2,500
3,500
4,500
5,500
6,500
7,500
Jan-00 Jul-00 Jan-01 Jul-01 Jan-02 Jul-02 Jan-03 Jul-03 Jan-04 Jul-04 Jan-05 Jul-05 Jan-06 Jul-06 Jan-07 Jul-07 Jan-08 Jul-08 Jan-09 Jul-09 Jan-10 Jul-10 Jan-11 Jul-11 Jan-12 Jul-12 Jan-13 Jul-13 Jan-14 Jul-14 Jan-15 Jul-15
U.S. Existing Home Sales (Thousands) U.S. New Home Sales (Thousands)
Peak-to-2014Q4: Existing Down 30%
New Down 64%
Forecast
Sources: US Census Bureau, National Association of Realtors® (“Peak” is 2005Q3), CoreLogic 2015 forecast. 6

Composition of home sales has changed
Existing home sales 84%
New home sales
16%
Historical average
Existing home sales
93%
New home sales 7%
Recovery average
7

New Sales & Resales (nondistressed) Are Up
8
--------Forecast--------2011 2012 2013 2014 2015 2016
Existing Home Sales (Thousands) 4,357 4,868 5,263 5,214 5,375 5,483 Resales (Non-Distressed) 3,143 3,703 4,278 4,459 4,656 4,808 Distressed Sales (Short and REO) 1,214 1,165 984 756 719 675
New Home Sales (Thousands) 349 404 472 484 554 648
Total Home Sales (Thousands) 4,706 5,273 5,735 5,698 5,929 6,131 percent change -2% 12% 9% -1% 5% 3%
Distressed Sales Share (Percent) 2,012 22% 17% 13% 12% 11%Cash Sales Share (Percent) 43% 42% 39% 36% 34% 32%
Source: CoreLogic MarketTrends, CoreLogic Office of the Chief Economist forecast

Distressed Sales & Cash Sales Trending Down
9
--------Forecast--------2011 2012 2013 2014 2015 2016
Existing Home Sales (Thousands) 4,357 4,868 5,263 5,214 5,375 5,483 Resales (Non-Distressed) 3,143 3,703 4,278 4,459 4,656 4,808 Distressed Sales (Short and REO) 1,214 1,165 984 756 719 675
New Home Sales (Thousands) 349 404 472 484 554 648
Total Home Sales (Thousands) 4,706 5,273 5,735 5,698 5,929 6,131 percent change -2% 12% 9% -1% 5% 3%
Distressed Sales Share (Percent) 2,012 22% 17% 13% 12% 11%Cash Sales Share (Percent) 43% 42% 39% 36% 34% 32%
Source: CoreLogic MarketTrends, CoreLogic Office of the Chief Economist forecast

House Prices
150
175
200
225
250
275
U.S. House Prices Were Up in 2014 Monthly House Price Trends By Index ($ Thousands)
Sources: Standard & Poor's, Federal Housing Finance Agency, CoreLogic, and HUD.
CoreLogic (Excluding Distressed Sales)
S&P/Case-‐Shiller 20-‐City Index
FHFA Purchase-‐only Index
10

Home Price Change, Dec. 2014 vs. Dec. 2013
11 Source: CoreLogic Home Price Index (detached and attached, including distressed sales)
CoreLogic forecast for 2015: U.S. HPI up 5% to 6%

Purchase-Money Will Dominate Origination Mix
12
$350 $440 $580 $580 $640
$856
$1,312 $990
$380 $360
$286
$370 $355
$240 $250
$1,492
$2,122 $1,925
$1,200 $1,250
2011 2012 2013 2014 2015 Conventional Purchase Conventional Refi FHA & VA
(38)%
Single-Family Mortgage Originations ($ Billions)
Lowest Refi Share Since 2000
Origination Activity Projected to Decline by Almost One-Half 2012 to 2015
Sources: Freddie Mac, HUD, VA, CoreLogic 2015 projection
Forecast
12