Household Hunger Scale (HHS): Indicator Definition and Measurement Guide, Aug 2011

Household Over-Indebtedness
Definition and Measurement with Italian Data
Giovanni D’Alessio* and Stefano Iezzi†
Abstract
The last decade has seen significant increases in consumer indebtedness in western countries, causing concern about its economic and social impact. In particular, over-indebtedness is attracting attention from national and international authorities because of its potential effect on both the sustainability of households’ indebtedness and the stability of the financial system. From a social point of view, the excessive accumulation of debts accompanied by households’ liquidity constraints causes a deterioration in households’ social and economic well-being, thus leading in the short and medium term to social exclusion and poverty. The aim of this paper is to present and analyze the main measures of over-indebtedness used in the literature. In particular, the paper uses data from the Italian Survey of Household Income and Wealth to extend the existing knowledge about the possible ways of measuring economic difficulty and over-indebtedness. The traditional and the new measures of over-indebtedness are subsequently compared with the measures of poverty in order to disentangle the relationship between the two phenomena.
* Bank of Italy, Economic and Financial Statistics Department. Email: [email protected]. † Bank of Italy, Economic and Financial Statistics Department. Email: [email protected]

Introduction 1
The economic recession following the financial crisis which began in 2008 and the job losses to which it gave rise, together with a continuing squeeze on credit, has triggered concerns that a substantial and growing number of households are likely to have difficulty in managing the debts they accumulated in the years leading up to the crisis.
There is some evidence of this having occurred in the countries hardest hit by the recession, which are also to a large extent those that recorded the largest increase of household debt before the crisis.
In the case of Italy, for many years the significant increase in household debt did not give rise to concern for several reasons: the initial level of household indebtedness was particularly low by international standards; the increase recorded in recent years has only filled part of the gap; the growth in indebtedness has been seen as reflecting the reduction in both nominal and real interest rates as a consequence of the increase in competitiveness in financial markets, which has reduced the cost of debt and the cases of credit constraints. The difficult economic conditions associated with the crisis have also led in Italy to the recent approval of a law on consumer bankruptcy.2 3
The intention here is to examine the accumulation of consumer debt among Italian households, the form which it has taken and the extent to which it has been associated with problems of servicing interest charges and debt repayment. The aim is also to examine the types of households, in terms of income level and other characteristics, likely to become over-indebted, in the sense of having difficulty in servicing their outstanding loans.
Studying over-indebtedness is of interest for many reasons. It is of course a problem for people who live in a condition of economic distress which they are unable to quit. Accordingly, over-indebtedness has to be considered as a social issue and its measurement should focus on the number of people involved and the extent of their difficulty. But over-indebtedness can also be seen as an issue for financial intermediaries, and more in general for the stability of the financial system as a whole. Consequently, it is important to emphasize the quantity of the debt and the amount of collateral provided to guarantee the loans.
This research is mainly concerned with the methodological aspects of the problem, as we try to improve the existing knowledge about ways of measuring financial difficulty and over-indebtedness. This will be done following both the approaches described above. The empirical research is conducted on the Italian Household Income and Wealth Survey, which collects data on debts, income and assets, as well as for subjective indicators of well being. A comparative analysis of the phenomenon across several countries will be possible in the near future, when the data on the first wave of Household Finance and Consumption Surveys become available.
The paper is organized as follows. In the next section we outline the main measures of over-indebtedness present in the literature. In the third section the measures are critically examined and discussed with reference to the Italian case by using micro data from the Bank
1 We wish to thank Luigi Cannari and Grazia Marchese for their helpful comments. The views
expressed are those of the authors and do not necessarily reflect those of the Bank of Italy. 2 See Viimsalu (2010) for an analysis of European legislation in this field. 3 According to Law 3/2012 over-indebtedness is defined as a situation in which there is a
persistent imbalance between obligations and assets that can be easily liquidated, as well as an inability to fulfil the obligations regularly. The law says that over-indebted persons can apply for a repayment plan to a specific agency and to the court, and, if accepted, the plan is also binding for the creditors. The judge can also decide on a suspension of any executive action by the creditors against the debtors.

3
of Italy’s Household Income and Wealth Survey. Section 4 examines the performance of the indicators used to identify over-indebted households, as well as the robustness and optimality of the cut points usually adopted. In section 5 we examine how the measures of over-indebtedness characterize the various segments of Italy’s population, over the period 2006-10. Section 6 examines how these measures are connected with the traditional measure of poverty. Section 7 outlines the conclusions.
Definitions and indicators of over-indebtedness
According to the life-cycle theory, households apply to credit markets because they want to have steady living conditions over the years. Since income generally increases at the beginning of a person’s life and decreases in the period following retirement, debt is the means that allows households to smooth their expenses over their lives; young families expect their future income to grow and spend more than they earn, thus accumulating debts that they will repay when they are more mature.
In the above framework, there are many reasons why a household may accumulate more debt than it can repay.4
A first driver of over-indebtedness is financial imprudence (Disney, Bridges and Gathergood, 2008; Anderloni and Vandone, 2010), i.e. poor financial decisions caused by an inadequate understanding of the real cost of repaying the loan. This factor may be linked both to the issue of the transparency of lenders’ terms and conditions (Department of Trade and Industry, 2001) and to borrowers’ financial literacy and ability to manage their finances correctly (plan expenses and income) (Lusardi and Tufano, 2009).5 The imprudence may also derive from psychological biases and mental shortcuts that affect consumers’ decisions and predictions about borrowing, such as the over-confidence bias, i.e. the tendency to underestimate the probability of suffering an adverse event (Kilborn, 2005). Bucks and Pence (2008) show that borrowers with adjustable-rate mortgages are likely to underestimate or not know how much their interest rates could change.
Over-indebtedness may also arise, however, when unexpected events modify the initial conditions in which the contract between creditor and debtor was concluded (Keese, 2009).6 An unexpected reduction of household income (e.g. a job loss), an unforeseen expense (e.g. expensive medical care), an increase in the cost of debt (e.g. a rise in interest rates) are all events that can lead to over-indebtedness. Unexpected changes in family structure may also affect the ability to repay the debt (e.g. divorce or the birth or death of a family component).
In some cases the condition of over-indebtedness derives from poverty, which pushes individuals incapable of coping with their expenses to ask for a loan that has little chance of being repaid; this mainly happens when creditors are unable to select the right debtors. It is also important to note the particular situation when the need for a loan is determined by the condition of over-indebtedness itself, thus causing a vicious cycle that is potentially disruptive for families and dangerous for financial intermediaries.7
4 An analysis of the nature of over-indebtedness in the framework of economic theory, and of its
measures can be found in Betti et al. (2007). 5 A recent critique of financial education public programs can be found in Willis (2008). 6 Of course, the effects of adverse events can be limited by insurance. When the events are
reasonably foreseeable, the lack of insurance can be seen as a form of imprudence. 7 As noted by Valins (2004), factors such as gambling, alcoholism and drug addiction can also be
considered as causes of over-indebtedness, although they are barely considered in the mainstream debt literature.

4
But what do we really mean by over-indebtedness and how can we measure it? There is not a consensus in the literature on the definition of over-indebtedness (Kempson, 1992; Bridges e Disney, 2004; Kempson, McKay and Willitts, 2004) or, consequently, on how to measure it. The European Commission in a recent study (European Commission, 2008a) examined and compared definitions and measures of over-indebtedness in the EU countries, and underlined the different points of view emerging from the different socio-economic and legislative environments.
For example, in Germany, over-indebtedness has been defined as a situation where household income “in spite of a reduction of the living standard, is insufficient to discharge all payment obligations over a long period of time” (Haas, 2006). In France, where there is a special Committee on the topic, an individual is considered over-indebted when, with well-meaning intentions, he/she is unable to meet the obligations coming from debts obtained for non-professional reasons. In the UK the focus has been put on being in arrears in paying regular bills, over-indebtedness being defined as a situation “where households or individuals are in arrears on a structural basis, or at a significant risk of getting into arrears on a structural basis” (Oxera, 2004).
In the wide variety of official national definitions of over-indebtedness the European Commission study identifies some features common to all countries: the economic dimension (amount of debt to repay), the temporal dimension (the relevant horizon is the medium-long term), the social dimension (the basic expenses that have to be met ahead of the repayment of the debts) and the psychological dimension (the stress that over-indebtedness causes).
A more recent study carried out for the European Commission to develop a common definition across the EU has identified a set of criteria to be applied (European Commission, 2010):
• the unit of measurement should be the household because the incomes of individuals are usually pooled within the same household;
• indicators need to cover all aspects of households’ financial commitments: borrowing for housing purposes, consumer credit, to pay utility bills, to meet rent and mortgage payments and so on;
• over-indebtedness implies an inability to meet recurrent expenses and therefore should be seen as a structural rather than a temporary state;
• it is not possible to resolve the problem simply by borrowing more; • for a household to meet its commitments, it must reduce its expenses substantially or
find ways of increasing its income.
According to these criteria, a household is over-indebted when its existing and expected resources are insufficient to meet its financial commitments without lowering its standard of living, which might mean reducing it below what is regarded as the minimum acceptable in the country concerned, which in turn might have both social and policy implications.
This definition of over-indebtedness might be widely accepted in principle but in practice it is very difficult to identify households in such a situation. Consequently empirical studies have tended to use more practical definitions.
Recent studies of over-indebtedness have tended to converge on a common set of indicators, while noting that there is no universal agreement on which indicator best captures true over-indebtedness (BIS, 2010, Keese, 2009). The indicators broadly reflect four aspects of over-indebtedness: making high repayments relative to income, being in arrears, making heavy use of credit and finding debt a burden (see Table 1).

5
Table 1 – Common indicators of over-indebtedness
Category Indicator
Households spending more than 30% (or 50%) of their gross monthly income on total borrowing repayments (secured and unsecured)
Households spending more than 25% of their gross monthly income on unsecured repayments
Cost of servicing debt
Households whose spending on total borrowing repayments takes them below the poverty line
Arrears Households more than 2 months in arrears on a credit commitment or household bill
Number of loans Households with 4 or more credit commitments
Subjective perception of burden
Households declaring that their borrowing repayments are a “heavy burden”
The first two indicators capture the burden imposed by debt repayments and put arbitrary limits on repayments relative to gross income, beyond which they are thought to represent a significant burden for households. Oxera (2004) identifies 50 per cent as the limit for the ratio of the cost of debt to income beyond which repayments are a major burden for households (DeVaney and Lytton, 1995). When considering only unsecured loans, the limit drops to 25 per cent. This indicator is based on the fact that the risks connected with collateralized debts are basically covered by real assets, thus the analysis must be restricted to unsecured loans. The third indicator refers to the situation in which the income available, after paying the debt servicing costs, is not sufficient to meet the basic needs of life.
The arrears indicator captures all forms of debt and household bills for which a household is more than two months overdue. The cut-off is chosen in such a way that households simply forgetting to pay a bill or debt for one or two months are not considered to be over-indebted (Oxera, 2004).
A different approach to measuring over-indebtedness is to use the presence of multiple debts. The DTI Task Force on Tackling Overindebtedness (Kempson, 2002) identified a strong relationship between individuals reporting debt repayment difficulties and being in arrears and having four or more credit commitments. This measure has to be seen as an indicator of risk, as the use of multiple creditors might limit creditors’ ability to measure the risk of insolvency correctly and might be strategic for households wishing to obtain an amount of credit higher than what the banking system would normally allow. However, given the expansion of credit products in recent years, it has been suggested that the threshold of four credit commitments may no longer be meaningful.
Considering the difficulties associated with most indicators of over-indebtedness, arguably the most powerful method is to ask people directly whether or not they are facing debt repayment difficulties. This is the preferred approach in Betti et al.’s (2007) cross-comparison of over-indebtedness in European Union countries. Using the EU’s harmonized Household Budget Survey and the European Community Household Panel dataset, Betti et al. argue that although their measure is subjective, and thus prone to error due to different people’s interpretations of whether or not they are facing repayment difficulties, there does not appear to be a substantial group of people who hide their difficulties from official surveys.
All of the indicators presented above suffer from a variety of problems.
Repayment-to-income ratios offer an apparently simple way of measuring over-indebtedness, but there are serious problems with this approach. For example, there are questions as to whether an increase in borrowing, which implies an increase in the
6
repayment-to-income ratio, is driven by households who can afford it. In other words, debt can increase relative to income without this necessarily making debt management problems more acute if the increase occurs predominantly among households with high levels of income. Households with high levels of income can potentially bear a debt burden higher than 30 per cent of their income.
In addition, debt-to-income ratio measures typically ignore household assets. Households might accept a debt burden of more than 30 per cent if they can rely on financial assets worth more than their outstanding debts: it appears unrealistic to classify such households as over-indebted. Furthermore, while an increase in outstanding debt might be accompanied by growing difficulty in servicing the loans, it might be accompanied by an increase in the value of assets which are often the counterpart of the debt. In other words, households might be able to meet their debt servicing obligation by selling some of the assets, though this might be problematic if the only asset is the home in which they are living. Furthermore, the availability of assets may allow households with heavy debt burdens to access new credit. An expansion of credit should make it easier for households to manage their debt and cope with temporary reduction in income.
The over-indebtedness indicator that identifies the households that, after taking account of the spending on total borrowing repayments, are below the poverty line has the great advantage of referring to a commonly accepted threshold: the poverty line.
Although the use of data on arrears in making payments avoids such problems to some extent, it is still necessary to judge the seriousness of the arrears and the point where over-indebtedness begins, which itself will depend on the situation in different countries and the financial circumstances of the household. Furthermore, by looking only at the households currently unable to repay their debts, this measure may overlook those who still manage to meet their financial obligations, but who have borrowed so much that they have become vulnerable to external shocks, such as an increase in interest rates or a temporary loss in income. Arguably, such households can also be considered over-indebted.
The criterion based on the number of credit commitments might not reliably detect situations of over-indebtedness since a large number of outstanding small debts does not necessarily imply a condition of difficulty. Similarly, being behind in the payment of small amounts might not correspond to a condition of over-indebtedness.
Moreover, all these measures, for the most part, are measures of the process of becoming over-indebted, rather than measures of the outcome associated with having problems with debts. As these indicators address different aspects of over-indebtedness, they each provide potentially valuable information. However, none of them is ideal in the sense that it prevails over all the others. For example, Disney et al. (2008) argue that the various indicators are likely to capture debt problems in different household types and at different points of the life cycle. The challenge here is to find an appropriate set of indicators that can determine the likely proportion of the population facing debt repayment difficulties. Moreover such a set of indicators will need to operate within the limits of the available data.
Considering the difficulties associated with most indicators of over-indebtedness, arguably the most powerful method is to ask people directly whether or not they are facing debt repayment difficulties. The drawback with subjective indicators is that they inevitably depend on individuals’ interpretation of terms such as “heavy burden”, which is likely to vary both between households within countries and, even more, between households of different countries.
The application of the indicators to the Italian ca se
This section provides an assessment of the most common indicators of over-indebtedness for the case of Italy, using micro-data obtained from the 2010 Italian Survey on

7
Household Income and Wealth (SHIW, hereafter). The SHIW has been conducted almost every two years by the Bank of Italy since 1965 to collect information on the economic behavior of Italian households using a sample of about 8,000 households. The survey collects detailed data on income and wealth, but also information on demographics, consumption, savings, and several other topics.
The wealth of data coming from the biennial Italian survey allows the construction of all of the common indicators of over-indebtedness at household-level with a good degree of accuracy. For example, with regard to the debt-burden indicators, the SHIW collects data on income and debt servicing costs for all types of loan with the exclusion of those associated with business.8
Considering the debt-to-income ratio indicator with a 30 per cent cut point (A30, where A=R/Y, hereafter), the SHIW survey collects detailed information on household assets, thus allowing us to exceed the limits of the traditional indicator. First of all, we can consider that households who hold financial assets can sell them to pay their debts if there is an unexpected event, such as a job loss, that jeopardizes their ability to make payments. It is also possible to define a different version of the traditional debt-burden indicator, by reducing the total borrowing repayments by an amount proportional to the ratio between the outstanding debt and the value of the financial assets, under the hypothesis that households use their financial assets to repay some or all of their debts, thus reducing their debt servicing costs proportionally.
In formal terms, if AF is the stock of financial assets and D is the outstanding debt, the debt servicing costs are reduced by an amount equal to AF/D. If the value of the financial assets exceeds the debt, the outstanding debt becomes null. Note also that when households sell their financial assets, they stop receiving the related income flows, thus their disposable income, Y, decreases by an amount equal to the income from financial assets, YCF, and the debt-burden indicator becomes:
( )( )YCFY
R
D
AFDA
−⋅−= ,0max
1 .
The use of financial assets to repay some or all of the outstanding debt implies in general that A1<A, except where the return on the financial assets is particularly high and the financial liabilities are long-term debts.
Households might also own real assets such as their homes and other properties. Since a household’s home is generally very illiquid, it is important to distinguish two different upgrades of the debt-burden indicator. In the first case we assume that households can use both financial assets and real assets in the form of properties other than their homes.
If AR2 is the stock of real assets in the form of properties other than the household’s home, in the hypothesis that the household sells all these assets together with the financial assets to repay its debts, the debt servicing costs are reduced by an amount equal to (AF+AR2)/D. As for the preceding case, the use of the properties to repay some or all of the outstanding debt implies that the household stops receiving some or all of the income flows coming from those assets, thus their disposable income decreases by YCA, representing the income from real estate associated with the assets sold, and the debt-burden indicator becomes:
8 The burden indicators could suffer from measurement errors affecting income, assets and
liabilities in sample surveys. In SHIW data, under-reporting of debt values is considered to be significantly higher than that of income. D’Aurizio et al. (2006), analyzing the Italian survey data for 2004, arrive at an estimate of the level of under-reporting of debts of about 28 per cent, while D’Alessio and Faiella (2002) show that the under-reporting of income varies from 5 to 14 per cent in the 2000 survey.

8
( )( )YCAYCFY
R
D
ARAFDA
−−⋅−−= 2,0max
2
Another version of the indicator also considers the household’s home. We assume that households cannot obtain the entire value of the property, but only a part representing the residual life estate value, under the hypothesis that households continue to live in their homes. The value of the residual life estate can be obtained by multiplying the market value of the property by a coefficient depending on the age of the holder of the life estate.9 If AR1 is the market value of the household’s home and f is the conversion coefficient to the value of the residual life estate, the debt servicing costs are reduced by (AF-AR2-AR1⋅f)/D and the debt-burden indicator becomes:
( )( )YCAYCFY
R
D
fARARAFDA
−−⋅⋅−−−= 12,0max
3
Finally it is possible to identify three new indicators of over-indebtedness, A130, A230 and A330, by using the three variables A1, A2 and A3, defined above, and the 30 per cent cut point, as used for the traditional indicator A.
With SHIW data it is also possible to construct the B indicator, which identifies households as over-indebted whose income is below the poverty line and who are indebted at the same time, or whose spending on total borrowing repayments takes them below the poverty line. For this purpose we use the modified OECD scale of equivalence (which assigns a coefficient of 1 to the head of household, 0.5 to other household members aged 14 or more, and 0.3 to those younger than 14) and the poverty line equal to 60 per cent of the median income (European Commission, 2008b).
SHIW data also allow us to define the C25 indicator (related to households that spend more than 25 per cent of their gross monthly income on unsecured repayments).
With regard to arrears, the D indicator provides data on structural arrears connected only with repayments of mortgage and consumer loans. Arrears on domestic bills are excluded, so that the percentage of over-indebted households is probably underestimated. Note, moreover, that it is plausible to assume that the direct question on arrears is penalized by patterns of shame and embarrassment that are likely to prevent individuals from answering truthfully.
With the SHIW data it is also possible to measure the number of loans with a good approximation, considering households to be over-indebted that have 4 or more debts (the E4
indicator). The survey collects information on the number of loans connected with properties. For other household needs (purchases of durable and non-durable goods and for business purposes) the 2010 survey collects data on the number of loans.
With regard to the subjective perception of debt problems, in the SHIW there is no information that allows the construction of this specific indicator. However, in the SHIW questionnaire households are asked whether their income is sufficient to see them through to the end of the month. The information coming from this question relates to any form of spending and not only to debt repayments, consequently the condition of difficulty might be caused determined by an excessive level of indebtedness besides other factors. Thus this indicator cannot be employed as a proxy of the subjective measure of debt problems, but it can be used as a benchmark for assessing the over-indebtedness indicators.
In the last column of Table 2 the estimates of the indicators are reported for the year 2010. According to SHIW 3.1 per cent of Italian households spend more than 30 per cent of their income to repay their debts. If we consider the assets held by households, the
9 The Italian Revenue Agency provides coefficients for the computation of residual life estate as a
function of the current market value and the owner’s age.

9
percentage drops to 2.4, 2.2 and 1.1 per cent respectively for the indicators A1, which considers financial assets, A2, which considers financial assets and properties other than the household’s home, and A3, which considers all assets with the exception of the value of the residual life estate of the household’s home. About 6 per cent of households are considered to be poor and indebted or to have debt servicing costs that take them below the poverty line.
The percentage of over-indebted households is only 0.9 per cent when the 25 per cent cut point is considered for non-collateralized debts, given the low diffusion of consumer credit among Italian households and the relatively low average amount of credit per household. The percentage of households in arrears is only 1.1 per cent, partly because arrears on domestic bills are excluded from the computation. The percentage of households with 4 or more credit commitments is also very low at 0.5 per cent.
All the debt-burden indicators are very connected with each other; households who are identified as over-indebted according to the A330 indicator are, with just a few exceptions, a subset of the households who are considered over-indebted by the A230 indicator, and so on backwards to the A30 indicator.
Table 2 – Over-indebted households according to var ious indicators, 2010 (percentages)
A30 A130 A230 A330 B C25 D E4 Total
A30. Households spending more than 30% of their gross monthly income on total borrowing repayments
- 2.39 2.17 0.97 1.92 0.65 0.35 0.17 3.10
A130. Households spending more than 30% of their gross monthly income on total borrowing repayments (after deducting their financial assets)
- 2.17 0.94 1.57 0.41 0.32 0.16 2.39
A230. Households spending more than 30% of their gross monthly income on total borrowing repayments (after deducting their financial assets and properties other than their main home)
- 0.94 1.43 0.41 0.30 0.12 2.17
A330. Households spending more than 30% of their gross monthly income on total borrowing repayments (after deducting financial and real assets except for the residual life estate of the household’s home)
- 0.80 0.34 0.28 0.08 1.13
B. Households who are poor and indebted or whose spending on total borrowing repayments takes them below the poverty line
- 0.54 0.71 0.12 6.20
C25. Households spending more than 25% of their gross monthly income on unsecured repayments
- 0.15 0.00 0.89
D. Households in arrears on a credit commitment for more than 3 months
- 0.09 1.15
E4. Households with 4 or more credit commitments
- 0.37
F. Households reporting they make ends meet “with difficulty” or “with great difficulty”
1.60 1.29 1.10 0.75 4.11 0.68 0.93 0.19 29.83
Households reporting they make ends meet “with difficulty” or “with great difficulty” among the over-indebted households according to the indicator in column
51.6 54.0 50.7 66.4 66.3 76.4 80.9 51.4 -
If we exclude the different versions of the debt-burden indicator, it will be seen that the degree of overlap between over-indebtedness indicators is very limited. The percentage

10
of households who are over-indebted according to two indicators simultaneously is not higher than 1.9 per cent (households who spend more than 30 per cent of their income on borrowing repayments and whose spending on borrowing repayments takes them below the poverty line, i.e. A30 and B). In general, 8.2 per cent of Italian households are over-indebted according to at least one of the five indicators (A30, B, C25, D, E4), 2 per cent according to at least two indicators at the same time and 0.6 per cent according to three indicators, while only 0.2 per cent of households are over-indebted according to four or five indicators contemporaneously.
This result, quite common in the literature,10 can be justified by the limited ability of the indicators to detect the real situations of over-indebtedness; it is more likely explained, however, by the multidimensional structure of over-indebtedness. Thus it can be useful to analyze how the different over-indebtedness indicators are connected with the more general subjective indicator of economic distress.
In aggregate, 29.8 per cent of households report that they make ends meet with “difficulty” or with “great difficulty”. Note, however, that the general condition of economic difficulty might be determined by an excessive level of indebtedness besides other factors. There might be households who report they are in economic distress even if they are not over-indebted. It seems acceptable to assume, however, that households who are over-indebted will have declared themselves to be in economic distress. This condition is not fully satisfied by any of the over-indebtedness indicators.
If we consider the overall debt indicator (A30), it is found that over 50 per cent of households declare they are also economically distressed. In other words, about half of those who are detected as over-indebted according to this indicator report general economic difficulty. The degree of overlap between the over-indebtedness indicator and the subjective measure of economic distress is generally quite low. For instance, one fifth of the households who are in arrears on a credit commitment for at least 3 months (indicator D, equal to 1.15 per cent), report economic difficulty. Half of the households who declare that they have at least 4 debt commitments (indicator E4, about 0.4 per cent) are also economically distressed. Among the households with a debt burden on non-collateralized loans of more than 25 per cent of their income (indicator C25), about three quarters are also in economic difficulty according to their self-report. Finally, in two cases out of three households that are debt poor declare they are economically distressed.
It is also important to note that over-indebtedness is only a small subset of the households who declare that they are in economic difficulty. No more than 4.7 per cent of the economically distressed households have an overall debt burden higher than 30 per cent of their income. In other words over-indebtedness does not appear to be a widespread factor explaining the perceived condition of economic distress. This result may be due to the relatively limited diffusion of debts among Italian households and the strong correlation between levels of debt and income among households. At the same time another important possible explanation, which deserves to be analyzed in depth, may be the poor ability of the indicators to detect conditions of over-indebtedness. This highlights the need to analyze how the indicators are constructed and the cut points selected.
The performance of the over-indebtedness indicators
The predictive performance of the indicators of over-indebtedness can be theoretically evaluated by comparison with what is called a “gold standard”, i.e. a measure that indicates whether a household is over-indebted or not with certainty. If a “gold standard” is available, the performance of each indicator is usually summarized by its sensitivity and
10 BIS, 2010.

11
specificity. In our case we do not have a gold standard at our disposal; however, we believe that we can use the subjective measure of economic distress which, despite its limitations, can be considered an “imperfect gold standard”.
The objective of the following analysis is to evaluate the performance of the indicators by changing the cut points. In general, as the threshold is moved up, the percentage of over-indebted households who declare they are economically distressed rises. This effect also causes a reduction in the percentage of households who are found to be over-indebted. This inevitable trade-off suggests looking for the cut point that maximizes some measure of statistical association between the over-indebtedness indicator and the imperfect gold standard.
Table 3 displays the value of a few measures of statistical association between the over-indebtedness indicator and the dichotomous indicator of household economic distress according to different threshold values for each indicator.11
The A indicator has the highest value of statistical association �� with the subjective indicator of economic distress when the cut point is 30 per cent (A30), thus empirically confirming the importance of this threshold as indicated in the literature. For indicators A1, A2 and A3, which consider the assets held by households, the association measure reaches its peak when the cut point is 20 per cent for A1 and A2, and 10 per cent for A3 (A120, A220, A310). For the indicator C related to non-collateralized loans, the association measure reaches its peak when the cut point is 15 per cent (C15), which is lower than the value generally recommended in the literature. For the indicator relating to the number of debt commitments, the statistical association is highest when the threshold is 3 or more loans (E3).
Figure 1 – Performance of over-indebtedness indicat ors according to different cut points, 2010
0.00
0.05
0.10
0.15
0.20
0.25
10 15 20 25 30 35 40 45 50 10 15 20 25 30 35 40 45 50 10 15 20 25 30 35 40 45 50 10 15 20 25 30 35 40 45 50
Pov
erty 10 15 20 25 30 35 40 45
Arr
ears
2 or
mor
e3
or m
ore
4 or
mor
e5
or m
ore
Cut points
Phi
-squ
are
AA1 A2 A3
C
B
D
E
11 See Appendix A for the definition of the indexes used.

12
Table 3 – Performance of over-indebtedness indicato rs according to different cut points, 2010
Indicator
Share of over-
indebted households
Phi2
Specificity Predictivity Odds ratio Relative risk Accuracy
A A10.............................. 14.1 0.021 0.863 0.322 1.139 1.094 0.651 A15.............................. 9.8 0.048 0.911 0.364 1.397 1.252 0.675 A20.............................. 6.7 0.068 0.944 0.414 1.730 1.428 0.690 A25.............................. 4.4 0.080 0.966 0.468 2.148 1.611 0.699 A30.............................. 3.1 0.085 0.979 0.516 2.597 1.772 0.703 A35.............................. 2.3 0.074 0.984 0.518 2.590 1.767 0.703 A40.............................. 1.7 0.053 0.987 0.483 2.230 1.636 0.701 A45.............................. 1.4 0.049 0.989 0.484 2.239 1.639 0.701 A50.............................. 1.2 0.052 0.992 0.515 2.535 1.744 0.702 A1 A110........................... 9.6 0.061 0.916 0.384 1.535 1.329 0.680 A115........................... 6.9 0.081 0.944 0.434 1.891 1.505 0.693 A120........................... 4.7 0.101 0.967 0.506 2.532 1.757 0.702 A125........................... 3.3 0.093 0.978 0.527 2.728 1.816 0.704 A130........................... 2.4 0.083 0.984 0.540 2.840 1.847 0.704 A135........................... 1.6 0.068 0.989 0.540 2.822 1.837 0.703 A140........................... 1.2 0.048 0.991 0.494 2.328 1.671 0.702 A145........................... 1.0 0.052 0.994 0.536 2.747 1.811 0.702 A150........................... 0.8 0.031 0.994 0.460 2.013 1.547 0.701 A2 A210........................... 9.0 0.056 0.920 0.379 1.494 1.306 0.680 A215........................... 6.5 0.075 0.947 0.428 1.842 1.481 0.692 A220........................... 4.3 0.095 0.969 0.503 2.488 1.740 0.702 A225........................... 3.1 0.077 0.978 0.498 2.402 1.704 0.702 A230........................... 2.2 0.067 0.985 0.505 2.450 1.718 0.702 A235........................... 1.5 0.056 0.990 0.508 2.467 1.722 0.702 A240........................... 1.1 0.035 0.992 0.451 1.946 1.520 0.701 A245........................... 0.9 0.042 0.994 0.504 2.407 1.699 0.702 A250........................... 0.7 0.026 0.995 0.440 1.860 1.481 0.701 A3 A305........................... 6.0 0.065 0.950 0.415 1.731 1.427 0.691 A310........................... 4.1 0.096 0.971 0.511 2.568 1.767 0.703 A315........................... 2.6 0.089 0.983 0.546 2.919 1.872 0.704 A320........................... 1.7 0.083 0.990 0.586 3.407 1.997 0.705 A325........................... 1.1 0.084 0.995 0.668 4.831 2.271 0.705 A330...........................
...................................... 0.8 0.080 0.996 0.694 5.413 2.352 0.705
A335........................... 0.6 0.052 0.997 0.604 3.615 2.036 0.703 A340........................... 0.4 0.055 0.998 0.706 5.697 2.380 0.703 A345........................... 0.4 0.052 0.998 0.694 5.382 2.339 0.703 A350........................... 0.3 0.034 0.999 0.607 3.645 2.040 0.702 B ..................... 6.2 0.205 0.970 0.663 5.199 2.417 0.722 C C10.............................. 4.4 0.112 0.971 0.539 2.903 1.877 0.705 C15.............................. 2.4 0.127 0.989 0.672 5.028 2.323 0.710 C20.............................. 1.5 0.110 0.994 0.708 5.869 2.423 0.708 C25.............................. 0.9 0.097 0.997 0.765 7.796 2.600 0.706 C30.............................. 0.7 0.081 0.998 0.753 7.285 2.551 0.705 C35.............................. 0.4 0.063 0.998 0.724 6.232 2.444 0.704 C40.............................. 0.4 0.048 0.998 0.662 4.629 2.228 0.703 C45.............................. 0.3 0.059 0.999 0.795 9.165 2.677 0.703 D..................... 1.1 0.120 0.997 0.807 10.136 2.761 0.709 E E2 ................................ 6.7 0.029 0.938 0.348 1.277 1.181 0.681 E3 ................................ 1.4 0.037 0.988 0.439 1.859 1.482 0.700 E4 ................................ 0.4 0.029 0.997 0.520 2.561 1.749 0.702 E5 ................................ 0.1 0.016 0.999 0.544 2.811 1.826 0.702
With respect to any other indicator and considering any cut point, the debt-poverty indicator B displays the highest level of statistical association �� followed by the C15 indicator, based on non-collateralized loans with cut point at 15 per cent of disposable household income. The latter result might be explained by the fact that collateralized debts represent a

13
less severe source of economic distress since the loan is covered by guarantees. Quite a high level of statistical association is also found for the D indicator, based on arrears. The A120, A220 and A310 indicators have values of statistical association that are very similar and slightly higher than the value for the traditional A30 indicator, thus confirming the need to redefine this indicator in order to take financial and real assets into account. The number of loan commitments (E) does not seem to contribute to the construction of a performing indicator of over-indebtedness: the highest level of statistical association is reached when the cut point is “3 or more” (E3), and it is lower than for any other indicator.
The evaluation of the cut points according to different statistical association measures, as shown in Table 3, does not modify the general picture outlined above. The over-indebtedness indicators based on arrears and the non-collateralized debt burden are the best performing indicators in terms of ability to detect conditions of over-indebtedness.12
In what follows, we will only consider the indicators with cut points that maximize the statistical association between the subjective condition of economic distress and the over-indebtedness indicator, i.e. A30, A120, A220, A310, C15, E3, and B and D. The degree of internal consistency of the new indicators, according to Cronbach's alpha is equal to 0.85, which is higher than the level estimated on the set of indicators defined as shown in Table 2 (A30, A130, A230, A330, B, C25, D, E4), for which it is equal to 0.8.13 By using the new cut points, the proportion of households with only one indicator decreases while the proportion of households with more than one indicator increases.
Who is over-indebted?
Table 4 shows the percentage of over-indebted households, according to different indicators and according to the cut points that maximize the explicative power of the condition of economic distress.
According to the debt-burden indicators (A) and the debt-poverty indicator (B), between 2 and 4 per cent of Italian households are over-indebted; they are generally with a head of household aged between 31 and 40 years, with a lower or upper secondary education; they are also self-employed, have a middle or low household income and live in a large city.
The non-collateralized loans indicator (C) and the arrears indicator (D) display figures that are very similar, but slightly different from those of the other indicators. According to these two indicators, over-indebted households have a young, employee head of household, are lower income households and resident in the South and Islands. The difference is more pronounced when the comparison is with the debt-poverty indicator.
As already emphasized previously, the proportion of over-indebted households drops drastically when we also consider perceived economic distress. Considering the debt-burden
12 In the 2006 and 2008 surveys the statistical association between the over-indebtedness
indicators and the perceived condition of economic distress is always lower than in the 2010 survey. This could reveal a lower accuracy of the information collected in the earlier surveys, which implies attenuation bias in the measures of association. It is also possible that over-indebtedness was a less important issue before 2010. The highest levels of statistical association with the perceived condition of economic difficulty still involve the B and D indicators; lower values of association are found for the C indicators. The cut point values are not always confirmed for the 2006 and 2008 surveys. These results suggest that the choice of cut point depends both on the objective of the analysis and on the context.
13 The Cronbach coefficient is a function of the simple correlation coefficients among the set of variables considered. Under the hypothesis that the variables measure a unique latent trait, Cronbach’s alpha is a lower bound for the reliability score of the variable summing up all the variables considered (Cronbach, 1951).

14
indicator, the percentage halves to 2 per cent for A, A1, A2 and A3, and to 0.6 per cent for E, the number of commitments indicator; it decreases by a third for the B indicator (to 4.1 per cent) and the C indicator (to 1.6 per cent), and by a fifth for the D indicator (to 0.93 per cent). The characteristics of the households are more or less the same as those identified by the only over-indebtedness indicators (Table 5).
It is important to note that in the case of the B and C indicators the amount of debt is lower than 20,000 euros in 70 per cent of the cases. For the other indicators this percentage is much higher (Table 6).
In any case all the figures seem to be much lower than those found in Betti et al. (2007), who used subjective indicators and found that about 10 per cent of households are over-indebted. In Betti et al.’s analysis Italy has the lowest level of over-indebtedness among the European countries (the EU average is 16 per cent).
Table 4 – Over-indebted households according to dif ferent indicators, 2010
A30 A120 A220 A310 B C15 D E3
Perceived condition
of economic distress
Age Up to 30 years ................................... 3.0 3.6 3.4 8.3 6.1 3.2 1.9 1.6 37.3 31 to 40 years..................................... 6.5 9.6 8.8 11.5 10.3 4.1 1.3 2.3 33.2 41 to 50 years..................................... 4.7 7.1 6.9 5.6 9.4 3.4 2.1 2.1 31.2 51 to 65 years..................................... 2.9 4.6 3.9 1.9 6.0 1.9 1.0 2.0 24.6 Over 65 years..................................... 0.3 0.7 0.6 0.4 1.8 1.0 0.3 0.0 30.0
Educational qualification
None ................................................. 0.1 0.8 0.8 0.2 5.3 1.3 0.1 0.2 61.4 Primary school certificate ................. 1.0 1.9 1.7 1.2 4.1 1.5 0.9 0.4 38.2 Lower secondary school certificate ... 4.5 6.1 5.5 5.5 9.9 3.6 1.9 1.2 36.0 Upper secondary school diploma ...... 3.4 5.6 5.3 5.4 4.8 2.5 0.9 2.7 19.7 University degree .............................. 2.6 4.1 4.1 3.3 1.9 0.4 0.3 1.7 9.5
Work status
Employee........................................... 3.7 6.0 5.7 6.1 7.6 3.5 1.7 1.7 29.2 Self-employed.................................... 8.0 10.5 9.1 7.5 9.4 3.1 1.3 3.9 20.1 Not employed .................................... 0.9 1.4 1.2 0.9 3.6 0.9 0.5 0.3 33.7
Quintiles of household income
1st quintile ........................................ 5.3 6.3 5.8 6.7 20.8 6.4 2.8 0.5 74.8 2nd quintile ....................................... 2.5 3.8 3.3 2.7 7.2 2.3 1.3 1.0 39.2 3rd quintile......................................... 3.3 5.1 4.9 4.9 2.1 2.0 0.8 1.7 21.3 4th quintile......................................... 1.6 4.9 4.7 4.1 0.5 0.6 0.8 1.4 10.3 5th quintile......................................... 2.8 3.3 3.1 2.2 0.5 0.6 0.1 2.6 3.6
Town size
Up to 20,000 inhabitants.................... 3.6 4.6 4.0 4.2 6.5 2.4 1.2 1.1 27.8 From 20,000 to 40,000 inhabitants..... 1.9 4.8 4.8 4.2 7.0 2.6 1.0 1.9 30.8 From 40,000 to 500,000 inhabitants... 2.7 4.4 4.2 3.8 6.1 2.0 0.9 1.4 32.2 More than 500,000 inhabitants .......... 3.4 5.8 5.2 4.7 4.3 2.8 1.6 2.3 31.2
Geographical area
North ................................................. 3.1 4.4 4.2 4.5 4.3 1.7 0.9 1.3 22.2 Centre ............................................... 3.7 5.7 5.2 4.0 4.4 2.4 1.3 2.4 24.3 South and Islands .............................. 2.7 4.6 4.0 3.7 10.3 3.4 1.5 1.1 44.9 Total.................................................. 3.1 4.7 4.3 4.1 6.2 2.4 1.2 1.4 29.8

15
Table 5 – Over-indebted households according to dif ferent indicators and the subjective condition of economic distress, 2006-201 0
First principal component (*)
A30 A120 A220 A310 B C15 D E3 2006 2008 2010
and perceived condition of economic distress
Age Up to 30 years ........................................ 1.7 1.0 1.0 1.4 4.9 2.0 0.1 0.2 0.05 0.21 -0.08 31 to 40 years.......................................... 2.8 4.4 3.6 4.8 6.5 2.8 1.1 1.1 -0.01 0.25 0.30 41 to 50 years.......................................... 2.6 3.6 3.6 3.6 6.5 2.6 1.7 0.9 -0.02 0.06 0.23 51 to 65 years.......................................... 1.6 2.5 2.3 1.3 3.5 1.0 1.0 0.9 -0.25 -0.16 -0.05 Over 65 years.......................................... 0.2 0.6 0.5 0.4 1.4 0.6 0.3 0.0 -0.33 -0.33 -0.27
Educational qualification
None ...................................................... 0.1 0.8 0.8 0.2 5.3 1.2 0.1 0.2 -0.28 -0.24 -0.19 Primary school certificate ...................... 0.7 1.5 1.3 1.0 2.8 1.3 0.9 0.2 -0.22 -0.19 -0.15 Lower secondary school certificate ........ 3.1 3.9 3.6 3.6 6.8 2.5 1.4 0.7 -0.06 0.14 0.25 Upper secondary school diploma ........... 1.1 1.9 1.7 1.7 2.5 1.3 0.7 1.1 -0.18 -0.14 -0.09 University degree ................................... 0.2 0.8 0.8 0.8 1.2 0.2 0.3 0.5 -0.29 -0.29 -0.26
Work status
Employee................................................ 1.9 2.7 2.7 2.8 5.0 2.3 1.4 0.8 -0.04 0.10 0.09 Self-employed......................................... 3.3 4.9 4.0 3.8 4.8 1.8 0.9 1.6 -0.22 -0.09 0.26 Not employed ......................................... 0.7 1.2 1.1 0.8 2.9 0.8 0.5 0.2 -0.26 -0.24 -0.18
Quintiles of household income
1st quintile ............................................. 4.3 5.4 5.1 5.9 16.0 5.4 2.5 0.5 0.14 0.44 0.68 2nd quintile ............................................ 1.5 2.1 1.7 1.5 3.5 1.1 1.0 0.6 -0.15 -0.06 -0.07 3rd quintile.............................................. 1.2 2.2 2.2 1.6 0.9 1.2 0.6 0.9 -0.16 -0.12 -0.10 4th quintile.............................................. 0.6 1.7 1.7 1.4 0.1 0.3 0.5 0.6 -0.31 -0.28 -0.19 5th quintile.............................................. 0.3 0.6 0.4 0.3 0.0 0.0 0.0 0.6 -0.33 -0.35 -0.32
Town size . .
Up to 20,000 inhabitants......................... 2.0 2.5 2.2 2.3 3.9 1.6 0.9 0.6 -0.12 -0.06 0.02 From 20,000 to 40,000 inhabitants.......... 0.7 1.8 1.8 1.6 4.2 1.9 0.8 0.5 -0.15 -0.10 -0.06 From 40,000 to 500,000 inhabitants........ 1.5 2.4 2.4 1.8 4.6 1.2 0.9 0.7 -0.21 -0.07 0.00 More than 500,000 inhabitants ............... 1.5 2.4 2.1 2.6 3.6 2.1 1.1 0.8 -0.23 -0.09 0.02
Geographical area
North ...................................................... 1.3 1.8 1.6 1.9 2.7 1.0 0.8 0.6 -0.19 -0.12 -0.09 Centre .................................................... 1.4 2.4 2.2 2.0 3.0 1.4 0.8 0.7 -0.26 -0.20 -0.03 South and Islands ................................... 2.2 3.3 3.1 2.5 7.0 2.6 1.2 0.7 -0.05 0.09 0.16 Total....................................................... 1.6 2.4 2.2 2.1 4.1 1.6 0.9 0.6 -0.16 -0.07 0.00
(*) Principal component analysis conducted on the comparable variables along the period 2006-2010 (A30, A120, A220, A310, B and C15). Households from 2006 and 2088 surveys are treated as supplementary units, and thus do not contribute to determine the principal components.

16
Table 6 – Amount of debt held by over-indebted hous eholds according to different indicators and the subjective indicator o f economic distress, 2010
Amount of debt A30 A120 A220 A310 B C15 D E3
Up to 10,000 euros..................... 17.1 9.6 9.2 14.0 51.7 51.7 31.5 5.7
From 10,000 to 20,000 euros ..... 7.7 8.7 9.3 10.6 12.1 19.8 26.1 13.0
From 20,000 to 50,000 euros ..... 19.4 20.1 20.3 11.6 13.8 18.9 15.6 15.7
From 50,000 to 100,000 euros ... 14.4 19.6 19.3 22.0 9.0 4.4 9.7 27.7
More than 100,000 euros ........... 41.5 42.0 42.0 41.7 13.4 5.2 17.0 37.9
Total.......................................... 100.0 100.0 100.0 100.0 100.0 100.0 100.0 100.0
A30 A120 A220 A310 B C15 D E3
Amount of debt and perceived condition of economic distress
Up to 10,000 euros..................... 24.1 15.4 15.3 23.3 56.9 50.0 31.5 11.6
From 10,000 to 20,000 euros ..... 12.4 14.8 16.2 18.8 13.5 25.9 26.5 20.3
From 20,000 to 50,000 euros ..... 21.2 26.3 27.4 16.7 12.1 14.8 11.3 19.4
From 50,000 to 100,000 euros ... 9.5 14.3 13.5 14.9 5.8 2.7 11.4 16.8
More than 100,000 euros ........... 32.8 29.2 27.6 26.2 11.8 6.6 19.4 31.8
Total.......................................... 100.0 100.0 100.0 100.0 100.0 100.0 100.0 100.0
The comparison of the over-indebtedness indicators across the years shows that the percentage of over-indebted households increased between 2006 and 2010; 14 the largest increase concerned the debt-poverty and non-collateralized loan indicators (Figure 2). This dynamic is consistent with the findings of Magri and Pico (2012), who underline that the economic crisis has caused a decrease in the percentage of households holding a mortgage and an increase in the use of consumer credit.
Figure 2 – Indicators of over-indebtedness, 2006-20 10 (*)
0.0
0.5
1.0
1.5
2.0
2.5
3.0
3.5
4.0
4.5
A-30 A1-20 A2-20 A3-10 B C D E
2006
2008
2010
(*) The 2010 estimates are different from those in Table 5 because, in order to allow comparison with 2006 and 2008, they exclude debt servicing costs for professional reasons.
14 The computations take account of the changes in the questionnaires from 2006 to 2010.

17
If we consider the first principal component of the over-indebtedness indicators continually available in 2006-2010 (A30, A120, A220, A310, B and C15),
15 over-indebtedness grew significantly between 2006 and 2008, followed by a less rapid increase between 2008 and 2010. However, it is important to note that, whereas in 2006-2008 the rise of the first principal component refers to households in the first quintile of income, with an employee or self-employed head of household aged up to 40, in 2008-2010 the rise refers to households with a middle-aged self-employed head (Table 5).
Over-indebtedness and poverty
Notwithstanding debts represent liabilities, they are not generally a sign of bad economic conditions. In fact, indebted households have higher levels of income and wealth than non-indebted households (respectively by 27 and 12 per cent; Table 7). 16 A possible explanation of this result is that indebted households have regular incomes and use loans especially to buy their main home; thus debts are usually counterbalanced by assets and income from real estate. By contrast, less well-off households apply for loans less frequently, not least because debtors are selected by financial intermediaries.17
It makes one wonder whether the relationship between indebtedness and income and wealth is reversed in the case of over-indebtedness and what is the relationship between over-indebtedness and poverty.
The analysis of the different indicators does not provide a clear answer to this question. Over-indebted households according to the debt-poverty indicator, B, have a level of income and wealth that is approximately 45 per cent lower than that of other households. The same gap for income and a wider gap for wealth are recorded when using the C15 non-collateralized loans indicator with a cut point at 15 per cent. According to these two indicators, there is a positive connection between over-indebtedness and economic poverty.
Over-indebted households according to indicators D and A310 also have a significantly lower level of income and wealth than other households; the D indicator has a positive association with the condition of economic poverty; the association for the A310 indicator is still positive but more limited.
For the A120 and A220 indicators the figures are very similar to those for A310 but with a lower intensity. It is important to note that households that are over-indebted according to the A30 indicator (overall debt burden and cut point at 30 per cent of disposable income) have income that is 17.8 per cent lower than that of other households but wealth that is 26.2 per cent higher. The statistical association with economic poverty is positive but weak.
By contrast, households that are over-indebted according to the E3 indicator have much higher levels of income and wealth than other households, and a negative association with economic poverty.
In sum, the indicators with the highest levels of statistical association with the subjective condition of economic distress (B, C15 and D) are those with higher levels of association with the objective condition of economic distress, in terms of income, wealth and economic poverty. These indicators detect situations of both over-indebtedness and general economic distress.
15 The first principal component explains 63.8 per cent of the total variability 16 There is a similar difference for the average value of the subjective indicator of happiness,
which is 6.4 for indebted households and 6 for non-indebted households, in a range between 1 and 10 points.
17 In accordance with these results, Brandolini et al. (2010) find that the share of poor households decreases when wealth other than income is taken into account.
18
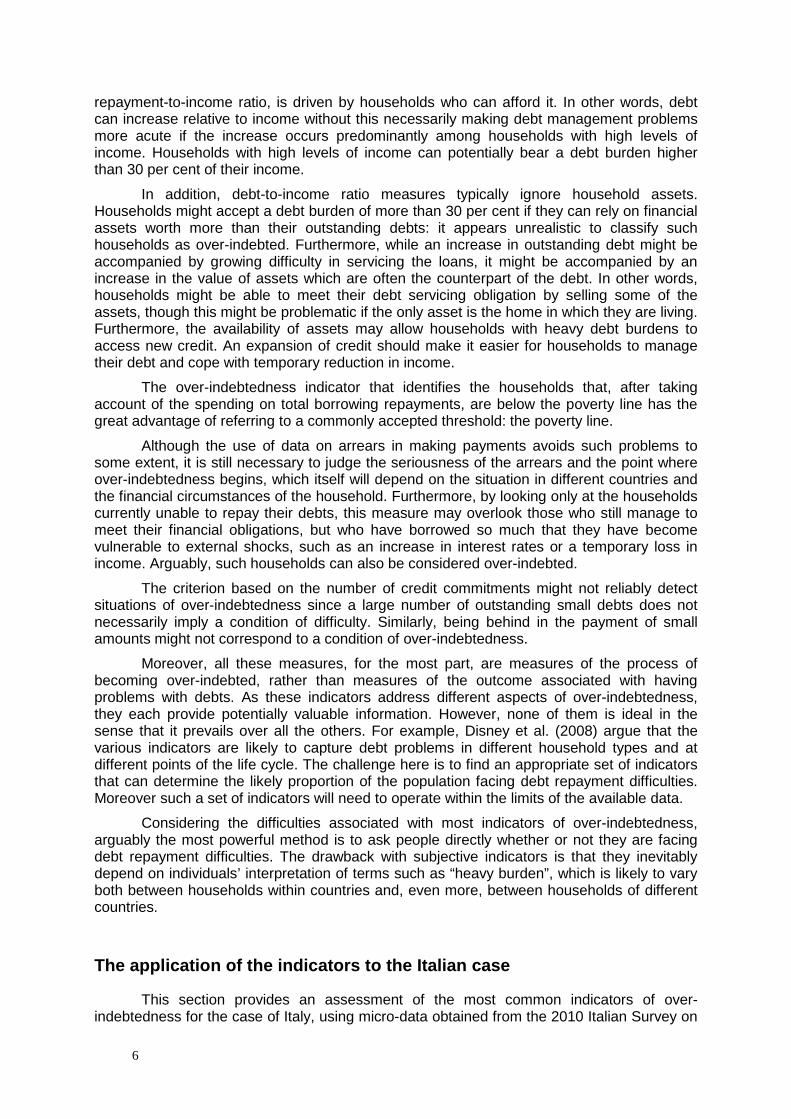
It is also important to note that the indicators that contribute most to explaining the condition of economic difficulty, after deducting the effect of economic poverty, are A310 and C15. These indicators have an important explanatory power with regard to the perceived condition of economic distress, beyond a mere condition of poverty.
Table 7 – Over-indebted households and economic pov erty 2010 (percentages)
Indebted or over-indebted indicator
Percentage points of income gap respect to
other households
Percentage points of wealth gap respect to
other households
Statistical association Φ2 with economic poverty
Contribution of over-indebtedness (in row) to
the perceived condition of economic distress (after deducting the effect of economic poverty) (*)
A30.................................................... -17.8 26.2 0.0636 0.0005
A120................................................. -13.3 -1.9 0.0423 0.0062
A220................................................. -13.7 -16.1 0.0406 0.0070
A310................................................. -22.8 -71.7 0.0636 0.0099
B ................................... -45.4 -46.5 0.3052 0.0032
C15.................................................... -39.7 -72.8 0.1314 0.0083
D................................... -30.5 -52.7 0.0754 0.0020
E 3..................................................... 51.5 102.0 - 0.0386 (**) 0.0040
Indebted households.......... 26.9 12.2 - 0.0397 (**) -
(*) Increase in the statistical association Φ2 due to the condition of over-indebtedness (in row), with respect to the basic model (with only economic poverty) explaining the perceived condition of economic distress. (**) In a 2x2 table, the negative sign indicates the most of the data falls off the diagonal (inverse relationship).
Conclusions
The objective of this research is to examine the measures of over-indebtedness proposed in the literature and apply them to the Italian case by using the broad information coming from the Bank of Italy’s survey on households.
The main result of the analysis is that the proposed indicators allow the different aspects of over-indebtedness to be measured; in fact, there is a limited overlap of the indicators. Considering the five most popular objective indicators, whereas about 8 per cent of households are over-indebted according to at least one indicator, no more than 2 per cent are over-indebted according to two indicators simultaneously. Moreover, the condition of over-indebtedness according to these indicators rarely coincides /???/ with the subjective condition of economic distress; the percentage of concordance varies between 50 and 80 per cent.
The limited performance of the traditional over-indebtedness indicators suggests it is worth critically assessing both the existence of alternative indicators and the use of different cut points from those commonly used.
We have evaluated the performance of different versions of the debt-burden indicator, taking into account the financial and real assets held by households. In some cases these indicators seem to outperform the traditional debt-burden indicator in detecting situations of economic distress.
As regards cut points, the analysis reaffirms the validity of the 30 per cent threshold for the overall debt burden, whereas it suggests a reduction to 15 per cent for the non-collateralized indicator cut point and to 3 for the number of commitments. In general, the
19
indicators incorporating the new cut points have a higher internal consistency, thus suggesting they are better able to capture the multidimensional nature of over-indebtedness.
The indicator that best detects the condition of economic distress associated with over-indebtedness is the debt-poverty indicator, according to which a household is over-indebted if its total borrowing repayments bring its income below the poverty line. The non-collateralized loans indicator with 15 per cent cut point and the arrears indicator also have a very good performance in detecting debt problems. We have also analyzed the use of multivariate techniques, such as principal component analysis, in order to identify a synthetic indicator.
In 2010, if we also consider the subjective condition of economic distress as an additional necessary condition, the percentage of over-indebted households varies between 0.5 and 4 per cent. The broadness of these estimates can be explained by a certain vagueness in the definition of over-indebtedness. We believe that this issue needs to be investigated further, including in relation to specific economic and social contexts; in particular it will be important to conduct a comparative analysis across European countries when the first data from the Household Finance and Consumption Survey become available.
However, the percentage of over-indebted households seems to be much lower than that found in Betti et al. (2007), who, by employing only subjective measures, find the proportion of over-indebted households in Italy to be 10 per cent. The comparison of these figures with those found in former years, shows that over-indebtedness increased between 2006 and 2010, especially between 2006 and 2008; the increase was associated with consumer credit and conditions of poverty.
Finally the paper shows that, in spite of the positive relationship between indebtedness and income/wealth, the over-indebtedness indicators are positively connected to conditions of economic poverty; leaving aside the debt-poverty indicator, which by definition is strongly correlated with economic poverty, the association with the non-collateralized loans indicator is particularly high. According to this indicator, for 70 per cent of over-indebted households the amount of debt is not higher than 20,000 euros, thus suggesting that this form of over-indebtedness represents a social issue more than a problem of financial stability. A different conclusion can be drawn when considering the debt-burden indicator, according to which the average amount of debt held by over-indebted households is quite high (more than 100,000 euros). Even if the indicator detects a limited percentage of households at large, the risk connected to these cases is potentially more significant in terms of financial stability.

20
Appendix A
Let us consider a 2 by 2 contingency table crossing a condition (typically an illness) and a test. In such a situation the 4 possible outcomes are as shown below:
Illness Not illness
Positive TP (True Positive) FP (False Positive)
Negative FN (False Negative) TN (True Negative)
In the paper we have applied this scheme considering self-perceived well being as the gold standard and the over-indebtedness index as the test.
From this table several indexes can be defined:
• sensitivity, Se = TP/(TP+FN), i.e. the portion of the population in a bad condition that is correctly classified by the test. It defines the ability of a test to catch the over-indebted; it reaches its maximum when there are no false-negative results;
• specificity, Sp = TN/(TN + FP), i.e. the portion of the population in a good condition that is correctly classified by the test. It defines the ability of a test to classify those who are not over-indebted correctly; it reaches its maximum when there are no false-positive results;
• predictivity, Pv = TP/(TP+TN), i.e. the portion of the population classified by the test as over-indebted that is correctly classified;
• accuracy, Ac = TP+TN / (TP+TN+FP+FN), i.e. the portion of the population correctly classified by the test;
• odds ratio, Or = (TP/FP) / (FN/TN), i.e. the ratio of the odds of being in a bad/good condition, in the 2 groups (over-indebted/not);
• relative risk, Rr = TP/(TP+FP) / FN/(FN+TN), i.e. the relative increase in the probability of being in a bad condition due to over-indebtedness;
• the �2 contingency index, �2 = (TP TN) / Sqrt(TP TN FP FN)
21
References
Anderloni L., D. Vandone (2010), Risk of overindebtedness and behavioural factors, Dipartimento di Scienze Economiche Aziendali e Statistiche, Università degli Studi di Milano, Working Paper, no.25.
Betti G., N. Dourmashkin, M. Rossi, Y. P. Yin, (2007), Consumer over-indebtedness in the EU: measurement and characteristics, Journal of Economic Studies, Vol. 34 Issue: 2, pp. 136 - 156.
BIS – Department for Business, Innovation and Skill (2010), Over-indebtedness in Britain: Second follow-up report.
Bonaccorsi di Patti E., R. Felici (2008), Il rischio dei mutui alle famiglie in Italia: evidenza da un milione di contratti, Questioni di Economia e Finanza (Occasional papers), no.32, Banca d’Italia.
Brandolini A., S. Magri, T. Smeeding (2010), Asset-based measurtement of poverty, Temi di discussione, no. 755, Banca d’Italia.
Bridges S., R. Disney (2004), Use of credit and arrears on debt among low-income families in the United Kingdom,"Fiscal Studies, Institute for Fiscal Studies, vol. 25(1), pages 1-25, March.
Bucks B., K. Pence (2008), Do borrowers know their mortgage terms? Journal of Urban Economics, Elsevier Inc., 64(2), p. 218-233.
Cronbach L. J. (1951), Coefficient alpha and the internal structure of tests. Psychometrika, 16(3), 297-334.
D’Alessio G., I. Faiella (2002), Nonresponse behaviour in the Bank of Italy's Survey of Household Income and Wealth (2002), Temi di Discussione no. 462, Banca d’Italia.
D'Aurizio L., I. Faiella, S. Iezzi, A.Neri (2006), L’under-reporting della ricchezza finanziaria nell’indagine sui bilanci delle famiglie, Temi di discussione no. 610, Banca d’Italia.
Department of Trade and Industry, Consumer Affairs Directorate (2001), Report by the task force on tackling over-indebtedness, London.
DeVaney S.A., R.H. Lytton (1995), “Household insolvency: A Review of Household Debt Repayment, Delinquency, and Bankrupcty”, Financial Services Review, 4 (2), pp. 137-156.
Disney R., S. Bridges, J. Gathergood (2008), Drivers of Over-Indebtedness, Report to the Department of Business, Enterprise and Regulatory Reform, Center for Policy Evaluation, University of Nottingham.
Disney R., J. Gathergood (2009), Understanding Consumer OverIndebtedness Using Counselling Sector Data: Scoping Study. Report to the Department for Business, Innovation and Skills (BIS) December.
European Central Bank (2005), Assessing the financial vulnerability of mortgage-indebted euro area households using micro level data, Financial Stability Review, Frankfurt, December.
European Commission (2008a), Towards a common operational European definition of over-indebtedness.
European Commission (2008b), The social situation in the European Union 2007: Social cohesion through equal opportunities, Luxembourg: Office for Official Publications of the European Communities.

22
European Commission (2010), Over-indebtedness: New evidence from the EU-SILC special module, Research note 4/2010
Haas O. J. (2006), Over-indebtedness in Germany, Employment Section, Social Finance Program Working Paper No. 44, International Labour Office: Geneva.
Keese M. (2009), Triggers and Determinants of Severe Household Indebtedness in Germany, SOEP papers 239, DIW Berlin, The German Socio-Economic Panel (SOEP).
Kempson E. (1992), Over-indebtedness in Britain, A report to the Department of Trade and Industry.
Kempson E. (2002), Over-indebtedness in Britain. A report to the Department of Trade and Industry, Personal Finance Research Centre, September.
Kempson E., S. McKay and M. Willitts (2004), Characteristics of Families in Debt and the Nature of Indebtedness, Corporate Document Services, DWP Research Report.
Kilborn J. J. (2005), Behavioral economics, overindebtedness and comparative consumer bankruptcy: searching for causes and evaluating solutions, Emory Bankruptcy Developments Journal, July.
Lusardi A. e P. Tufano (2009), Debt Literacy, Financial Experiences and Overindebtedness, NBER Working Papers 14808, National Bureau of Economic Research, Inc.
Magri S., R. Pico, C. Rampazzi (2011), Which households use consumer credit in Europe?, Questioni di Economia e Finanza, no.100, Banca d’Italia.
Magri S., R. Pico (2009), Arrears on Mortgages: Differences Across Countries and in Italy. How Much Do Italian Banks Price Them?, Banca d’Italia, mimeo.
Magri S., R. Pico (2012), L’indebitamento delle famiglie italiane: risultati dell’Indagine sui bilanci delle famiglie, Banca d’Italia, mimeo.
OXERA (2004), Are UK households over-indebted?, Commissioned by the Association for Payment Clearing Services, British Bankers Association, Consumer Credit Association and the Finance and Leasing Association.
Valins O. (2004), When Debt Becomes a Problem: A Literature Study, Strategic Social Policy Group, Ministry of Social Development, New Zealand.
Viimsalu S. (2010), The Over-Indebtedness Regulatory System in the Light of the Changing Economic Landscape, Juridica International, XVII.
Willis L. (2008), Against financial literacy education, University of Pennsylvania Law School, Research paper, no.10.