Hotel Market Study Redevelopment Authority Milwaukee...
76
Hotel Market Study Redevelopment Authority Milwaukee, Wisconsin Prepared by: HVS International 205 West Randolph Street, Suite 1650 Chicago, Illinois 60601 (312) 587-9900 (312) 587-9908 FAX Submitted to: Mr. Tony Q. Smith S.B. Friedman & Company 221 North LaSalle Street, Suite 820 Chicago, Illinois 60601 (312) 424-4254 (312) 424-4262 FAX
Transcript of Hotel Market Study Redevelopment Authority Milwaukee...
Hotel Market Study
Redevelopment Authority
Milwaukee, Wisconsin
Prepared by:
HVS International 205 West Randolph Street, Suite 1650 Chicago, Illinois 60601 (312) 587-9900 (312) 587-9908 FAX
Submitted to:
Mr. Tony Q. Smith S.B. Friedman & Company 221 North LaSalle Street, Suite 820 Chicago, Illinois 60601 (312) 424-4254 (312) 424-4262 FAX
HVS International 205 West Randolph Street Suite 1650 Chicago, Illinois 60606 (312) 587-9900 (312) 587-9908 FAX www.hvs.com New York
San Francisco
Boulder
Miami
Dallas/Fort Worth
Atlanta
Denver
Chicago
Washington, D.C.
Weston, CT
Phoenix
Mt. Lakes, NJ
Boston
Newport, RI
Vancouver
Toronto
London
Madrid
New Delhi
Singapore
Hong Kong
Sydney
São Paolo
Buenos Aires Specialists in Hotel Consulting and Appraisal Worldwide
June 6, 2007 Mr. Tony Q. Smith S.B. Friedman & Company 221 North LaSalle Street, Suite 820 Chicago, Illinois 60601 (312) 424-4254 (312) 424-4262 FAX
Re: Hotel Market Study Milwaukee, Wisconsin HVS Reference: 2007088012
Dear Mr. Smith:
Pursuant to your request, we herewith submit our market study pertaining to the hotel market in Milwaukee. We have inspected the real estate and analyzed the hotel market conditions in the Milwaukee area. We have toured the proposed project sites, and the results of our fieldwork and analysis are presented in this report. We have also reviewed summaries of the proposed improvements for each site.
We hereby certify that we have no undisclosed interest in any of the properties or development projects we evaluated, and our employment and compensation are not contingent upon our findings. This study is subject to the comments made throughout this report and to all assumptions and limiting conditions set forth herein.
Sincerely, Hans Detlefsen, Director [email protected], (312) 587-9900, ext. 15 Thomas Hazinski, Managing Director [email protected], (312) 587-9900, ext. 11 HVS International
HVS International Milwaukee Hotel Market Study Table of Contents
Table of Contents
Section Title 1 Summary of Conclusions
2 Nature of the Assignment
3 Description of Proposals and Neighborhood
4 Supply and Demand Analysis
Addenda
Market Area Analysis Projection of Occupancy and Average Rate Explanation of the Penetration Analysis Statement of Assumptions and Limiting Conditions Certification
HVS International Milwaukee Hotel Market Study Summary of Conclusions 1-4
1. Summary of Conclusions
In 2006/7, several developers have presented preliminary proposals to the City of Milwaukee for mixed-use projects located throughout downtown Milwaukee, the Park East District Corridor, and other nearby neighborhoods. Eleven of these development proposals include plans for hotels. Many of the developers have requested public assistance, in various forms, from the City of Milwaukee. S.B. Friedman & Company, the City’s development advisory consultant, has retained HVS International to help evaluate the hotel components of these proposals. Our analysis will focus on whether these proposed hotels are likely to impact the Milwaukee community or local economy in some positive manner and whether the proposed hotels are likely to negatively affect an existing set of hotels in downtown Milwaukee.
One conclusion from our analysis is that most of the proposed hotel developments are unlikely to have significant new impacts that will benefit the local economy. While the proposed new hotel developments could induce some new demand and capture currently unaccommodated hotel demand to some degree, these projects would also rely on capturing a portion of their demand from existing hotels in the market area. As hotel demand continues to grow in the market area, and as area occupancy levels eventually climb to 70% and higher on an annual basis, the market may be able to absorb new supply without negatively affecting existing hotels significantly. Based on our analysis of growth rates, however, this is not likely to happen until approximately 2010 or 2011.
A second conclusion from our analysis is that the site located at 4th Street and Wisconsin Avenue has great strategic importance for the City. This site is one of the few sites adjacent to the Midwest Airlines Center that could support the addition of new hotel construction. The Ghazi proposal represents one of two potential recommended uses for the site. One of the important convention-related needs that meeting planners and tourism officials have identified is the introduction of more retail, dining, and entertainment options in close proximity to the convention center to enhance the experience of delegates and attendees. The Ghazi proposal appears to be well positioned to accomplish a significant improvement in this regard. Moreover, because the City still has some control over this project due to its ownership of the land, the City may be able to influence the development in such a way that it will maximize certain benefits to the downtown area and the local convention industry.
However, the second potential recommendation for this site is the development of an additional convention hotel. If a planned convention center expansion takes place in the near future there will likely be a need for a simultaneous development of an additional convention hotel. If the proposed
HVS International Milwaukee Hotel Market Study Summary of Conclusions 1-5
Ghazi development occurs, then the opportunity to develop such a convention hotel at this site will be eliminated. Therefore, the Ghazi proposal also represents a significant opportunity cost. Nonetheless, this opportunity cost could be mitigated if the City is able to secure an alternate site that would be equally suitable for an additional convention hotel.
HVS International Milwaukee Hotel Market Study Nature of the Assignment 2-1
2. Nature of the Assignment
The subject of the study includes eleven different proposals for eleven sites located throughout Milwaukee’s Downtown, Near Downtown, and Park East neighborhoods. For the purposes of this study, we assume the properties are generally expected to open on January 1, 2009 and will feature varying hotel types and sizes. We evaluate the proposed brands, service levels, and room counts later in this report. The proposed sites are described in the following section as well.
In most cases the agents who propose to develop these hotels have ownership of, or options to purchase, their proposed development sites.
We assume that each development team would own their respective hotels. But we assume they would all retain professional management firms to operate the hotels. In most cases this implies the payment of a base management fee of 3.0% of total revenues generated by the hotels.
A variety of brands and franchise arrangements have been proposed. The Staybridge Suites is currently under construction. Based on a recent survey of project sponsors by the Redevelopment Authority, it is our understanding that some of the other developers are seeking to obtain franchise agreements, and some have entered into operating agreements with hotel management firms.
The methodology used to develop this study is based on the market research and valuation techniques set forth in the textbooks authored by Hospitality Valuation Services for the American Institute of Real Estate Appraisers and the Appraisal Institute, entitled The Valuation of Hotels and Motels,1 Hotels, Motels and Restaurants: Valuations and Market Studies,2 The Computerized Income
1 Stephen Rushmore, The Valuation of Hotels and Motels. (Chicago: American Institute of Real Estate Appraisers, 1978). 2 Stephen Rushmore, Hotels, Motels and Restaurants: Valuations and Market Studies. (Chicago: American Institute of Real Estate Appraisers, 1983).
Subject of the Study
Ownership, Franchise, and Management Assumptions
Method of Study
HVS International Milwaukee Hotel Market Study Nature of the Assignment 2-2
Approach to Hotel/Motel Market Studies and Valuations,3 and Hotels and Motels: A Guide to Market Analysis, Investment Analysis, and Valuations.4
1. The subject site has been evaluated from the viewpoint of its physical utility for the future operation of a hotel, as well as access, visibility, and other relevant location factors.
2. The surrounding economic environment, on both an area and neighborhood level, have been reviewed to identify specific hostelry-related economic and demographic trends that may have an impact on future demand for hotels.
3. Dividing the market for transient accommodations into individual segments defines specific market characteristics for the types of travelers expected to utilize the area's hotels. The factors investigated include purpose of visit, average length of stay, facilities and amenities required, seasonality, daily demand fluctuations, and price sensitivity.
4. An analysis of existing and proposed competition provides an indication of the current accommodated demand, along with market penetration and the degree of competitiveness.
5. The subject's proposed improvements have been evaluated or recommended for optimal capture of demand in this market and at the subject site’s location.
6. Documentation for an occupancy and average rate projection is derived utilizing the build-up approach based on an analysis of lodging activity.
7. A detailed projection of income and expense made in accordance with the Uniform System of Accounts for the Lodging Industry could be developed based on our room night analysis. This is not included in the current scope of work for this assignment. But it could be incorporated at some point in the future for a specific proposed hotel development. Such an analysis would set forth the anticipated economic benefits of the proposed projects to the owner.
3 Stephen Rushmore, The Computerized Income Approach to Hotel/Motel Market Studies and Valuations. (Chicago: American Institute of Real Estate Appraisers, 1990). 4 Stephen Rushmore, Hotels and Motels: A Guide to Market Analysis, Investment Analysis, and Valuations. (Chicago: Appraisal Institute, 1992).

HVS International Milwaukee Hotel Market Study Nature of the Assignment 2-3
The subject development sites were inspected by Hans Detlefsen on April 10, 2007.
Date of Inspection
HVS International Milwaukee Hotel Market Study Description of Proposals 3-1
3. Description of Proposals and Neighborhood Sites
The suitability of the site and neighborhood selected for the operation of a lodging facility is an important consideration affecting the economic viability of a property and its ultimate marketability. Moreover, the site selection can have implications for a project’s ability to generate positive impacts for the host neighborhood or the greater Milwaukee community. Factors such as size, topography, access, visibility, and the availability of utilities have a direct impact on the desirability of a particular site. Factors such as proximity to public assets (e.g. a convention center) and whether the surrounding neighborhood is in need of revitalization have implications for the project’s ability to generate these positive impacts.
In this section we evaluate each of the proposed sites and each project’s relationship to its host neighborhood through a series of objective and subjective factors of comparison. We do not specifically consider each project’s request for public incentives. However, most of the projects identified have significant parking requirements that continue to evolve based on refinements to the proposed developments. Several developers have sought financial assistance for assistance on project parking.
HVS evaluated each of eleven development proposals with respect to three types of potential impacts that could benefit the Milwaukee community. Specifically, we evaluated each project’s potential impact on the following:
Impacts on convention demand,
Neighborhood improvement impacts, and
Economic or community impacts generated by non-hotel development components, such as office, retail, and residential developments.
Overview

HVS International Milwaukee Hotel Market Study Description of Proposals 3-2
The City of Milwaukee could reasonably expect each of these three types of impacts to be of value to the local economy or the resident community. Projects that retain or augment convention demand contribute economic impacts to the community by attracting convention-related spending that otherwise would not occur in the local economy. Additions to the supply of full-service hotels adjacent to the convention center or additions to dining and entertainment options nearby could add to Milwaukee’s competitive position as a regional or national convention destination. Projects that involve the renovation of a vacant or underutilized building contribute to the revitalization of urban neighborhoods. Projects that introduce a type or quality of office, retail, or residential products that currently are not supplied in the market may also have the potential to generate economic impacts by providing a type of space for which demand currently exceeds supply.
Each of the projects listed below would provide tax benefits to various levels of government based on real estate value, food and beverage consumption, on-site sales, retail activity generated, and other guest expenditures. In addition, each project would contribute 14.6% of room rental revenues based on the following City of Milwaukee room tax formula: 7% - Milwaukee County Room Tax (collected for Wisconsin Center District); 2% - City of Milwaukee Room Tax (collected for Wisconsin Center District); 5% - State of Wisconsin General Sales Tax (collected for State of Wisconsin General Fund); 0.5% - Milwaukee County Sales Tax (collected for Milwaukee County General Fund); and 0.1% - Regional Sales Tax (collected for Miller Park Stadium District).
HVS evaluated eleven proposals, which represent a range of different hotel qualities, service levels and sizes. The qualities range from a mid-scale, extended stay Staybridge Suites, to an upper-upscale, full-service Renaissance Club Sport Hotel by Marriott, to the proposed luxury brand Kimpton. Several proposals include upscale, focused-service brands. Other proposals include upscale and limited service boutique properties.
For the purposes of this report, we define a full-service hotel as one which includes: (1) a three-meal restaurant; (2) a lounge; (3) a minimum of 60 square feet of meeting space per guest room; (4) a business center; (5) a fitness center; (6) additional recreational amenities, such as a pool; (7) room service; (8) concierge service; (9) laundry services; and (10) other services catering to business and group functions that may include high-speed Internet, audio-visual equipment, event planning, valet parking and other services.
Discussion of Hotel Service Level

HVS International Milwaukee Hotel Market Study Description of Proposals 3-3
Limited-service hotels are those that offer some, but not all, of these services offered at full-service properties. Some industry participants have begun using the term “focused-service” in recent years to distinguish a set of limited-service properties that offer more rather than fewer services. The focused-service brands tend to represent the high end of quality and service levels offered within the broad set of limited-service hotels. They also tend to target the corporate business traveler segment.
Extended-stay properties are typically limited-service or focused-service hotels. These properties focus their marketing and sales efforts on guests that stay five days or longer. Because these hotels primarily serve long-term guests, they generally offer relatively large living quarters, often equipped with kitchen appliances and expanded wardrobe areas.
Boutique hotels can represent a broad range of quality and service levels, depending on the particular market area. For the purpose of this report, we use the term “boutique” to indicate hotels that have upscale finishes and high quality rooms and amenities. However, they generally do not offer all the services of a full-service hotel. Boutique hotels are typically smaller than full-service hotels and in many cases are located in historic or renovated buildings in urban settings.
Luxury hotels represent the highest overall levels of finishes, building quality and services. However, they need not be full-service in the sense that they offer meeting space and other requirements listed in the definition of a full-service hotel. They can be boutique hotels with independent brands or they can carry a national brand, or they can have unique names but still be part of a larger national chain such as Kimpton.
HVS reviewed the following eleven proposal summaries, as provided by the Redevelopment Authority of the City of Milwaukee. 1) Development Opportunity Corporation (DOC)
• Location: Water & Juneau • Neighborhood: Downtown (Water Street) • Hotel Type: Extended Stay • Hotel Flag: Staybridge Suites • Number of Rooms: 135 • Additional Uses:
o 30 condominiums o 17,000 sq. ft. retail
Summary of Proposals
HVS International Milwaukee Hotel Market Study Description of Proposals 3-4
The Development Opportunity Corporation has already begun construction on a new Staybridge Suites hotel near downtown Milwaukee. The hotel will have 135 guest rooms and is expected to open in 2008. As a limited service hotel, with a strategic focus on extended-stay customers, this project is not expected to have an impact on local convention demand. It represents some neighborhood improvement and could serve as an anchor for the existing entertainment and restaurant cluster along Water Street. Although the project will include 17,000 square feet of retail space, the project is not expected to attract unique retail users that otherwise would not locate in Milwaukee. The economic and neighborhood impacts anticipated from this project are expected to be modest, with potential for this project to serve as an anchor for the adjacent Water Street entertainment and dining district.
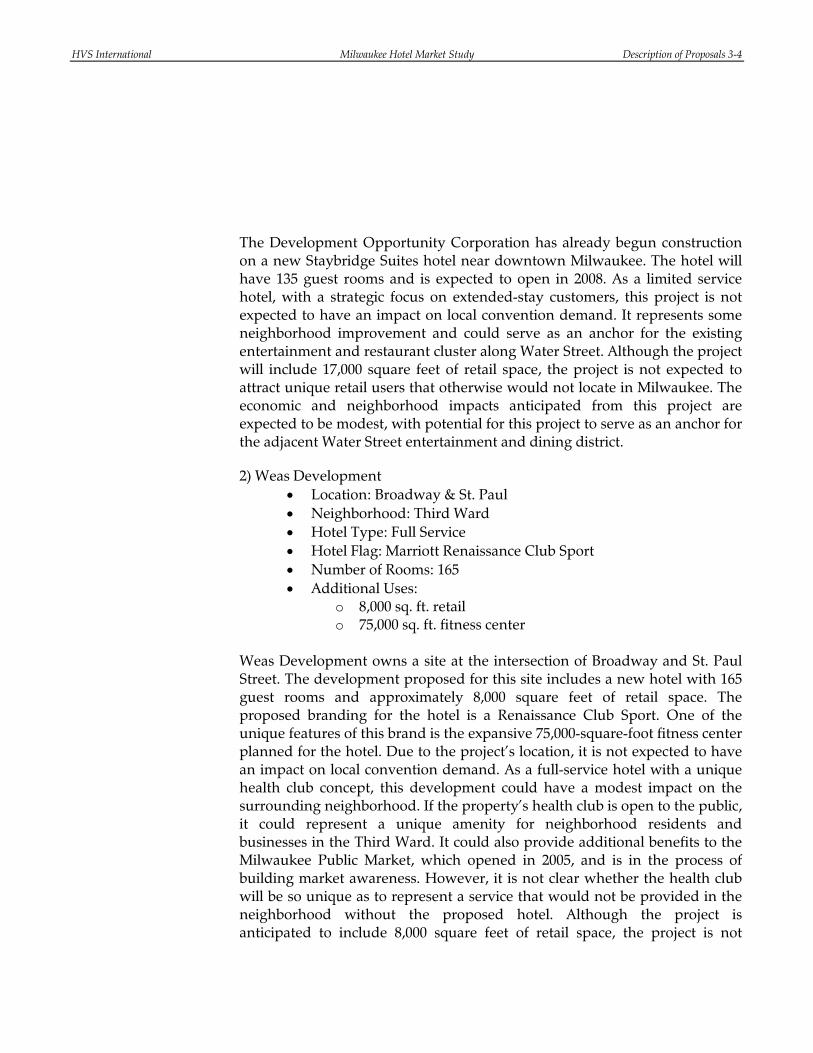
2) Weas Development • Location: Broadway & St. Paul • Neighborhood: Third Ward • Hotel Type: Full Service • Hotel Flag: Marriott Renaissance Club Sport • Number of Rooms: 165 • Additional Uses:
o 8,000 sq. ft. retail o 75,000 sq. ft. fitness center
Weas Development owns a site at the intersection of Broadway and St. Paul Street. The development proposed for this site includes a new hotel with 165 guest rooms and approximately 8,000 square feet of retail space. The proposed branding for the hotel is a Renaissance Club Sport. One of the unique features of this brand is the expansive 75,000-square-foot fitness center planned for the hotel. Due to the project’s location, it is not expected to have an impact on local convention demand. As a full-service hotel with a unique health club concept, this development could have a modest impact on the surrounding neighborhood. If the property’s health club is open to the public, it could represent a unique amenity for neighborhood residents and businesses in the Third Ward. It could also provide additional benefits to the Milwaukee Public Market, which opened in 2005, and is in the process of building market awareness. However, it is not clear whether the health club will be so unique as to represent a service that would not be provided in the neighborhood without the proposed hotel. Although the project is anticipated to include 8,000 square feet of retail space, the project is not

HVS International Milwaukee Hotel Market Study Description of Proposals 3-5
expected to attract unique retail users that otherwise would not locate in Milwaukee. The economic and neighborhood impacts anticipated from this project are expected to be modest, depending on the health club concept.
3) Ruvin Development – Kimpton • Location: 3rd & Juneau • Neighborhood: Park East • Hotel Type: Boutique • Hotel Flag: Kimpton • Number of Rooms: 184 • Additional Uses:
o 70 condominiums o 17,000 sq. ft. retail o 106,000 sq. ft. office o Spa
Ruvin/Gatehouse has an option to purchase a site at the intersection of 4th Street and Juneau Avenue. The development proposed for this site includes a new hotel with 184 guest rooms, a spa, 17,000 square feet of retail space, 106,000 square feet of office space, and 70 condominium units. The proposed branding for the hotel is a Kimpton, although the developer has not yet obtained a franchise agreement. Due to the project’s location, it is not expected to have an impact on local convention demand. As a potentially full-service, upper-upscale boutique hotel, this development could have some impact on the surrounding neighborhood by introducing a high-end hospitality brand to the Park East area. The Kimpton brand more typically focuses on highly urban downtown locations, especially within close proximity to theater districts and cultural attractions. Although the project will include substantial amounts of retail and office space, the project is not expected to attract unique retail or office users that otherwise would not locate in Milwaukee.
The economic and neighborhood impacts anticipated from this project are expected to be modest, with some potential to create an upscale neighborhood anchor for other retail, dining and office tenants if the developer is successful in obtaining the Kimpton brand, as anticipated. 4) Ruvin Development – Aloft
• Location: 3rd & Juneau • Neighborhood: Park East
HVS International Milwaukee Hotel Market Study Description of Proposals 3-6
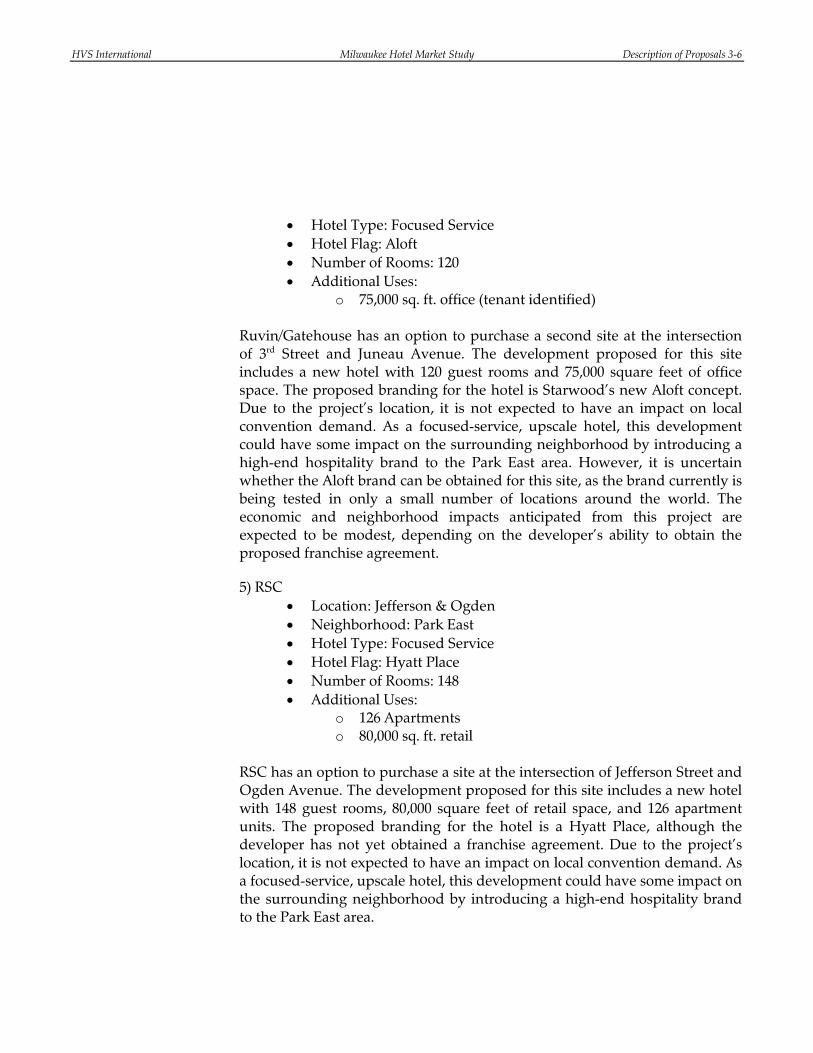
• Hotel Type: Focused Service • Hotel Flag: Aloft • Number of Rooms: 120 • Additional Uses:
o 75,000 sq. ft. office (tenant identified) Ruvin/Gatehouse has an option to purchase a second site at the intersection of 3rd Street and Juneau Avenue. The development proposed for this site includes a new hotel with 120 guest rooms and 75,000 square feet of office space. The proposed branding for the hotel is Starwood’s new Aloft concept. Due to the project’s location, it is not expected to have an impact on local convention demand. As a focused-service, upscale hotel, this development could have some impact on the surrounding neighborhood by introducing a high-end hospitality brand to the Park East area. However, it is uncertain whether the Aloft brand can be obtained for this site, as the brand currently is being tested in only a small number of locations around the world. The economic and neighborhood impacts anticipated from this project are expected to be modest, depending on the developer’s ability to obtain the proposed franchise agreement.
5) RSC • Location: Jefferson & Ogden • Neighborhood: Park East • Hotel Type: Focused Service • Hotel Flag: Hyatt Place • Number of Rooms: 148 • Additional Uses:
o 126 Apartments o 80,000 sq. ft. retail
RSC has an option to purchase a site at the intersection of Jefferson Street and Ogden Avenue. The development proposed for this site includes a new hotel with 148 guest rooms, 80,000 square feet of retail space, and 126 apartment units. The proposed branding for the hotel is a Hyatt Place, although the developer has not yet obtained a franchise agreement. Due to the project’s location, it is not expected to have an impact on local convention demand. As a focused-service, upscale hotel, this development could have some impact on the surrounding neighborhood by introducing a high-end hospitality brand to the Park East area.
HVS International Milwaukee Hotel Market Study Description of Proposals 3-7
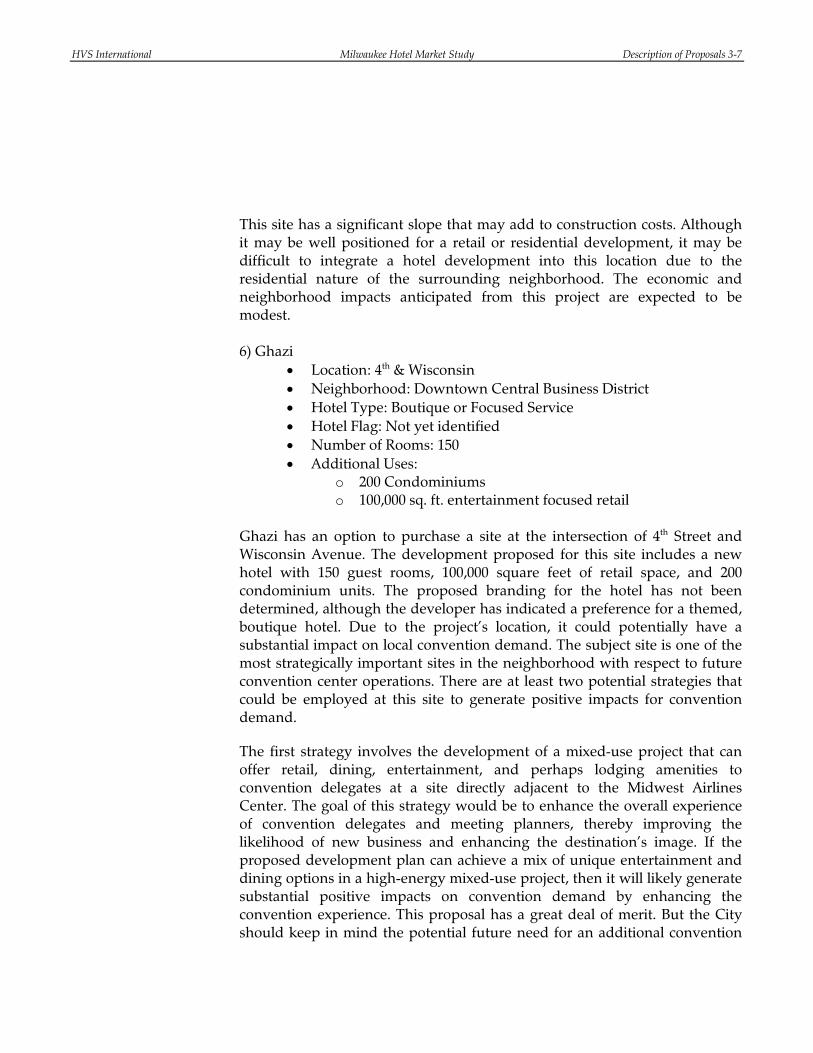
This site has a significant slope that may add to construction costs. Although it may be well positioned for a retail or residential development, it may be difficult to integrate a hotel development into this location due to the residential nature of the surrounding neighborhood. The economic and neighborhood impacts anticipated from this project are expected to be modest. 6) Ghazi
• Location: 4th & Wisconsin • Neighborhood: Downtown Central Business District • Hotel Type: Boutique or Focused Service • Hotel Flag: Not yet identified • Number of Rooms: 150 • Additional Uses:
o 200 Condominiums o 100,000 sq. ft. entertainment focused retail
Ghazi has an option to purchase a site at the intersection of 4th Street and Wisconsin Avenue. The development proposed for this site includes a new hotel with 150 guest rooms, 100,000 square feet of retail space, and 200 condominium units. The proposed branding for the hotel has not been determined, although the developer has indicated a preference for a themed, boutique hotel. Due to the project’s location, it could potentially have a substantial impact on local convention demand. The subject site is one of the most strategically important sites in the neighborhood with respect to future convention center operations. There are at least two potential strategies that could be employed at this site to generate positive impacts for convention demand.
The first strategy involves the development of a mixed-use project that can offer retail, dining, entertainment, and perhaps lodging amenities to convention delegates at a site directly adjacent to the Midwest Airlines Center. The goal of this strategy would be to enhance the overall experience of convention delegates and meeting planners, thereby improving the likelihood of new business and enhancing the destination’s image. If the proposed development plan can achieve a mix of unique entertainment and dining options in a high-energy mixed-use project, then it will likely generate substantial positive impacts on convention demand by enhancing the convention experience. This proposal has a great deal of merit. But the City should keep in mind the potential future need for an additional convention
HVS International Milwaukee Hotel Market Study Description of Proposals 3-8
hotel. Therefore, HVS recommends a full evaluation of other site options for a full-service convention hotel before proceeding with this development plan.
The second strategy involves the development of an additional convention hotel that can offer substantial room blocks to convention groups. Such a project would likely involve a single-use hotel development, with a minimum of 300 guestrooms in a nationally branded full-service hotel. The goal of this strategy is to improve Milwaukee’s competitive advantages with respect to the overall sleeping room package that can be offered to convention groups. If the Midwest Airlines Center expands, there will likely be a critical need for such a development in conjunction with this expansion. This strategy could have a positive impact on the existing Grand Avenue retail cluster by attracting a larger concentration of visitors to this location. A potential risk associated with the development proposed by Ghazi is that it would eliminate one of the most ideal development locations for a potential future convention hotel.
The economic and neighborhood impacts anticipated from this project are expected to be substantial, depending on the final programming and tenant mix of the project. HVS concludes that this development site is among the most strategic development sites in downtown Milwaukee with respect to convention center planning. Moreover, this proposal represents the most likely opportunity to generate substantial economic impacts and neighborhood impacts for the City. 7) MLG
• Location: Water & Knapp • Neighborhood: Park East • Hotel Type: Not yet identified • Hotel Flag: Not yet identified • Number of rooms: 60 • Additional Uses:
o 32 Condominiums o 50,000 sq. ft. retail o 332,000 sq. ft. office
MLG has an option to purchase a site at the intersection of Water Street and Knapp Street, along the east bank of the Milwaukee River. The development proposed for this site includes a new hotel with 60 guestrooms, 50,000 square feet of retail space, 332,000 square feet of office space, and 32 condominium
HVS International Milwaukee Hotel Market Study Description of Proposals 3-9
units. The proposed branding for the hotel is undetermined. Due to the project’s location, it is not expected to have an impact on local convention demand. Due to the undetermined nature of the hotel service level and brand, it is uncertain whether this development could have any significant impact on the surrounding neighborhood by introducing a high-end hospitality brand to the Park East area. The relatively small number of guestrooms suggests that any impact from the hotel will be small.
Moreover, due to the project’s large office component and potentially attractive location along the river, this project may have some potential to attract certain office tenants that otherwise would not locate in Milwaukee. Further analysis of development plans and office tenant letters of intent could help refine this determination. But currently, the economic and neighborhood impacts anticipated from this project are undetermined.
It is uncertain whether the MLG project will include a hotel component. Furthermore, the project’s ability to identify a major anchor tenant for the proposed office space is a key determinant for whether this project will continue. 8) Moderne
• Location: 3rd & Juneau • Neighborhood: Park East • Hotel Type: Extended Stay • Hotel Flag: Element • Number of Rooms: 120 • Additional Uses:
o 80 Condominiums o 20,000 sq. ft. retail o Spa
Moderne owns a site at the intersection of 3rd Street and Juneau Avenue. The development proposed for this site includes a new hotel with 120 guest rooms, a spa, 20,000 square feet of retail space, and 80 condominium units. The proposed branding for the hotel is Starwood’s new Element prototype, which features an upscale environment for extended-stay travelers. Due to the project’s location, it is not expected to have an impact on local convention demand. As a focused-service, upscale hotel, this development could have a positive impact on the surrounding neighborhood by introducing a high-end hospitality brand to the Park East area. The economic and neighborhood
HVS International Milwaukee Hotel Market Study Description of Proposals 3-10
impacts anticipated from this project could be modest, depending on the property’s size and design. 9) Badger Pacific
• Location: Milwaukee & Wisconsin • Neighborhood: Downtown (East town) • Hotel Type: Boutique • Hotel Flag: Not yet identified • Number of Rooms: Not yet identified
Badger owns a site at the intersection on Milwaukee Street, south of Wisconsin Avenue. The development proposed for this site includes a new hotel with 80 guestrooms to be located in a renovated brick building in a revitalizing downtown neighborhood. The proposed branding for the hotel is undetermined and may include an independent boutique brand. Due to the project’s location, it is not expected to have an impact on local convention demand. But it could have a significant impact on the immediate neighborhood surrounding the site, which currently has some underutilized buildings. The Metro Hotel is one example of how such a project could contribute to a neighborhood’s revitalization. It could also attract small retail and restaurant entrepreneurs that could further enhance the image of the immediate neighborhood. The economic and neighborhood impacts anticipated from this project are expected to be modest.
10) Dixon • Location: 5th and Florida • Neighborhood: Walker’s Point • Hotel Type: Independent Boutique (Motorcycle Theme) • Hotel Flag: Iron Horse • Number of Rooms: 100 • Additional Uses:
o Spa o On-site restaurant
Dixon owns a site at the intersection of 5th Street and Florida Street. The development proposed for this site includes a new hotel with 100 guestrooms, a restaurant and a spa to be located in a renovated brick, historic building in a revitalizing neighborhood. The Iron Horse Hotel will be an independent boutique brand. Due to the project’s location, it is not expected to have an impact on local convention demand. But it could have a significant impact on

HVS International Milwaukee Hotel Market Study Description of Proposals 3-11
the immediate neighborhood surrounding the site, which currently has some underutilized buildings. It could also complement proposed entertainment attractions in the area – specifically, the nearby Harley Davidson Museum, which is currently under construction. This hotel project could add to the marketing appeal of the proposed new museum destination, which is expected to add to the marketing appeal of the city as a whole. The economic and neighborhood impacts anticipated from this project are expected to be modest.
11) Schultz • Location: 236 N. Water • Neighborhood: 5th Ward • Hotel Type: Not yet identified • Hotel Flag: Not yet identified • Number of Rooms: 100 • Additional Uses:
o 220 Condominiums o 10,000 sq. ft. retail
Schultz owns a site at the intersection of Water Street and Pittsburgh Avenue. The development proposed for this site includes a new hotel with 100 guestrooms, 10,000 square feet of retail space, and 220 condominium units. The proposed branding for the hotel is undetermined. It is unclear whether a hotel of any type will be feasible at this location, as surrounding uses indicate that residential and retail may be the highest and best use for this site. Due to the project’s location, it is not expected to have an impact on local convention demand. The neighborhood is primarily characterized by residential development and does not include any major hotel demand generators. The hotel is not likely to have a significant impact on the surrounding neighborhood. Although the project will include a modest amount of retail space and a large number of condominiums, the project is not expected to attract unique retail tenants or residents that otherwise would not locate in Milwaukee. The economic and neighborhood impacts anticipated from this project are expected to be minimal.
The neighborhood surrounding a lodging facility often has an impact on a hotel's status, image, class, style of operation, and sometimes its ability to attract and properly serve a particular market segment. This section of the report investigates the proposed projects' neighborhood and evaluates any
Neighborhood

HVS International Milwaukee Hotel Market Study Description of Proposals 3-12
pertinent locational factors that could affect occupancy, average rate and overall profitability.
Map of Neighborhood
Source: Microsoft Streets & Trips
Overall, the supportive nature of the development in the immediate areas surrounding the development proposals is considered appropriate for, and conducive to, the operation of a hotel. However, this is true to varying

HVS International Milwaukee Hotel Market Study Description of Proposals 3-13
degrees for the different proposals. The surrounding neighborhood uses around the Ghazi site are most conducive to a hotel. This could also be true of the Dixon site if an effective linkage and association can be made to the proposed new Harley Davidson Museum, which is planned for a nearby location. It is unclear to what degree the sites in the Park East area will be conducive to hotel operations. Although at least one major corporate demand generator (Manpower) would benefit hotels at these locations, it is our general conclusion that these sites are not as conducive to hotel operations as potential sites located in the core business district that are more centrally located to multiple hotel demand generators and visitor amenities.
Overall, the hotel components of the proposed developments are expected to have only minimal to modest impacts that would benefit the local economy or Milwaukee neighborhoods. The Ghazi proposal is the most likely exception to this conclusion, as it involves a highly strategic site that could be used to substantially enhance or augment convention business. Some of the other proposals may have the potential to enhance their surrounding neighborhoods by catalyzing area revitalization or preserving historic buildings. But HVS concludes that the impacts generated by the hotel components of such projects are unlikely to justify substantial public financial incentives, especially when hotel developments may not be the highest and best use for such sites.
Modest loans for preservation-related projects might make sense as a neighborhood revitalization and preservation incentive, depending on the City’s policy priorities. Such an incentive could apply to certain projects considered in this report, such as those proposed by the Badger and Dixon development teams.
Throughout this report HVS will analyze the broader Milwaukee hotel industry to evaluate market demand and supply. We will further consider the potential impacts from each development proposal. Our analysis will focus on the hotel components of each development proposal. Based on our initial evaluation of the proposed development sites, programs, and neighborhoods it appears that the greatest potential for positive impacts is likely to involve the site located at 4th Street and Wisconsin Avenue. This site is at a highly strategic location that represents an opportunity to develop a project that will further leverage public investments that have been made in the Midwest Airlines Center.
Conclusion
HVS International Milwaukee Hotel Market Study Description of Proposals 3-14
Finally, the competitive set of hotels we evaluated exhibited a strengthening position in the market. However, they are not yet quite at a level where we would expect unaccommodated demand to be great enough to offset new additions to supply in the market. An aggregate occupancy level around 70% is generally an indicator that a market is ready to absorb new supply. The competitive set has not yet achieved an aggregate occupancy level this high, based on market data from the past six years.
HVS International Milwaukee Hotel Market Study Supply and Demand Analysis 4-1
4. Supply and Demand Analysis
In the economic principle of supply and demand, price varies directly, but not proportionately, with demand and inversely, but not proportionately, with supply. In the lodging industry, supply is measured by the number of guestrooms available, and demand is measured by the number of guestrooms occupied; the net effect of supply and demand towards equilibrium results in a prevailing price, or average rate. The purpose of this section is to investigate current supply and demand trends as indicated by the current competitive market, and set forth a basis for the projection of future supply and demand growth. We also provide an overview of national occupancy and average rate trends, both on an overall basis and by chain scale.
All of the proposed hotels would be located in Milwaukee, Wisconsin. The greater Milwaukee metropolitan area offers 90 hotels and motels, spanning 12,346 rooms. The two largest hotels are the 730-room Hilton and the 483-room Hyatt, both located in the downtown district near the convention center.
Of this larger supply set, the proposed subject properties are expected to compete with a smaller set of hotels based on various factors. These factors may include location, price point, product quality, length of stay (such as an extended-stay focus vs. non-extended-stay focus), room type (all-suite vs. standard), hotel age, or brand, among other factors. We have reviewed these pertinent attributes and established an expected competitive set based upon this review. Our review of the proposed subject’s specific competitive set within the Milwaukee area begins on page 4-4.
The U.S. lodging industry is in a period of strong recovery, with year-end 2006 results reflecting 1.1% growth in room nights sold coupled with average rate growth of 7.0%; RevPAR (revenue per available room) in 2006 increased by 7.5% nationwide. RevPAR is calculated by multiplying occupancy by average rate, and provides an indication of how well rooms revenue is being maximized. This follows a strong 2005, which registered RevPAR growth of 8.6%. Managers were able to continue to command considerable increases to their negotiated rates in 2006, following a trend, which first took hold in 2004; this strength in rates for primary users supported higher rates for other segments of demand. A stronger economy also supported higher demand levels and occupancy levels accordingly improved. The following table
Definition of Subject Hotel Market
National Trends Overview
HVS International Milwaukee Hotel Market Study Supply and Demand Analysis 4-2
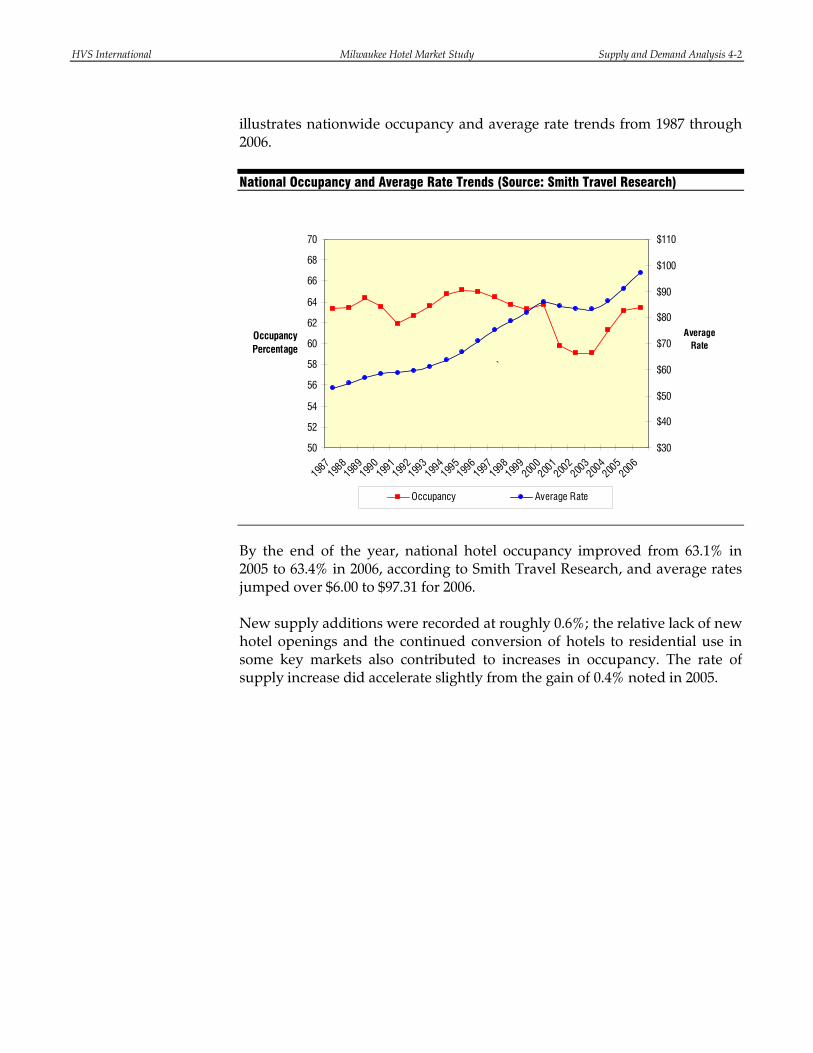
illustrates nationwide occupancy and average rate trends from 1987 through 2006. National Occupancy and Average Rate Trends (Source: Smith Travel Research)
50
52
54
56
58
60
62
64
66
68
70
1987
1988198
9199
0199
1199
2199
3199
4199
5199
6199
7199
8199
9200
0200
1200
2200
3200
4200
5200
6
Occupancy Percentage
$30
$40
$50
$60
$70
$80
$90
$100
$110
Average Rate
Occupancy Average Rate
`
By the end of the year, national hotel occupancy improved from 63.1% in 2005 to 63.4% in 2006, according to Smith Travel Research, and average rates jumped over $6.00 to $97.31 for 2006. New supply additions were recorded at roughly 0.6%; the relative lack of new hotel openings and the continued conversion of hotels to residential use in some key markets also contributed to increases in occupancy. The rate of supply increase did accelerate slightly from the gain of 0.4% noted in 2005.
HVS International Milwaukee Hotel Market Study Supply and Demand Analysis 4-3
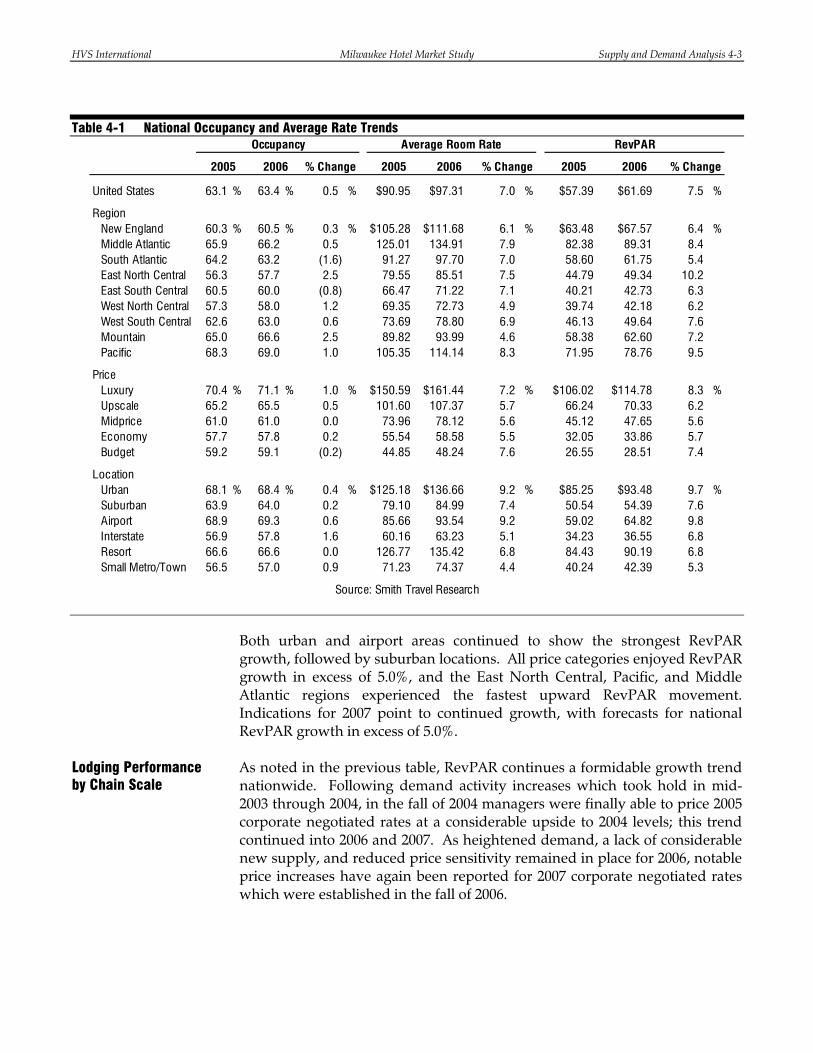
Table 4-1 National Occupancy and Average Rate Trends
United States 63.1 % 63.4 % 0.5 % $90.95 $97.31 7.0 % $57.39 $61.69 7.5 %
RegionNew England 60.3 % 60.5 % 0.3 % $105.28 $111.68 6.1 % $63.48 $67.57 6.4 %Middle Atlantic 65.9 66.2 0.5 125.01 134.91 7.9 82.38 89.31 8.4South Atlantic 64.2 63.2 (1.6) 91.27 97.70 7.0 58.60 61.75 5.4East North Central 56.3 57.7 2.5 79.55 85.51 7.5 44.79 49.34 10.2East South Central 60.5 60.0 (0.8) 66.47 71.22 7.1 40.21 42.73 6.3West North Central 57.3 58.0 1.2 69.35 72.73 4.9 39.74 42.18 6.2West South Central 62.6 63.0 0.6 73.69 78.80 6.9 46.13 49.64 7.6Mountain 65.0 66.6 2.5 89.82 93.99 4.6 58.38 62.60 7.2Pacific 68.3 69.0 1.0 105.35 114.14 8.3 71.95 78.76 9.5
PriceLuxury 70.4 % 71.1 % 1.0 % $150.59 $161.44 7.2 % $106.02 $114.78 8.3 %Upscale 65.2 65.5 0.5 101.60 107.37 5.7 66.24 70.33 6.2Midprice 61.0 61.0 0.0 73.96 78.12 5.6 45.12 47.65 5.6Economy 57.7 57.8 0.2 55.54 58.58 5.5 32.05 33.86 5.7Budget 59.2 59.1 (0.2) 44.85 48.24 7.6 26.55 28.51 7.4
LocationUrban 68.1 % 68.4 % 0.4 % $125.18 $136.66 9.2 % $85.25 $93.48 9.7 %Suburban 63.9 64.0 0.2 79.10 84.99 7.4 50.54 54.39 7.6Airport 68.9 69.3 0.6 85.66 93.54 9.2 59.02 64.82 9.8Interstate 56.9 57.8 1.6 60.16 63.23 5.1 34.23 36.55 6.8Resort 66.6 66.6 0.0 126.77 135.42 6.8 84.43 90.19 6.8Small Metro/Town 56.5 57.0 0.9 71.23 74.37 4.4 40.24 42.39 5.3
2006 % Change
Source: Smith Travel Research
Occupancy Average Room Rate RevPAR
2005 2006 % Change 2005 2006 % Change 2005
Both urban and airport areas continued to show the strongest RevPAR growth, followed by suburban locations. All price categories enjoyed RevPAR growth in excess of 5.0%, and the East North Central, Pacific, and Middle Atlantic regions experienced the fastest upward RevPAR movement. Indications for 2007 point to continued growth, with forecasts for national RevPAR growth in excess of 5.0%. As noted in the previous table, RevPAR continues a formidable growth trend nationwide. Following demand activity increases which took hold in mid-2003 through 2004, in the fall of 2004 managers were finally able to price 2005 corporate negotiated rates at a considerable upside to 2004 levels; this trend continued into 2006 and 2007. As heightened demand, a lack of considerable new supply, and reduced price sensitivity remained in place for 2006, notable price increases have again been reported for 2007 corporate negotiated rates which were established in the fall of 2006.
Lodging Performance by Chain Scale
HVS International Milwaukee Hotel Market Study Supply and Demand Analysis 4-4
Also pertinent to this analysis is a review of lodging statistics by chain scale; this provides greater indication of differences between price segments and occupancies based on product quality level.
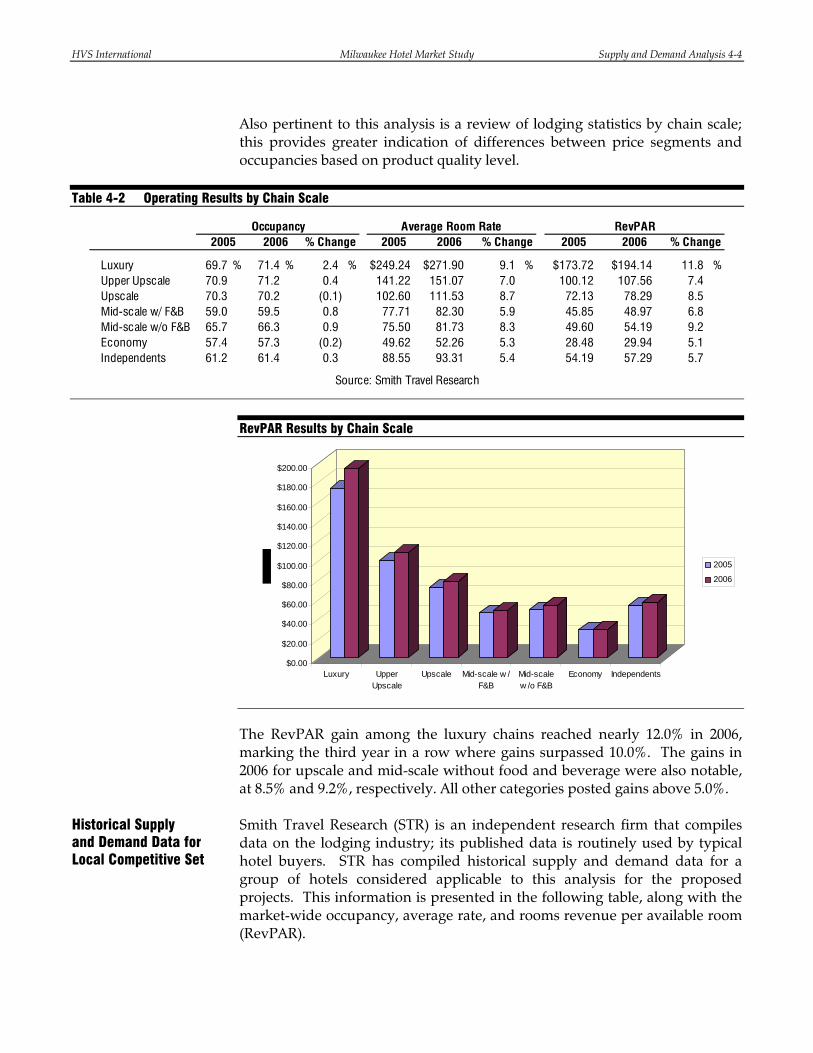
Table 4-2 Operating Results by Chain Scale
Luxury 69.7 % 71.4 % 2.4 % $249.24 $271.90 9.1 % $173.72 $194.14 11.8 %Upper Upscale 70.9 71.2 0.4 141.22 151.07 7.0 100.12 107.56 7.4Upscale 70.3 70.2 (0.1) 102.60 111.53 8.7 72.13 78.29 8.5Mid-scale w/ F&B 59.0 59.5 0.8 77.71 82.30 5.9 45.85 48.97 6.8Mid-scale w/o F&B 65.7 66.3 0.9 75.50 81.73 8.3 49.60 54.19 9.2Economy 57.4 57.3 (0.2) 49.62 52.26 5.3 28.48 29.94 5.1Independents 61.2 61.4 0.3 88.55 93.31 5.4 54.19 57.29 5.7
2006 % Change 2005Occupancy Average Room Rate RevPAR
% Change2006 % Change 2005 20062005
Source: Smith Travel Research
RevPAR Results by Chain Scale
$0.00
$20.00
$40.00
$60.00
$80.00
$100.00
$120.00
$140.00
$160.00
$180.00
$200.00
Luxury UpperUpscale
Upscale Mid-scale w /F&B
Mid-scalew /o F&B
Economy Independents
2005
2006
The RevPAR gain among the luxury chains reached nearly 12.0% in 2006, marking the third year in a row where gains surpassed 10.0%. The gains in 2006 for upscale and mid-scale without food and beverage were also notable, at 8.5% and 9.2%, respectively. All other categories posted gains above 5.0%. Smith Travel Research (STR) is an independent research firm that compiles data on the lodging industry; its published data is routinely used by typical hotel buyers. STR has compiled historical supply and demand data for a group of hotels considered applicable to this analysis for the proposed projects. This information is presented in the following table, along with the market-wide occupancy, average rate, and rooms revenue per available room (RevPAR).
Historical Supply and Demand Data for Local Competitive Set
HVS International Milwaukee Hotel Market Study Supply and Demand Analysis 4-5
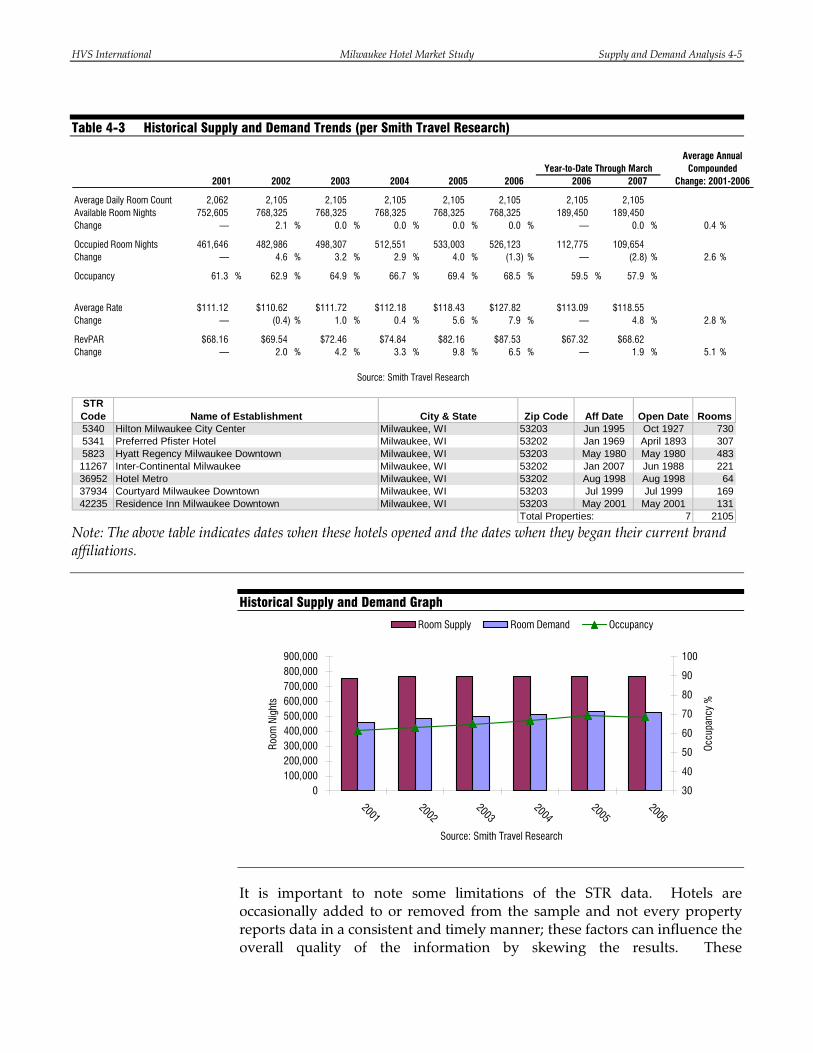
Table 4-3 Historical Supply and Demand Trends (per Smith Travel Research)
2001 2002 2003 2004 2005 2006 2006 2007
Average Daily Room Count 2,062 2,105 2,105 2,105 2,105 2,105 2,105 2,105Available Room Nights 752,605 768,325 768,325 768,325 768,325 768,325 189,450 189,450Change — 2.1 % 0.0 % 0.0 % 0.0 % 0.0 % — 0.0 % 0.4 %
Occupied Room Nights 461,646 482,986 498,307 512,551 533,003 526,123 112,775 109,654Change — 4.6 % 3.2 % 2.9 % 4.0 % (1.3) % — (2.8) % 2.6 %
Occupancy 61.3 % 62.9 % 64.9 % 66.7 % 69.4 % 68.5 % 59.5 % 57.9 %
Average Rate $111.12 $110.62 $111.72 $112.18 $118.43 $127.82 $113.09 $118.55Change — (0.4) % 1.0 % 0.4 % 5.6 % 7.9 % — 4.8 % 2.8 %
RevPAR $68.16 $69.54 $72.46 $74.84 $82.16 $87.53 $67.32 $68.62Change — 2.0 % 4.2 % 3.3 % 9.8 % 6.5 % — 1.9 % 5.1 %
Source: Smith Travel Research
Year-to-Date Through MarchAverage Annual
Compounded Change: 2001-2006
STR Code Name of Establishment City & State Zip Code Aff Date Open Date Rooms5340 Hilton Milwaukee City Center Milwaukee, WI 53203 Jun 1995 Oct 1927 7305341 Preferred Pfister Hotel Milwaukee, WI 53202 Jan 1969 April 1893 3075823 Hyatt Regency Milwaukee Downtown Milwaukee, WI 53203 May 1980 May 1980 48311267 Inter-Continental Milwaukee Milwaukee, WI 53202 Jan 2007 Jun 1988 22136952 Hotel Metro Milwaukee, WI 53202 Aug 1998 Aug 1998 6437934 Courtyard Milwaukee Downtown Milwaukee, WI 53203 Jul 1999 Jul 1999 16942235 Residence Inn Milwaukee Downtown Milwaukee, WI 53203 May 2001 May 2001 131
Total Properties: 7 2105
Note: The above table indicates dates when these hotels opened and the dates when they began their current brand affiliations.
Historical Supply and Demand Graph
0100,000200,000300,000400,000500,000600,000700,000800,000900,000
20012002
20032004
20052006
Source: Smith Travel Research
Room
Nig
hts
30
40
50
60
70
80
90
100
Occu
panc
y %
Room Supply Room Demand Occupancy
It is important to note some limitations of the STR data. Hotels are occasionally added to or removed from the sample and not every property reports data in a consistent and timely manner; these factors can influence the overall quality of the information by skewing the results. These
HVS International Milwaukee Hotel Market Study Supply and Demand Analysis 4-6
inconsistencies may also cause the STR data to differ from the results of our competitive survey. Nonetheless, STR data provide the best indication of aggregate growth or decline in existing supply and demand, and thus these trends have been considered in our analysis.
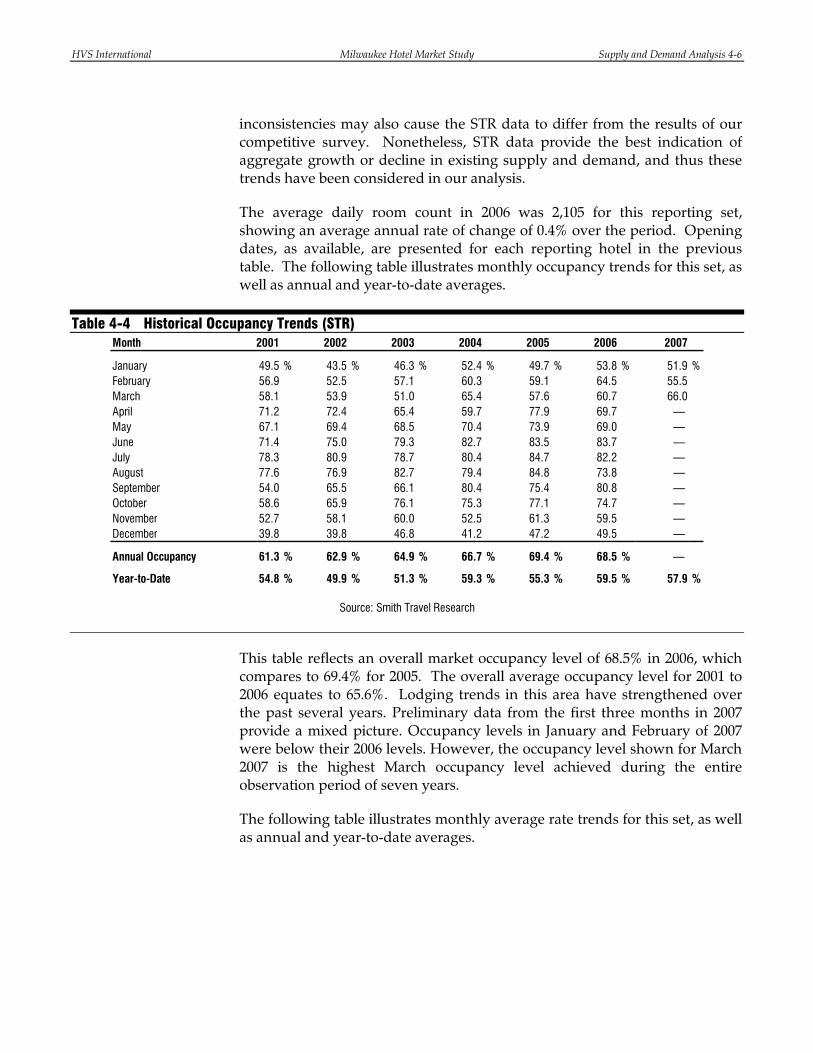
The average daily room count in 2006 was 2,105 for this reporting set, showing an average annual rate of change of 0.4% over the period. Opening dates, as available, are presented for each reporting hotel in the previous table. The following table illustrates monthly occupancy trends for this set, as well as annual and year-to-date averages.
Table 4-4 Historical Occupancy Trends (STR) Month 2001 2002 2003 2004 2005 2006 2007
January 49.5 % 43.5 % 46.3 % 52.4 % 49.7 % 53.8 % 51.9 %February 56.9 52.5 57.1 60.3 59.1 64.5 55.5March 58.1 53.9 51.0 65.4 57.6 60.7 66.0April 71.2 72.4 65.4 59.7 77.9 69.7 — May 67.1 69.4 68.5 70.4 73.9 69.0 — June 71.4 75.0 79.3 82.7 83.5 83.7 — July 78.3 80.9 78.7 80.4 84.7 82.2 — August 77.6 76.9 82.7 79.4 84.8 73.8 — September 54.0 65.5 66.1 80.4 75.4 80.8 — October 58.6 65.9 76.1 75.3 77.1 74.7 — November 52.7 58.1 60.0 52.5 61.3 59.5 — December 39.8 39.8 46.8 41.2 47.2 49.5 —
Annual Occupancy 61.3 % 62.9 % 64.9 % 66.7 % 69.4 % 68.5 % —
Year-to-Date 54.8 % 49.9 % 51.3 % 59.3 % 55.3 % 59.5 % 57.9 %
Source: Smith Travel Research
This table reflects an overall market occupancy level of 68.5% in 2006, which compares to 69.4% for 2005. The overall average occupancy level for 2001 to 2006 equates to 65.6%. Lodging trends in this area have strengthened over the past several years. Preliminary data from the first three months in 2007 provide a mixed picture. Occupancy levels in January and February of 2007 were below their 2006 levels. However, the occupancy level shown for March 2007 is the highest March occupancy level achieved during the entire observation period of seven years.
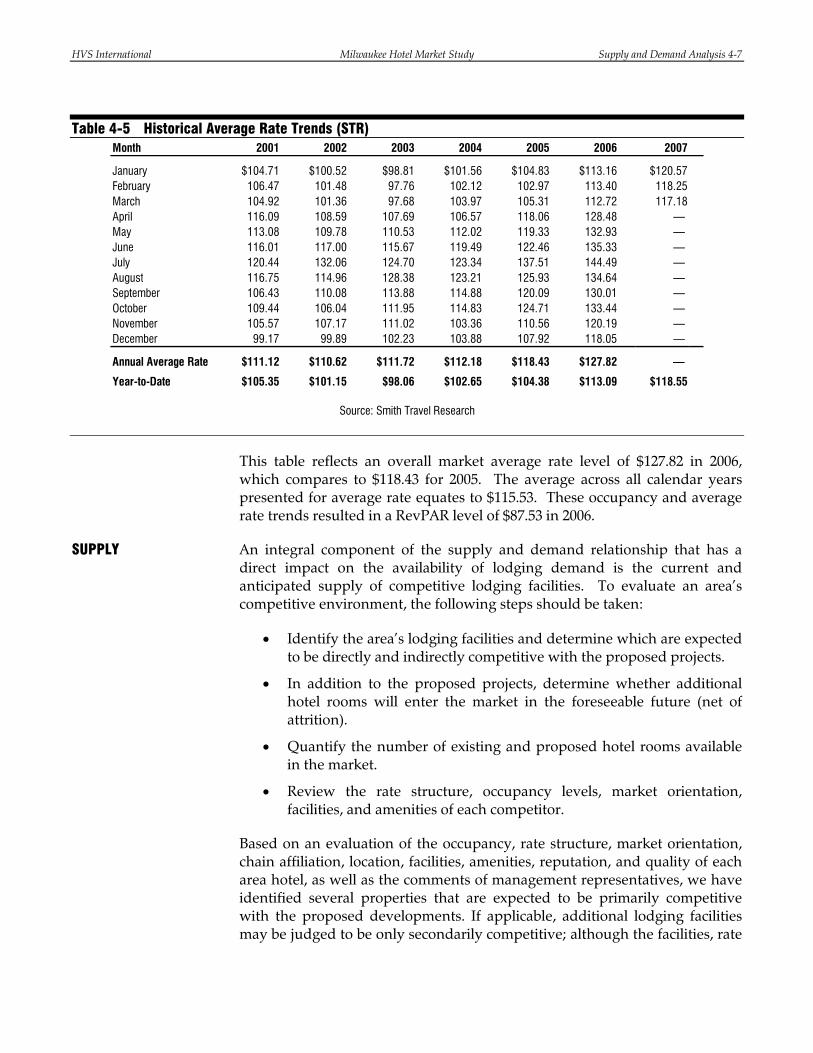
The following table illustrates monthly average rate trends for this set, as well as annual and year-to-date averages.
HVS International Milwaukee Hotel Market Study Supply and Demand Analysis 4-7
Table 4-5 Historical Average Rate Trends (STR) Month 2001 2002 2003 2004 2005 2006 2007
January $104.71 $100.52 $98.81 $101.56 $104.83 $113.16 $120.57February 106.47 101.48 97.76 102.12 102.97 113.40 118.25March 104.92 101.36 97.68 103.97 105.31 112.72 117.18April 116.09 108.59 107.69 106.57 118.06 128.48 — May 113.08 109.78 110.53 112.02 119.33 132.93 — June 116.01 117.00 115.67 119.49 122.46 135.33 — July 120.44 132.06 124.70 123.34 137.51 144.49 — August 116.75 114.96 128.38 123.21 125.93 134.64 — September 106.43 110.08 113.88 114.88 120.09 130.01 — October 109.44 106.04 111.95 114.83 124.71 133.44 — November 105.57 107.17 111.02 103.36 110.56 120.19 — December 99.17 99.89 102.23 103.88 107.92 118.05 —
Annual Average Rate $111.12 $110.62 $111.72 $112.18 $118.43 $127.82 —
Year-to-Date $105.35 $101.15 $98.06 $102.65 $104.38 $113.09 $118.55
Source: Smith Travel Research
This table reflects an overall market average rate level of $127.82 in 2006, which compares to $118.43 for 2005. The average across all calendar years presented for average rate equates to $115.53. These occupancy and average rate trends resulted in a RevPAR level of $87.53 in 2006.
An integral component of the supply and demand relationship that has a direct impact on the availability of lodging demand is the current and anticipated supply of competitive lodging facilities. To evaluate an area’s competitive environment, the following steps should be taken:
• Identify the area’s lodging facilities and determine which are expected to be directly and indirectly competitive with the proposed projects.
• In addition to the proposed projects, determine whether additional hotel rooms will enter the market in the foreseeable future (net of attrition).
• Quantify the number of existing and proposed hotel rooms available in the market.
• Review the rate structure, occupancy levels, market orientation, facilities, and amenities of each competitor.
Based on an evaluation of the occupancy, rate structure, market orientation, chain affiliation, location, facilities, amenities, reputation, and quality of each area hotel, as well as the comments of management representatives, we have identified several properties that are expected to be primarily competitive with the proposed developments. If applicable, additional lodging facilities may be judged to be only secondarily competitive; although the facilities, rate
SUPPLY
HVS International Milwaukee Hotel Market Study Supply and Demand Analysis 4-8
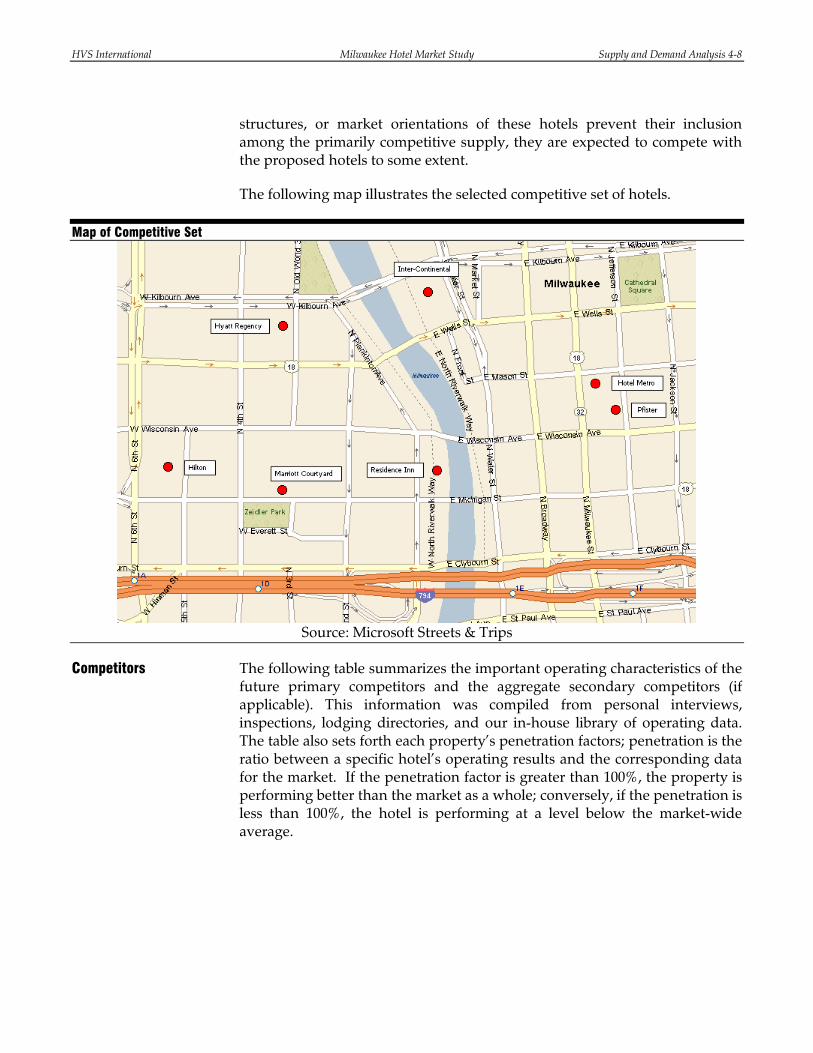
structures, or market orientations of these hotels prevent their inclusion among the primarily competitive supply, they are expected to compete with the proposed hotels to some extent.
The following map illustrates the selected competitive set of hotels.
Map of Competitive Set
Source: Microsoft Streets & Trips
The following table summarizes the important operating characteristics of the future primary competitors and the aggregate secondary competitors (if applicable). This information was compiled from personal interviews, inspections, lodging directories, and our in-house library of operating data. The table also sets forth each property’s penetration factors; penetration is the ratio between a specific hotel’s operating results and the corresponding data for the market. If the penetration factor is greater than 100%, the property is performing better than the market as a whole; conversely, if the penetration is less than 100%, the hotel is performing at a level below the market-wide average.
Competitors
HVS International Milwaukee Hotel Market Study Supply and Demand Analysis 4-9
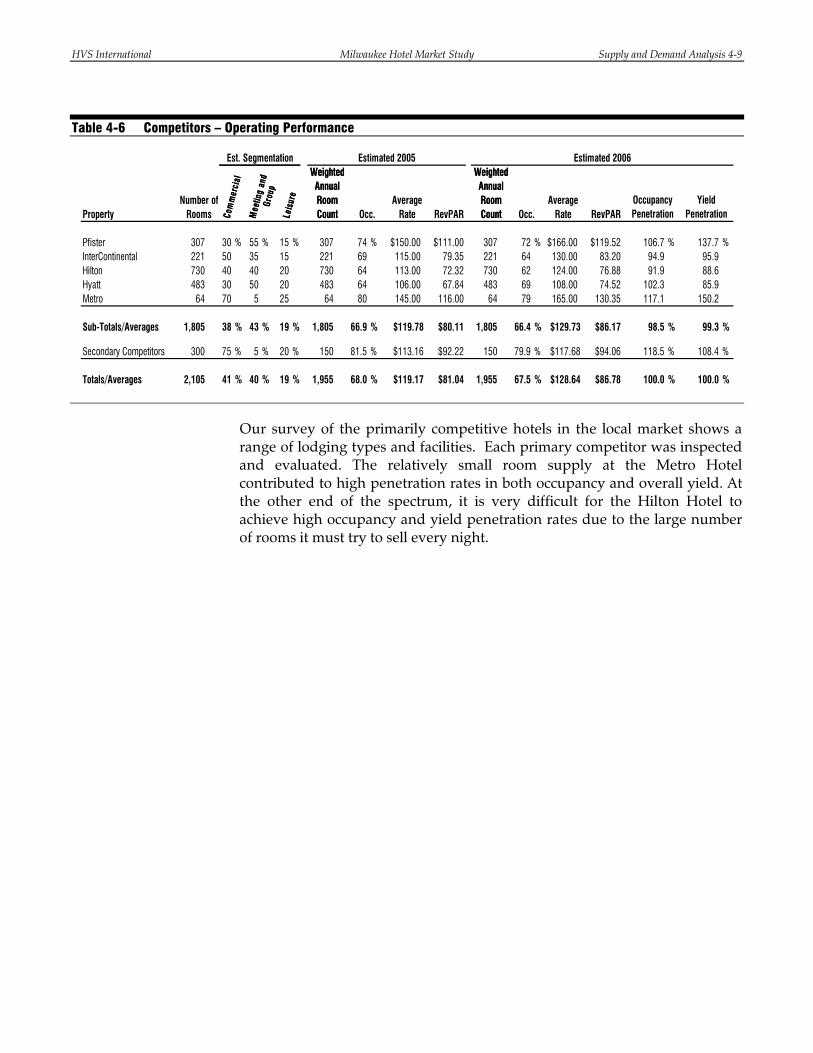
Table 4-6 Competitors – Operating Performance
Est. Segmentation Estimated 2005 Estimated 2006Weighted
Annual Room Count
Weighted Annual Room CountCo
mm
erci
al
Mee
ting
and
Grou
p
Leis
ure
Property Occ. RevPAR RevPAROccupancy Penetration
Yield Penetration
Pfister 307 30 % 55 % 15 % 307 74 % $150.00 $111.00 307 72 % $166.00 $119.52 106.7 % 137.7 %InterContinental 221 50 35 15 221 69 115.00 79.35 221 64 130.00 83.20 94.9 95.9Hilton 730 40 40 20 730 64 113.00 72.32 730 62 124.00 76.88 91.9 88.6Hyatt 483 30 50 20 483 64 106.00 67.84 483 69 108.00 74.52 102.3 85.9Metro 64 70 5 25 64 80 145.00 116.00 64 79 165.00 130.35 117.1 150.2
Sub-Totals/Averages 1,805 38 % 43 % 19 % 1,805 66.9 % $119.78 $80.11 1,805 66.4 % $129.73 $86.17 98.5 % 99.3 %
Secondary Competitors 300 75 % 5 % 20 % 150 81.5 % $113.16 $92.22 150 79.9 % $117.68 $94.06 118.5 % 108.4 %
Totals/Averages 2,105 41 % 40 % 19 % 1,955 68.0 % $119.17 $81.04 1,955 67.5 % $128.64 $86.78 100.0 % 100.0 %
Number of Rooms
Weighted Annual Room Count
Weighted Annual Room CountCo
mm
erci
al
Mee
ting
and
Grou
p
Leis
ure
Average Rate Occ.
Average Rate
Our survey of the primarily competitive hotels in the local market shows a range of lodging types and facilities. Each primary competitor was inspected and evaluated. The relatively small room supply at the Metro Hotel contributed to high penetration rates in both occupancy and overall yield. At the other end of the spectrum, it is very difficult for the Hilton Hotel to achieve high occupancy and yield penetration rates due to the large number of rooms it must try to sell every night.
HVS International Milwaukee Hotel Market Study Supply and Demand Analysis 4-10
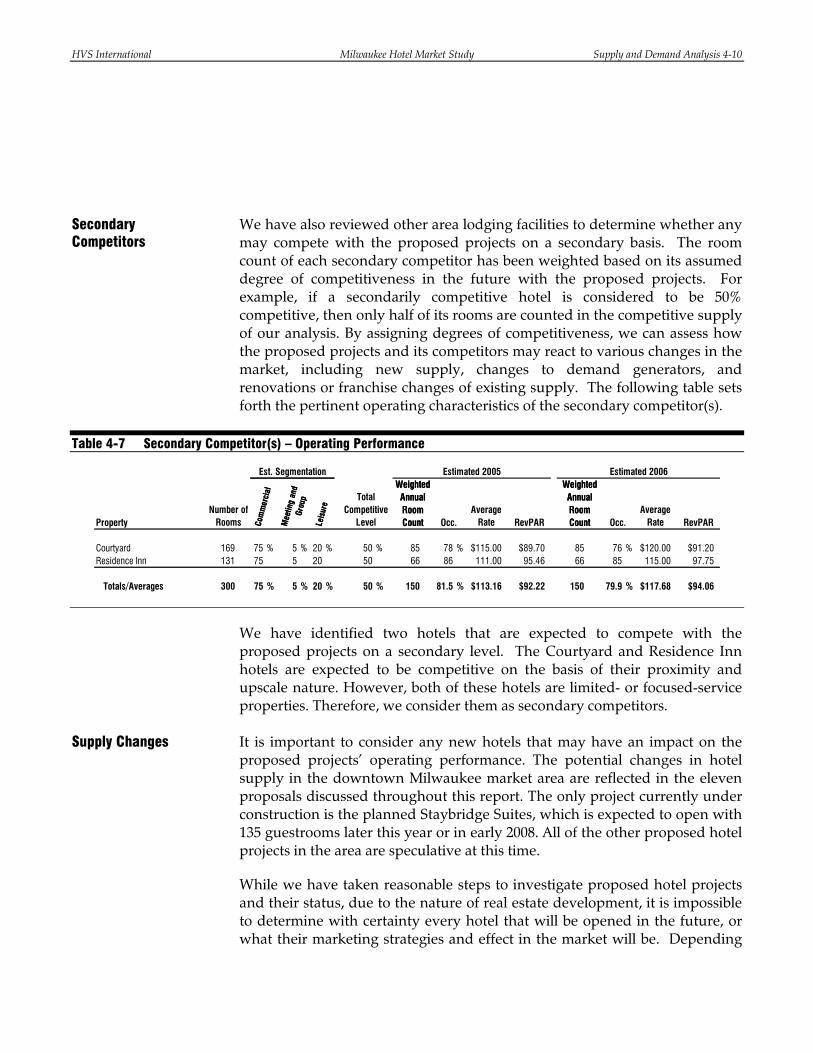
We have also reviewed other area lodging facilities to determine whether any may compete with the proposed projects on a secondary basis. The room count of each secondary competitor has been weighted based on its assumed degree of competitiveness in the future with the proposed projects. For example, if a secondarily competitive hotel is considered to be 50% competitive, then only half of its rooms are counted in the competitive supply of our analysis. By assigning degrees of competitiveness, we can assess how the proposed projects and its competitors may react to various changes in the market, including new supply, changes to demand generators, and renovations or franchise changes of existing supply. The following table sets forth the pertinent operating characteristics of the secondary competitor(s).
Table 4-7 Secondary Competitor(s) – Operating Performance
Est. Segmentation Estimated 2005 Estimated 2006
Com
mer
cial
Mee
ting
and
Grou
p
Leis
ure
Weighted Annual Room Count
Weighted Annual Room Count
Total
PropertyNumber of
RoomsCompetitive
Level Occ.Average
Rate RevPAR Occ.Average
Rate RevPAR
Courtyard 169 75 % 5 % 20 % 50 % 85 78 % $115.00 $89.70 85 76 % $120.00 $91.20Residence Inn 131 75 5 20 50 66 86 111.00 95.46 66 85 115.00 97.75
Totals/Averages 300 75 % 5 % 20 % 50 % 150 81.5 % $113.16 $92.22 150 79.9 % $117.68 $94.06
Com
mer
cial
Mee
ting
and
Grou
p
Leis
ure
Weighted Annual Room Count
Weighted Annual Room Count
We have identified two hotels that are expected to compete with the proposed projects on a secondary level. The Courtyard and Residence Inn hotels are expected to be competitive on the basis of their proximity and upscale nature. However, both of these hotels are limited- or focused-service properties. Therefore, we consider them as secondary competitors. It is important to consider any new hotels that may have an impact on the proposed projects’ operating performance. The potential changes in hotel supply in the downtown Milwaukee market area are reflected in the eleven proposals discussed throughout this report. The only project currently under construction is the planned Staybridge Suites, which is expected to open with 135 guestrooms later this year or in early 2008. All of the other proposed hotel projects in the area are speculative at this time.
While we have taken reasonable steps to investigate proposed hotel projects and their status, due to the nature of real estate development, it is impossible to determine with certainty every hotel that will be opened in the future, or what their marketing strategies and effect in the market will be. Depending
Secondary Competitors
Supply Changes
HVS International Milwaukee Hotel Market Study Supply and Demand Analysis 4-11
on the outcome of current and future projects, the future operating potential of existing area hotel properties may be positively or negatively affected. Future improvement in market conditions will raise the risk of increased competition. Our forthcoming forecast of stabilized occupancy and average rate is intended to reflect such risk.
We have identified various properties that are expected to be competitive to some degree with the existing hotel supply in downtown Milwaukee. Any of the proposed hotels that open will likely enter a dynamic market of varying product types and price points. The following analysis will present our forecast for future hotel demand, based partially on historical trends.
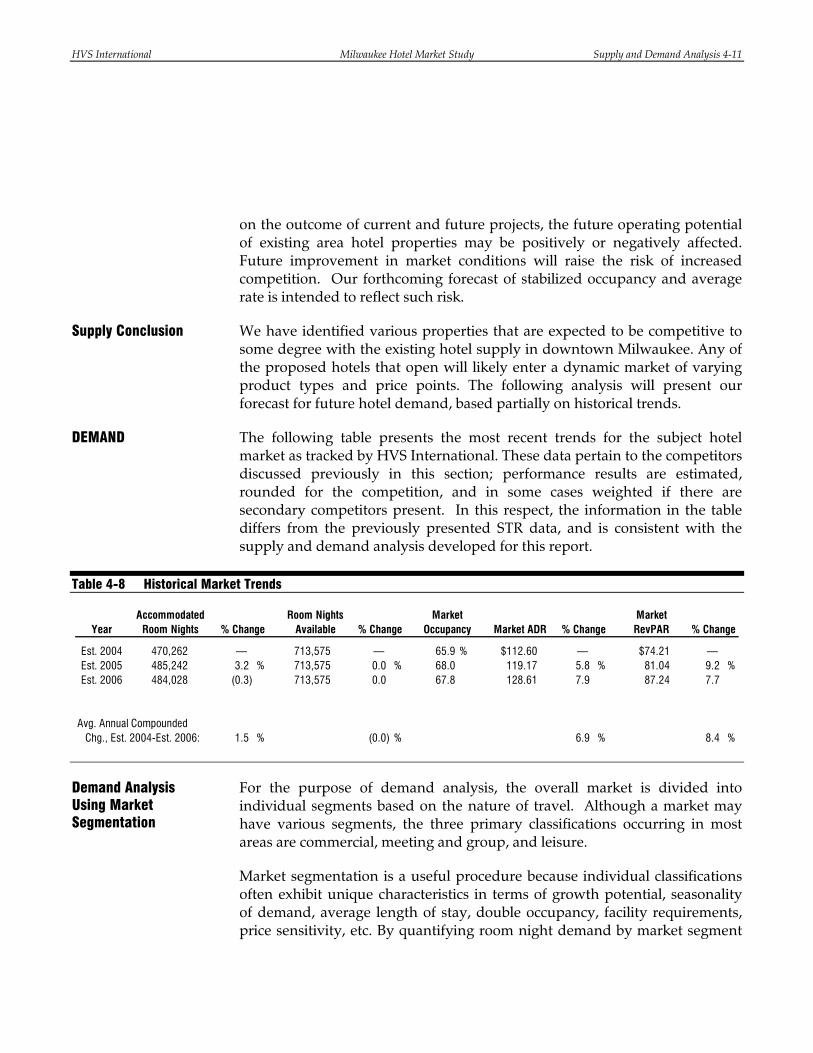
The following table presents the most recent trends for the subject hotel market as tracked by HVS International. These data pertain to the competitors discussed previously in this section; performance results are estimated, rounded for the competition, and in some cases weighted if there are secondary competitors present. In this respect, the information in the table differs from the previously presented STR data, and is consistent with the supply and demand analysis developed for this report.
Table 4-8 Historical Market Trends
Year
Est. 2004 470,262 — 713,575 — 65.9 % $112.60 — $74.21 — Est. 2005 485,242 3.2 % 713,575 0.0 % 68.0 119.17 5.8 % 81.04 9.2 %Est. 2006 484,028 (0.3) 713,575 0.0 67.8 128.61 7.9 87.24 7.7
Avg. Annual Compounded Chg., Est. 2004-Est. 2006: 1.5 % (0.0) % 6.9 % 8.4 %
Accommodated Room Nights % Change
Room Nights Available
Market RevPAR % Change% Change% Change
Market Occupancy Market ADR
For the purpose of demand analysis, the overall market is divided into individual segments based on the nature of travel. Although a market may have various segments, the three primary classifications occurring in most areas are commercial, meeting and group, and leisure.
Market segmentation is a useful procedure because individual classifications often exhibit unique characteristics in terms of growth potential, seasonality of demand, average length of stay, double occupancy, facility requirements, price sensitivity, etc. By quantifying room night demand by market segment
Supply Conclusion
DEMAND
Demand Analysis Using Market Segmentation
HVS International Milwaukee Hotel Market Study Supply and Demand Analysis 4-12
and analyzing the characteristics of each segment, the demand for transient accommodations can be projected. Lodging demand in the Milwaukee area is generated primarily by the following three market segments:
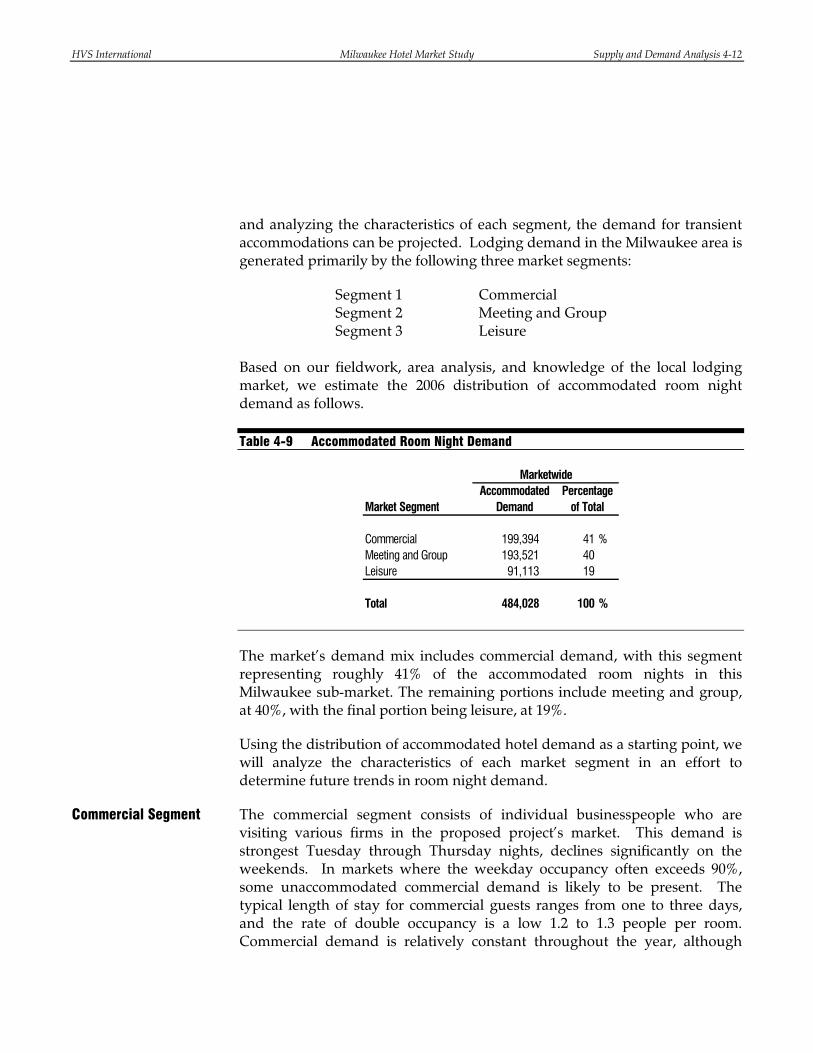
Segment 1 Commercial Segment 2 Meeting and Group Segment 3 Leisure Based on our fieldwork, area analysis, and knowledge of the local lodging market, we estimate the 2006 distribution of accommodated room night demand as follows.
Table 4-9 Accommodated Room Night Demand
Marketwide
Market Segment
Commercial 199,394 41 %Meeting and Group 193,521 40Leisure 91,113 19
Total 484,028 100 %
Percentage of Total
Accommodated Demand
The market’s demand mix includes commercial demand, with this segment representing roughly 41% of the accommodated room nights in this Milwaukee sub-market. The remaining portions include meeting and group, at 40%, with the final portion being leisure, at 19%.
Using the distribution of accommodated hotel demand as a starting point, we will analyze the characteristics of each market segment in an effort to determine future trends in room night demand.
The commercial segment consists of individual businesspeople who are visiting various firms in the proposed project’s market. This demand is strongest Tuesday through Thursday nights, declines significantly on the weekends. In markets where the weekday occupancy often exceeds 90%, some unaccommodated commercial demand is likely to be present. The typical length of stay for commercial guests ranges from one to three days, and the rate of double occupancy is a low 1.2 to 1.3 people per room. Commercial demand is relatively constant throughout the year, although
Commercial Segment
HVS International Milwaukee Hotel Market Study Supply and Demand Analysis 4-13
some declines are noticeable in late December and during other holiday periods.
The commercial segment includes numerous smaller classifications; however, the primary categories considered in this analysis are individual business travelers and high-volume corporate accounts. Most individual business travelers are visiting firms in the immediate area or passing through en route to other destinations. Their lodging choices are influenced by brand loyalty (and frequent traveler programs in particular), as well as location and convenience with respect to businesses and amenities. High-volume corporate accounts are generated by local companies; demand in this sub-segment may include employees of the firm or its affiliates, and often consists of training groups. These companies typically designate hotels as “preferred” accommodations; in return, the selected lodging facilities generally offer a significant discount from their published rates. Typically, these rates are negotiated on an annual basis, and the size of the discount is tied to the number of room nights produced.
Major factors considered in the development of our growth rates include the presence of Manpower's new headquarters development, as well as a multitude of healthcare and finance firms such as Aurora, Covenant and GE Medical. Another major presence in the market is the retail industry and companies such as Kohl's supplying thousands of jobs in the area. Local economic indicators suggest that these industries are experiencing modest growth, and this trend should continue through the near term.
All of the economic and demographic data presented as an appendix to this report have some influence on commercial lodging demand; the trends that have the most direct correlation are changes in FIRE, service, wholesale trade, and total employment; occupied office space; and air passenger counts. Considering these historical trends and the introduction of new major employers in the downtown area, we project demand change rates of 3.0% in 2007, 3.0% in 2008, and 2.5% in 2009. After these first three projection years, we have forecast demand change rates of 1.0% in 2010 and 1.0% in 2011.
The meeting and group market includes meetings, seminars, conventions, trade association shows, and similar gatherings of ten or more people. Peak convention demand typically occurs in the spring and fall. Because of vacations, the summer months represent the slowest period for this market segment; winter demand varies. Although there are numerous classifications within the meeting and group segment, the primary categories considered in
Meeting and Group Segment

HVS International Milwaukee Hotel Market Study Supply and Demand Analysis 4-14
this analysis are corporate groups, associations, and SMERFE (social, military, ethnic, religious, fraternal, and educational) groups.
Corporate groups are one of the most profitable components of this segment, because they exhibit limited price sensitivity and often sponsor banquets and other events that generate revenue for the host hotel. This demand may take the form of training programs, sales meetings, division conferences, and similar events with a business purpose. Corporate groups generally meet during the work week, thus generating lodging demand on Monday through Thursday nights. Association demand is generally divided on a geographical basis: the most common categories are national, regional, and state associations. Depending on their nature, these associations may be more rate sensitive than commercial groups. The scheduling pattern of associations also depends on the nature of the group. The SMERFE market consists of groups that are social, military, ethnic, religious, fraternal, or educational in nature. These groups are budget-conscious, and have a strong preference for weekend and summer meeting times, when rates are generally lowest.
Factors related to group demand considered in our development of growth rates for this segment include this market’s dependence on the convention center for group business throughout the year, as well as corporate group business demand tied to area business growth. Corporate meeting and group demand is considered a stable force in room-night production for local hotels. Convention demand has been somewhat stagnant in recent years, although a proposed facility expansion and recent growth in the industry could lead to a future spike in demand. Other group demand is generated by local residents with weddings, reunions, and other special events.
Future meeting and group demand is closely related to the success of the convention industry and growth in the commercial segment. Because most meetings have either a direct or an indirect business purpose, the economic considerations that have an impact on commercial travel also affect meeting and group demand. The exception is non-commercial meetings, which are tied to the economic factors that influence leisure travel. It should be noted that meetings and similar events are booked in advance, and thus growth in this segment tends to lag slightly behind increases in commercial demand. Considering these historical trends, we project demand change rates of 1.0% annually through 2011. These relatively slow projected growth rates could increase substantially if the convention center undergoes a major expansion or capital improvement in the near future or if convention demand in Milwaukee spikes for some other reason.
HVS International Milwaukee Hotel Market Study Supply and Demand Analysis 4-15
The leisure market segment consists of individuals and families who are spending time in the area or passing through en route to other destinations. Their travel purposes may include sightseeing, recreation, visiting friends and relatives, or numerous other non-business activities. Leisure demand is strongest Friday and Saturday nights and all week during holiday periods and the summer months. These peak periods are negatively correlated with commercial visitation, underscoring the stabilizing effect of capturing weekend and summer tourist travel.
The typical length of stay ranges from one to four days, depending on the destination and travel purpose, and the typical occupancy in a double room ranges from 1.8 to 2.5 people per room. Price sensitivity tends to vary with product type. All-suite properties with inclusive food and beverage will tend to drive strong leisure room rates, while highway properties with limited amenities typically offer more discounted leisure room rates.
Leisure demand in the area is primarily generated by festivals, sporting events, cultural attractions and its surrounding retail and entertainment venues. Weather is also one of the most important factors for this demand segment. During the warmer months, Milwaukee experiences dramatic increases in hotel demand. This upswing coincides with most of the major festivals, the Milwaukee Brewers' baseball season, and the summer family travel season. Growth related to these sources should continue to increase in the future as the overall population increases.
Future leisure demand is related to the overall economic health of the region and the nation. Trends showing changes in state and regional unemployment and disposable personal income often have a strong correlation to non-commercial visitation. Of the economic and demographic data presented earlier in this report, trends in retail sales, retail sector employment, total employment, and air traffic counts tend to have the strongest influence on leisure demand. Considering these historical trends, we project demand change rates of 2.0% in 2007, 2.0% in 2008, and 2.0% in 2009. After these first three projection years, we have forecast demand change rates of 1.0% in 2010 and 1.0% in 2011.
The purpose of segmenting the lodging market is to define each major type of demand, identify customer characteristics, and estimate future growth trends. Starting with an analysis of the local area, three segments were defined as representing the subject properties’ lodging market. Various types of economic and demographic data were then evaluated to determine their
Leisure Segment
Conclusion
HVS International Milwaukee Hotel Market Study Supply and Demand Analysis 4-16
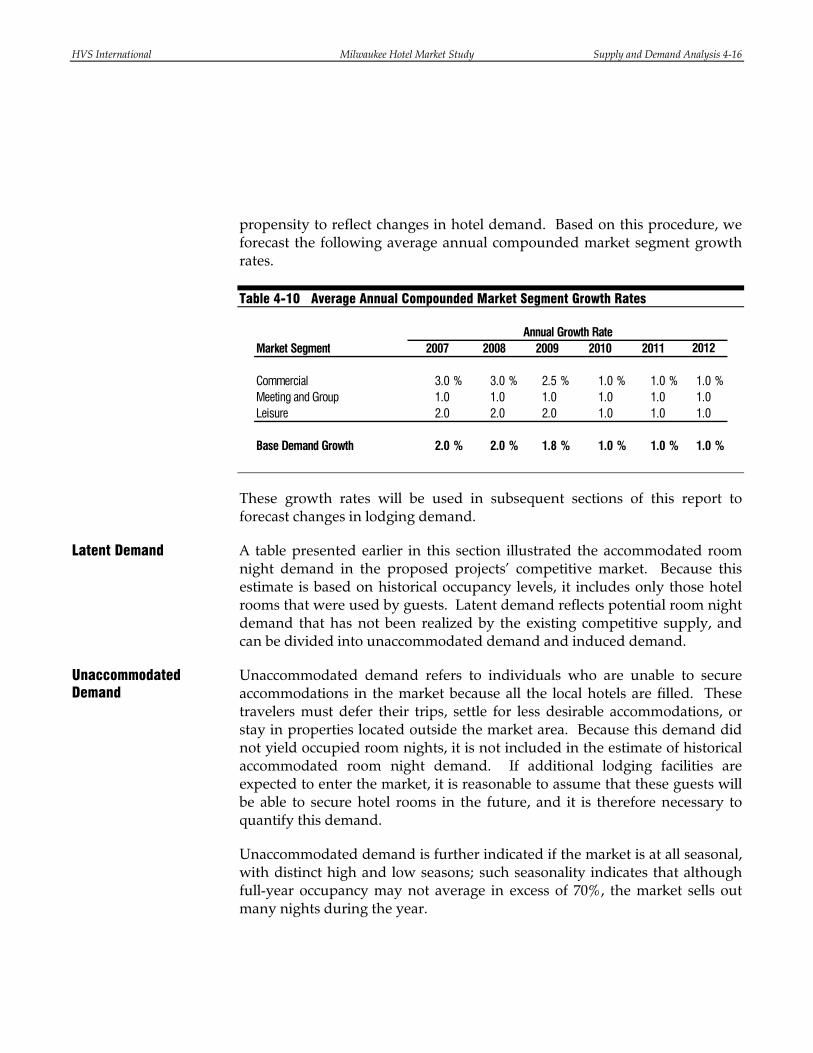
propensity to reflect changes in hotel demand. Based on this procedure, we forecast the following average annual compounded market segment growth rates.
Table 4-10 Average Annual Compounded Market Segment Growth Rates
Annual Growth RateMarket Segment
Commercial 3.0 % 3.0 % 2.5 % 1.0 % 1.0 % 1.0 %Meeting and Group 1.0 1.0 1.0 1.0 1.0 1.0Leisure 2.0 2.0 2.0 1.0 1.0 1.0
Base Demand Growth 2.0 % 2.0 % 1.8 % 1.0 % 1.0 % 1.0 %
2007 2008 2009 2010 20122011
These growth rates will be used in subsequent sections of this report to forecast changes in lodging demand.
A table presented earlier in this section illustrated the accommodated room night demand in the proposed projects’ competitive market. Because this estimate is based on historical occupancy levels, it includes only those hotel rooms that were used by guests. Latent demand reflects potential room night demand that has not been realized by the existing competitive supply, and can be divided into unaccommodated demand and induced demand.
Unaccommodated demand refers to individuals who are unable to secure accommodations in the market because all the local hotels are filled. These travelers must defer their trips, settle for less desirable accommodations, or stay in properties located outside the market area. Because this demand did not yield occupied room nights, it is not included in the estimate of historical accommodated room night demand. If additional lodging facilities are expected to enter the market, it is reasonable to assume that these guests will be able to secure hotel rooms in the future, and it is therefore necessary to quantify this demand.
Unaccommodated demand is further indicated if the market is at all seasonal, with distinct high and low seasons; such seasonality indicates that although full-year occupancy may not average in excess of 70%, the market sells out many nights during the year.
Latent Demand
Unaccommodated Demand
HVS International Milwaukee Hotel Market Study Supply and Demand Analysis 4-17
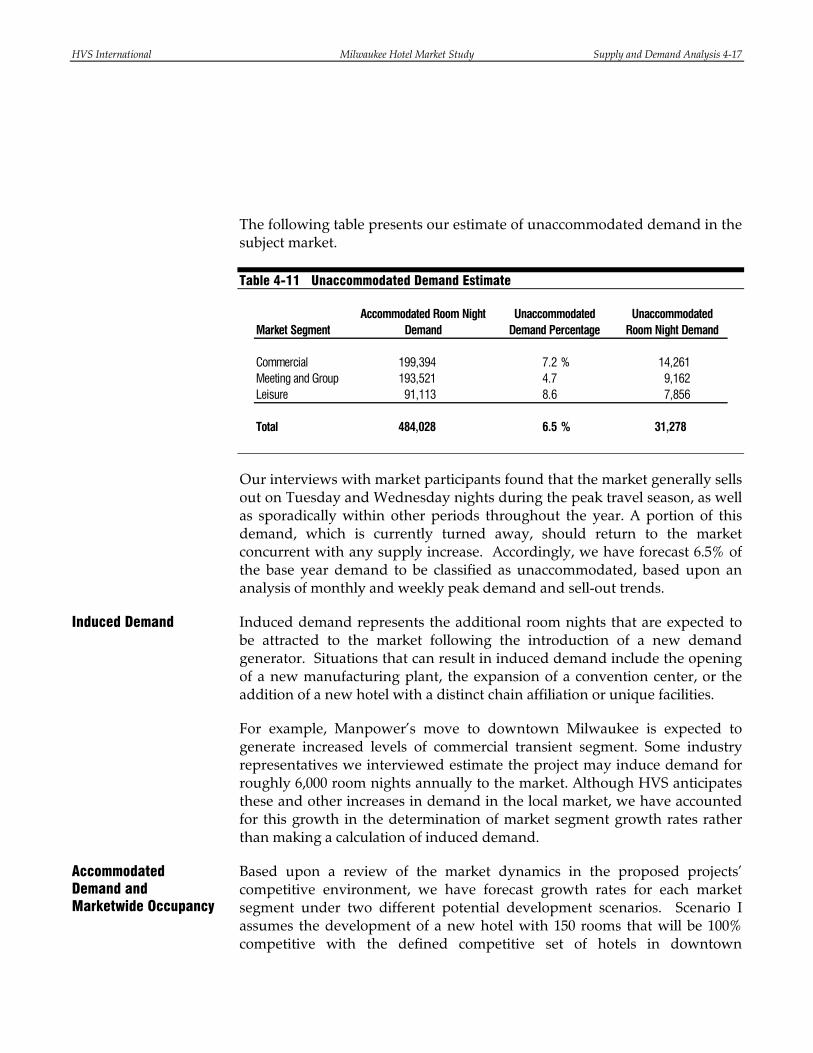
The following table presents our estimate of unaccommodated demand in the subject market.
Table 4-11 Unaccommodated Demand Estimate
Market Segment
Commercial 199,394 7.2 % 14,261Meeting and Group 193,521 4.7 9,162Leisure 91,113 8.6 7,856
Total 484,028 6.5 % 31,278
Accommodated Room Night Demand
Unaccommodated Demand Percentage
Unaccommodated Room Night Demand
Our interviews with market participants found that the market generally sells out on Tuesday and Wednesday nights during the peak travel season, as well as sporadically within other periods throughout the year. A portion of this demand, which is currently turned away, should return to the market concurrent with any supply increase. Accordingly, we have forecast 6.5% of the base year demand to be classified as unaccommodated, based upon an analysis of monthly and weekly peak demand and sell-out trends.
Induced demand represents the additional room nights that are expected to be attracted to the market following the introduction of a new demand generator. Situations that can result in induced demand include the opening of a new manufacturing plant, the expansion of a convention center, or the addition of a new hotel with a distinct chain affiliation or unique facilities.
For example, Manpower’s move to downtown Milwaukee is expected to generate increased levels of commercial transient segment. Some industry representatives we interviewed estimate the project may induce demand for roughly 6,000 room nights annually to the market. Although HVS anticipates these and other increases in demand in the local market, we have accounted for this growth in the determination of market segment growth rates rather than making a calculation of induced demand.
Based upon a review of the market dynamics in the proposed projects’ competitive environment, we have forecast growth rates for each market segment under two different potential development scenarios. Scenario I assumes the development of a new hotel with 150 rooms that will be 100% competitive with the defined competitive set of hotels in downtown
Induced Demand
Accommodated Demand and Marketwide Occupancy
HVS International Milwaukee Hotel Market Study Supply and Demand Analysis 4-18
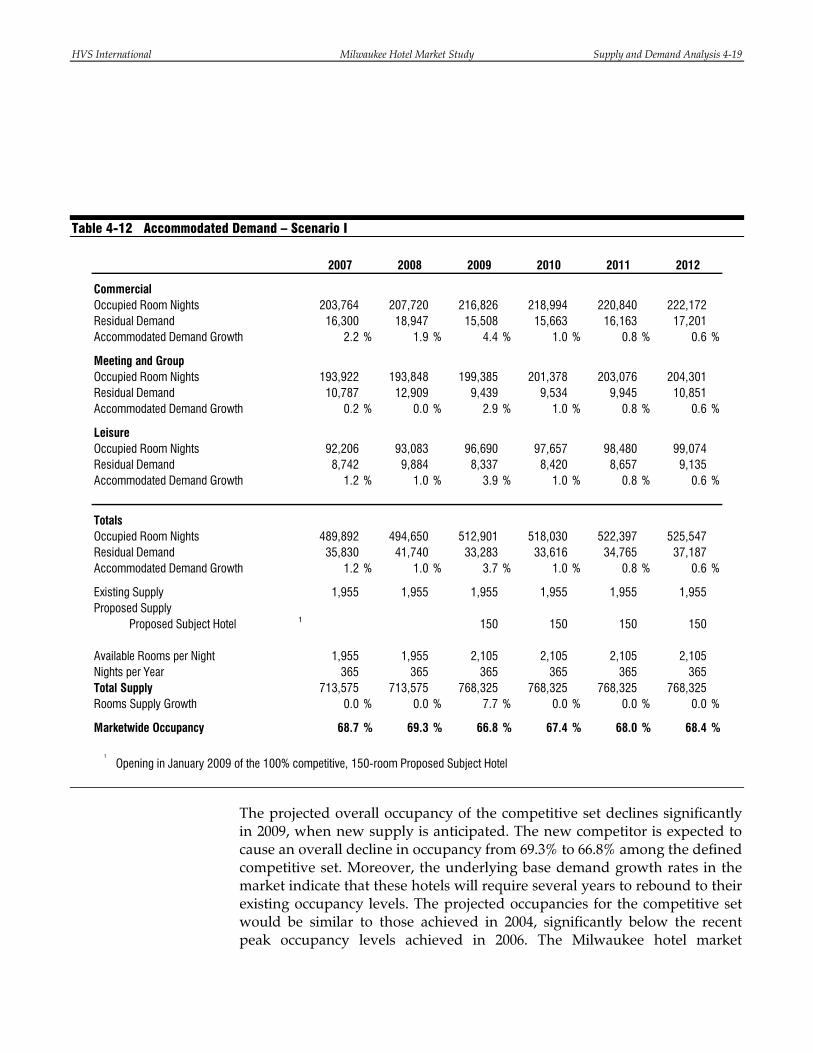
Milwaukee. Scenario II assumes the development of up to three different hotels, representing a total of 350 new hotel rooms. However, in this scenario, we assume that only 150 of these rooms will be 100% competitive with the defined set of hotels. The remaining 200 new rooms we assume will be 50% competitive. (For clarification, 200 rooms that are 50% competitive would have the same impact on the competitive set as 100 rooms that are 100% competitive.)
Using the calculated potential demand for the market, we have determined marketwide accommodated demand based on the inherent limitations of demand fluctuations and other factors in the market area.
Scenario I – The following table details our projection of lodging demand growth for the subject market, including the total number of occupied room nights and any residual unaccommodated demand in the market. This analysis assumes that one or more of the proposed hotels opens in 2009 with a total of 150 new hotel rooms supplied to the market.
HVS International Milwaukee Hotel Market Study Supply and Demand Analysis 4-19
Table 4-12 Accommodated Demand – Scenario I
203,764 207,720 216,826 218,994 220,840 222,17216,300 18,947 15,508 15,663 16,163 17,201
2.2 % 1.9 % 4.4 % 1.0 % 0.8 % 0.6 %
193,922 193,848 199,385 201,378 203,076 204,30110,787 12,909 9,439 9,534 9,945 10,851
0.2 % 0.0 % 2.9 % 1.0 % 0.8 % 0.6 %
92,206 93,083 96,690 97,657 98,480 99,0748,742 9,884 8,337 8,420 8,657 9,135
1.2 % 1.0 % 3.9 % 1.0 % 0.8 % 0.6 %
489,892 494,650 512,901 518,030 522,397 525,54735,830 41,740 33,283 33,616 34,765 37,187
1.2 % 1.0 % 3.7 % 1.0 % 0.8 % 0.6 %
1,955 1,955 1,955 1,955 1,955 1,955
Proposed Subject Hotel ¹ 150 150 150 150
Available Rooms per Night 1,955 1,955 2,105 2,105 2,105 2,105Nights per Year 365 365 365 365 365 365Total Supply 713,575 713,575 768,325 768,325 768,325 768,325Rooms Supply Growth 0.0 % 0.0 % 7.7 % 0.0 % 0.0 % 0.0 %
Marketwide Occupancy 68.7 % 69.3 % 66.8 % 67.4 % 68.0 % 68.4 %
¹ Opening in January 2009 of the 100% competitive, 150-room Proposed Subject Hotel
2010 2011 20122007 2008 2009
CommercialOccupied Room NightsResidual DemandAccommodated Demand Growth
Meeting and GroupOccupied Room NightsResidual DemandAccommodated Demand Growth
LeisureOccupied Room NightsResidual DemandAccommodated Demand Growth
Existing SupplyProposed Supply
TotalsOccupied Room NightsResidual DemandAccommodated Demand Growth
The projected overall occupancy of the competitive set declines significantly in 2009, when new supply is anticipated. The new competitor is expected to cause an overall decline in occupancy from 69.3% to 66.8% among the defined competitive set. Moreover, the underlying base demand growth rates in the market indicate that these hotels will require several years to rebound to their existing occupancy levels. The projected occupancies for the competitive set would be similar to those achieved in 2004, significantly below the recent peak occupancy levels achieved in 2006. The Milwaukee hotel market
HVS International Milwaukee Hotel Market Study Supply and Demand Analysis 4-20
currently lags behind the national average by roughly two to three occupancy points. This scenario would likely increase that margin by an additional two to three points in the near term.
Scenario II – The following table details our projection of lodging demand growth for the subject market, including the total number of occupied room nights and any residual unaccommodated demand in the market. This analysis assumes that three of the proposed hotels open in 2009 with a total of 350 new hotel rooms supplied to the market. However, we assume that only 150 of those rooms will be 100% competitive with the defined competitive set. The remaining 200 additional rooms added to supply we assume will only be 50% competitive with the competitive set, due mainly to the proposed development locations.

HVS International Milwaukee Hotel Market Study Supply and Demand Analysis 4-21
Table 4-13 Accommodated Demand – Scenario II
203,764 207,720 216,826 218,994 221,184 223,39616,300 18,947 15,508 15,663 15,819 15,977
2.2 % 1.9 % 4.4 % 1.0 % 1.0 % 1.0 %
193,922 193,848 199,385 201,378 203,392 205,42610,787 12,909 9,439 9,534 9,629 9,725
0.2 % 0.0 % 2.9 % 1.0 % 1.0 % 1.0 %
92,206 93,083 96,690 97,657 98,633 99,6208,742 9,884 8,337 8,420 8,504 8,589
1.2 % 1.0 % 3.9 % 1.0 % 1.0 % 1.0 %
489,892 494,650 512,901 518,030 523,210 528,44235,830 41,740 33,283 33,616 33,952 34,292
1.2 % 1.0 % 3.7 % 1.0 % 1.0 % 1.0 %
1,955 1,955 1,955 1,955 1,955 1,955
Proposed Subject Hotel ¹ 150 150 150 150Park East One ² 50 50 50 50Park East Two ³ 50 50 50 50
Available Rooms per Night 1,955 1,955 2,205 2,205 2,205 2,205Nights per Year 365 365 365 365 365 365Total Supply 713,575 713,575 804,825 804,825 804,825 804,825Rooms Supply Growth 0.0 % 0.0 % 12.8 % 0.0 % 0.0 % 0.0 %
Marketwide Occupancy 68.7 % 69.3 % 63.7 % 64.4 % 65.0 % 65.7 %
¹ Opening in January 2009 of the 100% competitive, 150-room Proposed Subject Hotel and 200 additional rooms that are 50% competitive.² Opening in January 2009 of the 50% competitive, 100-room Park East One³ Opening in January 2009 of the 50% competitive, 100-room Park East Two
2010 2011 20122007 2008 2009
CommercialOccupied Room NightsResidual DemandAccommodated Demand Growth
Meeting and GroupOccupied Room NightsResidual DemandAccommodated Demand Growth
LeisureOccupied Room NightsResidual DemandAccommodated Demand Growth
Existing SupplyProposed Supply
TotalsOccupied Room NightsResidual DemandAccommodated Demand Growth
The projected overall occupancy of the competitive set declines significantly in 2009, when new supply is anticipated. The new competitors are expected to cause an overall decline in occupancy from 69.3% to 63.7% among the defined competitive set. The projected occupancies for the competitive set would be similar to those achieved in 2002 or 2003, as the national economy
HVS International Milwaukee Hotel Market Study Supply and Demand Analysis 4-22
was emerging from a recession. The selected competitive set of hotels in Milwaukee currently lags behind the national average by roughly two to three occupancy points. This scenario could potentially increase that margin by an additional five points in the near term. However, this assumes all of the supply opens at the same time and that 150 rooms are 100% competitive and an additional 200 rooms are 50% competitive with the defined competitive set. Our analysis also assumes that the proposed new hotels would not induce their own demand into the market. But further research may reveal that some proposed projects, such as the Iron Horse Hotel or the Kimpton Hotel, would induce some room night demand into the market. Additional research and more detailed development plans would be required to gain a more accurate understanding of whether this outcome is likely.
The existing room supply reflects the weighted number of rooms available in the selected set of primary and secondary competitors, defined earlier in this section. Although the Staybridge Suites is expected to open this year, it is not considered competitive with the defined competitive set of hotels we analyzed in this report. Its positioning will be limited-service and extended-stay in nature. Therefore, its target market will likely be more price-sensitive and longer-term than the target market for the hotels in the competitive set.
The above room night projections for the market area were used in determining overall competitive occupancy levels in Appendix B of this study.

HVS International Milwaukee Hotel Market Study Market Area Analysis A-1
Appendix A. Market Area Analysis
The economic vitality of the market area and neighborhood surrounding a proposed hotel development is an important consideration in forecasting lodging demand and income potential. Economic and demographic trends that reflect the amount of visitation provide a basis from which to project hotel demand. The purpose of the market area analysis is to review available economic and demographic data to determine whether the local market will undergo economic growth, stabilize, or decline. In addition to predicting the direction of the economy, the rate of change must be quantified. These trends are then correlated based on their propensity to reflect variations in lodging demand, with the objective of forecasting the amount of growth or decline in transient visitation by individual market segment (e.g., commercial, meeting and group, and leisure).
The market area for a lodging facility is the geographical region where the sources of transient visitation (demand) and the competitive supply are located. The proposed properties are all located in the City of Milwaukee, the County of Milwaukee, and the State of Wisconsin.
Market Area Definition

HVS International Milwaukee Hotel Market Study Market Area Analysis A-2
Milwaukee
The subject market area can be defined by its Metropolitan Statistical Area (MSA): MILWAUKEE-WAUKESHA-WEST ALLIS, WI MSA. The MSA is the most standard definition used in comparative studies of metropolitan areas. The federal government defines an MSA as a large population nucleus, which, together with adjacent counties, has a higher degree of social integration. The following exhibit illustrates the market area and regional transportation access routes that serve the market area.
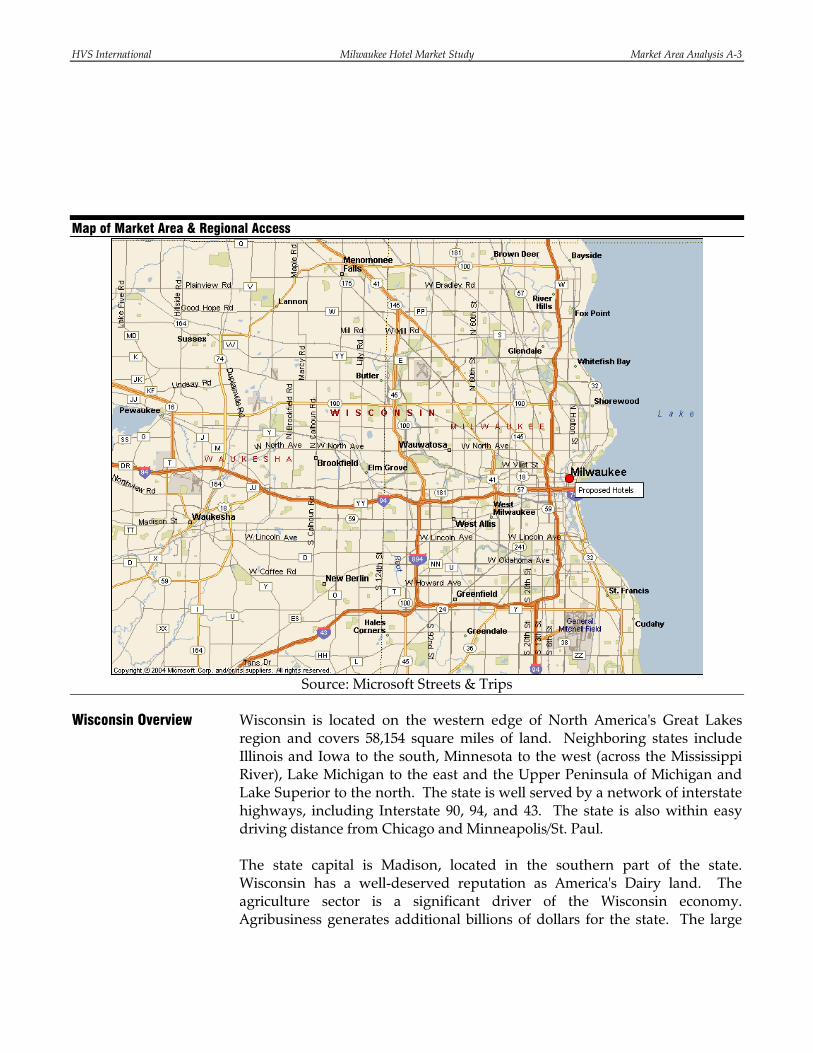
HVS International Milwaukee Hotel Market Study Market Area Analysis A-3
Map of Market Area & Regional Access
Source: Microsoft Streets & Trips
Wisconsin is located on the western edge of North America's Great Lakes region and covers 58,154 square miles of land. Neighboring states include Illinois and Iowa to the south, Minnesota to the west (across the Mississippi River), Lake Michigan to the east and the Upper Peninsula of Michigan and Lake Superior to the north. The state is well served by a network of interstate highways, including Interstate 90, 94, and 43. The state is also within easy driving distance from Chicago and Minneapolis/St. Paul. The state capital is Madison, located in the southern part of the state. Wisconsin has a well-deserved reputation as America's Dairy land. The agriculture sector is a significant driver of the Wisconsin economy. Agribusiness generates additional billions of dollars for the state. The large
Wisconsin Overview
HVS International Milwaukee Hotel Market Study Market Area Analysis A-4
volume of goods moving from Wisconsin farms provides employment to thousands of workers who transport, process, and market food products. Based on fieldwork conducted in the area and our in-house sources, we have evaluated various economic and demographic statistics to determine trends in lodging demand. A primary source of economic and demographic statistics used in this analysis is the Complete Economic and Demographic Data Source published by Woods & Poole Economics, Inc. – a well-regarded forecasting service based in Washington, DC. Using a database containing more than 300 variables for each county in the nation, Woods & Poole employs a sophisticated regional model to forecast economic and demographic trends. Historical statistics are based on census data and information published by the Bureau of Economic Analysis. Projections are formulated by Woods & Poole, and all dollar amounts have been adjusted for inflation, thus reflecting real change. This data is summarized in the following table.
Economic and Demographic Review
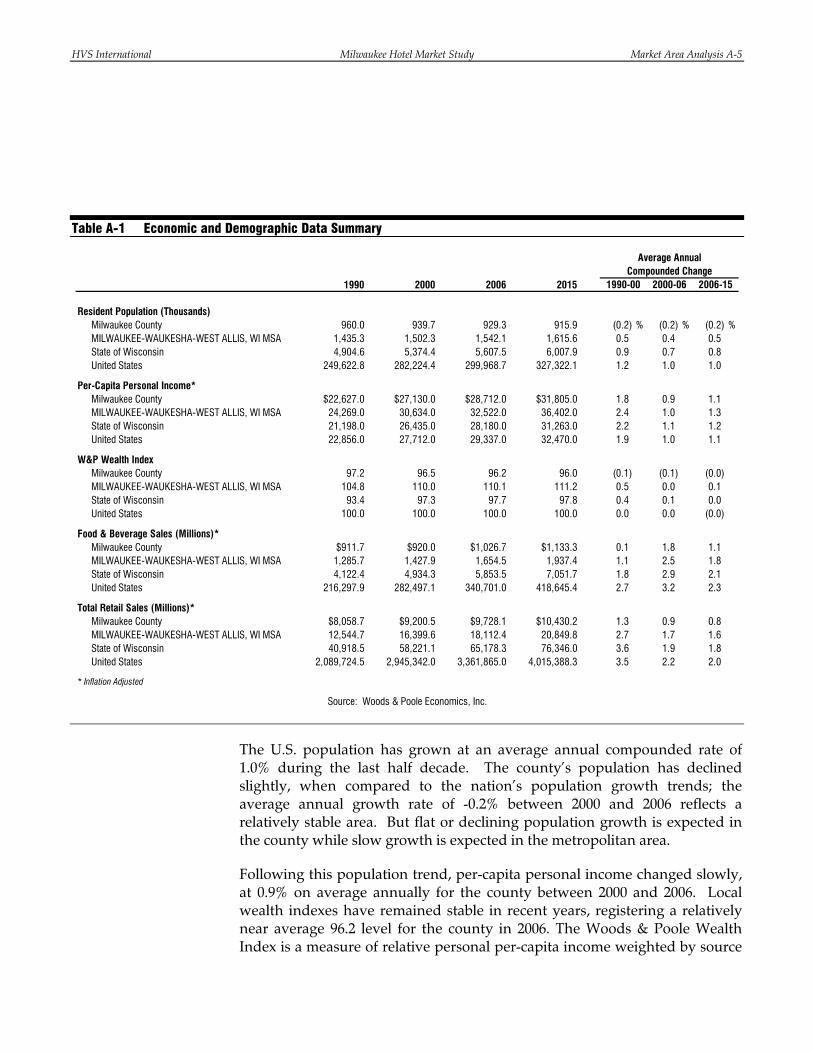
HVS International Milwaukee Hotel Market Study Market Area Analysis A-5
Table A-1 Economic and Demographic Data Summary
Average AnnualCompounded Change
1990 2000 2006 2015 1990-00 2000-06 2006-15
Resident Population (Thousands)Milwaukee County 960.0 939.7 929.3 915.9 (0.2) % (0.2) % (0.2) %MILWAUKEE-WAUKESHA-WEST ALLIS, WI MSA 1,435.3 1,502.3 1,542.1 1,615.6 0.5 0.4 0.5State of Wisconsin 4,904.6 5,374.4 5,607.5 6,007.9 0.9 0.7 0.8United States 249,622.8 282,224.4 299,968.7 327,322.1 1.2 1.0 1.0
Per-Capita Personal Income*Milwaukee County $22,627.0 $27,130.0 $28,712.0 $31,805.0 1.8 0.9 1.1MILWAUKEE-WAUKESHA-WEST ALLIS, WI MSA 24,269.0 30,634.0 32,522.0 36,402.0 2.4 1.0 1.3State of Wisconsin 21,198.0 26,435.0 28,180.0 31,263.0 2.2 1.1 1.2United States 22,856.0 27,712.0 29,337.0 32,470.0 1.9 1.0 1.1
W&P Wealth IndexMilwaukee County 97.2 96.5 96.2 96.0 (0.1) (0.1) (0.0)MILWAUKEE-WAUKESHA-WEST ALLIS, WI MSA 104.8 110.0 110.1 111.2 0.5 0.0 0.1State of Wisconsin 93.4 97.3 97.7 97.8 0.4 0.1 0.0United States 100.0 100.0 100.0 100.0 0.0 0.0 (0.0)
Food & Beverage Sales (Millions)*Milwaukee County $911.7 $920.0 $1,026.7 $1,133.3 0.1 1.8 1.1MILWAUKEE-WAUKESHA-WEST ALLIS, WI MSA 1,285.7 1,427.9 1,654.5 1,937.4 1.1 2.5 1.8State of Wisconsin 4,122.4 4,934.3 5,853.5 7,051.7 1.8 2.9 2.1United States 216,297.9 282,497.1 340,701.0 418,645.4 2.7 3.2 2.3
Total Retail Sales (Millions)*Milwaukee County $8,058.7 $9,200.5 $9,728.1 $10,430.2 1.3 0.9 0.8MILWAUKEE-WAUKESHA-WEST ALLIS, WI MSA 12,544.7 16,399.6 18,112.4 20,849.8 2.7 1.7 1.6State of Wisconsin 40,918.5 58,221.1 65,178.3 76,346.0 3.6 1.9 1.8United States 2,089,724.5 2,945,342.0 3,361,865.0 4,015,388.3 3.5 2.2 2.0
* Inflation Adjusted
Source: Woods & Poole Economics, Inc.
The U.S. population has grown at an average annual compounded rate of 1.0% during the last half decade. The county’s population has declined slightly, when compared to the nation’s population growth trends; the average annual growth rate of -0.2% between 2000 and 2006 reflects a relatively stable area. But flat or declining population growth is expected in the county while slow growth is expected in the metropolitan area.
Following this population trend, per-capita personal income changed slowly, at 0.9% on average annually for the county between 2000 and 2006. Local wealth indexes have remained stable in recent years, registering a relatively near average 96.2 level for the county in 2006. The Woods & Poole Wealth Index is a measure of relative personal per-capita income weighted by source
HVS International Milwaukee Hotel Market Study Market Area Analysis A-6
of income. It is higher in places where residents derive a relatively larger portion of their income from dividends, interest, and rent, since these income sources correlate with assets. It is lower in places where relatively more income comes from transfer payments, because people who receive benefits from government programs tend to have low net worth.
Food and beverage sales and retail sales continue to show positive change within the county, the state, and the nation; a continued 1.1% average annual growth rate is anticipated for the county’s food and beverage sales in 2006 through 2010. A modestly slower 0.8% positive average annual change is expected in county retail sales through 2010.
The characteristics of an area's workforce provide an indication of the type and amount of transient visitation likely to be generated by local businesses. Sectors such as finance, insurance, and real estate (FIRE); wholesale trade; and services produce a considerable number of visitors who are not particularly rate sensitive. The government sector often generates transient room nights, but per-diem reimbursement allowances often limit the accommodations selection to budget and mid-priced lodging facilities. Contributions from manufacturing, construction, transportation, communications, and public utilities (TCPU) employers can also be important, depending on the company type.
The following table sets forth the local county workforce distribution by business sector in 1990, 2000, and 2006, as well as a forecast for 2015.
Work Force Characteristics
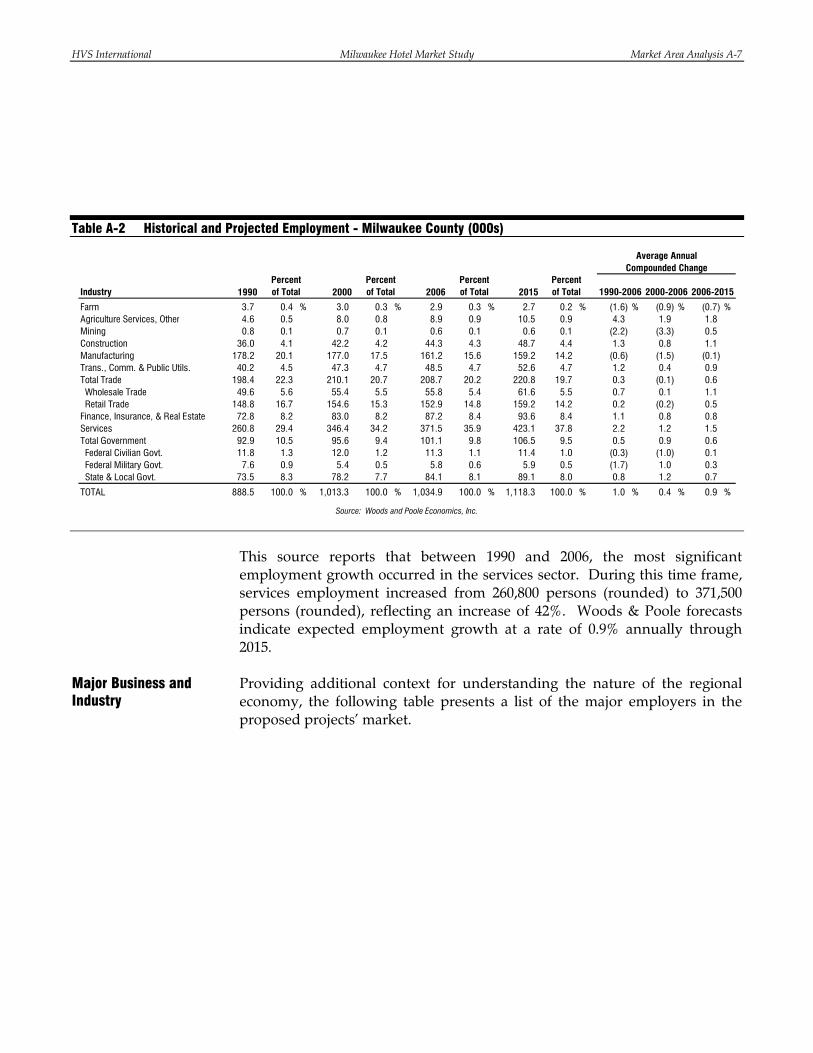
HVS International Milwaukee Hotel Market Study Market Area Analysis A-7
Table A-2 Historical and Projected Employment - Milwaukee County (000s)
Average AnnualCompounded Change
Percent Percent Percent PercentIndustry 1990 of Total 2000 of Total 2006 of Total 2015 of Total
Farm 3.7 0.4 % 3.0 0.3 % 2.9 0.3 % 2.7 0.2 % (1.6) % (0.9) % (0.7) %Agriculture Services, Other 4.6 0.5 8.0 0.8 8.9 0.9 10.5 0.9 4.3 1.9 1.8Mining 0.8 0.1 0.7 0.1 0.6 0.1 0.6 0.1 (2.2) (3.3) 0.5Construction 36.0 4.1 42.2 4.2 44.3 4.3 48.7 4.4 1.3 0.8 1.1Manufacturing 178.2 20.1 177.0 17.5 161.2 15.6 159.2 14.2 (0.6) (1.5) (0.1)Trans., Comm. & Public Utils. 40.2 4.5 47.3 4.7 48.5 4.7 52.6 4.7 1.2 0.4 0.9Total Trade 198.4 22.3 210.1 20.7 208.7 20.2 220.8 19.7 0.3 (0.1) 0.6 Wholesale Trade 49.6 5.6 55.4 5.5 55.8 5.4 61.6 5.5 0.7 0.1 1.1 Retail Trade 148.8 16.7 154.6 15.3 152.9 14.8 159.2 14.2 0.2 (0.2) 0.5Finance, Insurance, & Real Estate 72.8 8.2 83.0 8.2 87.2 8.4 93.6 8.4 1.1 0.8 0.8Services 260.8 29.4 346.4 34.2 371.5 35.9 423.1 37.8 2.2 1.2 1.5Total Government 92.9 10.5 95.6 9.4 101.1 9.8 106.5 9.5 0.5 0.9 0.6 Federal Civilian Govt. 11.8 1.3 12.0 1.2 11.3 1.1 11.4 1.0 (0.3) (1.0) 0.1 Federal Military Govt. 7.6 0.9 5.4 0.5 5.8 0.6 5.9 0.5 (1.7) 1.0 0.3 State & Local Govt. 73.5 8.3 78.2 7.7 84.1 8.1 89.1 8.0 0.8 1.2 0.7
TOTAL 888.5 100.0 % 1,013.3 100.0 % 1,034.9 100.0 % 1,118.3 100.0 % 1.0 % 0.4 % 0.9 %
Source: Woods and Poole Economics, Inc.
1990-2006 2000-2006 2006-2015
This source reports that between 1990 and 2006, the most significant employment growth occurred in the services sector. During this time frame, services employment increased from 260,800 persons (rounded) to 371,500 persons (rounded), reflecting an increase of 42%. Woods & Poole forecasts indicate expected employment growth at a rate of 0.9% annually through 2015. Providing additional context for understanding the nature of the regional economy, the following table presents a list of the major employers in the proposed projects’ market.
Major Business and Industry
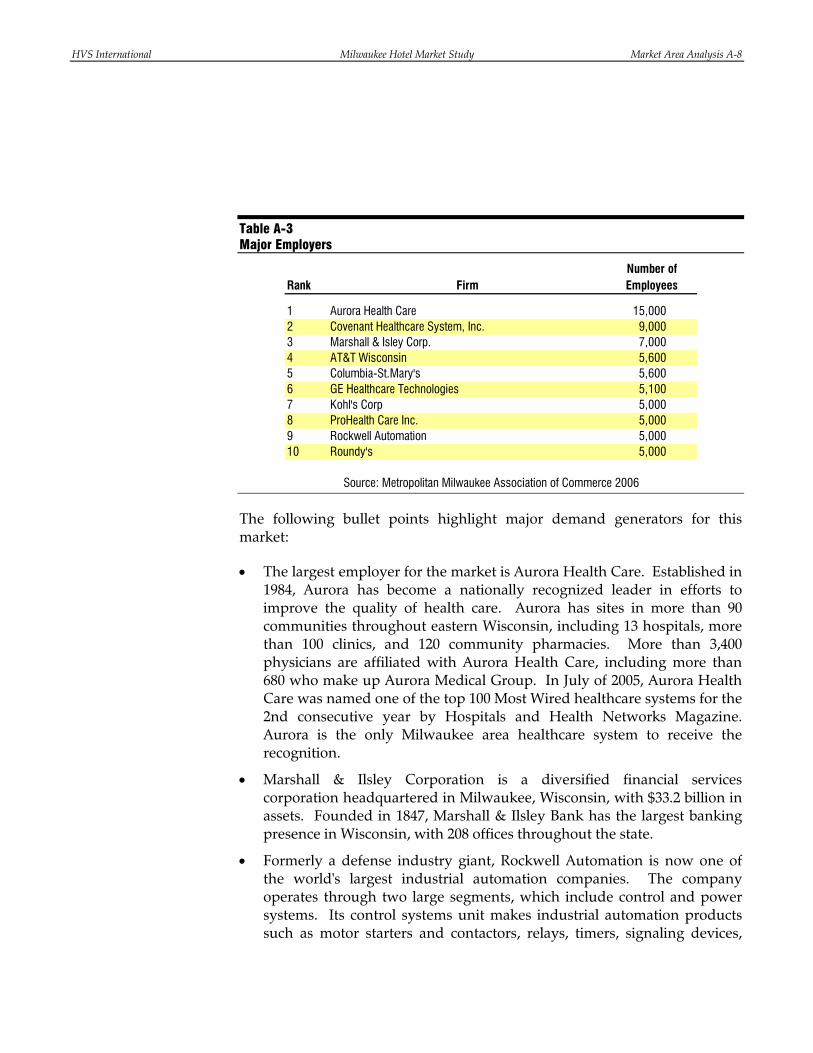
HVS International Milwaukee Hotel Market Study Market Area Analysis A-8
Table A-3 Major Employers
Number ofRank Firm Employees
1 Aurora Health Care 15,0002 Covenant Healthcare System, Inc. 9,0003 Marshall & Isley Corp. 7,0004 AT&T Wisconsin 5,6005 Columbia-St.Mary's 5,6006 GE Healthcare Technologies 5,1007 Kohl's Corp 5,0008 ProHealth Care Inc. 5,0009 Rockwell Automation 5,00010 Roundy's 5,000
Source: Metropolitan Milwaukee Association of Commerce 2006
The following bullet points highlight major demand generators for this market:
• The largest employer for the market is Aurora Health Care. Established in 1984, Aurora has become a nationally recognized leader in efforts to improve the quality of health care. Aurora has sites in more than 90 communities throughout eastern Wisconsin, including 13 hospitals, more than 100 clinics, and 120 community pharmacies. More than 3,400 physicians are affiliated with Aurora Health Care, including more than 680 who make up Aurora Medical Group. In July of 2005, Aurora Health Care was named one of the top 100 Most Wired healthcare systems for the 2nd consecutive year by Hospitals and Health Networks Magazine. Aurora is the only Milwaukee area healthcare system to receive the recognition.
• Marshall & Ilsley Corporation is a diversified financial services corporation headquartered in Milwaukee, Wisconsin, with $33.2 billion in assets. Founded in 1847, Marshall & Ilsley Bank has the largest banking presence in Wisconsin, with 208 offices throughout the state.
• Formerly a defense industry giant, Rockwell Automation is now one of the world's largest industrial automation companies. The company operates through two large segments, which include control and power systems. Its control systems unit makes industrial automation products such as motor starters and contactors, relays, timers, signaling devices,
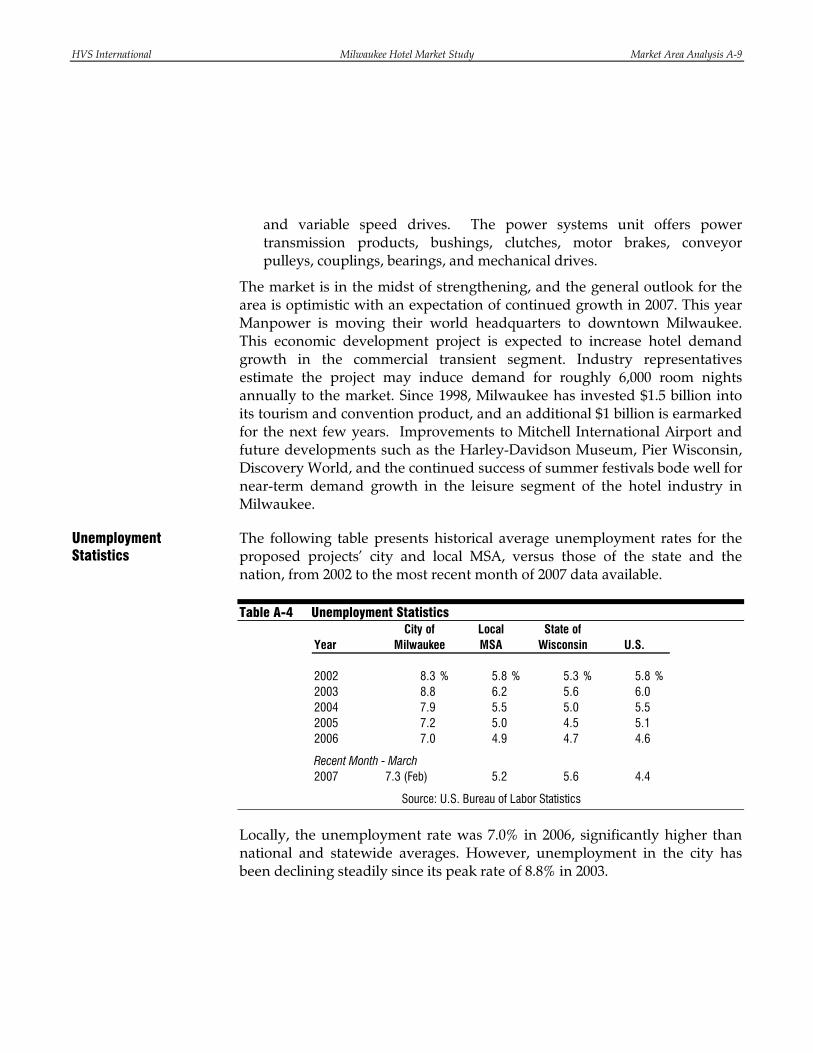
HVS International Milwaukee Hotel Market Study Market Area Analysis A-9
and variable speed drives. The power systems unit offers power transmission products, bushings, clutches, motor brakes, conveyor pulleys, couplings, bearings, and mechanical drives.
The market is in the midst of strengthening, and the general outlook for the area is optimistic with an expectation of continued growth in 2007. This year Manpower is moving their world headquarters to downtown Milwaukee. This economic development project is expected to increase hotel demand growth in the commercial transient segment. Industry representatives estimate the project may induce demand for roughly 6,000 room nights annually to the market. Since 1998, Milwaukee has invested $1.5 billion into its tourism and convention product, and an additional $1 billion is earmarked for the next few years. Improvements to Mitchell International Airport and future developments such as the Harley-Davidson Museum, Pier Wisconsin, Discovery World, and the continued success of summer festivals bode well for near-term demand growth in the leisure segment of the hotel industry in Milwaukee.
The following table presents historical average unemployment rates for the proposed projects’ city and local MSA, versus those of the state and the nation, from 2002 to the most recent month of 2007 data available.
Table A-4 Unemployment Statistics
Year
2002 8.3 % 5.8 % 5.3 % 5.8 %2003 8.8 6.2 5.6 6.02004 7.9 5.5 5.0 5.52005 7.2 5.0 4.5 5.12006 7.0 4.9 4.7 4.6
Recent Month - March2007 7.3 (Feb) 5.2 5.6 4.4
Source: U.S. Bureau of Labor Statistics
Milwaukee MSA Wisconsin U.S.City of Local State of
Locally, the unemployment rate was 7.0% in 2006, significantly higher than national and statewide averages. However, unemployment in the city has been declining steadily since its peak rate of 8.8% in 2003.
Unemployment Statistics

HVS International Milwaukee Hotel Market Study Market Area Analysis A-10
A convention center serves as a gauge of visitation trends to a particular market. Convention centers also generate significant levels of demand for area hotels and serve as a focal point for community activity. Typically, hotels serving as headquarters for an event benefit the most, by way of premium rates and the hosting of related banquet events. During the largest of conventions, peripheral hotels may benefit from compression within the city as a whole.
The Midwest Airlines Center accommodates conventions and large meetings in the Milwaukee area. This facility opened on July 24, 1998 and was fully completed on December 31, 1999. The facility contains an approximate 37,500-square-foot ballroom, 28 meeting rooms, and an approximate 189,000-square-foot exhibit hall. The original plans for the center called for an expansion in 2005 of approximately 100,000 square feet of exhibit space, meeting rooms, dining rooms, and additional underground parking. At this time, the expansion plans are on hold pending improvement of the national convention market.
Midwest Airlines Center
The following table illustrates recent use statistics for this facility.
Convention Activity
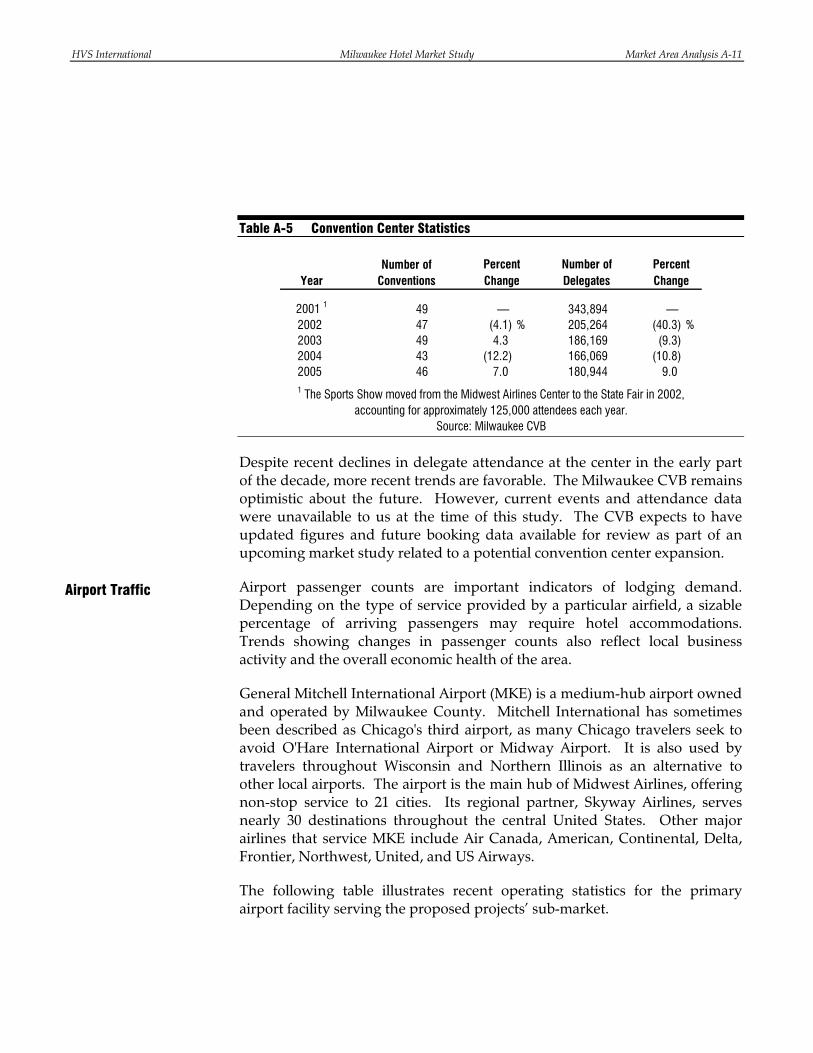
HVS International Milwaukee Hotel Market Study Market Area Analysis A-11
Table A-5 Convention Center Statistics
Percent Number of PercentYear Change Delegates Change
2001 1 49 — 343,894 — 2002 47 (4.1) % 205,264 (40.3) %2003 49 4.3 186,169 (9.3)2004 43 (12.2) 166,069 (10.8)2005 46 7.0 180,944 9.01 The Sports Show moved from the Midwest Airlines Center to the State Fair in 2002,
accounting for approximately 125,000 attendees each year.
Number ofConventions
Source: Milwaukee CVB
Despite recent declines in delegate attendance at the center in the early part of the decade, more recent trends are favorable. The Milwaukee CVB remains optimistic about the future. However, current events and attendance data were unavailable to us at the time of this study. The CVB expects to have updated figures and future booking data available for review as part of an upcoming market study related to a potential convention center expansion.
Airport passenger counts are important indicators of lodging demand. Depending on the type of service provided by a particular airfield, a sizable percentage of arriving passengers may require hotel accommodations. Trends showing changes in passenger counts also reflect local business activity and the overall economic health of the area.
General Mitchell International Airport (MKE) is a medium-hub airport owned and operated by Milwaukee County. Mitchell International has sometimes been described as Chicago's third airport, as many Chicago travelers seek to avoid O'Hare International Airport or Midway Airport. It is also used by travelers throughout Wisconsin and Northern Illinois as an alternative to other local airports. The airport is the main hub of Midwest Airlines, offering non-stop service to 21 cities. Its regional partner, Skyway Airlines, serves nearly 30 destinations throughout the central United States. Other major airlines that service MKE include Air Canada, American, Continental, Delta, Frontier, Northwest, United, and US Airways.
The following table illustrates recent operating statistics for the primary airport facility serving the proposed projects’ sub-market.
Airport Traffic
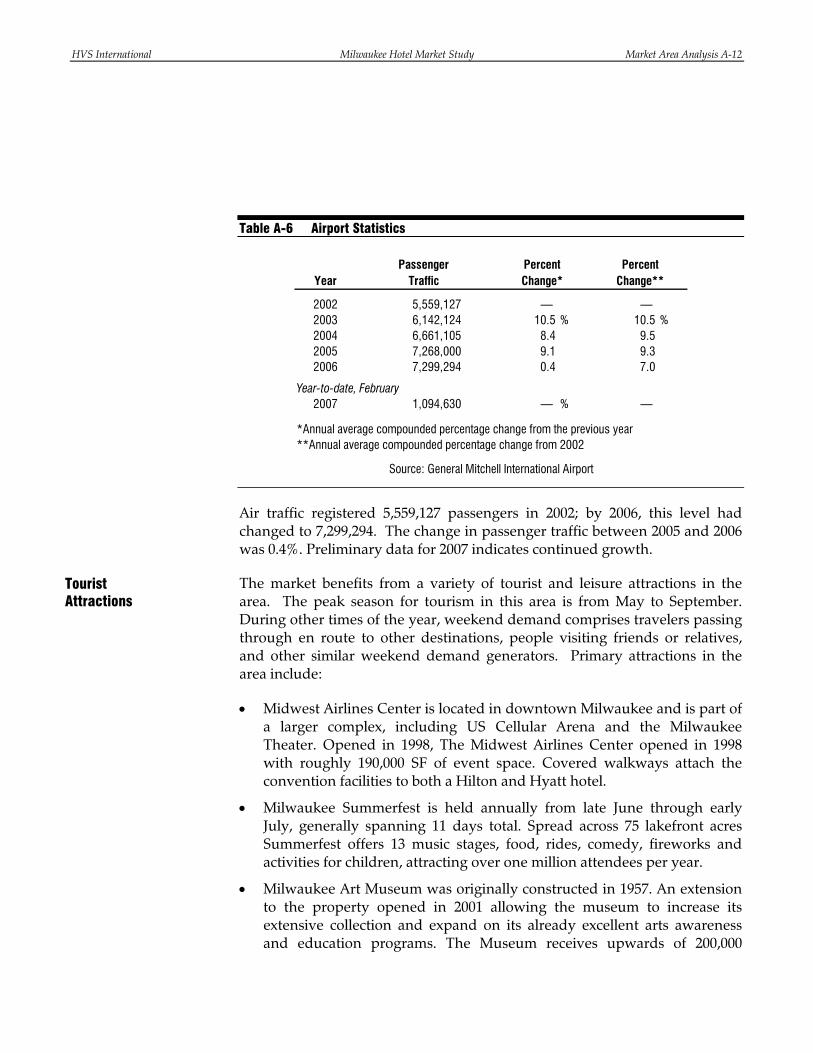
HVS International Milwaukee Hotel Market Study Market Area Analysis A-12
Table A-6 Airport Statistics
Year
2002 5,559,127 — — 2003 6,142,124 10.5 % 10.5 %2004 6,661,105 8.4 9.52005 7,268,000 9.1 9.32006 7,299,294 0.4 7.0
Year-to-date, February2007 1,094,630 — % —
*Annual average compounded percentage change from the previous year**Annual average compounded percentage change from 2002
TrafficPassenger
Source: General Mitchell International Airport
Percent PercentChange* Change**
Air traffic registered 5,559,127 passengers in 2002; by 2006, this level had changed to 7,299,294. The change in passenger traffic between 2005 and 2006 was 0.4%. Preliminary data for 2007 indicates continued growth.
The market benefits from a variety of tourist and leisure attractions in the area. The peak season for tourism in this area is from May to September. During other times of the year, weekend demand comprises travelers passing through en route to other destinations, people visiting friends or relatives, and other similar weekend demand generators. Primary attractions in the area include:
• Midwest Airlines Center is located in downtown Milwaukee and is part of a larger complex, including US Cellular Arena and the Milwaukee Theater. Opened in 1998, The Midwest Airlines Center opened in 1998 with roughly 190,000 SF of event space. Covered walkways attach the convention facilities to both a Hilton and Hyatt hotel.
• Milwaukee Summerfest is held annually from late June through early July, generally spanning 11 days total. Spread across 75 lakefront acres Summerfest offers 13 music stages, food, rides, comedy, fireworks and activities for children, attracting over one million attendees per year.
• Milwaukee Art Museum was originally constructed in 1957. An extension to the property opened in 2001 allowing the museum to increase its extensive collection and expand on its already excellent arts awareness and education programs. The Museum receives upwards of 200,000
Tourist Attractions
HVS International Milwaukee Hotel Market Study Market Area Analysis A-13
visitors per year and contains about 20,000 works of art from antiquity to the present.
• Miller Park is a major league baseball stadium, home to the Milwaukee Brewers. The Park officially opened in 2001 and features a fully retractable roof.
This section discussed a wide variety of economic indicators for the pertinent market area. The area was subject to an economic correction earlier this decade, concurrent with the rest of the nation. Recent indicators and our market interviews and research show improvement. Population growth is projected to be slow in the area. But the outlook for the area is generally favorable, and real growth should continue through the near term.
Conclusion
HVS International Milwaukee Hotel Market Study Projection of Occupancy and Average Rate B-1
Appendix B. Projection of Occupancy and Rate
This section provides an analysis of occupancy and average rate for a proposed new upscale hotel with 150 guestrooms to be located in downtown Milwaukee. We roughly model the occupancy and average rate analysis in this chapter based on the Ghazi development proposal. But the analysis we develop in this section could be applied to any of the other projects if we make certain adjustments. We assume the proposed new hotel opens in 2009. The purpose of this analysis is to model the most likely effects such a development can reasonably be expected to have on the existing defined competitive set of hotels described in the previous section of this report.
The proposed projects’ forecasted market share and occupancy levels are based upon its anticipated competitive position within the market, as quantified by its penetration rate. The penetration rate is the ratio of a property's market share to its fair share. A complete discussion of the concept of penetration is presented in the appendices.
In the following table, the penetration rates attained by the primary competitors and the aggregate secondary competitors are set forth for each segment for the base year.
Table B-1 Historical Penetration Rates
Property
Pfister 77 % 146 % 85 % 106 %InterContinental 115 83 75 94Hilton 90 93 99 93Hyatt 74 127 108 102Metro 198 15 155 116Secondary Competition 215 15 125 118
Over
all
Com
mer
cial
Mee
ting
and
Grou
p
Leisu
re
Penetration Rate Analysis
Historical Penetration Rates by Market Segment
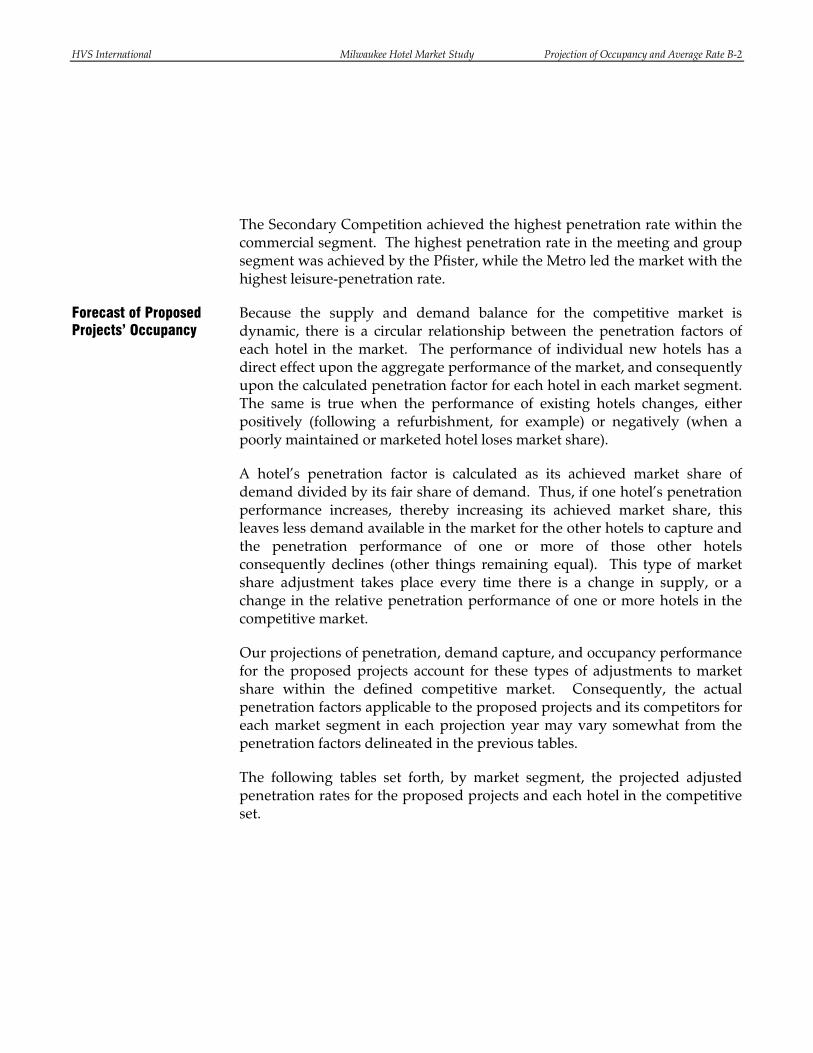
HVS International Milwaukee Hotel Market Study Projection of Occupancy and Average Rate B-2
The Secondary Competition achieved the highest penetration rate within the commercial segment. The highest penetration rate in the meeting and group segment was achieved by the Pfister, while the Metro led the market with the highest leisure-penetration rate.
Because the supply and demand balance for the competitive market is dynamic, there is a circular relationship between the penetration factors of each hotel in the market. The performance of individual new hotels has a direct effect upon the aggregate performance of the market, and consequently upon the calculated penetration factor for each hotel in each market segment. The same is true when the performance of existing hotels changes, either positively (following a refurbishment, for example) or negatively (when a poorly maintained or marketed hotel loses market share).
A hotel’s penetration factor is calculated as its achieved market share of demand divided by its fair share of demand. Thus, if one hotel’s penetration performance increases, thereby increasing its achieved market share, this leaves less demand available in the market for the other hotels to capture and the penetration performance of one or more of those other hotels consequently declines (other things remaining equal). This type of market share adjustment takes place every time there is a change in supply, or a change in the relative penetration performance of one or more hotels in the competitive market.
Our projections of penetration, demand capture, and occupancy performance for the proposed projects account for these types of adjustments to market share within the defined competitive market. Consequently, the actual penetration factors applicable to the proposed projects and its competitors for each market segment in each projection year may vary somewhat from the penetration factors delineated in the previous tables.
The following tables set forth, by market segment, the projected adjusted penetration rates for the proposed projects and each hotel in the competitive set.
Forecast of Proposed Projects’ Occupancy
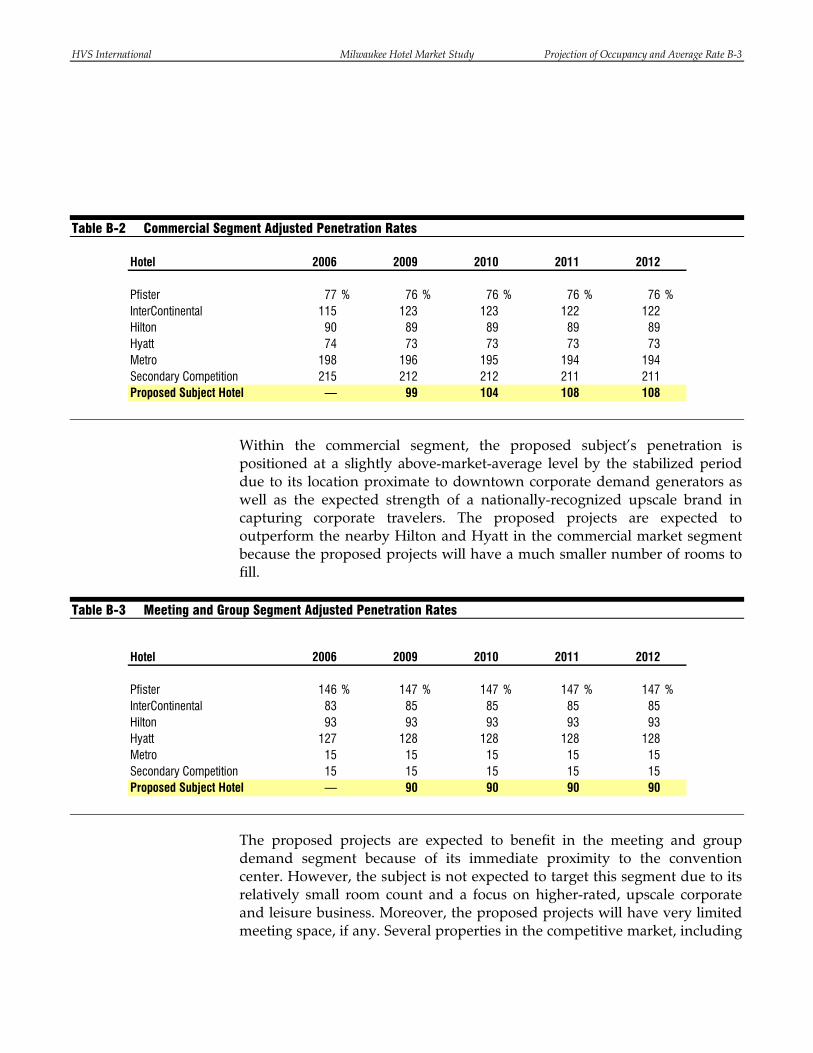
HVS International Milwaukee Hotel Market Study Projection of Occupancy and Average Rate B-3
Table B-2 Commercial Segment Adjusted Penetration Rates
Hotel 2006 2009 2010 2011 2012
Pfister 77 % 76 % 76 % 76 % 76 %InterContinental 115 123 123 122 122Hilton 90 89 89 89 89Hyatt 74 73 73 73 73Metro 198 196 195 194 194Secondary Competition 215 212 212 211 211Proposed Subject Hotel — 99 104 108 108
Within the commercial segment, the proposed subject’s penetration is positioned at a slightly above-market-average level by the stabilized period due to its location proximate to downtown corporate demand generators as well as the expected strength of a nationally-recognized upscale brand in capturing corporate travelers. The proposed projects are expected to outperform the nearby Hilton and Hyatt in the commercial market segment because the proposed projects will have a much smaller number of rooms to fill.
Table B-3 Meeting and Group Segment Adjusted Penetration Rates
Hotel 2006 2009 2010 2011 2012
Pfister 146 % 147 % 147 % 147 % 147 %InterContinental 83 85 85 85 85Hilton 93 93 93 93 93Hyatt 127 128 128 128 128Metro 15 15 15 15 15Secondary Competition 15 15 15 15 15Proposed Subject Hotel — 90 90 90 90
The proposed projects are expected to benefit in the meeting and group demand segment because of its immediate proximity to the convention center. However, the subject is not expected to target this segment due to its relatively small room count and a focus on higher-rated, upscale corporate and leisure business. Moreover, the proposed projects will have very limited meeting space, if any. Several properties in the competitive market, including

HVS International Milwaukee Hotel Market Study Projection of Occupancy and Average Rate B-4
the nearby Pfister Hotel, the Hyatt, and the Hilton encompass far more meeting space and they specifically target the meeting and group segment. Therefore, we believe that the proposed hotel will trail these competitors in penetrating this segment.
Table B-4 Leisure Segment Adjusted Penetration Rates
Hotel 2006 2009 2010 2011 2012
Pfister 85 % 84 % 83 % 83 % 83 %InterContinental 75 79 79 79 79Hilton 99 97 97 97 97Hyatt 108 107 106 106 106Metro 155 153 152 152 152Secondary Competition 125 124 123 123 123Proposed Subject Hotel — 109 113 113 113
The proposed projects should benefit from a modest amount of leisure demand during weekends, with its upscale image, unique brand, and urban location being notable highlights. The hotel's pricing structure will be relatively high, reflecting a strategy to target high-end leisure travelers for weekend stays. The Hotel Metro is expected to remain a primary leader in this segment; but the proposed projects will employ a similar strategy.
These positioned segment penetration rates result in the following market segmentation forecast.
Table B-5 Market Segmentation Forecast – Proposed projects
Commercial 43 % 44 % 45 % 45 %Meeting and Group 36 35 34 34Leisure 21 21 21 21
Total 100 % 100 % 100 % 100 %
2010 2011 20122009
The proposed project’s occupancy forecast is set forth as follows, with the adjusted projected penetration rates used as a basis for calculating the amount of captured market demand.
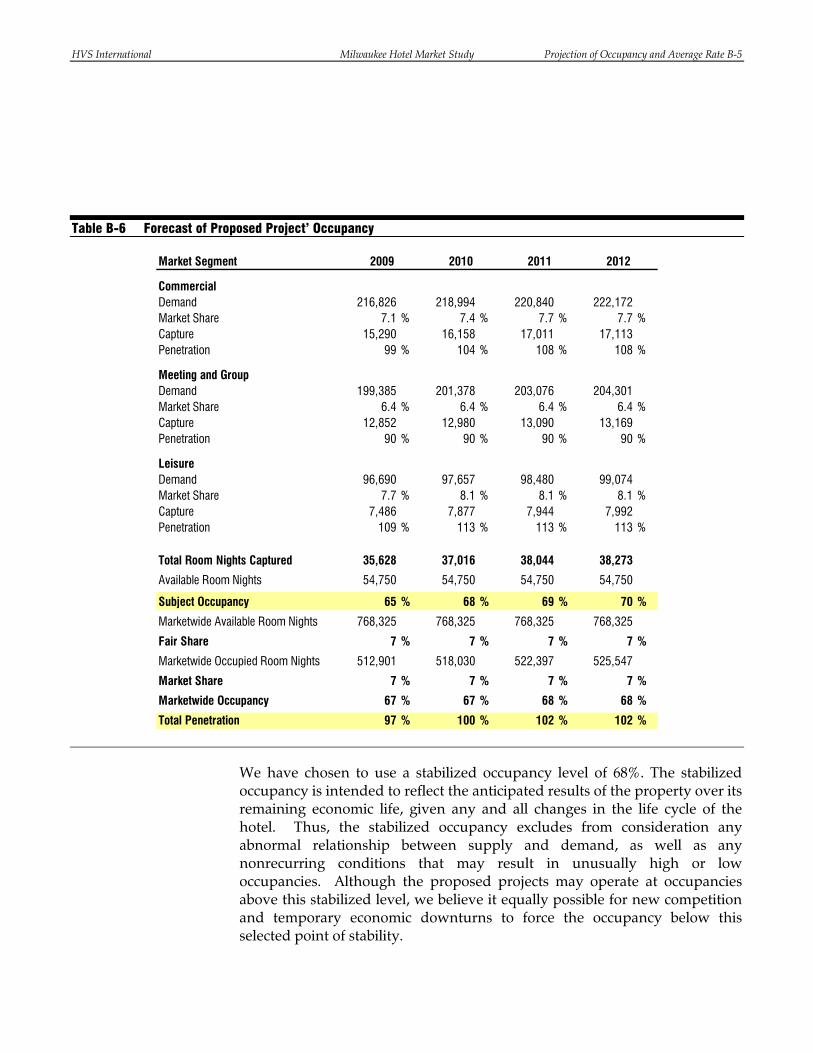
HVS International Milwaukee Hotel Market Study Projection of Occupancy and Average Rate B-5
Table B-6 Forecast of Proposed Project’ Occupancy
Market Segment
CommercialDemand 216,826 218,994 220,840 222,172Market Share 7.1 % 7.4 % 7.7 % 7.7 %Capture 15,290 16,158 17,011 17,113Penetration 99 % 104 % 108 % 108 %
Meeting and GroupDemand 199,385 201,378 203,076 204,301Market Share 6.4 % 6.4 % 6.4 % 6.4 %Capture 12,852 12,980 13,090 13,169Penetration 90 % 90 % 90 % 90 %
LeisureDemand 96,690 97,657 98,480 99,074Market Share 7.7 % 8.1 % 8.1 % 8.1 %Capture 7,486 7,877 7,944 7,992Penetration 109 % 113 % 113 % 113 %
Total Room Nights Captured 35,628 37,016 38,044 38,273
Available Room Nights 54,750 54,750 54,750 54,750
Subject Occupancy 65 % 68 % 69 % 70 %
Marketwide Available Room Nights 768,325 768,325 768,325 768,325
Fair Share 7 % 7 % 7 % 7 %
Marketwide Occupied Room Nights 512,901 518,030 522,397 525,547
Market Share 7 % 7 % 7 % 7 %
Marketwide Occupancy 67 % 67 % 68 % 68 %
Total Penetration 97 % 100 % 102 % 102 %
2011 20122009 2010
We have chosen to use a stabilized occupancy level of 68%. The stabilized occupancy is intended to reflect the anticipated results of the property over its remaining economic life, given any and all changes in the life cycle of the hotel. Thus, the stabilized occupancy excludes from consideration any abnormal relationship between supply and demand, as well as any nonrecurring conditions that may result in unusually high or low occupancies. Although the proposed projects may operate at occupancies above this stabilized level, we believe it equally possible for new competition and temporary economic downturns to force the occupancy below this selected point of stability.
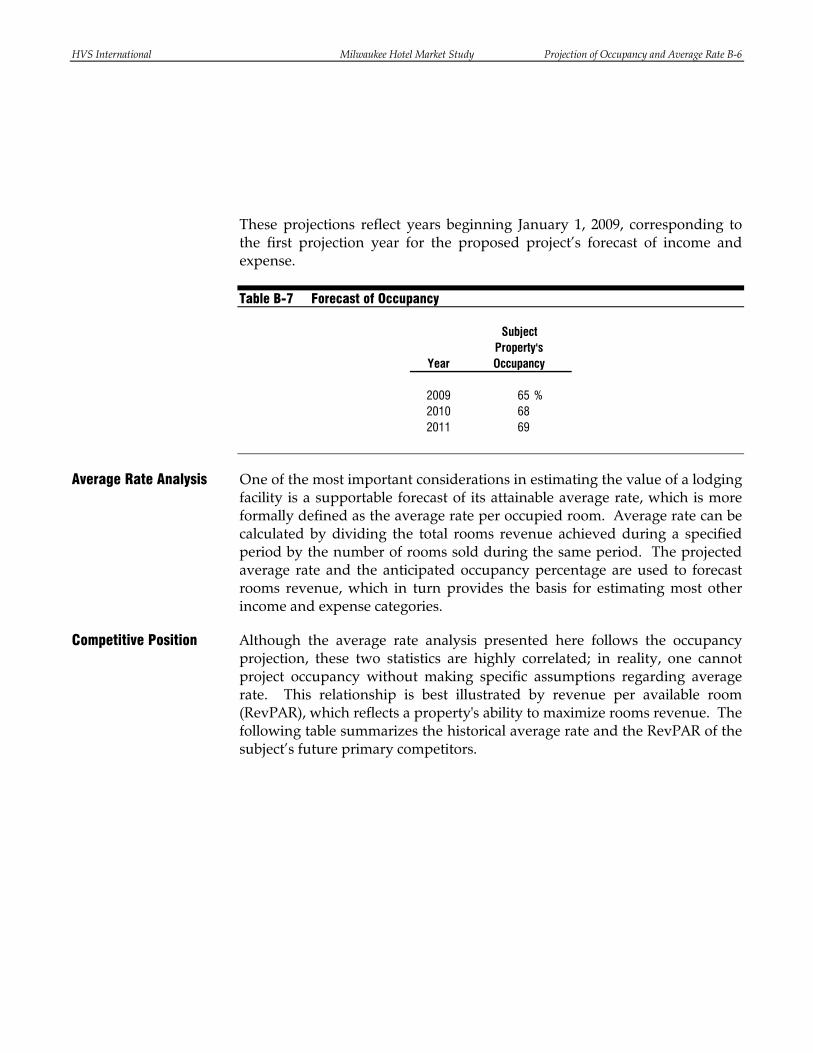
HVS International Milwaukee Hotel Market Study Projection of Occupancy and Average Rate B-6
These projections reflect years beginning January 1, 2009, corresponding to the first projection year for the proposed project’s forecast of income and expense.
Table B-7 Forecast of Occupancy
Subject
Year
2009 65 %2010 682011 69
Property's Occupancy
One of the most important considerations in estimating the value of a lodging facility is a supportable forecast of its attainable average rate, which is more formally defined as the average rate per occupied room. Average rate can be calculated by dividing the total rooms revenue achieved during a specified period by the number of rooms sold during the same period. The projected average rate and the anticipated occupancy percentage are used to forecast rooms revenue, which in turn provides the basis for estimating most other income and expense categories.
Although the average rate analysis presented here follows the occupancy projection, these two statistics are highly correlated; in reality, one cannot project occupancy without making specific assumptions regarding average rate. This relationship is best illustrated by revenue per available room (RevPAR), which reflects a property's ability to maximize rooms revenue. The following table summarizes the historical average rate and the RevPAR of the subject’s future primary competitors.
Average Rate Analysis
Competitive Position
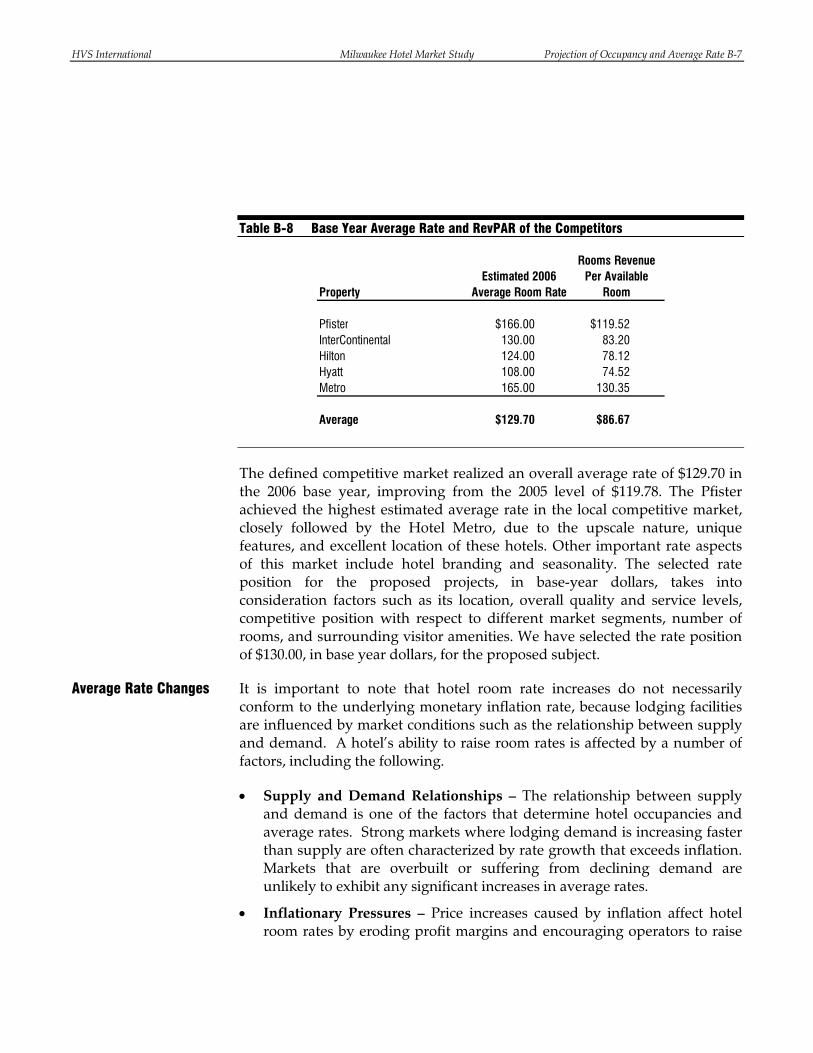
HVS International Milwaukee Hotel Market Study Projection of Occupancy and Average Rate B-7
Table B-8 Base Year Average Rate and RevPAR of the Competitors
Property
Pfister $166.00 $119.52InterContinental 130.00 83.20Hilton 124.00 78.12Hyatt 108.00 74.52Metro 165.00 130.35
Average $129.70 $86.67
Estimated 2006 Average Room Rate
Rooms Revenue Per Available
Room
The defined competitive market realized an overall average rate of $129.70 in the 2006 base year, improving from the 2005 level of $119.78. The Pfister achieved the highest estimated average rate in the local competitive market, closely followed by the Hotel Metro, due to the upscale nature, unique features, and excellent location of these hotels. Other important rate aspects of this market include hotel branding and seasonality. The selected rate position for the proposed projects, in base-year dollars, takes into consideration factors such as its location, overall quality and service levels, competitive position with respect to different market segments, number of rooms, and surrounding visitor amenities. We have selected the rate position of $130.00, in base year dollars, for the proposed subject.
It is important to note that hotel room rate increases do not necessarily conform to the underlying monetary inflation rate, because lodging facilities are influenced by market conditions such as the relationship between supply and demand. A hotel’s ability to raise room rates is affected by a number of factors, including the following.
• Supply and Demand Relationships – The relationship between supply and demand is one of the factors that determine hotel occupancies and average rates. Strong markets where lodging demand is increasing faster than supply are often characterized by rate growth that exceeds inflation. Markets that are overbuilt or suffering from declining demand are unlikely to exhibit any significant increases in average rates.
• Inflationary Pressures – Price increases caused by inflation affect hotel room rates by eroding profit margins and encouraging operators to raise
Average Rate Changes
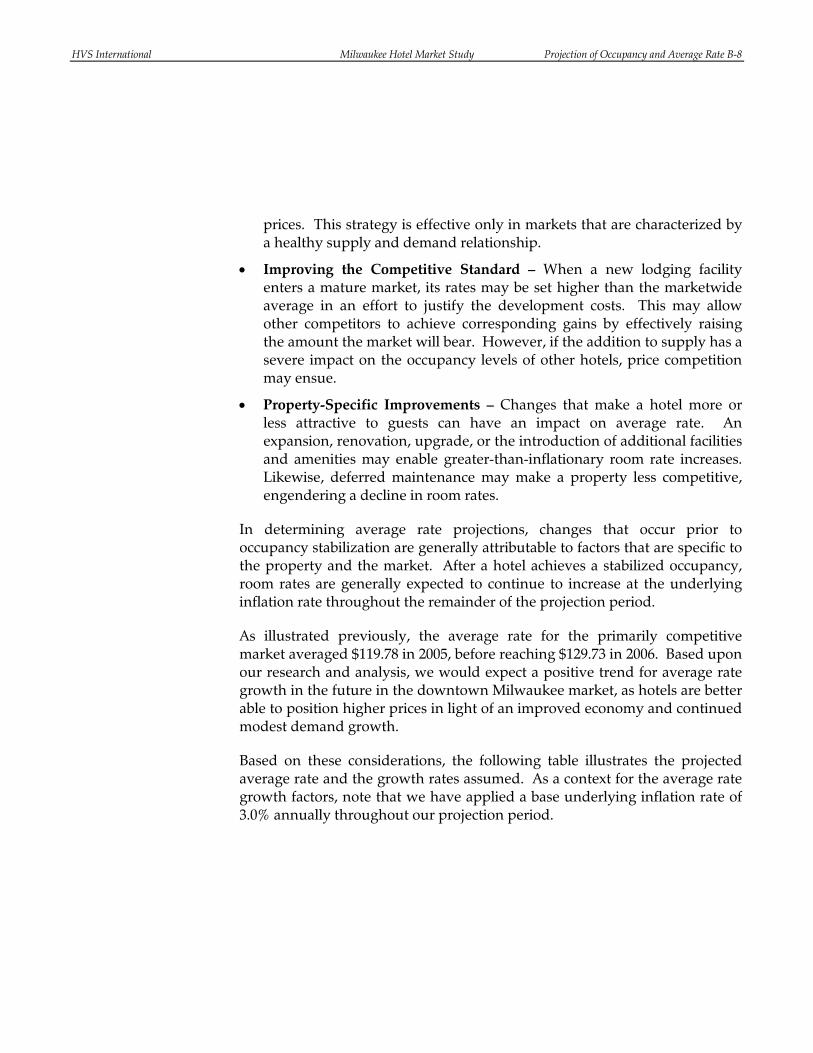
HVS International Milwaukee Hotel Market Study Projection of Occupancy and Average Rate B-8
prices. This strategy is effective only in markets that are characterized by a healthy supply and demand relationship.
• Improving the Competitive Standard – When a new lodging facility enters a mature market, its rates may be set higher than the marketwide average in an effort to justify the development costs. This may allow other competitors to achieve corresponding gains by effectively raising the amount the market will bear. However, if the addition to supply has a severe impact on the occupancy levels of other hotels, price competition may ensue.
• Property-Specific Improvements – Changes that make a hotel more or less attractive to guests can have an impact on average rate. An expansion, renovation, upgrade, or the introduction of additional facilities and amenities may enable greater-than-inflationary room rate increases. Likewise, deferred maintenance may make a property less competitive, engendering a decline in room rates.
In determining average rate projections, changes that occur prior to occupancy stabilization are generally attributable to factors that are specific to the property and the market. After a hotel achieves a stabilized occupancy, room rates are generally expected to continue to increase at the underlying inflation rate throughout the remainder of the projection period.
As illustrated previously, the average rate for the primarily competitive market averaged $119.78 in 2005, before reaching $129.73 in 2006. Based upon our research and analysis, we would expect a positive trend for average rate growth in the future in the downtown Milwaukee market, as hotels are better able to position higher prices in light of an improved economy and continued modest demand growth.
Based on these considerations, the following table illustrates the projected average rate and the growth rates assumed. As a context for the average rate growth factors, note that we have applied a base underlying inflation rate of 3.0% annually throughout our projection period.

HVS International Milwaukee Hotel Market Study Projection of Occupancy and Average Rate B-9
Table B-9 Market and Proposed Project’s Average Rate Forecast
Year
Base Year 67.8 % — % $128.61 — % — % $130.00 101.1 %2007 68.7 5.0 135.04 — 5.0 136.50 101.12008 69.3 4.0 140.44 — 4.0 141.96 101.12009 66.8 3.0 144.66 65.0 3.0 146.22 101.12010 67.4 3.0 149.00 68.0 3.0 150.61 101.12011 68.0 3.0 153.47 69.0 3.0 155.12 101.12012 68.4 3.0 158.07 70.0 3.0 159.78 101.1
Average Rate Growth
Average Rate
Average Rate Penetration
Areawide (Calendar Year) Subject Property (Calendar Year)
OccupancyAverage Rate
Growth Average Rate Occupancy
As illustrated above, a 5.0% rate of change is expected for the proposed project's positioned 2006 room rate in 2007. This is followed by growth rates of 4.0% and 3.0% in 2008 and 2009, respectively. The downtown Milwaukee hotel market should enjoy positive rate growth through the near term. The proposed project's rate position should reflect growth similar to market trends because of its new facility, excellent location, and proposed mixed-use amenities nearby. The proposed project’s penetration rate is forecast to reach 101.1% by the stabilized period.
A new property must establish its reputation and a client base in the market during its ramp-up period; as such, the proposed project’s average rates in the initial operating period have been discounted to reflect this likelihood. We forecast 5.0% and 3.0% discounts to the proposed project’s forecast room rates in the first two operating years, which would be typical for a new operation of this type.
The following average rates will be used to forecast the proposed project's rooms revenue; this forecast reflects years which begin January 1, 2009 and correspond with our financial projections.
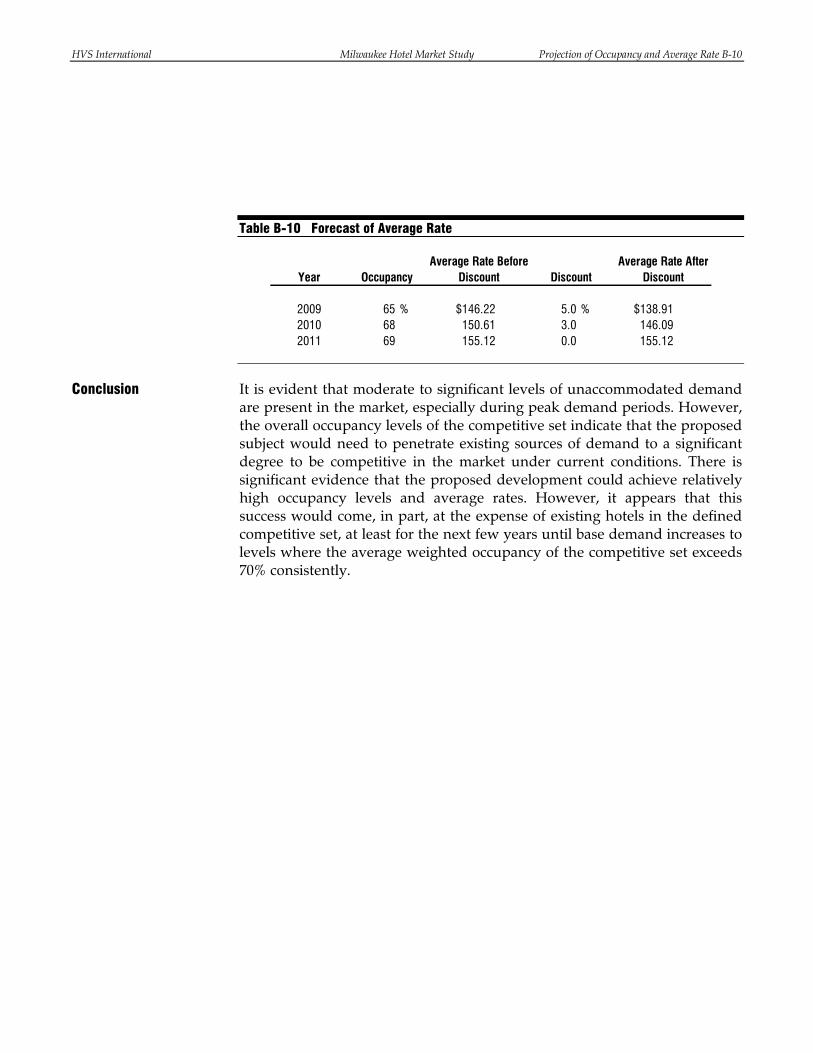
HVS International Milwaukee Hotel Market Study Projection of Occupancy and Average Rate B-10
Table B-10 Forecast of Average Rate
Year
2009 65 % $146.22 5.0 % $138.912010 68 150.61 3.0 146.092011 69 155.12 0.0 155.12
OccupancyAverage Rate Before
Discount DiscountAverage Rate After
Discount
It is evident that moderate to significant levels of unaccommodated demand are present in the market, especially during peak demand periods. However, the overall occupancy levels of the competitive set indicate that the proposed subject would need to penetrate existing sources of demand to a significant degree to be competitive in the market under current conditions. There is significant evidence that the proposed development could achieve relatively high occupancy levels and average rates. However, it appears that this success would come, in part, at the expense of existing hotels in the defined competitive set, at least for the next few years until base demand increases to levels where the average weighted occupancy of the competitive set exceeds 70% consistently.
Conclusion
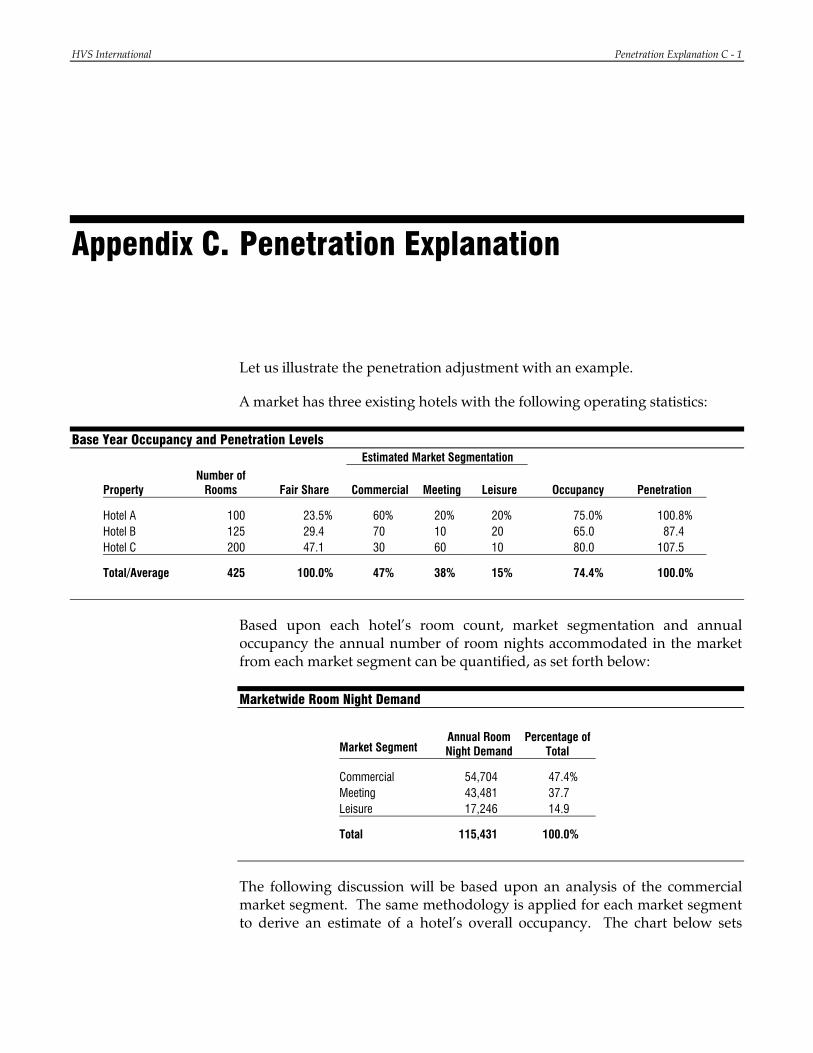
HVS International Penetration Explanation C - 1
Appendix C. Penetration Explanation
Let us illustrate the penetration adjustment with an example.
A market has three existing hotels with the following operating statistics:
Base Year Occupancy and Penetration Levels Estimated Market Segmentation
Property Number of
Rooms Fair Share Commercial Meeting Leisure Occupancy Penetration Hotel A 100 23.5% 60% 20% 20% 75.0% 100.8% Hotel B 125 29.4 70 10 20 65.0 87.4 Hotel C 200 47.1 30 60 10 80.0 107.5 Total/Average 425 100.0% 47% 38% 15% 74.4% 100.0%
Based upon each hotel’s room count, market segmentation and annual occupancy the annual number of room nights accommodated in the market from each market segment can be quantified, as set forth below:
Marketwide Room Night Demand
Market Segment Annual Room Night Demand
Percentage of Total
Commercial 54,704 47.4% Meeting 43,481 37.7 Leisure 17,246 14.9 Total 115,431 100.0%
The following discussion will be based upon an analysis of the commercial market segment. The same methodology is applied for each market segment to derive an estimate of a hotel’s overall occupancy. The chart below sets

HVS International Penetration Explanation C - 2
forth the commercial demand accommodated by each hotel. Each hotel’s commercial penetration factor is computed by:
1) calculating the hotel’s market share % of commercial demand (commercial room nights accommodated by subject hotel divided by total commercial room nights accommodated by all hotels) and
2) dividing the hotel’s commercial market share % by the hotel’s fair share %.
The following chart sets forth each hotel’s fair share, commercial market share and commercial penetration factor.
Commercial Segment Penetration Factors
Property Number of
Rooms Fair Share Commercial
Capture Commercial
Market Share Commercial Penetration
Hotel A 100 23.5% 12,973 30.0% 127.6% Hotel B 125 29.4 14,054 37.9 129.0 Hotel C 200 47.1 27,677 32.0 68.1 Total/Average 425 100.0% 54,704 100.0% 100.0%
When a new 100-room hotel enters the market the fair share of each hotel changes due to the new denominator which has been increased by the 100 rooms which have been added to the market.
Commercial Segment Fair Share
Property Number of
Rooms Fair Share Hotel A 100 19.0% Hotel B 125 23.8 Hotel C 200 38.1 New Hotel 100 19.0 Total 525 100.0%
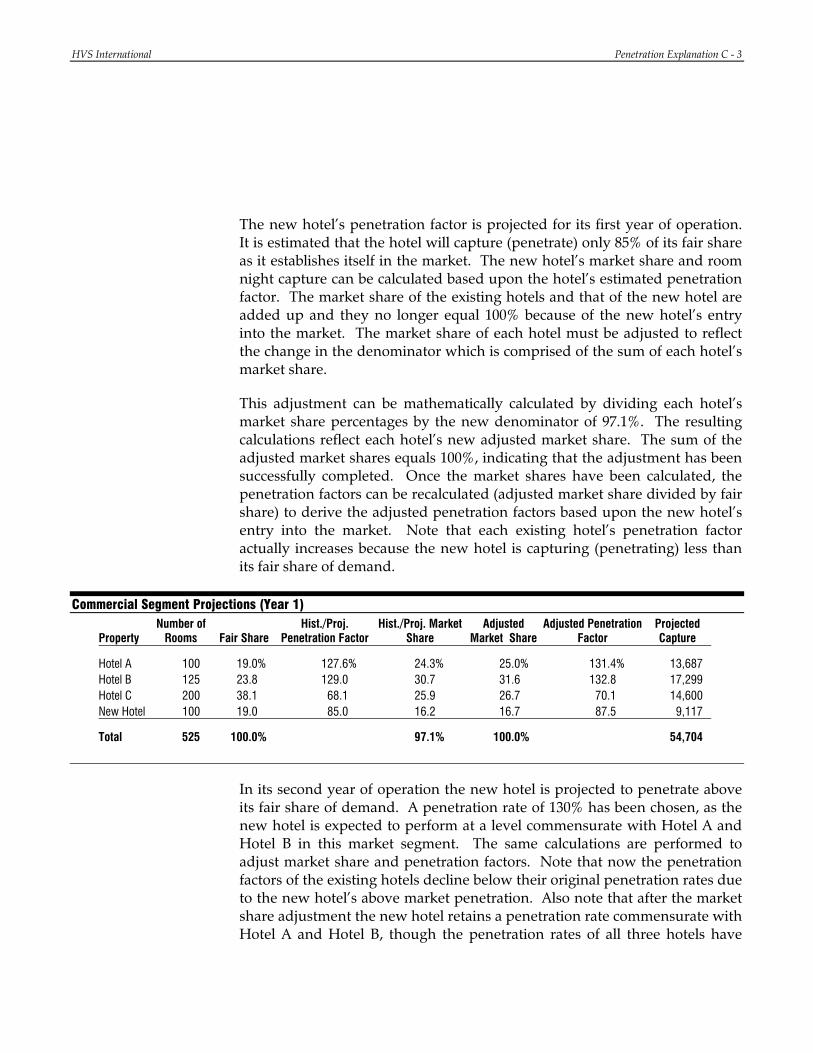
HVS International Penetration Explanation C - 3
The new hotel’s penetration factor is projected for its first year of operation. It is estimated that the hotel will capture (penetrate) only 85% of its fair share as it establishes itself in the market. The new hotel’s market share and room night capture can be calculated based upon the hotel’s estimated penetration factor. The market share of the existing hotels and that of the new hotel are added up and they no longer equal 100% because of the new hotel’s entry into the market. The market share of each hotel must be adjusted to reflect the change in the denominator which is comprised of the sum of each hotel’s market share.
This adjustment can be mathematically calculated by dividing each hotel’s market share percentages by the new denominator of 97.1%. The resulting calculations reflect each hotel’s new adjusted market share. The sum of the adjusted market shares equals 100%, indicating that the adjustment has been successfully completed. Once the market shares have been calculated, the penetration factors can be recalculated (adjusted market share divided by fair share) to derive the adjusted penetration factors based upon the new hotel’s entry into the market. Note that each existing hotel’s penetration factor actually increases because the new hotel is capturing (penetrating) less than its fair share of demand.
Commercial Segment Projections (Year 1)
Property Number of
Rooms Fair Share Hist./Proj.
Penetration Factor Hist./Proj. Market
Share Adjusted
Market Share Adjusted Penetration
Factor Projected Capture
Hotel A 100 19.0% 127.6% 24.3% 25.0% 131.4% 13,687 Hotel B 125 23.8 129.0 30.7 31.6 132.8 17,299 Hotel C 200 38.1 68.1 25.9 26.7 70.1 14,600 New Hotel 100 19.0 85.0 16.2 16.7 87.5 9,117 Total 525 100.0% 97.1% 100.0% 54,704
In its second year of operation the new hotel is projected to penetrate above its fair share of demand. A penetration rate of 130% has been chosen, as the new hotel is expected to perform at a level commensurate with Hotel A and Hotel B in this market segment. The same calculations are performed to adjust market share and penetration factors. Note that now the penetration factors of the existing hotels decline below their original penetration rates due to the new hotel’s above market penetration. Also note that after the market share adjustment the new hotel retains a penetration rate commensurate with Hotel A and Hotel B, though the penetration rates of all three hotels have
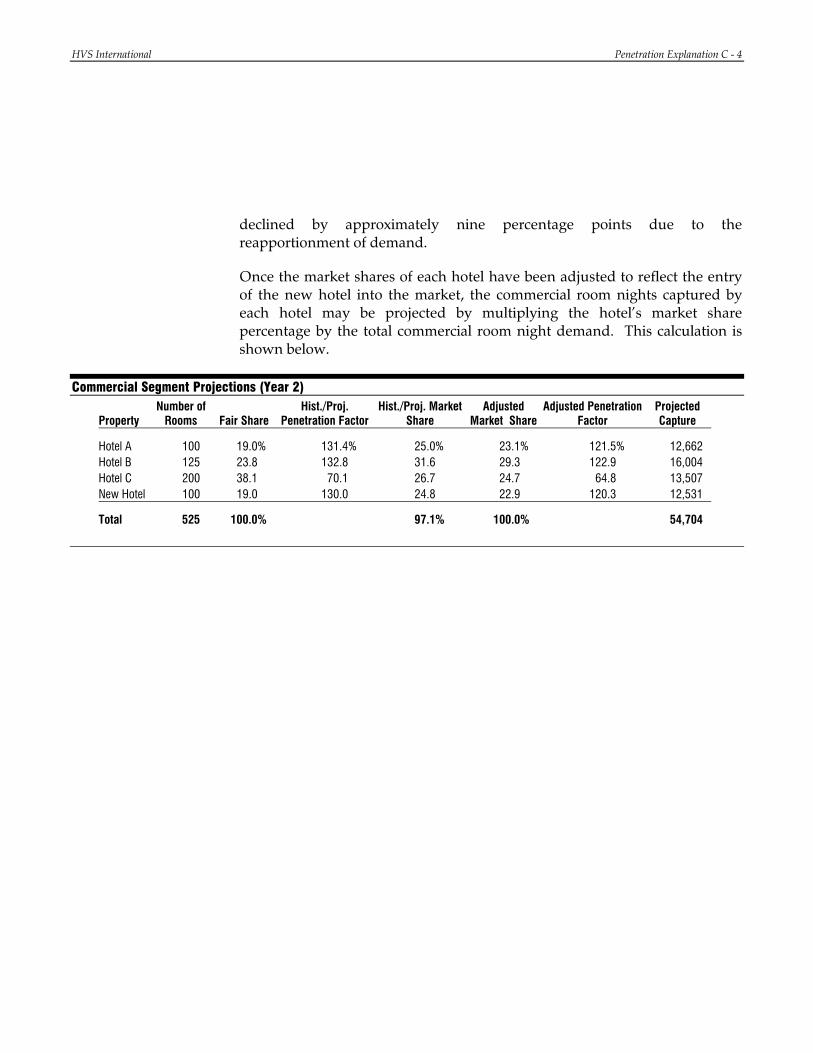
HVS International Penetration Explanation C - 4
declined by approximately nine percentage points due to the reapportionment of demand.
Once the market shares of each hotel have been adjusted to reflect the entry of the new hotel into the market, the commercial room nights captured by each hotel may be projected by multiplying the hotel’s market share percentage by the total commercial room night demand. This calculation is shown below.
Commercial Segment Projections (Year 2)
Property Number of
Rooms Fair Share Hist./Proj.
Penetration Factor Hist./Proj. Market
Share Adjusted
Market Share Adjusted Penetration
Factor Projected Capture
Hotel A 100 19.0% 131.4% 25.0% 23.1% 121.5% 12,662 Hotel B 125 23.8 132.8 31.6 29.3 122.9 16,004 Hotel C 200 38.1 70.1 26.7 24.7 64.8 13,507 New Hotel 100 19.0 130.0 24.8 22.9 120.3 12,531 Total 525 100.0% 97.1% 100.0% 54,704
HVS International Milwaukee Hotel Market Study Statement of Assumptions and Limiting Conditions 1
Statement of Assumptions and Limiting Conditions
1. This report is set forth as a market study of the proposed projects; this is not an appraisal report.
2. This report is to be used in whole and not in part.
3. No responsibility is assumed for matters of a legal nature, nor do we render any opinion as to title, which is assumed to be marketable and free of any deed restrictions and easements. The property is evaluated as though free and clear unless otherwise stated.
4. We assume that there are no hidden or unapparent conditions of the sub-soil or structures, such as underground storage tanks, that would impact the property’s development potential. No responsibility is assumed for these conditions or for any engineering that may be required to discover them.
5. We have not considered the presence of potentially hazardous materials or any form of toxic waste on the project site. The consultants are not qualified to detect hazardous substances, and we urge the client to retain an expert in this field if desired.
6. The Americans with Disabilities Act (ADA) became effective on January 26, 1992. We have assumed the proposed hotel would be designed and constructed to be in full compliance with the ADA.
7. We have made no survey of the site, and we assume no responsibility in connection with such matters. Sketches, photographs, maps, and other exhibits are included to assist the reader in visualizing the property. It is assumed that the use of the described real estate will be within the boundaries of the property described, and that no encroachment will exist.
8. All information, financial operating statements, estimates, and opinions obtained from parties not employed by Division Name are
HVS International Milwaukee Hotel Market Study Statement of Assumptions and Limiting Conditions 2
assumed to be true and correct. We can assume no liability resulting from misinformation.
9. Unless noted, we assume that there are no encroachments, zoning violations, or building violations encumbering the proposed projects.
10. The property is assumed to be in full compliance with all applicable federal, state, local, and private codes, laws, consents, licenses, and regulations (including a liquor license where appropriate), and that all licenses, permits, certificates, franchises, and so forth can be freely renewed or transferred to a purchaser.
11. All mortgages, liens, encumbrances, leases, and servitudes have been disregarded unless specified otherwise.
12. None of this material may be reproduced in any form without our written permission, and the report cannot be disseminated to the public through advertising, public relations, news, sales, or other media.
13. We are not required to give testimony or attendance in court by reason of this analysis without previous arrangements, and only when our standard per diem fees and travel costs are paid prior to the appearance.
14. If the reader is making a fiduciary or individual investment decision and has any questions concerning the material presented in this report, it is recommended that the reader contact us.
15. We take no responsibility for any events or circumstances that take place subsequent to the date of our field inspection.
16. The quality of a lodging facility's on-site management has a direct effect on a property's economic viability. The financial forecasts presented in this analysis assume responsible ownership and competent management. Any departure from this assumption may have a significant impact on the projected operating results.
17. The estimated operating results presented in this report are based on an evaluation of the overall economy, and neither take into account nor make provision for the effect of any sharp rise or decline in local or national economic conditions. To the extent that wages and other operating expenses may advance during the economic life of the property, we expect that the prices of rooms, food, beverages, and services will be adjusted to at least offset those advances. We do not warrant that the estimates will be attained, but they have been
HVS International Milwaukee Hotel Market Study Statement of Assumptions and Limiting Conditions 3
prepared on the basis of information obtained during the course of this study and are intended to reflect the expectations of a typical hotel investor.
18. This analysis assumes continuation of all provisions of the Internal Revenue Code of 1986, as amended to date.
19. Many of the figures presented in this report were generated using sophisticated computer models that make calculations based on numbers carried out to three or more decimal places. In the interest of simplicity, most numbers have been rounded to the nearest tenth of a percent. Thus, these figures may be subject to small rounding errors.
20. It is agreed that our liability to the client is limited to the amount of the fee paid as liquidated damages. Our responsibility is limited to the client, and use of this report by third parties shall be solely at the risk of the client and/or third parties. The use of this report is also subject to the terms and conditions set forth in our engagement letter with the client.
21. Evaluating and comprising financial forecasts for hotels is both a science and an art. Although this analysis employs various mathematical calculations to provide value indications, the final forecasts are subjective and may be influenced by our experience and other factors not specifically set forth in this report.
22. HVS Chicago prepared this study. All opinions, recommendations, and conclusions expressed during the course of this assignment are rendered by the staff of HVS Chicago as employees, rather than as individuals.

HVS International Milwaukee Hotel Market Study Certification 1
Certification
We, the undersigned, hereby certify:
1. that the statements of fact presented in this report are true and correct to the best of our knowledge and belief;
2. that the reported analyses, opinions, and conclusions presented in this report are limited only by the assumptions and limiting conditions set forth, and are our personal, impartial, and unbiased professional analyses, opinions, and conclusions;
3. that Hans Detlefsen personally inspected the property described in this report; Thomas Hazinski participated in the analysis and reviewed the findings, but did not personally inspect the property;
4. that the consultants have extensive experience in the evaluation of hotels and believe that they are competent to undertake this study;
5. that we have no current or contemplated interests in the real estate that is the subject of this report;
6. that we have no personal interest or bias with respect to the subject matter of this report or the parties involved;
7. that this report sets forth all of the limiting conditions (imposed by the terms of this assignment) affecting the analyses, opinions, and conclusions presented herein;
8. that the fee paid for the preparation of this report is not contingent upon our conclusions, or the occurrence of a subsequent event directly related to the intended use of this report;
9. that this report has been prepared in accordance with, and is subject to, the requirements of the Code of Professional Ethics and Standards of Professional Appraisal Practice of the Appraisal Institute;
10. that the use of this report is subject to the requirements of the Appraisal Institute relating to review by its duly authorized representatives;
HVS International Milwaukee Hotel Market Study Certification 2
11. that this report has been prepared in accordance with the Uniform Standards of Professional Appraisal Practice (as adopted by the Appraisal Foundation);
12. that no one other than those listed above and the undersigned prepared the analyses, conclusions, and opinions concerning the real estate that are set forth in this report;
13. that as of the date of this report, Hans Detlefsen has completed the requirements of the associate program of the Appraisal Institute; and
14. that our engagement in this assignment was not contingent upon developing or reporting predetermined results.
Thomas Hazinski Managing Director HVS International
Hans Detlefsen Director HVS International