Hospira Overview Presentation June 2007...
43
Hospira, Inc. Investor Presentation June 2007 Advancing Wellness ™ through the right people and the right products
Transcript of Hospira Overview Presentation June 2007...

Hospira, Inc.Investor PresentationJune 2007
Advancing Wellness™ through the right people and the right products
2
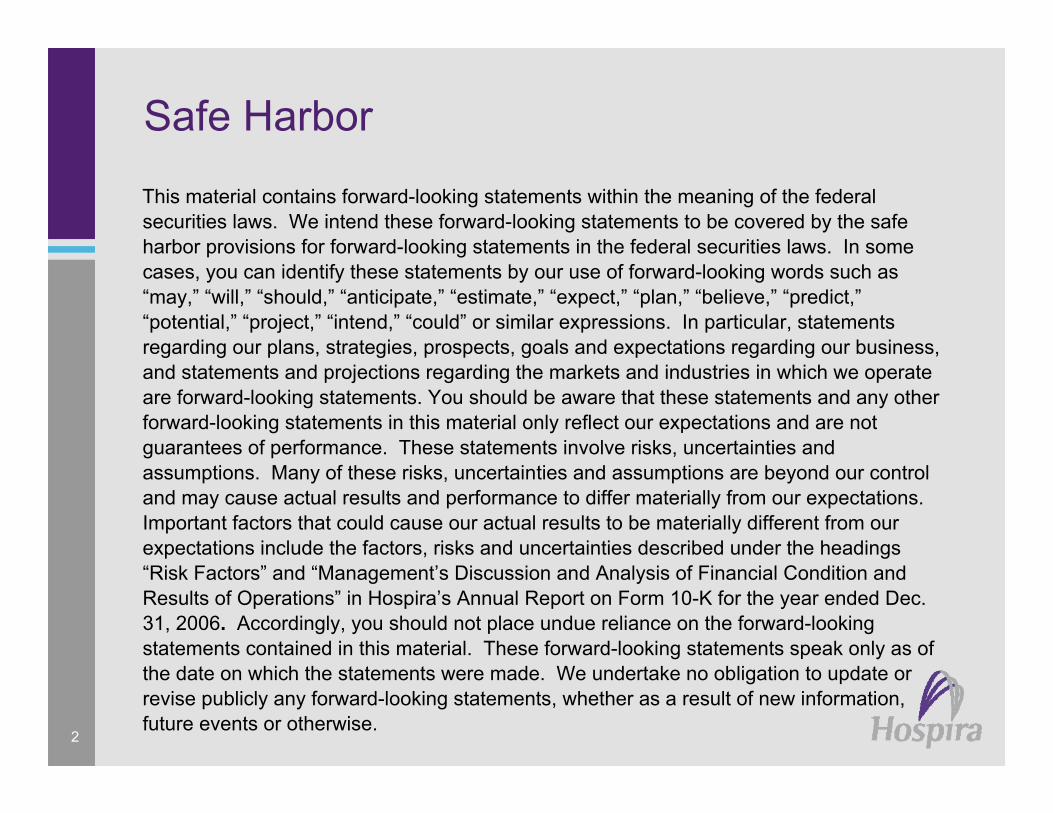
Safe Harbor
This material contains forward-looking statements within the meaning of the federal securities laws. We intend these forward-looking statements to be covered by the safe harbor provisions for forward-looking statements in the federal securities laws. In some cases, you can identify these statements by our use of forward-looking words such as “may,” “will,” “should,” “anticipate,” “estimate,” “expect,” “plan,” “believe,” “predict,”“potential,” “project,” “intend,” “could” or similar expressions. In particular, statements regarding our plans, strategies, prospects, goals and expectations regarding our business, and statements and projections regarding the markets and industries in which we operate are forward-looking statements. You should be aware that these statements and any other forward-looking statements in this material only reflect our expectations and are not guarantees of performance. These statements involve risks, uncertainties and assumptions. Many of these risks, uncertainties and assumptions are beyond our control and may cause actual results and performance to differ materially from our expectations. Important factors that could cause our actual results to be materially different from our expectations include the factors, risks and uncertainties described under the headings “Risk Factors” and “Management’s Discussion and Analysis of Financial Condition and Results of Operations” in Hospira’s Annual Report on Form 10-K for the year ended Dec. 31, 2006. Accordingly, you should not place undue reliance on the forward-looking statements contained in this material. These forward-looking statements speak only as of the date on which the statements were made. We undertake no obligation to update or revise publicly any forward-looking statements, whether as a result of new information, future events or otherwise.

3
Hospira Overview
#1 or #2 position in major U.S. product linesGlobal leadership in generic injectablesBalanced portfolio of products that address customer needsFocused on serving the hospital$2.7 billion in 2006 sales (excludes Mayne)
– 2006 pro forma sales*: $3.3 billion18 manufacturing facilities15,000 employeesPioneer in innovation and safety
* Includes Mayne
4
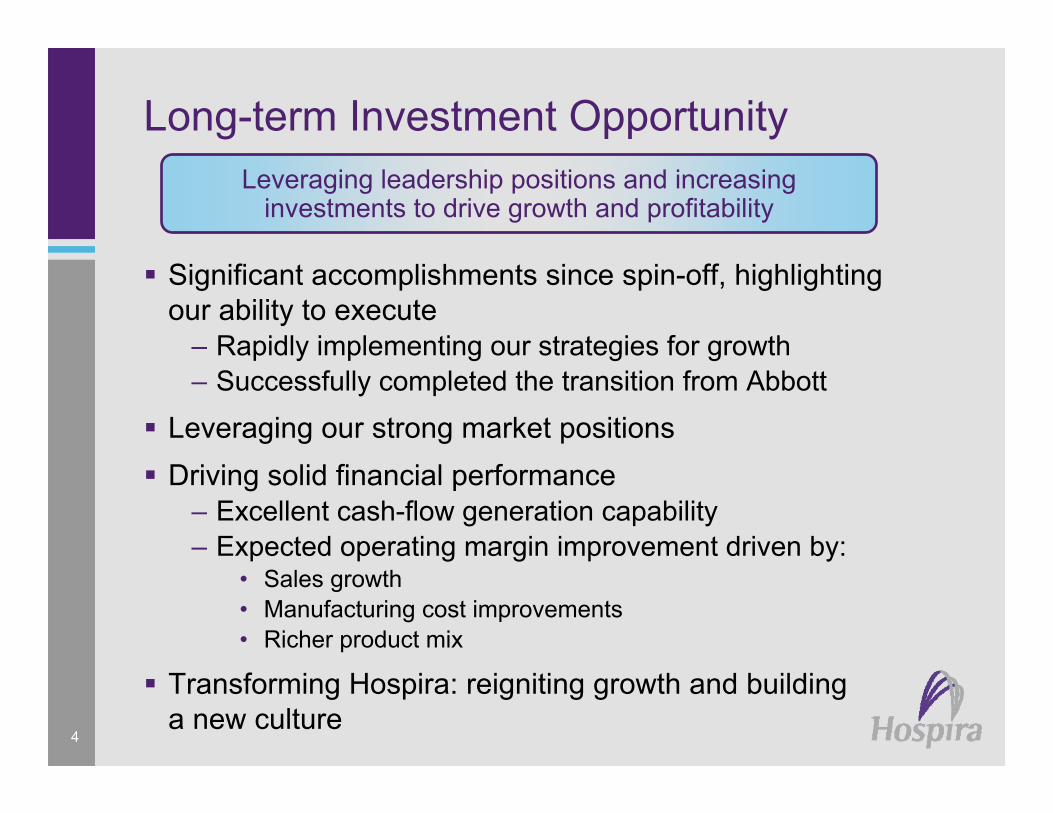
Long-term Investment Opportunity
Significant accomplishments since spin-off, highlighting our ability to execute
– Rapidly implementing our strategies for growth– Successfully completed the transition from Abbott
Leveraging our strong market positionsDriving solid financial performance
– Excellent cash-flow generation capability– Expected operating margin improvement driven by:
• Sales growth• Manufacturing cost improvements• Richer product mix
Transforming Hospira: reigniting growth and building a new culture
Leveraging leadership positions and increasing investments to drive growth and profitability

55
Transforming Hospira
Optimized portfolio through selective M&A
Careful financial management to driveshareholder value
Executing Hospira’s two key strategies:– Invest for growth– Improve margins and cash flow
Transformation from an under-invested, no-growth operating division with declining margins
to a company with top-line growth and improving margins

6
Key Strategies
Invest for growth:– Investments in new product pipeline– Biogenerics strategy– Mayne Pharma acquisition– Alliances forged to build SIP portfolio
outside the U.S.
Improve margins and cash flow:– Exited low-margin businesses– Launched manufacturing optimization initiatives
Significant progress over the past three years in executing our two key strategies

7
Strategy: Invest for Growth
Increase R&D pipeline investment and acceleratenew product introductions
– Medication Management Systems– Specialty Injectable Pharmaceuticals
Expand internationally
Pursue acquisitions and alliances
We are increasing our investments in the business to drive long-term profitable growth

8
Product Strengths Address Customer Needs
Current Hospira Strengths Moving ForwardCustomer Needs
We help reduce healthcare expenses by lowering pharmaceutical costs and improving productivity and safety
Specialty injectable pharmaceuticals and biogenerics
Full integration enabling added safety features and enhancements
Compounding
Broad portfolio of high qualitygeneric injectable pharmaceuticals
Innovative solutions from bar codingto drug-infusion monitoring systemshelp reduce medication errors
Comprehensive offeringof needleless products
Solutions to high cost of proprietary pharmaceuticals
Reduction in medication errors:Errors create an economic burden estimated at $77 billionin the U.S. alone
Increased worker safety:Needlestick accidents cost an estimated $1 billion annuallyExposure to toxic drugs when mixed in a hospital pharmacy
Networked infusion systems withsafety software; proprietarydrug delivery systems
Caregiver labor reduction:Saves time and enables focus on more value-added activities
iSecure™, VisIV™, new deliverysystems in development; auto-programmable infusion systems and incremental services
9
Mayne Pharma Acquisition
Acquisition aligns powerfully with strategy of investing for growth; addresses two of Hospira’s key long-term growth drivers:
• Generic injectable product line• International expansion
Significantly accelerates growth of Hospira’s global footprint
– Doubles international sales to 30% of total sales
Establishes Hospira as the worldwide leader in generic injectables
Expands Hospira’s oncology presence and providesadditional R&D and manufacturing capabilities
$2 billion acquisition closed Feb. 2, 2007

10
• EPS impact in 2007: slightly accretive to adjusted EPS*, dilutive to GAAP EPS
• Cost synergies: minimum of $50 million annually beginning in 2008
• Financing: ≈ $120 million cash on hand; a $500 million term loan and bonds:
• $375 million of floating-rate notes due 2010• $500 million of 5.55% notes due 2012 and • $550 million of 6.05% notes due 2017
• Hospira credit rating remains investment grade
Expected Financial Impact of Acquisition
* excludes impact of transaction-related expenses and the amortization of intangible assets related to thetransaction, as well as other specified items

11
Strategy: Improve Margins and Cash Flow
Improve product mix
Optimize manufacturing efficiencies
Streamline administrative systems / processes
Advance culture of financial fitness
We are taking actions across the entireorganization to sustain and expand profitable growth

12
Hospira’s Products

13
Global Pharmaceuticals and Global Devices
Specialty Injectable Pharmaceuticals (SIP)IV Solutions/NutritionalsContract Manufacturing
Medication Management Systems (MMS)Critical CareBrain-function Monitoring
Hospira’s Product Lines
* Including Mayne
2006 Hospira Pro Forma Sales*
Global Pharma
Global Devices

14
Global Pharmaceuticals
Specialty Pharmaceuticals– Generic injectables– Advanced delivery systems– Biogenerics– Specialty proprietary pharma
Infusion Therapy– IV solutions– Nutritionals– Plasma expanders– Specialty solutions
One 2 One® ContractManufacturing
– Pharma contract manufacturing
– Delivery systemlicensing
Americas
APAC
EMEA
GlobalPharma
GlobalDevices
2006 HospiraPro Forma Sales*
* Including Mayne

15
Uniquely Capable to Expand Our Leadership Position in Global Pharmaceuticals
#1 position globally in generic injectables, with a broad portfolio of products and expanding geographic presence
New differentiated products focused on first-to-market opportunities are key growth drivers
Robust strategy with multi-pronged approach to the market– Balanced risk / reward pipeline– Growing participation in proprietary and specialty pharmaceutical
segments
Hospira has the necessary capabilities to succeed, including R&D, regulatory, manufacturing, local market knowledge and relationships with customers
Low-cost global manufacturing with high product quality and reliability of supply
Long-term Sales Growth Rate Goal: 7 – 9%

16
Specialty Injectable PharmaceuticalsOur Business is Evolving in New Directions to Drive Growth
Oncology
Compounding
IntellectualProperty Strategy
BiogenericsNew Delivery andPackaging Systems
GeographicExpansion
SuperGenerics
ProprietaryAcute-care Drugs
Precedex®
LEGACYSIP BUSINESSTraditional small
moleculegeneric injectables
Differentiatedpackaging systems
17
7
17
10
8 8
Definition Stage Development Stage Pending at FDA Pending at an EUAgency
Pending at TGA
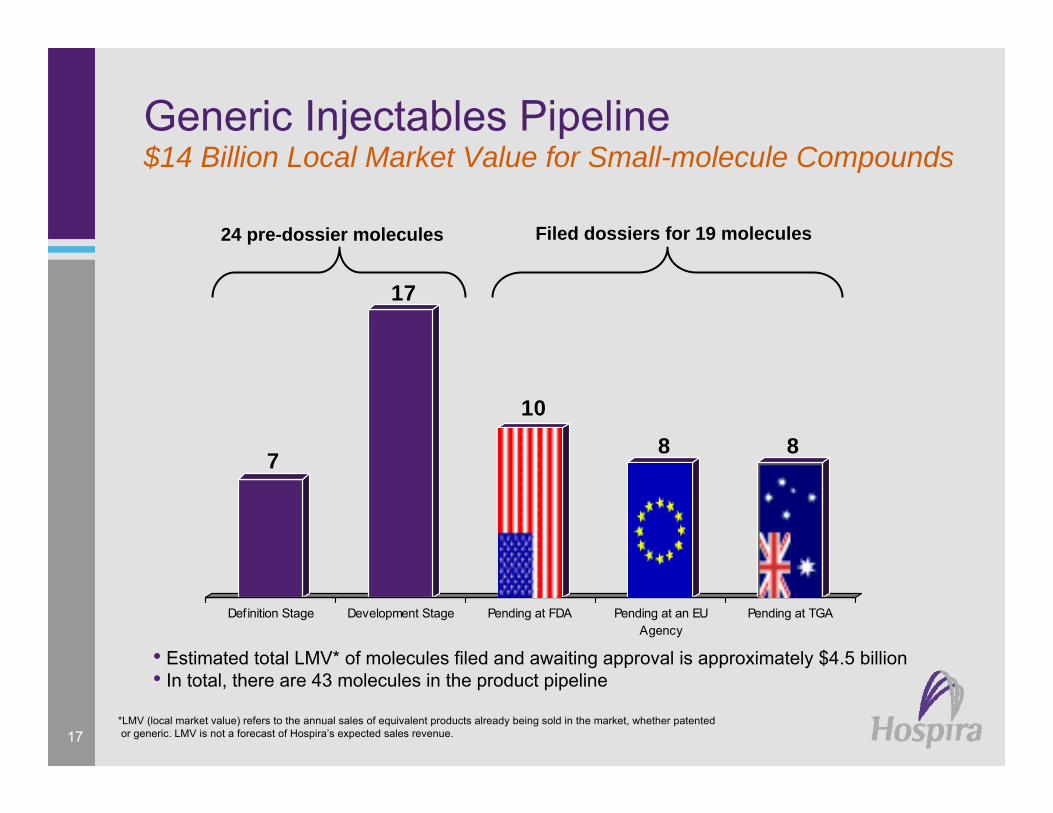
Generic Injectables Pipeline
• Estimated total LMV* of molecules filed and awaiting approval is approximately $4.5 billion• In total, there are 43 molecules in the product pipeline
24 pre-dossier molecules Filed dossiers for 19 molecules
*LMV (local market value) refers to the annual sales of equivalent products already being sold in the market, whether patentedor generic. LMV is not a forecast of Hospira’s expected sales revenue.
$14 Billion Local Market Value for Small-molecule Compounds
18
Infusion Therapy - VisIV™
VisIV addresses an ever-growing market need to provide eco-friendly hospital products that offer health, economic and safety advantages
– VisIV reduces waste; no outer wrap required – Promotes caregiver safety through its
needlestick safety feature– Bar coded feature promotes patient safety – Pre-sterilized ports improve caregiver workflow;
drive labor savings
Premium-priced product in use in more than 400 hospitals in the U.S.
– Limited product line; planned gradual rollout
VisIV’s customer-inspired design expected to help drive organic growth in this core product category
Responding to Unmet Healthcare Needs

19
Contract Manufacturing – One 2 One®
Partnerships with world’s leading pharmaceutical and biotechnology companies who want:
– expertise in I.V. drug formulation – broad range of delivery systems– a focus on quality
Our strategies for One 2 One:– Maximize portfolio synergies – new contract opportunities – Balance portfolio to manage development mix with on-market
products, late-phase clinical projects and earlier-phase opportunities
An opportunistic business with a focus onhigher-margin partnerships
20
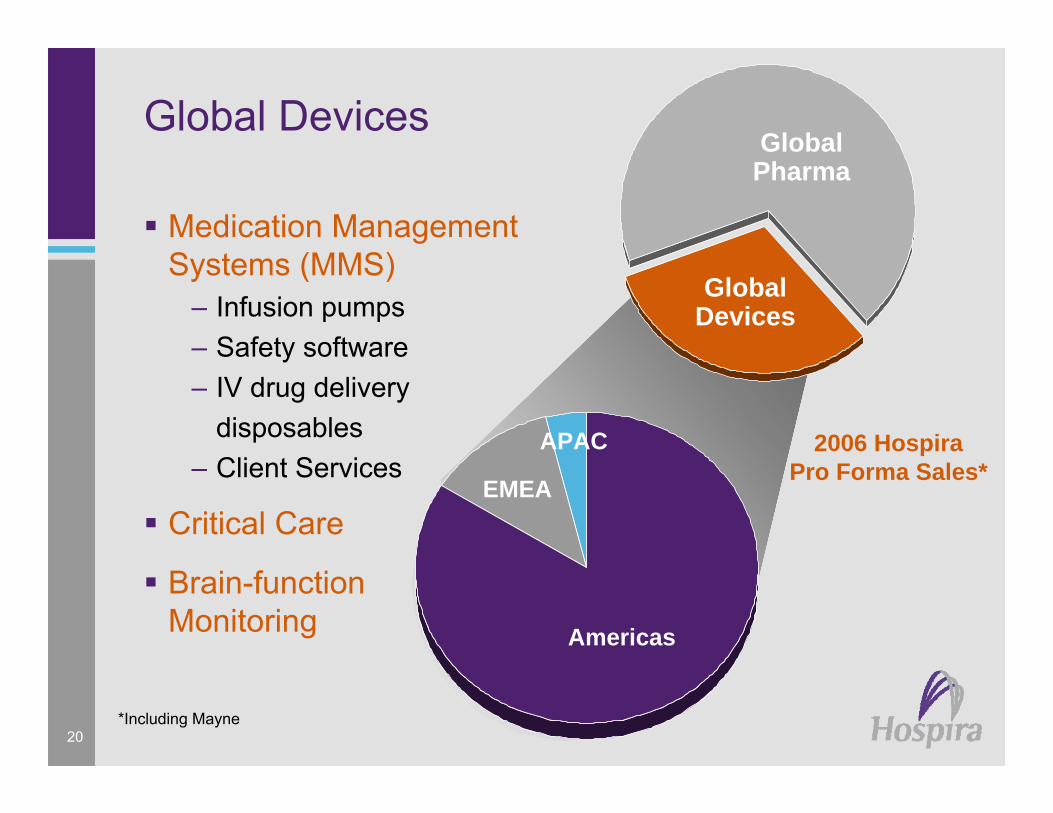
Global Devices
Medication ManagementSystems (MMS)
– Infusion pumps– Safety software– IV drug delivery
disposables– Client Services
Critical Care
Brain-functionMonitoring
*Including Mayne
2006 HospiraPro Forma Sales*
Americas
APAC
EMEA
GlobalDevices
GlobalPharma
21
Hospira Aspires to Become the Global Leader in Medication Management Systems
Hospira is well positioned to grow globally
Broad portfolio helps customers addressmedication errors and other needs on a global basis
Hospira MedNet® drives integration across hospital information systems
Significant installed base of 400,000 pumpsworldwide will help drive global expansion
Long-term Sales Growth Rate Goal: 8 – 10%
22
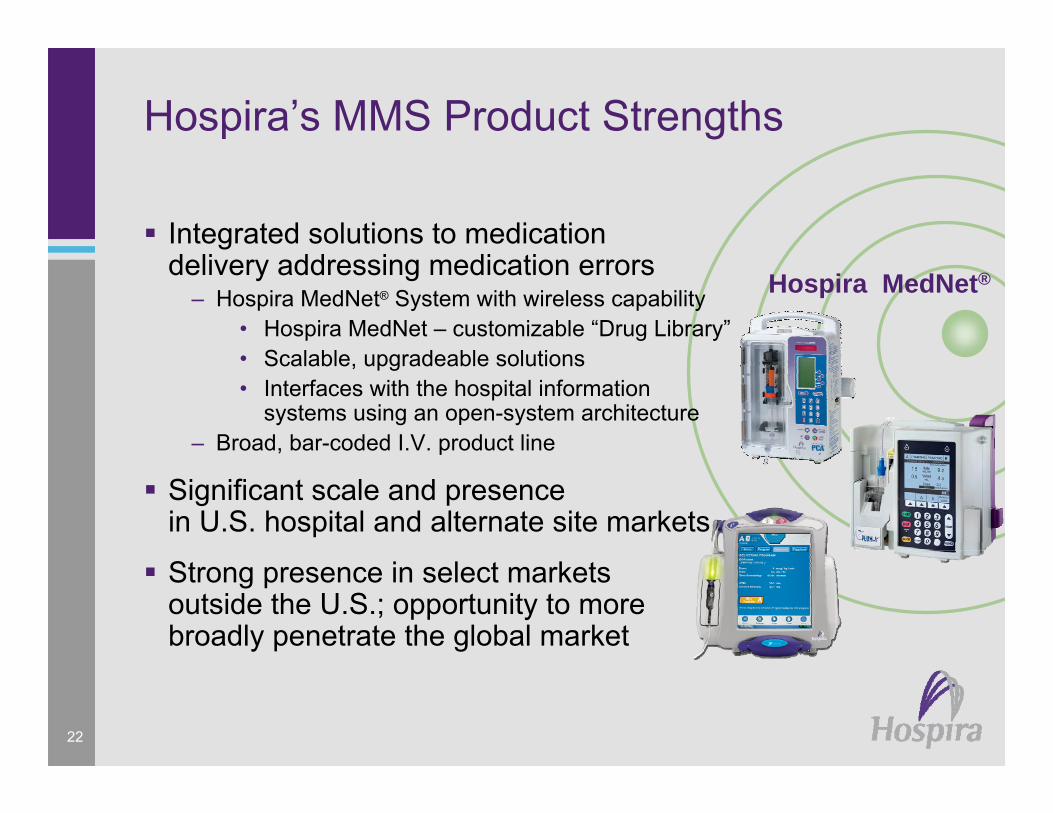
Hospira’s MMS Product Strengths
Integrated solutions to medicationdelivery addressing medication errors
– Hospira MedNet® System with wireless capability• Hospira MedNet – customizable “Drug Library”• Scalable, upgradeable solutions• Interfaces with the hospital information
systems using an open-system architecture– Broad, bar-coded I.V. product line
Significant scale and presencein U.S. hospital and alternate site markets
Strong presence in select markets outside the U.S.; opportunity to more broadly penetrate the global market
Hospira MedNet®

23
LEGACYMMS BUSINESS
Medication Management SystemsOur Business is Evolving in New Directions to Drive Growth
Global Expansion
Integration Partnerships
New PumpPlatforms
AdjacentOpportunities
Value-addedDisposables
Client Services
EnhancedHospira MedNet®

24
Hospira By Region
The AmericasAPAC
EMEA Devices
Pharma
Australia /N. ZealandJapan
Rest ofRegion
APAC
EMEA
Rest of Region
Top 5 EU Markets
Pharma
Devices
Canada /L. America
U.S.
Pharma
Devices
The Americas
* Including Mayne
2006 HospiraPro Forma Sales*
24
25
Hospira’s Leadership
Position in the U.S.
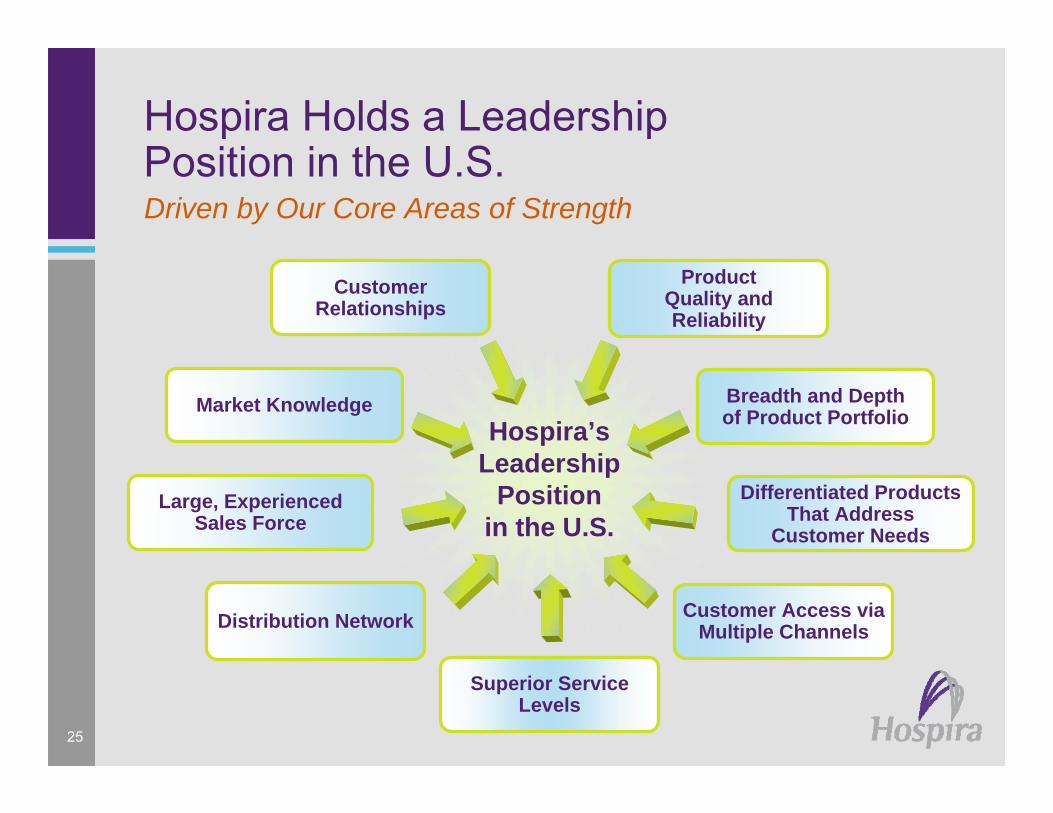
Hospira Holds a LeadershipPosition in the U.S.Driven by Our Core Areas of Strength
Superior Service Levels
Customer Relationships
Product Quality andReliability
Market Knowledge Breadth and Depth of Product Portfolio
Large, ExperiencedSales Force
Differentiated Products That Address
Customer Needs
Distribution Network Customer Access via Multiple Channels

More than 150 compounds in over780 dosages and
formulations
Hospira Products
5 – 6%Projected Market Growth
$5.8BU.S. Market Size(excluding biologics)
Specialty Injectables
Specialty Injectable Pharmaceuticals: U.S.
26
Abraxis11%
Bedford8%
Baxter 12%
Hospira*17%
Other52%
Dollar Share of U.S. Generic Injectables Market
Source: IMS Provider Perspective (U.S.), 2006* Including Mayne Pharma

4 – 6%Projected Market Growth
#2Market Position
Hospira MedNet®SystemPlum A+®
SymbiqTM
LifeCare PCA®
Key Products
$1.2BU.S. Market Size
Medication Management
Systems
27
Medication Management Systems: U.S.
Baxter 29%
Cardinal /Alaris26%
Other17%
Hospira28%
Share of Installed Infusion Devices – U.S. Hospitals
Source: Market size and growth rate – internal research, company and syndicated market reports;Market share – MDI, 2H 2006
28
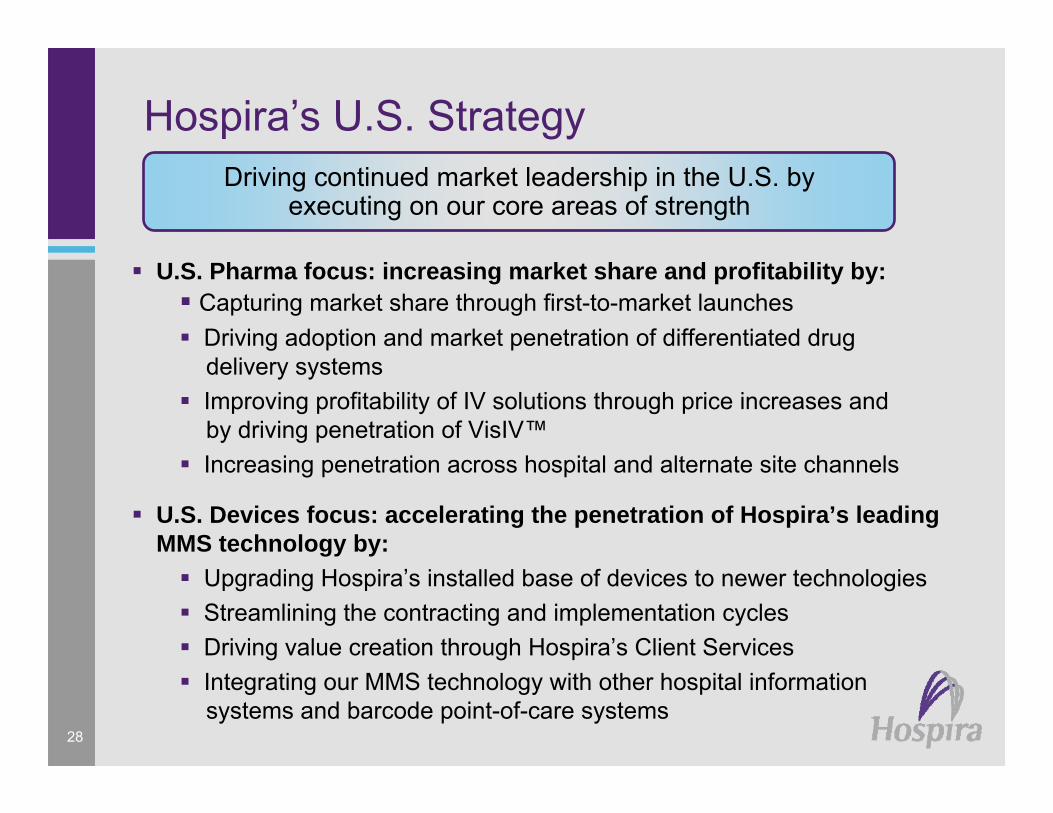
Hospira’s U.S. StrategyDriving continued market leadership in the U.S. by
executing on our core areas of strength
U.S. Pharma focus: increasing market share and profitability by:Capturing market share through first-to-market launchesDriving adoption and market penetration of differentiated drugdelivery systemsImproving profitability of IV solutions through price increases and by driving penetration of VisIV™Increasing penetration across hospital and alternate site channels
U.S. Devices focus: accelerating the penetration of Hospira’s leading MMS technology by:
Upgrading Hospira’s installed base of devices to newer technologiesStreamlining the contracting and implementation cyclesDriving value creation through Hospira’s Client Services Integrating our MMS technology with other hospital informationsystems and barcode point-of-care systems

29
Market Environment Outside the U.S.
Large, fragmented markets at least as large as the U.S.Widely diverse marketsIncreasing awareness of safety and medication management issues
– Significant growth potential– Demographic trends in developed countries
similar to U.S.Hospira currently has presence in more than 70 countries outside the U.S.
– Through direct sales force or distributor relationships

30
Hospira’s Strategy Outside the U.S.
Leverage our product strengths and customer relationships to drive growth
Leverage U.S. strengths where appropriateLeverage Mayne’s strong relationships, market knowledge and leadership positions in specialty injectable pharmaceuticalsMaximize return on existing product portfolioExpand product linesAdditional acquisitions and alliances possible

31
Hospira’s Core Strengths
Combined capabilities create abilityto provide unique, integrated productsto customers
Pharmaceutical and device competencies
Going forward, skill sets in both areaswill be necessary to be successful in the marketplace
Expertise in both generic and proprietary pharmaceuticals
Reliability of product and supply is critical to our customersQuality and manufacturing
Deep local market knowledgeand strong customer relationshipsSales and distribution
Provides customers with a“one-stop shop”
Breadth and depth of SIP and MMS product lines
Ability to move quickly to capitalizeon market opportunitiesSpeed in decision making
32
Financial Performance

33
Solid Financial Position with Significant Progress Toward Longer-term Goals
Faster-than-expected improvements since spin-off
Strong balance sheet
Solid cash-flow generation
Priority for available cash is to pay down debt incurred as a result of Mayne Pharma acquisition
34
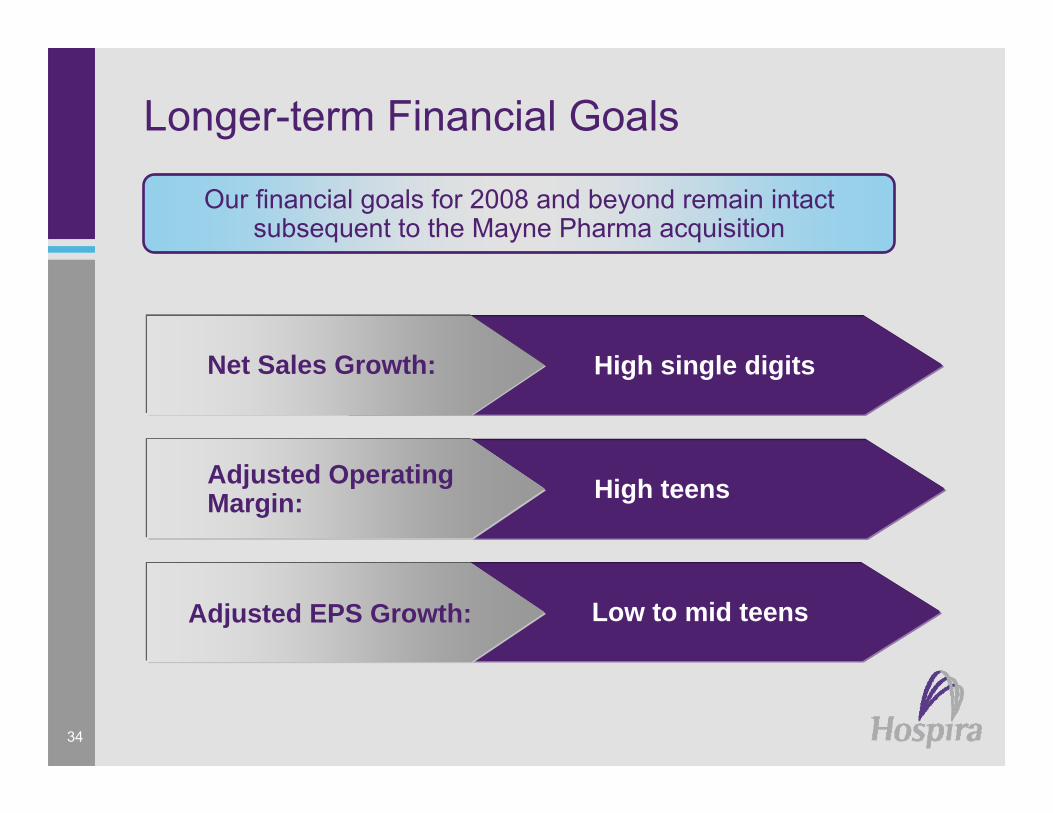
Longer-term Financial Goals
High single digits
High teens
Low to mid teens
Net Sales Growth:
Adjusted Operating Margin:
Adjusted EPS Growth:
Our financial goals for 2008 and beyond remain intact subsequent to the Mayne Pharma acquisition

35
Faster-than-expected Improvements Since Spin-off
* This is a non-GAAP financial measure. Descriptions of the adjustments made to the nearest GAAP measure and a full reconciliation to the GAAP results can be found at the end of this presentation.
** Other than Core Sales, 2003 numbers have not been adjusted.
$1.92
$1.82
4.5%
14.9%
29.9%
1%
1%
2004
$1.46
$1.91
5.3%
16.0%
34.2%
5%
(1)%
2005
16.2%13.7%Adjusted* Operating Margin
$1.94$1.67Adjusted* Diluted Earnings per Share
5.9%4.2%R&D as % of Sales
37.0%26.7%Adjusted* Gross Margin
$1.48$1.67Diluted Earnings per Share - GAAP
5%(2)%“Core” Net Sales Growth*
2%1%Net Sales Growth
2006(Pre-Spin)2003**

36
Balance Sheet Improvements Have Enabled Hospira to Pursue Attractive Opportunities
At December 31, $ Millions, except percentages
34.0%
$702
$917
$322
Historical
200620052004
34.4%
$695
$965
$521
$2,582$699Total Long-term Debt
67.0%41.5%Debt/Capital
$972$662Working Capital
$258$128Cash
Pro Forma*
* Assumes that the acquisition of Mayne Pharma and the related financing transactions, including the note offering completed on March 23, 2006, occurred on December 31, 2006. For further information, please refer to Exhibit 99.3to Hospira’s amended Current Report on Form 8-K/A filed with the SEC on March 20, 2007. The information presented in Exhibit 99.3 has been further adjusted to assume that the note offering had been completed on Dec. 31, 2006.

37
Solid Cash Flow Generation
$368 $387
$571
$424
$0
$100
$200
$300
$400
$500
$600
$ M
illio
ns
2003 2004 2005 2006(Pre-spin)
We have generated nearly $1.4 billion of Cash Flow from Operations over the last three years
Cash Flow from Operations

38
Long-term Investment Opportunity
Significant accomplishments since spin-off, highlighting our ability to execute
– Rapidly implementing our strategies for growth– Successfully completed the transition from Abbott
Leveraging our strong market positionsDriving solid financial performance
– Excellent cash-flow generation capability– Expected operating margin improvement driven by:
• Sales growth• Manufacturing cost improvements• Richer product mix
Transforming Hospira: reigniting growth and building a new culture
Leveraging leadership positions and increasing investments to drive growth and profitability
39
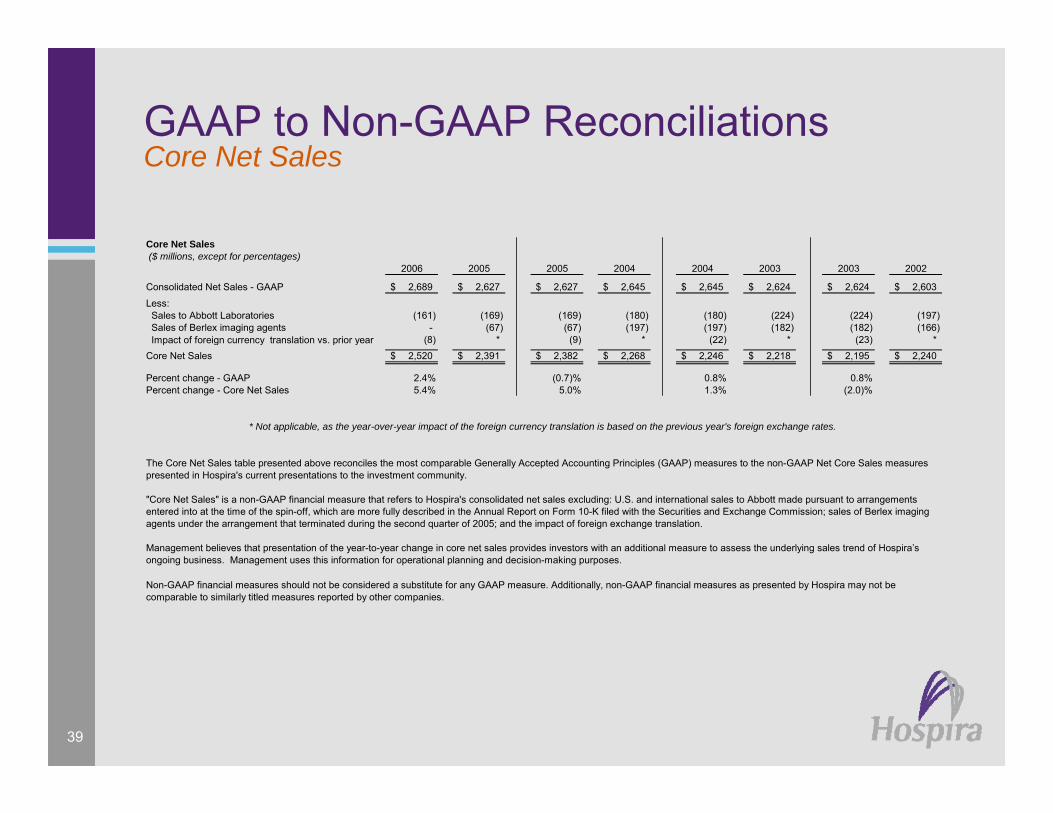
GAAP to Non-GAAP ReconciliationsCore Net Sales
Core Net Sales ($ millions, except for percentages)
2006 2005 2005 2004 2004 2003 2003 2002
Consolidated Net Sales - GAAP 2,689$ 2,627$ 2,627$ 2,645$ 2,645$ 2,624$ 2,624$ 2,603$
Less: Sales to Abbott Laboratories (161) (169) (169) (180) (180) (224) (224) (197) Sales of Berlex imaging agents - (67) (67) (197) (197) (182) (182) (166) Impact of foreign currency translation vs. prior year (8) * (9) * (22) * (23) *Core Net Sales 2,520$ 2,391$ 2,382$ 2,268$ 2,246$ 2,218$ 2,195$ 2,240$
Percent change - GAAP 2.4% (0.7)% 0.8% 0.8%Percent change - Core Net Sales 5.4% 5.0% 1.3% (2.0)%
Non-GAAP financial measures should not be considered a substitute for any GAAP measure. Additionally, non-GAAP financial measures as presented by Hospira may not be comparable to similarly titled measures reported by other companies.
The Core Net Sales table presented above reconciles the most comparable Generally Accepted Accounting Principles (GAAP) measures to the non-GAAP Net Core Sales measures presented in Hospira's current presentations to the investment community.
"Core Net Sales" is a non-GAAP financial measure that refers to Hospira's consolidated net sales excluding: U.S. and international sales to Abbott made pursuant to arrangements entered into at the time of the spin-off, which are more fully described in the Annual Report on Form 10-K filed with the Securities and Exchange Commission; sales of Berlex imaging agents under the arrangement that terminated during the second quarter of 2005; and the impact of foreign exchange translation.
* Not applicable, as the year-over-year impact of the foreign currency translation is based on the previous year's foreign exchange rates.
Management believes that presentation of the year-to-year change in core net sales provides investors with an additional measure to assess the underlying sales trend of Hospira’s ongoing business. Management uses this information for operational planning and decision-making purposes.

40
GAAP to Non-GAAP ReconciliationsOther Measures
GAAP Adjustments Adjusted GAAP Adjustments Adjusted GAAP Adjusted
Net sales 2,527,714$ -$ 2,527,714$ 2,457,588$ -$ 2,457,588$ 2.9 2.9Net sales to Abbott Laboratories 160,791 - 160,791 169,108 - 169,108 (4.9) (4.9)
Total Net Sales 2,688,505 - 2,688,505 2,626,696 - 2,626,696 2.4 2.4
Cost of products sold 1,749,262 (54,225) A 1,695,037 1,777,640 (48,722) E 1,728,918 (1.6) (2.0)Gross Profit 939,243 54,225 993,468 849,056 48,722 897,778 10.6 10.7
Research and development 161,621 (3,794) B 157,827 138,834 (906) B 137,928 16.4 14.4Acquired in-process research and development 10,000 (10,000) C - - - - nm nmSelling, general and administrative 428,038 (28,592) D 399,446 373,607 (34,249) B 339,358 14.6 17.7
Income From Operations 339,584 96,611 436,195 336,615 83,877 420,492 0.9 3.7
Interest expense 31,024 - 31,024 28,276 - 28,276 9.7 9.7Other (income), net (16,137) - (16,137) (13,736) - (13,736) 17.5 17.5
Income Before Income Taxes 324,697 96,611 421,308 322,075 83,877 405,952 0.8 3.8
Income tax expense 87,018 22,519 109,537 86,437 10,991 F 97,428 0.7 12.4Net Income 237,679$ 74,092$ 311,771$ 235,638$ 72,886$ 308,524$ 0.9 1.1
Earnings Per Common Share: Basic 1.51$ 0.47$ 1.98$ 1.48$ 0.46$ 1.94$ 2.0 2.1 Diluted 1.48$ 0.46$ 1.94$ 1.46$ 0.45$ 1.91$ 1.4 1.6
Weighted Average Common Shares Outstanding: Basic 157,368 157,368 157,368 159,275 159,275 159,275 (1.2) (1.2) Diluted 160,424 160,424 160,424 161,634 161,634 161,634 (0.7) (0.7)
Statistics (as a % of Total Net Sales, except for income tax rate)
Gross Profit 34.9% 37.0% 32.3% 34.2%
R&D 6.0% 5.9% 5.3% 5.3%
SG&A 15.9% 14.9% 14.2% 12.9%
Income From Operations 12.6% 16.2% 12.8% 16.0%
Income Before Income Taxes 12.1% 15.7% 12.3% 15.5%
Net Income 8.8% 11.6% 9.0% 11.7%
Income tax rate 26.8% 26.0% 26.8% 24.0%
A -- Includes costs of $64,251 related to the announced closures of the Donegal, Ireland; Ashland, OH; Montreal, Canada; and North Chicago, IL facilities as part of Hospira's manufacturing optimization initiatives; a reduction of the obligation associated with the sale of the Salt Lake City, UT manufacturing plant to ICU Medical ($6,825); a gain on the sale of the Donegal, Ireland facility ($7,851); integration costs associated with the acquisition of Mayne Pharma of$114; and non-recurring transition costs of $4,536.B -- Non-recurring transition costs.C -- Acquired in-process research and development related to the acquisition of BresaGen.D -- Includes integration charges of $1,820 related to the acquisition of Mayne Pharma, integration charges of $95 related to the acquisition of BresaGen, and non-recurring transition costs of $26,677.E -- Includes an impairment charge of $2,429 and other charges of $13,754 related to the sale of the Salt Lake City, UT manufacturing plant to ICU Medical; $8,616 related to the closure of the Donegal, Ireland facility as part of Hospira's manufacturing optimization initiatives; impairment charges of $13,074 related to the Montreal, Canada and Ashland, Ohio manufacturing facilities; and non-recurring transition costs of $10,849.F -- Includes $9,139 tax impact of earnings repatriation related to The American Jobs Creations Act.
Hospira, Inc.Reconciliation of Consolidated Statements of Income
2006 2005Twelve Months Ended December 31
(Unaudited)(dollars and shares in thousands, except per share amounts)
% Change vs. Prior Year

41
GAAP to Non-GAAP ReconciliationsOther Measures (continued)
2003*
GAAP Adjustments Adjusted GAAP GAAP Adjusted**
Net sales 2,465,052$ 2,465,052$ 2,400,228$ 2.7 2.7%Net sales to Abbott Laboratories 179,984 179,984 223,509 (19.5) (19.5)
Total Net Sales 2,645,036 - 2,645,036 2,623,737 0.8 0.8%
Cost of products sold 1,858,435 (4,819) A 1,853,616 1,922,686 (3.3) (3.6)Gross Profit 786,601 4,819 791,420 701,051 12.2 12.9%
Research and development 119,583 (279) A 119,304 109,720 9.0 8.7%Selling, general and administrative 304,004 (27,123) A 276,881 230,956 31.6 19.9%
(64,636) 64,636 B - - nmIncome From Operations 427,650 (32,415) 395,235 360,375 18.7 9.7%
Interest expense 18,758 18,758 - nmOther (income) expense, net (2,628) (189) A (2,817) 1,254 nm
Income Before Income Taxes 411,520 (32,226) 379,294 359,121 14.6 5.6%
Income tax expense 109,968 (16,234) C 93,734 98,758 11.4 (5.1)Net Income 301,552$ (15,992)$ 285,560$ 260,363$ 15.8 9.7%
Earnings Per Common Share: Basic 1.93$ (0.10)$ 1.83$ 1.67$ Diluted 1.92$ (0.10)$ 1.82$ 1.67$
Weighted Average Common Shares Outstanding: Basic 156,187 156,187 156,187 156,043 Diluted 157,160 157,160 157,160 156,043
Statistics (as a % of Total Net Sales, except for Income tax rate)
Gross Profit 29.7% 29.9% 26.7%
R&D 4.5% 4.5% 4.2%
SG&A 11.5% 10.5% 8.8%
Income From Operations 16.2% 14.9% 13.7%
Income Before Income Taxes 15.6% 14.3% 13.7%
Net Income 11.4% 10.8% 9.9%
Income tax rate 26.7% 24.7% 27.5%
A -- Non-recurring transition costs.B -- Curtailment gain ($64,636).
** Year-over-year adjusted performance comparisons are between Adjusted Results in 2004 and GAAP results in 2003. Results for 2003 do not include any of the ongoing, incremental costs of being a standalone public company or any non-recurring transition costs.
C -- Curtailment gain is tax effected at 37.5%, while non-recurring transition costs are tax effected at 24.7%. Fourth Quarter 2004 includes impact of decreasing overall effective tax rate from 26% to 24.7%.
% Change vs. Prior Year
Hospira, Inc.Reconciliation of Statements of Income
(Unaudited)(dollars and shares in thousands, except per share amounts)
* Hospira spun off from Abbott Laboratories on April 30, 2004. Results for the portion of 2004 after the spin-off reflect the company's status as an indpendent public company; the portion of 2004 prior to the spin-off and full-year 2003 performance reflect results for the business operated as a part of Abbott Laboratories. Results for 2003 do not include any of the ongoing, incremental costs of being a standalone public company or any non-recurring transition costs.
Twelve Months Ended December 31
Curtailment of post-retirement medical and dental benefits
2004*
42
GAAP to Non-GAAP ReconciliationsOther Measures (continued)
Adjusted Gross Margin
Adjusted Operating Margin
Adjusted Diluted Earnings Per Share
Management believes that these non-GAAP financial measures, when presented together with, and reconciled to, the comparable measures presented in accordance with GAAP, are useful to both management and investors in their analysis of the company’s ongoing business and operating performance. Management believes that such presentation enables investors to have more complete information with which to assess the company's base results of operation and prospects. Such presentation also facilitates period-to-period comparison of Hospira's base operating results. Management uses this information for operational planning and decision-making purposes. Non-GAAP financial measures should not be considered a substitute for any GAAP measure. Additionally, non-GAAP financial measures as presented by Hospira may not be comparable to similarly titled measures reported by other companies.
The financial information included in this presentation for 2003 and the first four months of 2004 represents a compilation that reflects the results of the businesses that now comprise Hospira as they operated as part of Abbott. It does not reflect Hospira's results of operations had Hospira been a stand-alone company for those periods.
The tables presented on the previous slide reconcile the most comparable Generally Accepted Accounting Principles (GAAP) measures to the non-GAAP financial and operating measures presented in Hospira's current presentations to the investment community.
Adjusted Gross Margin is a non-GAAP financial measure that refers to Hospira's gross profit excluding certain items as noted below, divided by consolidated net sales. The adjusted gross profit excludes: non-recurring transition expenses in 2005 and 2004 that are related to Hospira becoming an independent, stand-alone company, including expenses relating to the establishment of new facilities, the build-out of independent information technology systems, and product registration and re-labeling; charges in 2005 associated with the impairment related to the Montreal, Canada and Ashland, Ohio facilities and the company’s manufacturing optimization initiatives, which included the sale of the Salt Lake City facility to ICU Medical, Inc. and the planned closing of the Donegal, Ireland facility.
Adjusted Operating Margin is a non-GAAP financial measure that refers to Hospira's operating income excluding certain items as noted below, divided by consolidated net sales. The adjusted gross profit excludes: non-recurring transition expenses in 2005 and 2004 that are related to Hospira becoming an independent, stand-alone company, including expenses relating to the establishment of new facilities, the build-out of independent information technology systems, and product registration and re-labeling; charges in 2005 associated with the impairment related to the Montreal, Canada and Ashland, Ohio facilities and the company’s manufacturing optimization initiatives, which included the sale of the Salt Lake City facility to ICU Medical, Inc. and the planned closing of the Donegal, Ireland facility; and a non-cash curtailment gain in 2004 related to the discontinuation of the company's post-retirement medical and dental plans.
Adjusted Diluted Earnings Per Share is a non-GAAP financial measure that refers to Hospira’s diluted earnings per share figures and that exclude, net of tax: the non-recurring transition expenses in 2005 and 2004 that are related to Hospira becoming an independent, stand-alone company, including expenses relating to the establishment of new facilities, the build-out of independent information technology systems, and product registration and re-labeling; charges in 2005 associated with the impairment related to the Montreal, Canada and Ashland, Ohio facilities and the company’s manufacturing optimization initiatives, which in 2005 included the sale of the Salt Lake City facility to ICU Medical, Inc. and the planned closing of the Donegal, Ireland facility; the tax impact related to the company’s decision to repatriate undistributed foreign earnings in 2005 of $175.0 million under The Jobs Creation Act of 2004; and a non-cash curtailment gain in 2004 related to discontinuation of the company’s post-retirement medical and dental plans.

Hospira, Inc.
Advancing Wellness™ through the right people and the right products