Hoonyol Lee, Jae-Hee Lee Kangwon National University, Korea
42
An Experiment of GB-SAR An Experiment of GB-SAR Interferometric Measurement Interferometric Measurement of Target Displacement and of Target Displacement and Atmospheric Correction Atmospheric Correction Hoonyol Lee, Jae-Hee Lee Hoonyol Lee, Jae-Hee Lee Kangwon National University, Korea Kangwon National University, Korea Seong-Jun Cho, Nak-Hoon Sung, Jung-Ho Kim Seong-Jun Cho, Nak-Hoon Sung, Jung-Ho Kim Korea Institute of Geoscience and Mineral Korea Institute of Geoscience and Mineral Resources Resources IGARSS2008, Boston, MA, USA
-
Upload
sumitra-chetan -
Category
Documents
-
view
37 -
download
1
description
IGARSS2008, Boston, MA, USA. An Experiment of GB-SAR Interferometric Measurement of Target Displacement and Atmospheric Correction. Hoonyol Lee, Jae-Hee Lee Kangwon National University, Korea Seong-Jun Cho, Nak-Hoon Sung, Jung-Ho Kim Korea Institute of Geoscience and Mineral Resources. - PowerPoint PPT Presentation
Transcript of Hoonyol Lee, Jae-Hee Lee Kangwon National University, Korea

An Experiment of GB-SAR Interferometric An Experiment of GB-SAR Interferometric Measurement of Target Displacement and Measurement of Target Displacement and
Atmospheric CorrectionAtmospheric Correction
Hoonyol Lee, Jae-Hee Lee Hoonyol Lee, Jae-Hee Lee Kangwon National University, KoreaKangwon National University, Korea
Seong-Jun Cho, Nak-Hoon Sung, Jung-Ho KimSeong-Jun Cho, Nak-Hoon Sung, Jung-Ho KimKorea Institute of Geoscience and Mineral ResourcesKorea Institute of Geoscience and Mineral Resources
IGARSS2008, Boston, MA, USA
Contents
• GB-SAR System
• Displacement Measurement
• Atmospheric Correction
• Conclusion

Introduction• GB-SAR: Ground-Based Synthetic Aperture Radar
– “Synthetic Aperture Radar”• Imaging Radar• Azimuth aperture synthesis
– “Ground-Based”• Fairly versatile system configuration
– Multiple frequency (L, C, X, Ku, Ka, etc)– Full Polarization (VV, VH, HV, HH)
• Ultimate SAR focusing– Zero Doppler centroid (stationary vehicle and target during Tx/Rx)– Accurate estimation of Doppler rate from geometry
• Topography Mapping: Cross-Track InSAR• Surface Motion: Zero-baseline and short atmospheric path for high temporal
coherency, DInSAR• Useful for new SAR concept design
• GB-SAR Activities– EU and Japan for avalanche, landslide, glacier, building monitoring

GB-SAR System
< Example >Center frequency : 5.3 GHz
Range bandwidth : 600 MHz Range resolution: 25 cmNumber of points : 1601Maximum Range: 200 m Azimuth length : 5 m Azimuth Step : 5 cm Azimuth Resolution: 0.32 degreeAzimuth width: 32 degree Power : 33 dBmPolarization: Full


System Configuration
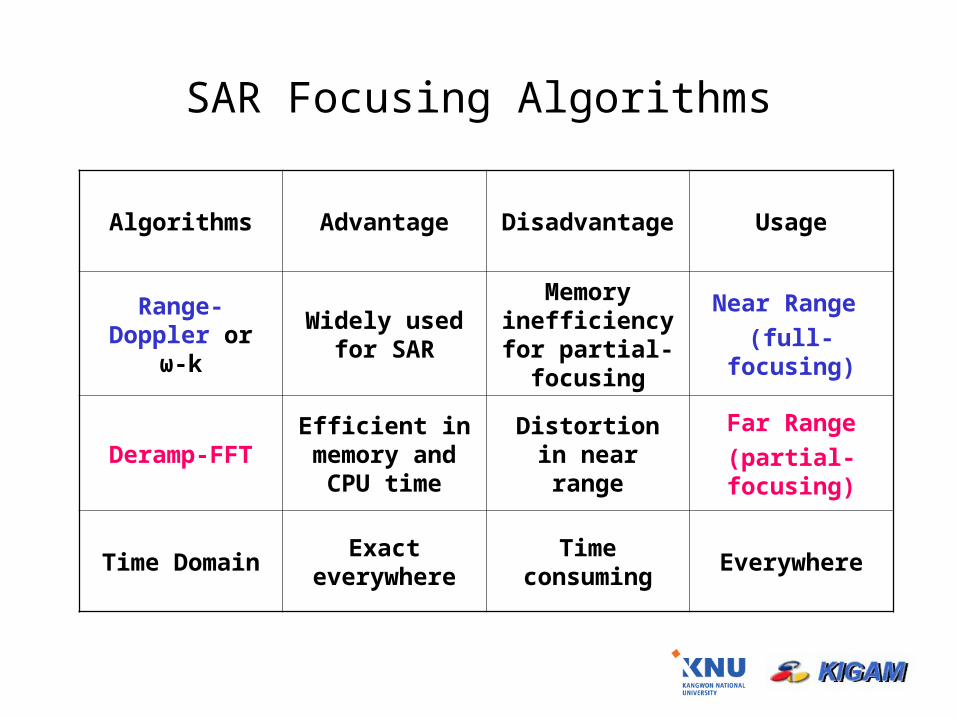
SAR Focusing Algorithms
Algorithms Advantage Disadvantage Usage
Range-Doppler or ω-k
Widely used for SAR
Memory inefficiency for partial-focusing
Near Range
(full-focusing)
Deramp-FFTEfficient in
memory and CPU time
Distortion in near range
Far Range
(partial-focusing)
Time Domain Exact everywhere Time consuming Everywhere

DF vs RD (Indoor)
(a) DF algorithm (b) RD algorithm

DF vs RD (outdoor)
(a) DF algorithm (2MB Memory)
(b) DF algorithm (geocoded) (b) RD algorithm (128MB Memory)

GB-SAR Resolutions
(a) Full Focusing (Region IV) (b) Partial Focusing (Region I)
2
ResolutionAzimuth
aLx
MHz) 600for cm (252
Resolution Range
BB
cR
band)-C m, 5for 3.0(
2,
2
ResolutionAzimuth
X
XX
Rx

Image Area (Bw = 200 MHz)

VV
T1

VH
T1

HH
T1

DInSAR (T2-T1): Temporal baseline of 20 minutes
VV

Cross-Track InSAR (T3-T2)Vertical baseline of 30cm
VV

Delta-f InSAR (T4-T3)Carrier frequency shift of -10 MHz
VVVV

Cross-Track and Delta-f InSAR (T4-T2)
Vertical baseline of 30 cm, Carrier frequency shift of -10MHz
VVVVVV

Wider View2cm Step, 2007. 3. 19 7:22pm- 4:20am, A1~A9
HHVV

System Phase Errors
Ideal CaseA6-A5, HH
Azimuth scan shift of 2cm. A9-A1, HH
Range System Shift of 2mm
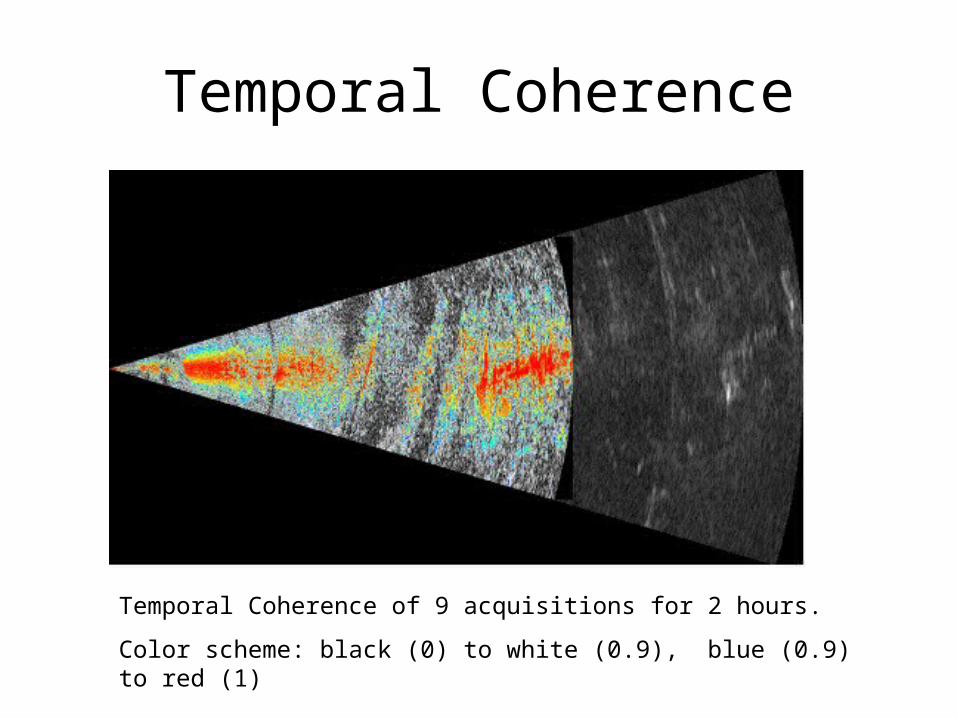
Temporal Coherence
Temporal Coherence of 9 acquisitions for 2 hours.
Color scheme: black (0) to white (0.9), blue (0.9) to red (1)

Measurement of Target DisplacementMeasurement of Target Displacement
2007. 7. 18 3pm ~ 7pm2007. 7. 18 3pm ~ 7pm

Image Area (KIGAM, Daejeon, Korea)
Image Area

Precise Motion of the Trihedral Corner Reflector (160m away from the system)
↑ Radar
Direction
A trihedral corner reflector on top of an acrylic plate with rulers on both sides
Displacements toward GB-SAR:
1, 6, 10, 30, and 40 mm

GB-SAR Images
VV VH
HV HH

Comparisons with Actual Displacement
Co-polarization

Cross-polarization
Comparisons with Actual Displacements

GB-SAR Interferometry in a Non-Dispersive Medium
• GB-SAR phase in a medium:
n = refractive index λ = wavelength R = range
• Displacement sensitivity of phase:
ex) -12.72 degree/mm for C-band when n = 1 (vacuum)
4
Rn
4Rn
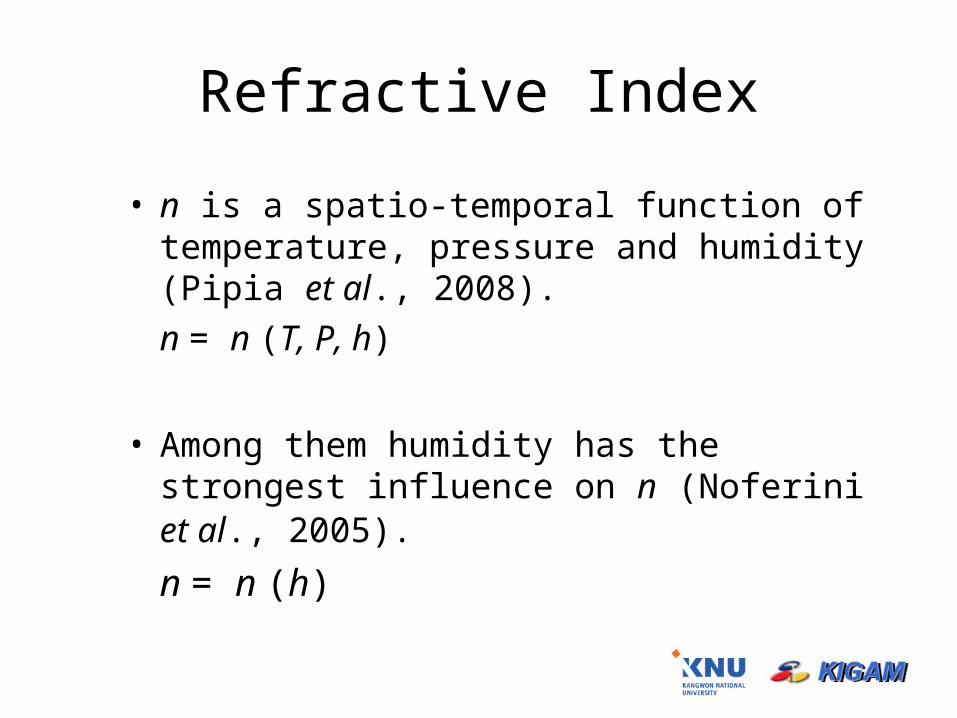
Refractive Index
• n is a spatio-temporal function of temperature, pressure and humidity (Pipia et al., 2008).
n = n (T, P, h)
• Among them humidity has the strongest influence on n (Noferini et al., 2005).
n = n (h)

Phase/Range vs. Humidity

Atmospheric Correction Algorithm
• Strong linear trend between phase/range and humidity
• Atmospheric correction algorithm:
4/ R n ah b

Regression Coefficients
a b
Total -4.32×10⁻⁴ 2.06×10⁻²
HH -4.54×10⁻⁴ 2.18×10⁻²
VV -4.70×10⁻⁴ 2.24×10⁻²
VH -3.93×10⁻⁴ 1.88×10⁻²
HV -4.20×10⁻⁴ 2.00×10⁻²
4/ (47% 58%)R n ah b h
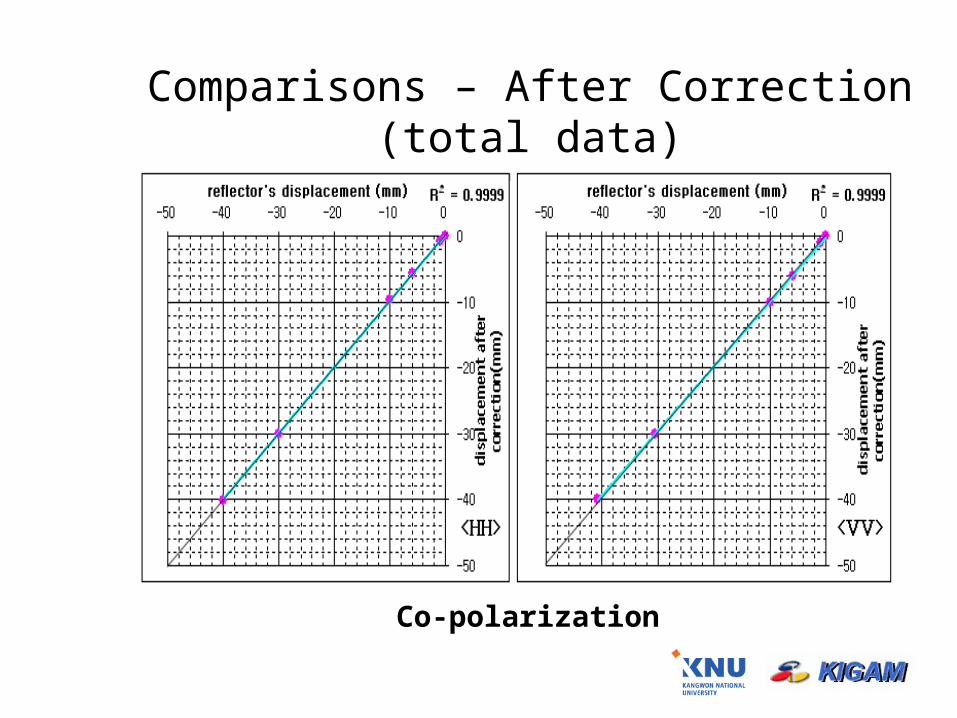
Comparisons – After Correction (total data)
Co-polarization

Cross-polarization
Comparisons – After Correction (total data)

Comparisons – After Correction (each pol.)
Co-polarization

Cross-polarization
Comparisons – After Correction (each pol.)

RMS Errors
Before Correction (mm)
Total Correction (mm)
Each-pol. Correction (mm)
HH 1.560 0.188 0.219
VV 1.124 0.482 0.618
VH 0.764 0.918 0.783
HV 1.446 0.488 0.471

Comparison with Pipia et al., 2008
• Pipia et al., 2008– X-band (9.65GHz) GB-SAR system– HH polarization– Temp: 21°C– Humidity: 44 ~ 59%
• Our algorithm in HH polarization at 52% humidity (average of Pipia et al.) is:
33.30 10 R
31.85 10 R

Wavelength Dependency of Phase Delay
• n is constant over the wide range of electromagnetic spectrum (non-dispersive).
• Phase delay is inversely proportional to wavelength.
• Gradient ratio between X and C-band: 1.78
• Wavelength ratio between C and X-band: 1.82
4
Rn
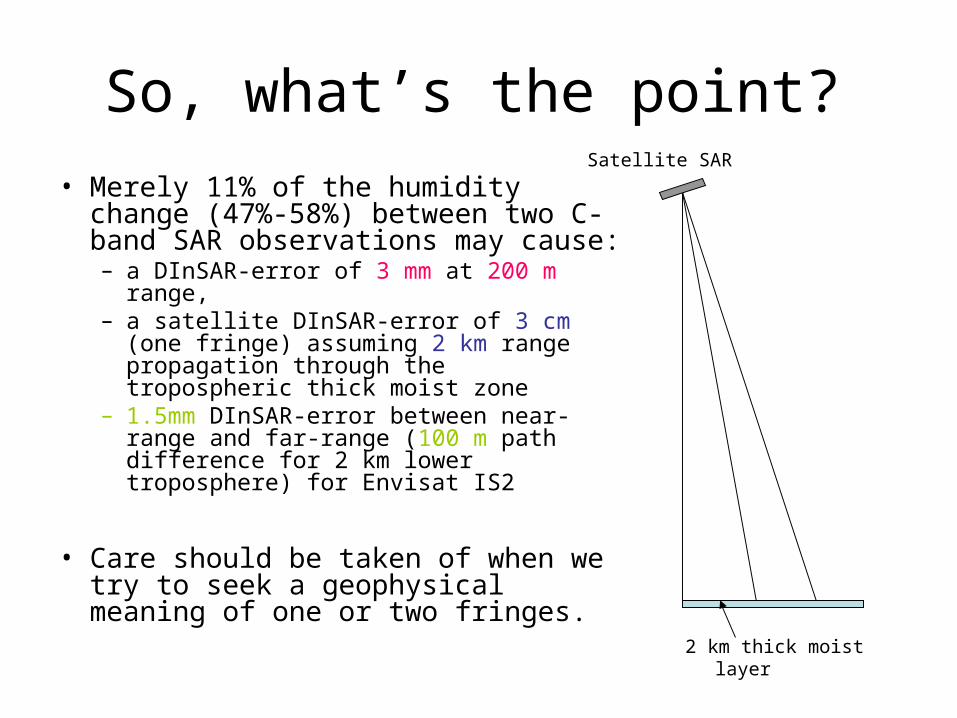
So, what’s the point?
• Merely 11% of the humidity change (47%-58%) between two C-band SAR observations may cause:– a DInSAR-error of 3 mm at 200 m range,– a satellite DInSAR-error of 3 cm (one fringe)
assuming 2 km range propagation through the tropospheric thick moist zone
– 1.5mm DInSAR-error between near-range and far-range (100 m path difference for 2 km lower troposphere) for Envisat IS2
• Care should be taken of when we try to seek a geophysical meaning of one or two fringes.
2 km thick moist layer
Satellite SAR

Conclusion
• We made a SAR system capable of highly accurate consecutive measurements.
• GB-SAR displacement measurement have shown 2-3 mm error with moisture change of 11% (47-58%) at 160 m range.
• Phase/Range vs humidity showed highly linear trend, resulting in a simple atmospheric correction algorithm in terms of humidity.
• Comparison with an X-band experiment (Pipia et al., 2008) confirmed the non-dispersive nature of microwave.
• Merely 11% moisture change both in time and space, for example, is enough to generate one or two fringes for satellite-based InSAR applications.

Thank YouThank You