Honors Thesis Hieu Luu Colgate University Thesis...
36
The Relationship between Employee Attitudes and Organizational Performance: Evidence from Cooperative Retail Stores Honors Thesis Hieu Luu Colgate University Thesis Advisor: Professor Takao Kato May 2011
Transcript of Honors Thesis Hieu Luu Colgate University Thesis...
The Relationship between Employee Attitudes and Organizational Performance: Evidence
from Cooperative Retail Stores
Honors Thesis
Hieu Luu
Colgate University
Thesis Advisor: Professor Takao Kato
May 2011
Abstract
This paper is an examination of the relationship between employee attitudes and selected measures of job performance (sales volume, turnover, and absenteeism). Using annual employee survey data from Eroski, a cooperative retail business in Spain, I find evidence that employee attitudes are positively related to sales volume. This relationship is, however, only present in stores with a high level of employee ownership and employee involvement (called Coop stores). In stores with lower level of employee ownership (called Gespa stores), no such evidence is found. In both types of stores, I do not find evidence that employee attitudes are related to turnover rate and absenteeism rate. These empirical findings fit well with previous literature on job attitudes and producer cooperatives. I will also argue that the findings are consistent with Coop’s superior institutional features over Gespa’s. Keywords: Employee Attitudes, Job Satisfaction, Organizational Performance, Producer Cooperatives JEL Classification: J54, J28, L25
I am very grateful to Professor Jyoti Khanna, my classmates, and other professors in my seminar presentations for their helpful comments. I want to thank Professor Takao Kato for providing me with the Mondragon dataset, and especially for his valuable advice not only on this project but on many other occasions during my college career.
I. Introduction
Can employees’ job attitudes determine the economic performance of their workplace?
This question, usually called the attitude-performance problem, has drawn extensive research
from all fields of behavioral sciences over the past 70 years. Due to its significance in business
management and human psychology, the answer to it has often been referred to as the “Holy
Grail” in organizational behavior research (Weiss & Cropanzano, 1996). Nonetheless, such
answer is yet to be found. Theories concerning job satisfaction are still weak; empirical studies
provide mixed results. The situation calls for further investigations.
This paper is an attempt to provide more insights and evidence into this attitude-
performance question. Using data from an employee attitude survey of a retail business in Spain,
I will determine whether employee attitudes could be associated with economic performance at
the organizational level. Organizational performance will be specifically measured by a set of
three variables: sales performance, turnover, and absenteeism. The main focus is on sales
performance; however, turnover and absenteeism are included in the analysis because a high rate
of either ones will increase the cost of labor for the firm, which consequently reduces
organizational efficiency. Traditionally most research on job satisfaction was conducted at the
individual worker level. My analysis here, however, will be performed at the organizational
level. For each retail store in the sample, an Employee Attitude Index (EAI) will be created to
capture the employee satisfaction climate of the store. Furthermore, particular attention will be
paid to the ownership scheme and the institutional framework of the workplace. I presume that
organizational structures and ownerships will affect how workers perceive and identify
themselves with their jobs. As a result, a worker could react differently to the same increase in
job satisfaction depending on whether he/she is an owner of the workplace. This hypothesis
motivates me to explore how the attitude-performance relationship is affected by the levels of
employee involvement and of employee ownership. In other words, is the attitude-performance
relationship more significant in workplaces where employees are also owners and are heavily
involved in the management?
The empirical data for this study is obtained from the Eroski retail chain, headquatered in
the Basque region of Spain. Eroski group is the third biggest retail business in Spain, with
employment reaching 50,587 in 2007. The company was founded in 1969 as a member
organization of the Mondragon Cooperatives (MCC); as such, its store units have traditionally
followed the cooperative model where all employees are also owners and have significant power
over the management. These traditional cooperative stores are commonly referred to as Coop
stores, and are located in Northern Spain. Beginning in 1997, in an effort to expand their market,
Eroski have opened up stores in other parts of Spain. Most of these newer stores follow an
organizational structure called Gespa - a hybrid between cooperative models and capitalist
models. In these Gespa stores, the level of employee ownership and involvement is considerably
less than in Coop stores. This heterogeneity of ownership and involvement will serve as a key
point in my identification of the attitude-performance relationship.
The attitude survey was conducted in two years, 2006 and 2008, in both Coop and Gespa
stores. Each employee was asked number of written questions regarding their satisfaction with
various aspects of their job; their responses were recorded anonymously. By matching a store’s
survey data with its corresponding performance data in 2006 and 2008, I can assess the
relationship between the store’s employee attitudes and different measures of economic
performance. The empirical analysis supports the following conclusion. Employee attitudes and
organizational performance are linearly related; however, this attitudes- performance relationship
is fundamentally different between Coop and Gespa stores. Out of the three specified
performance variables, sales volume and turnover rate are related to attitudes in Coop stores,
while absenteeism is related to attitudes in Gespa stores. The empirical findings suggest that the
level of employee ownership and involvement might affect how attitudes and performance are
associated. Qualitative evidence will be provided in later parts in order to interpret the empirical
findings. The rest of the paper will proceed as follow. Section II outlines important institutional
features of Coop and Gespa stores. Section III reviews relevant studies in the literature
concerning job satisfaction, economic performance, and employee ownership and involvement.
Section IV describes the data and method. Section V presents the econometric specification and
estimation results. Section VI concludes.
II. The Case – Eroski Retail Stores
As aforementioned, our case Eroski is a large retail business in Nothern Spain and a
member organization of the greater Mondragon Cooperatives (MCC). Founded in the late 1950s,
Mondragon is now a highly successful cooperative consortium in Spain.1 Mondragon is an
organization of over 250 cooperative subsidiary firms spanning four business areas: Finance,
Industrial Manufacturing, Distribution, and Research and Education, where Eroski is part of the
Distribution group. A democratic, labor-managed enterprise, Eroski is a distinctive case in many
ways.2
1 The economic success of Mondragon has attracted considerable interest from scholars and proponents of cooperative organizations. For discussions of Mondragon and its success, please see for example: Johnson and Whyte (1977), Bradley and Gleb (1982) and Whyte (1999).
Since cooperative firms are relatively rare (compared to conventional capitalists) and
generally not well-understood, this part will outline important features concerning the company
2 The International Cooperative Alliance (ICA), to which many cooperative firms around the world belong, has specified seven cooperative principles: Voluntary and Open Membership; Democratic Member Control; Member Economic Participation; Autonomy and Independence; Education, Training and Information; Co-operation among Cooperatives, and Concern for Community. Eroski stores, especially Coops, have been operating in close accordance with these principles.
and its institutional framework in order to supplement the econometric interpretations in later
parts.
Eroski first began operation in 1969 as a single store; since then it has been on a steady
growth path. Nowadays it is the third largest retail chain in Spain in terms of retail floor space
and the largest single employer in the Mondragon group (employing about half of the total
Mondragon workforce). As of 2008, Eroski have a total of 2441 retail outlets; most of them are
located in Spain (2398 units), the remainder in France and Andorra. Under the common
CONSUM brand name, these retail outlets are divided into three subgroups: hypermarkets,
supermarkets, and specialized shops. Due to the availability of the survey data, this study will
focus exclusively on the hypermarket subgroup; analysis concerning supermarkets and
specialized stores is left for future research. In 2008, Eroski owns a total of 109 hypermarkets.
Usually located in the outskirt of the cities, Eroski hypermarkets are large department stores that
offer a very diverse range of products. Each hypermarket is divided into three sections: food,
clothing and domestic products. Most items in stock are on display to attract a wide range of
customers. Self-service is typical in most departments, except in some specialized food
departments where customers occasionally consult the expertise of sales clerks. The task for the
majority of employees consists of receiving and shelving goods, and maintaining the cleanliness
and the appearance of their departments.
Despite considerable economic success, Eroski did not seek to expand their market beyond
the Basque region until fairly recently in 1997. This delayed expansion is partly because the
company used to be highly committed to its traditional cooperative model, which emphasizes
employee’s democratic control and thus does not facilitate fast and massive size expansions
(Bakaikoa et al., 2004). In 1997, when faced with increasing competitions, Eroski decided to
open a number of new stores that do not necessarily follow traditional cooperative models.
Consequently, now Eroski stores have different organizational structures. Stores opened prior to
1997 are traditional cooperative units (Coop stores). Stores opened after 1997 sacrifice some of
the original cooperative spirit in favor of fast expansions. These newer stores either follow a
secondary form of cooperative structure (called Gespa) or simply adopt a pure capitalist structure
with no cooperative features involved. Within the hypermarket subgroup of Eroski, no newer
store follows the pure capitalist structure. For the purpose of this paper, we are only concerned
with hypermarkets, so only the distinction between Coop and Gespa is necessary and will be
discussed below.
One of the most fundamental differences between Coop and Gespa stores is their
ownership. Coop stores are solely owned by its workers. All Coop workers who have permanent
contract are expected to become cooperative members after a short probationary period (usually
less than six months) (Arando et. al. 2011). A key requirement for a prospective member is the
willingness to buy a substantial amount of stake in the store. After this capital commitment, the
probationary worker will effectively become a coop member and an owner of the store. In 2009,
this minimum initial stake for Coop membership is 6000 Euros, which amounts to about 30% of
the average annual remuneration in an Eroski store. 20% of this initial stake will be allocated to
the store’s collective reserve, while the rest remains individually owned. Over time, this initial
stake will grow in size as profits made by Eroski are credited to individual member’s accounts.
These individual accounts also yield an annual interest rate, usually set above the market rate. On
the other hand, in Gespa stores, the initial capital requirement to become an owner is only as half
as that in Coops, or about 3000 Euros. As in Coops, this initial stake will also grow over time, as
store surpluses are distributed to the worker-owners’ accounts. However, since the first Gespa
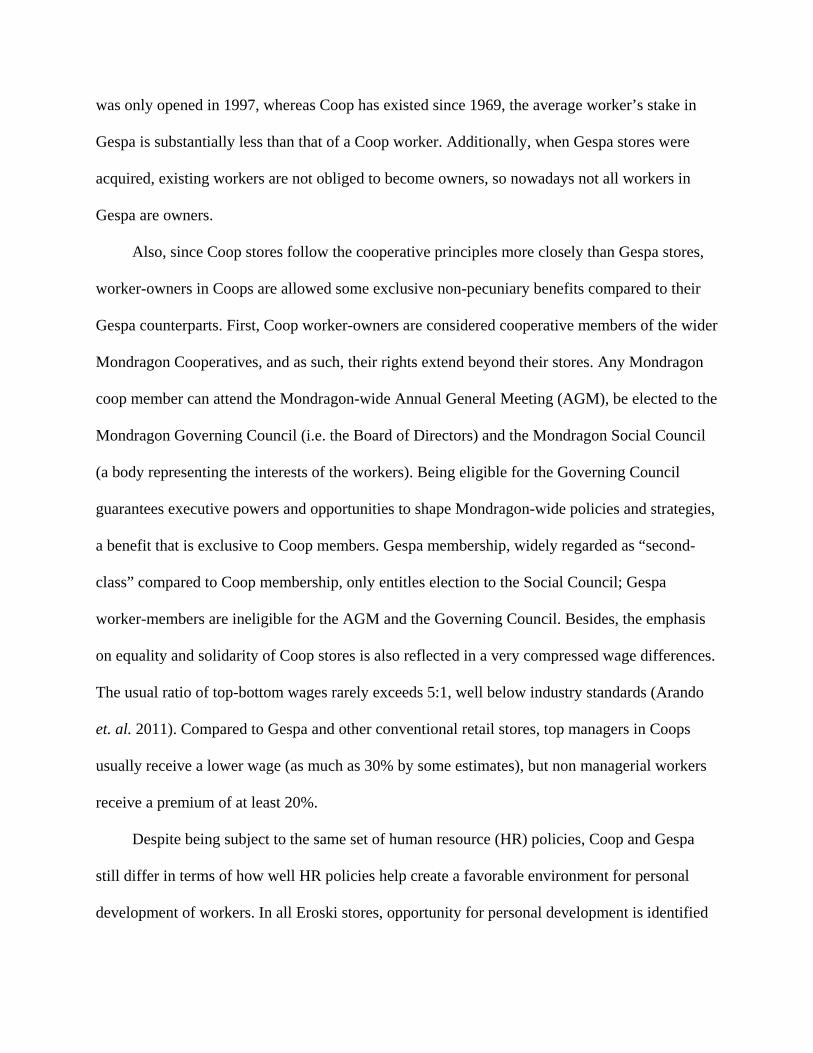
was only opened in 1997, whereas Coop has existed since 1969, the average worker’s stake in
Gespa is substantially less than that of a Coop worker. Additionally, when Gespa stores were
acquired, existing workers are not obliged to become owners, so nowadays not all workers in
Gespa are owners.
Also, since Coop stores follow the cooperative principles more closely than Gespa stores,
worker-owners in Coops are allowed some exclusive non-pecuniary benefits compared to their
Gespa counterparts. First, Coop worker-owners are considered cooperative members of the wider
Mondragon Cooperatives, and as such, their rights extend beyond their stores. Any Mondragon
coop member can attend the Mondragon-wide Annual General Meeting (AGM), be elected to the
Mondragon Governing Council (i.e. the Board of Directors) and the Mondragon Social Council
(a body representing the interests of the workers). Being eligible for the Governing Council
guarantees executive powers and opportunities to shape Mondragon-wide policies and strategies,
a benefit that is exclusive to Coop members. Gespa membership, widely regarded as “second-
class” compared to Coop membership, only entitles election to the Social Council; Gespa
worker-members are ineligible for the AGM and the Governing Council. Besides, the emphasis
on equality and solidarity of Coop stores is also reflected in a very compressed wage differences.
The usual ratio of top-bottom wages rarely exceeds 5:1, well below industry standards (Arando
et. al. 2011). Compared to Gespa and other conventional retail stores, top managers in Coops
usually receive a lower wage (as much as 30% by some estimates), but non managerial workers
receive a premium of at least 20%.
Despite being subject to the same set of human resource (HR) policies, Coop and Gespa
still differ in terms of how well HR policies help create a favorable environment for personal
development of workers. In all Eroski stores, opportunity for personal development is identified
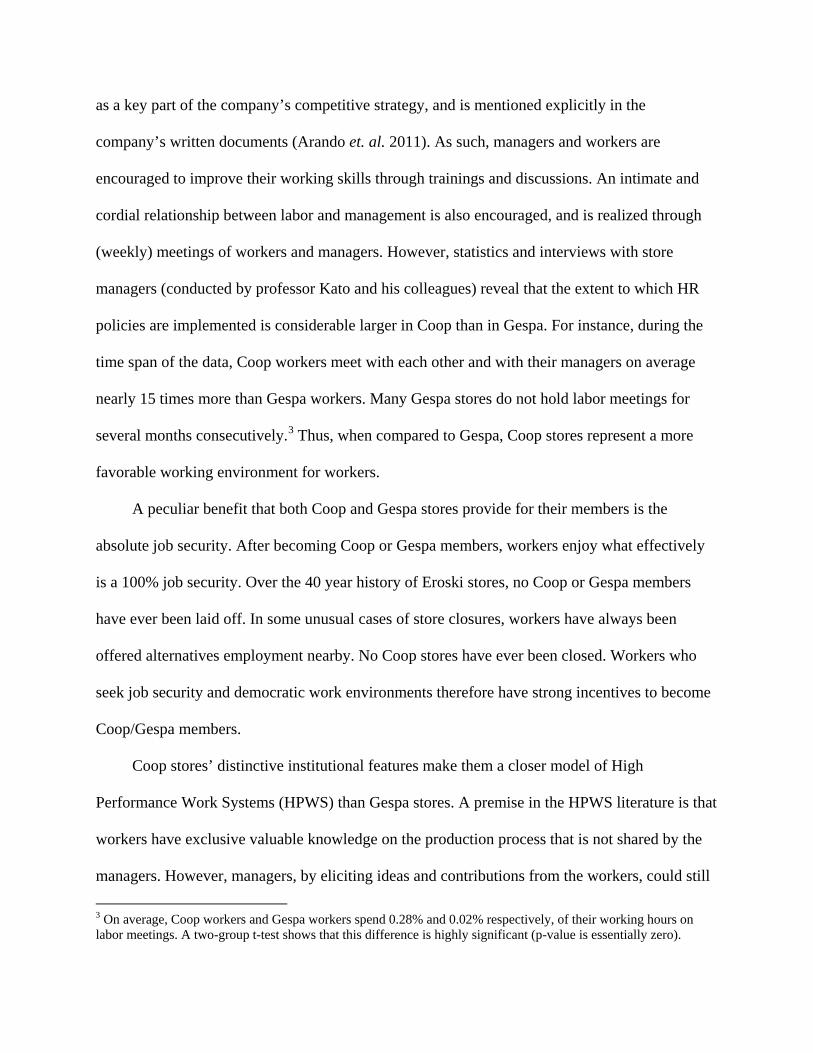
as a key part of the company’s competitive strategy, and is mentioned explicitly in the
company’s written documents (Arando et. al. 2011). As such, managers and workers are
encouraged to improve their working skills through trainings and discussions. An intimate and
cordial relationship between labor and management is also encouraged, and is realized through
(weekly) meetings of workers and managers. However, statistics and interviews with store
managers (conducted by professor Kato and his colleagues) reveal that the extent to which HR
policies are implemented is considerable larger in Coop than in Gespa. For instance, during the
time span of the data, Coop workers meet with each other and with their managers on average
nearly 15 times more than Gespa workers. Many Gespa stores do not hold labor meetings for
several months consecutively.3
A peculiar benefit that both Coop and Gespa stores provide for their members is the
absolute job security. After becoming Coop or Gespa members, workers enjoy what effectively
is a 100% job security. Over the 40 year history of Eroski stores, no Coop or Gespa members
have ever been laid off. In some unusual cases of store closures, workers have always been
offered alternatives employment nearby. No Coop stores have ever been closed. Workers who
seek job security and democratic work environments therefore have strong incentives to become
Coop/Gespa members.
Thus, when compared to Gespa, Coop stores represent a more
favorable working environment for workers.
Coop stores’ distinctive institutional features make them a closer model of High
Performance Work Systems (HPWS) than Gespa stores. A premise in the HPWS literature is that
workers have exclusive valuable knowledge on the production process that is not shared by the
managers. However, managers, by eliciting ideas and contributions from the workers, could still
3 On average, Coop workers and Gespa workers spend 0.28% and 0.02% respectively, of their working hours on labor meetings. A two-group t-test shows that this difference is highly significant (p-value is essentially zero).
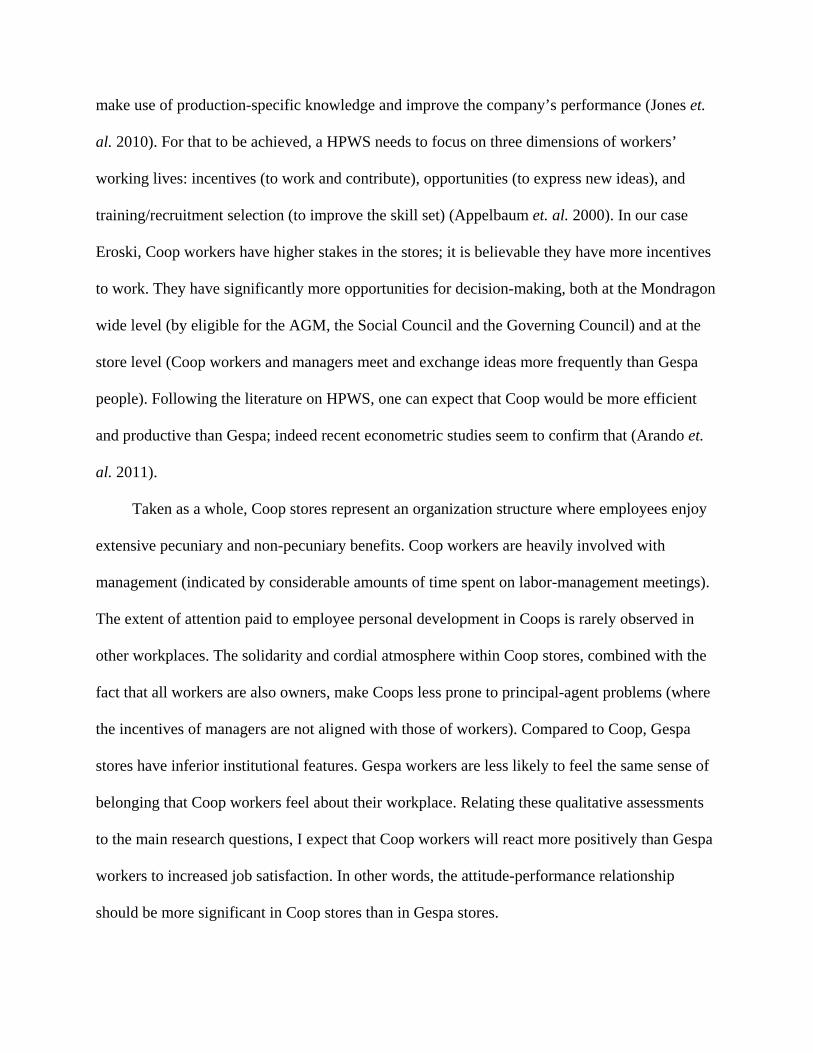
make use of production-specific knowledge and improve the company’s performance (Jones et.
al. 2010). For that to be achieved, a HPWS needs to focus on three dimensions of workers’
working lives: incentives (to work and contribute), opportunities (to express new ideas), and
training/recruitment selection (to improve the skill set) (Appelbaum et. al. 2000). In our case
Eroski, Coop workers have higher stakes in the stores; it is believable they have more incentives
to work. They have significantly more opportunities for decision-making, both at the Mondragon
wide level (by eligible for the AGM, the Social Council and the Governing Council) and at the
store level (Coop workers and managers meet and exchange ideas more frequently than Gespa
people). Following the literature on HPWS, one can expect that Coop would be more efficient
and productive than Gespa; indeed recent econometric studies seem to confirm that (Arando et.
al. 2011).
Taken as a whole, Coop stores represent an organization structure where employees enjoy
extensive pecuniary and non-pecuniary benefits. Coop workers are heavily involved with
management (indicated by considerable amounts of time spent on labor-management meetings).
The extent of attention paid to employee personal development in Coops is rarely observed in
other workplaces. The solidarity and cordial atmosphere within Coop stores, combined with the
fact that all workers are also owners, make Coops less prone to principal-agent problems (where
the incentives of managers are not aligned with those of workers). Compared to Coop, Gespa
stores have inferior institutional features. Gespa workers are less likely to feel the same sense of
belonging that Coop workers feel about their workplace. Relating these qualitative assessments
to the main research questions, I expect that Coop workers will react more positively than Gespa
workers to increased job satisfaction. In other words, the attitude-performance relationship
should be more significant in Coop stores than in Gespa stores.
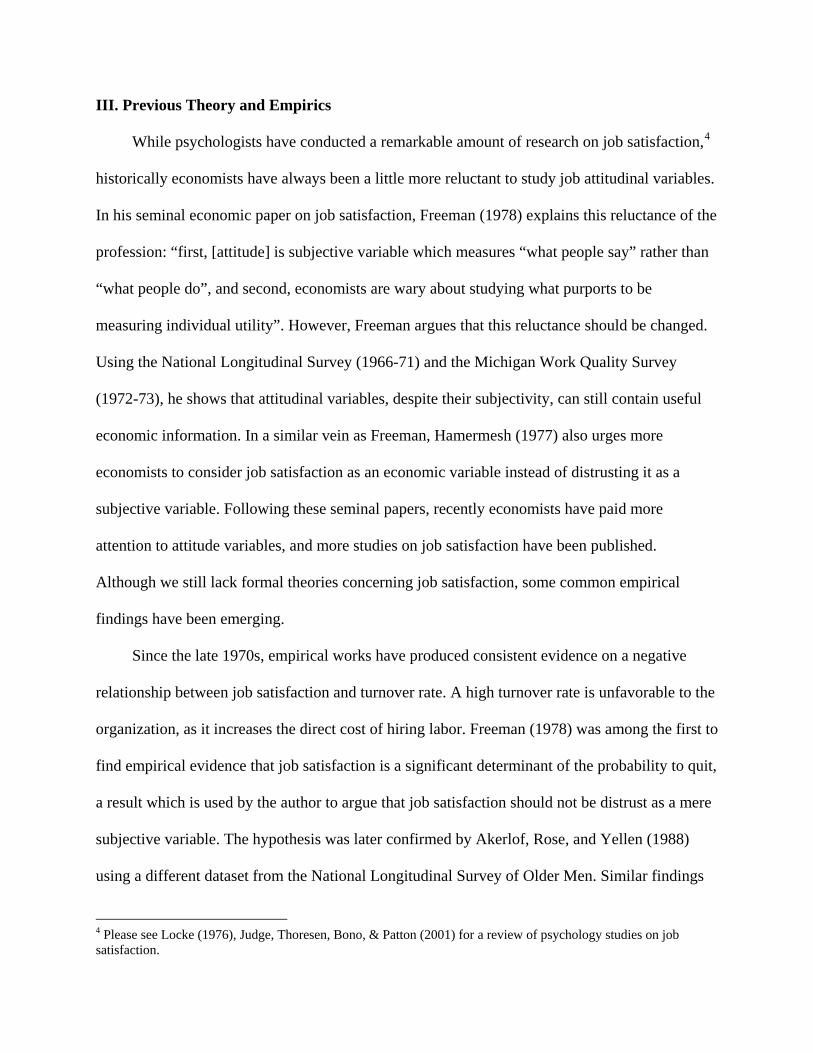
III. Previous Theory and Empirics
While psychologists have conducted a remarkable amount of research on job satisfaction,4
Since the late 1970s, empirical works have produced consistent evidence on a negative
relationship between job satisfaction and turnover rate. A high turnover rate is unfavorable to the
organization, as it increases the direct cost of hiring labor. Freeman (1978) was among the first to
find empirical evidence that job satisfaction is a significant determinant of the probability to quit,
a result which is used by the author to argue that job satisfaction should not be distrust as a mere
subjective variable. The hypothesis was later confirmed by Akerlof, Rose, and Yellen (1988)
using a different dataset from the National Longitudinal Survey of Older Men. Similar findings
historically economists have always been a little more reluctant to study job attitudinal variables.
In his seminal economic paper on job satisfaction, Freeman (1978) explains this reluctance of the
profession: “first, [attitude] is subjective variable which measures “what people say” rather than
“what people do”, and second, economists are wary about studying what purports to be
measuring individual utility”. However, Freeman argues that this reluctance should be changed.
Using the National Longitudinal Survey (1966-71) and the Michigan Work Quality Survey
(1972-73), he shows that attitudinal variables, despite their subjectivity, can still contain useful
economic information. In a similar vein as Freeman, Hamermesh (1977) also urges more
economists to consider job satisfaction as an economic variable instead of distrusting it as a
subjective variable. Following these seminal papers, recently economists have paid more
attention to attitude variables, and more studies on job satisfaction have been published.
Although we still lack formal theories concerning job satisfaction, some common empirical
findings have been emerging.
4 Please see Locke (1976), Judge, Thoresen, Bono, & Patton (2001) for a review of psychology studies on job satisfaction.

are also obtained from studies done on samples outside of the US: Clark, Georgellis, and Sanfey
(1998) use data from the German Socio-Economic Panel to show that workers with higher
reported level of satisfaction are statistically more likely to quit than those with lower reported
level of satisfaction. Danish economists Kristensen and Westergard-Nielsen (2004) offer the
same evidence using data from the European Community Household Panel (ECHP). They also
rank various satisfaction domains according to their ability to predict quits: for example,
satisfaction with the Type of Work (such as challenging or mundane) is the most reliable
predictor of job quits, while satisfaction with Job Security is found to be the least reliable aspect.
Frijters, Shields, and Wheatley-Price (2004) study job satisfaction of public school teachers in
England and Wales and found that improving job satisfaction with non-pecuniary aspects of
work have a larger impact on reducing quit rates than improving satisfaction with pay.
Unfortunately, economic studies investigating the effect of job satisfaction on absenteeism,
another equally important job behavior, have not been numerous. According to Jones et al.
(2009), absenteeism refers to unscheduled absence of employees. Like quitting rates, high rates
of absenteeism is also unwanted by the organization because it imposes a number of costs on the
employer, such as the direct loss of output from absent employees, overtime for other employees
to fill in, temporary helping and extra management costs (Oi, 1962). Given that low job
satisfaction does seem to make employees more likely to quit job, one can reasonably expect that
it will also cause employee who cannot quit more likely to be absent. Indeed, an inverse
relationship between job satisfaction and absenteeism is occasionally found by psychologists,
such as Vroom (1964) and Clegg (1983). However, further research is desired in order to reach a
scholarly consensus.
On the other hand, it is well-established in the economic literature that turnover rate and
absenteeism, among other work environment indicators, are strongly and inversely related to job
performance. Using data on the British coal mining industry Pencavel (1974) finds that high
level of industrial morale, as manifested by low levels of absenteeism, labor turnover, accidents,
and strikes has a positive and significant impact on output. The author also argues that this high
level of industrial morale reflects “the co-operation extended by the workers to their
management, their interest in their job, and their willingness to assume responsibility that their
work is properly and expeditiously done”. Ichniowski (1986) proposes a theoretical model to
identify the determinants of employee formal complaints received by the firm (called grievance
rates) and its effect on productivity. Using this model to analyze performance data from eleven
paper mills the author finds that a grievance-free plant is 1.3% more productive and up to 16.7%
more profitable than a plant that operates with an average grievance rate. Katz, Kochan, and
Gobeille (1983) study General Motors plants during the 1970s and find that grievance rates,
absenteeism, contract negotiation behavior are all negatively and significantly associated with
product quality, while employee’s ratings on the quality of their labor-management relations is
positively associated with product quality. This study is followed by a second paper (Katz,
Kochan, & Weber, 1982) which draws a similar conclusion using a different dataset from a large
durable goods manufacturer in the US.
A few studies have examined the direct link between employee attitudes and performance.
Bartel (2004) studies 160 branches of a Canadian bank and finds a positive relationship between
branch performance and employee’s satisfaction with quality of performance evaluation,
feedback and recognition at the workplace. The author argues that satisfaction with these
selected measures is important in determining the efficiency of High Performance Work Systems
(HPWSs) in that it captures the “incentives” dimension of the workplace (among the three
dimensions incentives, opportunities, and training, as described previously). A similar study is
done by Bartel, Freeman, Ichniowski, and Kleiner (2003). The authors analyze employee attitude
survey from nearly two hundred establishments of a major U.S. bank and offer evidence that
higher employee attitude level is associated with higher productivity, higher growth and lower
turnover at the branch level. On a theoretical ground, Katz et al. (1982) argue that worker
motivation and participation in decision-making will increase both organizational performance
and worker satisfaction, but this positive connection can only be maintained over time if the
organizational environment also maintains support for high level of labor involvement and labor-
management cooperation. If labor and management are not cooperative, or the worker does not
get rewarded for his involvement, his/her initial motivation and participation will eventually
wane, resulting in both lower performance and lower satisfaction. Similar lines of argument
could also be found from several other scholars (Goodman, 1979; Kochan and Dyer, 1976;
Walton, 1975; Walton, 1980).
An important strand in the literature focuses on the functioning of labor-managed firms
(LMFs) and employee-owned firms (EOFs). Research on economic performance of LMFs began
in the late 1950s, when state-owned enterprises and socialist states were still prevalent in the
world. However, after 50 years still it is unclear whether LMFs and EOFs have a performance
advantage over conventional capitalist firms. Theoretical work yield conflicting predictions.
Vanek (1970) associates employee ownership and participation in management with strong
incentives for labor, resulting in higher productivity compared to no ownership. In contrast,
Alchian and Demsetz (1972), Jensen and Meckling (1976) argue that that efficient monitoring of
labor requires the monitors to be claimant on the firm’s profits, and in case of LMFs, it is often
ambiguous who the main claimant of profit would be. Also, cooperatives structures exacerbate
free-rider problems arisen from team works, which will practically offset any initial incentive
gains from ownership (Holmstrom, 1982). Likewise, empirical studies on productivity of LMFs
do not offer a clear conclusion yet. For example, Craig and Pencavel (1995) study plywood
construction coops in North America find that coop mills are from 6% to 14% more productive
that their capitalist counterparts. But a comparable study done by Jones (2007) on Italian
construction firms found no evidence that coops are more efficient that conventional firms.
Finally, do EOFs and LMFs have positive effects on employee attitudes? Kruse and Blasi
(1995) assert that there is no a priori answer to this question. Employee-owners might be more
satisfied if they value ownership and perceive it as a mean to greater income, job security, and
more control over the workplace. In contrast, ownership might have negligible or negative effect
on attitudes if employees “perceive no difference in their work lives, dislike the extra risk or
have raised expectations that are not fulfilled”. Empirical estimations tend to find mixed results.
For instance, Greenberg (1980) analyzes survey from 550 employees of four U.S. plywood
cooperative and find that co-op membership is associated with higher satisfaction for workers.
Kruse (1984) offer evidence from two different companies with Employee Stock Ownership Plan
(ESOP) that ESOP workers exhibit no significant difference in satisfaction when compared to
the national sample of workers in comparable industry. My paper, comparing satisfaction across
Coop and Gespa stores, will hopefully shed some light on these inconclusive problems.
IV. Data and Method
A major goal of this paper is to assess the attitude-performance relationship at an
organizational level. Compared to previous studies that analyze this relationship at the individual
worker level, this aggregate approach is motivated by several theoretical rationales. The principal

motivation behind an attitude analysis at the organization level is the notion that individual
workers in the same firm share a “group attitude” (Bartel et al., 2003). This group attitude is
shaped by the workers’ common experience in their working lives. For instance, a poor working
condition will likely to introduce dissatisfaction to all workers working under that same
condition. Similarly, an understanding and fair manager will elicit positive satisfaction from
most workers under his management. In each case, individual worker’s satisfaction will converge
over time to a shared “group attitude” level, regardless of the initial individual attitude that they
brought when taking up their jobs. This proposition receives some empirical support by
Schneider, Goldstein and Smith (1995), where the authors show that the dispositions of people in
the same organization become increasingly homogeneous over time.
Additionally, some researchers hypothesize that positive shared attitudes are associated
with higher level of cooperation and collaboration among the workers (Ostroff, 1993). This level
of cooperation is an organizational measure and cannot vary within work units, and as such it is
unlikely to be affected by individual attitudes. A similar analogy could be made about the
performance of Eroski retail stores. In retail stores, the most apparent measure of performance is
the store’s sales volume. Sales volume is an organizational level variable and therefore is
unlikely to be affected by any single worker’s satisfaction. Besides, there is often no objective
measure of individual productivity in a retail store setting. In this case, a measure of store-level
satisfaction is necessary in order to analyze the satisfaction-performance relationship.
Data on the performance of Eroski hypermarkets was obtained by Professor Takao Kato
and his colleagues to compile a monthly panel dataset spanning over 40 months from February
2006 to May 2009. This dataset is new and represent full access to a complete set of variables
concerning the internal functioning of 92 Eroski hypermarkets. Besides, in 2006 and 2008,
worker satisfaction surveys were conducted in all Eroski hypermarkets, providing
comprehensive cross-sectional data on the satisfaction level of individual workers. The survey’s
questions total 68 and are the same ones in both years; each question is essentially a statement on
an specific aspect of the workplace, such as company policies, pay, promotion, communication
with managers etc. On a 5 point scale, workers are asked to assign a numerical value to their
level of satisfaction (with 5 being the most satisfied) in response to each of these statements. By
matching each store’s performance with its workers’ responses in the two satisfaction surveys, I
can assess how employee attitudes are related to organizational economic outcomes.
To capture the employee satisfaction at the store-level, I followed Bartel et al. (2003) and
created an Employee Attitude Index (EAI) for each store. First, an individual index is computed
for each worker by taking the arithmetic mean of their responses to all 68 questions on the
survey. Since each store has multiple workers, the EAI is then computed as the mean of the
individual indices obtained from each worker working in a given store. In all the empirical
analysis that follows, EAI is the main index for job attitudes. However, two additional attitude
indices will be specified for robustness check: one using principal component analysis, the other
one using theoretical grouping of survey questions. Detailed implementation will be described in
later sections.
For each store, I obtain two yearly observations of EAI (in year 2006 and 2008). In
contrast, the performance data consists of only monthly variables. To match a store’s
performance variables with its corresponding EAI, recalculation of monthly performance
variables is therefore required. For each of the performance-related variables, I calculated their
yearly values by taking the arithmetic mean of their monthly values in each given year (2006 and
2008). Stores that have observations only for one year are eliminated. In the final dataset, each
store has two yearly performance & survey observations. The total number of observations is
150, corresponding to 75 stores (25 Coop, 50 Gespa). Table 1 and 2 provide the full summary
statistics of relevant variables.
The summary statistics gives rise to a rather intriguing observation. It seems that on
average Coop workers to have a lower satisfaction than Gespa workers in both year 2006 and
2008. A two-group t-test shows that this difference is statistically significant at the 5% and 1%
level in year 2006 and year 2008 respectively. At first, this difference might seem a little
counter-intuitive, given that Coop worker-members enjoy far more benefits than their Gespa
counterparts. However, two main interpretations could be proposed. First, as described in
previous part, the extent to which HR policies are implemented in Coop is considerably larger
than in Gespa. Recently there have been a few arguments that innovative HR policies are
associated with increasing work intensity and stress for the workers (Godard, 2001; Godard,
2010). For example, in production teams (a popular innovative HR practice that is present in
both Coop and Gespa stores), workers often feel obliged to performed well due to peer pressure
and group norms. Consequently, the gain in productivity comes at the expense of worker’s
satisfaction and mental wellness. Second, it is also probable that due to their attachment with the
workplace, Coop workers have higher job expectations than Gespa workers. Expectations that
are not fulfilled could lead to lower job satisfaction (Kruse & Blasi, 1995). The qualitative
evidence about the institutional framework of Coops might give more support for the “raised
expectations” interpretation. It is unlikely that Coop environments, with emphasis on workers’
personal development, would cause more stress for the workers. In either case, the issue deserves
more thorough investigations and is a potentially important topic for future research.
V. Econometric Specifications and Estimates

To estimate the attitude-performance relationship in a retail context, I adopt a production
function for retail firms based on that of Jones et. al. (2010), who study the efficiency of HRM
practices in Finish stores. The starting point is the familiar Cobb-Douglas production function:
Qit = Ait (Sit)p (ELit)q
Where Qit is a performance measure of store i in year t, Sit is the floor space, and ELit is effective
labor (specified as the total number of worked hours), and Ait is the productivity parameter.
According to Jones et. al. (2010), the productivity parameter could be decomposed into
permanent effects (ie. store fixed effects), time effects, and other effects which may vary across
time and establishments (in our case this is EAI). As EAI may have an effect on store
productivity, I specify the productivity parameter as: Ait = eβ(Year) + β(EAI) + α + u. Lastly, I include
market condition as an additional control, since it is believable that retail revenue is strongly
related to market demand. Taking the log of the above production function, I obtain:
lnYit = lnAit + p(lnSit) + q(lnELit)
lnYit = [β(Yeart) + β(EAIit) + αi + uit] + p(lnSit) + q(lnELit) +β(Marketit)
Since floor space is unchanged throughout the time span of the data, p(lnSit) is a constant and
thus can be rewritten more compactly in the store fixed effect term αi. Rearranging and adding an
interaction term EAI*Coop, I get clean estimable equations:
(1) lnYit= β0 + β1(lnLit) + β2(lnMit) +β3(Year)t + β4(EAIit) + αi + uit
(2) lnYit= β0 + β1(lnLit) + β2(lnMit) +β3(Year)t + β4(EAIit) +β5(Coopi*EAIit) + αi + uit
where Q it is a performance measure, Lit is the average monthly number of worked hours, Mit is
the average monthly commercial index (measured locally at the region where the store is
located), and EAIit is the employee attitudes index. As mentioned earlier, Yit will be a set of three
variables: sales volume (Qit), turnover rate (Tit), and absenteeism rate (Ait). To make easier
interpretations, Yit is specified as an exponential function of turnover and absenteeism (Yit=eT
and Yit=eA). When taking the log to get the estimable equations, the dependent variables Tit and
Ait will be in level form.
Employee Attitudes and Real Sales
To estimate the relationship between employee attitudes and real sales, I estimated the following
equations (1) and (2) with the dependent variable (denoted by lnQit) being the real sales of store i
in year t. Equation (1) presupposes that store structures have no effect on the relationship
between EAI and real sales. Equation (2) includes the interaction term between the Coop dummy
and EAI to allow for store structure effects on the EAI-Sales relationship. In theory, equation (2)
should include a Coop dummy (no interaction) in order to be fully specified. However, since
store structure does not change over time, the effect of the Coop dummy is already incorporated
in the fixed effect term αi.
Table 3 reports the coefficient estimates for equation (1) and (2). For our purpose we are
most interested in the estimates for β4 in equation (1) and β4, β5 in equation (2). From panel (1),
we see that leaving the store structure variable uncontrolled leads to insignificant estimates of
EAI. This result suggests that either (a) EAI is not related to sales performance regardless of the
store being Coop or Gespa, or (b) EAI is related to sales in both types of store, but the signs of
the relationship are opposites, meaning EAI is positively related to sales performance in one type
of stores, and inversely related to sales in the other. Panel (2) offers evidence in favor of the
latter interpretation. When store structure variable is included, estimate for the interaction term
(Coop*EAI) is positive and significant at the 1% level. A linear combination test of (EAI +
Coop*EAI) yields the point estimate 0.14 with a p-value=0.02. This estimate is interpreted as:
given a store being Coop, on average a one unit increase in its Employee Attitude Index
corresponds to 14% increase in the average monthly sales of the store. This empirical finding
suggests that the attitudes-sales performance is a positive relationship which is enhanced by the
level of employee ownership.
Employee Attitudes and Turnover Rate
Again, equation (1) and (2) are estimated using the average monthly turnover of store i in
year t as the dependent variable.5
Table 4 reports the fixed effect estimates for equation (1) and (2) using turnover as the
dependent variable. The coefficient estimate for EAI is statistically insignificant in both
equations. For equation (2), a linear combination test of (β4 + β5) yields the point estimate -
.031538 with t-stat= -1.55 (p-value=0.126). One might take this as suggestive evidence that a
negative relationship is present in Coop (with p-value bordering the 0.10 threshold). The
imprecision might be due to the limited number of observations in the dataset. However, it is
Since Coop and Gespa worker-members are guaranteed to have
100% job-security, what the dependent variable represents is more or less a voluntary separation
of employee from employers (however, not all Coop and Gespa workers are members, and these
non-members could be laid off involuntarily, but we do not have sufficient data to confirm or
refute this). A high rate of separation is undesirable, because stores have to spend resources on
the hiring and training of new workers, which in turn lowers their economic efficiency. The year
dummy is included because for the most part 2008 was a year with a very favorable market (the
global recession did not set in until November 2008). Such favorable market conditions in 2008
would naturally induce a lower turnover rate and correlate with employees’ job perceptions (i.e.
EAI) as well.
5 Previous drafts of my paper did not include the labor variable (lnLit) in the turnover and absenteeism regressions because of endogeneity concerns. However, thanks to comments I received during the honors presentations and upon a more careful examination of past literature, I decide to re-include the labor variable in order to create a more systematic and complete picture.
safer to say that in both Coop and Gespa, a linear relationship between employee attitudes and
store turnover does not exist. On another hand, the estimates for labor (lnLit) and year (Yeart) are
negative and significant in both equations, suggesting that bigger stores have higher turnover
rate, and that turnover are lower in 2008 than in 2006 (which may be an effect of favorable
market conditions in 2008).
Employee Attitudes and Absenteeism
Equation (1) and (2) are estimated with the dependent variable Ait being the average
monthly absenteeism rate of store i in year t. In order to calculate Ait for each store, total monthly
worked man-hours is subtracted from the total monthly scheduled worked hours. This difference
is unscheduled absent hours of the total workforce; dividing it by the scheduled work hours to
obtain a monthly ratio R it (ie. unscheduled absent hours over scheduled work hours). Finally, for
each store, Ait is computed as the monthly average of this ratio R it over a given year (2006 or
2008). A high Ait means that employees are absent a large part of their scheduled hours. This is
undesirable to the organization, since absence of employees imposes extra costs such as finding a
replacement, direct loss of output due to absence, among others.
Table 5 reports the fixed effect estimates for equation (1) and (2) using absenteeism rate as
the dependent variable. As in the turnover regressions, a very similar picture emerges here. The
coefficient estimate for EAI is statistically insignificant in both equations. For equation (2), a
linear combination test of (β4 + β5) yields the point estimate -.016747 with t-stat= -0.56 (p-
value=0.579). Again, one could argue that there is a piece of suggestive evidence, particularly in
equation (1). In (1), the estimate for EAI is negative (-0.38) and bordering significance (p-
value=0.106). One could say that, without controlling for store structure, raising EAI is
associated with a decrease in absenteeism rate. However, this effect fades away as soon as the
Coop interaction term is introduced in equation (2). The regression results suggest that in both
Coop and Gespa, a linear relationship between employee attitudes and absenteeism rate does not
exist. On a side note, the estimates for labor (lnLit) and year (Yeart) are significantly positive and
negative (respectively) in both equations, a result that is consistent with that of the turnover
regressions.
Robustness Checks
In essence, the preliminary findings suggest that attitudes and sales volume are positively
related in Coop (not in Gespa), while attitudes and turnover, attitudes and absenteeism are not
related regardless of store structure. In order to verify the robustness of the previous findings, I
have performed two checks: a data-driven principal component analysis and a theory-driven
grouping of survey questions.
Principal component analysis applied on the 68 survey questions produces in 4 “main
components”. Since the survey responses were highly correlated, the resulting first component
clearly dominates the other three (the first component explains over 70% of the variations in the
initial 68 questions). I labeled this first component “Satisfaction Climate”; Satisfaction Climate
average -2.69 for all stores, 1.20 for Gespa stores and -3.21 for Coop stores. A two sample t-test
confirms that the difference is significant at 1% level, implying that Coop workers are less happy
than Gespa workers. The robustness check is performed by substituting Satisfaction Climate in
place of EAI in the regressions of equation (1) and (2). Estimation results, which are reported in
table 6, are strikingly similar to when EAI was used. Again, satisfaction climate is positively
related to sales performance in Coop stores (but not Gespa stores); it is not related to turnover
and absenteeism in either type of stores.
The second check relies on grouping of survey questions that address similar aspects of
working lives. The use of EAI and principal components more or less lump all the survey
questions together to create a comprehensive index, while grouping questions will create
narrower, more detailed indices. I adopted the classification of workplace variables provided by
Appelbaum et. al. (2000) in order to decide which questions to group together. Appelbaum et. al.
originally classify objective variables of the workplace into the three pillars (incentives,
opportunities and skills) of a High Performance Work System (HPWS), in contrast to my survey
data which consists of subjective variables. In adopting their classification, however, I follow the
rationale set out by Jones et. al. (2010), who argue that these objective variables only matter to
the extent of the workers’ perception of them. For instance, if the pay is objectively high
(compared to industry standards) but the workers are still unsatisfied with it (ie. subjectively
perceive the pay to be low), then that high pay will not enhance efficiency of human resource.
The questions are then chosen to fit into 7 groups: Autonomy of Workers, Communication,
Training, Recruitment/Selection, Job Security, Promotion/Pay, and Intrinsic Reward. Then for
each group I take the average of the survey responses in order to create a group index. Table 7
reports summary statistics for each question group: in all groups Gespa workers are happier than
Coop workers. Finally, I substitute these group indices in place of EAI in the regressions of
equation (1) and (2). Compared to the conclusions reached earlier using EAI, the estimation
results using attitudes group, given in table 8, seem to be ambivalent.6
6 Table 8 only reports results with lnQit being the dependent variable. Regressions of turnover and absenteeism produce insignificant estimates for attitudes, which is consistent with previous findings. They are available upon request.
Out of the 7 groups, 4
groups (Autonomy, Communication, Training and Intrinsic Reward) produce very similar results
and further confirm the initial EAI findings. The other three groups (Selection, Job Security and
Promotion/Pay) do not lend strong support for the initial findings. However, one must keep in
mind that Coop/Gespa stores have distinctive institutional features regarding these three work
aspects. Job security is practically 100% for all members; the wage range is very compressed
compared to industry standard, and recruitment/selection could be strongly affected by self-
selection. These peculiar features might be the reason for insignificant estimates of attitudes
concerning these groups.
Discussion
My empirical analysis reveals that attitudes and sales volume are positively related in Coop
stores (but not Gespa), while attitudes are not related to turnover and absenteeism. In light of
previous empirical study on similar subjects, this finding is both new and expected. As outlined
in the literature review part, previous studies on job attitudes and producer cooperatives have
found very mixed results. There is virtually no consensus regarding both attitudes and
cooperatives. In a way, my mixed empirical findings reflect this ambivalence of past literature.
However, by combining my econometric results with institutional features of Coop/Gespa
stores, several claims could be supported. One could argue that the result is favorable to the
Coop structure. Interviews of store managers, conducted by Professor Takao Kato and his
colleagues, reveal that among the three performance variables used in this study, sales volume is
the most important one. Store managers are unanimously concerned with sales growth. Reducing
turnover and absenteeism is relevant to an efficient organization, but it is not the top priority of
Eroski managers. Following this reasoning, one could say that only Coop stores could potentially
boost sales by increasing the satisfaction of its employees; therefore, the result is more favorable
to Coop stores than Gespa stores.
The mechanism behind the attitudes-sales relationship in Coop stores deserves some
thoughts. Previous descriptions of Eroski stores have made clear that Coop stores possess many
institutional advantages over Gespa stores. Compared to their Gespa colleagues, Coop workers
enjoy more extensive benefits and have more decision-making power (both at the store level and
at the Mondragon wide level). Most importantly, Coop workers have higher financial stakes in
the stores, and receive a higher interest payment out of the store profits. Coop’s employee
involvement and employee ownership schemes create a powerful incentive mechanism for Coop
workers to be productive. Furthermore, Coop workers probably have very close relationship with
managers (as the workers are involved in management as well). Previous studies have suggests
that the relationship between the worker and his employer is important in determining the extent
to which the worker will reciprocate to a gift by employer (Bellemare & Shearer, 2007). If one
views an increase in satisfaction as a “gift”, then my empirical finding does make sense. The
better relationship between Coop workers and employers make the workers more likely to react
positively to an increase in satisfaction.
VI. Conclusion
For over 70 years, the attitudes-performance problem has been the subject of much
research in social sciences. Producer cooperatives and labor-managed firms have also attracted
much attention from scholars in various fields. This paper, a study of attitudes-performance in a
cooperative setting, is a contribution to both of these hot topics. By estimating fixed-effect
models, I find that employee attitudes can potentially help boost sales volume in Coop stores,
and that employee attitudes are not related to store turnover and absenteeism regardless of
ownership structure.
A recent econometric study on the Eroski chain has shown evidence that Coop are better-
performers than Gespa in terms of sales growth (Arando et. al. 2011). The authors, estimating a
first difference model, find that Coop hypermarkets can grow sales significantly faster than
Gespa stores. They argue that Coop’s superior performance is due to its institutional advantages
over other organizational structures (such as substantial employee involvement, workers having
large financial stake in the firm). My findings in this paper are, in a way, very consistent with
Arando et. al.’s. There is a powerful incentive mechanism within Coop stores that give them a
competitive edge against other store structure. Happier workers in Coop are also the more
productive workers; they have the incentives to “give back” to their organizations.
My approach is, however, not without limitations. Estimations using a fixed effect model
do not make clear the direction of causality. Following the evidence that attitudes and
performance are positively related in Coop, I have argued that a “gift-exchange” story is
happening. However, there is no econometric evidence to support this story so far. It is probable
that workers in stores that have higher sales will become happier; in other words, the direction of
causality is reversed. It could also be the case that a third factor, such as workers’ personal
characteristics, is moderating both variables. To further verify the causality direction, stronger
evidence needs to be found. Another concern is external validity. Mondragon and Eroski is a
peculiar case to start with; they do not necessarily represent the larger population of labor
managed firms. Any attempt to generate the findings of this paper to other LMFs needs a more
solid theoretical and empirical ground. Clearly, there are many avenues and open questions
concerning employee attitudes and producer cooperatives that future research can fruitfully
address.
Akerlof, G., Rose, A., & Yellen, J. (1988). Job Switching and Job Satisfaction in the US Labor Market. Brookings Papers on Economic Activity , 495-582. Alchian, A. A., & Demsetz, H. (1972). Production, Information Costs, and Economic Organization. American Economic Review, Vol. 62, No. 5, , 777-95. Appelbaum, E., Bailey, T., Berg, P., & Kalleberg, A. L. (2000). Manufacturing Advantage: Why High Performance Work Systems Pay Off. Ithaca NY: ILR Cornell University Press. Arando, S., Gago, M., Jones, D., & Kato, T. (n.d.). Productive Efficiency in the Mondragon Cooperatives: Evidence from an Econometric case study. Forthcoming IZA Discussion Paper, 2011 . Bakaikoa, B., Errasti, A., & Begiristain, A. (2004). Governance of the Mondragon Corporacion Cooperativa. Annals of Public and Cooperative Economics, vol.75 , 61-87. Bartel, A., Freeman, R., Ichniowski, C., & Kleiner, M. (2003). Can a Work Organization Have an Attitude Problem? The Impact of Workplaces on Employee Attitudes and Economic Outcomes. NBER Working Paper No.9987 . Bellemare, C., & Shearer, B. (2007). Gift Exchange within a Firm: Evidence from a Field Experiment. Institute for the Study of Labor (IZA) Discussion Papers No.2696 . Bradley, K., & Gelb, A. (1982). The Replication and Sustainability of the Mondragon Experiment. British Journal of Industrial Relations, Vol. 20, No. 1 , 20-33. Clark, A., Georgellis, Y., & Sanfey, P. (1998). Job Satisfaction, Wage Changes and Quits: Evidence From Germany. Research in Labor Economics, vol. 17 , 95-121. Clegg, C. W. (1983). Psychology of Employee Lateness, Absence and Turnover: A Methodological Critique and Emprical Study. Journal of Applied Psychology vol. 68 , 88–101. Craig, B., & Pencavel, J. (1995). Participation and Productivity: A Comparison of Worker Cooperatives and Conventional Firms in the Plywood Industry. Brookings Papers on Economic Activity , 121-60. Freeman, R. B. (1978). Job Satisfaction as an Economic Variable. American Economic Review, vol. 68, no.2 , 135–41. Frijters, P., Shields, M. A., & Wheatley-Price, S. (2004). To Teach or Not ToTeach? Panel Data Evidence on the Quitting Decision. IZA Discussion Paper No. 1164 . Godard, J. (2001). High Performance and the Transformation of Work? The Implications of Alternative Work Practices for the Experience and Outcomes of Work. Industrial and Labor Relations Review vol.54 , 776-805. Godard, J. (2010). What Is Best for Workers? The Implications of Workplace and Human Resource Management Practices Revisited. Industrial Relations , 466-88. Goodman, P. (1979). Assessing Organizational Change: The Rushton Quality of Work Experiment. New York: Wiley-Interscience. Greenberg, E. (1980). Participation in Industrial Decision Making and Work Satisfaction: The Case of Producer Cooperatives. Social Science Quarterly, vol. 60, iss. 4 , 551-69. Hamermesh, D. S. (1977). Economic Aspects of Job Satisfaction. In O. C. Ashenfelter, & W. E. Oates, Essays in Labor Market Analysis (pp. 53–72). New York: Wiley.
Holmstrom, B. (1982). Moral Hazard in Teams. Bell Journal of Economics, Vol. 13, No. 2 , 324-40. Ichniowski, C. (1986). Industrial Relations and Economic Performance: Grievance and Productivity. Industrial and Labor Relations Review, vol. 40 , 75-89. Jensen, M. C., & Meckling, W. H. (1976). Theory of the Firm: Managerial Behavior, Agency Costs and Ownership Structure. Journal of Financial Economics, Vol.3, No.4 , 305-60. Johnson, A. G., & Whyte, W. F. (1977). The Mondragon System of Worker Production Cooperatives." . Industrial and Labor Relations Review, Vol.31, No.1 , 18-30. Jones, D. C. (2007). The Productive Efficiency of Italian Producer Cooperatives: Evidence from Conventional and Cooperative Firms. In S. Novkovic, & V. Sena, Cooperative Firms in Global Markets Volume 10 of the book series: Advances in the Economic Analysis of Participatory & Labor-Managed Firms (pp. 3-28). Amsterdam: Elsevier/JAI. Jones, D. C., Kalmi, P., & Kauhanen, A. (2010). How Does Employee Involvement Stack Up? The Effects of Human Resource Management Policies on Performance in a Retail Firm. Industrial Relations, v. 49 , 1-21. Jones, M. K., Jones, R. J., Latreille, P. L., & Sloane, P. J. (2009). Training, Job Satisfaction, and Workplace Performance in Britain: Evidence from WERS 2004 . LABOUR Vol. 23, Issue S1 , 139-175. Judge, T. A., Thoresen, C. J., Bono, J. E., & Patton, G. K. (2001). The Job Satisfaction–Job Performance Relationship: A Qualitative and Quantitative Review. Psychological Bulletin, Vol. 127 No. 3 , 376–407. Katz, H. C., Kochan, T. A., & Weber, M. R. (1982). Assessing the effects of industrial relations and quality of working life : effects on organizational effectiveness. Working paper #1381-82 (MIT Sloan School of Management) . Katz, H., Kochan, T., & Gobeille, K. (1983). Industrial Relations Performance, Economic Performance, and QWL Programs: An Interplant Analysis. Industrial and Labor Relations Review , 3-17. Kochan, T. A., & Dyer, L. (1976). "A Model of Organizational Change in the Context of Union-Management Relations. Journal of Applied Behavioral Science vol.12 , 59-78. Kristensen, N., & Westergard-Nielsen, N. (2004). Does Low Job Satisfaction Lead to Job Mobility? IZA Discussion Paper No. 1026 . Kruse, D. (1984). Employee Ownership and Employee Attitude: Two Case Studies. Norwood PA: Norwood Editions. Kruse, D., & Blasi, J. (1995). Employee Ownership, Employee Attitudes, and Firm Performance. NBER Working Papers No.5277 . Locke, E. A. (1976). The Nature and Causes of Job Satisfaction. In M. D. Dunnette, Handbook of Industrial and Organizational Psychology (pp. 1297–1349). Chicago IL: Rand McNally College Publishing Company. Oi, W. (1962). Labor as a Quasi-fixed Factor. Journal of Political Economy vol. 70 , 538–555.
Ostroff, C. (1993). Comparing Correlations Based on Individual-level and Aggregated Data. Journal of Applied Psychology vol.78 , 569-82. Ostroff, C. (1992). The Relationship between Satisfaction, Attitudes, and Performance: An Organizational-level Analysis. Journal of Applied Psychology vol.77 , 963-74. Pencavel, J. (1974). Analysis of an Index of Industrial Morale. British Journal of Industrial Relations, vol 12 , 48-55. Schneider, B., Goldstein, H., & Smith, D. (1995). The ASA Framework: An Update. Personnel Psychology vol.48 , 747-74. Vanek, J. (1970). The General Theory of Labor-Managed Market Economies. Ithaca, NY: ILR Cornell University Press. Vroom, V. H. (1964). Work and Motivation. New York: Wiley. Walton, R. E. (1980). Establishing and Maintaining High Commitment Work Systems. In J. Kimberly, & R. Miles, The Organizational Life Cycle: Issues in the Creation, Transformation and Decline of Organizations (pp. 208-290). San Francisco: Jossey Bass. Walton, R. E. (1975). The Diffusion of New Work Structures: Explaining Why Success Didn't Take. Organizational Dynamics . Weiss, H. M., & Cropanzano, R. (1996). Affective events theory: a theoretical discussion of the structure, causes and consequences of affective experiences at work. Research in Organizational Behavior, vol. 18 , 1-74. Whyte, W. (1999). Research Note: The Mondragon Cooperatives in 1976 and 1998. Industrial and Labor Relations Review vol. 52 , 478-81.
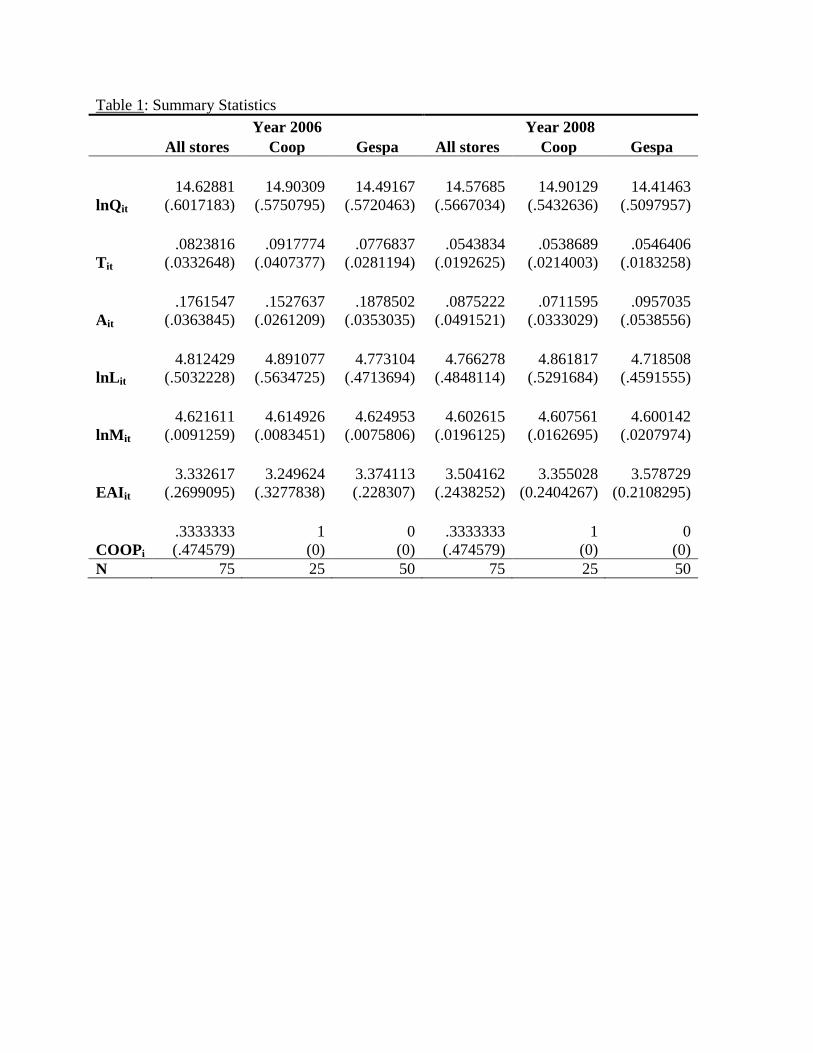
Table 1: Summary Statistics
Year 2006 Year 2008
All stores Coop Gespa All stores Coop Gespa
lnQit 14.62881
(.6017183) 14.90309
(.5750795) 14.49167
(.5720463) 14.57685
(.5667034) 14.90129
(.5432636) 14.41463
(.5097957)
Tit .0823816
(.0332648) .0917774
(.0407377) .0776837
(.0281194) .0543834
(.0192625) .0538689
(.0214003) .0546406
(.0183258)
Ait .1761547
(.0363845) .1527637
(.0261209) .1878502
(.0353035) .0875222
(.0491521) .0711595
(.0333029) .0957035
(.0538556)
lnLit 4.812429
(.5032228) 4.891077
(.5634725) 4.773104
(.4713694) 4.766278
(.4848114) 4.861817
(.5291684) 4.718508
(.4591555)
lnMit 4.621611
(.0091259) 4.614926
(.0083451) 4.624953
(.0075806) 4.602615
(.0196125) 4.607561
(.0162695) 4.600142
(.0207974)
EAIit 3.332617
(.2699095) 3.249624
(.3277838) 3.374113 (.228307)
3.504162 (.2438252)
3.355028 (0.2404267)
3.578729 (0.2108295)
COOPi .3333333 (.474579)
1 (0)
0 (0)
.3333333 (.474579)
1 (0)
0 (0)
N 75 25 50 75 25 50
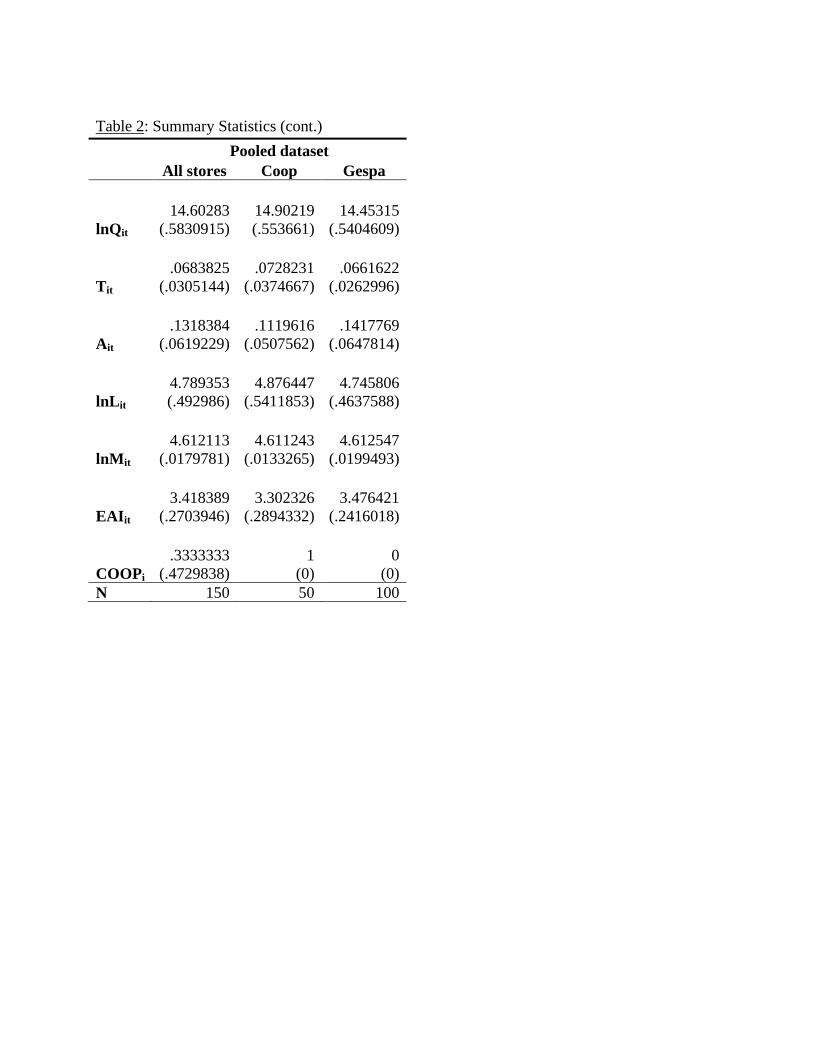
Table 2: Summary Statistics (cont.)
Pooled dataset
All stores Coop Gespa
lnQit 14.60283
(.5830915) 14.90219 (.553661)
14.45315 (.5404609)
Tit .0683825
(.0305144) .0728231
(.0374667) .0661622
(.0262996)
Ait .1318384
(.0619229) .1119616
(.0507562) .1417769
(.0647814)
lnLit 4.789353 (.492986)
4.876447 (.5411853)
4.745806 (.4637588)
lnMit 4.612113
(.0179781) 4.611243
(.0133265) 4.612547
(.0199493)
EAIit 3.418389
(.2703946) 3.302326
(.2894332) 3.476421
(.2416018)
COOPi
.3333333 (.4729838)
1 (0)
0 (0)
N 150 50 100
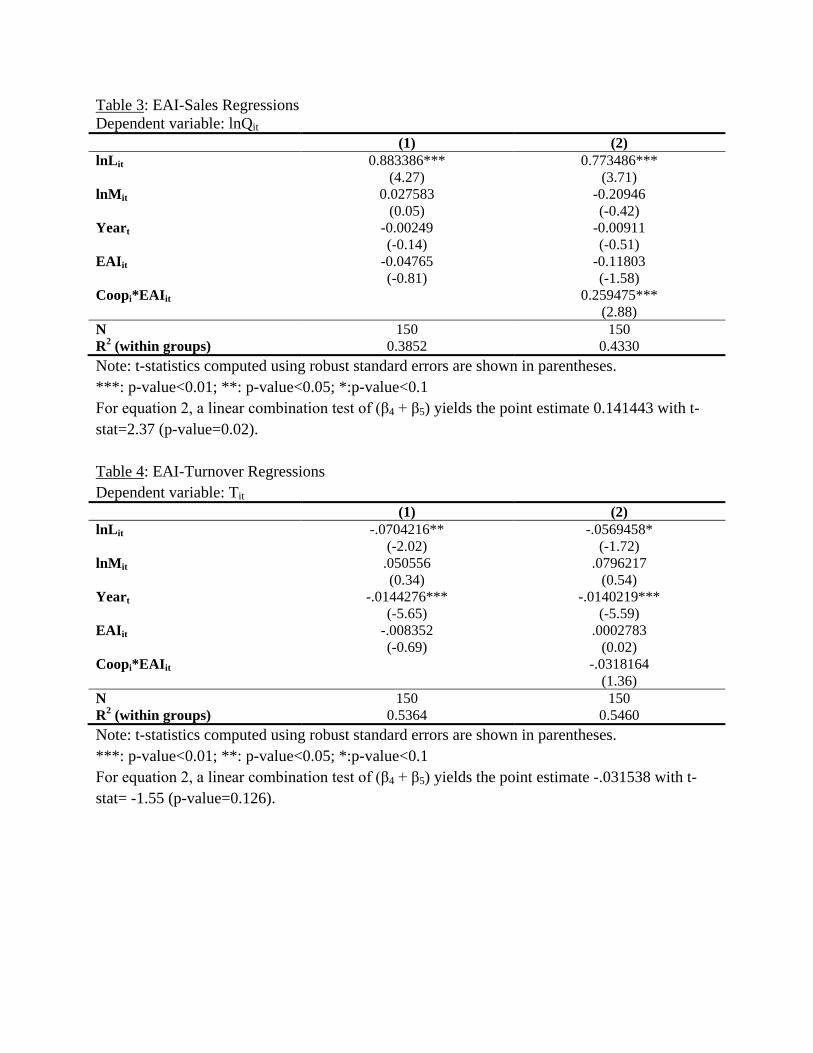
Table 3: EAI-Sales Regressions Dependent variable: lnQit (1) (2) lnLit 0.883386***
(4.27) 0.773486***
(3.71) lnMit 0.027583
(0.05) -0.20946 (-0.42)
Yeart -0.00249 (-0.14)
-0.00911 (-0.51)
EAIit -0.04765 (-0.81)
-0.11803 (-1.58)
Coopi*EAIit 0.259475*** (2.88)
N 150 150 R2 (within groups) 0.3852 0.4330 Note: t-statistics computed using robust standard errors are shown in parentheses. ***: p-value<0.01; **: p-value<0.05; *:p-value<0.1 For equation 2, a linear combination test of (β4 + β5) yields the point estimate 0.141443 with t-stat=2.37 (p-value=0.02). Table 4: EAI-Turnover Regressions Dependent variable: Tit (1) (2) lnLit -.0704216**
(-2.02) -.0569458*
(-1.72) lnMit .050556
(0.34) .0796217
(0.54) Yeart -.0144276***
(-5.65) -.0140219***
(-5.59) EAIit -.008352
(-0.69) .0002783
(0.02) Coopi*EAIit -.0318164
(1.36) N 150 150 R2 (within groups) 0.5364 0.5460 Note: t-statistics computed using robust standard errors are shown in parentheses. ***: p-value<0.01; **: p-value<0.05; *:p-value<0.1 For equation 2, a linear combination test of (β4 + β5) yields the point estimate -.031538 with t-stat= -1.55 (p-value=0.126).
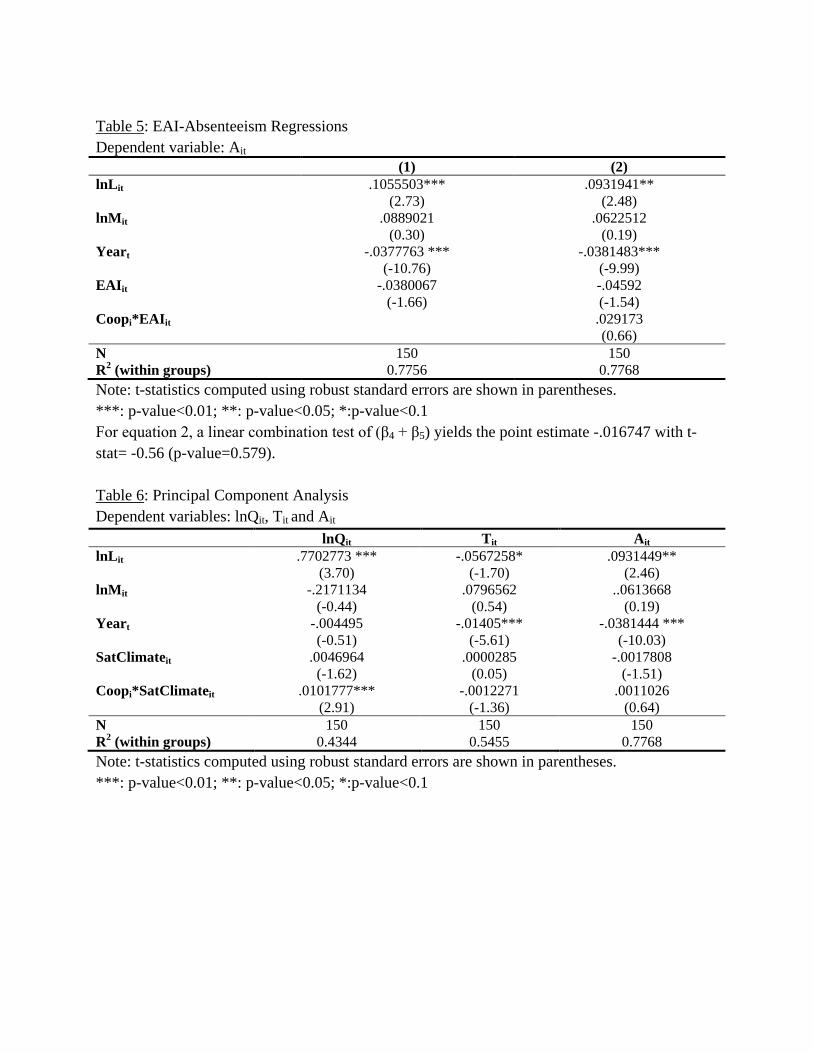
Table 5: EAI-Absenteeism Regressions Dependent variable: Ait (1) (2) lnLit .1055503***
(2.73) .0931941**
(2.48) lnMit .0889021
(0.30) .0622512
(0.19) Yeart -.0377763 ***
(-10.76) -.0381483***
(-9.99) EAIit -.0380067
(-1.66) -.04592 (-1.54)
Coopi*EAIit .029173 (0.66)
N 150 150 R2 (within groups) 0.7756 0.7768 Note: t-statistics computed using robust standard errors are shown in parentheses. ***: p-value<0.01; **: p-value<0.05; *:p-value<0.1 For equation 2, a linear combination test of (β4 + β5) yields the point estimate -.016747 with t-stat= -0.56 (p-value=0.579). Table 6: Principal Component Analysis Dependent variables: lnQit, Tit and Ait lnQit Tit Ait lnLit .7702773 ***
(3.70) -.0567258*
(-1.70) .0931449**
(2.46) lnMit -.2171134
(-0.44) .0796562
(0.54) ..0613668
(0.19) Yeart -.004495
(-0.51) -.01405***
(-5.61) -.0381444 ***
(-10.03) SatClimateit .0046964
(-1.62) .0000285
(0.05) -.0017808
(-1.51) Coopi*SatClimateit .0101777***
(2.91) -.0012271
(-1.36) .0011026
(0.64) N 150 150 150 R2 (within groups) 0.4344 0.5455 0.7768 Note: t-statistics computed using robust standard errors are shown in parentheses. ***: p-value<0.01; **: p-value<0.05; *:p-value<0.1
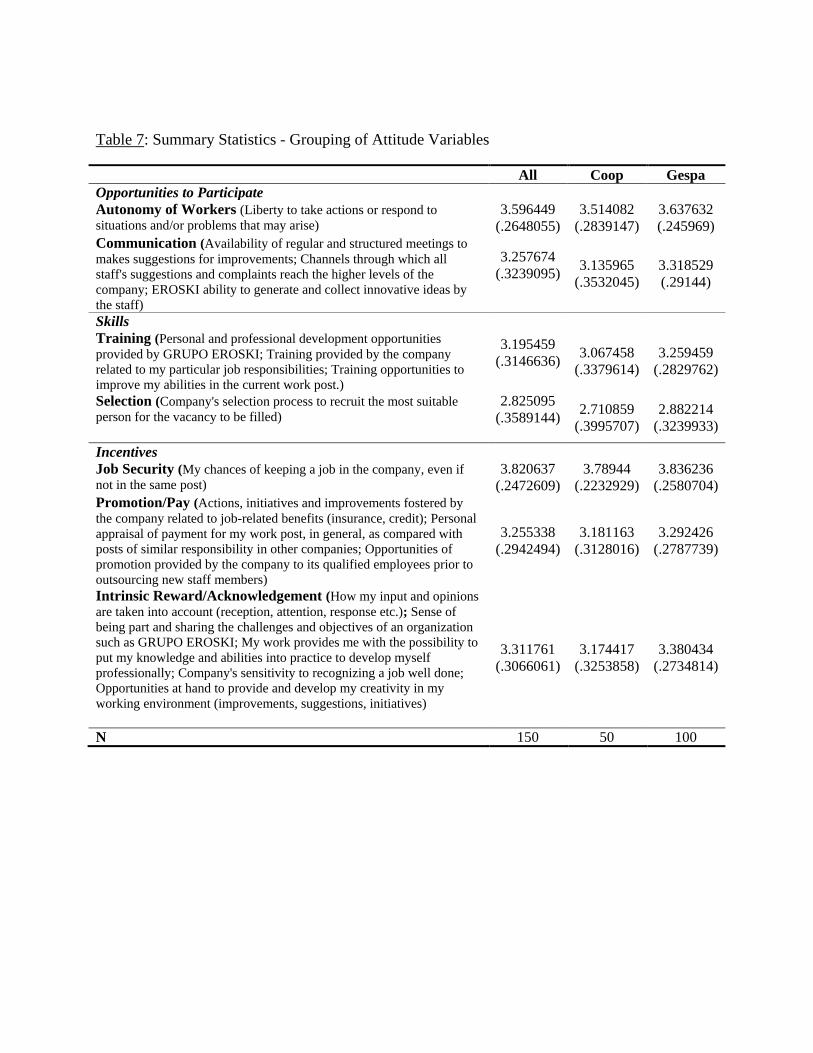
Table 7: Summary Statistics - Grouping of Attitude Variables
All Coop Gespa Opportunities to Participate Autonomy of Workers (Liberty to take actions or respond to situations and/or problems that may arise)
3.596449 (.2648055)
3.514082 (.2839147)
3.637632 (.245969)
Communication (Availability of regular and structured meetings to makes suggestions for improvements; Channels through which all staff's suggestions and complaints reach the higher levels of the company; EROSKI ability to generate and collect innovative ideas by the staff)
3.257674 (.3239095)
3.135965 (.3532045)
3.318529 (.29144)
Skills Training (Personal and professional development opportunities provided by GRUPO EROSKI; Training provided by the company related to my particular job responsibilities; Training opportunities to improve my abilities in the current work post.)
3.195459 (.3146636)
3.067458 (.3379614)
3.259459 (.2829762)
Selection (Company's selection process to recruit the most suitable person for the vacancy to be filled)
2.825095 (.3589144)
2.710859 (.3995707)
2.882214 (.3239933)
Incentives Job Security (My chances of keeping a job in the company, even if not in the same post)
3.820637 (.2472609)
3.78944 (.2232929)
3.836236 (.2580704)
Promotion/Pay (Actions, initiatives and improvements fostered by the company related to job-related benefits (insurance, credit); Personal appraisal of payment for my work post, in general, as compared with posts of similar responsibility in other companies; Opportunities of promotion provided by the company to its qualified employees prior to outsourcing new staff members)
3.255338 (.2942494)
3.181163 (.3128016)
3.292426 (.2787739)
Intrinsic Reward/Acknowledgement (How my input and opinions are taken into account (reception, attention, response etc.); Sense of being part and sharing the challenges and objectives of an organization such as GRUPO EROSKI; My work provides me with the possibility to put my knowledge and abilities into practice to develop myself professionally; Company's sensitivity to recognizing a job well done; Opportunities at hand to provide and develop my creativity in my working environment (improvements, suggestions, initiatives)
3.311761 (.3066061)
3.174417 (.3253858)
3.380434 (.2734814)
N 150 50 100
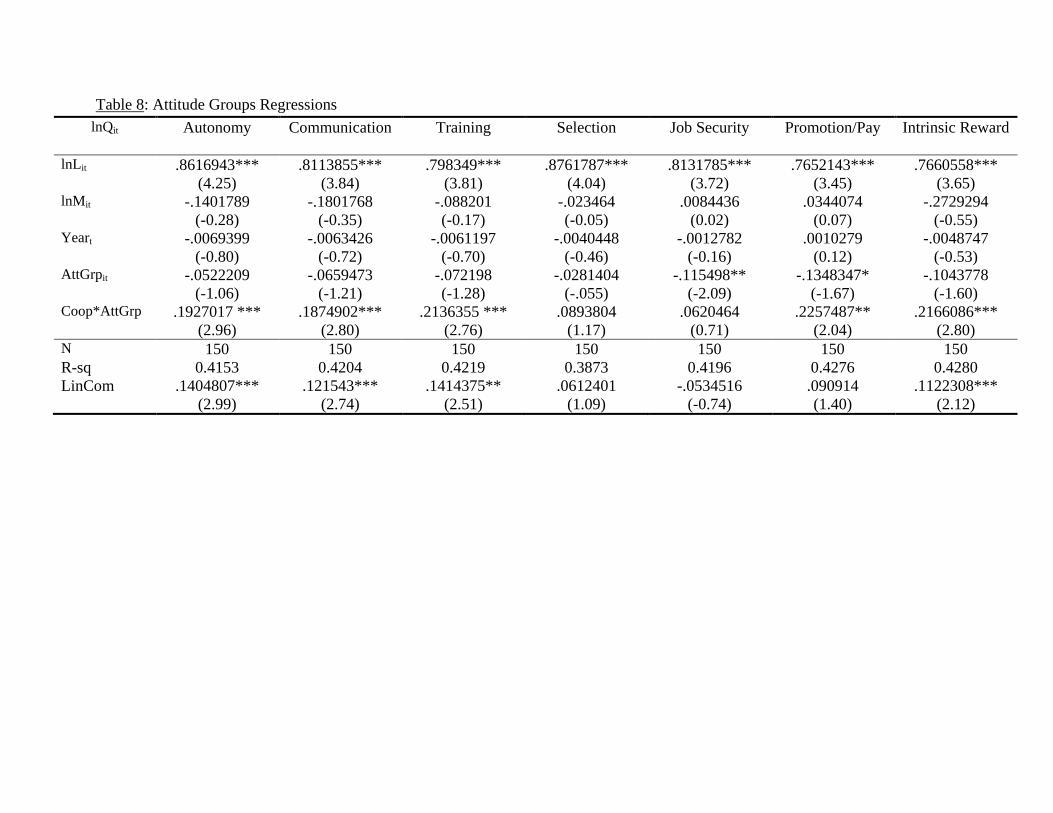
Table 8: Attitude Groups Regressions lnQit Autonomy Communication Training Selection Job Security Promotion/Pay Intrinsic Reward
lnLit .8616943***
(4.25) .8113855***
(3.84) .798349***
(3.81) .8761787***
(4.04) .8131785***
(3.72) .7652143***
(3.45) .7660558***
(3.65) lnMit -.1401789
(-0.28) -.1801768
(-0.35) -.088201 (-0.17)
-.023464 (-0.05)
.0084436 (0.02)
.0344074 (0.07)
-.2729294 (-0.55)
Yeart -.0069399 (-0.80)
-.0063426 (-0.72)
-.0061197 (-0.70)
-.0040448 (-0.46)
-.0012782 (-0.16)
.0010279 (0.12)
-.0048747 (-0.53)
AttGrpit -.0522209 (-1.06)
-.0659473 (-1.21)
-.072198 (-1.28)
-.0281404 (-.055)
-.115498** (-2.09)
-.1348347* (-1.67)
-.1043778 (-1.60)
Coop*AttGrp .1927017 *** (2.96)
.1874902*** (2.80)
.2136355 *** (2.76)
.0893804 (1.17)
.0620464 (0.71)
.2257487** (2.04)
.2166086*** (2.80)
N 150 150 150 150 150 150 150 R-sq 0.4153 0.4204 0.4219 0.3873 0.4196 0.4276 0.4280 LinCom .1404807***
(2.99) .121543***
(2.74) .1414375**
(2.51) .0612401
(1.09) -.0534516
(-0.74) .090914 (1.40)
.1122308*** (2.12)