
Homologous Mechanisms of Visuospatial Working Memory
12
Behavioral/Systems/Cognitive Homologous Mechanisms of Visuospatial Working Memory Maintenance in Macaque and Human: Properties and Sources Robert M. G. Reinhart, Richard P. Heitz, Braden A. Purcell, Pauline K. Weigand, Jeffrey D. Schall, and Geoffrey F. Woodman Department of Psychology, Vanderbilt Vision Research Center, Center for Integrative and Cognitive Neuroscience, Vanderbilt University, Nashville, Tennessee 37240 Although areas of frontal cortex are thought to be critical for maintaining information in visuospatial working memory, the event-related potential (ERP) index of maintenance is found over posterior cortex in humans. In the present study, we reconcile these seemingly contradictory findings. Here, we show that macaque monkeys and humans exhibit the same posterior ERP signature of working memory maintenance that predicts the precision of the memory-based behavioral responses. In addition, we show that the specific pattern of rhythmic oscillations in the alpha band, recently demonstrated to underlie the human visual working memory ERP component, is also present in monkeys. Next, we concurrently recorded intracranial local field potentials from two prefrontal and another frontal cortical area to determine their contribution to the surface potential indexing maintenance. The local fields in the two prefrontal areas, but not the cortex immediately posterior, exhibited amplitude modulations, timing, and relationships to behavior indicating that they contribute to the generation of the surface ERP component measured from the distal posterior electrodes. Rhythmic neural activity in the theta and gamma bands during maintenance provided converging support for the engagement of the same brain regions. These findings demon- strate that nonhuman primates have homologous electrophysiological signatures of visuospatial working memory to those of humans and that a distributed neural network, including frontal areas, underlies the posterior ERP index of visuospatial working memory maintenance. Introduction Working memory is the cognitive substrate that allows us to hold and manipulate information over relatively brief time intervals and is critical for complex human behavior (Baddeley, 2003). Although behavioral studies have often been used to infer the nature of the representations we store (Luck and Vogel, 1997; Cowan, 2001; Zhang and Luck, 2008; Perez and Vogel, 2012), the recent discovery of a human event-related potential (ERP) com- ponent that indexes the maintenance of information in visuospa- tial working memory has allowed for neuroscientific study of these representations, individual differences, and the role of working memory representations in attention tasks (Vogel and Machizawa, 2004; Vogel et al., 2005; Woodman and Vogel, 2008; Carlisle et al., 2011). This component is most commonly known as the contralateral delay activity (or CDA) and is characterized by a lateralized posterior potential that is sustained during the retention interval of a short-term memory task. In addition, re- cent studies of EEG oscillations have suggested that the CDA may be due to the suppression of posterior rhythmic activity in the alpha band, contralateral to the remembered stimulus (Mazaheri and Jensen, 2008, 2010; van Dijk et al., 2010). However, if we are going to understand the neuronal and postsynaptic mechanisms that give rise to this critical neuroscientific tool for studying tem- porary memory, we need to simultaneously record activity within the brain. Research spanning spatial scales (e.g., from local to large-scale electrical fields) is one of the greatest needs for understanding cognitive brain dynamics (Nunez and Srinivasan, 2006). The ab- sence of such research has limited our ability to definitively iden- tify neural generators of ERP components given the ambiguities involved in inversely modeling neural sources (Helmholtz, 1853; Luck, 2005; Nunez and Srinivasan, 2006). One solution to this problem is to establish homology between ERP components ob- served in monkeys and humans and then record the postsynaptic activity in different brain regions of the monkey to determine whether these local fields contribute to the components of inter- est (Schroeder et al., 1991, 1992; Lamme et al., 1992; Woodman, 2010). The present study takes this underused approach to an age-old problem. Received Jan. 13, 2012; revised March 29, 2012; accepted April 8, 2012. Author contributions: J.D.S. and G.F.W. designed research; R.M.G.R., R.P.H., B.A.P., P.K.W., and G.F.W. performed research; R.M.G.R., R.P.H., and B.A.P. contributed unpublished reagents/analytic tools; R.M.G.R. analyzed data; R.M.G.R., J.D.S., and G.F.W. wrote the paper. This work was supported by National Institutes of Health Grants R01-EY019882, P30-EY08126, and P30- HD015052, by National Science Foundation Grant BCS-0957072, and by Robin and Richard Patton through the E. Bronson Ingram Chair in Neuroscience. We thank John Haitas, Mary Feurtado, and Michelle Young for their technical assistance. The authors declare no competing financial interests. Correspondence should be addressed to Geoffrey F. Woodman, PMB 407817, 2301 Vanderbilt Place, Vanderbilt University, Nashville, TN 37240-7817. E-mail: [email protected]. DOI:10.1523/JNEUROSCI.0215-12.2012 Copyright © 2012 the authors 0270-6474/12/327711-12$15.00/0 The Journal of Neuroscience, May 30, 2012 • 32(22):7711–7722 • 7711
Transcript of Homologous Mechanisms of Visuospatial Working Memory
Behavioral/Systems/Cognitive
Homologous Mechanisms of Visuospatial Working MemoryMaintenance in Macaque and Human: Properties andSources
Robert M. G. Reinhart, Richard P. Heitz, Braden A. Purcell, Pauline K. Weigand, Jeffrey D. Schall,and Geoffrey F. WoodmanDepartment of Psychology, Vanderbilt Vision Research Center, Center for Integrative and Cognitive Neuroscience, Vanderbilt University, Nashville,Tennessee 37240
Although areas of frontal cortex are thought to be critical for maintaining information in visuospatial working memory, the event-relatedpotential (ERP) index of maintenance is found over posterior cortex in humans. In the present study, we reconcile these seeminglycontradictory findings. Here, we show that macaque monkeys and humans exhibit the same posterior ERP signature of working memorymaintenance that predicts the precision of the memory-based behavioral responses. In addition, we show that the specific pattern ofrhythmic oscillations in the alpha band, recently demonstrated to underlie the human visual working memory ERP component, is alsopresent in monkeys. Next, we concurrently recorded intracranial local field potentials from two prefrontal and another frontal corticalarea to determine their contribution to the surface potential indexing maintenance. The local fields in the two prefrontal areas, but not thecortex immediately posterior, exhibited amplitude modulations, timing, and relationships to behavior indicating that they contribute tothe generation of the surface ERP component measured from the distal posterior electrodes. Rhythmic neural activity in the theta andgamma bands during maintenance provided converging support for the engagement of the same brain regions. These findings demon-strate that nonhuman primates have homologous electrophysiological signatures of visuospatial working memory to those of humansand that a distributed neural network, including frontal areas, underlies the posterior ERP index of visuospatial working memorymaintenance.
IntroductionWorking memory is the cognitive substrate that allows us to holdand manipulate information over relatively brief time intervalsand is critical for complex human behavior (Baddeley, 2003).Although behavioral studies have often been used to infer thenature of the representations we store (Luck and Vogel, 1997;Cowan, 2001; Zhang and Luck, 2008; Perez and Vogel, 2012), therecent discovery of a human event-related potential (ERP) com-ponent that indexes the maintenance of information in visuospa-tial working memory has allowed for neuroscientific study ofthese representations, individual differences, and the role ofworking memory representations in attention tasks (Vogel andMachizawa, 2004; Vogel et al., 2005; Woodman and Vogel, 2008;
Carlisle et al., 2011). This component is most commonly knownas the contralateral delay activity (or CDA) and is characterizedby a lateralized posterior potential that is sustained during theretention interval of a short-term memory task. In addition, re-cent studies of EEG oscillations have suggested that the CDA maybe due to the suppression of posterior rhythmic activity in thealpha band, contralateral to the remembered stimulus (Mazaheriand Jensen, 2008, 2010; van Dijk et al., 2010). However, if we aregoing to understand the neuronal and postsynaptic mechanismsthat give rise to this critical neuroscientific tool for studying tem-porary memory, we need to simultaneously record activity withinthe brain.
Research spanning spatial scales (e.g., from local to large-scaleelectrical fields) is one of the greatest needs for understandingcognitive brain dynamics (Nunez and Srinivasan, 2006). The ab-sence of such research has limited our ability to definitively iden-tify neural generators of ERP components given the ambiguitiesinvolved in inversely modeling neural sources (Helmholtz, 1853;Luck, 2005; Nunez and Srinivasan, 2006). One solution to thisproblem is to establish homology between ERP components ob-served in monkeys and humans and then record the postsynapticactivity in different brain regions of the monkey to determinewhether these local fields contribute to the components of inter-est (Schroeder et al., 1991, 1992; Lamme et al., 1992; Woodman,2010). The present study takes this underused approach to anage-old problem.
Received Jan. 13, 2012; revised March 29, 2012; accepted April 8, 2012.Author contributions: J.D.S. and G.F.W. designed research; R.M.G.R., R.P.H., B.A.P., P.K.W., and G.F.W. performed
research; R.M.G.R., R.P.H., and B.A.P. contributed unpublished reagents/analytic tools; R.M.G.R. analyzed data;R.M.G.R., J.D.S., and G.F.W. wrote the paper.
This work was supported by National Institutes of Health Grants R01-EY019882, P30-EY08126, and P30-HD015052, by National Science Foundation Grant BCS-0957072, and by Robin and Richard Patton through the E.Bronson Ingram Chair in Neuroscience. We thank John Haitas, Mary Feurtado, and Michelle Young for their technicalassistance.
The authors declare no competing financial interests.Correspondence should be addressed to Geoffrey F. Woodman, PMB 407817, 2301 Vanderbilt Place, Vanderbilt
University, Nashville, TN 37240-7817. E-mail: [email protected]:10.1523/JNEUROSCI.0215-12.2012
Copyright © 2012 the authors 0270-6474/12/327711-12$15.00/0
The Journal of Neuroscience, May 30, 2012 • 32(22):7711–7722 • 7711
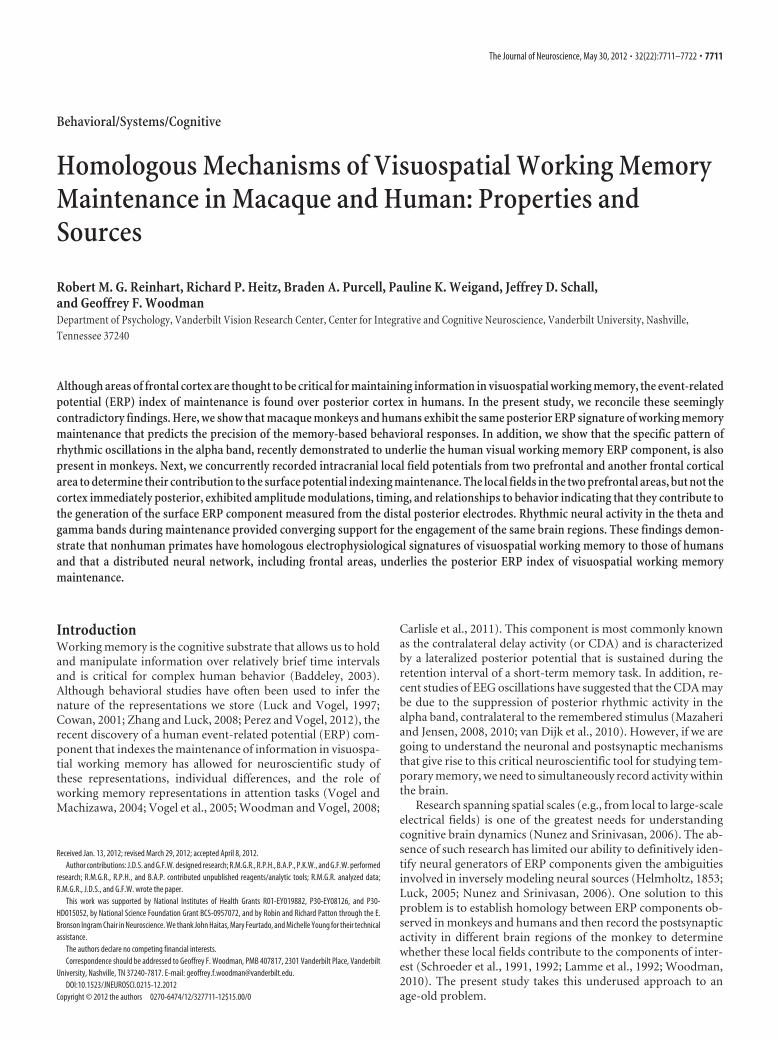
The memory-guided saccade task has been the modal workingmemory paradigm in neuroscience (Gnadt and Andersen, 1988;Funahashi et al., 1989; Colby et al., 1996; Constantinidis andSteinmetz, 1996; Chafee and Goldman-Rakic, 1998; Constantini-dis et al., 2002; Wang et al., 2011). This task requires that a subjectremember a particular spatial location over a delay period. Wehad both humans and macaque monkeys perform the samememory-guided saccade task to test the hypothesis that the CDAis found in both primate species. While recording EEG and ERPsfrom the monkeys using an array of surface electrodes, we simul-taneously recorded local field potentials (LFPs) from the frontaleye field (FEF), the supplementary eye field (SEF), and the sup-plementary motor area (SMA) (Fig. 1). Although it is known thatneurons in regions of frontal cortex exhibit sustained activityduring the memory-guided saccade task, it is unknown whetherthese regions contribute to the generation of the decidedly moreposterior CDA.
Materials and MethodsSubjectsWe recorded surface ERPs and intracranial activity from four macaquemonkeys. All procedures and care of the monkeys were performed withsupervision and approval from the Vanderbilt Institutional Animal Careand Use Committee in accordance with the Public Health Service Policyon Humane Care and Use of Laboratory Animals. Human ERP data werecollected from 10 neurologically normal subjects (age range, 19 –30; sixwere females). Each participated in both Experiments 1 and 2 after weobtained informed consent. All procedures were approved by the Van-derbilt University Institutional Review Board.
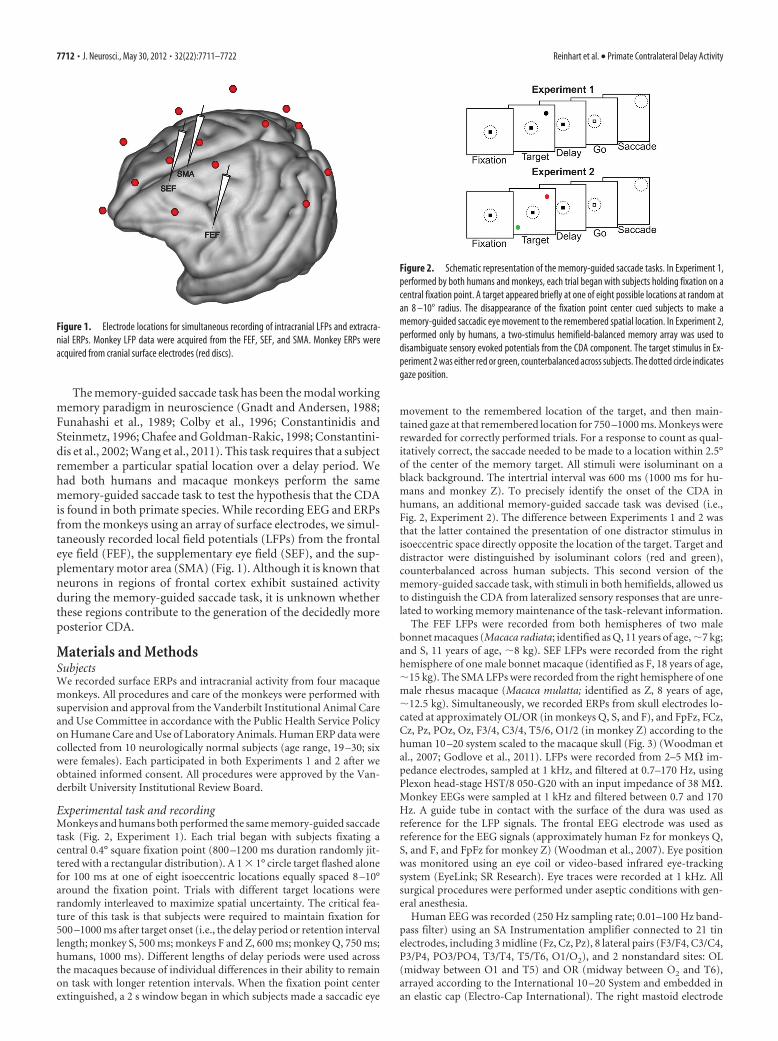
Experimental task and recordingMonkeys and humans both performed the same memory-guided saccadetask (Fig. 2, Experiment 1). Each trial began with subjects fixating acentral 0.4° square fixation point (800 –1200 ms duration randomly jit-tered with a rectangular distribution). A 1 � 1° circle target flashed alonefor 100 ms at one of eight isoeccentric locations equally spaced 8 –10°around the fixation point. Trials with different target locations wererandomly interleaved to maximize spatial uncertainty. The critical fea-ture of this task is that subjects were required to maintain fixation for500 –1000 ms after target onset (i.e., the delay period or retention intervallength; monkey S, 500 ms; monkeys F and Z, 600 ms; monkey Q, 750 ms;humans, 1000 ms). Different lengths of delay periods were used acrossthe macaques because of individual differences in their ability to remainon task with longer retention intervals. When the fixation point centerextinguished, a 2 s window began in which subjects made a saccadic eye
movement to the remembered location of the target, and then main-tained gaze at that remembered location for 750 –1000 ms. Monkeys wererewarded for correctly performed trials. For a response to count as qual-itatively correct, the saccade needed to be made to a location within 2.5°of the center of the memory target. All stimuli were isoluminant on ablack background. The intertrial interval was 600 ms (1000 ms for hu-mans and monkey Z). To precisely identify the onset of the CDA inhumans, an additional memory-guided saccade task was devised (i.e.,Fig. 2, Experiment 2). The difference between Experiments 1 and 2 wasthat the latter contained the presentation of one distractor stimulus inisoeccentric space directly opposite the location of the target. Target anddistractor were distinguished by isoluminant colors (red and green),counterbalanced across human subjects. This second version of thememory-guided saccade task, with stimuli in both hemifields, allowed usto distinguish the CDA from lateralized sensory responses that are unre-lated to working memory maintenance of the task-relevant information.
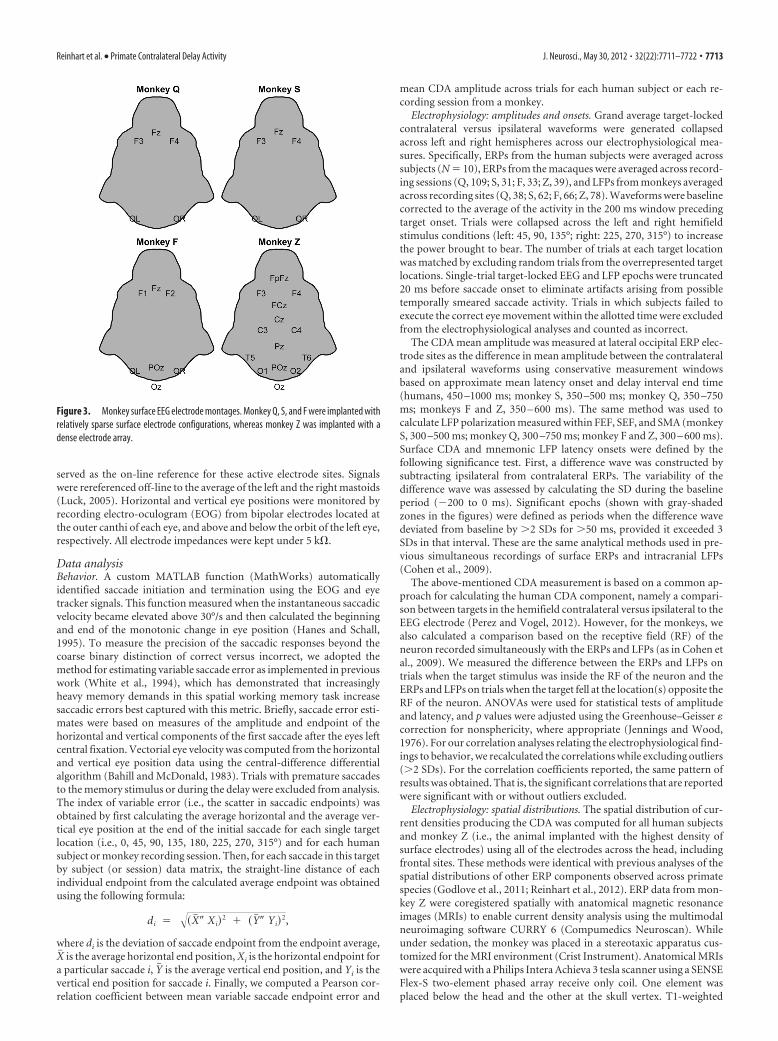
The FEF LFPs were recorded from both hemispheres of two malebonnet macaques (Macaca radiata; identified as Q, 11 years of age, �7 kg;and S, 11 years of age, �8 kg). SEF LFPs were recorded from the righthemisphere of one male bonnet macaque (identified as F, 18 years of age,�15 kg). The SMA LFPs were recorded from the right hemisphere of onemale rhesus macaque (Macaca mulatta; identified as Z, 8 years of age,�12.5 kg). Simultaneously, we recorded ERPs from skull electrodes lo-cated at approximately OL/OR (in monkeys Q, S, and F), and FpFz, FCz,Cz, Pz, POz, Oz, F3/4, C3/4, T5/6, O1/2 (in monkey Z) according to thehuman 10 –20 system scaled to the macaque skull (Fig. 3) (Woodman etal., 2007; Godlove et al., 2011). LFPs were recorded from 2–5 M� im-pedance electrodes, sampled at 1 kHz, and filtered at 0.7–170 Hz, usingPlexon head-stage HST/8 050-G20 with an input impedance of 38 M�.Monkey EEGs were sampled at 1 kHz and filtered between 0.7 and 170Hz. A guide tube in contact with the surface of the dura was used asreference for the LFP signals. The frontal EEG electrode was used asreference for the EEG signals (approximately human Fz for monkeys Q,S, and F, and FpFz for monkey Z) (Woodman et al., 2007). Eye positionwas monitored using an eye coil or video-based infrared eye-trackingsystem (EyeLink; SR Research). Eye traces were recorded at 1 kHz. Allsurgical procedures were performed under aseptic conditions with gen-eral anesthesia.
Human EEG was recorded (250 Hz sampling rate; 0.01–100 Hz band-pass filter) using an SA Instrumentation amplifier connected to 21 tinelectrodes, including 3 midline (Fz, Cz, Pz), 8 lateral pairs (F3/F4, C3/C4,P3/P4, PO3/PO4, T3/T4, T5/T6, O1/O2), and 2 nonstandard sites: OL(midway between O1 and T5) and OR (midway between O2 and T6),arrayed according to the International 10 –20 System and embedded inan elastic cap (Electro-Cap International). The right mastoid electrode
Figure 1. Electrode locations for simultaneous recording of intracranial LFPs and extracra-nial ERPs. Monkey LFP data were acquired from the FEF, SEF, and SMA. Monkey ERPs wereacquired from cranial surface electrodes (red discs).
Figure 2. Schematic representation of the memory-guided saccade tasks. In Experiment 1,performed by both humans and monkeys, each trial began with subjects holding fixation on acentral fixation point. A target appeared briefly at one of eight possible locations at random atan 8 –10° radius. The disappearance of the fixation point center cued subjects to make amemory-guided saccadic eye movement to the remembered spatial location. In Experiment 2,performed only by humans, a two-stimulus hemifield-balanced memory array was used todisambiguate sensory evoked potentials from the CDA component. The target stimulus in Ex-periment 2 was either red or green, counterbalanced across subjects. The dotted circle indicatesgaze position.
7712 • J. Neurosci., May 30, 2012 • 32(22):7711–7722 Reinhart et al. • Primate Contralateral Delay Activity
served as the on-line reference for these active electrode sites. Signalswere rereferenced off-line to the average of the left and the right mastoids(Luck, 2005). Horizontal and vertical eye positions were monitored byrecording electro-oculogram (EOG) from bipolar electrodes located atthe outer canthi of each eye, and above and below the orbit of the left eye,respectively. All electrode impedances were kept under 5 k�.
Data analysisBehavior. A custom MATLAB function (MathWorks) automaticallyidentified saccade initiation and termination using the EOG and eyetracker signals. This function measured when the instantaneous saccadicvelocity became elevated above 30°/s and then calculated the beginningand end of the monotonic change in eye position (Hanes and Schall,1995). To measure the precision of the saccadic responses beyond thecoarse binary distinction of correct versus incorrect, we adopted themethod for estimating variable saccade error as implemented in previouswork (White et al., 1994), which has demonstrated that increasinglyheavy memory demands in this spatial working memory task increasesaccadic errors best captured with this metric. Briefly, saccade error esti-mates were based on measures of the amplitude and endpoint of thehorizontal and vertical components of the first saccade after the eyes leftcentral fixation. Vectorial eye velocity was computed from the horizontaland vertical eye position data using the central-difference differentialalgorithm (Bahill and McDonald, 1983). Trials with premature saccadesto the memory stimulus or during the delay were excluded from analysis.The index of variable error (i.e., the scatter in saccadic endpoints) wasobtained by first calculating the average horizontal and the average ver-tical eye position at the end of the initial saccade for each single targetlocation (i.e., 0, 45, 90, 135, 180, 225, 270, 315°) and for each humansubject or monkey recording session. Then, for each saccade in this targetby subject (or session) data matrix, the straight-line distance of eachindividual endpoint from the calculated average endpoint was obtainedusing the following formula:
di � ��X� � Xi�2 � �Y� � Yi�
2,
where di is the deviation of saccade endpoint from the endpoint average,X� is the average horizontal end position, Xi is the horizontal endpoint fora particular saccade i, Y� is the average vertical end position, and Yi is thevertical end position for saccade i. Finally, we computed a Pearson cor-relation coefficient between mean variable saccade endpoint error and
mean CDA amplitude across trials for each human subject or each re-cording session from a monkey.
Electrophysiology: amplitudes and onsets. Grand average target-lockedcontralateral versus ipsilateral waveforms were generated collapsedacross left and right hemispheres across our electrophysiological mea-sures. Specifically, ERPs from the human subjects were averaged acrosssubjects (N � 10), ERPs from the macaques were averaged across record-ing sessions (Q, 109; S, 31; F, 33; Z, 39), and LFPs from monkeys averagedacross recording sites (Q, 38; S, 62; F, 66; Z, 78). Waveforms were baselinecorrected to the average of the activity in the 200 ms window precedingtarget onset. Trials were collapsed across the left and right hemifieldstimulus conditions (left: 45, 90, 135°; right: 225, 270, 315°) to increasethe power brought to bear. The number of trials at each target locationwas matched by excluding random trials from the overrepresented targetlocations. Single-trial target-locked EEG and LFP epochs were truncated20 ms before saccade onset to eliminate artifacts arising from possibletemporally smeared saccade activity. Trials in which subjects failed toexecute the correct eye movement within the allotted time were excludedfrom the electrophysiological analyses and counted as incorrect.
The CDA mean amplitude was measured at lateral occipital ERP elec-trode sites as the difference in mean amplitude between the contralateraland ipsilateral waveforms using conservative measurement windowsbased on approximate mean latency onset and delay interval end time(humans, 450 –1000 ms; monkey S, 350 –500 ms; monkey Q, 350 –750ms; monkeys F and Z, 350 – 600 ms). The same method was used tocalculate LFP polarization measured within FEF, SEF, and SMA (monkeyS, 300 –500 ms; monkey Q, 300 –750 ms; monkey F and Z, 300 – 600 ms).Surface CDA and mnemonic LFP latency onsets were defined by thefollowing significance test. First, a difference wave was constructed bysubtracting ipsilateral from contralateral ERPs. The variability of thedifference wave was assessed by calculating the SD during the baselineperiod (�200 to 0 ms). Significant epochs (shown with gray-shadedzones in the figures) were defined as periods when the difference wavedeviated from baseline by 2 SDs for 50 ms, provided it exceeded 3SDs in that interval. These are the same analytical methods used in pre-vious simultaneous recordings of surface ERPs and intracranial LFPs(Cohen et al., 2009).
The above-mentioned CDA measurement is based on a common ap-proach for calculating the human CDA component, namely a compari-son between targets in the hemifield contralateral versus ipsilateral to theEEG electrode (Perez and Vogel, 2012). However, for the monkeys, wealso calculated a comparison based on the receptive field (RF) of theneuron recorded simultaneously with the ERPs and LFPs (as in Cohen etal., 2009). We measured the difference between the ERPs and LFPs ontrials when the target stimulus was inside the RF of the neuron and theERPs and LFPs on trials when the target fell at the location(s) opposite theRF of the neuron. ANOVAs were used for statistical tests of amplitudeand latency, and p values were adjusted using the Greenhouse–Geisser �correction for nonsphericity, where appropriate (Jennings and Wood,1976). For our correlation analyses relating the electrophysiological find-ings to behavior, we recalculated the correlations while excluding outliers(2 SDs). For the correlation coefficients reported, the same pattern ofresults was obtained. That is, the significant correlations that are reportedwere significant with or without outliers excluded.
Electrophysiology: spatial distributions. The spatial distribution of cur-rent densities producing the CDA was computed for all human subjectsand monkey Z (i.e., the animal implanted with the highest density ofsurface electrodes) using all of the electrodes across the head, includingfrontal sites. These methods were identical with previous analyses of thespatial distributions of other ERP components observed across primatespecies (Godlove et al., 2011; Reinhart et al., 2012). ERP data from mon-key Z were coregistered spatially with anatomical magnetic resonanceimages (MRIs) to enable current density analysis using the multimodalneuroimaging software CURRY 6 (Compumedics Neuroscan). Whileunder sedation, the monkey was placed in a stereotaxic apparatus cus-tomized for the MRI environment (Crist Instrument). Anatomical MRIswere acquired with a Philips Intera Achieva 3 tesla scanner using a SENSEFlex-S two-element phased array receive only coil. One element wasplaced below the head and the other at the skull vertex. T1-weighted
Figure 3. Monkey surface EEG electrode montages. Monkey Q, S, and F were implanted withrelatively sparse surface electrode configurations, whereas monkey Z was implanted with adense electrode array.
Reinhart et al. • Primate Contralateral Delay Activity J. Neurosci., May 30, 2012 • 32(22):7711–7722 • 7713
gradient-echo structural images were obtained with a 3D turbo field echoanatomical sequence (TR, 8.729 ms; 130 slices; 0.70 mm thickness). Ahigh-resolution 3D model of the segmented skull and brain was con-structed in CURRY 6. The cranial surface electrode locations were coreg-istered to the head model guided by stereotaxic coordinates recordedduring surgery. From this 3D head model, a three-compartment bound-ary element method (BEM) volume conductor geometry was generated.The BEM model consisted of 2704 triangle meshes overall, or 1358 nodes,which describe the smoothed inner skull, the outer skull, and the outsideof the skin. The mean triangle edge lengths (node distances) were 9 mm(skin), 8 mm (skull), and 6 mm (brain compartment). Standard conduc-tivity values for the three compartments were used as follows: skin, 0.33S/m; skull, 0.0042 S/m; brain, 0.33 S/m. Of note, CURRY is designed toprovide solutions from skin surface electrodes; however, we measured
monkey ERPs from the cranial surface. Skin conductance and thicknessvalues did not contribute to the computed model solutions in monkeysbecause electrodes were located on the skull surface.
For humans, the interpolated BEM model was derived from averagedMRI data from the Montreal Neurological Institute. It consisted of 9300triangular meshes overall, or 4656 nodes, with mean triangle edge lengthsof 9 mm (skin), 6.8 mm (skull), and 5.1 mm (brain compartment).Standard conductivity values for the three compartments were set to thefollowing: skin, 0.33 S/m; skull, 0.0042 S/m; and brain, 0.33 S/m. Theinterpolated BEM model was built using the onboard CURRY 6 MRIdataset (Fuchs et al., 2002).
The current density analysis was calculated from the voltage differencewaves (contralateral minus ipsilateral) during the memory retention in-terval for humans (450 –1000 ms) and monkey Z (350 – 600 ms). Current
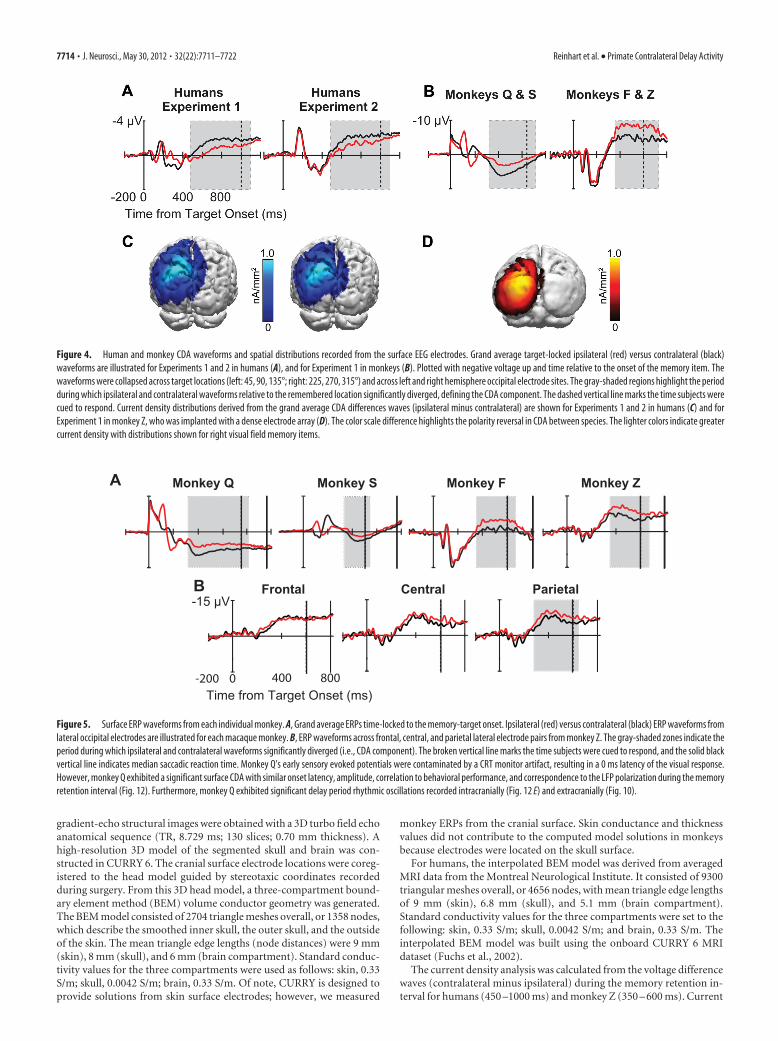
Figure 4. Human and monkey CDA waveforms and spatial distributions recorded from the surface EEG electrodes. Grand average target-locked ipsilateral (red) versus contralateral (black)waveforms are illustrated for Experiments 1 and 2 in humans (A), and for Experiment 1 in monkeys (B). Plotted with negative voltage up and time relative to the onset of the memory item. Thewaveforms were collapsed across target locations (left: 45, 90, 135°; right: 225, 270, 315°) and across left and right hemisphere occipital electrode sites. The gray-shaded regions highlight the periodduring which ipsilateral and contralateral waveforms relative to the remembered location significantly diverged, defining the CDA component. The dashed vertical line marks the time subjects werecued to respond. Current density distributions derived from the grand average CDA differences waves (ipsilateral minus contralateral) are shown for Experiments 1 and 2 in humans (C) and forExperiment 1 in monkey Z, who was implanted with a dense electrode array (D). The color scale difference highlights the polarity reversal in CDA between species. The lighter colors indicate greatercurrent density with distributions shown for right visual field memory items.
Monkey Q Monkey S Monkey ZMonkey F
-200
-15 μV
4000 800Time from Target Onset (ms)
A
B Frontal Central Parietal
Figure 5. Surface ERP waveforms from each individual monkey. A, Grand average ERPs time-locked to the memory-target onset. Ipsilateral (red) versus contralateral (black) ERP waveforms fromlateral occipital electrodes are illustrated for each macaque monkey. B, ERP waveforms across frontal, central, and parietal lateral electrode pairs from monkey Z. The gray-shaded zones indicate theperiod during which ipsilateral and contralateral waveforms significantly diverged (i.e., CDA component). The broken vertical line marks the time subjects were cued to respond, and the solid blackvertical line indicates median saccadic reaction time. Monkey Q’s early sensory evoked potentials were contaminated by a CRT monitor artifact, resulting in a 0 ms latency of the visual response.However, monkey Q exhibited a significant surface CDA with similar onset latency, amplitude, correlation to behavioral performance, and correspondence to the LFP polarization during the memoryretention interval (Fig. 12). Furthermore, monkey Q exhibited significant delay period rhythmic oscillations recorded intracranially (Fig. 12 E) and extracranially (Fig. 10).
7714 • J. Neurosci., May 30, 2012 • 32(22):7711–7722 Reinhart et al. • Primate Contralateral Delay Activity

density was estimated using the standardized low-resolution electro-magnetic tomography-weighted accurate minimum norm method(SWARM) (Wagner et al., 2007). For monkey Z, SWARM was estimatedusing the cranial surface electrode locations mentioned above, whereasfor humans SWARM was estimated using electrode positions based onthe International 10 –20 System and a cortical surface obtained from asegmentation of the CURRY 6 individual reference brain.
Electrophysiology: time–frequency analyses. Time–frequency analyseswere performed using a Morlet wavelet decomposition with FieldTripsoftware (Oostenveld et al., 2011). The Morlet wavelet has a Gaussianenvelope that is defined by a constant ratio (�f � f/7) and a waveletduration (6�t), where f is the center frequency and �t � 1/(2��f). After
obtaining complex time–frequency data pointsfor every individual trial, these data were trans-formed into a total power measure. For eachfrequency in the resulting time–frequency ma-trix, the baseline period was defined by the av-erage of the values within a �200 to 0 ms timewindow preceding the time-locking targetevent. A simple subtraction of baseline valuesfrom all the values in the epoch was performed,as this is the most common approach to base-line correction in EEG and ERP research. Anaverage of total power, single-trial values wascalculated using conservative measurementwindows based on approximate mean latencyonset and delay interval end time, just as withthe CDA (humans, 300 –1000 ms; monkey S,200 –500 ms; monkey Q, 200 –750 ms; mon-keys F and Z, 200 – 600 ms). As with the CDA,figures were generated from measurements atlateral occipital electrode sites for EEG, and atlateral FEF, SEF, and SMA sites for LFPs as thedifference in mean amplitude between the con-tralateral and ipsilateral waveforms. Similarly,we statistically compared the power in left andright target conditions for each hemisphere in-tracranially at theta (4 – 8 Hz) and gamma fre-quencies (30 –50 Hz), and extracranially forelectrodes sites OL and OR at the alpha andlow-beta frequencies (8 –16 Hz).
ResultsBehaviorUsing the modal memory-guided saccade task in the neurosci-ence literature (Gnadt and Andersen, 1988; Funahashi et al.,1989; Colby et al., 1996; Constantinidis and Steinmetz, 1996;Chafee and Goldman-Rakic, 1998; Constantinidis et al., 2002;Wang et al., 2011), we found that monkeys and humans per-formed at similar levels of accuracy (90% correct across alltarget locations and subjects, with the exception of monkey S,whose percentage correct was 75% correct) (for accuracy cri-teria, see Materials and Methods). For the qualitatively correctmemory-guided saccades made in the vicinity of the memorytarget, the saccadic endpoint error for monkeys was 1.5 0.5°(mean SD) and for humans was 1.0 0.3° (Experiment 1) and1.2 0.3° (Experiment 2). Reaction times for monkeys were248 31 ms (mean SD) and for humans 318 58 ms (Exper-iment 1) and 320 51 ms (Experiment 2) across correct trials.Within species, the Pearson correlation between saccadic reac-tion times and positional error was not significant (monkey:r(211) � �0.025, p � 0.891; human Experiment 1: r(9) � �0.189,p � 0.301; human Experiment 2: r(9) � �0.110, p � 0.349).Between species, a two-tailed t test revealed significant differ-ences between saccadic reaction times (p � 0.01) and positionalerror (p � 0.01) due to monkeys being faster but less accuratethan humans. This pattern of memory-guided saccade perfor-mance is consistent with previous findings from humans (Curtiset al., 2004) and monkeys (Funahashi et al., 1989).
Surface event-related potentials and oscillatory activityIn humans, a sustained contralateral negativity arose �450 msafter memory target presentation over posterior electrode sitesand continued through the memory retention interval (Fig. 4A).This is the primary defining characteristic of the CDA duringchange detection tasks in humans (Vogel and Machizawa, 2004;Vogel et al., 2005; Perez and Vogel, 2012). To determine which
Figure 6. Human CDA waveforms and spatial distributions across reference electrode configurations. A, Grand average target-synchronized ipsilateral (red) versus contralateral (black) ERP waveforms are shown using an average mastoid reference electrodeconfiguration (left panel), the standard in human CDA research, as well as a frontocentral reference electrode configuration similarto that of each monkey’s ERPs in the present study (right panel). The gray-shaded zones indicate the period during which ipsilateraland contralateral waveforms significantly diverged (i.e., CDA component). The broken vertical line marks the time subjects werecued to respond, and the solid black vertical line indicates median saccadic response time. B, Current density distributions derivedfrom the grand average CDA difference waves (contralateral minus ipsilateral) are illustrated for humans with both referenceelectrode sites. The lighter colors indicate greater current density with distributions shown for right visual field memory items.
Figure 7. The relationship between human and monkey surface CDA amplitude andbehavioral performance. Scatterplots of significantly negative linear correlations be-tween mean variable error (in degrees of visual angle) and mean surface CDA amplitude(contralateral minus ipsilateral) are shown for Experiments 1 and 2 in humans (A) and forExperiment 1 in monkeys (B).
Reinhart et al. • Primate Contralateral Delay Activity J. Neurosci., May 30, 2012 • 32(22):7711–7722 • 7715
portions of the waveforms were due to the potentially confound-ing effects of lateralized sensory evoked potentials, and verify thelatency of the CDA in humans, the same group of human subjectsperformed a second memory-guided saccade task in which a dis-tractor was presented directly opposite the task-relevant memorytarget in the other hemifield (Fig. 2, Experiment 2). Experiment 2confirmed the onset of the human CDA during this spatial mem-ory task was at 450 ms after stimulus (Fig. 4A).
In macaques, we found that the CDA, defined by the sustaineddifference in lateralized potentials, began at �350 ms after thememory target and took the form of a strong contralateral posi-tivity over posterior electrodes. As in humans, this activity wassustained throughout the delay period (Fig. 4B). All monkeysexhibited a clear CDA during the memory retention interval fol-lowing the initial sensory ERPs (Fig. 5). For monkeys Q and S,this sustained contralateral positivity rode on top of a bilateralpositivity, whereas for monkeys F and Z this contralateral posi-tivity appears to overlap with a bilateral negativity. Previous stud-ies of the CDA in humans (Vogel and Machizawa, 2004; Carlisleet al., 2011) have shown that the CDA commonly overlaps withboth the P3 component that is believed to index working memoryupdating (Donchin and Coles, 1988) and it is known to exist innonhuman primates (Arthur and Starr, 1984) and later negativityslow waves that have been documented in working memory tasks(Ruchkin et al., 1992). It appears that, across monkeys, we areobserving some individual differences in the onset and durationof these overlapping ERP components. Such individual differ-ences are common in human ERP studies, although the source ofsuch variation across subjects is not yet well understood (Woodman,2010). It is notable that monkey F exhibited a CDA that was similarto the other macaques, given that this monkey was �18 years of age.This finding appears to challenge a recent report in which the work-ing memory-related activity of older macaque monkeys appears tobe abnormal (Wang et al., 2011).
As is evident, the CDA latency differed by �100 ms betweenspecies (Fig. 4). However, a substantial portion of this interspe-cies latency difference is due to the use of different referenceelectrodes. A reanalysis of the human data using a frontocentralreference electrode, as in the monkey recordings, essentially elim-inated this latency discrepancy (Fig. 6). However, when compar-ing the latency of the CDA in humans and one monkey (i.e., Z)rereferenced to similar mastoid reference sites, it appears that themonkey CDA does onset �75 ms earlier than the same effect inhumans. This latency difference would be similar to previousstudies of macaque ERPs in which onset latencies of homologouscomponents are often �25% shorter than those observed in hu-mans (Woodman, 2012). The interspecies difference in CDA po-larity was reliably observed using both the standard average
mastoid and frontocentral reference electrodes. This polarity in-version of homologous ERP components across species is con-sistent with previous studies of lateralized attention effects(Woodman et al., 2007; Cohen et al., 2009), but was not found forthe error-related negativity and positivity in monkeys (Godloveet al., 2011). Such polarity inversions are most likely due to vari-ation of cortical folding across species (Woodman, 2010) becausethe orientation of the cortical tissue generating the electrical fieldsmeasured in ERP recordings determines the polarity of the com-ponent. For example, in humans it appears that the same ERPcomponent (i.e., the C1, which begins at �50 ms after stimulus)will flip polarity when the stimulus activates the inferior versussuperior banks of the calcarine sulcus (Clark et al., 1995). Never-theless, compared with the human, the monkey CDA exhibited acomparable latency following lateralized sensory transients andidentical persistence throughout the memory retention interval.In both species, the CDA continued until the saccadic responsewas initiated. However, the lateralized ERPs did not exhibit anincrease in amplitude immediately before the saccade, as wouldbe expected if it reflected saccade preparation (Figs. 4, 5, 6A).
Like all ERP components, the current sources of the CDA canbe modeled from the spatial distribution of voltages on the sur-
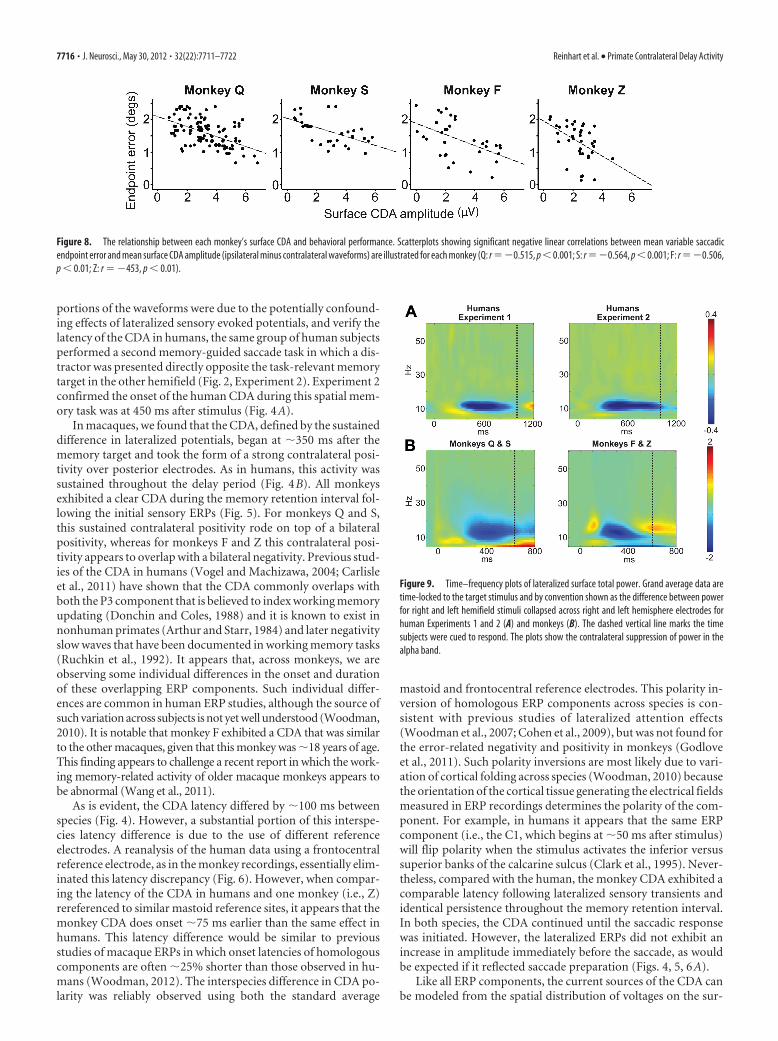
Figure 8. The relationship between each monkey’s surface CDA and behavioral performance. Scatterplots showing significant negative linear correlations between mean variable saccadicendpoint error and mean surface CDA amplitude (ipsilateral minus contralateral waveforms) are illustrated for each monkey (Q: r ��0.515, p � 0.001; S: r ��0.564, p � 0.001; F: r ��0.506,p � 0.01; Z: r � �453, p � 0.01).
Figure 9. Time–frequency plots of lateralized surface total power. Grand average data aretime-locked to the target stimulus and by convention shown as the difference between powerfor right and left hemifield stimuli collapsed across right and left hemisphere electrodes forhuman Experiments 1 and 2 (A) and monkeys (B). The dashed vertical line marks the timesubjects were cued to respond. The plots show the contralateral suppression of power in thealpha band.
7716 • J. Neurosci., May 30, 2012 • 32(22):7711–7722 Reinhart et al. • Primate Contralateral Delay Activity
face using all of the electrodes on the head. The spatial distribu-tion of the human CDA component from Experiments 1 and 2was assessed during the epoch that a significant CDA was found(i.e., 450 –1000 ms). The dense electrode array of monkey Z al-lowed for the same analysis of the monkey CDA (from 350 to 600ms) (Fig. 3 shows electrode configurations for each monkey).Distributed current densities were projected onto 3D reconstruc-tions of anatomical MRIs from the monkey and a reference brainfor humans. Current density in humans was concentrated in dor-sal posterior foci explaining 97% (Experiment 1) and 98% (Ex-periment 2) of the variance of the surface potential distribution(Fig. 4C). Similarly, current density for the monkey CDA wasconcentrated in dorsal posterior areas (96% explained variance)(Fig. 4D). We verified that a dorsal posterior scalp topographywas also found in humans when using a frontocentral reference,as was used in the monkeys (Fig. 6B). Thus, the spatial distribu-tion of current density producing the CDA in monkeys mirroredthat of humans performing the memory-guided saccade task witha target presented alone or with a distractor.
A key advantage of the memory-guided saccade task is that itprovides a graded metric of accuracy through the distribution ofsaccadic endpoints. Behavioral studies of the memory-guidedsaccade task in both humans (Ploner et al., 1998) and monkeys(White et al., 1994) have shown that measurements of saccadicendpoint scatter (i.e., the squared variability of saccadic end-point, sometimes known as variable error) is more directly re-lated to visual working memory maintenance than coarsermeasures of correct versus incorrect, or absolute error. To deter-mine the relationship between the delay period activity and thefidelity of the mnemonic representation guiding the behavioralresponse, we tested the prediction that the amplitude of the CDAmeasured during the retention interval predicted the spatial pre-cision of the subsequent memory-guided saccade. If the CDAprovides a measure of the quality of the memory representationof the location, then we would expect that a larger CDA would
result in less error due to a higher fidelityworking memory representation. In con-trast, if the CDA were simply measuringthe eccentricity of the remembered loca-tion, then the CDA would not predict theaccuracy of the behavioral report of thelocation, but instead simply the amplitudeof the saccadic response, regardless ofwhat the memory target location was.
We found that the mean amplitude ofthe CDA was predictive of the mean end-point error using subjects as the unit ofanalysis for humans and recording ses-sions for the monkey data (Fig. 7). Signif-icant negative correlations were observed
between mean CDA amplitude and magnitude of saccadic errorin humans (Experiment 1: r(9) � �0.841, p � 0.01; Experiment 2:r(9) � �0.810, p � 0.01) and monkeys (Q and S: r(139) � �0.528,p � 0.01; F and Z: r(71) � �0.447, p � 0.01) (Fig. 8). In contrast,we found that the amplitude of the CDA did not strongly orreliably predict the eccentricity of the saccadic responses made inhumans (values of r � �0.06 to �0.35; values of p 0.17) ormonkeys (values of r � �0.02 to �0.24; values of p 0.06). Wefound a similar pattern of results when within-subject correla-tions were performed. Specifically, within-subject correlationsmirrored those obtained using both measures of saccadic error(human and monkey: values of p � 0.01) and saccadic amplitude(human: values of p 0.11; monkey: values of p 0.10). Thus, aspredicted above, when CDA amplitude was higher, response er-ror was lower.
It has recently been shown that systematic modulation of thelateralized posterior alpha rhythm (8 –13 Hz) in humans mayaccount for the slow and sustained evoked responses of the CDA(Mazaheri and Jensen, 2008, 2010; van Dijk et al., 2010). Thishemisphere-specific lateralized EEG alpha activity over posteriorcortex is often referred to as contralateral alpha-band suppres-sion and is found during visuospatial working memory tasks inhumans (Jokisch and Jensen, 2007; Van Der Werf et al., 2008;Grimault et al., 2009; Sauseng et al., 2009). To provide additionalevidence that the macaque homolog of the human CDA is due tothe same EEG dynamics, we spectrally decomposed EEG signalsfrom both species to assess oscillatory fluctuations in the alphaband. Beginning �300 ms after memory target onset, alphapower in human was suppressed over parietooccipital electrodesin the hemisphere contralateral to the remembered stimulus (Fig.9A). That is, when the target was presented in the right hemifield,the right electrodes showed significantly greater alpha-bandpower relative to left electrodes (t(9) � 4.844; p � 0.002). Thesame pattern of activity was observed for targets presented on theleft (t(9) � 2.691; p � 0.03). These results replicate previous work
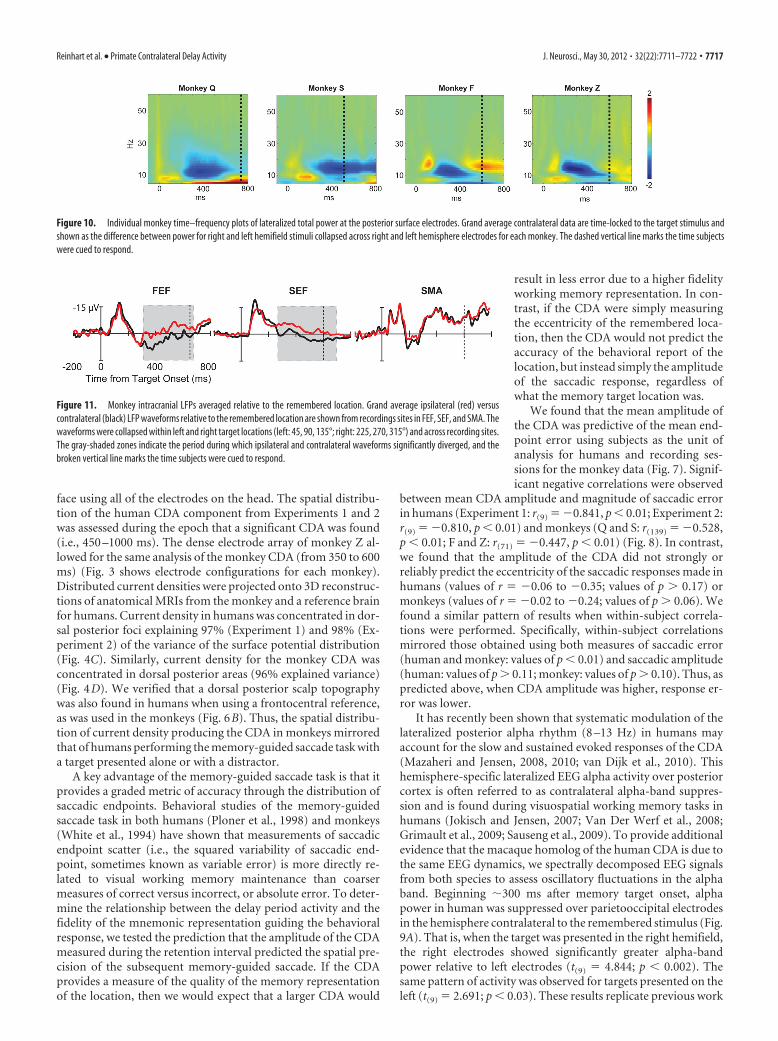
Figure 10. Individual monkey time–frequency plots of lateralized total power at the posterior surface electrodes. Grand average contralateral data are time-locked to the target stimulus andshown as the difference between power for right and left hemifield stimuli collapsed across right and left hemisphere electrodes for each monkey. The dashed vertical line marks the time subjectswere cued to respond.
Figure 11. Monkey intracranial LFPs averaged relative to the remembered location. Grand average ipsilateral (red) versuscontralateral (black) LFP waveforms relative to the remembered location are shown from recordings sites in FEF, SEF, and SMA. Thewaveforms were collapsed within left and right target locations (left: 45, 90, 135°; right: 225, 270, 315°) and across recording sites.The gray-shaded zones indicate the period during which ipsilateral and contralateral waveforms significantly diverged, and thebroken vertical line marks the time subjects were cued to respond.
Reinhart et al. • Primate Contralateral Delay Activity J. Neurosci., May 30, 2012 • 32(22):7711–7722 • 7717
(Jokisch and Jensen, 2007; Van Der Werf et al., 2008; Grimault etal., 2009; Sauseng et al., 2009) and demonstrate a strong lateral-ization in human alpha-band activity with respect to the hemi-field of the remembered stimulus during memory retention.
In macaques, we found a contralateral alpha-band suppressionbeginning at �150 ms following memory target onset over posteriorelectrodes mirroring the EEG effects found in humans (Fig. 9B). Allmonkeys exhibited suppressed alpha and low-beta power at poste-rior electrodes in the hemisphere contralateral to the rememberedstimulus. This resulted in power being significantly greater for thehemisphere ipsilateral to the remember stimulus (left hemisphere Q:t(108) � 2.572, p � 0.01; S: t(30) � 3.158, p � 0.004; F: t(32) � 2.214,p � 0.04; Z: t(38) � 2.613, p � 0.01; right hemisphere Q: t(108) �2.704, p � 0.009; S: t(30) � 3.252, p � 0.003; F: t(32) � 2.076, p � 0.05;Z: t(38) � 2.287, p � 0.02; Fig. 10). Despite the interspecies differencein CDA polarity previous noted, hemispheric lateralization of alphapower was reliably observed across species, providing further evi-dence that the human and monkey CDAs are indexing the samefundamental neural dynamics. In sum, time–frequency analysis ofoscillatory power for both human and nonhuman primates revealedstrong modulation of alpha-band activity during the delay period.
Intracranial event-related local field potentials andoscillatory activityAlthough estimating the current density producing the CDA pro-vides useful information, simultaneous intracranial recordings ofLFPs are critical to identify the sources in the distributed networkbelieved to underlie ERP components. This is because it is be-lieved that the surface ERPs are generated by a spatially weightedaverage of the postsynaptic LFP activity in the brain, although anumber of these sources might not contribute to the spatial dis-tribution of a component due to cancellation or superposition(Helmholtz, 1853; Luck, 2005; Nunez and Srinivasan, 2006;Woodman, 2010). In macaque monkeys performing thememory-guided saccade task, the LFPs recorded from FEF andSEF, but not SMA, exhibited sustained delay period activity whenthe memory target was in the contralateral hemifield (Fig. 11)(see also Fig. 12A). This resulted in significantly more positiveLFPs when the remembered location was contralateral to the sitein FEF (F(1,99) � 15.280; p � 0.01; 94% of sites significant) andSEF (F(1,65) � 22.160; p � 0.01; 92% of sites significant), but notin SMA (F(1,77) � 0.637; p � 0.427; 4% of sites significant). Inaddition to the traditional approach of measuring the CDA com-ponent by comparing polarization when remembered items werepresented in the contralateral versus the ipsilateral hemifield, werestricted the analysis to the trials when the memory target waslocated within the RF of the neuron recorded simultaneouslywith the LFPs. This more restrictive analysis yielded the samepattern of results with significant differences in the amplitude ofthe delay period LFPs when the memory item was in versus out ofthe RF of the neurons in FEF (F(1,99) � 13.770; p � 0.01; 92%of sites significant) and SEF (F(1,65) � 17.738; p � 0.01; 93% ofsites significant), but not in SMA (F(1,77) � 0.116; p � 0.734; 1%of sites significant).
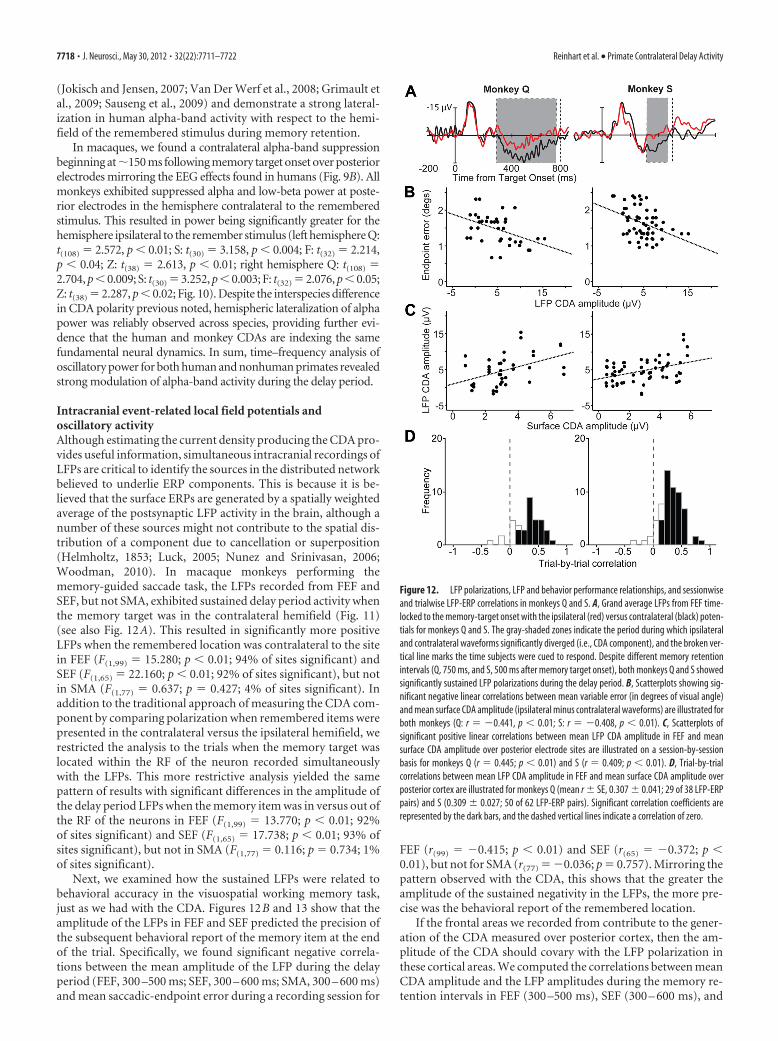
Next, we examined how the sustained LFPs were related tobehavioral accuracy in the visuospatial working memory task,just as we had with the CDA. Figures 12B and 13 show that theamplitude of the LFPs in FEF and SEF predicted the precision ofthe subsequent behavioral report of the memory item at the endof the trial. Specifically, we found significant negative correla-tions between the mean amplitude of the LFP during the delayperiod (FEF, 300 –500 ms; SEF, 300 – 600 ms; SMA, 300 – 600 ms)and mean saccadic-endpoint error during a recording session for
FEF (r(99) � �0.415; p � 0.01) and SEF (r(65) � �0.372; p �0.01), but not for SMA (r(77) � �0.036; p � 0.757). Mirroring thepattern observed with the CDA, this shows that the greater theamplitude of the sustained negativity in the LFPs, the more pre-cise was the behavioral report of the remembered location.
If the frontal areas we recorded from contribute to the gener-ation of the CDA measured over posterior cortex, then the am-plitude of the CDA should covary with the LFP polarization inthese cortical areas. We computed the correlations between meanCDA amplitude and the LFP amplitudes during the memory re-tention intervals in FEF (300 –500 ms), SEF (300 – 600 ms), and
Figure 12. LFP polarizations, LFP and behavior performance relationships, and sessionwiseand trialwise LFP-ERP correlations in monkeys Q and S. A, Grand average LFPs from FEF time-locked to the memory-target onset with the ipsilateral (red) versus contralateral (black) poten-tials for monkeys Q and S. The gray-shaded zones indicate the period during which ipsilateraland contralateral waveforms significantly diverged (i.e., CDA component), and the broken ver-tical line marks the time subjects were cued to respond. Despite different memory retentionintervals (Q, 750 ms, and S, 500 ms after memory target onset), both monkeys Q and S showedsignificantly sustained LFP polarizations during the delay period. B, Scatterplots showing sig-nificant negative linear correlations between mean variable error (in degrees of visual angle)and mean surface CDA amplitude (ipsilateral minus contralateral waveforms) are illustrated forboth monkeys (Q: r � �0.441, p � 0.01; S: r � �0.408, p � 0.01). C, Scatterplots ofsignificant positive linear correlations between mean LFP CDA amplitude in FEF and meansurface CDA amplitude over posterior electrode sites are illustrated on a session-by-sessionbasis for monkeys Q (r � 0.445; p � 0.01) and S (r � 0.409; p � 0.01). D, Trial-by-trialcorrelations between mean LFP CDA amplitude in FEF and mean surface CDA amplitude overposterior cortex are illustrated for monkeys Q (mean r SE, 0.307 0.041; 29 of 38 LFP-ERPpairs) and S (0.309 0.027; 50 of 62 LFP-ERP pairs). Significant correlation coefficients arerepresented by the dark bars, and the dashed vertical lines indicate a correlation of zero.
7718 • J. Neurosci., May 30, 2012 • 32(22):7711–7722 Reinhart et al. • Primate Contralateral Delay Activity
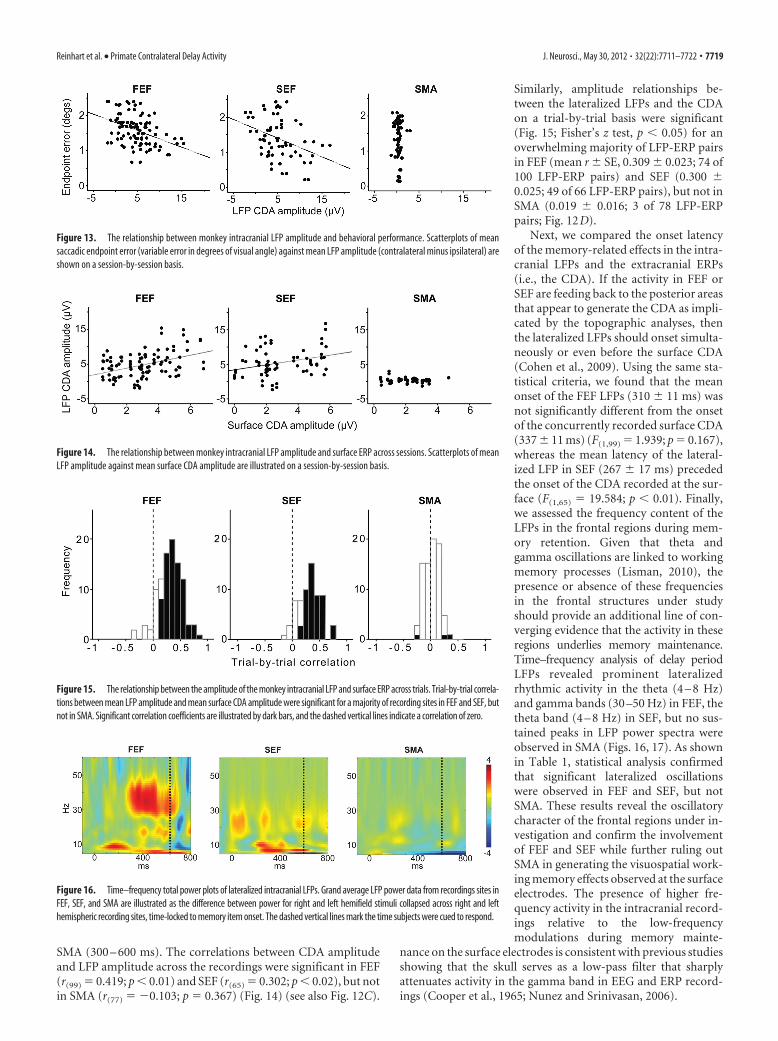
SMA (300 – 600 ms). The correlations between CDA amplitudeand LFP amplitude across the recordings were significant in FEF(r(99) � 0.419; p � 0.01) and SEF (r(65) � 0.302; p � 0.02), but notin SMA (r(77) � �0.103; p � 0.367) (Fig. 14) (see also Fig. 12C).
Similarly, amplitude relationships be-tween the lateralized LFPs and the CDAon a trial-by-trial basis were significant(Fig. 15; Fisher’s z test, p � 0.05) for anoverwhelming majority of LFP-ERP pairsin FEF (mean r SE, 0.309 0.023; 74 of100 LFP-ERP pairs) and SEF (0.300 0.025; 49 of 66 LFP-ERP pairs), but not inSMA (0.019 0.016; 3 of 78 LFP-ERPpairs; Fig. 12D).
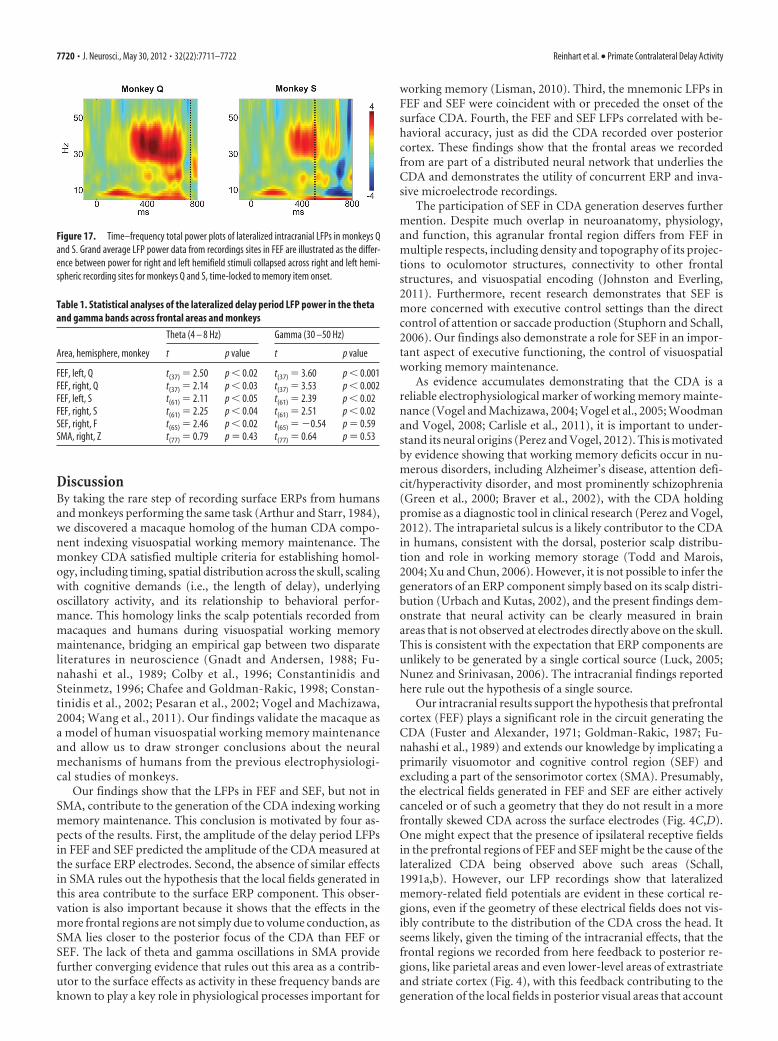
Next, we compared the onset latencyof the memory-related effects in the intra-cranial LFPs and the extracranial ERPs(i.e., the CDA). If the activity in FEF orSEF are feeding back to the posterior areasthat appear to generate the CDA as impli-cated by the topographic analyses, thenthe lateralized LFPs should onset simulta-neously or even before the surface CDA(Cohen et al., 2009). Using the same sta-tistical criteria, we found that the meanonset of the FEF LFPs (310 11 ms) wasnot significantly different from the onsetof the concurrently recorded surface CDA(337 11 ms) (F(1,99) � 1.939; p � 0.167),whereas the mean latency of the lateral-ized LFP in SEF (267 17 ms) precededthe onset of the CDA recorded at the sur-face (F(1,65) � 19.584; p � 0.01). Finally,we assessed the frequency content of theLFPs in the frontal regions during mem-ory retention. Given that theta andgamma oscillations are linked to workingmemory processes (Lisman, 2010), thepresence or absence of these frequenciesin the frontal structures under studyshould provide an additional line of con-verging evidence that the activity in theseregions underlies memory maintenance.Time–frequency analysis of delay periodLFPs revealed prominent lateralizedrhythmic activity in the theta (4 – 8 Hz)and gamma bands (30 –50 Hz) in FEF, thetheta band (4 – 8 Hz) in SEF, but no sus-tained peaks in LFP power spectra wereobserved in SMA (Figs. 16, 17). As shownin Table 1, statistical analysis confirmedthat significant lateralized oscillationswere observed in FEF and SEF, but notSMA. These results reveal the oscillatorycharacter of the frontal regions under in-vestigation and confirm the involvementof FEF and SEF while further ruling outSMA in generating the visuospatial work-ing memory effects observed at the surfaceelectrodes. The presence of higher fre-quency activity in the intracranial record-ings relative to the low-frequencymodulations during memory mainte-
nance on the surface electrodes is consistent with previous studiesshowing that the skull serves as a low-pass filter that sharplyattenuates activity in the gamma band in EEG and ERP record-ings (Cooper et al., 1965; Nunez and Srinivasan, 2006).
Figure 13. The relationship between monkey intracranial LFP amplitude and behavioral performance. Scatterplots of meansaccadic endpoint error (variable error in degrees of visual angle) against mean LFP amplitude (contralateral minus ipsilateral) areshown on a session-by-session basis.
Figure 14. The relationship between monkey intracranial LFP amplitude and surface ERP across sessions. Scatterplots of meanLFP amplitude against mean surface CDA amplitude are illustrated on a session-by-session basis.
Figure 15. The relationship between the amplitude of the monkey intracranial LFP and surface ERP across trials. Trial-by-trial correla-tions between mean LFP amplitude and mean surface CDA amplitude were significant for a majority of recording sites in FEF and SEF, butnot in SMA. Significant correlation coefficients are illustrated by dark bars, and the dashed vertical lines indicate a correlation of zero.
Figure 16. Time–frequency total power plots of lateralized intracranial LFPs. Grand average LFP power data from recordings sites inFEF, SEF, and SMA are illustrated as the difference between power for right and left hemifield stimuli collapsed across right and lefthemispheric recording sites, time-locked to memory item onset. The dashed vertical lines mark the time subjects were cued to respond.
Reinhart et al. • Primate Contralateral Delay Activity J. Neurosci., May 30, 2012 • 32(22):7711–7722 • 7719
DiscussionBy taking the rare step of recording surface ERPs from humansand monkeys performing the same task (Arthur and Starr, 1984),we discovered a macaque homolog of the human CDA compo-nent indexing visuospatial working memory maintenance. Themonkey CDA satisfied multiple criteria for establishing homol-ogy, including timing, spatial distribution across the skull, scalingwith cognitive demands (i.e., the length of delay), underlyingoscillatory activity, and its relationship to behavioral perfor-mance. This homology links the scalp potentials recorded frommacaques and humans during visuospatial working memorymaintenance, bridging an empirical gap between two disparateliteratures in neuroscience (Gnadt and Andersen, 1988; Fu-nahashi et al., 1989; Colby et al., 1996; Constantinidis andSteinmetz, 1996; Chafee and Goldman-Rakic, 1998; Constan-tinidis et al., 2002; Pesaran et al., 2002; Vogel and Machizawa,2004; Wang et al., 2011). Our findings validate the macaque asa model of human visuospatial working memory maintenanceand allow us to draw stronger conclusions about the neuralmechanisms of humans from the previous electrophysiologi-cal studies of monkeys.
Our findings show that the LFPs in FEF and SEF, but not inSMA, contribute to the generation of the CDA indexing workingmemory maintenance. This conclusion is motivated by four as-pects of the results. First, the amplitude of the delay period LFPsin FEF and SEF predicted the amplitude of the CDA measured atthe surface ERP electrodes. Second, the absence of similar effectsin SMA rules out the hypothesis that the local fields generated inthis area contribute to the surface ERP component. This obser-vation is also important because it shows that the effects in themore frontal regions are not simply due to volume conduction, asSMA lies closer to the posterior focus of the CDA than FEF orSEF. The lack of theta and gamma oscillations in SMA providefurther converging evidence that rules out this area as a contrib-utor to the surface effects as activity in these frequency bands areknown to play a key role in physiological processes important for
working memory (Lisman, 2010). Third, the mnemonic LFPs inFEF and SEF were coincident with or preceded the onset of thesurface CDA. Fourth, the FEF and SEF LFPs correlated with be-havioral accuracy, just as did the CDA recorded over posteriorcortex. These findings show that the frontal areas we recordedfrom are part of a distributed neural network that underlies theCDA and demonstrates the utility of concurrent ERP and inva-sive microelectrode recordings.
The participation of SEF in CDA generation deserves furthermention. Despite much overlap in neuroanatomy, physiology,and function, this agranular frontal region differs from FEF inmultiple respects, including density and topography of its projec-tions to oculomotor structures, connectivity to other frontalstructures, and visuospatial encoding (Johnston and Everling,2011). Furthermore, recent research demonstrates that SEF ismore concerned with executive control settings than the directcontrol of attention or saccade production (Stuphorn and Schall,2006). Our findings also demonstrate a role for SEF in an impor-tant aspect of executive functioning, the control of visuospatialworking memory maintenance.
As evidence accumulates demonstrating that the CDA is areliable electrophysiological marker of working memory mainte-nance (Vogel and Machizawa, 2004; Vogel et al., 2005; Woodmanand Vogel, 2008; Carlisle et al., 2011), it is important to under-stand its neural origins (Perez and Vogel, 2012). This is motivatedby evidence showing that working memory deficits occur in nu-merous disorders, including Alzheimer’s disease, attention defi-cit/hyperactivity disorder, and most prominently schizophrenia(Green et al., 2000; Braver et al., 2002), with the CDA holdingpromise as a diagnostic tool in clinical research (Perez and Vogel,2012). The intraparietal sulcus is a likely contributor to the CDAin humans, consistent with the dorsal, posterior scalp distribu-tion and role in working memory storage (Todd and Marois,2004; Xu and Chun, 2006). However, it is not possible to infer thegenerators of an ERP component simply based on its scalp distri-bution (Urbach and Kutas, 2002), and the present findings dem-onstrate that neural activity can be clearly measured in brainareas that is not observed at electrodes directly above on the skull.This is consistent with the expectation that ERP components areunlikely to be generated by a single cortical source (Luck, 2005;Nunez and Srinivasan, 2006). The intracranial findings reportedhere rule out the hypothesis of a single source.
Our intracranial results support the hypothesis that prefrontalcortex (FEF) plays a significant role in the circuit generating theCDA (Fuster and Alexander, 1971; Goldman-Rakic, 1987; Fu-nahashi et al., 1989) and extends our knowledge by implicating aprimarily visuomotor and cognitive control region (SEF) andexcluding a part of the sensorimotor cortex (SMA). Presumably,the electrical fields generated in FEF and SEF are either activelycanceled or of such a geometry that they do not result in a morefrontally skewed CDA across the surface electrodes (Fig. 4C,D).One might expect that the presence of ipsilateral receptive fieldsin the prefrontal regions of FEF and SEF might be the cause of thelateralized CDA being observed above such areas (Schall,1991a,b). However, our LFP recordings show that lateralizedmemory-related field potentials are evident in these cortical re-gions, even if the geometry of these electrical fields does not vis-ibly contribute to the distribution of the CDA cross the head. Itseems likely, given the timing of the intracranial effects, that thefrontal regions we recorded from here feedback to posterior re-gions, like parietal areas and even lower-level areas of extrastriateand striate cortex (Fig. 4), with this feedback contributing to thegeneration of the local fields in posterior visual areas that account
Figure 17. Time–frequency total power plots of lateralized intracranial LFPs in monkeys Qand S. Grand average LFP power data from recordings sites in FEF are illustrated as the differ-ence between power for right and left hemifield stimuli collapsed across right and left hemi-spheric recording sites for monkeys Q and S, time-locked to memory item onset.
Table 1. Statistical analyses of the lateralized delay period LFP power in the thetaand gamma bands across frontal areas and monkeys
Area, hemisphere, monkey
Theta (4 – 8 Hz) Gamma (30 –50 Hz)
t p value t p value
FEF, left, Q t(37) � 2.50 p � 0.02 t(37) � 3.60 p � 0.001FEF, right, Q t(37) � 2.14 p � 0.03 t(37) � 3.53 p � 0.002FEF, left, S t(61) � 2.11 p � 0.05 t(61) � 2.39 p � 0.02FEF, right, S t(61) � 2.25 p � 0.04 t(61) � 2.51 p � 0.02SEF, right, F t(65) � 2.46 p � 0.02 t(65) � �0.54 p � 0.59SMA, right, Z t(77) � 0.79 p � 0.43 t(77) � 0.64 p � 0.53
7720 • J. Neurosci., May 30, 2012 • 32(22):7711–7722 Reinhart et al. • Primate Contralateral Delay Activity
for the observed CDA distribution at the surface. At this point, itis unclear whether the nature of the neural activity underlying theCDA is that of sustained firing of neurons, oscillatory enhancement,or relative suppression. However, these are network-dynamic hy-potheses that future concurrent intracranial recordings will be ableto test in further detail.
Future work using our combination of ERP and intracranialrecordings will be aimed at distinguishing between competingmodels of visuospatial working memory that differ in their pro-posed roles that attention mechanisms play in the maintenance ofinformation. For example, one theoretical perspective is that in-formation is maintained in visuospatial working memory by thedeployment of attention to the remembered location in thememory-guided saccade task (Cowan, 1999; Awh and Jonides,2001). This could explain why the lateralized ERP effects of covertattentional deployment resemble those of working memorymaintenance reported here at the level of the surface ERPs(Woodman et al., 2007; Cohen et al., 2009). However, other the-ories propose that the maintenance of information and covertattentional selection rely upon separate mechanisms (Baddeley,2003). The set of empirical tools that we have developed here holdnew promise for definitively distinguishing between cognitivemodels of working memory. In addition, our findings will guideinactivation and microstimulation studies that will be able toprovide causal evidence that characterizes the precise neuroana-tomical loci and neurophysiological events that give rise to themacaque homolog of the human CDA.
ReferencesArthur DL, Starr A (1984) Task-relevant late positive component of the
auditory event-related potential in monkeys resembles P300 in humans.Science 223:186 –188.
Awh E, Jonides J (2001) Overlapping mechanisms of attention and spatialworking memory. Trends Cogn Sci 5:119 –126.
Baddeley A (2003) Working memory: looking back and looking forward.Nat Rev Neurosci 4:829 – 839.
Bahill AT, McDonald JD (1983) Smooth pursuit eye movements in re-sponse to predictable target motions. Vision Res 23:1573–1583.
Braver TS, Cohen JD, Barch DM (2002) The role of the prefrontal cortex innormal and disordered cognitive control: a cognitive neuroscience per-spective. In: Principles of frontal lobe function (Stuff DT, Knight RT, eds),pp 428 – 448. Oxford: Oxford UP.
Carlisle NB, Arita JT, Pardo D, Woodman GF (2011) Attentional templatesin visual working memory. J Neurosci 31:9315–9322.
Chafee MV, Goldman-Rakic PS (1998) Neuronal activity in macaque pre-frontal area 8a and posterior parietal area 7ip related to memory guidedsaccades. J Neurophysiol 79:2919 –2940.
Clark VP, Fan S, Hillyard SA (1995) Identification of early visual evokedpotential generators by retinotopic and topographic analyses. Hum BrainMapp 2:170 –187.
Cohen JY, Heitz RP, Schall JD, Woodman GF (2009) On the origin of event-related potentials indexing covert attentional selection during visualsearch. J Neurophysiol 102:2375–2386.
Colby CL, Duhamel JR, Goldberg ME (1996) Visual, presaccadic, and cog-nitive activation of single neurons in monkey lateral intraparietal area.J Neurophysiol 76:2841–2852.
Constantinidis C, Steinmetz MA (1996) Neuronal activity in posterior pa-rietal area 7a during the delay periods of a spatial memory task. J Neuro-physiol 76:1352–1355.
Constantinidis C, Williams GV, Goldman-Rakic PS (2002) A role for inhi-bition in shaping the temporal flow of information in prefrontal cortex.Nat Neurosci 5:175–180.
Cooper R, Winter AL, Crow HJ, Walter WG (1965) Comparison of subcor-tical, cortical, and scalp activity using chronically indwelling electrodes inman. Electroencephalogr Clin Neurophysiol 18:217–228.
Cowan N (1999) An embedded-processes model of working memory. In:Models of working memory: mechanisms of active maintenance and ex-
ecutive control (Miyake A, Shah P, eds), pp 62–101. Cambridge, UK:Cambridge UP.
Cowan N (2001) The magical number 4 in short-term memory: a reconsid-eration of mental storage capacity. Behav Brain Sci 24:87–185.
Curtis CE, Rao VY, D’Esposito M (2004) Maintenance of spatial andmotor codes during oculomotor delayed response tasks. J Neurosci24:3944 –3952.
Donchin E, Coles MGH (1988) Is the P300 component a manifestation ofcontext updating. Behav Brain Sci 11:357–374.
Fuchs M, Kastner J, Wagner M, Hawes S, Ebersole JS (2002) A standardizedboundary element method volume conductor model. Clin Neurophysiol113:702–712.
Funahashi S, Bruce CJ, Goldman-Rakic PS (1989) Mnemonic coding of vi-sual space in the monkey’s dorsolateral prefrontal cortex. J Neurophysiol61:331–349.
Fuster JM, Alexander GE (1971) Neuron activity related to short-termmemory. Science 173:652– 654.
Gnadt JW, Andersen RA (1988) Memory related motor planning activity inposterior parietal cortex of macaque. Exp Brain Res 70:216 –220.
Godlove DC, Emeric EE, Segovis CM, Young MS, Schall JD, Woodman GF(2011) Event-related potentials elicited by errors during the stop-signaltask. I: Macaque monkeys. J Neurosci 31:15640 –15649.
Goldman-Rakic PS (1987) Circuitry of the prefrontal cortex and the reg-ulation of behavior by representational knowledge. In: Handbook ofphysiology (Plum F, Mountcastle VB, eds). Bethesda, MD: AmericanPhysiological Society.
Green MF, Kern RS, Braff DL, Mintz J (2000) Neurocognitive deficits andfunctional outcome in schizophrenia: are we measuring the “right stuff?”Schizophr Bull 26:119 –136.
Grimault S, Robitaille N, Grova C, Lina JM, Dubarry AS, Jolicoeur P (2009)Oscillatory activity in parietal and dorsolateral prefrontal cortex duringretention in visual short-term memory: additive effects of spatial atten-tion and memory load. Hum Brain Mapp 30:3378 –3392.
Hanes DP, Schall JD (1995) Countermanding saccades in macaque. VisNeurosci 12:929 –937.
Helmholtz Hv (1853) Ueber einige Gesetze der Vertheilung elektrischerStrome in korperlichen Leitern mit Anwendung auf die thierisch-elektrischen Versuche. Annalen der Physik und Chemie 89:211–233,354 –377.
Jennings JR, Wood CC (1976) The e-adjustment procedure for repeated-measures analyses of variance. Psychophysiology 13:277–278.
Johnston KE, Everling S (2011) Frontal cortex and flexible control of sac-cades. In: The Oxford handbook of eye movements (Liversedge S, Gil-christ I, Everling S, eds), pp 279 –302. New York: Oxford UP.
Jokisch D, Jensen O (2007) Modulation of gamma and alpha activity duringa working memory task engaging the dorsal or ventral stream. J Neurosci27:3244 –3251.
Lamme VA, Van Dijk BW, Spekreijse H (1992) Texture segregation ispressed by primary visual cortex in man and monkey. Evidence from VEPexperiments. Vision Res 32:797– 807.
Lisman J (2010) Working memory: the importance of theta and gammaoscillations. Curr Biol 20:R490 –R492.
Luck SJ (2005) An introduction to the event-related potential technique.Cambridge, MA: MIT.
Luck SJ, Vogel EK (1997) The capacity of visual working memory for fea-tures and conjunctions. Nature 390:279 –281.
Mazaheri A, Jensen O (2008) Asymmetric amplitude modulations of brainoscillations generate slow evoked responses. J Neurosci 28:7781–7787.
Mazaheri A, Jensen O (2010) Rhythmic pulsing: linking ongoing brain ac-tivity with evoked responses. Front Hum Neurosci 4:177.
Nunez PL, Srinivasan R (2006) Electric fields of the brain: the neurophysicsof EEG, Ed 2. Oxford: Oxford UP.
Oostenveld R, Fries P, Maris E, Schoffelen JM (2011) FieldTrip: open sourcesoftware for advanced analysis of MEG, EEG, and invasive electrophysi-ological data. Comput Intell Neurosci 2011:156869.
Perez VB, Vogel EK (2012) What ERPs can tell us about working memory.In: Oxford handbook of event-related potential components (Luck SJ,Kappenman E, eds), pp 361–372. New York: Oxford UP.
Pesaran B, Pezaris JS, Sahani M, Mitra PP, Andersen RA (2002) Temporalstructure in neuronal activity during working memory in macaque pari-etal cortex. Nat Neurosci 5:805– 811.
Ploner CJ, Gaymard B, Rivaud S, Agid Y, Pierrot-Deseilligny C (1998) Tem-
Reinhart et al. • Primate Contralateral Delay Activity J. Neurosci., May 30, 2012 • 32(22):7711–7722 • 7721
poral limits of spatial working memory in human. Eur J Neurosci10:794 –797.
Reinhart RM, Carlisle NB, Kang MS, Woodman GF (2012) Event-relatedpotentials elicited by errors during the stop-signal task. II: Human effec-tor specific error responses. J Neurophysiol 107:2794 –2807.
Ruchkin DS, Johnson R Jr, Grafman J, Canoune H, Ritter W (1992) Distinc-tions and similarities among working memory processes: an event-relatedpotential study. Brain Res Cogn Brain Res 1:53– 66.
Sauseng P, Klimesch W, Heise KF, Gruber WR, Holz E, Karim AA, GlennonM, Gerloff C, Birbaumer N, Hummel FC (2009) Brain oscillatory sub-strates of visual short-term memory capacity. Curr Biol 19:1846 –1852.
Schall JD (1991a) Neuronal activity related to visually guided saccadic eyemovements in the supplementary motor area of rhesus monkeys. J Neu-rophysiol 66:530 –558.
Schall JD (1991b) Neuronal activity related to visually guided saccades inthe frontal eye fields of rhesus monkeys: comparison with supplementaryeye fields. J Neurophysiol 66:559 –579.
Schroeder CE, Tenke CE, Givre SJ, Arezzo JC, Vaughan HG Jr (1991) Striatecortical contribution to the surface-recorded pattern-reversal VEP in thealert monkey. Vision Res 31:1143–1157.
Schroeder CE, Tenke CE, Givre SJ (1992) Subcortical contributions to thesurface-recorded flash-VEP in the awake macaque. ElectroencephalogrClin Neurophysiol 84:219 –231.
Stuphorn V, Schall JD (2006) Executive control of countermanding sac-cades by the supplementary eye field. Nat Neurosci 9:925–931.
Todd JJ, Marois R (2004) The capacity limit of visual short-term memory inhuman posterior parietal cortex. Nature 428:751–754.
Urbach TP, Kutas M (2002) The intractability of scaling scalp distributionsto infer neuroelectric sources. Psychophysiology 39:791– 808.
Van Der Werf J, Jensen O, Fries P, Medendorp WP (2008) Gamma-bandactivity in human posterior parietal cortex encodes the motor goal duringdelayed prosaccades and antisaccades. J Neurosci 28:8397– 8405.
van Dijk H, van der Werf J, Mazaheri A, Medendorp WP, Jensen O (2010)
Modulations in oscillatory activity with amplitude asymmetry can pro-duce cognitively relevant event-related responses. Proc Natl Acad SciU S A 107:900 –905.
Vogel EK, Machizawa MG (2004) Neural activity predicts individual differ-ences in visual working memory capacity. Nature 428:748 –751.
Vogel EK, McCollough AW, Machizawa MG (2005) Neural measures revealindividual differences in controlling access to working memory. Nature438:500 –503.
Wagner M, Fuchs M, Kastner J (2007) SWARM: sLORETA-weighted accu-rate minimum norm inverse solutions. International Congress Series1300:185–188.
Wang M, Gamo NJ, Yang Y, Jin LE, Wang X-J, Laubach M, Mazer JA, Lee D,Arnsten AF (2011) Neuronal basis of age-related working memory de-cline. Nature 476:210 –213.
White JM, Sparks DL, Stanford TR (1994) Saccades to remembered targetlocations: an analysis of systematic and variable errors. Vision Res34:79 –92.
Woodman GF (2010) A brief introduction to the use of event-related po-tentials in studies of perception and attention. Atten Percept Psychophys72:2031–2046.
Woodman GF (2012) Homologues of human event-related potential com-ponents in nonhuman primates. In: The Oxford handbook of event-related potential components (Luck SJ, Kappenman E, eds), pp 611– 625.New York: Oxford UP.
Woodman GF, Vogel EK (2008) Top-down control of visual working mem-ory consolidation. Psychon Bull Rev 15:223–229.
Woodman GF, Kang MS, Rossi AF, Schall JD (2007) Nonhuman primateevent-related potentials indexing covert shifts of attention. Proc NatlAcad Sci U S A 104:15111–15116.
Xu Y, Chun MM (2006) Dissociable neural mechanisms supporting visualshort-term memory for objects. Nature 440:91–95.
Zhang W, Luck SJ (2008) Discrete fixed-resolution representations in visualworking memory. Nature 453:233–235.
7722 • J. Neurosci., May 30, 2012 • 32(22):7711–7722 Reinhart et al. • Primate Contralateral Delay Activity