HOMEWORK P.410: 33) 0.0060; reject the null hypothesis. 34) 0.7264; fail to reject the null...
16
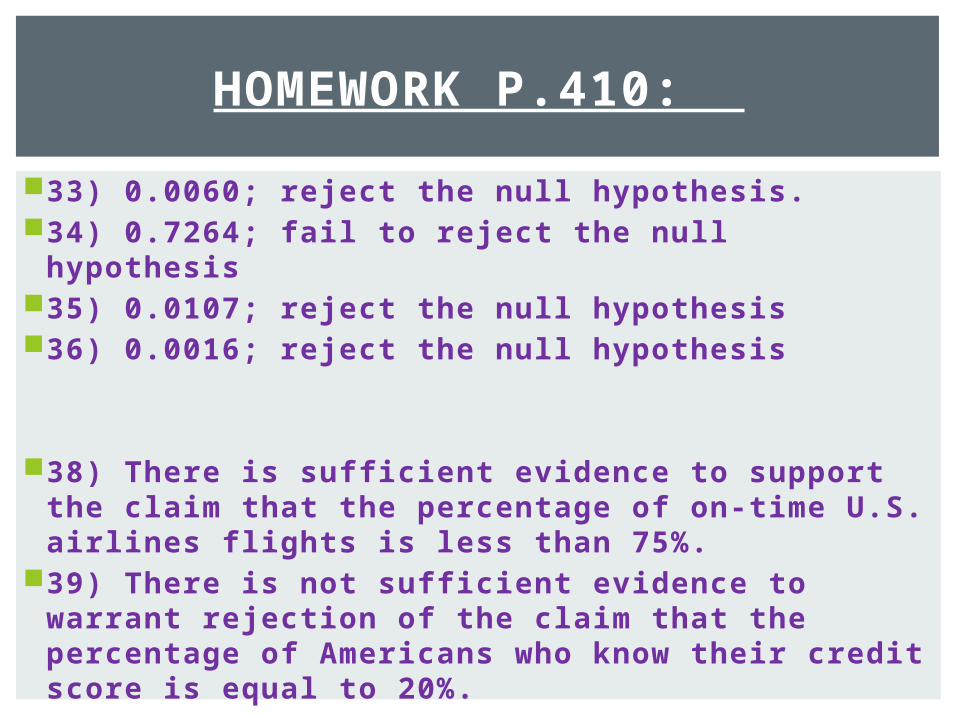
HOMEWORK P.410: 33) 0.0060; reject the null hypothesis. 34) 0.7264; fail to reject the null hypothesis 35) 0.0107; reject the null hypothesis 36) 0.0016; reject the null hypothesis 38) There is sufficient evidence to support the claim that the percentage of on-time U.S. airlines flights is less than 75%. 39) There is not sufficient evidence to warrant rejection of the claim that the percentage of Americans who know their credit score is equal to 20%.
-
Upload
kathryn-ramsey -
Category
Documents
-
view
227 -
download
2
Transcript of HOMEWORK P.410: 33) 0.0060; reject the null hypothesis. 34) 0.7264; fail to reject the null...
HOMEWORK P.410:
33) 0.0060; reject the null hypothesis.34) 0.7264; fail to reject the null hypothesis35) 0.0107; reject the null hypothesis36) 0.0016; reject the null hypothesis
38) There is suffi cient evidence to support the claim that the percentage of on-time U.S. airlines fl ights is less than 75%.
39) There is not suffi cient evidence to warrant rejection of the claim that the percentage of Americans who know their credit score is equal to 20%.

Testing a Claim About a Proportion
SECTION 8.3

Medicine: Are certain medications effective? Can pregnant women correctly guess the sex of their
babies? Do different medical procedures provide the results they
promise?Entertainment:
How effective are different commercials? How many people watch the Super Bowl – are these high
priced ad spaces worthwhile? Business
Do products work as advertised? How many people might be interested in a new product?
Create your own!
WHY TEST A CLAIM?

Section 8.2
We looked at the individual components of a hypothesis test and how they each work.
Section 8.3
We will test different proportion claims to determine if they are true or not.
WHAT’S THE DIFFERENCE?

Step 0: Check Requirements. Simple Random Sample Conditions for a Binomial Distribution are satisfied and
Step 1: Determine and . Step 2: Select an appropriate (normally .05
or .01)Step 3: Calculate the appropriate test statisticStep 4: Determine the P-value (Draw a picture)Step 5: Reject if the P-value , fail to reject if notStep 6: State conclusion in simple non-technical
terms
THE HOW TO

The XSORT is a method of gender selection that promises couples an increased chance of having a baby girl. Among 726 babies born to
couples using the XSORT method in an attempt to have a baby girl, 668 of the babies
were girls and the others were boys. Use these results with a 0.05 significance level to
test the claim that among babies born to couples using the XSORT method, the
proportion of girls is greater than the value of 0.5 expected with no treatment.
THE PROBLEM

Step 0: Check Requirements. Simple Random Sample Conditions for a Binomial Distribution are satisfied and
THE HOW TO
Step 1: Determine and .
THE HOW TO
Step 2: Select an appropriate (normally .05 or .01)
THE HOW TO

Step 3: Calculate the appropriate test statistic
THE HOW TO
Step 4: Determine the P-value (Draw a picture)
THE HOW TO

Step 5: Reject if the P-value , fail to reject if not
THE HOW TO

Step 6: State conclusion in simple non-technical terms
THE HOW TO

A study addressed the issue of whether pregnant women can correctly guess the sex of their baby. Among the 104 subjects, 55% correctly guessed the sex of the baby. How
many of the 104 made correct guesses?
FINDING THE NUMBER OF SUCCESSES X

If you can create a confidence interval using the sample statistic, and it does
not contain the value for the parameter given by the null hypothesis, you can
reject the null hypothesis.
SIDE NOTE: CONFIDENCE INTERVAL METHOD