Homework assignment and student achievement in · PDF fileDiscussion Papers No. 711, October...
36
Discussion Papers Statistics Norway Research department No. 711 • October 2012 Torberg Falch and Marte Rønning Homework assignment and student achievement in OECD countries
Transcript of Homework assignment and student achievement in · PDF fileDiscussion Papers No. 711, October...

Discussion Papers
Statistics NorwayResearch department
No. 711 •October 2012
Torberg Falch and Marte Rønning
Homework assignment and student achievement in OECD countries


Discussion Papers No. 711, October 2012 Statistics Norway, Research Department
Torberg Falch and Marte Rønning
Homework assignment and student achievement in OECD countries
Abstract: This paper analyzes the effect of assigning homework on student achievement using data from 16 OECD countries that participated in TIMSS 2007. The model exploits withinstudent variation in homework across subjects in a sample of primary school students who have the same teacher in two related subjects; mathematics and science. Unobserved teacher and student characteristics are thus conditioned out of the model and the identification rests on random relative homework assignment across the subjects at the teacher and classroom level. We find a modest, but statistically significant effect of homework. The effect varies across countries, and it is positively correlated with the amount of time students and teachers spend in the classroom.
Keywords: Homework assignment, student achievement
JEL classification: I20, I21, I24, I
Acknowledgements: We are grateful for generous comments from David Figlio, Edwin Leuven, Bjarne Strøm, Ludger Woessmann, and seminar participants in Oslo, Trondheim and the EALE-conference in Bonn.
Address: Marte Rønning, Statistics Norway, Research Department. E-mail: [email protected]
Torberg Falch,Department of Economics. Norwegian University of Science and Technology, N-7491 Trondheim, Norway. E-post: [email protected]

Discussion Papers comprise research papers intended for international journals or books. A preprint of a Discussion Paper may be longer and more elaborate than a standard journal article, as it may include intermediate calculations and background material etc.
© Statistics Norway Abstracts with downloadable Discussion Papers in PDF are available on the Internet: http://www.ssb.no http://ideas.repec.org/s/ssb/dispap.html For printed Discussion Papers contact: Statistics Norway Telephone: +47 62 88 55 00 E-mail: [email protected] ISSN 0809-733X Print: Statistics Norway

3
Sammendrag
I denne artikkelen studerer vi effekten av å gi hjemmelekser på elevprestasjoner blant ni-åringer i 16
OECD land. Flertallet av elevene har samme klasse og lærer i to fag (matematikk og naturfag).
Uobserverbare faste egenskaper ved elevene og læreren kan derfor differensieres bort ved å utnytte at
samme lærer gir ulik mengede hjemmelekser i de to fagene. Gjennomsnittseffekten, på tvers av alle
land, viser at lekser til alle timer øker elevprestasjonene med omtrent 3 poeng (4 prosent av ett
standardavvik) i fohold til at det aldri blir gitt lekser. Jenter som får hjemmelekser ser også ut til å
gjøre det bedre enn gutter som får hjemmelekser. Når vi ser på hvert land hver for seg, finner vi at
effekten av hjemmelekser er høyest i USA, Australia og Østerrike (14-21 prosent av ett
standardavvik). Til slutt tyder resultatene også på at effekten av lekser er større i de landene hvor både
lærerne og elevene tilbringer mer tid i skolen. Dataene som benyttes i analysen kommer fra TIMSS
2007 (Trends in International Mathematics and Science Study).

1 Introduction
It is a widespread belief among school leaders, teachers and parents that homework is a valuable
educational tool. However, the literature on the effect of homework on student achievement is
scarce and mainly concentrated to the US.
In this paper we estimate the effect of homework for 16 OECD countries using data from
the Trends in International Mathematics and Science Study (TIMSS) in 2007 for nine years old
students. Homework assignment is decided by the teachers in the classroom. Thus, the main
empirical challenge is that observed homework assignment is likely to be correlated with unob-
served characteristics of teachers and students. The present paper exploits that most students in
primary education are in the same class and have the same teacher in mathematics and science,
but are assigned different amount of homework in these two subjects. The estimation strategy
relies on random relative homework assignment in mathematics and science at the teacher level,
conditional on unobserved student characteristics. We investigate the validity of this assumption
in several ways. Metzler and Woessmann (2012) use a similar strategy to estimate the effect
of teacher subject knowledge for Peruvian sixth graders with the same teacher in mathematics
and Spanish.
The literature finds that better educated parents spend more time helping their children
with homework than less educated parents (Guryan et al., 2008; Rønning, 2011). In addition to
estimating average effects, we investigate whether the effect of homework depends on the home
environment. We also take a closer look at the US to allow for a more thorough comparison with
the existing literature, and compare country specific estimates to characteristics of the national
school organization.
The next section reviews the literature. Section 3 describes the data, Section 4 discusses
the empirical approach, while the results are presented in Section 5. We find a positive and
significant effect of homework on average, but the effect varies greatly across countries. Section
6 discusses the cross-country variation in the homework effect. Section 7 concludes.
4

2 Review of the literature on homework
The majority of the homework literature is from other disciplines than economics. Cooper (1989)
reviews nearly 120 US educational studies of the effect of homework on student achievement.
Studies comparing the achievement of students with and without homework tend to find no
association in primary education and a positive association in high school. In a follow-up paper,
Cooper et al. (2006) review more recent US studies and reach similar conclusions. In addition,
they argue that the link between homework and student achievement does not differ across
subjects. Even though some studies have investigated the effect of exogenous introduction
of homework, Cooper et al. argue that all studies in their review suffer from non-random
assignments.
Few analyses of homework using non-US data exist. Two exceptions from the education dis-
cipline are Trautwein (2007) and Dettmers et al. (2009) who use data from secondary education.
Trautwein (2007) use different datasets for Germany and find that homework frequency is more
important than the time students use on mathematics homework in a cross-section framework.
Dettmers et al. (2009) use an international comparable achievement test (PISA 2003), and find
in most countries a positive association between achievement in mathematics and average home-
work time at the class level as reported by the students. In a cross-section framework, however,
student reported time on homework is vulnerably to a spurious relationship with achievement
since the reported time used may be related to unobserved variation in student ability and mo-
tivation. In addition, such analyses may be biased due to unobserved characteristics of students
and teachers.
Endogeneity issues have been addressed in the economic literature in different ways. First,
the value-added approach assumes that lagged test score captures all endowments at the indi-
vidual level. Betts (1996) extends the traditional value-added education production function
with hours of homework as reported by teachers in seventh to eleventh grade. He finds a sizable
positive effect of homework. Recent studies use data from the US survey National Educational
Longitudinal Study of 1988 (NELS) which includes 8 graders in the base year, with follow-ups
in 1990 and 1992. In a value-added model, Eren and Henderson (2008) find that homework
assigned by teachers is most effective for high and low achievers. As Todd and Wolpin (2003)
5

point out, however, value-added models are also highly susceptible to endogeneity bias when
data on some relevant inputs are missing.
Aksoy and Link (2000) use the student fixed effects approach on the NELS data to estimate
the effect of the time the students report doing homework, and find strong positive effects.
McMullen and Busscher (2009) study younger students, and is thus more comparable to our
study. They use data for students in first to fifth grade from the US survey Early Childhood
Longitudinal Study and find no relationship between homework and achievement in the cross
section. However, in models with student fixed effects, both the time teachers expect their
students to spend on homework and the number of times per week the parents report their
children worked on homework have positive effects on mathematics and reading achievement.
In a recent paper, Eren and Henderson (2011) argue that it is possible to include both student
fixed effects and teacher fixed effects in analyses on the eight grade students in the NELS data,
which must imply that at least some students have the same teacher in their two test subjects.
The students are tested in one subject in natural sciences (mathematics or science) and one
subject in humanities (English or history). While their approach is similar to ours, we exploit
variation between more comparable subjects in a grade where it is more common to have the
same teacher in several subjects. Eren and Henderson find that the effect of assigned homework,
given student fixed effects, is extremely sensitive to the inclusion of teacher fixed effects, and
that the results are driven by a large homework effect in mathematics.
The small literature in economics which most credible addresses the causal effect of homework
is concentrated on students at the university level. Grodner and Rupp (2011) present evidence
from a field experiment in which a treatment group of students was required to do homework.
They find that the treatment group got significantly better learning outcomes. The novelty
of Grodner and Rupp’s paper is that they are able to separate between the effect of being
assigned homework and the effect of completing homework. By exploiting natural experiments
which randomly assign students into different study groups, both Grove and Wasserman (2006)
and Emerson and Mencken (2011) find that students who are exposed to graded homework (as
opposed to non-graded homework) increase their achievement.
There are some attempts to estimate heterogeneous effects of homework in the literature.
Both Rønning (2011) and Eren and Henderson (2011) find that only students with college
6

educated parents benefit from homework. Rønning (2011) also shows that higher educated
parents help more with homework than lower educated parents, and suggests that assigning
homework can amplify existing inequalities through complementarities with home inputs.
Assigning homework can be interpreted as an attempt to increase student effort. The few
explicit analyzes of student effort that exist is therefore relevant for the interpretation of the
findings in the homework literature, see for example Krohn and O’Connor (2005). However,
the results in this literature for K-12 education is mixed and suffer from the same methodolog-
ical problems as the homework literature. The few studies that exists with an experimental
framework seem to be on college students. Stinebrickner and Stinebrickner (2008) exploit that
assignment of roommates at Berea College is random, and use whether the roommate has a
video game as an instrument for study effort. They find that the return to effort is large.
Since homework assignment is decided by the teachers, this paper is also related to the
literature on effective teaching practices. Using NELS, Goldhaber and Brewer (1997) find several
variables describing teacher behavior in the classroom to influence student achievement. Machin
and McNally (2008) study a highly structured literacy hour that was introduced in English
primary schools in the 1990s, and find that the change in teaching method significantly increased
literacy skills. Schwerdt and Wuppermann (2009) exploit between-subject variation in lecturing
style at eighth grade. They find that traditional lecture type teaching yields higher student
achievement than in-class teaching time used for problem solving.
3 Data
TIMSS (Trends in International Mathematics and Science Study) is an international compa-
rable student test in mathematics and science conducted by the International Association for
the Evaluation of Educational Achievement (IEA). The 2007 database includes information on
homework for students enrolled in the two adjacent grades that contain the largest proportion of
nine year olds (third/fourth graders in most countries) and students enrolled in the two adjacent
grades that contain the largest proportion of 13 year olds (7th/8th graders in most countries).
The variables in the data, except the test scores, are based on surveys of students, teachers, and
schools. Parents did not participate in the TIMSS survey.
7

We focus on the nine year olds since there is little variation in homework assignment for the
13 year olds in TIMSS. We also restrict the sample to the OECD countries, which are listed in
Table 1.
In the empirical analysis we drop students with missing information on homework (approx-
imately 30 percent of the sample). Since our empirical strategy is to condition on both student
and teacher fixed effects, only students with the same teacher in both mathematics and science
will contribute to the identification. Thus, we drop students who are registered with more than
one teacher.1 This amounts to only four percent of the students, but vary across the countries.2
Homework
The teachers participating in TIMSS are asked how often they assign homework. The categories
in the survey are “Every or almost every lesson”, “About half the lessons”, “Some lessons”, and
“Homework not given”.
Summary statistics are provided in Table 1 and show that homework is more extensive in
mathematics than in science. In all countries, almost all students get at least some homework
in mathematics. The only exception is the Netherlands where a majority of the students (63.6
percent) never get homework. At the other extreme, in Germany and Hungary more than
90 percent of the students get homework in mathematics in every or almost every lesson. In
Australia, New Zealand, Sweden, England and Scotland, assigning homework in some lessons
seem to be most common. There is less cross-country variation in homework in science. Apart
from Hungary and Italy, a majority of the students either get homework in some lessons or no
lessons.1This procedure excludes students with different teachers in the two subjects and students who are taught
by more than one teacher in one of the subjects. Such students will not contribute to the homework estimatesin our approach since we focus on the difference in achievement between math and science as discussed closer inSection 4 below.
2The number of students excluded from the analysis by this procedure is highest for the Unites States (55percent), while no students are dropped in Italy. To make the comparability across the subjects as clean aspossible, we also drop observations where the teacher report different class size in math and science. Thisamounts to additional 2.3 percent of the sample, with the larges share in Scotland (7.3 percent), whereas nostudents are dropped in the Netherlands and Norway. The empirical results are, however, not sensitive to thislatter reduction of the sample.
8

Table 1: Percent of students who get homework in mathematics and science.Country Every or almost About half Some lessons Homework not Observations
every lesson the lessons givenMathematics
All countries 43.3 19.2 30.4 7.0 48670Australia 16.8 17.9 51.9 13.3 3100Austria 83.0 14.8 2.2 0.0 2123Czech Republic 21.1 57.2 21.7 0.0 3167Denmark 64.4 30.8 4.8 0.0 1793Germany 92.4 6.5 1.1 0.0 2644Hungary 93.0 3.5 2.0 1.6 3572Italy 57.1 17.3 23.4 2.1 4470Japan 60.4 22.3 15.8 1.5 3297Netherlands 0.5 2.5 33.4 63.6 2878New Zealand 14.1 9.5 58.2 18.2 3170Norway 39.8 39.8 20.2 0.2 3333Slovak Republic 64.4 23.1 11.7 0.7 3102Sweden 4.1 13.2 80.5 2.2 2489United States 75.2 9.9 10.8 4.1 3345England 1.7 13.9 80.9 3.4 3547Scotland 8.2 28.3 62.1 1.3 2640
ScienceAll countries 11.8 9.4 45.1 33.8 48670Australia 0.0 0.1 34.4 65.5 3100Austria 0.6 6.1 93.3 0.0 2123Czech Republic 2.4 11.7 74.5 11.4 3167Denmark 0.0 7.5 26.7 65.8 1793Germany 6.8 30.1 53.1 10.1 2644Hungary 62.1 24.6 12.2 1.0 3572Italy 50.9 13.9 24.8 10.4 4470Japan 0.0 1.1 65.5 33.4 3297Netherlands 2.0 3.9 27.0 67.1 2878New Zealand 0.7 1.2 36.8 61.4 3170Norway 2.12 7.3 44.0 46.6 3333Slovak Republic 14.8 14.4 57.5 13.3 3102Sweden 0.8 0.0 52.2 47.0 2489United States 9.5 15.9 38.2 36.4 3345England 0.8 4.5 52.1 42.6 3547Scotland 0.0 2.1 50.4 47.5 2640
Note: Data source is the teacher data file in TIMSS 2007, regression sample.
9

Student achievement
TIMSS 2007 summarizes student achievement by using Item Response Theory (IRT). The IRT
scaling approach calculates “plausible values” based on a multiple imputation methodology to
obtain proficiency scores for all the students who participated in the tests. Since the plausible
values are predictions based on limited information, and therefore are contaminated by some
errors, TIMSS provides five separate plausible values.3 In this paper we use the average of all
the plausible values as our measure of student achievement. Regressing homework on each of
the five plausible values separately, and then calculating the average of the coefficients (with
bootstrapped standard errors), gives similar results.
Table 2 presents a descriptive overview of the test scores, separately for country and subject.
The test scores in TIMSS have an international mean of 500 and a standard deviation of 100.
Since we exclude non-OECD countries from the analysis, average achievement in our sample
is slightly larger than the international mean, and the standard deviation is about 75 in both
subjects.
Japan has the highest test score in both mathematics (572) and science (551), whereas
Norway has the lowest score in both mathematics (477) and science (480). Both the Netherlands
and Hungary, in which the students get the least and the most homework, respectively, perform
relatively well. In most countries, the test score is higher in science than in mathematics,
reflecting that the opposite is the case in non-OECD countries. The difference is largest for
Slovak Republic, Czech Republic, and Italy.
Student and teacher characteristics
Since parents did not participate in the data collection, information on parental education and
income is lacking in the TIMSS database. The indicators for socioeconomic status that we
include in the analysis are therefore “the number of books at home” and “how often the test
language is spoken at home”, as reported by the students. As highlighted by among others
Ammermueller and Pischke (2009), the number of books at home is highly correlated with
parental education and income. In addition, our empirical model includes gender and birth
year.3The correlation coefficients between the plausible values in our regression sample are in the range 0.85-0.88.
10
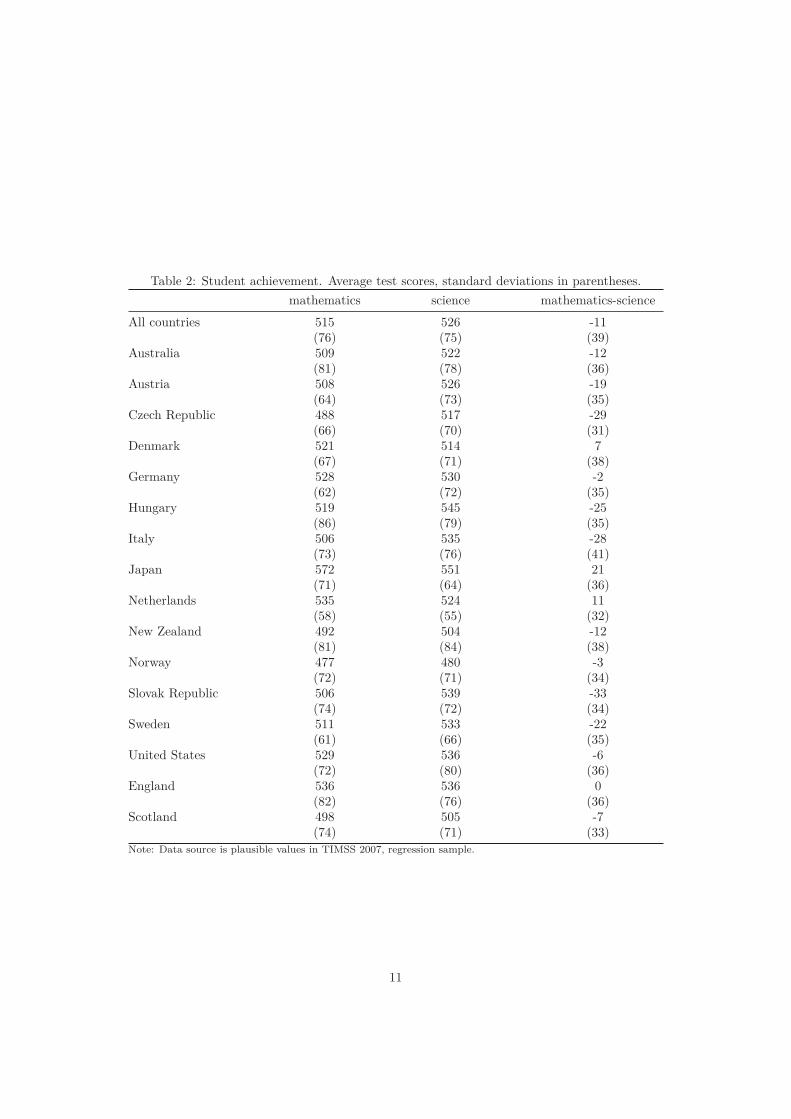
Table 2: Student achievement. Average test scores, standard deviations in parentheses.mathematics science mathematics-science
All countries 515 526 -11(76) (75) (39)
Australia 509 522 -12(81) (78) (36)
Austria 508 526 -19(64) (73) (35)
Czech Republic 488 517 -29(66) (70) (31)
Denmark 521 514 7(67) (71) (38)
Germany 528 530 -2(62) (72) (35)
Hungary 519 545 -25(86) (79) (35)
Italy 506 535 -28(73) (76) (41)
Japan 572 551 21(71) (64) (36)
Netherlands 535 524 11(58) (55) (32)
New Zealand 492 504 -12(81) (84) (38)
Norway 477 480 -3(72) (71) (34)
Slovak Republic 506 539 -33(74) (72) (34)
Sweden 511 533 -22(61) (66) (35)
United States 529 536 -6(72) (80) (36)
England 536 536 0(82) (76) (36)
Scotland 498 505 -7(74) (71) (33)
Note: Data source is plausible values in TIMSS 2007, regression sample.
11

From the teacher questionnaire we have information on teacher’s gender, age, and education,
as well as an indicator for class size. Summary statistics are given in Appendix Table A1. The
table shows that the mean values of the variables are very similar in our regression sample
(column (1)) as in the whole sample of students in TIMSS (column (2)). The main exception
is that missing values for teachers are less common in our regression sample than in the whole
sample.
4 Empirical approach
This section presents our identification strategy. The following education production function
is a useful starting point:
yinjc = Xijcβx + Zjcβz + βAhwanjc + βHhwhnjc + βShwsnjc + βCn Cc + λi + ηj + εinjc (1)
The dependent variable, yinjc, is the achievement of student i in subject n (n = 1, 2, where
1 = mathematics and 2 = science) with teacher j in country c. Since the teacher defines
the class in the TIMSS dataset, subscript j denotes both teacher and class. Xijc is a vector
of observed student characteristics, Zjc is a vector of observed characteristics of the teacher
and the class, hwanjc, hwhnjc, and hwsnjc are dummy variables taking the value one if the
teacher assigns homework in all lessons, half of the lessons, and in some lessons, respectively
(homework not given is the reference category). λi represents student fixed effect (which takes
into account every characteristic of the students that are related to their average performance),
ηj represents teacher fixed effect (which absorbs any effects of unobserved teacher quality and
class environment that is common for the two subjects), Cc is a vector of dummy variables for
each country which are assumed to have different impact across subjects, and εinjc is a random
error term.
Estimating models with student fixed effects is a common approach in the literature.4 How-
ever, a drawback of these models is that the variation might still be affected by selection and4Dee’s (2005, 2006) seminal papers use the NELS data to identify the effect of teacher characteristics by
exploiting within-student variations across two subjects. Thus, only students with different teachers contributeto the identification. Other papers with this identification strategy includes Clotfelter et al. (2010) on teachercredentials and Lavy (2012) on instruction time.
12

unobserved teacher (or class) characteristics. Equation (1) takes all teacher and class charac-
teristics into account by also including teacher fixed effects.
Since the students have the same teacher in both mathematics and science, differencing the
model by subtracting yi2 from yi1 effectively condition on both student and teacher fixed effects,
and arguable yields causal estimates. A similar strategy is applied by Metzler and Woessmann
(2012) when estimating the effect of teacher subject knowledge on a sample of Peruvian sixth
graders with the same teacher in mathematics and Spanish.
yi1jc − yi2jc = Δyijc = βA�hwajc + βH�hwhjc + βS�hwsjc + βCCc + �εijc (2)
Our identification assumes that homework assignment is random, conditional on the elements
in Equation (1). That is, the difference in assigned homework between mathematics and science
included in Equation (2) is unrelated to student and teacher/class characteristics. An indication
for the validity of this assumption is the size and significance of the correlations between the
difference in the amount of homework across subjects and the observed characteristics.
Table 3 provides evidence on these correlations by relating the difference in the indicators
for homework (Δhwa, Δhwh, Δhws) to the observed student and teacher/class characteristics.
For student characteristics, the null hypothesis of no joint significance cannot be rejected at
10 percent level for any of the indicators. The same is true for teacher characteristics, except
for homework in every or almost every lesson for which the null of no relationship is rejected
at 5 percent level (p-value is equal to 0.045). Notice, however, that there is no systematic
relationship between homework assignment and individual teacher characteristics. For instance,
teachers with short tertiary education assign homework more often in science than in math
compared to both teachers with more and less education. For student characteristics, year
of birth and language at home are individually significantly related to homework assignment.
Overall, however, the evidence in Table 3 suggests that relative assignment of homework is
reasonable random with respect to observable student and teacher characteristics.
Another way to consider potential omitted variable bias is to condition on the observables
Xijc and Zjc in Equation (2). If the estimated effect of homework is sensitive to this change
in model specification, one would be concerned that the estimate is not causal (Altonji et al.,
13

Tabl
e3:
The
rela
tion
betw
een
rela
tive
hom
ewor
kas
signm
ent
and
obse
rved
stud
ent
and
teac
her/
clas
sch
arac
teris
tics
Ever
yor
alm
ost
Abo
utha
lfSo
me
less
ons
ever
yle
sson
(Δh
va)
ofth
ele
sson
s(Δ
hw
h)
(Δh
ws)
Stud
ent
char
acte
rist
ics
Num
ber
ofbo
oks
atho
me
(one
book
case
=re
f)-
No
orve
ryfe
wbo
oks
0.00
1(0
.010
)0.
015
(0.0
10)
-0.0
04(0
.013
)-
One
book
shel
f0.
003
(0.0
06)
-0.0
01(0
.007
)-0
.002
(0.0
08)
-T
wobo
okca
ses
-0.0
09(0
.007
)-0
.010
(0.0
07)
0.00
1(0
.009
)-
Thr
eeor
mor
ebo
okca
ses
-0.0
10(0
.008
)0.
011
(0.0
09)
-0.0
03(0
.012
)-
Mis
sing
info
rmat
ion
-0.0
03(0
.019
)-0
.003
(0.0
20)
-0.0
01(0
.025
)H
owof
ten
test
lang
uage
issp
oken
atho
me
(alw
ays
oral
mos
tal
way
s=re
f)-
Som
etim
esor
neve
r0.
028
(0.0
13)*
*-0
.020
(0.0
14)
0.01
4(0
.018
)-
Mis
sing
info
rmat
ion
0.02
2(0
.037
)0.
017
(0.0
35)
-0.0
33(0
.044
)B
irth
year
(199
6=re
f)-
<=
1995
-0.0
15(0
.018
)-0
.003
(0.0
19)
-0.0
02(0
.018
)-
1997
0.01
4(0
.006
)**
-0.0
01(0
.007
)0.
005
(0.0
10)
->
=19
980.
085
(0.0
36)*
*-0
.037
(0.0
28)
-0.0
53(0
.036
)-
Mis
sing
info
rmat
ion
-0.2
07(0
.175
)-0
.059
(0.0
50)
0.18
8(0
.173
)G
ende
r-
Boy
-0.0
03(0
.004
)-0
.005
(0.0
04)
0.00
1(0
.006
)-
Mis
sing
info
rmat
ion
-0.0
03(0
.047
)-0
.000
(0.0
69)
0.02
5(0
.062
)te
ache
r/cl
ass
char
acte
rist
ics
Gen
der
-Fe
mal
e-0
.002
(0.0
23)
0.00
3(0
.025
)-0
.020
(0.0
34)
-M
issi
ngin
form
atio
n0.
114
(0.2
40)
-0.4
83(0
.294
)0.
527
(0.1
78)*
**A
ge(2
5-29
=re
f)-
30-3
90.
010
(0.0
27)
-0.0
57(0
.031
)*0.
038
(0.0
39)
-40
-49
-0.0
21(0
.027
)-0
.008
(0.0
31)
0.01
9(0
.038
)-
50-5
9-0
.035
(0.0
28)
-0.0
35(0
.030
)0.
056
(0.0
38)
-60
orol
der
0.07
8(0
.048
)-0
.048
(0.0
52)
-0.0
49(0
.067
)-
Mis
sing
info
rmat
ion
-0.1
91(0
.128
)0.
053
(0.1
88)
-0.2
19(0
.141
)Ed
ucat
ion
(Ter
tiary
educ
atio
n,m
ediu
m=
ref)
-U
pper
seco
ndar
yed
ucat
ion
orle
ss0.
042
(0.0
55)
-0.0
18(0
.051
)-0
.020
(0.0
57)
-Te
rtia
ryed
ucat
ion,
shor
t-0
.054
(0.0
30)*
0.01
3(0
.035
)0.
010
(0.0
48)
-Te
rtia
ryed
ucat
ion,
long
-0.0
11(0
.024
)0.
033
(0.0
30)
-0.0
39(0
.043
)-
Mis
sing
info
rmat
ion
0.04
8(0
.054
)0.
040
(0.0
83)
-0.1
16(0
.114
)C
lass
size
(<=
19pu
pils=
ref)
->
=20
pupi
ls0.
021
(0.0
21)
-0.0
00(0
.023
)-0
.019
(0.0
25)
-M
issi
ngin
form
atio
n-0
.059
(0.0
42)
0.03
0(0
.056
)-0
.010
(0.0
72)
Test
sof
join
tsig
nific
ance
,p-v
alue
sSt
uden
tch
arac
teris
tics
0.14
420.
2237
0.95
28Te
ache
rch
arac
teris
tics
0.04
570.
6164
0.18
74N
ote:
4867
0ob
serv
atio
ns.
Stan
dard
erro
rsar
ecl
uste
red
atth
ete
ache
rle
vel.
*/**
/***
deno
tes
stat
istic
alsig
nific
ance
atth
e10
/5/1
perc
ent
leve
l.
14

2005). However, the evidence that the difference in homework assignment is uncorrelated with
the observable characteristics is a first indication that the estimate of homework can be given a
causal interpretation.
Since homework is assigned by the teachers, a concern is that homework assignment might
be related to unobserved teacher quality. Poor teachers may assign homework to compensate
for lack of learning in class, which would give underestimated estimates of the causal effect
of homework in models without teacher quality included. It is also possible that high-skilled
teachers use homework to achieve ambitious goals, which would give the opposite bias.
Teacher quality is hard to measure and might be weakly related to observable characteris-
tics. In order to shed some light on this issue we construct two measures of relative teaching
quality based on the teacher survey in TIMSS. First, teachers report how competent they feel in
different parts of the curricula in each subject. Second, they report on post-education training
in each subject.5 We relate the differences in competence and training across the subjects to
the difference in homework assignment across the subjects. The correlations are clearly insignif-
icant.6 We have also included the relative competence and relative training in the regression
models in Table 3, but again the relationships are clearly insignificant.7
Another necessary assumption for the within-subject identification strategy is that the ef-
fect of interest is the same for both subjects, that is, the β′s cannot vary across the subjects.
Although this is a plausible assumption, and in accordance with the education literature on
homework, it is interesting to investigate the validity of this assumption. Metzler and Woess-
mann (2012) follow Chamberlain (1982) and assumes that the fixed effects are determined by
the observables in the model. In this case one can estimate subject specific equations and test
for equality of coefficients across the subjects. We provide results using this approach.5The question on competence includes 20 topics in math and 22 topics in science, and for each topic there
are four alternative answers; ’not applicable’, ’highly qualified’ ’somewhat qualified’ and ’not qualified’. We codethe answers with ’missing, ’3’, ’2’, and ’1’, respectively, and summarize separately for mathematics and science.Two percent of the teachers have missing value in at least one subject. The question on post-education trainingincludes 6 subquestions related to the content of the course(s) for which the teacher can answer ’yes’ or ’no’. Wesummarize the ’yes’-answers separately for mathematics and science. There are no missing observations.
6The significance of the correlations are calculated based on models including both our measure of relativecompetence and relative training in addition to county fixed effects, clustering errors at the teacher level. Thep-values of joint significance for competence and training are 0.71, 0.66, and 0.76 for homework in all lessons,half of the lessons, and in some lessons, respectively.
7The p-values of joint significance for competence and training in these models are 0.80, 0.72, and 0.78 forhomework in all lessons, half of the lessons, and in some lessons, respectively.
15

5 Results
This section starts out by discussing OLS results and compare them with the results from our
preferred model specification. Finally we present some heterogeneity analyzes.
5.1 OLS
Results for models without fixed effects, pooling all countries, are presented in Table 4. The
point estimates for the homework variables are positive and similar for both mathematics (col-
umn 1) and science (column 2), but only statistically significant for science at conventional
levels. Students who get homework in all lessons have on average 5-6 test score points higher
performance than students who never get homework (7-8 percent of a standard deviation in
student achievement). The third column in Table 4 stacks the data and presents average effects
across the two subjects. Student achievement is highest in classes with homework in half of the
lessons and lowest in classes which never have homework. Stronger effect of the dummy variable
for homework in half of the lessons than on the dummy variable for homework in all lessons
indicates that these estimates cannot be given a causal interpretation.
Regarding student characteristics, the results are as expected and in line with the literature.
The indicators for the number of books at home are particularly strong predictors of student
achievement. Regarding teacher characteristics, student achievement is highest for teachers 40-
59 years of age, while teacher gender and teacher education has little impact. The model also
includes an indicator for class size. Student achievement is better in large classes than in small
classes.
Interestingly, the effects of all control variables are very similar for the two subjects. This in-
dicates that assuming similar responses, as implicitly done in the approach below, is a reasonable
assumption. The variable with clearly different effects is the indicator for test-language spoken
only sometimes or never at home. Being a language minority is more detrimental for achieve-
ment in science than in mathematics. In addition, boys and young students are performing
relatively better in mathematics than in science.
The last column in Table 4 replaces the observable teacher characteristics with teacher fixed
effects. The results indicate that assigning more homework in mathematics than in science
16

Tabl
e4:
The
rela
tion
betw
een
stud
ent
achi
evem
ent
and
hom
ewor
kas
signm
ent
Mat
hem
atic
sSc
ienc
eM
athe
mat
ics
and
scie
nce
(1)
(2)
(3)
(4)
hom
ewor
k(n
ole
sson
s=re
f)-
Eve
ryor
alm
ost
ever
yle
sson
5.0
(4.0
)6.
4(3
.0)*
*7.
8(2
.3)*
**3.
0(0
.8)*
**-
Abo
utha
lfof
the
less
ons
5.4
(3.9
)10
.2(2
.6)*
**9.
1(2
.1)*
**2.
0(0
.7)*
**-
Som
ele
sson
s0.
7(3
.5)
6.0
(1.4
)***
5.0
(1.4
)***
1.2
(0.5
)**
Mat
hem
atic
s-1
6.2
(1.3
)***
-13.
5(1
.0)*
**st
uden
tch
arac
teri
stic
sN
oof
book
sat
hom
e(o
nebo
okca
se=
ref)
-N
oor
very
few
book
s-5
6.4
(1.4
)***
-57.
2(1
.4)*
**-5
6.8
(1.3
)***
-42.
5(1
.1)*
**-
One
book
shel
f-2
4.7
(0.9
)***
-24.
5(0
.8)*
**-2
4.6
(0.8
)***
-17.
6(0
.7)*
**-
Two
book
case
s17
.5(0
.9)*
**18
.0(0
.9)*
**17
.8(0
.9)*
**14
.3(0
.8)*
**-
Thr
eeor
mor
ebo
okca
ses
17.6
(1.2
)***
23.2
(1.1
)***
20.4
(1.1
)***
15.1
(0.9
)***
How
ofte
nte
st-la
ngua
geis
spok
enat
hom
e(a
lway
san
dal
mos
tal
way
s=re
f)-
Som
etim
esor
neve
r-2
8.0
(1.8
)***
-44.
1(1
.8)*
**-3
6.0
(1.7
)***
-28.
2(1
.3)*
**B
irth
year
(199
6=re
f)-
<=
1995
-47.
7(2
.6)*
**-4
2.7
(2.7
)***
-45.
2(2
.6)*
**-3
8.2
(2.0
)***
-19
97-3
.7(0
.9)*
**-5
.0(0
.9)*
**-4
.4(0
.8)*
**-1
.5(0
.7)*
*-
>=
1998
-13.
0(3
.3)*
**-1
9.6
(3.3
)***
-16.
3(3
.2)*
**-5
.0(2
.5)*
*B
oy9.
9(0
.7)*
**7.
6(0
.7)*
**8.
7(0
.6)*
**8.
8(0
.6)*
**te
ache
r/cl
ass
char
acte
rist
ics
Fem
ale
2.3
(1.7
)2.
2(1
.6)
2.3
(1.6
)-
Age
(25-
29=
ref)
-30
-39
2.5
(2.2
)1.
6(2
.1)
2.0
(2.1
)-
-40
-49
6.2
(2.1
)***
5.6
(2.0
)***
5.9
(2.1
)***
--
50-5
97.
7(2
.2)*
**7.
1(2
.1)*
**7.
4(2
.1)*
**-
-60
orol
der
3.8
(4.2
)1.
9(4
.0)
3.0
(4.0
)-
Educ
atio
n(T
ertia
ryed
ucat
ion,
med
ium
=re
f)-
Upp
erse
cond
ary
educ
atio
nor
less
-5.9
(3.3
)*-6
.8(3
.1)*
*-6
.3(3
.1)*
*-
-Te
rtia
ryed
ucat
ion,
shor
t-2
.7(2
.7)
-2.1
(2.8
)-2
.4(2
.7)
--
Tert
iary
educ
atio
n,lo
ng-2
.0(2
.3)
-2.7
(2.2
)-2
.3(2
.2)
-C
lass
size
(<=
19pu
pils
=re
f)->
=20
pupi
ls5.
3(1
.7)*
**4.
4(1
.6)*
**4.
9(1
.6)*
**-
Teac
her
fixed
effec
tsN
oN
oN
oYe
sR
-squ
ared
0.22
00.
216
0.22
10.
4156
Obs
erva
tions
4867
048
670
9734
097
340
Not
e:T
hem
odel
sin
colu
mn
(1)-
(3)
are
estim
ated
byor
dina
ryle
ast
squa
re.
The
mod
elin
colu
mn
(4)
ises
timat
edby
teac
her
fixed
effec
ts.
Inad
ditio
nto
repo
rted
varia
bles
,all
mod
elsp
ecifi
catio
nsin
clud
esu
bjec
ttim
esco
untr
ysp
ecifi
ceff
ects
and
dum
my
varia
bles
form
issin
gin
form
atio
n.St
anda
rder
rors
are
clus
tere
dat
the
teac
her
leve
l.*/
**/*
**de
note
sst
atist
ical
signi
fican
ceat
the
10/5
/1pe
rcen
tle
vel.
17

increases the achievement in mathematics relative to science. Homework in all lessons increases
student test scores by 3.0, that is about 4.4 percent of a standard deviation. This effect is
larger in relative terms since the standard deviation in student achievement in mathematics
relative to science is only about 39 score points. The effect of assigning homework in half of
the lessons and in some lessons are smaller as expected, but statistically significant at 1 percent
level. The effect size of homework in half of the lessons and in some lessons are 65 percent
and 40 percent of the effect of homework in all lessons, respectively.8 Thus, the relative effects
of the homework indicators seem reasonable in contrast to the OLS results in columns (1)-(3).
The point estimates are smaller than the OLS results, which indicates than the OLS results are
biased upwards by omitted characteristics of the teachers.
5.2 The difference-in-differences approach
Student characteristics have strong effect on student achievement. The question is whether there
are unobserved student characteristics that is important for achievement and correlated with
homework assignment. In this paper the identification strategy is to eliminate both the unob-
served student and unobserved teacher characteristics. To the extent that these characteristics
have the same effects on mathematics and science, they are differenced out of the model. The
results are reported in Table 5.
The estimated effect of homework in column (1), which is the model in Equation (2) above,
is identical to the model in column (4) in Table 4. Conditional on teacher fixed effects, the
estimated effect of homework is unrelated to the handling of student characteristics.9
If the approach differences out all relevant factors at the student and teacher level, the
estimated effect of homework should not be sensitive to the inclusion of such variables. In
column (2) we allow student and teacher characteristics to have different effects on achievement
in mathematics and science, i.e., we add these characteristics to the model in Equation (2). With
this change in model formulation, the estimated effect of homework changes only marginally. The8The effect of homework in all lessons is significantly larger than both the effect of homework in half of the
lessons and in some lessons at 10 percent level. The p-values are 0.086 and 0.004, respectively. The effect ofhomework in half of the lessons is not significantly different from the effect of homework in some lessons at 10percent level (the p-value is 0.138).
9With the data structure in our sample, it is not possible to include student fixed effects without at the sametime implicitly including teacher fixed effects. Since all students have the same teacher in both subjects, thestudent fixed effects fully absorb the teacher fixed effects.
18

Table 5: The effect of assigned homework on student achievement(1) (2) (3) (4)
Homework in every or almost every lesson 3.0 2.6 - -(0.8)*** (0.7)***
Homework in about half of the lessons 2.0 1.9 - -(0.7)*** (0.7)***
Homework in some lessons 1.2 1.1 - -(0.5)** (0.5)**
Cardinal measure of homework - - 2.7 2.4(0.8)*** (0.7)***
Teacher fixed effects Yes Yes Yes YesStudent fixed effects Yes Yes Yes YesStudent characteristics No Yes No YesTeacher characteristics No Yes No YesCountry fixed effects Yes Yes Yes Yes
Tests of joint significance, p-value- Teacher characteristics - 0.276 - 0.290- Student characteristics - <0.001 - <0.001- Country fixed effects <0.001 <0.001 <0.001 <0.001
R-squared within student 0.156 0.171 0.155 0.171Observations 48670 48670 48670 48670Note: Standard errors are t clustered at the teacher level. */**/*** denotes statistically signif-icance at the 10/5/1 percent level.
19

effect of homework in all lessons compared to never homework declines from 3.0 to 2.6, that is 50
percent of the standard error in column (1), while the effects of the other homework indicators
hardly change at all. The decline is solely due to the inclusion of student characteristics. A
model only including teacher characteristics does not change the effect of homework. The lower
part of Table 5 presents results for F-tests of joint significance of the control variables. The null
hypothesis of no joint effect of teacher/class characteristics can clearly not be rejected.10
The results suggest that the effect of homework is close to linear. At the outset “yes-or-no”
answers on surveys are ordinal since there is no explicit scaling. However, in our case, it is fair to
assume that “Homework in half of the lessons” involves half as much homework as “Homework in
every or almost every lesson”. Regarding “Homework in some lessons”, it is clearly less than half
of the lessons and more than no lessons, and obviously assumed to be significantly different from
those alternatives. In order to perform heterogeneity analyzes that are easily interpretable, we
create a cardinal measure which takes the value unity when homework is assigned in all lessons,
0.5 if homework is assigned in half of the lessons, 0.25 if homework is assigned in some lessons,
and 0 if homework is not given.
The final part of Table 5 (columns (3) - (5)) presents results using this cardinal measure of
homework. This model formulation is a testable simplification of Equation (2). For all model
specifications in Table 5, the restrictions are not rejected at 10 percent level.11 The results imply
that assigning homework in all lessons compared to no lessons increases student achievement by
about 2.5 test score points.
As already mentioned, our identification strategy assumes that the effect of homework is
identical in mathematics and science. In essence, we are estimating the average effect of home-
work in these two subjects. The assumption can be tested by assuming that the fixed effects in
Equation (1), λi and ηj , are projections of the observable variables, see Chamberlain (1982) and,
e.g., Card (1999) and Metzler and Woessmann (2012). Since our results are highly sensitive to
the inclusion of teacher fixed effects, the validity of such an assumption can be questioned in our
case. The results of the test, however, indicates that the effect of homework is not statistically10We have also estimated models including the difference of the measures of teacher self-reported competence
and training as presented in Section 3. The effect of competence is positive and statistically significantly related tostudent achievement at the one percent level.The effect of training is also positive, but statistically insignificant.More importantly, the estimated effect of homework does not change when including these two variables.
11The p-values on whether the models in columns (3) and (4) are allowable simplifications of the related modelsin column (1) and (2) are 0.42 and 0.34, respectively.
20

different in mathematics and science at five percent level.12
5.3 Heterogeneous effects
Results from country-specific models are reported in Table 6. In the first two columns we
present results using the full sample, whereas we in the remaining columns, (3) - (9) look
at different sub-samples. The table only uses the cardinal measure of homework in order to
simplify the comparison across countries. The first column presents results for our preferred
model specification, the same model specification as in column (3) in Table 5. The effect of
homework is positive in 12 of the 16 countries, and the effect is significant at five percent level
in Australia, Austria, and the US. In the latter countries, the effect of homework is about 12-14
test score points, that is 14-21 percent of a standard deviation in these countries. For most
other countries, the estimated effect is close to the average effect in Table 5. Sweden turns up
as an outlier with a negative effect that is significant at five percent level.
The model in column (2) in Table 6 includes student and teacher characteristics in the spec-
ification. This change in specification leaves the estimated effect of homework almost unaltered
in all countries. The largest change is for the US, for which the estimate of homework in all
versus none lessons is reduced from 14.2 to 11.4 score points (1.0 standard errors). This finding
indicates that omitted variable bias is not a major concern in any country.
In column (3) - (9) we investigate whether the effect of assigning homework differs across
different groups of students. We split the sample with respect to the number of books at home
("less than 1 bookcase", "1 or 2 bookcases", and "3 or more bookcases"), language most commonly
spoken at home, and gender.
For all countries (first row), the point estimate for the sample of students with few books at12The model for the fixed effects includes all observable variables, including homework in both subjects, and
can be projected back into the two equations for student achievement in mathematics and science. Then the twoequations of interest include homework in both subjects and is a so-called correlated random effects model whichcan be estimated by seemingly unrelated regressions. Our working assumption is that the effect homework isequal across the two subjects, which imply that there are two restrictions on the correlated random effects modelthat cannot be rejected. The first restriction is that the effects of homework in the other subject are equal in thetwo equations. We estimate the model with maximum likelihood in order to cluster the standard errors at theteacher level, using the cardinal measure of homework. Since teacher fixed effects are important for the pointestimates of homework in Table 4, we include mean values at the teacher level for all student characteristics inthe model. The results imply that the restriction cannot be rejected at five percent level (p-value is equal to0.397). The second restriction, given that the first holds, is that the effects of homework in the relevant subjectare equal in the two equations. This restriction is neither rejected at five percent level (p-value is equal to 0.060).The point estimates indicates that the effect of homework is 2.2 test score points larger in mathematics than inscience.
21

Tabl
e6:
Hom
ewor
kan
dst
uden
tac
hiev
emen
t.C
ount
rysp
ecifi
ces
timat
esan
dsu
b-sa
mpl
es.
Full
sam
ple
Num
ber
ofbo
oks
atho
me
Test
lang
uage
spok
enat
hom
eG
ende
rLe
ssth
an1
or2
book
-3+
book
-A
lway
s/so
met
imes
/G
irlB
oy1
book
case
case
sca
ses
alm
ost
alw
ays
neve
r(1
)(2
)(3
)(4
)(5
)(6
)(7
)(8
)(9
)A
llco
untr
ies
2.7
2.4
3.9
2.0
2.2
2.4
3.4
4.0
1.6
(0.8
)***
(0.7
)***
(1.0
)***
(1.0
)**
(1.5
)(0
.8)*
**(2
.4)
(0.9
)***
(0.9
)*A
ustr
alia
11.8
10.3
19.8
10.4
6.0
9.0
15.8
16.0
7.6
(3.4
)***
(3.1
)***
(5.4
)***
(4.5
)**
(4.2
)(2
.8)*
**(1
0.0)
(4.4
)***
(3.9
)*A
ustr
ia11
.812
.216
.811
.7-5
.710
.712
.519
.65.
0(5
.1)*
*(4
.4)*
**(7
.2)*
*(6
.2)*
(9.8
)(4
.6)*
*(1
4.2)
(6.9
)***
(5.2
)C
zech
Rep
ublic
2.6
2.9
3.5
2.0
7.5
3.0
-3.7
5.5
0.3
(2.5
)(2
.5)
(4.0
)(3
.2)
(3.3
)**
(2.4
)(1
1.6)
(3.6
)(2
.8)
Den
mar
k5.
05.
5-0
.66.
215
.96.
6-5
.37.
03.
3(4
.6)
(4.7
)(6
.4)
(5.9
)(1
1.6)
(4.5
)(1
2.7)
(5.4
)(5
.2)
Ger
man
y2.
91.
70.
03.
63.
62.
72.
95.
42.
0(3
.4)
(3.1
)(6
.7)
(4.8
)(6
.8)
(3.8
)(1
2.5)
(5.5
)(3
.8)
Hun
gary
-3.9
-2.3
-2.2
-4.1
-3.9
-4.1
10.7
-4.4
-3.3
(3.5
)(2
.8)
(4.5
)(4
.4)
(5.6
)(3
.5)
(14.
2)(4
.1)
(3.9
)It
aly
-1.0
-1.2
0.2
-2.2
-0.3
-0.7
-14.
9-0
.1-1
.8(1
.5)
(1.5
)(2
.0)
(2.0
)(3
.8)
(1.6
)(5
.1)*
**(1
.9)
(2.1
)Ja
pan
3.9
3.5
6.4
1.8
6.0
3.7
17.3
3.2
4.6
(2.2
)*(2
.3)
(2.7
)**
(3.2
)(5
.3)
(2.3
)(2
4.1)
(2.9
)(3
.0)
Net
herla
nds
5.7
5.0
8.4
-1.1
18.1
4.4
16.8
4.1
6.5
(3.6
)(3
.5)
(5.0
)*(3
.8)
(6.5
)***
(4.0
)(1
0.7)
(3.8
)(4
.6)
New
Zeal
and
2.0
1.7
6.9
2.2
-7.1
3.3
-2.9
0.8
3.7
(2.8
)(2
.5)
(3.9
)*(3
.2)
(5.6
)(2
.9)
(5.3
)(3
.2)
(3.8
)N
orw
ay1.
82.
20.
1-1
.012
.71.
77.
94.
9-0
.9(1
.9)
(1.9
)(3
.0)
(2.3
)(5
.1)*
*(1
.9)
(6.6
)(2
.5)*
(2.6
)Sl
ovak
Rep
ublic
-0.5
-0.9
2.0
-3.7
8.2
-0.6
-0.9
1.1
-1.9
(2.4
)(2
.6)
(3.4
)(2
.9)
(4.5
)*(2
.4)
(6.1
)(2
.9)
(2.9
)Sw
eden
-10.
1-9
.0-8
.9-8
.5-1
3.6
-10.
41.
5-1
2.9
-7.7
(4.4
)**
(4.3
)**
(11.
0)(5
.8)
(8.0
)*(4
.3)*
*(1
7.2)
(5.0
)**
(5.6
)U
nite
dSt
ates
14.2
11.4
14.8
15.7
6.2
13.2
12.3
15.5
13.0
(2.8
)***
(2.6
)***
(4.1
)***
(3.1
)***
(5.2
)(2
.7)*
**(5
.2)*
*(3
.4)*
**(3
.3)*
**En
glan
d2.
82.
70.
56.
5-4
.72.
73.
36.
7-0
.9(4
.5)
(4.0
)(5
.9)
(5.8
)(7
.6)
(4.6
)(1
0.6)
(5.3
)(5
.1)
Scot
land
3.6
3.1
0.1
11.0
-13.
64.
0-1
.91.
65.
4(3
.6)
(3.7
)(5
.4)
(4.3
)**
(9.0
)(3
.8)
(11.
4)(4
.4)
(4.5
)
Stud
ent
char
acte
ristic
sN
oYe
sN
oN
oN
oN
oN
oN
oN
oTe
ache
rch
arac
teris
tics
No
Yes
No
No
No
No
No
No
No
Not
e:C
ount
rysp
ecifi
ces
timat
esof
the
card
inal
mea
sure
ofho
mew
ork
usin
gth
em
odel
inEq
uatio
n(2
).St
anda
rder
rors
are
clus
tere
dat
the
teac
her
leve
l.*/
**/*
**de
note
sst
atist
ical
lysig
nific
ance
atth
e10
/5/1
perc
ent
leve
l.
22

home is almost twice the size of the point estimates for the other two book-categories, and the
point estimate is statistically significant at the one percent level. On average across countries,
homework assignment seems to equalize student achievement. When looking separately at each
country, this result basically holds for the countries with a significant positive average effect of
homework (Australia, Austria, Japan and the US).13
It is, however, interesting to note from columns (3) - (5) in Table 6 that while homework
assignment seems to have a progressive effect in some countries, it seems to have a regressive
effect in other countries. In the Czech Republic, the Netherlands, Norway and the Slovak
Republic, the effect of assigning homework is significantly positive for the group of students
with the most books at home, even though the average effect across all students is insignificant
in these countries. This result is in accordance with the findings in Rønning (2011) for the
Netherlands and implies that homework amplifies existing inequalities in student achievement.
When stratifying the data on test-language, the estimates on the sample of non-native stu-
dents are mainly imprecisely determined. However, for the countries with a significantly positive
average effect, the point estimates are relatively close for the two sub-samples. It is a surpris-
ingly large negative effect of assigning homework in Italy on students who only sometimes or
never speak the test language at home. The average negative effect in Sweden is related to the
students who almost or almost always speak the test language at home.
Finally, the effect of homework is on average more than twice as large for girls than for boys.
The largest differences in favor of girls are estimated for Australia, Austria, the Czech Republic,
England, and Norway. For the countries where the estimated effect is largest for boys, the effect
is insignificant for both genders, with the exception of Sweden.
5.4 Separate models for the US
The literature on homework is mainly from the US. To allow for a more thorough comparison
with that literature, Table 7 presents results from different model specifications on the sample
of students in the US.
The OLS results are very different for mathematics and science. Whereas homework seems
to be negatively related to achievement in mathematics (column (1)), the pattern is less clear for13On average in the regression sample, 32.3 percent of the students have less than one bookcase at home (see
Appendix Table A1). This share varies from 20.4 percent in Australia to 44.7 percent in Italy.
23

Table 7: Models for the USOLS Fixed effects
Mathematics Science Mathematicsand science
(1) (2) (3) (4) (5)Homework in every or -16.1 0.8 7.1 17.0 13.3almost every lessons (8.5)* (10.4) (7.3) (2.8)*** (2.7)***
Homework in about -18.2 22.3 14.8 10.6 7.7half of the lessons (9.4)* (9.9)** (7.8)* (3.0)*** (2.8)***
Homework in -23.2 8.7 6.1 9.9 7.0some lessons (11.3)** (6.8) (5.4) (2.1)*** (1.9)***
Teacher characteristics Yes Yes Yes No YesStudent characteristics Yes Yes Yes No YesTeacher fixed effects No No No Yes YesStudent fixed effects No No No Yes YesObservations 3345 3345 6690 6690 3345Note: Standard errors are clustered at the teacher level. */**/*** denotes statistically signifi-cance at the 10/5/1 percent level.
science (column (2)). The average associations across the subjects presented in column (3) are
positive, but insignificant at the five percent level. These results resemble the previous findings
for the US that homework is not significantly related to achievement in primary education
(Cooper, 1989; Cooper et al., 2006).
When conditioning on both teacher and student fixed effects (column (4) in Table 7), the
point estimate of assigning homework becomes larger and statistically significant at one percent
level, which is in line with the literature on secondary education (REFS her?). In addition, the
relative effects of the three indicators of homework become meaningful as in the pooled sample.
Including observed characteristics of students and teachers/classes (column (5)) reduces the
effect of homework somewhat (about 1.5 standard errors), but the effect of homework is still
highly significant and larger than the international average effect.
/clearpage
24

6 International comparison
An interesting question is why the estimated effect of homework seems to differ across countries?
In the case of model misspesification there would be no systematic relationships between the
estimated homework effects and country characteristics. This section sets out to investigate
whether the effect of homework is correlated with the organization of primary school.
Previous research has indicated that students learn less from homework if it is used in a
compensatory way, i.e., homework is a substitute to in-school learning in the sense that topics
supposed to be taught in school are given as homework (Rønning, 2011). Arguably, the use of
homework may be more optimal if it serves as a complement to in-class learning (i.e. homework
is meant to hone skills previously taught in the classroom). If this is the case one would expect
the homework effect to be positively related to the time students and teachers spend in the
classroom.
Figure 1 presents correlations between the estimates of the homework effect (taken from
column (1) in Table 6) and measures of time spent on class instruction and teaching in primary
school as reported by OECD (2011). Instruction time is defined as the “formal number of 60-
minute hours per school year organized by the school for class instruction” (p. 386) and teaching
time is defined as “the number of hours per year that a full-time teacher teaches a group or class
of students as set by policy” (p. 427).14
As expected, the correlation between the effect of homework and both instruction time
(upper panel of Figure 1) and teaching time (lower panel of Figure 1) are positive. While the
latter relationship is significant at the 5 percent level, the p-value of the former relationship is
0.12.15
Although these correlations cannot be given a causal interpretation, the findings are consis-
tent with the hypothesis that homework is more efficient when it is used as a complement to
classroom learning.
/clearpage14Notice that information on instruction time is missing for New Zealand, Scotland and the US, while infor-
mation on teaching time is missing for New Zealand and Sweden.15The correlation coefficients are 0.45 and 0.63 with respect to instruction time and teaching time, respectively,
and the slopes of the regression lines in Figure 1 are 0.023 and 0.025, respectively. If we use the estimatedhomework effects from column (2) in Table 6 instead of the estimated effects in column (1), the correlations are0.37 and 0.52 with p-values of 0.22 and 0.06, respectively.
25

Australia
Netherlands
Italy
England
Denmark
Germany
Japan
Austria
Norway
Sweden
Slovak
Czech Rep
Hungary
−10
−50
510
15
600 700 800 900 1000Instruction time, age 9−11
US
Netherlands
Australia
ScotlandCzech Rep
Slovak
Germany
Austria
Italy
Norway
JapanDenmark
England
Hungary
−10
−50
510
15
600 700 800 900 1000 1100Teaching time, primary
Figure 1: The relationship between the effect of homework and instruction time (upper figure)and net teaching time (lower figure)
26

7 Concluding remarks
By using data for nine years old students in 16 OECD countries who participated in TIMSS 2007,
this paper analyzes the effect of homework on student achievement. The identification rests on
within-student variation in homework in a sample of students who have the same teacher in
both mathematics and science. Unobserved teacher and student characteristics are conditioned
out of the model by applying this approach.
Our findings indicate that models which do not take unobserved teacher characteristics
into account tend to overestimate the effect of homework. When conditioning on unobserved
characteristics of the teachers that are constant across mathematics and science, we find that
assigning homework in all lessons compared to never assigning homework increases student test
scores by 3 points, which is about 4 percent of a standard deviation. This estimate is insensitive
to the inclusion of student fixed effects. The effect of assigning homework is largest in the US,
Austria and Australia where it amounts to about 14-21 percent of a standard deviation. For
most other countries we find an effect of homework of about the same magnitude as the average
effect. In addition, the effect of homework seems to be larger for girls than for boys, while the
relationship between the homework effect and the home environment in terms of the number of
books at home varies greatly across countries.
Finally, the effect of homework also seems to be related to the organization of primary school
at the country level. It is larger in countries where students and teachers spend more time in
school, which is consistent with the hypothesis that homework is most beneficial when used as
a complement to classroom learning.
27

References
[1] Aksoy, T. and Links, C. R. (2000): A panel analysis of student mathematics
achievement in the US in the 1990s: does increasing the amount of time in learning
activities affect math achievement? Economics of Education Review, 19, 261-277.
[2] Altonji, J. G., Elder, T. E. and Taber, C. R. (2005). Selection on observed and
unobserved variables: Assessing the effectiveness of Catholic schools. Journal of
Political Economy, 113, 151-184.
[3] Ammermueller, A. and Pischke, J-S. (2009). Peer effects in European primary
schools: Evidence from PIRLS. Journal of Labor Economics, 27, 315-348.
[4] Betts, J. (1996): The role of homework in improving school quality. Discussion
Paper 96-16, University of California, San Diego.
[5] Card, D. (1999): The causal effect of education on earnings. In Ashenfelter, O. and
Card, D. (eds.), Handbook of Labor Economics, vol. 3A. North-Holland, Amster-
dam.
[6] Chamberlain, G. (1982). Multivariate regression models for panel data. Journal of
Econometrics, 18, 5-46.
[7] Clotfelter, C. T., Ladd, H. F., Vigdor, J. L. (2010). Teacher credentials and student
achievement in high school: a cross-subject analysis with student fixed effects.
Journal of Human Resources, 45, 655-681.
[8] Cooper, H. (1989). Homework. White Plains, NY: Longman
[9] Cooper, H., Robinson, J. C. and Patall, E. A. (2006). Does homework improve
academic achievement? A synthesis of research, 1987-2003. Review of Educational
Research, 76, 1-62.
[10] Dee, T. S. (2005). A teacher like me: does race, ethnicity, or gender matter?
American Economic Review, 95, 158-165.
28

[11] Dee, T. S. (2006). Teachers and the gender gaps in student achievement. Journal
of Human Resources, 42, 528-554.
[12] Dettmers S., Trautwein D. and Lütke O. (2009). The relationship between home-
work time and achievement is not universal: evidence from multilevel analyses in
40 countries. School Effectiveness and School Improvement, 20(4), 375-405.
[13] Emerson, T. N. and Mencken, K. D. (2011). Homework: To require or not? Online
graded homework and student achievement. Perspectives on Economic Education
Research, 7(1), 20-42
[14] Eren O. and Henderson D. J. (2008). The impact of homework on student achieve-
ment. Econometrics Journal, 11, 326-348.
[15] Eren O. and Henderson D. J. (2011). Are we wasting our children’s time by giving
them more homework? Economics of Education Review, 30(5), 950-961.
[16] Goldhaber, D. and Brewer, D. (1997). Why don’t schools and teachers seem to mat-
ter? Assessing the impact of unobservables on educational productivity. Journal
of Human Resources, 32(3), 505-523.
[17] Grodner A. and Rupp N. G. (2011). The role of homework on student learning
outcomes: Evidence from a field experiment. Working Paper, East Carolina Uni-
versity
[18] Grove, W. A. and Wasserman, T. (2006). Incentives and student learning: A nat-
ural experiment with economics problem sets. American Economic Review, 96 (2),
447-452
[19] Guryan J., Hurst E. and Kearney M. S. (2008). Parental education and parental
time with children. Journal of Economic Perspectives, 22(3), 23-46.
[20] Krohn G. A. and O’Connor C. M. (2005). Student effort and performance over the
semester. Journal of Economic Education, 36(1), 3-28.
29

[21] Lavy, V. (2010). Do differences in school’s instruction time explain international
achievement gaps in math, science, and reading? Evidence from developed and
developing countries. NBER Working Paper No. 16227.
[22] Machin S. and S. McNally (2008). The literacy hour. Journal of Public Economics,
92, 1141-1462.
[23] McMullen S. and Busscher D. (2009). Homework and academic achievement in
elementary school. Working Paper, Calvin College.
[24] Meltzer, J. and Woessmann, L. (2012). The impact of teacher subject knowledge
on student achievement: Evidence from within-teacher within-student variation.
Journal of Development Economics, 99, 486-496.
[25] OECD (2011). Education at a glance 2011: OECD Indicators, OECD Publishing,
Paris.
[26] Rønning, M. (2011). Who benefits from homework assignments? Economics of
Education Review, 30, 55-64.
[27] Schwerdt G. and Wuppermann A. C. (2009). Is traditional teaching really all that
bad? A within-student between-subject approach. Economics of Education Review,
30(2), 365-379.
[28] Stinebrickner R. and Stinebrickner T. (2008). The causal effect of studying on
academic performance. The B.E. Journal of Economic Analysis & Policy, 8(1),
Article 14.
[29] TIMSS 2007 user guide for the International Database. Lynch School of Education,
Boston College.
[30] Todd P. and Wolpin K. I. (2003). On the specification and estimation of the pro-
duction function for cognitive achievement. Economic Journal, 113, F3-F33.
[31] Trautwein, U. and Köller, O. (2003). The relationship between homework and
achievement: still much of a mystery. Educational Psychology Review, 15, 115-145.
30

[32] Trautwein, U. (2007). The homework-achievement relation reconsidered: Differen-
tiating homework time, homework frequency, and homework effort. Learning and
Instructions, 17, 372-388.
Appendix
31

Table A1: Control variables, summary statistics. Reported are percentages(1) (2)
Regression sample Full samplestudent characteristicsNumber of books at home- No or very few books 9.4 9.5- One bookshelf 22.9 22.8- One bookcase 34.5 34.4- Two bookcases 16.8 16.7- Three or more bookcases 13.8 13.8- Missing information 2.6 2.8How often test language is spoken at home- Always or almost always 91.1 90.0- Sometimes or never 7.1 8.0- Missing information 1.8 2.0Birth year- <=1995 2.5 2.8- 1996 43.8 45.9- 1997 52.3 50.1- >=1998 1.4 1.2- Missing information 0.01 0.01Gender- Girl 49.0 49.0- Boy 49.7 49.6- Missing information 1.3 1.4teacher/class characteristicsGender- Female 81.8 78.0- Male 17.9 17.3- Missing information 0.3 3.7Age- 25-29 14.7 13.8- 30-39 24.5 24.0- 40-49 27.9 26.8- 50-59 28.6 27.7- 60 or older 3.9 3.9- Missing information 0.4 3.8Teacher’s education (based on isced codes)- Upper secondary education or less 9.4 6.9- Tertiary education, short 10.4 12.0- Tertiary education, medium 47.7 46.3- Tertiary education, long 23.5 24.3- Missing information 9.1 10.5Class size- <=19 pupils 18.6 15.87- >=20 pupils 78.9 61.38- Missing information 2.5 22.75Observations 48670 73,103Note: The data on family background are taken from the pupil questionnaire and the data on teacher/classcharacteristics are taken from the teacher questionnaire.
32


Statistics Norway
Oslo:PO Box 8131 DeptNO-0033 OsloTelephone: + 47 21 09 00 00Telefax: + 47 21 09 00 40
Kongsvinger:NO-2225 KongsvingerTelephone: + 47 62 88 50 00Telefax: + 47 62 88 50 30
E-mail: [email protected]: www.ssb.no
ISSN 0809-733X
Returadresse:Statistisk sentralbyråNO-2225 KongsvingerB