Home | Sampo.com - BOARD OF DIRECTORS’ REPORT ......Sampo Group’s equity as at 31 December 2019...
185
BOARD OF DIRECTORS’ REPORT AUDITOR’S REPORT SAMPO PLC’S FINANCIAL STATEMENTS Sampo plc’s Notes to the Accounts GROUP’S IFRS FINANCIAL STATEMENTS Group’s Notes to the Accounts BOARD OF DIRECTORS’ REPORT AND FINANCIAL STATEMENTS 2019 1 BOARD OF DIRECTORS’ REPORT AND FINANCIAL STATEMENTS 2019
Transcript of Home | Sampo.com - BOARD OF DIRECTORS’ REPORT ......Sampo Group’s equity as at 31 December 2019...

BOARD OFDIRECTORS’ REPORT
AUDITOR’S REPORT
SAMPO PLC’S FINANCIAL STATEMENTS
Sampo plc’s Notes to the Accounts
GROUP’S IFRS FINANCIAL STATEMENTS
Group’s Notes to the Accounts
BOARD OF DIRECTORS’ REPORT AND FINANCIAL STATEMENTS 2019 1
BOARD OF DIRECTORS’REPORT AND
FINANCIAL STATEMENTS
2019
CONTENTS
REPORTS FOR THE YEAR 2019 WWW.SAMPO.COM/YEAR2019
Board of Directors’ Report for 2019 . . . . . . . . . . . . . . 3Sampo Group . . . . . . . . . . . . . . . . . . . . . . . . . . . . . . . . . . . . . . . . . . . . . . . . . . . . . 4Economic Environment . . . . . . . . . . . . . . . . . . . . . . . . . . . . . . . . . . . . . . . 6Business Areas . . . . . . . . . . . . . . . . . . . . . . . . . . . . . . . . . . . . . . . . . . . . . . . . . . 7
If . . . . . . . . . . . . . . . . . . . . . . . . . . . . . . . . . . . . . . . . . . . . . . . . . . . . . . . . . . . . . . . . . . 7Topdanmark . . . . . . . . . . . . . . . . . . . . . . . . . . . . . . . . . . . . . . . . . . . . . . . . . . 9Associated Company Nordea . . . . . . . . . . . . . . . . . . . . . . . . 10Mandatum Life . . . . . . . . . . . . . . . . . . . . . . . . . . . . . . . . . . . . . . . . . . . . 11Holding . . . . . . . . . . . . . . . . . . . . . . . . . . . . . . . . . . . . . . . . . . . . . . . . . . . . . . 13
Other Developments . . . . . . . . . . . . . . . . . . . . . . . . . . . . . . . . . . . . . . . . . 14Changes in the Group Structure . . . . . . . . . . . . . . . . . . . 14Changes in Group Management . . . . . . . . . . . . . . . . . . . . 16
Governance and Related Issues . . . . . . . . . . . . . . . . . . . . . . . . . . 18Governance . . . . . . . . . . . . . . . . . . . . . . . . . . . . . . . . . . . . . . . . . . . . . . . . 18Annual General Meeting . . . . . . . . . . . . . . . . . . . . . . . . . . . . . . . 18Corporate Responsibility . . . . . . . . . . . . . . . . . . . . . . . . . . . . . . 19Personnel . . . . . . . . . . . . . . . . . . . . . . . . . . . . . . . . . . . . . . . . . . . . . . . . . . 19Remuneration . . . . . . . . . . . . . . . . . . . . . . . . . . . . . . . . . . . . . . . . . . . . . 20Risk Management . . . . . . . . . . . . . . . . . . . . . . . . . . . . . . . . . . . . . . . . 21
Shares, Share Capital and Shareholders . . . . . . . . . . . . . 22Shares and Share Capital . . . . . . . . . . . . . . . . . . . . . . . . . . . . . . 22Authorizations Granted to the Board . . . . . . . . . . . . . 24Shareholders . . . . . . . . . . . . . . . . . . . . . . . . . . . . . . . . . . . . . . . . . . . . . . . 24Holdings of the Board and Executive Management . . . . . . . . . . . . . . . . . . . . . . . . . . 26
Financial Standing . . . . . . . . . . . . . . . . . . . . . . . . . . . . . . . . . . . . . . . . . . . 27Extra Dividend in the Form of Nordea Shares . 27Internal Dividends . . . . . . . . . . . . . . . . . . . . . . . . . . . . . . . . . . . . . . . . 27Ratings . . . . . . . . . . . . . . . . . . . . . . . . . . . . . . . . . . . . . . . . . . . . . . . . . . . . . . . 28
Solvency . . . . . . . . . . . . . . . . . . . . . . . . . . . . . . . . . . . . . . . . . . . . . . . . . . . . . 28Debt Financing . . . . . . . . . . . . . . . . . . . . . . . . . . . . . . . . . . . . . . . . . . . . 29
Outlook . . . . . . . . . . . . . . . . . . . . . . . . . . . . . . . . . . . . . . . . . . . . . . . . . . . . . . . . . . 31Outlook for 2020 . . . . . . . . . . . . . . . . . . . . . . . . . . . . . . . . . . . . . . . . . 31The Major Risks and Uncertainties to the Group in the Near-Term . . . . . . . . . . . . . . . . . . . . . . . 31
Dividends . . . . . . . . . . . . . . . . . . . . . . . . . . . . . . . . . . . . . . . . . . . . . . . . . . . . . . . 32The New Dividend Policy . . . . . . . . . . . . . . . . . . . . . . . . . . . . . . 32Dividend Proposal . . . . . . . . . . . . . . . . . . . . . . . . . . . . . . . . . . . . . . . 32
Key Figures . . . . . . . . . . . . . . . . . . . . . . . . . . . . . . . . . . . . . . . . . . . . . . . . . . . . . . 33Calculation of the Key Figures . . . . . . . . . . . . . . . . . . . . . . . 36
Group’s IFRS Financial Statements . . . . . . . . . . . 38Statement of Profit and Other Comprehensive Income, IFRS . . . . . . . . . . . . . . . . . . . . . . . . . . . . . . . . . . . . . . . . . . . . . . . . . . . . 39Consolidated Balance Sheet, IFRS . . . . . . . . . . . . . . . . . . . . . . 40Statement of Changes in Equity, IFRS . . . . . . . . . . . . . . . . . 41Statement of Cash Flows, IFRS . . . . . . . . . . . . . . . . . . . . . . . . . . 42
Group’s Notes to the Accounts . . . . . . . . . . . . . . . . . . . . 43Summary of Significant Accounting Policies . . . . . . . . 44Segment Information . . . . . . . . . . . . . . . . . . . . . . . . . . . . . . . . . . . . . . . . 62Material Partly-Owned Subsidiairies . . . . . . . . . . . . . . . . . . . . 67Business Acquisitions . . . . . . . . . . . . . . . . . . . . . . . . . . . . . . . . . . . . . . . . 68Group’s Other Notes to the Accounts . . . . . . . . . . . . . . . . . 69
Sampo plc’s Financial Statements . . . . . . . . . . . .167Sampo plc’s Income Statement . . . . . . . . . . . . . . . . . . . . . . . 168Sampo plc’s Balance Sheet . . . . . . . . . . . . . . . . . . . . . . . . . . . . . 169Sampo plc’s Statement of Cash Flows . . . . . . . . . . . . . . . 170
Sampo plc’s Notes to the Accounts . . . . . . . . . . 171Summary of Significant Account Policies. . . . . . . . . . .172Notes to the Income Statement 1–4 . . . . . . . . . . . . . . . . . .172Notes to the Assets 5–9 . . . . . . . . . . . . . . . . . . . . . . . . . . . . . . . . . . . 173Notes to the Liabilities 10–13 . . . . . . . . . . . . . . . . . . . . . . . . . . . 174Note to the Income Taxes 14 . . . . . . . . . . . . . . . . . . . . . . . . . . . . 175Notes to the Liabilities and Commitments 15–16 . . . . . . . . . . . . . . . . . . . . . . . . . . . . . . . . . . . . . . . 176Notes to the Staff and Management 17–19 . . . . . . . . 176Note to the Shares Held 20 . . . . . . . . . . . . . . . . . . . . . . . . . . . . . .177
Approval of the Financial Statements and the Board of Directors’ Report . . . . . . . . . . 178
Auditor’s Report . . . . . . . . . . . . . . . . . . . . . . . . . . . . . . . . . . . . . . . . . . .179
BOARD OFDIRECTORS’ REPORT
AUDITOR’S REPORT
SAMPO PLC’S FINANCIAL STATEMENTS
Sampo plc’s Notes to the Accounts
GROUP’S IFRS FINANCIAL STATEMENTS
Group’s Notes to the Accounts
2BOARD OF DIRECTORS’ REPORT AND FINANCIAL STATEMENTS 2019

BOARD OF DIRECTORS’ REPORT
14Other
Developments
7Business Areas
18Governance and
Related Issues
22Shares, Share Capital
and Shareholders
4Sampo Group
6Economic
Environment
Changes in the Group Structure .................... 14Changes in Group Management .......................... 16
Governance ............................ 18Annual General Meeting .... 18Corporate Responsibility ... 19Personnel ................................ 19Remuneration ........................ 20Risk Management ................ 21
If ................................................... 7Topdanmark ............................. 9Associated Company Nordea ..................................... 10Mandatum Life ...................... 11Holding .................................... 13
Shares and Share Capital ..22Authorizations Granted to the Board ......... 24Shareholders .......................... 24Holdings of the Board and Executive Management ..... 26
32Dividends
31Outlook
33Key Figures
27Financial Standing
The New Dividend Policy ..32Dividend Proposal ............... 32
Calculation of the Key Figures ..................... 36
Extra Dividend in the Form of Nordea Shares ...... 27Internal Dividends ................ 27Ratings ..................................... 28Solvency .................................. 28Debt Financing ..................... 29
Outlook for 2020 .................. 31The Major Risks and Uncertainties to the Group in the Near-Term ..... 31
AUDITOR’S REPORT
SAMPO PLC’S FINANCIAL STATEMENTS
Sampo plc’s Notes to the Accounts
GROUP’S IFRS FINANCIAL STATEMENTS
Group’s Notes to the Accounts
BOARD OFDIRECTORS’ REPORT
3BOARD OF DIRECTORS’ REPORT 2019

Sampo Group’s profit before taxes for 2019 amounted
to EUR 1,541 million (2,094). The profit includes a loss
of EUR 155 million incurred when distributing Nordea
shares as dividends in the third quarter of 2019. The profit
for the for the comparison year contains a positive non-
recurring item of EUR 197 million from the Danske Bank
co-operation agreement that Mandatum Life completed
in the second quarter of 2018. The total comprehensive
income for the period, taking changes in the market value
of assets into account, rose to EUR 1,565 million (1,034).
Earnings per share was EUR 2.04 (3.04) and marked-to-
market earnings per share was EUR 2.63 (1.70). Marked-
to-market earnings were boosted by strong equity market
development. Return on equity for the Group amounted
to 12.0 per cent (7.5) for 2019. Net asset value per share on
31 December 2019 increased to EUR 20.71 (20.60).
Sampo plc’s Board of Directors is proposing at the Annual
General Meeting to be held on 23 April 2020 a dividend
of EUR 2.20 per share (2.85). The proposed dividend pay-
ment amounts in total to EUR 1,222 million (1,583). The
Board has on 6 February 2020 approved a new dividend
policy according to which total annual dividends paid
will be at least 70 per cent of Group's net profit for the
year (excluding extraordinary items). In addition share
buy-backs can be used to complement the cash dividend.
If segment’s profit before taxes rose to EUR 884 million
(848). Underwriting performance continues on its
excellent track. Insurance technical result amounted to
EUR 685 million (643) and combined ratio for full-year
2019 was 84.5 per cent (85.2). Return on equity amounted
to 34.5 per cent (11.2). Premiums grew strongly in all
business areas in the Nordics amounting to 5.7 per cent
with fixed currencies. If lowered the discount rate applied
in Finland from 1.2 per cent to 0.95 per cent. This had a
negative impact of EUR 62 million on the results. If paid a
dividend of SEK 7.5 billion (EUR 710 million) to Sampo plc
in December 2019.
Topdanmark had another strong year and segment’s profit
before taxes rose to EUR 238 million (199). The combined
ratio amounted to 82.1 per cent (82.3). Topdanmark’s
Board of Directors proposes to the AGM of 2020 a
dividend of DKK 17 per share. If approved Sampo plc’s
share of the dividend payment is EUR 96 million.
Sampo’s share of Nordea’s net profit for 2019 amounted
to EUR 290 million (625). Nordea made encouraging
progress in the fourth quarter of 2019 towards achieving
its financial targets. In segment reporting the share of
Nordea’s profit is included in the segment ‘Holding’. For
2019 Nordea targets a dividend of EUR 0.40 per share
(0.69). If the AGM approves this, Sampo plc will receive a
dividend of EUR 322 million (594).
Profit before taxes for the segment Mandatum amounted
to EUR 280 million (450). The profit for the comparison
year includes a contribution of EUR 197 million from
the Danske Bank co-operation agreement in the second
quarter of 2018. Return on equity rose to 23.5 per cent
(8.7). Mandatum Life’s Board proposes a dividend of EUR
150 million to be paid to Sampo plc in the first quarter of
2020.
Sampo Group’s total investment assets, excluding
Topdanmark’s life insurance assets, on 31 December 2019
amounted to EUR 21.8 billion (21.7), of which 76 per cent
was invested in fixed income instruments (79), 16 per cent
in equities (14) and 8 per cent in other assets (7). If’s share
of assets was 50 per cent (50), Topdanmark’s 13 per cent
(13), Mandatum Life’s 26 per cent (26) and Sampo plc’s 11
per cent (11).
Sampo plc - Board of Directors’ Report for 2019Sampo Group
AUDITOR’S REPORT
SAMPO PLC’S FINANCIAL STATEMENTS
Sampo plc’s Notes to the Accounts
GROUP’S IFRS FINANCIAL STATEMENTS
Group’s Notes to the Accounts
BOARD OFDIRECTORS’ REPORT
4BOARD OF DIRECTORS’ REPORT 2019

Sampo Group’s equity as at 31 December 2019 amounted
to EUR 11,908 million (12,386), excluding the minority
share of EUR 635 million (628). Dividend payments, both
cash dividend and dividend in kind, of EUR 1,902 million
reduced the equity and the comprehensive income for the
year of EUR 1,565 million increased it.
Sampo Group’s solvency capital is as of October 2019
calculated according to the Solvency II rules. At the end of
2019 the solvency ratio stood at 167 per cent (140).
Sampo Group will issue a report on non-financial
information in accordance with Chapter 3a, Section 5 of
the Accounting Act. The report, Corporate Responsibility
Report 2019, will be separate from the Board of Directors’
Report and will be published in May 2020.
Key FiguresSampo Group, 2019
EURm 2019 2018 Change, %Profit before taxes *) 1,541 2,094 -26
If 884 848 4
Topdanmark 238 199 20
Associates (Nordea & NDX Intressenter) 298 621 -52
Mandatum *) 280 450 -38
Holding (excl. Associates) -159 -3 -
Profit for the period **) 1,237 1,778 -30
2019 2018 ChangeEarnings per share, EUR *) 2.04 3.04 -1.00
EPS (incl. change in FVR), EUR 2.63 1.70 0.93
NAV per share, EUR 20.71 20.60 0.11
Average number of staff (FTE) 9,813 9,509 304
Group solvency ratio, % 167 140 27
RoE, % 12.0 7.5 4.5
*) the comparison year includes the contribution of EUR 197 million from the Danske Bank co-operation agreement in the second quarter of 2018.**) of which non-controlling interests are EUR 107 million (91) for 2019.
Income statement items are compared on a year-on-year basis and comparison figures for balance sheet items are from 31 December 2018 unless otherwise stated.
Exchange Rates used in Reporting
1–12/2019 1–9/2019 1–6/2019 1–3/2019 1–12/2018EURSEKIncome statement (average) 10.5853 10.5679 10.5181 10.4187 10.2583
Balance sheet (at end of period) 10.4468 10.6958 10.5633 10.3980 10.2548
DKKSEKIncome statement (average) 1.4183 1.4158 1.4090 1.3959 1.3764
Balance sheet (at end of period) 1.3982 1.4326 1.4153 1.3929 1.3733
NOKSEKIncome statement (average) 1.0749 1.0816 1.0810 1.0694 1.0688
Balance sheet (at end of period) 1.0591 1.0809 1.0897 1.0765 1.0308
EURDKKIncome statement (average) 7.4661 7.4644 7.4651 7.4637 7.4533
Balance sheet (at end of period) 7.4715 7.4662 7.4636 7.4652 7.4673
AUDITOR’S REPORT
SAMPO PLC’S FINANCIAL STATEMENTS
Sampo plc’s Notes to the Accounts
GROUP’S IFRS FINANCIAL STATEMENTS
Group’s Notes to the Accounts
BOARD OFDIRECTORS’ REPORT
5BOARD OF DIRECTORS’ REPORT 2019

The global economy is expected to have grown at a
modest pace of 2.8 per cent in 2019, which is slightly
less than the previous year’s figure. One of the main
reasons for the expected drop has to do with decreased
investments among major economies, such as the EU,
USA and China, driven by perceived threats surrounding
the fluidity of international trade. Earlier in the year, the
US-China trade spat escalated in a tit-for-tat increase
on imposed tariffs. In addition, the risks posed by a
hard Brexit decreased foreign investments into the UK.
While some of the major politico-economic hurdles were
overcome as of late 2019, concrete solutions to other
issues, such as climate change, still remained to be found.
The Nordic economies experienced somewhat of a
slowdown from the previous year, although Norway did
post a slight uptick in its growth figures. As the export-
driven Nordic cluster is naturally sensitive to global
economic shocks, the global slowdown due to escalated
trade tensions markedly decreased intraregional
investments. While Denmark and Norway weathered
the downward growth pressures somewhat better due
to greater utilisation of their respective labour forces,
structural issues in both Sweden and Finland hindered
overall growth potential.
In Finland expected growth dropped to 1.5 per cent,
with investments falling by 0.7 per cent and private
consumption stalling, 2019 was a generally challenging
year for the Finnish economy. Investments were
depressed particularly due to decreased construction
starts and private consumption only saw somewhat
of a rebound in the latter half of the year. Despite a
global economic slowdown, Finland did experience a
moderately strong pickup in exports compared to imports
balancing out the current account. The unemployment
rate has been falling since 2016 although the trend did not
continue into 2019, as the unemployment has been flat at
6.7 per cent since April.
In Sweden growth figures were slightly gloomier at
an expected 1.1 per cent, driven internally by weak
consumption growth and decreased levels of investment
particularly in the housing sector. Housing prices saw
a recovery from a drop in 2017, and towards the end
of the year a lot of the past housing starts came into
fruition. One big driver for price increases has been the
urban sprawl driving up demand in major cities, such as
Stockholm and Gothenburg. However, unemployment
rose to 6.8 per cent thereby placing a lot of potential
consumers without a paycheque and further contributing
to a weakish consumption growth figure of 1.0 per cent.
One of the bigger surprises in Sweden was the Riksbank’s
decision to raise rates towards the end of the year despite
weak economic data. The rate hike was largely motivated
by concerns over possible adverse effects stemming from
negative rates.
In Norway the economy grew at an expected 2.5 per cent,
which was propped up by a stable global demand for oil
and new investments into oil production. During the year,
oil related investments grew by 14 per cent, which partly
off-set the slump in foreign direct investments within the
Nordic region. Unemployment dropped to 3.7 per cent,
which was the lowest out of the Nordics. Compared to
the rest of the world, Norway’s economy weathered the
global trade uncertainties well. Due to a strong economy,
Norway’s central bank hiked rates three times during the
year.
In Denmark the economy grew at an expected 2.1 per
cent, driven by increased exports as well as investments
especially into the pharmaceutical industry. In addition,
positive developments in real wages buffed by low interest
rate payments increased Danish households’ disposable
incomes during the year leading to lower demand sided
risks. This has also increased aggregate real savings to
create a cushy buffer for a rainy day. Overall, Denmark’s
economy performed solidly despite slower global growth.
Economic Environment
AUDITOR’S REPORT
SAMPO PLC’S FINANCIAL STATEMENTS
Sampo plc’s Notes to the Accounts
GROUP’S IFRS FINANCIAL STATEMENTS
Group’s Notes to the Accounts
BOARD OFDIRECTORS’ REPORT
6BOARD OF DIRECTORS’ REPORT 2019

Business Areas
If
If is the leading property and casualty insurance company
in the Nordic region, with insurance operations that
also encompass the Baltic countries. The P&C insurance
group’s parent company, If P&C Insurance Holding Ltd, is
located in Sweden, and the If subsidiaries and branches
provide insurance solutions and services in Finland,
Sweden, Norway, Denmark and the Baltic countries. If’s
operations are divided into four business areas: Private,
Commercial, Industrial and Baltic.
Profit before taxes for 2019 for the If segment was EUR 884
million (848). Combined ratio amounted to 84.5 per cent
(85.2) and risk ratio to 62.7 per cent (63.3).
In 2019 EUR 190 million (173) was released from technical
reserves relating to prior year claims. Return on equity
increased to 34.5 per cent (11.2) and the fair value reserve
on 31 December 2019 amounted to EUR 457 million (234).
Technical result was EUR 685 million (643). Insurance
margin (technical result in relation to net premiums
earned) rose to 15.9 per cent (15.1).
ResultsIf, 2019
EURm 2019 2018 Change, %Premiums, net 4,475 4,325 3
Net income from investments 229 229 0
Other operating income 33 30 13
Claims incurred -2,751 -2,716 1
Change in insurance liabilities -87 -35 147
Staff costs -558 -529 6
Other operating expenses -443 -445 -1
Finance costs -16 -15 7
Share of associates’ profit/loss 1 4 -87
Profit before taxes 884 848 4
Key figures 2019 2018 ChangeCombined ratio, % 84.5 85.2 -0.7
Risk ratio, % 62.7 63.3 -0.6
Cost ratio, % 21.8 21.9 -0.1
Expense ratio, % 16.1 16.4 -0.3
Return on equity, % 34.5 11.2 23.3
Average number of staff (FTE) 6,865 6,603 262
AUDITOR’S REPORT
SAMPO PLC’S FINANCIAL STATEMENTS
Sampo plc’s Notes to the Accounts
GROUP’S IFRS FINANCIAL STATEMENTS
Group’s Notes to the Accounts
BOARD OFDIRECTORS’ REPORT
7BOARD OF DIRECTORS’ REPORT 2019

Combined ratio, % Risk ratio, %2019 2018 Change 2019 2018 Change
Private 82.0 83.7 -1.7 60.3 61.8 -1.5
Commercial 88.3 86.9 1.4 65.9 64.4 1.5
Industrial 89.3 92.3 -3 69.8 71.2 -1.4
Baltic 87.0 88.8 -1.8 58.4 60.0 -1.6
Sweden 76.5 79.7 -3.2 57.3 60.5 -3.2
Norway 88.4 85.7 2.7 66.7 63.1 3.6
Finland 87.4 88.6 -1.2 64.7 66.2 -1.5
Denmark 94.1 98.1 -4.0 66.0 69.0 -3
Large claims for If were EUR 4 million (29) worse than
expected for the full-year 2019. In BA Industrial they
were EUR 8 million better and in BA Commercial EUR 13
million worse than expected in 2019.
The Swedish discount rate used to discount the annuity
reserves was -0.77 per cent (-0.41) at the end of 2019 and had
a negative effect on the full-year results of EUR 22 million.
In Finland the discount rate for annuities was lowered from
1.2 per cent to 0.95 during the fourth quarter which had a
negative effect of EUR 62 million on the results.
Gross written premiums amounted to EUR 4,675 million
(4,502) in 2019. With fixed currency rates premiums grew
5.7 per cent in January – December 2019. All business
areas had growth. The growth was highest in the BA
Industrial, at 16.5 per cent. In BA Private the premium
growth amounted to 5.1 per cent and in BA Commercial
2.8 per cent. Gross written premiums grew by 5.1 per
cent in Sweden, 9.5 per cent in Norway, 2.2 per cent in
Finland and 5.0 per cent in Denmark. Positive customer
development continued in all business areas in 2019, the
customer base in BA Private increased by 2 per cent.
The cost ratio was 21.8 per cent (21.9) and expense ratio
16.1 per cent (16.4).
On 31 December 2019, the total investment assets of If
amounted to EUR 10.8 billion (10.9), of which fixed income
investments constituted 86 per cent (88), money market
2 per cent (2) and equity 12 per cent (10). Net income from
investments amounted to EUR 229 million (229). Invest-
ment return marked-to-market for the full-year 2019 was
5.0 per cent (-0.8). Duration for interest bearing assets was
1.3 years (1.4) and average maturity 2.8 years (2.7). Fixed
income running yield without taking into account the FX
hedging cost as at 31 December 2019 was 1.8 per cent (1.7).
If’s solvency position is described in the section
Solvency.
AUDITOR’S REPORT
SAMPO PLC’S FINANCIAL STATEMENTS
Sampo plc’s Notes to the Accounts
GROUP’S IFRS FINANCIAL STATEMENTS
Group’s Notes to the Accounts
BOARD OFDIRECTORS’ REPORT
8BOARD OF DIRECTORS’ REPORT 2019
Topdanmark
Topdanmark is the second largest non-life insurance
company and a major life insurance company in
Denmark. The company is listed on Nasdaq Copenhagen.
In non-life insurance, Topdanmark has a 17 per cent
market share. Topdanmark focuses on the private,
agricultural and SME market. The company has around
620,000 customers and handles around 300,000 claims
a year. In life insurance, Topdanmark has a 10 per cent
market share in Denmark.
At the end of 2019 Sampo plc held 41,997,070 Topdanmark
shares, corresponding to 46.7 per cent of all shares and
48.2 per cent of related voting rights in the company. The
market value of the holding was EUR 1,846 million on
31 December 2019.
The Board of Directors recommends to the AGM of 2020 a
dividend of DKK 1,530 million (EUR 205 million), i.e. DKK
17 per share. If the AGM approves the proposal, Sampo
plc’s share of the dividend payment is EUR 96 million.
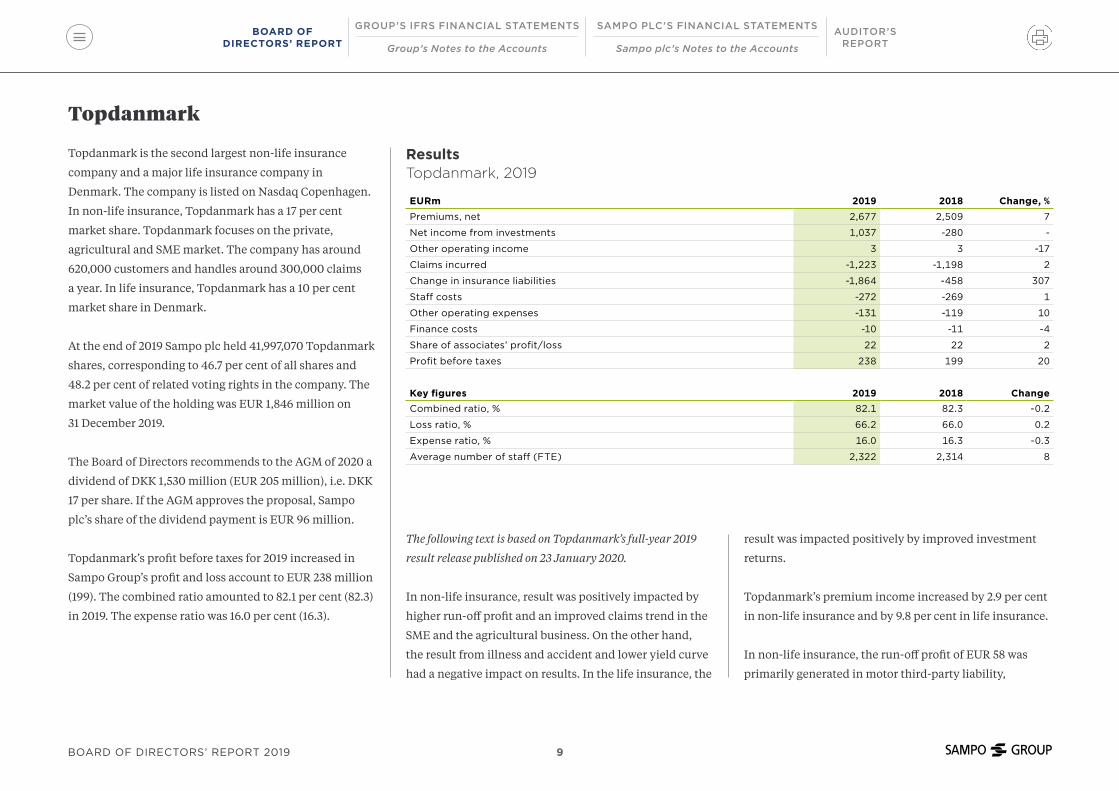
Topdanmark’s profit before taxes for 2019 increased in
Sampo Group’s profit and loss account to EUR 238 million
(199). The combined ratio amounted to 82.1 per cent (82.3)
in 2019. The expense ratio was 16.0 per cent (16.3).
ResultsTopdanmark, 2019
EURm 2019 2018 Change, %Premiums, net 2,677 2,509 7
Net income from investments 1,037 -280 -
Other operating income 3 3 -17
Claims incurred -1,223 -1,198 2
Change in insurance liabilities -1,864 -458 307
Staff costs -272 -269 1
Other operating expenses -131 -119 10
Finance costs -10 -11 -4
Share of associates’ profit/loss 22 22 2
Profit before taxes 238 199 20
Key figures 2019 2018 ChangeCombined ratio, % 82.1 82.3 -0.2
Loss ratio, % 66.2 66.0 0.2
Expense ratio, % 16.0 16.3 -0.3
Average number of staff (FTE) 2,322 2,314 8
The following text is based on Topdanmark’s full-year 2019
result release published on 23 January 2020.
In non-life insurance, result was positively impacted by
higher run-off profit and an improved claims trend in the
SME and the agricultural business. On the other hand,
the result from illness and accident and lower yield curve
had a negative impact on results. In the life insurance, the
result was impacted positively by improved investment
returns.
Topdanmark’s premium income increased by 2.9 per cent
in non-life insurance and by 9.8 per cent in life insurance.
In non-life insurance, the run-off profit of EUR 58 was
primarily generated in motor third-party liability,
AUDITOR’S REPORT
SAMPO PLC’S FINANCIAL STATEMENTS
Sampo plc’s Notes to the Accounts
GROUP’S IFRS FINANCIAL STATEMENTS
Group’s Notes to the Accounts
BOARD OFDIRECTORS’ REPORT
9BOARD OF DIRECTORS’ REPORT 2019

in workers’ compensation, and in illness and accident.
Weather-related claims were EUR 13 million below normal
level and amounted to EUR 10 million. Large claims were
EUR 6 million below normal level and amounted to EUR
7 million.
Topdanmark’s solvency position is described in the
section Solvency.
Further information on Topdanmark A/S and
its January-December 2019 result is available at
www.topdanmark.com.
Associated Company Nordea
Nordea is the largest bank in the Nordic region and among
the ten largest financial groups in Europe in terms of total
market capitalization with around 11 million customers.
Nordea’s shares are listed on the Nasdaq exchanges in
Stockholm, Helsinki and Copenhagen. In Sampo Group’s
reporting Nordea is treated as an associated company and
is included in the segment Holding.
On 31 December 2019 Sampo plc held 804,922,858 Nordea
shares corresponding to a holding of 19.87 per cent. The
average price paid per share amounted to EUR 6.46 and
the book value in the Group accounts was EUR 8.34 per
share. The closing price as at 31 December 2019 was EUR
7.24.
Nordea targets a dividend of EUR 0.40 per share (0.69) for
2019. Sampo plc’s share amounts to EUR 322 million (594)
if approved by the AGM.
Sampo’s share of Nordea’s 2019 profit before taxes
amounted to EUR 290 million (625).
AUDITOR’S REPORT
SAMPO PLC’S FINANCIAL STATEMENTS
Sampo plc’s Notes to the Accounts
GROUP’S IFRS FINANCIAL STATEMENTS
Group’s Notes to the Accounts
BOARD OFDIRECTORS’ REPORT
10BOARD OF DIRECTORS’ REPORT 2019
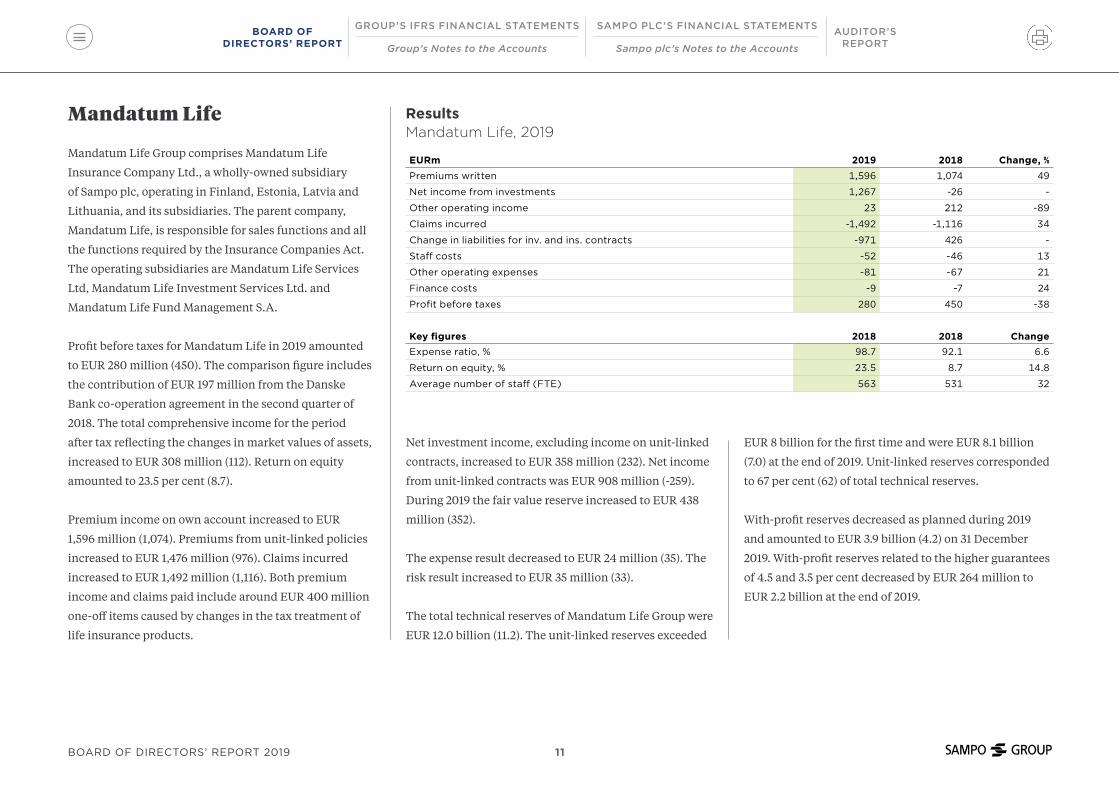
ResultsMandatum Life, 2019
EURm 2019 2018 Change, %Premiums written 1,596 1,074 49
Net income from investments 1,267 -26 -
Other operating income 23 212 -89
Claims incurred -1,492 -1,116 34
Change in liabilities for inv. and ins. contracts -971 426 -
Staff costs -52 -46 13
Other operating expenses -81 -67 21
Finance costs -9 -7 24
Profit before taxes 280 450 -38
Key figures 2018 2018 ChangeExpense ratio, % 98.7 92.1 6.6
Return on equity, % 23.5 8.7 14.8
Average number of staff (FTE) 563 531 32
Mandatum Life
Mandatum Life Group comprises Mandatum Life
Insurance Company Ltd., a wholly-owned subsidiary
of Sampo plc, operating in Finland, Estonia, Latvia and
Lithuania, and its subsidiaries. The parent company,
Mandatum Life, is responsible for sales functions and all
the functions required by the Insurance Companies Act.
The operating subsidiaries are Mandatum Life Services
Ltd, Mandatum Life Investment Services Ltd. and
Mandatum Life Fund Management S.A.
Profit before taxes for Mandatum Life in 2019 amounted
to EUR 280 million (450). The comparison figure includes
the contribution of EUR 197 million from the Danske
Bank co-operation agreement in the second quarter of
2018. The total comprehensive income for the period
after tax reflecting the changes in market values of assets,
increased to EUR 308 million (112). Return on equity
amounted to 23.5 per cent (8.7).
Premium income on own account increased to EUR
1,596 million (1,074). Premiums from unit-linked policies
increased to EUR 1,476 million (976). Claims incurred
increased to EUR 1,492 million (1,116). Both premium
income and claims paid include around EUR 400 million
one-off items caused by changes in the tax treatment of
life insurance products.
Net investment income, excluding income on unit-linked
contracts, increased to EUR 358 million (232). Net income
from unit-linked contracts was EUR 908 million (-259).
During 2019 the fair value reserve increased to EUR 438
million (352).
The expense result decreased to EUR 24 million (35). The
risk result increased to EUR 35 million (33).
The total technical reserves of Mandatum Life Group were
EUR 12.0 billion (11.2). The unit-linked reserves exceeded
EUR 8 billion for the first time and were EUR 8.1 billion
(7.0) at the end of 2019. Unit-linked reserves corresponded
to 67 per cent (62) of total technical reserves.
With-profit reserves decreased as planned during 2019
and amounted to EUR 3.9 billion (4.2) on 31 December
2019. With-profit reserves related to the higher guarantees
of 4.5 and 3.5 per cent decreased by EUR 264 million to
EUR 2.2 billion at the end of 2019.
AUDITOR’S REPORT
SAMPO PLC’S FINANCIAL STATEMENTS
Sampo plc’s Notes to the Accounts
GROUP’S IFRS FINANCIAL STATEMENTS
Group’s Notes to the Accounts
BOARD OFDIRECTORS’ REPORT
11BOARD OF DIRECTORS’ REPORT 2019
Mandatum Life has overall supplemented its technical
reserves with a total of EUR 230 million (232), of which
EUR 189 million is allocated to years 2020 – 2022. The
figure does not take into account the reserves relating to
the segregated fund. The discount rate used for 2020 and
2021 is 0.25 per cent. In the fourth quarter of 2019, the rate
used for 2022 was lowered from 2.50 per cent to 1.25 per
cent.
Discount rate of segregated liabilities was decreased from
0.50 per cent to 0.0 per cent and discount rate reserve of
segregated liabilities amounted to EUR 263 million (250).
At the end of 2019 Mandatum Life Group’s investment
assets, excluding the assets of EUR 8.2 billion (7.0)
covering unit-linked liabilities, amounted to EUR 5.7
billion (5.6) at market values.
The assets covering Mandatum Life’s original with profit
liabilities at the end of 2019 amounted to EUR 4.7 billion
(4.6) at market values. 46 per cent (49) of the assets are
in fixed income instruments, 15 per cent (9) in money
market, 25 per cent (27) in equities and 14 per cent (15) in
alternative investments. The investment return marked-
to-market for 2019 was 9.2 per cent (-2.4). The duration of
fixed income assets at the end of 2019 was 2.8 years (2.5)
and average maturity 2.9 years (2.8). The fixed income
running yield without taking into account the FX hedging
cost was 2.4 per cent (2.7) on 31 December 2019.
The assets covering the segregated fund amounted to
EUR 1.0 billion (1.0), of which 68 per cent (77) was in fixed
income, 13 per cent (5) in money market, 13 per cent (11)
in equities and 4 per cent (6) in alternative investments.
Segregated fund’s investment return marked-to-market
was 6.4 per cent (-1.9). On 31 December 2019 the duration
of fixed income assets was 2.8 years (2.5) and average
maturity 3.2 years (3.1). Fixed income running yield
without taking into account the FX hedging cost was 1.9
per cent (2.4).
Mandatum Life’s solvency position is described in the
section Solvency.
AUDITOR’S REPORT
SAMPO PLC’S FINANCIAL STATEMENTS
Sampo plc’s Notes to the Accounts
GROUP’S IFRS FINANCIAL STATEMENTS
Group’s Notes to the Accounts
BOARD OFDIRECTORS’ REPORT
12BOARD OF DIRECTORS’ REPORT 2019

ResultsHolding, 2019
EURm 2019 2018 Change, %Net investment income -2 2 -
Other operating income 16 17 -5
Staff costs -15 -11 38
Other operating expenses -13 -14 -10
Finance costs 10 3 232
Share of associates’ profit 298 621 -52
Valuation loss on distribution of Nordea shares -155 - -
Profit before taxes 139 618 -77
Key figures 2019 2018 ChangeAverage number of staff (FTE) 63 61 2
The segment’s profit before taxes excluding the associates
for January – December 2019 was EUR -159 million (-3).
Changes in market values of derivative instruments and
currency exchange rates can cause volatility in the net
investment income and finance cost lines.
Holding
Sampo plc owns and controls its subsidiaries engaged in
P&C and life insurance. In addition, Sampo plc held on
31 December 2019 approximately 19.9 per cent of the share
capital of Nordea, the largest bank in the Nordic countries.
Nordea is an associated company to Sampo plc. As of
March 2018 Sampo plc has also treated NDX Intressenter
AB, of which Sampo plc owns 36.25 per cent, as an
associate. The company was established for the takeover of
Nordax Group AB.
Holding segment’s profit before taxes for January –
December 2019 amounted to EUR 139 million (618), which
includes EUR 155 million loss incurred when distributing
Nordea shares as dividends in the third quarter of 2019.
Sampo’s share of profits of associated companies Nordea
and NDX Intressenter for January – December 2019
amounted to EUR 298 million (621) of which Nordea’s
share was EUR 290 million (625) and NDX Intressenter’s
EUR 8 million (-4). Nordea’s result was impacted by
one-off items amounting to EUR 1.3 billion.
Sampo plc’s holding in Nordea was booked in the
consolidated balance sheet at EUR 6.7 billion, i.e. EUR 8.34
per share. The market value of the holding was EUR 5.8
billion, i.e. EUR 7.24 per share, on 31 December 2019.
AUDITOR’S REPORT
SAMPO PLC’S FINANCIAL STATEMENTS
Sampo plc’s Notes to the Accounts
GROUP’S IFRS FINANCIAL STATEMENTS
Group’s Notes to the Accounts
BOARD OFDIRECTORS’ REPORT
13BOARD OF DIRECTORS’ REPORT 2019

Other Developments
Changes in the Group Structure
If P&C Insurance Holding Ltd (publ) signed on
28 November 2019 an agreement to buy Viking
Redningstjeneste TOPCO A/S. The acquisition price for
100 per cent ownership was EUR 32 million (NOK 325
million) which was paid in cash. The enterprise value
amounted to EUR 114 million.
Viking is a Nordic roadside assistance company head-
quartered in Norway. It serves its customers through
an extensive nationwide network of stations in Norway,
Sweden, Denmark and Finland. The acquisition of
Viking will strengthen If’s offering towards its partners
and further improve If’s position as the leading Nordic
insurance and service provider within the mobility area.
With this strategic acquisition If strengthens its position
in the Nordics by providing more comprehensive
service for its insurance customers and partners such
as carmakers. The financial effect of the acquisition on
Sampo Group is not expected to be significant.
The transaction was subject to approval by competition
authorities in Norway and Sweden which were received in
early January 2020 and the transaction was completed.
AUDITOR’S REPORT
SAMPO PLC’S FINANCIAL STATEMENTS
Sampo plc’s Notes to the Accounts
GROUP’S IFRS FINANCIAL STATEMENTS
Group’s Notes to the Accounts
BOARD OFDIRECTORS’ REPORT
14BOARD OF DIRECTORS’ REPORT 2019

Group Structure31 December 2019
Sampo plcFinland
If P&C Insurance Ltd (publ)Sweden
If P&C Insurance ASEstonia
If Livförsäkring ABSweden
If P&C Insurance Holding Ltd (publ)
Sweden
Nordea Bank Abp
Finland
100% < 20%
100%
100%
100%
100%
100%
Topdanmark A/S
Denmark
Topdanmark Kapitalforvaltning A/SDenmark
Topdanmark Forsikring A/SDenmark
Topdanmark Liv Holding A/SDenmark
Topdanmark Livsforsikring A/SDenmark
100%
100%
46.7%
Mandatum Life Services Ltd Finland
Mandatum Life Investment Services Ltd Finland
Mandatum LifeFund Management S.A.Luxembourg
Mandatum Life Insurance Company Ltd
Finland
100%
100%
100%
100%
AUDITOR’S REPORT
SAMPO PLC’S FINANCIAL STATEMENTS
Sampo plc’s Notes to the Accounts
GROUP’S IFRS FINANCIAL STATEMENTS
Group’s Notes to the Accounts
BOARD OFDIRECTORS’ REPORT
15BOARD OF DIRECTORS’ REPORT 2019
Changes in Group Management
Knut Arne Alsaker, 45, took over as the new Group
CFO as of 1 of January 2019. He was earlier CFO of If P&C
Group and is a member of the Sampo Group Executive
Committee.
Sampo’s Group CEO and President Kari Stadigh retired
on 31 December 2019. He also stepped down as Chairman
of If P&C Insurance as of 7 February 2019 and as Chairman
of Mandatum Life Insurance Company 30 June 2019.
Patrick Lapveteläinen took over as the Chairman of
Mandatum Life on the same day.
On 7 February 2019 Sampo's Board of Directors appointed
Torbjörn Magnusson, the CEO of If, to succeed Stadigh
as Group CEO and President of Sampo Group, effective
1 January 2020. Magnusson took immediately over as
Chairman of If P&C.
The Sampo and If Boards appointed Morten Thorsrud,
the Head of If Business Area Private, on 7 February 2019
to succeed Magnusson as the CEO of If, effective immedi-
ately. Thorsrud was in turn succeeded by Ingrid Janbu
Holthe as Head of If BA Private. She was also nominated
a member of the Group Executive Committee of Sampo
Group.
Torbjörn Magnusson was elected as Chairman of Nordea
Bank at the AGM held on 28 March 2019.
On 6 November 2019 Ricard Wennerklint, 50, was
appointed Chief of Strategy in Sampo Group as of
1 January 2020. He has held various positions in Sampo
Group since 2002 and been a member of the Sampo Group
Executive Committee since 2005.
AUDITOR’S REPORT
SAMPO PLC’S FINANCIAL STATEMENTS
Sampo plc’s Notes to the Accounts
GROUP’S IFRS FINANCIAL STATEMENTS
Group’s Notes to the Accounts
BOARD OFDIRECTORS’ REPORT
16BOARD OF DIRECTORS’ REPORT 2019

Organization31 December 2019
FinanceJukka Kurki
FinanceMåns Edsman
PrivateIngrid Janbu Holthe
CommercialIvar Martinsen
IndustrialPoul Steffensen
BalticAndris Morozovs
Risk ManagementKarin Friberg
Human ResourcesJohan Börjesson
ITKjell Rune Tveita
Legal AffairsDag Rehme
Marketing and CommunicationsKatarina Mohlin
Investment SolutionsLauri Vaittinen
Danske Bank and AlliancesRisto Honkanen*
Key Customers and Sales SupportTarja Tyni
Private Customers, Customer Service, IT and BalticsSanna Rajaniemi
Business DevelopmentPetri Vieraankivi
Legal AffairsTimo Vuokila
FinanceLars Thykier
Marketing and CommunicationsNiina Riihelä
OperationsBrian Rothemejer Jacobsen
TechnologyThomas Erichsen
IfMorten Thorsrud
Mandatum LifePetri Niemisvirta
InvestmentsPatrick Lapveteläinen
Group FinanceKnut Arne Alsaker
Group CEO and PresidentKari Stadigh (Until 31 Dec 2019) Torbjörn Magnusson (as of 1 Jan 2020)
Risk ManagementKai Sotamaa
Investor Relations and Group CommunicationsJarmo Salonen
Internal AuditAnn-Marie Andtback Beckman
TopdanmarkPeter Hermann
*Until 31 December 2019, Jussi Karppinen as of 1 January 2020
StrategyRicard Wennerklint (as of 1 Jan 2020)
AUDITOR’S REPORT
SAMPO PLC’S FINANCIAL STATEMENTS
Sampo plc’s Notes to the Accounts
GROUP’S IFRS FINANCIAL STATEMENTS
Group’s Notes to the Accounts
BOARD OFDIRECTORS’ REPORT
17BOARD OF DIRECTORS’ REPORT 2019

Governance and Related Issues
Governance
During 2019 Sampo complied in full with the Finnish
Corporate Governance Code 2015 approved by the
Securities Market Association on 1 October 2015, effective
from 1 January 2016 (the “CG Code 2015”).
Acting in compliance with the Corporate Governance
Code, Sampo publishes a separate Corporate
Governance Statement on its website in fulfillment
of the requirement referred to in the Finnish Securities
Markets Act (746/2012), chapter 7, section 7.
The statement will be available at
www.sampo.com/statement and
www.sampo.com/year2019.
Annual General Meeting
The Annual General Meeting of Sampo plc, held on
9 April 2019, decided to distribute a dividend of EUR 2.85
per share for 2018. The record date for dividend payment
was 11 April 2019 and the dividend was paid on 18 April
2019. In addition to the cash dividend, the Annual General
Meeting decided to authorize the Board of Directors
to resolve, in its discretion, on the distribution of an
extra dividend up to EUR 500,000,000 (EUR 0.9 per
share) either in cash and/or in financial instruments.
The authorization is valid until the next Annual General
Meeting.
The Annual General Meeting adopted the financial
accounts for 2018 and discharged the Board of Directors
and the Group CEO and President from liability for the
financial year.
The Annual General Meeting elected eight members
to the Board of Directors. The following members were
re-elected to the Board: Christian Clausen, Jannica
Fagerholm, Veli-Matti Mattila, Risto Murto, Antti
Mäkinen and Björn Wahlroos. Fiona Clutterbuck
and Johanna Lamminen were elected as new members
to the Board. The Members of the Board were elected
for a term continuing until the close of the next Annual
General Meeting.
At its organizational meeting, the Board elected Björn
Wahlroos as Chairman and Jannica Fagerholm as Vice
Chairperson. Veli-Matti Mattila, Risto Murto, Antti
Mäkinen and Björn Wahlroos (Chairman) were elected
to the Nomination and Compensation Committee and
Christian Clausen, Fiona Clutterbuck, Jannica Fagerholm
(Chairman), and Johanna Lamminen to the Audit
Committee.
All the Board members have been determined to be inde-
pendent of the company under the rules of the Finnish
Corporate Governance Code 2015. Furthermore, all Board
members but Antti Mäkinen have been determined to be
independent of the major shareholders.
The Annual General Meeting decided to pay the following
fees to the members of the Board of Directors until the
close of the 2020 Annual General Meeting: the Chairman
of the Board will be paid an annual fee of EUR 175,000
and other members of the Board will be paid EUR
90,000 each. Furthermore, the members of the Board
and its Committees will be paid the following annual
fees: the Vice Chairperson of the Board EUR 25,000, the
Chairperson of the Audit Committee EUR 25,000 and
the member of the Audit Committee EUR 6,000. A Board
member shall in accordance with the resolution of the
Annual General Meeting acquire Sampo plc's A shares at
the price paid in public trading for 50 per cent of his/her
annual fee excluding taxes and similar payments.
Ernst & Young Oy was elected as Auditor. The Auditor
will be paid a fee determined by an invoice approved by
Sampo. Kristina Sandin, APA, will act as the principally
responsible auditor.
There were 1,052 shareholders represented at the
beginning of the meeting holding altogether 360,849,587
shares and 365,649,587 votes in the company.
AUDITOR’S REPORT
SAMPO PLC’S FINANCIAL STATEMENTS
Sampo plc’s Notes to the Accounts
GROUP’S IFRS FINANCIAL STATEMENTS
Group’s Notes to the Accounts
BOARD OFDIRECTORS’ REPORT
18BOARD OF DIRECTORS’ REPORT 2019
Corporate Responsibility
Sampo is committed to developing the corporate respon-
sibility activities, targets, measurements, and reporting
of the Group. This is in the interests of, and expected, by
the Group’s various internal and external stakeholders.
During 2019, Sampo continued to work on corporate
responsibility in line with the Group’s updated corporate
responsibility themes: Responsible Business Management
and Practices, Responsible Corporate Culture,
Responsible Investments Management and Operations,
and Responsibility in Communities.
Responsible Business Management and Practice: During
the year, the group-level Corporate Responsibility
Steering Group started its work and convened two times.
Corporate responsibility covers a wide range of topics
relevant for key business operations, therefore a steering
group helps to guide the work on a group-level. In August
2019, Sampo Group joined the UN Global Compact and
is committed to its ten principles concerning human
rights, labor practices, environment, and anti-corruption.
Further, Sampo updated group-level principles, e.g.
Sampo Group Code of Conduct, to better reflect the needs
of the corporate responsibility in general and the Global
Compact. Sampo also initiated group-level greenhouse
gas reporting to support the previously available
company-level reporting.
Responsible Corporate Culture: In 2019, Sampo focused
on identifying group-level key performance indicators
to improve group-level reporting for example in terms
of employee well-being, diversity and equality, and
employee engagement. This is to better measure Sampo
Group’s performance in these areas. The work continues
in 2020.
Responsible Investment Management and Operations:
During 2019, Sampo strengthened the investment policies
of the Group companies by adding further instructions
on how to take the environmental, social, and governance
(ESG) issues into account in the investment process.
Depending on the asset classes, different ESG strategies,
such as ESG integration, norm-based screening,
sector-based screening, and active ownership, are used as
of 2020. Sampo Group also signed the UN Principles for
Responsible Investment (PRI) in April 2019.
Responsibility in Communities: In 2019, Sampo assessed
the UN Sustainable Development Goals (SDGs) and the
underlying targets in order to identify group-level SDGs.
During the project, all 17 SDGs and 169 targets were
evaluated in relation to the Group companies’ businesses
and the Group’s corporate responsibility themes. The
assessment showed that Sampo Group can have an impact
on all the SDGs, but the positive impact is the strongest on
goals 3, 4, 5, 8, 10, 11, 12, 13, and 17.
Sampo Group will issue a report on non-financial
information in accordance with Chapter 3a, Section 5
of the Accounting Act. The report, Sampo Group
Corporate Responsibility Report 2019, will be separate
from the Board of Directors’ Report and published in
May 2020 at www.sampo.com/year2019.
In addition to the group-level report, further information
on If and Topdanmark’s corporate responsibility
activities can be found in their respective reports.
The reports of If and Topdanmark are available
at www.sampo.com/year2019. More information
on Mandatum Life’s activities can be found from the
company website uusi.mandatumlife.fi/en/company/
Corporate-Responsibility.
Personnel
The average number of Sampo Group’s employees (FTE)
in 2019 amounted to 9,813 (9,509).
If is Sampo Group’s largest business area and employed
on average 70 per cent of the personnel. Topdanmark
employed 24 per cent and Mandatum Life approximately
6 per cent of the personnel. The parent company Sampo
plc employed 1 per cent of the work force.
In geographical terms Denmark had 30 per cent of the
personnel, Finland 23 per cent, Sweden 23 per cent and
Norway 14 per cent. The share of other countries was 10
per cent.
The total number of staff in If increased 4 per cent. As of
31 December 2019 If employed 6,925 persons.
AUDITOR’S REPORT
SAMPO PLC’S FINANCIAL STATEMENTS
Sampo plc’s Notes to the Accounts
GROUP’S IFRS FINANCIAL STATEMENTS
Group’s Notes to the Accounts
BOARD OFDIRECTORS’ REPORT
19BOARD OF DIRECTORS’ REPORT 2019
Topdanmark employed 2,366 persons at the end of the
year and the total number of staff increased 2 per cent.
The total number of staff in Mandatum Life increased
8 per cent. As of 31 December 2019 Mandatum Life
employed 573 persons.
Sampo plc had 64 employees (61) at the end of 2019.
At the end of the year, the total number of staff in Sampo
Group totaled 9,927 persons.
More detailed information on personnel in Sampo
Group is available in Sampo Group Corporate
Responsibility Report 2019 to be published in May 2020
at www.sampo.com/year2019.
Remuneration
Sampo plc’s Board of Directors has established the Sampo
Group Remuneration Principles, which apply to all Sampo
Group companies. The Remuneration Principles are
available at www.sampo.com/remuneration.
Sampo Group’s remuneration strategy shall be responsible
towards employees and shareholders. This means that the
long-term financial stability and value creation of Sampo
Group shall guide the remuneration design.
The different forms of remuneration used in Sampo
Group are the following:
(a) Fixed Compensation
(b) Variable Compensation
(c) Pension
(d) Other Benefits
The starting point of any compensation mechanism
shall be to encourage and stimulate employees to do
their best and surpass their targets. Remuneration
packages shall be designed to reward fairly for prudent
and successful performance. At the same time, however,
in order to safeguard the interest of other stakeholders,
compensation mechanisms shall not generate conflicts of
interest and shall not entice or encourage employees to
excessive or unwanted risk taking. Thus, compensation
mechanisms cannot be separated from risk management
objectives and practices.
The relative proportions of fixed and variable
compensation reflect the responsibilities of individual
executives and employees. Fixed salaries shall represent a
sufficiently high share of the total remuneration. Variable
compensation may be based on the contribution to the
company’s profitability and on individual performance or
linked to committing employees to Sampo Group.
The decision on payout of variable compensation shall
be based on the assessment of the incurred risk exposure
and the fulfillment of solvency capital requirements.
Furthermore, the payment of a certain portion of the
variable compensation payable to the Senior Executive
Management and to certain key persons shall be deferred
for a defined period of time as required in the regulatory
framework applicable to each Sampo Group company.
After the deferral period, a retrospective risk adjustment
review shall be carried out and the Board of Directors of
each Sampo Group company shall decide whether the
deferred variable compensation shall be paid/released
in full, partly or cancelled in whole. In 2019, altogether
EUR 10.5 million (7.0) of short-term and long-term
incentives has been deferred.
The Board of Directors decides on multiannual long-term
incentive schemes for the management and other key
employees of Sampo Group. In the long-term incentive
scheme 2014:1/2, altogether 21,525 units remain and will
vest during 2020. In the long-term incentive scheme
2017:1, altogether 4,033,000 allocated incentive units
remain and will vest during 2020 – 2023.
The value of one incentive unit is calculated as the
difference between the trade-weighted average price
of the Sampo A share at the time of payment and the
dividend-adjusted starting price. In addition to the
share price development, the calculation of the value of
one incentive unit takes into account the performance
of the insurance margin of If P&C and the return on
capital at risk as further specified in the terms of the
AUDITOR’S REPORT
SAMPO PLC’S FINANCIAL STATEMENTS
Sampo plc’s Notes to the Accounts
GROUP’S IFRS FINANCIAL STATEMENTS
Group’s Notes to the Accounts
BOARD OFDIRECTORS’ REPORT
20BOARD OF DIRECTORS’ REPORT 2019
respective incentive scheme. Both incentive schemes
contain a cap for maximum payout. The terms and
conditions of the incentive schemes are available at
www.sampo.com/incentiveterms.
A deferral rule applies to incentive rewards paid to key
employees who are considered as identified staff and
are subject to the deferral rule in accordance with the
remuneration policies of the relevant Sampo Group
companies in force at the launch of the incentive
schemes. At payout from the schemes, the identified
staff shall acquire Sampo A shares with a certain part of
the installment after deducting income tax and other
comparable charges. The shares are subject to disposal
restrictions for three years, after which the Board of
Directors shall decide on the possible release.
In 2019 EUR 18 million (23), including social cost, was paid
on the basis of the long-term incentive schemes. EUR 40
million (36), including social costs, was paid as short-term
incentives during the same period. The result impact of
the long-term incentive schemes in force in 2019 was EUR
12 million (5).
Sampo Group will publish in March 2020 the
Remuneration Report 2019 at www.sampo.com/
year2019. The Remuneration Report 2019 is part of
the Remuneration Statement, which is available at
www.sampo.com/ remunerationstatement. The
statement has been prepared in accordance with the
Corporate Governance Code 2015 issued by the Securities
Market Association and effective as of 1 January 2016.
The Remuneration Report prepared in accordance with
the new Corporate Governance Code 2020, approved by
the Securities Market Association on 19 September 2019,
effective from 1 January 2020 has to be published first
time for the financial year starting on 1 January 2020.
Risk Management
As dividends are Sampo plc’s major source of income,
its primary target for every sub-group is to maintain
a healthy balance between profits, risks and capital to
facilitate a steady stream of dividend payments in the
long term.
The second target is ensuring stable profitability at
business portfolio level. Potential risk concentrations
and more generally the correlation of reported profits
are monitored closely and their sources are analyzed. To
the extent possible risk concentrations are proactively
managed by strategic decisions.
Thirdly, Sampo prefers low leverage and adequate
liquidity buffers to be able to generate liquidity as needed.
The size of assessed diversification benefits of the Group
companies’ profits is reflected in Sampo’s decisions on its
capital structure and liquidity position.
Sampo Group companies operate in business areas where
specific features of value creation are the pricing of risks
and the active management of risk portfolios in addition
to sound customer services. Successful management of
underwriting risks and investment portfolio market risks is
the main source of earnings for Sampo Group companies.
In Sampo Group the risks associated with business
activities fall into three main categories: business risks
associated with external drivers affecting the competitive
environment or resulting from lack of internal operational
flexibility, reputational risk associated with the
company’s business practices or associations and risks
inherent in business operations.
A more detailed description of Sampo Group’s risk
management activities, governance, risks and capitaliza-
tion is available in the Risk Management Report 2019 at
www.sampo.com/year2019.
AUDITOR’S REPORT
SAMPO PLC’S FINANCIAL STATEMENTS
Sampo plc’s Notes to the Accounts
GROUP’S IFRS FINANCIAL STATEMENTS
Group’s Notes to the Accounts
BOARD OFDIRECTORS’ REPORT
21BOARD OF DIRECTORS’ REPORT 2019
Shares, Share Capital and Shareholders
Shares and Share Capital
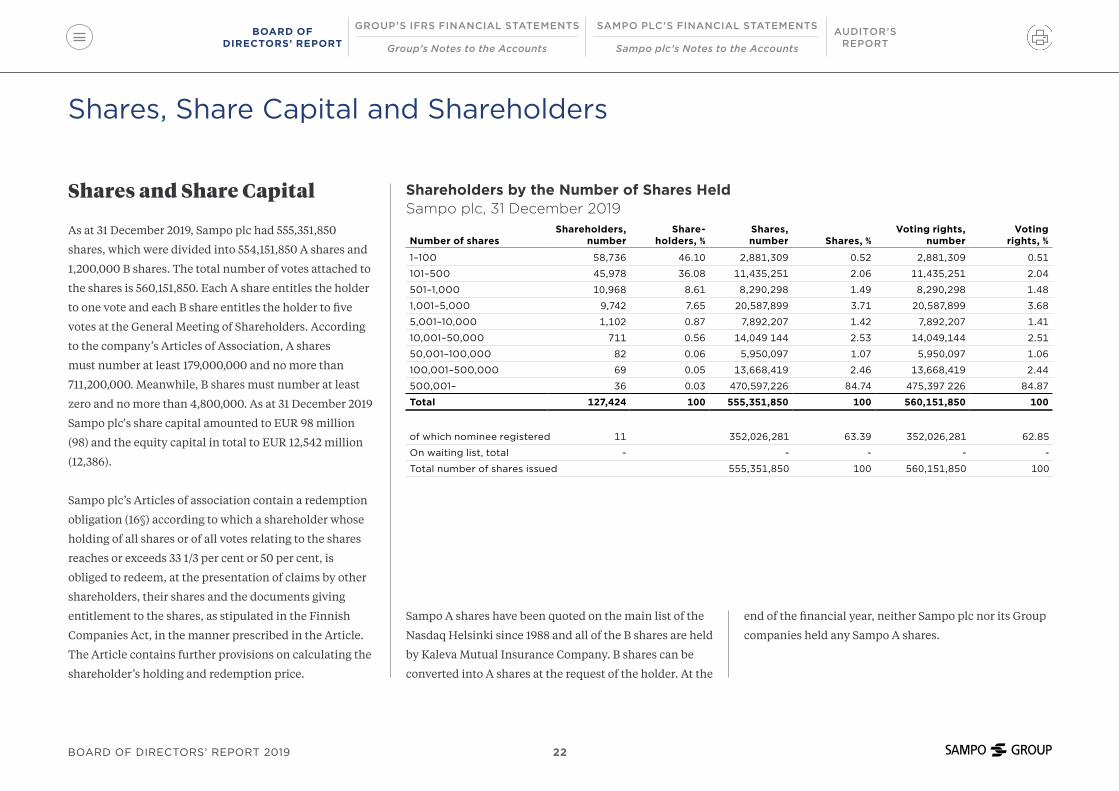
As at 31 December 2019, Sampo plc had 555,351,850
shares, which were divided into 554,151,850 A shares and
1,200,000 B shares. The total number of votes attached to
the shares is 560,151,850. Each A share entitles the holder
to one vote and each B share entitles the holder to five
votes at the General Meeting of Shareholders. According
to the company’s Articles of Association, A shares
must number at least 179,000,000 and no more than
711,200,000. Meanwhile, B shares must number at least
zero and no more than 4,800,000. As at 31 December 2019
Sampo plc's share capital amounted to EUR 98 million
(98) and the equity capital in total to EUR 12,542 million
(12,386).
Sampo plc’s Articles of association contain a redemption
obligation (16§) according to which a shareholder whose
holding of all shares or of all votes relating to the shares
reaches or exceeds 33 1/3 per cent or 50 per cent, is
obliged to redeem, at the presentation of claims by other
shareholders, their shares and the documents giving
entitlement to the shares, as stipulated in the Finnish
Companies Act, in the manner prescribed in the Article.
The Article contains further provisions on calculating the
shareholder’s holding and redemption price.
Shareholders by the Number of Shares HeldSampo plc, 31 December 2019
Number of sharesShareholders,
numberShare -
holders, %Shares, number Shares, %
Voting rights, number
Voting rights, %
1–100 58,736 46.10 2,881,309 0.52 2,881,309 0.51
101–500 45,978 36.08 11,435,251 2.06 11,435,251 2.04
501–1,000 10,968 8.61 8,290,298 1.49 8,290,298 1.48
1,001–5,000 9,742 7.65 20,587,899 3.71 20,587,899 3.68
5,001–10,000 1,102 0.87 7,892,207 1.42 7,892,207 1.41
10,001–50,000 711 0.56 14,049 144 2.53 14,049,144 2.51
50,001–100,000 82 0.06 5,950,097 1.07 5,950,097 1.06
100,001–500,000 69 0.05 13,668,419 2.46 13,668,419 2.44
500,001– 36 0.03 470,597,226 84.74 475,397 226 84.87
Total 127,424 100 555,351,850 100 560,151,850 100
of which nominee registered 11 352,026,281 63.39 352,026,281 62.85
On waiting list, total - - - - -
Total number of shares issued 555,351,850 100 560,151,850 100
Sampo A shares have been quoted on the main list of the
Nasdaq Helsinki since 1988 and all of the B shares are held
by Kaleva Mutual Insurance Company. B shares can be
converted into A shares at the request of the holder. At the
end of the financial year, neither Sampo plc nor its Group
companies held any Sampo A shares.
AUDITOR’S REPORT
SAMPO PLC’S FINANCIAL STATEMENTS
Sampo plc’s Notes to the Accounts
GROUP’S IFRS FINANCIAL STATEMENTS
Group’s Notes to the Accounts
BOARD OFDIRECTORS’ REPORT
22BOARD OF DIRECTORS’ REPORT 2019

Graph 25
2015 2016 2017 2018 2019 2020
Share Price PerformanceSampo plc, 2015–2019
EUR
50
45
40
35
30
25
20
Graph 26
2015 2016 2017 2018 2019 2020
Monthly Trading VolumeSampo plc, 2015–2019
Shares
50,000,000
40,000,000
30,000,000
20,000,000
10,000,000
0
● Volume, Nasdaq Helsinki ● Volume, other market places
AUDITOR’S REPORT
SAMPO PLC’S FINANCIAL STATEMENTS
Sampo plc’s Notes to the Accounts
GROUP’S IFRS FINANCIAL STATEMENTS
Group’s Notes to the Accounts
BOARD OFDIRECTORS’ REPORT
23BOARD OF DIRECTORS’ REPORT 2019
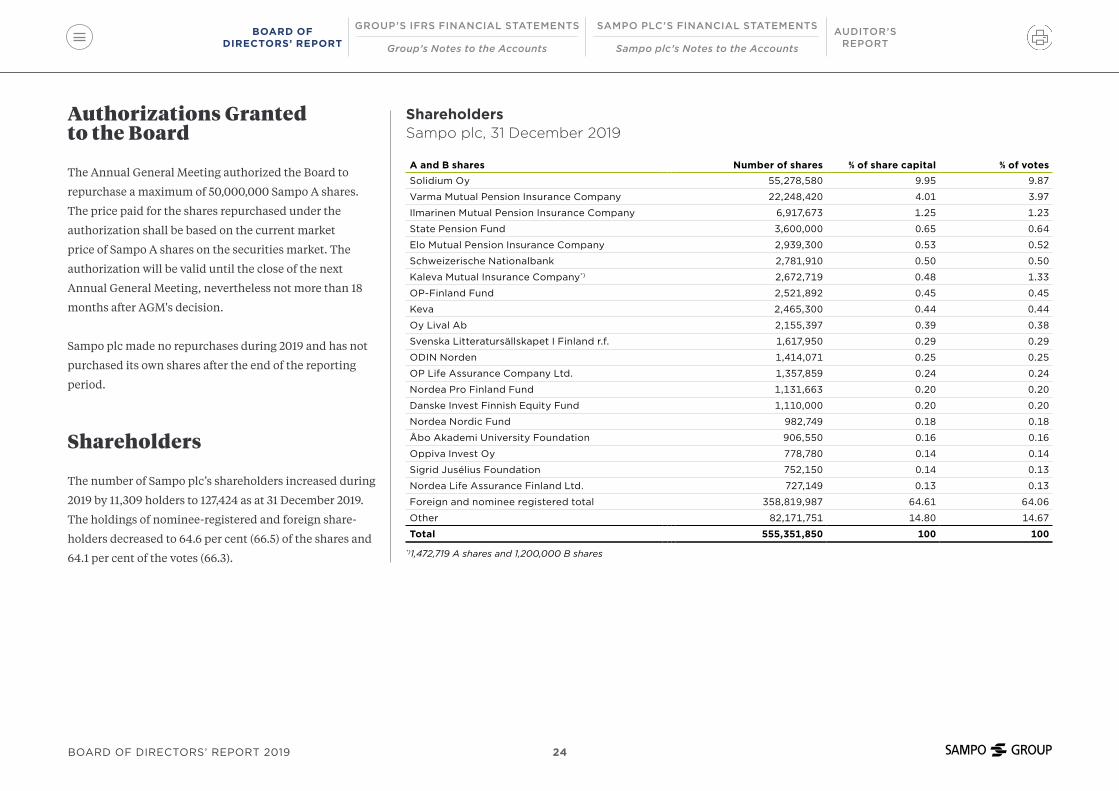
Authorizations Granted to the Board
The Annual General Meeting authorized the Board to
repurchase a maximum of 50,000,000 Sampo A shares.
The price paid for the shares repurchased under the
authorization shall be based on the current market
price of Sampo A shares on the securities market. The
authorization will be valid until the close of the next
Annual General Meeting, nevertheless not more than 18
months after AGM's decision.
Sampo plc made no repurchases during 2019 and has not
purchased its own shares after the end of the reporting
period.
Shareholders
The number of Sampo plc’s shareholders increased during
2019 by 11,309 holders to 127,424 as at 31 December 2019.
The holdings of nominee-registered and foreign share-
holders decreased to 64.6 per cent (66.5) of the shares and
64.1 per cent of the votes (66.3).
ShareholdersSampo plc, 31 December 2019
A and B shares Number of shares % of share capital % of votesSolidium Oy 55,278,580 9.95 9.87
Varma Mutual Pension Insurance Company 22,248,420 4.01 3.97
Ilmarinen Mutual Pension Insurance Company 6,917,673 1.25 1.23
State Pension Fund 3,600,000 0.65 0.64
Elo Mutual Pension Insurance Company 2,939,300 0.53 0.52
Schweizerische Nationalbank 2,781,910 0.50 0.50
Kaleva Mutual Insurance Company*) 2,672,719 0.48 1.33
OP-Finland Fund 2,521,892 0.45 0.45
Keva 2,465,300 0.44 0.44
Oy Lival Ab 2,155,397 0.39 0.38
Svenska Litteratursällskapet I Finland r.f. 1,617,950 0.29 0.29
ODIN Norden 1,414,071 0.25 0.25
OP Life Assurance Company Ltd. 1,357,859 0.24 0.24
Nordea Pro Finland Fund 1,131,663 0.20 0.20
Danske Invest Finnish Equity Fund 1,110,000 0.20 0.20
Nordea Nordic Fund 982,749 0.18 0.18
Åbo Akademi University Foundation 906,550 0.16 0.16
Oppiva Invest Oy 778,780 0.14 0.14
Sigrid Jusélius Foundation 752,150 0.14 0.13
Nordea Life Assurance Finland Ltd. 727,149 0.13 0.13
Foreign and nominee registered total 358,819,987 64.61 64.06
Other 82,171,751 14.80 14.67
Total 555,351,850 100 100
*)1,472,719 A shares and 1,200,000 B shares
AUDITOR’S REPORT
SAMPO PLC’S FINANCIAL STATEMENTS
Sampo plc’s Notes to the Accounts
GROUP’S IFRS FINANCIAL STATEMENTS
Group’s Notes to the Accounts
BOARD OFDIRECTORS’ REPORT
24BOARD OF DIRECTORS’ REPORT 2019

Shareholders by SectorSampo plc (A and B shares), 31 December 2019
Sector Number of shares %Corporations 68,476,008 12.33
Financial institutions and insurance corporations 19,681,305 3.54
Public institutions 39,312,155 7.08
Non-profit institutions 12,385,832 2.23
Households 56,676,563 10.21
Foreign ownership and nominee registered 358,819,987 64.61
Total 555,351,850 100
During 2019 Sampo plc received one notification of a
change in holding pursuant to Chapter 9, Section 5 of
the Securities Markets Act, according to which the total
number of Sampo A shares and voting rights owned by
Solidium Oy decreased on 2 April 2019 below ten (10) per
cent of Sampo plc's entire stock and voting rights. After
the notification Solidium holds 9.95 per cent of Sampo’s
shares and 9.87 per cent of the voting right.
The details of the notifications are available at
www.sampo.com/flaggings.
AUDITOR’S REPORT
SAMPO PLC’S FINANCIAL STATEMENTS
Sampo plc’s Notes to the Accounts
GROUP’S IFRS FINANCIAL STATEMENTS
Group’s Notes to the Accounts
BOARD OFDIRECTORS’ REPORT
25BOARD OF DIRECTORS’ REPORT 2019

Shares Owned by the Board of Directors and the Group Executive CommitteeSampo plc, 31 December 2019 and 31 December 2018
Board of Directors 31 Dec 2019 31 Dec 2018Wahlroos 4,946,969 6,633,436
Fagerholm 4,701 3,598
Clausen 2,129 1,479
Clutterbuck 753 0
Lamminen 711 0
Mattila 6,870 6,203
Murto 2,595 1,922
Mäkinen 5,131 4,464
Total 4,969,859 6,651,102
Board of Directors ownership of shares, % 0.9 1.2
Board of Directors share of votes, % 0.9 1.2
Group Executive Committee 31 Dec 2019 31 Dec 2018Stadigh 317,514 302,429
Magnusson 46,460 39,842
Alsaker 33,844 30,219
Janbu Holthe 0 0
Lapveteläinen 254,549 250,033
Martinsen 54,060 50,455
Niemisvirta 86,879 82,270
Thorsrud 55,524 51,591
Wennerklint 39,714 35,743
Total 888,544 842,582
Group Executive Committee's ownership of shares, % 0.2 0.2
Group Executive Committee's share of votes, % 0.2 0.2
Holdings of the Board and Executive Management
The following table presents the Board’s and Group
Executive Committee’s holdings of Sampo A shares. At the
end of 2019, members of Sampo plc’s Board of Directors
and their close family members owned either directly
or indirectly 4,969,859 (6,651,102) Sampo A shares. Their
combined holdings constituted 0.9 per cent (1.2) of the
share capital and related votes.
Members of the Group Executive Committee and their
spouses owned either directly or indirectly 888,544
(842,582) Sampo A shares representing 0.2 per cent (0.2) of
the share capital and related votes.
AUDITOR’S REPORT
SAMPO PLC’S FINANCIAL STATEMENTS
Sampo plc’s Notes to the Accounts
GROUP’S IFRS FINANCIAL STATEMENTS
Group’s Notes to the Accounts
BOARD OFDIRECTORS’ REPORT
26BOARD OF DIRECTORS’ REPORT 2019
Financial Standing
Extra Dividend in the Form of Nordea Shares
Sampo plc’s Board of Directors announced on 13 June
2019 that it plans to distribute an extra dividend in
the form of Nordea Bank Abp shares. The distribution
was decided upon on 7 August 2019. Each shareholder
received 1 Nordea share for each 10 Sampo shares.
Fractional entitlements to Nordea shares resulting from
the distribution ratio were not distributed in the form of
shares, but an equivalent amount was compensated to
shareholders in cash. The amount of Nordea Bank Abp
shares distributed amounted to 55,517,639 shares and
the value of the share dividend, based on the volume
weighted average price of Nordea on 12 August 2019, was
EUR 5.661. The ex-dividend date was 8 August 2019 and
the record date 9 August 2019. The payment date was
12 August 2019 for the share dividend and 16 August 2019
for the cash compensation.
In Finland, a share dividend is taxed similarly as cash
dividend. Sampo paid the Finnish transfer tax of 1.6 per
cent resulting from the distribution of the share dividend
on behalf of shareholders. As a result of the distribution
of the extra dividend, Sampo’s ownership in Nordea
decreased below 20 per cent. Going forward, the Group’s
solvency is only calculated by the Solvency II rules and
Nordea is treated as a normal equity investment.
Internal Dividends
Sampo plc, Sampo Group’s parent company, received
more than EUR 1.5 billion in dividends from its subsidi-
aries and associated company Nordea during 2019. The
following dividend payments were received:
• Mandatum Life; EUR 150 million in March 2019,
• Nordea; EUR 594 million in April 2019,
• Topdanmark; EUR 84 million in April 2019 and
• If; SEK 7.5 billion (EUR 710 million) in December 2019
Nordea targets a dividend of EUR 0.40 per share for 2019.
Sampo plc’s share amounts to EUR 322 million if approved
by the AGM on 25 March 2020.
Topdanmark’s Board of Directors proposed to the Annual
General Meeting of 2 April 2020 a dividend of DKK 17 per
share. If the AGM approves the proposal, Sampo’s share
of the Topdanmark’s total dividend amounts to EUR 96
million.
Mandatum Life’s Board proposes a dividend of EUR 150
million to be paid to Sampo plc in the first quarter of
2020. If normally pays its dividend towards the end of the
calendar year.
AUDITOR’S REPORT
SAMPO PLC’S FINANCIAL STATEMENTS
Sampo plc’s Notes to the Accounts
GROUP’S IFRS FINANCIAL STATEMENTS
Group’s Notes to the Accounts
BOARD OFDIRECTORS’ REPORT
27BOARD OF DIRECTORS’ REPORT 2019

Ratings
Relevant ratings for Sampo Group companies on
31 December 2019 are presented in the table below.
Solvency
Sampo’s capital requirement on Nordea holding increased
more than EUR 800 million during the first half of 2019
although the underlying risks for Sampo’s holding in
Nordea did not change. Sampo took active measures to
counter the negative impact by issuing EUR 500 million
of hybrid capital in May 2019. More importantly, the Board
received from the AGM in April 2019 an authorization
to distribute an extra dividend either in cash and/or in
financial instruments held by Sampo plc and announced
on 13 June 2019 that it planned to resolve on the distribu-
tion of an extra dividend in the form of Nordea shares in its
meeting scheduled 7 August 2019.
On 7 August 2019 Sampo Board made the formal decision
to distribute a total of 55,517,639 shares of Nordea Bank
Moody’s Standard & Poor’sRated company Rating Outlook Rating Outlook Sampo plc – Issuer Credit Rating A3 Stable A Stable
If P&C Insurance Ltd – Insurance Financial Strength Rating A1 Stable A+ Stable
If P&C Insurance Holding Ltd (publ) - Issuer Credit Rating - - A Stable
Mandatum Life Insurance Company Ltd – Issuer Credit Rating - - A+ Stable
Abp as an extra dividend (See section Extra dividend in the
form of Nordea shares). As a result of the dividend, Sampo’s
ownership in Nordea decreased below 20 per cent.
Hence, the conglomerate rules (FICO) solvency calculation
was terminated by a formal approval by the Finnish
FSA received on 21 October 2019. After the approval
Sampo Group calculates its group solvency only under
the Solvency II rules and Nordea is treated as an equity
investment. Sampo Group’s solvency ratio according to the
Solvency II directive amounted to 167 per cent (140) at the
end of December 2019. The proposed dividend has been
deducted from own funds in the Solvency II calculation.
The consolidation of Nordea as an associated company in
Sampo Group’s Financial Statements (IFRS) will remain
unchanged.
Solvency Position in the Subsidiaries
The insurance subsidiaries apply Solvency II rules in their
regulatory solvency calculations. If Group companies
use either partial internal models or standard model for
calculation of their solo solvency position. Mandatum Life
reports in accordance with standard formula for Solvency
II. Topdanmark uses a partial internal model to report its
stand-alone solvency position.
If Group has an A+ rating from S&P which will continue
to require significantly more capital than the standard
formula and therefore the use of standard formula has
no practical implications on If Group’s capital position.
On 31 December 2019 If Group’s Solvency II capital
requirement under standard formula amounted to EUR
1,890 million (1,833) and own funds to EUR 3,592 million
(3,599). The solvency ratio amounted to 190 per cent (196).
The S&P A+ rating capital requirement for If Group
amounted to EUR 3,083 million (2,949) on 31 December
2019 and the capital base was EUR 3,151 million (3,149).
Topdanmark calculates most of its non-life and health
risks and their respective solvency capital requirement
by a partial internal model approved by the DFSA. Other
risks are calculated by Solvency II SCR standard formula.
Topdanmark’s solvency ratio under the partial internal
model was 177 per cent (196) at the end of December 2019.
AUDITOR’S REPORT
SAMPO PLC’S FINANCIAL STATEMENTS
Sampo plc’s Notes to the Accounts
GROUP’S IFRS FINANCIAL STATEMENTS
Group’s Notes to the Accounts
BOARD OFDIRECTORS’ REPORT
28BOARD OF DIRECTORS’ REPORT 2019

Mandatum Life’s solvency ratio after transitional
measures amounted to 176 per cent (176) on 31 December
2019. Own funds were EUR 2,117 million (1,740) and
Solvency Capital Requirement (SCR) was EUR 1,204
million (990). The increase in own funds is mainly due
to the Tier 2 issue of EUR 250 million in September 2019
and the positive equity market development during the
reporting year. SCR grew because of increased market
risk due to positive equity market development, a change
in the symmetrical adjustment and changes in contract
boundary interpretations applied in calculating technical
provisions. Without transitional measures, own funds
would have amounted to EUR 1,756 million (1,348) and the
solvency capital requirement to EUR 1,234 million (1,030)
leading to a solvency ratio of 142 per cent (131).
More information on Sampo Group’s capital policy is
available in the Risk Management Report 2019 at
www.sampo.com/year2019.
Debt Financing
Sampo plc’s debt financing on 31 December 2019
amounted to EUR 3,908 million (4,067) and interest
bearing assets to EUR 1,725 million (1,959). Interest
bearing assets include bank accounts, fixed income
instruments and EUR 359 million (489) of hybrid
capital and subordinated debt instruments issued by the
subsidiaries and associated companies.
At the end of 2019 the interest bearing net debt of Sampo
plc amounted to EUR 2,183 million (2,108). The net debt
calculation takes into account interest bearing assets and
liabilities. Gross debt to Sampo plc’s equity was 51 per cent
(52) and financial leverage 34 per cent (34).
On 23 May 2019 Sampo plc issued 30NC10 Fixed/Floating
rate subordinated notes of EUR 500 million due 23 May
2049.
On 24 May 2019 Sampo plc repaid EUR 500 million senior
notes maturing on that date.
On 26 September 2019 Mandatum Life issued 30NC5 Tier
2 notes of EUR 250 million due 4 October 2049.
On 31 December 2019 financial liabilities in Sampo plc’s
balance sheet consisted of issued senior bonds and notes
of EUR 3,414 million (3,943). In addition Sampo plc has
issued subordinated notes of EUR 494 million. No CPs
were outstanding (124). The average interest, net of
interest rate swaps, on Sampo plc’s debt as of 31 December
2019 was 1.2 per cent (0.8).
More information on Sampo Group’s outstanding debt
issues is available at www.sampo.com/debtfinancing.
Outstanding Debt instrumentsSampo plc, 31 December 2019
Instrument & Nominal Coupon Swap Effective Rate Maturity
Senior Bond 2,000 SEKm Stibor3M + 0.77% Euribor3M + 0.59% 0.19% 28 May 2020
Senior Bond 1,000 SEKm 1.25% EUR 1.01% 1.01% 28 May 2020
Senior Bond 500 EURm 1.50% --- 1.59% 16 September 2021
Senior Bond 700 SEKm 0.88% Euribor6M + 0.38% 0.04% 23 May 2022
Senior Bond 1,300 SEKm Stibor3M + 0.55% Euribor6M + 0.39% 0.05% 23 May 2022
Senior Bond 750 EURm 1.000% --- 1.01% 18 September 2023
Senior Bond 500 EURm 1.250% Euribor6M + 0.74% 0.39% 20 May 2025
Senior Bond 500 EURm 1.625% 0.85% 21 February 2028
Senior Bond under separate documentation 1,000 NOKm 3.100% Euribor6M + 0.77% 0.34% 7 September 2028
Hybrid Tier2 Bond 500 EURm 3.375% --- 3.48% 23 May 2029
Senior Bond 500 EURm 2.25% --- 1.49% 27 September 2030
Public debt, 3,830 EURm 1.3%
Private placements 100 EURm 0.76%
Total 3,930 EURm 1.2%
AUDITOR’S REPORT
SAMPO PLC’S FINANCIAL STATEMENTS
Sampo plc’s Notes to the Accounts
GROUP’S IFRS FINANCIAL STATEMENTS
Group’s Notes to the Accounts
BOARD OFDIRECTORS’ REPORT
29BOARD OF DIRECTORS’ REPORT 2019

To balance the risks on the Group level Sampo plc’s debt
is mainly tied to short-term interest rates and issued in
euro or Swedish krona. Interest rate swaps are used to
obtain the desired characteristics for the debt portfolio.
These derivatives are valued at fair value in the profit and
loss account although economically they are related the
underlying bonds. As a result Sampo plc maintains the
arrange financing for strategic projects if needed. Strong
liquidity and the ability to acquire financing are essential
factors in maintaining Sampo Group’s strategic flexibility.
flexibility to adjust theth derivative position if needed
but this comes at the cost of increased volatility in the
Holding segment’s net finance costs.
The underlying objective of Sampo plc is to maintain a
well-diversified debt structure, relatively low leverage
and strong liquidity in order for the company to be able to
AUDITOR’S REPORT
SAMPO PLC’S FINANCIAL STATEMENTS
Sampo plc’s Notes to the Accounts
GROUP’S IFRS FINANCIAL STATEMENTS
Group’s Notes to the Accounts
BOARD OFDIRECTORS’ REPORT
30BOARD OF DIRECTORS’ REPORT 2019

Outlook
Outlook for 2020
Sampo Group’s business areas are expected to report good
operating results for 2020.
However, the marked-to-market results are, particularly
in life insurance, highly dependent on capital market
developments. The continuing low interest rate level also
creates a challenging environment for reinvestment in
fixed income instruments.
If P&C is expected to reach a combined ratio of 85 – 89 per
cent in 2020.
With regard to Topdanmark reference is made to the profit
forecast model that the company publishes quarterly.
Nordea’s contribution to the Group’s profit is expected to
be significant.
The Major Risks and Uncertainties to the Group in the Near-Term
In its current day-to-day business activities Sampo Group
is exposed to various risks and uncertainties mainly
through its separately managed major business units.
Major risks affecting the Group companies’ profitability
and its variation are market, credit, insurance and
operational risks that are quantified independently by the
major business units. At the group level sources of risks
are the same, but they are not directly additive because of
diversification effects.
Uncertainties in the form of major unforeseen events may
have an immediate impact on the Group’s profitability.
Identification of unforeseen events is easier than estima-
tion of their probabilities, timing and potential outcomes.
Currently there are a number of widely identified macro-
economic, political and other sources of uncertainty
which can, in various ways, affect the financial services
industry negatively. In particular the political risks are at
an elevated level at the moment.
Other sources of uncertainty are unforeseen structural
changes in the business environment and already
identified trends and potential wide-impact events.
These external drivers may have long-term impacts on
how business shall be conducted. Examples of already
identified trends are technological development in areas
such as artificial intelligence and digitalization, demo-
graphic changes and sustainability issues that may have
profound effects on financial sector companies as well.
AUDITOR’S REPORT
SAMPO PLC’S FINANCIAL STATEMENTS
Sampo plc’s Notes to the Accounts
GROUP’S IFRS FINANCIAL STATEMENTS
Group’s Notes to the Accounts
BOARD OFDIRECTORS’ REPORT
31BOARD OF DIRECTORS’ REPORT 2019

Dividends
The New Dividend Policy
Sampo has for several years had the ambition of annually
increasing its nominal dividend per share. On 24 October
2019 Sampo management, however, concluded that in
the present operating environment and with government
bond yields expected to remain negative for some time to
come, an increase in the dividend would not best serve
the company or its shareholders. This view was further
reinforced by a change in Nordea’s dividend policy
announced earlier on the same day.
Sampo plc’s Board of Directors has on 6 February 2020
approved a new dividend policy according to which
total annual dividends paid will be at least 70 per cent of
Group's net profit for the year (excluding extraordinary
items). In addition share buy-backs can be used to
complement the cash dividend.
Dividend Proposal
The parent company’s distributable capital and reserves
totalled EUR 7,383,547,646.18 of which profit for the
financial year was EUR 1,489,678,098.42.
The Board proposes to the Annual General Meeting a
dividend of EUR 2.20 per share to company’s 555,351,850
shares. The dividends to be paid are EUR 1,221,774,070.00
in total. The remainder of funds are left in the equity
capital.
The dividend will be paid to shareholders registered in the
Register of Shareholders held by Euroclear Finland Ltd
as at the record date of 27 April 2020. The Board proposes
that the dividend be paid on 5 May 2020.
No significant changes have taken place in the company’s
financial position since the end of the financial year. The
company’s liquidity position is good and in the view of
the Board, the proposed distribution does not jeopardize
the company’s ability to fulfill its obligations.
SAMPO PLC
Board of Directors
AUDITOR’S REPORT
SAMPO PLC’S FINANCIAL STATEMENTS
Sampo plc’s Notes to the Accounts
GROUP’S IFRS FINANCIAL STATEMENTS
Group’s Notes to the Accounts
BOARD OFDIRECTORS’ REPORT
32BOARD OF DIRECTORS’ REPORT 2019
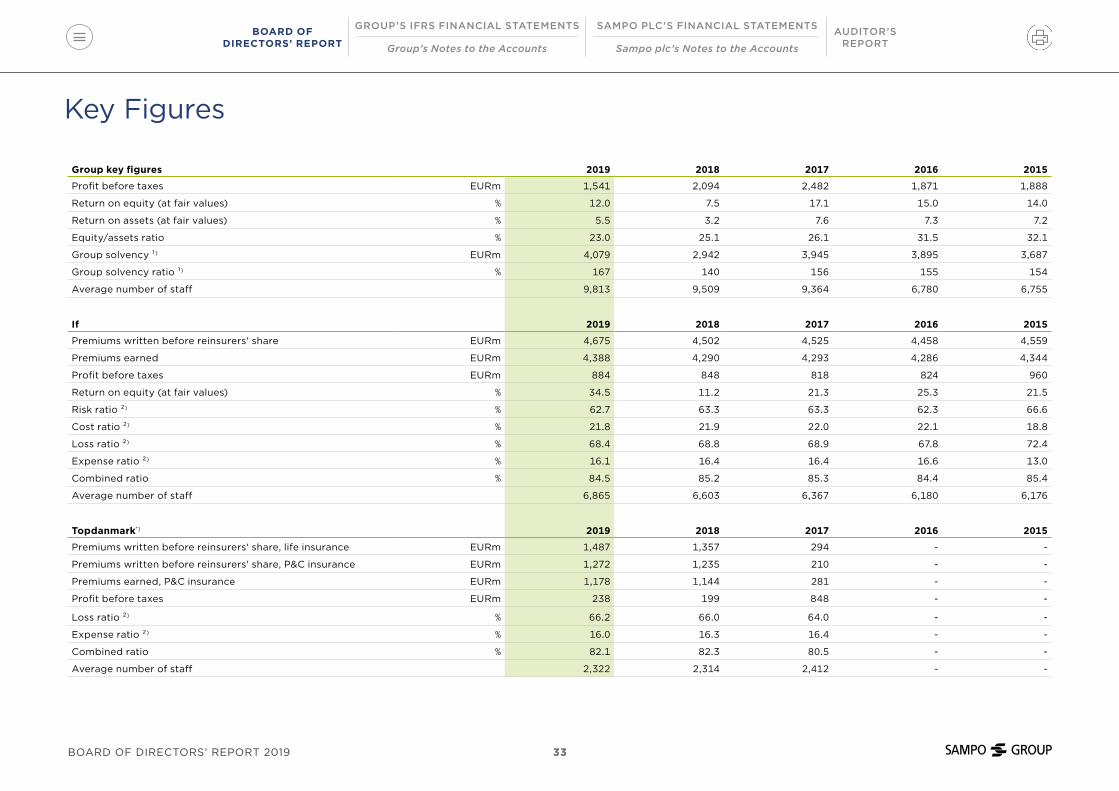
Key Figures
Group key figures 2019 2018 2017 2016 2015
Profit before taxes EURm 1,541 2,094 2,482 1,871 1,888
Return on equity (at fair values) % 12.0 7.5 17.1 15.0 14.0
Return on assets (at fair values) % 5.5 3.2 7.6 7.3 7.2
Equity/assets ratio % 23.0 25.1 26.1 31.5 32.1
Group solvency ¹) EURm 4,079 2,942 3,945 3,895 3,687
Group solvency ratio ¹) % 167 140 156 155 154
Average number of staff 9,813 9,509 9,364 6,780 6,755
If 2019 2018 2017 2016 2015
Premiums written before reinsurers' share EURm 4,675 4,502 4,525 4,458 4,559
Premiums earned EURm 4,388 4,290 4,293 4,286 4,344
Profit before taxes EURm 884 848 818 824 960
Return on equity (at fair values) % 34.5 11.2 21.3 25.3 21.5
Risk ratio ²) % 62.7 63.3 63.3 62.3 66.6
Cost ratio ²) % 21.8 21.9 22.0 22.1 18.8
Loss ratio ²) % 68.4 68.8 68.9 67.8 72.4
Expense ratio ²) % 16.1 16.4 16.4 16.6 13.0
Combined ratio % 84.5 85.2 85.3 84.4 85.4
Average number of staff 6,865 6,603 6,367 6,180 6,176
Topdanmark*) 2019 2018 2017 2016 2015
Premiums written before reinsurers' share, life insurance EURm 1,487 1,357 294 - -
Premiums written before reinsurers' share, P&C insurance EURm 1,272 1,235 210 - -
Premiums earned, P&C insurance EURm 1,178 1,144 281 - -
Profit before taxes EURm 238 199 848 - -
Loss ratio ²) % 66.2 66.0 64.0 - -
Expense ratio ²) % 16.0 16.3 16.4 - -
Combined ratio % 82.1 82.3 80.5 - -
Average number of staff 2,322 2,314 2,412 - -
AUDITOR’S REPORT
SAMPO PLC’S FINANCIAL STATEMENTS
Sampo plc’s Notes to the Accounts
GROUP’S IFRS FINANCIAL STATEMENTS
Group’s Notes to the Accounts
BOARD OFDIRECTORS’ REPORT
33BOARD OF DIRECTORS’ REPORT 2019

Mandatum 2019 2018 2017 2016 2015
Premiums written before reinsurers' share EURm 1,603 1,082 967 1,122 1,149
Profit before taxes EURm 280 450 236 210 181
Return on equity (at fair values) % 23.5 8.7 13.3 15.9 12.7
Expense ratio % 98.7 92.1 94.7 100.5 100.0
Average number of staff 563 531 525 543 522
Holding 2019 2018 2017 2016 2015
Profit before taxes EURm 139 618 576 778 749
Average number of staff 63 61 60 57 57
Per share key figures 2019 2018 2017 2016 2015
Earnings per share EUR 2.04 3.04 3.96 2.95 2.96
Earnings per share, incl. items in other comprehensive income EUR 2.63 1.70 3.79 3.14 2.79
Equity per share EUR 21.44 22.30 23.14 21.31 20.38
Net asset value per share EUR 20.71 20.60 25.37 24.86 23.79
Dividend per share ³) EUR 2.20 2.85 2.60 2.30 2.15
Dividend per earnings % 107.8 93.8 65.7 78.0 72.6
Effective dividend yield % 5.7 7.4 5.7 5.4 4.6
Price/earnings ratio 19.1 12.6 11.6 14.4 15.9
Adjusted number of shares at 31 Dec 1,000 555,352 555,352 555,352 560,000 560,000
Average adjusted number of shares 1,000 555,352 555,352 559,873 560,000 560,000
Weighted average number of shares, incl. dilutive potential shares 1,000 555,352 555,352 559,873 560,000 560,000
Market capitalisation EURm 21,609 21,331 24,858 23,850 26,320
AUDITOR’S REPORT
SAMPO PLC’S FINANCIAL STATEMENTS
Sampo plc’s Notes to the Accounts
GROUP’S IFRS FINANCIAL STATEMENTS
Group’s Notes to the Accounts
BOARD OFDIRECTORS’ REPORT
34BOARD OF DIRECTORS’ REPORT 2019

A shares 2019 2018 2017 2016 2015
Adjusted number of shares at 31 Dec 1,000 554,152 554,152 554,152 558,800 558,800
Average adjusted number of shares 1,000 554,152 554,152 554,152 558,800 558,800
Weighted average number of shares, incl. dilutive potential shares 1,000 554,152 554,152 554,152 558,800 558,800
Weighted average share price EUR 39.15 43.11 44.76 40.35 44.34
Adjusted share price, high EUR 43.38 48.92 47.46 46.56 49.40
Adjusted share price, low EUR 34.45 37.61 41.53 34.42 37.72
Adjusted closing price EUR 38.91 38.41 45.80 42.59 47.00
Share trading volume during the financial year 1,000 250,282 239,051 179,568 203,996 182,762
Relative share trading volume % 45.2 43.1 32.4 36.5 32.7
B shares 2019 2018 2017 2016 2015
Adjusted number of shares at 31 Dec 1,000 1,200 1,200 1,200 1,200 1,200
Average adjusted number of shares 1,000 1,200 1,200 1,200 1,200 1,200
*) In the comparison year 2017 Topdanmark was consolidated as an associate between January - September 2017. The key figures are from October - December 2017 when the company was first consolidated as a subsidiary.
1) From 2016 on, the group solvency for Sampo has been calculated according to the consolidation method defined in the Solvency II Directive (2009/138/EC) and the Finnish Insurance Companies Act (521/2008). As Sampo plc is the ultimate parent of the Solvency II group, the solvency is calculated at the group level.
2) Key figures for P&C insurance are based on activity based costs and cannot, therefore, be calculated directly from the consolidated income statement. 3) The Board of Director's proposal to the Annual General Meeting for the accounting period 2019.
In calculating the key figures the tax corresponding to the result for the accounting period has been taken into account. The valuation differences, adjusted with the deferred tax liability, on the investment property have been taken into account in return on assets, return on equity, equity/assets ratio and net asset value per share. Additionally, the items in the other comprehensive income have been taken into account in return on assets and return on equity. In the net asset value per share, the Group valuation difference on associate Nordea and listed subsidiary Topdanmark have also been taken into account.
AUDITOR’S REPORT
SAMPO PLC’S FINANCIAL STATEMENTS
Sampo plc’s Notes to the Accounts
GROUP’S IFRS FINANCIAL STATEMENTS
Group’s Notes to the Accounts
BOARD OFDIRECTORS’ REPORT
35BOARD OF DIRECTORS’ REPORT 2019

Calculation of the Key Figures
The key figures have been calculated in accordance with the decree issued by the Ministry of Finance and the specifying regulations and instructions of the Financial Supervisory Authority. The Group solvency has been calculated according to the consolidation method defined in Chapter 3 of the Act on the Supervision of Financial and Insurance Conglomerates.
Group Key Figures
Profit before taxesProperty & casualty insurance profit before taxes + life insurance profit before taxes + holding business profit before taxes ± Group elimination items with result impact
Property & casualty and life insurance+ insurance premiums written+ net income from investments+ other operating income- claims incurred- change in liabilities for investment and insurance contracts- staff costs- other operating expenses- finance costs+/- share of associates’ profit/loss
Holding+ net income from investments+ other operating income- staff costs- other operating expenses- finance costs+/- share of associates’ profit/loss
Return on equity (at fair values), % + total comprehensive income attributable to
parent company equity holders
± change in valuation differences on investments less deferred tax
X 100% + total equity attributable to parent company
equity holders (average of values on 1 Jan. and 31 Dec.)
± valuation differences on investments less deferred tax (average of values on 1 Jan. and 31 Dec.)
Return on assets (at fair values), %+ operating profit
± other comprehensive income before taxes
- profit attributable to non-controlling interests
+ interest and other financial expense
+ calculated interest on technical provisions
± change in valuation differences on investments X 100%
+ total balance sheet (average of values on 1 Jan. and 31 Dec.)
- technical provisions relating to unit-linked insurance (average of values on 1 Jan. and 31 Dec.)
± valuation differences on investments (average of values on 1 Jan. and 31 Dec.)
Equity/assets ratio (at fair values), %+ total equity
(attributable to parent company’s equity holders)
± valuation differences on investments less deferred tax
X 100%+ balance sheet total
± valuation differences on investments
Average number of staffAverage of month-end figures, adjusted for part-time staff
AUDITOR’S REPORT
SAMPO PLC’S FINANCIAL STATEMENTS
Sampo plc’s Notes to the Accounts
GROUP’S IFRS FINANCIAL STATEMENTS
Group’s Notes to the Accounts
BOARD OFDIRECTORS’ REPORT
36BOARD OF DIRECTORS’ REPORT 2019

Property & Casualty Insurance Key Figures
Life Insurance Key Figures
Per Share Key Figures
Risk ratio, %+ claims incurred
– claims settlement expensesX 100%
premiums earned
Expense ratio + operating expenses before change in deferred
acquisition costs
+ claims settlement expensesX 100%
expense charges
Earnings per shareprofit for the financial period attributable to the parent company’s equity holders
adjusted average number of shares
Equity per shareequity attributable to the parent company ‘s equity holders
adjusted number of shares at balance sheet date
Earnings per share, incl. change in fair value reservetotal comprehensive income for the financial period attributable to the parent company’s equity holders
adjusted average number of shares
Relative share trading volume, %number of shares traded through the Helsinki Exchanges
X 100%adjusted average number of shares
Dividend per share, %dividend for the accounting period
X 100%adjusted number of shares at balance sheet date
Dividend per earnings, %dividend per share
X 100%earnings per share
Effective dividend yield, %dividend per share
X 100%adjusted closing share price at balance sheet date
Price/earnings ratioadjusted closing share price at balance sheet date
earnings per share
Net asset value per share+ equity attributable to the parent company’s
equity holders
± valuation differences on listed associate in the Group
± valuation differences on investments less deferred tax
X 100%adjusted number of shares at balance sheet date
Loss ratio excl. unwinding of discount, % claims incurred before unwinding of discount
X 100%premiums earned
Expense ratio, %operating expenses
X 100%premiums earned
Cost ratio, %+ operating expenses
+ claims settlement expensesX 100%
premiums earned
Combined ratio excl. unwinding of discount, %Loss ratio before unwinding of discount + expense ratio
Market capitalisationnumber of shares at balance sheet date x closing share price at balance sheet date
AUDITOR’S REPORT
SAMPO PLC’S FINANCIAL STATEMENTS
Sampo plc’s Notes to the Accounts
GROUP’S IFRS FINANCIAL STATEMENTS
Group’s Notes to the Accounts
BOARD OFDIRECTORS’ REPORT
37BOARD OF DIRECTORS’ REPORT 2019

GROUP’S IFRS FINANCIAL STATEMENTS
39Statement of Profit and Other Comprehensive
Income, IFRS
40Consolidated Balance
Sheet, IFRS
42Statement of Cash Flows,
IFRS
41Statement of
Changes in Equity, IFRS
BOARD OFDIRECTORS’ REPORT
AUDITOR’S REPORT
SAMPO PLC’S FINANCIAL STATEMENTS
Sampo plc’s Notes to the AccountsGroup’s Notes to the Accounts
GROUP’S IFRS FINANCIAL STATEMENTS
38FINANCIAL STATEMENTS 2019
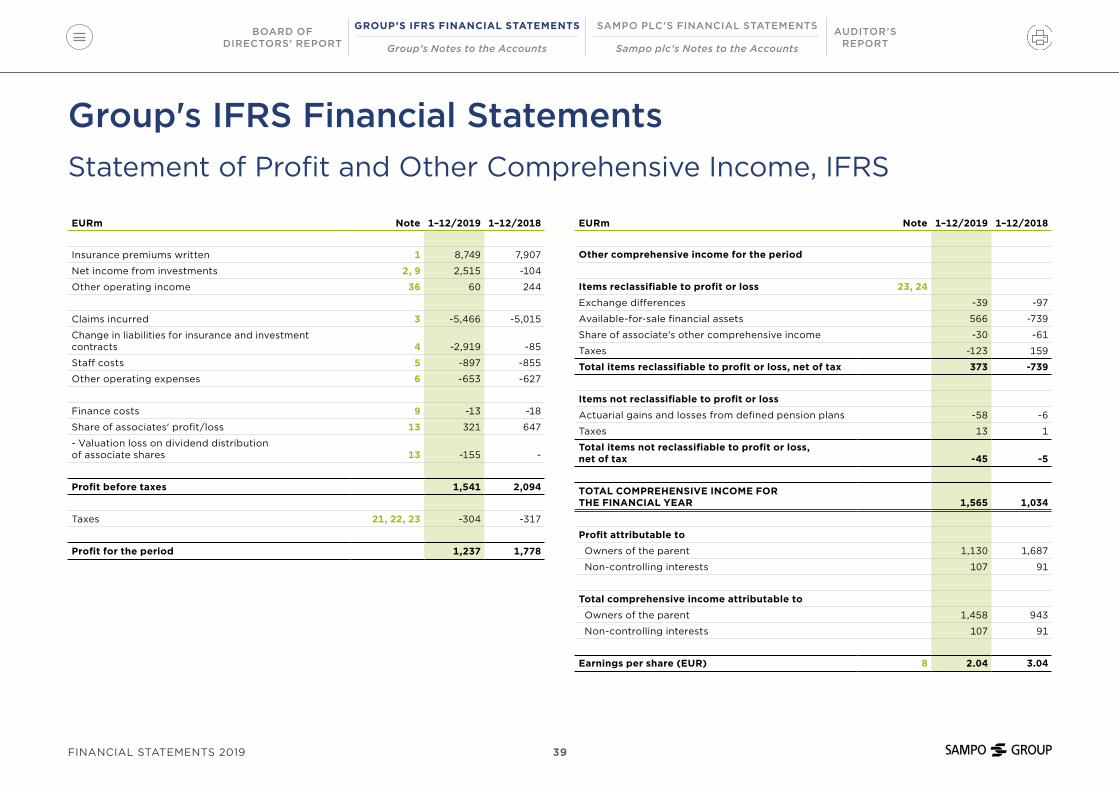
Group's IFRS Financial StatementsStatement of Profit and Other Comprehensive Income, IFRS
EURm Note 1–12/2019 1–12/2018
Other comprehensive income for the period
Items reclassifiable to profit or loss 23, 24
Exchange differences -39 -97
Available-for-sale financial assets 566 -739
Share of associate's other comprehensive income -30 -61
Taxes -123 159
Total items reclassifiable to profit or loss, net of tax 373 -739
Items not reclassifiable to profit or loss
Actuarial gains and losses from defined pension plans -58 -6
Taxes 13 1
Total items not reclassifiable to profit or loss, net of tax -45 -5
TOTAL COMPREHENSIVE INCOME FOR THE FINANCIAL YEAR 1,565 1,034
Profit attributable to
Owners of the parent 1,130 1,687
Non-controlling interests 107 91
Total comprehensive income attributable to
Owners of the parent 1,458 943
Non-controlling interests 107 91
Earnings per share (EUR) 8 2.04 3.04
EURm Note 1–12/2019 1–12/2018
Insurance premiums written 1 8,749 7,907
Net income from investments 2, 9 2,515 -104
Other operating income 36 60 244
Claims incurred 3 -5,466 -5,015
Change in liabilities for insurance and investment contracts 4 -2,919 -85
Staff costs 5 -897 -855
Other operating expenses 6 -653 -627
Finance costs 9 -13 -18
Share of associates' profit/loss 13 321 647
- Valuation loss on dividend distribution of associate shares 13 -155 -
Profit before taxes 1,541 2,094
Taxes 21, 22, 23 -304 -317
Profit for the period 1,237 1,778
BOARD OFDIRECTORS’ REPORT
AUDITOR’S REPORT
SAMPO PLC’S FINANCIAL STATEMENTS
Sampo plc’s Notes to the AccountsGroup’s Notes to the Accounts
GROUP’S IFRS FINANCIAL STATEMENTS
39FINANCIAL STATEMENTS 2019

EURm Note 12/2019 12/2018
Equity
Share capital 98 98
Reserves 1,530 1,530
Retained earnings 10,062 10,944
Other components of equity 217 -186
Equity attributable to owners of the parent 11,908 12,386
Non-controlling interests 635 628
Total equity 12,542 13,014
Total equity and liabilities 51,939 49,340
Consolidated Balance Sheet, IFRS
EURm Note 12/2019 12/2018
Assets
Property, plant and equipment 10 302 162
Investment property 11 679 665
Intangible assets 12 2,151 2,143
Investments in associates 13 7,217 8,065
Financial assets 9, 14, 15, 16, 17, 18, 19 23,443 22,693
Investments related to unit-linked insurance contracts 20 12,975 10,671
Tax assets 21 19 24
Reinsurers' share of insurance liabilities 26 289 294
Other assets 25 2,185 2,263
Cash and cash equivalents 2,677 2,361
Total assets 51,939 49,340
Liabilities
Liabilities for insurance and investment contracts 26 18,041 18,415
Liabilities for unit-linked insurance and investment contracts 27 14,368 11,390
Subordinated debt 9, 15, 17, 28 1,202 464
Other financial liabilities 9, 15, 17, 28 3,592 4,247
Tax liabilities 21 587 487
Provisions 29 20 18
Employee benefits 30 99 51
Other liabilities 31 1,489 1,254
Total liabilities 39,396 36,326
BOARD OFDIRECTORS’ REPORT
AUDITOR’S REPORT
SAMPO PLC’S FINANCIAL STATEMENTS
Sampo plc’s Notes to the AccountsGroup’s Notes to the Accounts
GROUP’S IFRS FINANCIAL STATEMENTS
40FINANCIAL STATEMENTS 2019
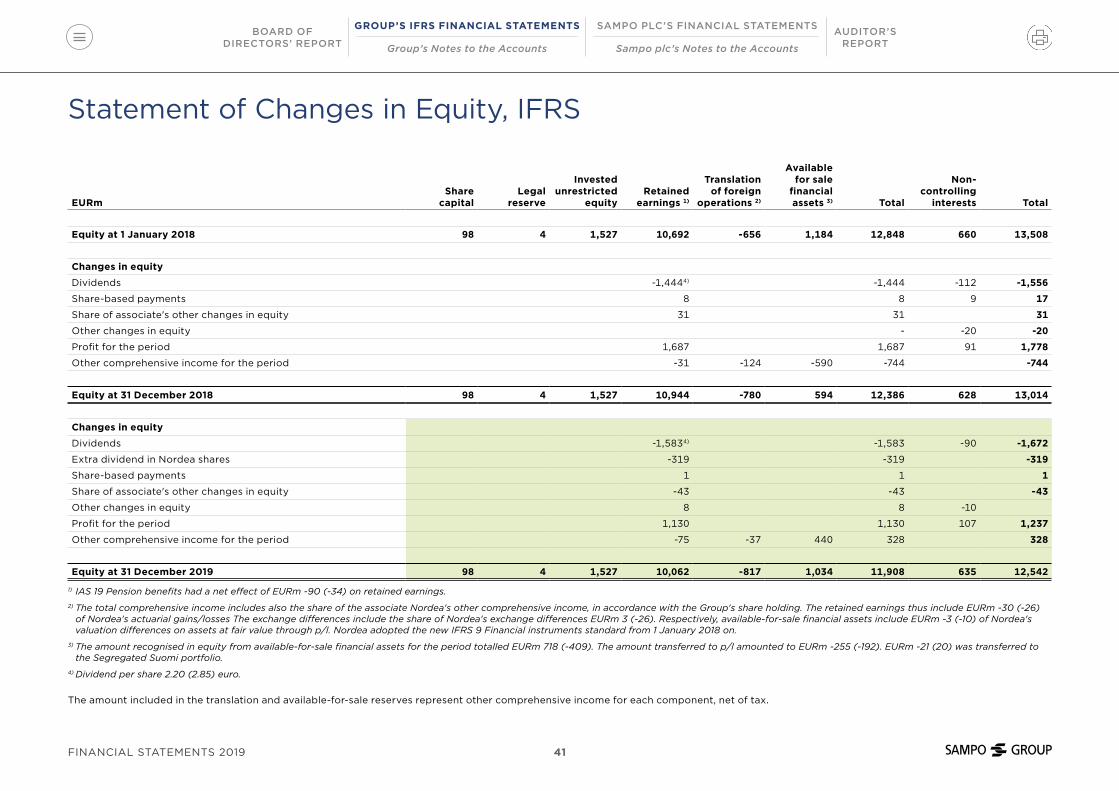
Statement of Changes in Equity, IFRS
EURmShare
capitalLegal
reserve
Invested unrestricted
equityRetained
earnings 1)
Translation of foreign
operations 2)
Available for sale
financial assets 3) Total
Non-controlling
interests Total
Equity at 1 January 2018 98 4 1,527 10,692 -656 1,184 12,848 660 13,508
Changes in equity
Dividends -1,4444) -1,444 -112 -1,556
Share-based payments 8 8 9 17
Share of associate's other changes in equity 31 31 31
Other changes in equity - -20 -20
Profit for the period 1,687 1,687 91 1,778
Other comprehensive income for the period -31 -124 -590 -744 -744
Equity at 31 December 2018 98 4 1,527 10,944 -780 594 12,386 628 13,014
Changes in equity
Dividends -1,5834) -1,583 -90 -1,672
Extra dividend in Nordea shares -319 -319 -319
Share-based payments 1 1 1
Share of associate's other changes in equity -43 -43 -43
Other changes in equity 8 8 -10
Profit for the period 1,130 1,130 107 1,237
Other comprehensive income for the period -75 -37 440 328 328
Equity at 31 December 2019 98 4 1,527 10,062 -817 1,034 11,908 635 12,542
1) IAS 19 Pension benefits had a net effect of EURm -90 (-34) on retained earnings.2) The total comprehensive income includes also the share of the associate Nordea's other comprehensive income, in accordance with the Group's share holding. The retained earnings thus include EURm -30 (-26)
of Nordea's actuarial gains/losses The exchange differences include the share of Nordea's exchange differences EURm 3 (-26). Respectively, available-for-sale financial assets include EURm -3 (-10) of Nordea's valuation differences on assets at fair value through p/l. Nordea adopted the new IFRS 9 Financial instruments standard from 1 January 2018 on.
3) The amount recognised in equity from available-for-sale financial assets for the period totalled EURm 718 (-409). The amount transferred to p/l amounted to EURm -255 (-192). EURm -21 (20) was transferred to the Segregated Suomi portfolio.
4) Dividend per share 2.20 (2.85) euro.
The amount included in the translation and available-for-sale reserves represent other comprehensive income for each component, net of tax.
BOARD OFDIRECTORS’ REPORT
AUDITOR’S REPORT
SAMPO PLC’S FINANCIAL STATEMENTS
Sampo plc’s Notes to the AccountsGroup’s Notes to the Accounts
GROUP’S IFRS FINANCIAL STATEMENTS
41FINANCIAL STATEMENTS 2019
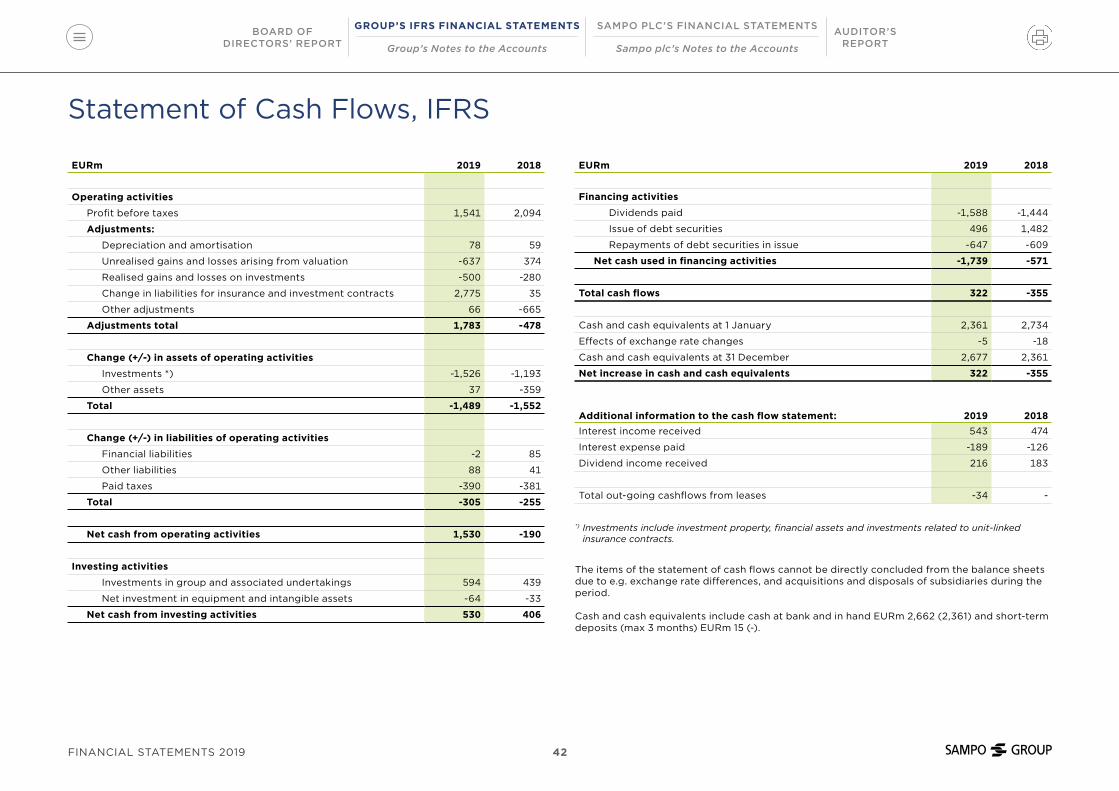
Statement of Cash Flows, IFRS
EURm 2019 2018
Operating activities
Profit before taxes 1,541 2,094
Adjustments:
Depreciation and amortisation 78 59
Unrealised gains and losses arising from valuation -637 374
Realised gains and losses on investments -500 -280
Change in liabilities for insurance and investment contracts 2,775 35
Other adjustments 66 -665
Adjustments total 1,783 -478
Change (+/-) in assets of operating activities
Investments *) -1,526 -1,193
Other assets 37 -359
Total -1,489 -1,552
Change (+/-) in liabilities of operating activities
Financial liabilities -2 85
Other liabilities 88 41
Paid taxes -390 -381
Total -305 -255
Net cash from operating activities 1,530 -190
Investing activities
Investments in group and associated undertakings 594 439
Net investment in equipment and intangible assets -64 -33
Net cash from investing activities 530 406
EURm 2019 2018
Financing activities
Dividends paid -1,588 -1,444
Issue of debt securities 496 1,482
Repayments of debt securities in issue -647 -609
Net cash used in financing activities -1,739 -571
Total cash flows 322 -355
Cash and cash equivalents at 1 January 2,361 2,734
Effects of exchange rate changes -5 -18
Cash and cash equivalents at 31 December 2,677 2,361
Net increase in cash and cash equivalents 322 -355
Additional information to the cash flow statement: 2019 2018Interest income received 543 474
Interest expense paid -189 -126
Dividend income received 216 183
Total out-going cashflows from leases -34 -
*) Investments include investment property, financial assets and investments related to unit-linked insurance contracts.
The items of the statement of cash flows cannot be directly concluded from the balance sheets due to e.g. exchange rate differences, and acquisitions and disposals of subsidiaries during the period.
Cash and cash equivalents include cash at bank and in hand EURm 2,662 (2,361) and short-term deposits (max 3 months) EURm 15 (-).
BOARD OFDIRECTORS’ REPORT
AUDITOR’S REPORT
SAMPO PLC’S FINANCIAL STATEMENTS
Sampo plc’s Notes to the AccountsGroup’s Notes to the Accounts
GROUP’S IFRS FINANCIAL STATEMENTS
42FINANCIAL STATEMENTS 2019
GROUP'S NOTES TO THE ACCOUNTS
69Group’s Other Notes to the Accounts
44Summary of
Significant Accounting Policies
62Segment
Information
68Business
Acquisitions
67Material
Partly-Owned Subsidiairies
1 Insurance premiums written...................................... 69
2 Net income from investments .................................. 69
3 Claims incurred .............................................................. 73
4 Change in liabilities for insurance and investment contracts .......................................... 73
5 Staff costs ........................................................................ 73
6 Other operating expenses ......................................... 74
7 Result analysis of If ...................................................... 74
8 Earnings per share ........................................................ 74
9 Financial assets and liabilities .................................. 75
10 Property, plant and equipment ............................... 76
11 Investment property .................................................... 77
12 Intangible assets ........................................................... 78
13 Investments in associates ......................................... 80
14 Financial assets .............................................................. 82
15 Fair values ....................................................................... 84
16 Change in fair values of financial assets ............... 85
17 Determination and hierarchy of fair values .......... 86
18 Movements in level 3 financial instruments measured at fair value ................................................ 90
19 Sensitivity analysis of level 3 financial instruments measured at fair value....... 92
20 Investments related to unit-linked insurance contracts ...................................................... 92
21 Deferred tax assets and liabilities ........................... 93
22 Taxes .................................................................................. 95
23 Components of other comprehensive income ... 95
24 Tax effects relating to components of other comprehensive income .............................. 96
25 Other assets .................................................................... 96
26 Liabilities from insurance and investment contracts .......................................... 97
27 Liabilities from unit-linked insurance and investment contracts ........................................103
28 Financial liabilities ......................................................104
29 Provisions.......................................................................106
30 Employee benefits ......................................................107
31 Other liabilities .............................................................110
32 Contingent liabilities and commitments .............111
33 Equity and reserves ....................................................112
34 Related party disclosures .........................................113
35 Incentive schemes ......................................................114
36 Auditors’ fees ...............................................................117
37 Legal proceedings ......................................................117
38 Investments in subsidiaries ......................................117
39 Events after the balance sheet date ....................117
40 Risk Management Disclosure 2019 .......................118
BOARD OFDIRECTORS’ REPORT
AUDITOR’S REPORT
SAMPO PLC’S FINANCIAL STATEMENTS
Sampo plc’s Notes to the Accounts
GROUP’S IFRS FINANCIAL STATEMENTS
Group’s Notes to the Accounts
43FINANCIAL STATEMENTS 2019

Group’s Notes to the Accounts
Sampo Group has prepared the consolidated financial
statements for 2019 in compliance with the International
Financial Reporting Standards (IFRSs). In preparing the
financial statements, Sampo has applied all the standards
and interpretations relating to its business, adopted by the
commission of the EU and effective at 31 December, 2019.
From January 2019 on, Sampo has applied the new
standard IFRS 16 Leases. The standard superseded IAS 17
according to which leases were recognised either in the
balance sheet as finance leases, or as other leases in which
case the related liability was disclosed in the notes. The
new standard requires all the leases, apart from low-value
and short-term leases, to be recognised in the balance
sheet. The related interest expenses and amortisations are
recognised in the income statement.
In the transition, the modified retrospective approach
was applied meaning that the comparison years were not
restated. In addition, the Group applied the exemption,
allowed by the standard, of not recognising short-term
leases and leases of low-value assets in the balance sheet.
The adoption of the standard had no material impact on
the Group's financial result. The Group's assets increased
by 141 million euro and liabilities by 137 million euro.
During the financial year, other adopted standards or
annual improvements to the standards had no material
impact on the Group’s financial statements reporting.
In preparing the notes to the consolidated financial
statements, attention has also been paid to the Finnish
accounting and company legislation and applicable
regulatory requirements.
The financial statements have for the most part been
prepared under the historical cost convention. Exceptions
are i.e. financial assets and liabilities at fair value through
p/l, financial assets available-for-sale, hedged items in fair
value hedges and share-based payments settled in equity
instruments measured at fair value.
The consolidated financial statements are presented
in euro (EUR), rounded to the nearest million, unless
otherwise stated.
The Board of Directors of Sampo plc accepted the
financial statements for issue on 6 February 2020.
Consolidation
Subsidiaries
The consolidated financial statements combine the
financial statements of Sampo plc and all its subsidiaries.
Entities qualify as subsidiaries if the Group has the
controlling power. The Group exercises control if its
shareholding is more than 50 per cent of the voting rights
or it otherwise has the power to exercise control over the
financial and operating policies of the entity. Subsidiaries
are consolidated from the date on which control is trans-
ferred to the Group, and cease to be consolidated from the
date that control ceases.
The acquisition method of accounting is used for the
purchase of subsidiaries. The cost of an acquisition
is allocated to the identifiable assets, liabilities and
contingent liabilities, which are measured at the fair value
of the date of the acquisition. Possible non-controlling
interest of the acquired entity is measured either at fair
value or at proportionate interest in the acquiree’s net
assets. The acquisition-specific choice affects both the
amount of recognised goodwill and non-controlling
interest. The excess of the aggregate of consideration
Summary of Significant Accounting Policies
BOARD OFDIRECTORS’ REPORT
AUDITOR’S REPORT
SAMPO PLC’S FINANCIAL STATEMENTS
Sampo plc’s Notes to the Accounts
GROUP’S IFRS FINANCIAL STATEMENTS
Group’s Notes to the Accounts
44FINANCIAL STATEMENTS 2019

transferred, non-controlling interest and possibly
previously held equity interest in the acquiree, over the
Group’s share of the fair value of the identifiable net assets
acquired, is recognised as goodwill.
The accounting policies used throughout the Group for
the purposes of consolidation are consistent with respect
to similar business activities and other events taking place
in similar conditions. All intra-group transactions and
balances are eliminated upon consolidation.
Associates
Associates are entities in which the Group has significant
influence, but no control over the financial management
and operating policy decisions. Unless otherwise
demonstrated, this is generally presumed when the Group
holds in excess of 20 per cent, but no more than 50 per
cent, of the voting rights of an entity. Investments in
associates are treated by the equity method of accounting,
in which the investment is initially recorded at cost
and increased (or decreased) each year by the Group’s
share of the post-acquisition net income (or loss), or
other movements reflected directly in the equity of the
associate. If the Group’s share of the associate’s loss
exceeds the carrying amount of the investment, the
investment is carried at zero value, and the loss in excess
is consolidated only if the Group is committed to fulfilling
the obligations of the associate. Goodwill arising on the
acquisition is included in the cost of the investment.
Unrealised gains (losses) on transactions are eliminated to
the extent of the Group’s interest in the entity.
The share of associates’ profit or loss, equivalent to the
Group’s holding, is presented as a separate line in the
income statement. The Group’s share of associate’s
changes in other comprehensive income is presented in
the Group’s other comprehensive income items.
If there is any indication that the value of the investment
may be impaired, the carrying amount is tested by com-
paring it with its recoverable amount. The recoverable
amount is the higher of its value in use or its fair value
less costs to sell. If the recoverable amount is less than its
carrying amount, the carrying amount is reduced to its
recoverable amount by recognising an impairment loss in
the profit/loss. If the recoverable amount later increases
and is greater than the carrying amount, the impairment
loss is reversed through profit and loss.
Foreign currency translation
The consolidated financial statements are presented in
euro, which is the functional and reporting currency of
the Group and the parent company. Items included in
the financial statements of each of the Group entities
are measured using their functional currency, being the
currency of the primary economic environment in which
the entity operates. Foreign currency transactions are
translated into the appropriate functional currency using
the exchange rates prevailing at the dates of transactions
or the average rate for a month. The balance sheet items
denominated in foreign currencies are translated into the
functional currency at the rate prevailing at the balance
sheet date.
Exchange differences arising from translation of trans-
actions and monetary balance sheet items denominated
in foreign currencies into functional currency are
recognised as translation gains and losses in profit or loss.
Exchange differences arising from equities classified as
available-for-sale financial assets are included directly in
the fair value reserve in equity.
BOARD OFDIRECTORS’ REPORT
AUDITOR’S REPORT
SAMPO PLC’S FINANCIAL STATEMENTS
Sampo plc’s Notes to the Accounts
GROUP’S IFRS FINANCIAL STATEMENTS
Group’s Notes to the Accounts
45FINANCIAL STATEMENTS 2019

The income statements of Group entities whose
functional currency is other than euro are translated into
euro at the average rate for the period, and the balance
sheets at the rates prevailing at the balance sheet date.
The resulting exchange differences are included in equity
and their change in other comprehensive income. When a
subsidiary is divested entirely or partially, the cumulative
exchange differences are included in the income
statement under sales gains or losses.
Goodwill and fair value adjustments arising on the
acquisition of a foreign entity are treated as if they were
assets and liabilities of the foreign entity. Exchange
differences resulting from the translation of these items at
the exchange rate of the balance sheet date are included in
equity and their change in other comprehensive income.
The following exchange rates were applied in the
consolidated financial statements:
1 euro (EUR) = Balance sheet
dateAverage
exchange rate
Swedish krona (SEK) 10.4468 10.5853
Danish krona (DKK) 7.4715 7.4661
Segment reporting
The Group’s segmentation is based on business areas
whose risks and performance bases as well as regulatory
environment differ from each other. The control and
management of business and management reporting
is organised in accordance with the business segments.
The Group’s business segments are If, Topdanmark,
Mandatum and Holding (including Nordea).
Geographical information has been given on income from
external customers and non-current assets. The reported
segments are Finland, Sweden, Norway, Denmark and the
Baltic countries.
In the inter-segment and inter-company pricing, for both
domestic and cross border transactions, market-based
prices are applied. The pricing is based on the Code of
conduct on Transfer Pricing Documentation in the EU
and OECD guidelines.
Inter-segment transactions, assets and liabilities are
eliminated in the consolidated financial statements on a
line-by-line basis.
Interest and dividends
Interest income and expenses are recognised in the
income statement using the effective interest rate
method. This method recognises income and expenses
on the instrument evenly in proportion to the amount
outstanding over the period to maturity. Dividends on
equity securities are recognised as revenue when the right
to receive payment is established.
Fees and commissions
The fees and transaction costs of financial instruments
measured at fair value through profit or loss are
recognised in profit or loss when the instrument is
initially recognised.
The costs of acquiring new and renewed insurance
business are treated as deferred acquisition costs in
the P&C insurance. In the life insurance business, the
acquisition costs are treated as fee and commission
expense under ‘Other operating expenses’.
Other fees and commissions paid for investment activities
are included in ‘Net income from investments’.
Insurance premiums
Insurance premiums in the income statement consist of
premiums written for P&C insurance and life insurance.
P&C insurance contracts are primarily of short duration, so
that premiums written are recognised as earned on a pro
rata basis, adjusting them by a change in the provision for
unearned premiums i.e. by the proportion of the insurance
premium income that, based on the period covered by the
insurance contract, belongs to the following financial year.
In the life insurance business, liabilities arising from
insurance and investment contracts count as long-term
BOARD OFDIRECTORS’ REPORT
AUDITOR’S REPORT
SAMPO PLC’S FINANCIAL STATEMENTS
Sampo plc’s Notes to the Accounts
GROUP’S IFRS FINANCIAL STATEMENTS
Group’s Notes to the Accounts
46FINANCIAL STATEMENTS 2019

liabilities. Therefore, the insurance premium and related
claims are usually not recognised in the same accounting
period. Depending on the type of insurance, premiums
are primarily recognised in premiums written when the
premium has been paid. In group pension insurance, a part
of the premiums is recognised already when charged.
The change in the provision for unearned premiums is
presented as an expense under 'Change in insurance and
investment contract liabilities'.
Financial assets and liabilities
Based on the measurement practice, financial assets
and liabilities are classified in the following categories
upon the initial recognition: financial assets at fair
value through profit or loss, loans and receivables,
available-for-sale financial assets, financial liabilities at
fair value through profit or loss, and other liabilities.
According to the Group’s risk management policy, invest-
ments are managed at fair value in order to have the most
realistic and real-time picture of investments, and they
are reported to the Group key management at fair value.
Investments comprise debt and equity securities. They
are mainly classified as financial assets available-for-sale
or at fair value through p/l.
A large majority of Sampo Group's financial assets are
valued at fair value. The valuation is based on either
published price quotations or valuation techniques based
on market observable inputs, where available. For a
limited amount of assets the value needs to be determined
using other techniques. The financial instruments
measured at fair value have been classified into three
hierarchy levels in the notes, depending on e.g. if the
market for the instrument is active, or if the inputs used
in the valuation technique are observable.
On level 1, the measurement of the instrument is based
on quoted prices in active markets for identical assets or
liabilities.
On level 2, inputs for the measurement of the instrument
include also other than quoted prices observable for the
asset or liability, either directly or indirectly by using
valuation techniques.
On level 3, the measurement is based on other inputs
rather than observable market data. The majority of
Sampo Group’s level 3 assets are private equity and
alternative funds.
For private equity funds the valuation of the underlying
investments is conducted by the fund manager who has
all the relevant information required in the valuation
process. The valuation is usually updated quarterly based
on the value of the underlying assets and the amount of
debt in the fund. There are several valuation methods,
which can be based on, for example, the acquisition value
of the investments, the value of publicly traded peer
companies, the multiple based valuation or the cashflows
of the underlying investments. Most private equity funds
follow the International Private Equity and Venture
Capital (IPEV) guidelines which give detailed instructions
on the valuation of private equity funds.
For alternative funds the valuation is also conducted
by the fund managers. Alternative funds often have
complicated structures and the valuation is dependent
on the nature of the underlying investments. There are
many different valuation methods that can be used,
for example, the method based on the cashflows of the
underlying investments. The operations and valuation
of alternative funds are regulated for example by the
Alternative Investment Fund Managers Directive
(AIFMD), which determines the principles and documen-
tation requirements of the valuation process.
In the life insurance business, IFRS 4 Insurance Contracts
provides that insurance contracts with a discretionary
participation feature are measured in accordance
with national valuation principles rather than at fair
value. These contracts and investments made to cover
shareholders’ equity are managed in their entirety and are
classified mainly as available-for-sale financial assets. An
exception to the rule are investments related to unit-linked
insurance, valued at fair value thru p/l and shown as a
separate line item in the balance sheet. The corresponding
liability is also shown as a separate line item.
BOARD OFDIRECTORS’ REPORT
AUDITOR’S REPORT
SAMPO PLC’S FINANCIAL STATEMENTS
Sampo plc’s Notes to the Accounts
GROUP’S IFRS FINANCIAL STATEMENTS
Group’s Notes to the Accounts
47FINANCIAL STATEMENTS 2019
Recognition and derecognition
Purchases and sales of financial assets at fair value
through profit or loss and available-for-sale financial
assets are recognised and derecognised on the trade
date, which is the date on which the Group commits
to purchase or sell the asset. Loans and receivables are
recognised when cash is advanced.
Financial assets and liabilities are offset and the net
amount is presented in the balance sheet only when the
Group has a legally enforceable right to set off the recog-
nised amounts and it intends to settle on a net basis, or to
realise the asset and settle the liability simultaneously.
Financial assets are derecognised when the contractual
rights to receive cash flows have expired or the Group
has transferred substantially all the risks and rewards of
ownership. Financial liabilities are derecognised when
the obligation specified in the contract is discharged or
cancelled or expired.
Financial assets and financial liabilities at fair value through profit or loss
In Sampo Group, financial assets and liabilities at fair
value through profit of loss comprise financial assets held
for trading and financial assets designated as at fair value
through profit or loss.
Financial assets held for tradingFinancial asset that is held for the purpose of selling or
buying in the short term, or belongs to a portfolio that is
managed together or is repeatedly used for short-term
profit taking, is classified as an asset held for trading.
Gains and losses arising from changes in fair value, or
realised on disposal, together with related interest income
and dividend, are recognised in the income statement.
Also derivative instruments that are not designated as
hedges and do not meet the requirements for hedge
accounting are classified as financial assets for trading
purposes.
Financial derivatives held for trading are initially recog-
nised at fair value. Derivative instruments are carried
as assets when the fair value is positive and as liabilities
when the fair value is negative. Derivative instruments are
recognised at fair value, and gains and losses arising from
changes in fair value together with realised gains and
losses are recognised in the income statement.
Financial assets designated as at fair value through profit or loss Financial assets designated as at fair value through profit
or loss are assets which, at inception, are irrevocably
designated as such. They are initially recognised at their
fair value. They are recognised in the income statement
and balance sheet accordingly with above-explained
assets held for trading.
Loans and receivables
Loans and receivables comprise non-derivative financial
assets with fixed or determinable payments that are
not quoted in an active market and that the Group does
not intend to sell immediately or in the short term. The
category also comprises cash and balances with banks.
Loans and receivables are initially recognised at their fair
value, added by transaction costs directly attributable
to the acquisition of the asset. Loans and receivables
are subsequently measured at amortised cost using the
effective interest rate method.
Available-for-sale financial assets
Available-for-sale financial assets are non-derivative
financial investments that are designated as available for
sale and or are not categorised into any other category.
Available-for-sale financial assets comprise debt and
equity securities.
Available-for-sale financial assets are initially recognised
fair value, including direct and incremental transaction
costs. They are subsequently remeasured at fair value,
and the changes in fair value are recorded in other
comprehensive income and presented in the fair value
reserve, taking the tax effect into account. Interest income
and dividends are recognised in profit or loss. When the
BOARD OFDIRECTORS’ REPORT
AUDITOR’S REPORT
SAMPO PLC’S FINANCIAL STATEMENTS
Sampo plc’s Notes to the Accounts
GROUP’S IFRS FINANCIAL STATEMENTS
Group’s Notes to the Accounts
48FINANCIAL STATEMENTS 2019

available-for-sale assets are sold, the cumulative change
in the fair value is transferred from equity and recognised
together with realised gains or losses in profit or loss. The
cumulative change in the fair value is also transferred
to profit or loss when the assets are impaired and the
impairment loss is recognised. Exchange differences due
to available-for-sale monetary balance sheet items are
always recognised directly in profit or loss.
Other financial liabilities
Other financial liabilities comprise debt securities in issue
and other financial liabilities.
Other financial liabilities are recognised when the
consideration is received and measured to amortised cost,
using the effective interest rate method.
If debt securities issued are redeemed before maturity,
they are derecognised and the difference between
the carrying amount and the consideration paid at
redemption is recognised in profit or loss.
Fair value
The fair value of financial instruments is determined
primarily by using quoted prices in active markets.
Instruments are measured either at the bid price or at
the last trade price, if there is an auction policy in the
stock market of the price source. The financial derivatives
are also measured at the last trade price. If the financial
instrument has a counter-item that will offset its market
risk, the same price source is used in assets and liabilities
to that extent. If a published price quotation does not
exist for a financial instrument in its entirety, but active
markets exist for its component parts, the fair value is
determined on the basis of the relevant market prices of
the component parts.
If a market for a financial instrument is not active, or the
instrument is not quoted, the fair value is established by
using generally accepted valuation techniques including
recent arm’s length market transactions between
knowledgeable, willing parties, reference to the current
fair value of another instrument that is substantially the
same, discounted cash flow analysis and option pricing
models.
If the fair value of a financial asset cannot be determined,
historical cost is deemed to be a sufficient approximation
of fair value. The amount of such assets in the Group
balance sheet is immaterial.
Impairment of financial assets
Sampo assesses at the end of each reporting period
whether there is any objective evidence that a financial
asset, other than those at fair value through p/l, may be
impaired. A financial asset is impaired and impairment
losses are incurred, if there is objective evidence of
impairment as a result of one or more loss events that
occurred after the initial recognition of the asset, and if
that event has an impact, that can be reliably estimated,
on the estimated future cash flows of the financial asset.
Financial assets carried at amortised cost
There is objective evidence of impairment, if an issuer or
debtor e.g. encounters significant financial difficulties
that will lead to insolvency and to estimation that the
customer will probably not be able to meet the obligations
to the Group. Objective evidence is first assessed for
financial assets that are individually significant, and
individually and collectively for financial assets not
individually significant.
When there is objective evidence of impairment of a
financial asset carried at amortised cost, the amount
of the loss is measured as the difference between the
receivable’s carrying amount and the present value of
estimated future cash flows discounted at the receivable’s
original effective interest rate. The difference is
BOARD OFDIRECTORS’ REPORT
AUDITOR’S REPORT
SAMPO PLC’S FINANCIAL STATEMENTS
Sampo plc’s Notes to the Accounts
GROUP’S IFRS FINANCIAL STATEMENTS
Group’s Notes to the Accounts
49FINANCIAL STATEMENTS 2019

recognised as an impairment loss in profit or loss. The
impairment is assessed individually.
If, in a subsequent period, the amount of the impairment
loss decreases, and the decease can objectively be
related to an event occurring after the impairment
was recognised (e.g. the default status is removed), the
previously recognised impairment loss shall be reversed
through profit or loss.
Available-for-sale financial assets
Whether there is objective evidence of an impairment
of available-for-sale financial assets, is evaluated in a
separate assessment, which is done if the credit rating
of an issuer has declined or the entity is placed on watch
list, or there is a significant or prolonged decline in the
fair value of an equity instrument below its original
acquisition cost.
The decision on whether the impairment is significant or
prolonged requires an assessment of the management.
The assessment is done case by case and with considera-
tion paid not only to qualitative criteria but also historical
changes in the value of an equity as well as time period
during which the fair value of an equity security has
been lower than the acquisition cost. In Sampo Group,
the impairment is normally assessed to be significant, if
the fair value of a listed equity or participation decreases
below the average acquisition cost by 20 per cent and
prolonged, when the fair value has been lower than the
acquisition cost for over 12 months.
As there are no quoted prices available in active
markets for unquoted equities and participations, the
aim is to determine their fair value with the help of
generally accepted valuation techniques available in
the markets. The most significant share of unquoted
equities and participations comprise the private equity
and venture capital investments. They are measured
in accordance with the generally accepted common
practice, International Private Equity and Venture Capital
Guidelines (IPEV).
The significance and prolongation of the impairment in
the last-mentioned cases is assessed case by case, taking
into consideration special factors and circumstances
related to the investment. Sampo invests in private equity
and venture capital in order to keep them to the end of
their life cycle, so the typical lifetime is 10 – 12 years. In
general, a justifiable assessment of a potential impair-
ment may only be done towards the end of the life cycle.
However, if additionally there is a well-founded reason
to believe that an amount equivalent to the acquisition
cost will not be recovered when selling the investment, an
impairment loss is recognised.
An impairment on equity funds is recognised in line with
the principles above when the starting year of the fund is
at least 10 years old and the carrying amount of the fund
is maximum EUR 500,000. In these cases both the fair
value and the carrying amount are booked to zero. An
impairment is only performed to those funds for which
the benchmarks are met in all Sampo Group companies’
portfolios.
In the case of debt securities, the amount of the
impairment loss is assessed as the difference between the
acquisition cost, adjusted with capital amortisations and
accruals, and the fair value at the review time, reduced by
previously in profit or loss recognised impairment losses.
When assessed that there is objective evidence of
impairment in debt or equity securities classified as
financial assets available-for-sale, the cumulative loss
recognised in other comprehensive income is transferred
from equity and recognised in profit or loss as an
impairment loss.
If, in a subsequent period, the fair value of a debt security
increases and the increase can objectively be related to an
event occurring after the impairment loss was recognised
in profit or loss, the impairment loss shall be reversed by
recognising the amount in profit or loss.
If the fair value of an equity security increases after the
impairment loss was recognised in profit or loss, the
increase shall be recognised in other comprehensive
income. If the value keeps decreasing below the
acquisition cost, an impairment loss is recognised
through profit or loss.
BOARD OFDIRECTORS’ REPORT
AUDITOR’S REPORT
SAMPO PLC’S FINANCIAL STATEMENTS
Sampo plc’s Notes to the Accounts
GROUP’S IFRS FINANCIAL STATEMENTS
Group’s Notes to the Accounts
50FINANCIAL STATEMENTS 2019

Derivative financial instruments and hedge accounting
Derivative financial instruments are classified as those
held for trading and those held for hedging, including
interest rate derivatives, credit risk derivatives, foreign
exchange derivatives, equity derivatives and commodity
derivatives. Derivative instruments are measured initially
at fair value. All derivatives are carried as assets when
fair value is positive and as liabilities when fair value is
negative.
Derivatives held for trading
Derivative instruments that are not designated as hedges
and embedded derivatives separated from a host contract
are treated as held for trading. They are measured at fair
value and the change in fair value, together with realised
gains and losses and interest income and expenses, is
recognised in profit or loss.
If derivatives are used for hedging, but they do not qualify
for hedge accounting as required by IAS 39, they are
treated as held for trading.
Hedge accounting
Sampo Group may hedge its operations against interest
rate risks, currency risks and price risks through fair value
hedging and cash flow hedging. Cash flow hedging is used
as a protection against the variability of the future cash
flows, while fair value hedging is used to protect against
changes in the fair value of recognised assets or liabilities.
During the financial year, the fair value hedging has been
applied in Mandatum.
Hedge accounting applies to hedges that are effective in
relation to the hedged risk and meet the hedge accounting
requirements of IAS 39. The hedging relationship
between the hedging instrument and the hedged item,
as well as the risk management objective and strategy for
undertaking the hedge, are documented at the inception
of the hedge. In addition, the effectiveness of a hedge is
assessed both at inception and on an ongoing basis, to
ensure that it is highly effective throughout the period
for which it was designated. Hedges are regarded as
highly effective in offsetting changes in fair value or the
cash flows attributable to a hedged risk within a range of
80–125 per cent.
Fair value hedgingIn accordance with the Group’s risk management
principles, fair value hedging is used to hedge changes
in fair values resulting from changes in price, interest
rate or exchange rate levels. The hedging instruments
used include foreign exchange forwards, interest rate
swaps, interest rate and cross currency swaps and options,
approved by the managements of the Group companies.
Changes in the fair value of derivative instruments that
are documented as fair value hedges and are effective in
relation to the hedged risk are recognised in profit or loss.
In addition, the hedged assets and liabilities are measured
at fair value during the period for which the hedge was
designated, with changes in fair value recognised in profit
or loss.
Securities lending
Securities lent to counterparties are retained in the
balance sheet. Conversely, securities borrowed are not
recognised in the balance sheet, unless these are sold to
third parties, in which case the purchase is recorded as a
trading asset and the obligation to return the securities as
a trading liability at fair value through profit or loss
Leases
Group as lessee
All lease contracts are primarily recognised in the balance
sheet in accordance with the new IFRS 16 Leases. The
only optional excemptions include certain short-term or
low-value contracts for which the lease payments can be
BOARD OFDIRECTORS’ REPORT
AUDITOR’S REPORT
SAMPO PLC’S FINANCIAL STATEMENTS
Sampo plc’s Notes to the Accounts
GROUP’S IFRS FINANCIAL STATEMENTS
Group’s Notes to the Accounts
51FINANCIAL STATEMENTS 2019

recognised as an expense on a straight-line basis over the
lease term.
Right-of-use assets related to lease contracts (right to
use an underlying asset) are recognised in the asset
side as part of Property, Plant and Equipment and the
corresponding lease liabilities in the liability side as part
of Other liabilities. Right-of-use asset is recognised at
the commencement date of the lease and measured at
cost that includes the amount of the initial measurement
of the liability and potential prepaid rents to the lessor.
Lease liability is also recognised at the commencement
date, and measured at the present value of the lease
payments.
Depreciations on right-of-use assets and interests on the
lease liabilities are recognised in the p/l.
Group as lessor
Leases are included in ‘Investment property’ in the
balance sheet. They are depreciated over their expected
useful lives on a basis consistent with similar owned
property, plant and equipment, and the impairment
losses are recognised on the same basis as for these items.
Rental income is recognised on a straight-line basis over
the lease term in profit or loss.
Intangible assets
Goodwill
Goodwill represents the excess of the cost of an acquisi-
tion (made after 1 January 2004) over the fair value of the
Group’s share of the net identifiable assets, liabilities and
contingent liabilities of the acquired entity at the date of
acquisition. Goodwill on acquisitions before 1 January
2004 is accounted for in accordance with the previous
accounting standards and the carrying amount is used as
the deemed cost in accordance with the IFRS.
Goodwill is measured at historical cost less accumulated
impairment losses. Goodwill is not amortised.
Other intangible assets
IT software and other intangible assets, whether procured
externally or internally generated, are recognised in
the balance sheet as intangible assets with finite useful
lives, if it is probable that the expected future economic
benefits that are attributable to the assets will flow to
the Group and the cost of the assets can be measured
reliably. The cost of internally generated intangible assets
is determined as the sum of all costs directly attributable
to the assets. Research costs are recognised as expenses
in profit or loss as they are incurred. Costs arising from
development of new IT software or from significant
improvement of existing software are recognised only to
the extent they meet the above-mentioned requirements
for being recognised as assets in the balance sheet.
Intangible assets with finite useful lives are measured
at historical cost less accumulated amortisation and
impairment losses. Intangible assets are amortised on
a straight-line basis over the estimated useful life of the
asset. The estimated useful lives by asset class are as
follows:
IT software 3–10 years
Other intangible assets 3–10 years
Property, plant and equipment
Property, plant and equipment comprise properties
occupied for Sampo’s own activities, office equipment,
fixtures and fittings, and furniture. Classification of
properties as those occupied for own activities and those
for investment activities is based on the square metres
in use. If the proportion of a property in Sampo’s use is
no more than 10 per cent, the property is classified as an
investment property.
Property, plant and equipment are measured at historical
cost less accumulated depreciation and impairment
losses, except for Topdanmark where the carrying amount
is based on revaluation i.e. fair value less accumulated
depreciation and impairment losses.
BOARD OFDIRECTORS’ REPORT
AUDITOR’S REPORT
SAMPO PLC’S FINANCIAL STATEMENTS
Sampo plc’s Notes to the Accounts
GROUP’S IFRS FINANCIAL STATEMENTS
Group’s Notes to the Accounts
52FINANCIAL STATEMENTS 2019

Improvement costs are added to the carrying amount of
a property when it is probable that the future economic
benefits that are attributable to the asset will flow to the
entity. Costs for repairs and maintenance are recognised
as expenses in the period in which they were incurred.
Items of property, plant and equipment are depreciated
on a straight-line basis over their estimated useful life. In
most cases, the residual value is estimated at zero. Land
is not depreciated. Estimates of useful life are reviewed
at financial year-ends and the useful life is adjusted if the
estimates change significantly. The estimated useful lives
by asset class are as follows:
Residential, business premises and offices 20–60 years
Industrial buildings and warehouses 30–60 years
Components of buildings 10–15 years
IT equipment and motor vehicles 3–5 years
Other equipment 3–10 years
Depreciation of property, plant or equipment will be
discontinued, if the asset in question is classified as held
for sale in accordance with IFRS 5 Non-current Assets Held
for Sale and Discontinued Operations.
Impairment of intangible assets and property, plant and equipment
At each reporting date the Group assesses whether there
is any indication that an intangible asset or an item
of property, plant or equipment may be impaired. If
any such indication exists, the Group will estimate the
recoverable amount of the asset. In addition, goodwill,
intangible assets not yet available for use and intangible
assets with an indefinite useful life will be tested for
impairment annually, independent of any indication
of impairment. For impairment testing the goodwill is
allocated to the cash-generating units of the Group from
the date of acquisition. In the test the carrying amount
of the cash-generating unit, including the goodwill, is
compared with its recoverable amount.
The recoverable amount is the higher of an asset’s fair
value less costs to sell and its value in use. The value
in use is calculated by estimating future net cash flows
expected to be derived from an asset or a cash-generating
unit, and by discounting them to their present value using
a pre-tax discount rate. If the carrying amount of an asset
is higher than its recoverable amount, an impairment loss
is recognised in profit or loss. In conjunction with this, the
impaired asset’s useful life will be re-determined.
If there is any indication that an impairment loss
recognised for an asset in prior periods may no longer
exist or may have decreased, the recoverable amount of
the asset will be estimated. If the recoverable amount of
the asset exceeds the carrying amount, the impairment
loss is reversed, but no more than to the carrying amount
which it would have been without recognition of the
impairment loss. Impairment losses recognised for
goodwill are not reversed.
Investment property
Investment property is held to earn rentals and for capital
appreciation. The investment property is measured the
same way as property, plant and equipment. The depreci-
ation periods and methods and the impairment principles
are also the same as those applied to corresponding
property occupied for own activities. The investment
property of the associate Nordea in the Holding segment is
measured at fair value in item Investments in associates.
The fair value of investment property is estimated using
a method based on estimates of future cash flows and a
comparison method based on information from actual
sales in the market. The fair value of investment property
is presented in the Notes.
The valuation takes into account the characteristics of
the property with respect to location, condition, lease
situation and comparable market information regarding
rents, yield requirements and unit prices. During the
financial year, the valuations were conducted by the
Group’s internal resources.
Provisions
A provision is recognised when the Group has a present
legal or constructive obligation as a result of a past
event, and it is probable that an outflow of resources
embodying economic benefits will be required to settle
BOARD OFDIRECTORS’ REPORT
AUDITOR’S REPORT
SAMPO PLC’S FINANCIAL STATEMENTS
Sampo plc’s Notes to the Accounts
GROUP’S IFRS FINANCIAL STATEMENTS
Group’s Notes to the Accounts
53FINANCIAL STATEMENTS 2019
the obligation and the Group can reliably estimate the
amount of the obligation. If it is expected that some or all
of the expenditure required to settle the provision will be
reimbursed by another party, the reimbursement will be
treated as a separate asset only when it is virtually certain
that the Group will receive it.
Insurance and investment contracts
Insurance contracts are treated, in accordance with IFRS
4, either as insurance or investment contracts. Under the
standard, insurance contracts are classified as insurance
contracts if significant insurance risk is transferred
between the policyholder and the insurer. If the risk trans-
ferred on the basis of the contract is essentially financial
risk rather than significant insurance risk, the contract
is classified as an investment contract. Classification of a
contract as an insurance contract or investment contract
determines the measurement principle applied to it.
Sampo treats the liabilities arising from contracts in
the first phase of the standard according to national
accounting standards, except for the equalisation reserve
and its changes which is reported in equity and profit or
loss, in accordance with the IFRS.
The risks involved in insurance and investment contracts
are widely elaborated in the Group’s note 40.
Reinsurance contracts
A reinsurance contract is a contract which meets the
IFRS 4 requirements for insurance contracts and on the
basis of which Sampo Group (the cedant) may receive
compensation from another insurer (the reinsurer), if it
becomes liable for paying compensation based on other
insurance contracts it has issued. Such compensation
received on the basis of reinsurance contracts is included
in the balance sheet under 'Reinsurers’ share of insurance
liabilities' and 'Other assets'. The former item includes the
reinsurers’ share of the provisions for unearned premiums
and claims outstanding in the Group’s reinsured
insurance contracts, while the latter includes short-term
receivables from reinsurers.
When the Group itself has to pay compensation to another
insurer on the basis of a reinsurance contract, the liability
is recognised in the item 'Other liabilities'.
Receivables and liabilities related to reinsurance are
measured uniformly with the cedant's receivables and
liabilities. Reinsurance receivables are tested annually for
impairment. Impairment losses are recognised through
profit or loss, if there is objective evidence indicating that
the Group (as the cedant) will not receive all amounts of
money it is entitled to on a contractual basis.
P&C Insurance business
Classification of insurance contractsIn classifying insurance contracts and examining their
related risks, embedded contracts are interpreted as one
contract.
Other than insurance contracts, i.e. contracts where the
risk is not transferred, include Captive contracts in which
an insurance company underwrites a company’s direct
business and reinsures the same risk in an insurance
company in the same group as the policyholder. There are
also contracts in P&C insurance (Reverse Flow Fronting
contracts) in which the insurance company grants
insurance and then transfers the insurance risk to the
final insurer. For both the above types of contract, only
the net effect of the contract relationship is recognised
in the income statement and balance sheet (instead of
the gross treatment, as previously). The prerequisite for
net treatment is that the net retention recognised on the
contract is zero.
There are also contracts in P&C insurance in which the
insurance risk is eliminated by a retrospective insurance
premium, i.e. the difference between forecast and actual
losses is evened out by an additional premium directly or
in connection with the annual renewal of the insurance.
BOARD OFDIRECTORS’ REPORT
AUDITOR’S REPORT
SAMPO PLC’S FINANCIAL STATEMENTS
Sampo plc’s Notes to the Accounts
GROUP’S IFRS FINANCIAL STATEMENTS
Group’s Notes to the Accounts
54FINANCIAL STATEMENTS 2019
The net cash flow from these contracts is recognised
directly in the balance sheet, without recognising it first
in the income statement as premiums written and claims
incurred.
Insurance liabilitiesInsurance liabilities are the net contractual obligations
which the insurer has on the basis of insurance contracts.
Insurance liabilities, consisting of the provisions for
unearned premiums and unexpired risks and for claims
outstanding, correspond to the obligations under
insurance contracts.
The provision for unearned premiums is intended to
cover anticipated claims costs and operating expenses
during the remaining term of insurance contracts in
force. In P&C insurance and reinsurance, the provision for
unearned premiums is normally calculated on a strictly
proportional basis over time, i.e. on a pro rata temporis
basis. If premiums are judged to be insufficient to cover
anticipated claims costs and operating expenses, the
provision for unearned premiums must be augmented
by a provision for unexpired risks. Calculation of the
provision for unexpired risks must also take into account
instalment premiums not yet due.
The provision for claims outstanding is intended to cover
the anticipated future payments of all claims incurred,
including claims not yet reported to the company; i.e. the
IBNR (incurred but not reported) provision. The provision
for claims outstanding includes claims payments plus all
estimated costs of claim settlements.
The provision for claims outstanding in direct P&C insur-
ance and reinsurance may be calculated by statistical
methods or through individual assessments of individual
claims. Often a combination of the two methods is used,
meaning large claims are assessed individually while
small claims and claims incurred but not reported (the
IBNR provision) are calculated using statistical methods.
Premiums written for P&C insurance and reinsurance
are recognised in the income statement when the annual
insurance premium is due for payment.
Liability adequacy testA liability adequacy test is performed separately for both
the provision for claims outstanding and the provision for
unearned premiums. The provision for claims outstanding
is based on estimates of future cash flows. The estimates
are made by using well-established actuarial methods.
The provision for unearned premiums is, for the most part,
calculated on a strictly proportional basis over time (so
called pro rata temporis principle). The adequacy of the
provision for unearned premiums is tested by calculating
a provision for unexpired risks for each company per busi-
ness area and line of business. If the provisions are judged
to be insufficient, the provision for unearned premiums is
augmented by recognising a provision for unexpired risks.
Pay-as-you-go system for P&C insurancePensions and compensation for healthcare or medical
rehabilitation paid on the basis of Finland’s statutory P&C
insurance (accident, motor third party liability and patient
insurance) are raised annually by the TEL (Employee
Pensions Act) index in order to maintain the real value of
the pensions. The index raises are not the responsibility of
the insurance companies, but are funded by the so-called
pay-as-you-go principle, i.e. each year premiums written
include index raises to the same amount that is paid out
in that year. In practice, the P&C insurance companies
collect a so-called expense loading along with their
premiums written, which is then forwarded to the central
organisation for the particular insurance line. The central
organisation distributes the pay-as-you-go contributions
collected so that the company undertaking the type of
insurance in question receives an amount equal to the
compensation falling under the pay-as-you-go system
it has paid that year. The insurer’s participation in the
payment is proportional to the insurer’s market share in
the insurance line in question.
The pay-as-you-go system related to pension index
raises is not treated as an insurance activity under
IFRS 4 and does not generate any risk for the insurance
company. Thus, the pay-as-you-go contribution collected
together with the insurance premium is not deemed to
be premium income, and the pension index raise paid
out is not deemed to be claims incurred. Because the
collected index raise corresponds in amount to the paid
out pension index raise, the said items are set-off in the
Income Statement item 'Other expenses from operations'.
The share of a balancing figure not yet received from, or
not paid by, a central organisation is presented as current
receivables or liabilities in the balance sheet items 'Other
assets' or 'Other liabilities'.
BOARD OFDIRECTORS’ REPORT
AUDITOR’S REPORT
SAMPO PLC’S FINANCIAL STATEMENTS
Sampo plc’s Notes to the Accounts
GROUP’S IFRS FINANCIAL STATEMENTS
Group’s Notes to the Accounts
55FINANCIAL STATEMENTS 2019

Deferred acquisition costsIn the P&C insurance business, acquisition costs clearly
relating to the writing of insurance contracts and
extending beyond the financial year are recognised as
assets in the balance sheet. Acquisition costs include
operating expenses directly or indirectly attributable
to writing insurance contracts, fees and commissions,
marketing expenses and the salaries and overheads of
sales staff. Acquisition costs are amortised in the same
way as provisions for unearned premiums, usually in 12
months at the maximum.
Life insurance business
Classification of insurance contractsPolicies issued by the life insurance business are classified
as either insurance contracts or investment contracts.
Insurance contracts are contracts that carry significant
insurance risk or contracts in which the policyholder has
the right to change the contract by increasing the risk. As
capital redemption contracts do not carry insurance risk,
these contracts are classified as investment contracts.
The discretionary participation feature (DPF) of a contract
is a contractual right held by a policyholder to receive
additional benefits, as a supplement to the guaranteed
minimum benefits. The supplements are bonuses based
on the reserves of policies credited to the policy reserve,
additional benefits in the case of death, or lowering of
insurance premiums. In Mandatum, the principle of fair-
ness specifies the application of this feature. In unit-linked
contracts the policyholder carries the investment risk by
choosing the investment funds linked to the contracts.
Measurement of insurance and investment contractsIn Mandatum, national accounting standards in accordance
with IFRS 4 Insurance contracts are applied to all insurance
contracts and investment contracts with DPF.
All contracts, except unit-linked contracts and the assumed
reinsurance, include DPF. In those unit-linked contracts
which are not insurance contracts, the policyholder has the
possibility to transfer the return on savings from unit-linked
schemes to guaranteed interest with DPF. Thus, the same
standard is applied to these contracts as to contracts with
DPF.
The surrender right, guaranteed interest and the
unbundling of the insurance component from the deposit
component and similar features are not separated and
measured separately.
In Mandatum, regarding the group pension portfolio
transferred from Suomi Mutual (=segregated portfolio),
a so-called shadow accounting is applied, as permitted
in IFRS 4.30, by adjusting the equity with the amount of
unrealised gains and losses of the agreement. The equity
is adjusted with an amount that unrealised gains or losses
would have affected the Segregated Portfolio in accordance
with the profit distribution policy of the Segregated
Portfolio, if the gains or losses had been realised at the
balance sheet date.
In Topdanmark unit-linked contracts include both
insurance and investment contracts. Insurance contracts
are measured in accordance with IFRS 4. Investment
contracts, on the other hand, are measured in accordance
with IAS 39 Financial Instruments: Recognition and
Measurement. Investment contracts do not include
discretionary participation feature.
All unit-linked contracts insurance are payable on
demand at market value. In case of death, 101% of
the amount is payable. This feature is considered an
insignificant insurance risk, and the contracts are
categorized and measured as investment contracts. There
are no other surrender rights and values to take into
consideration.
Insurance and investment contract liabilities and reinsurance assetsLiabilities arising from insurance and investment
contracts consist of provisions for unearned premiums
and outstanding claims. In the life insurance business,
various methods are applied in calculating liabilities
which involve assumptions on matters such as mortality,
morbidity, the yield level of investments, future operating
expenses and the settlement of claims.
Changes in the liabilities of reinsurance have been
calculated at variable rates of exchange.
BOARD OFDIRECTORS’ REPORT
AUDITOR’S REPORT
SAMPO PLC’S FINANCIAL STATEMENTS
Sampo plc’s Notes to the Accounts
GROUP’S IFRS FINANCIAL STATEMENTS
Group’s Notes to the Accounts
56FINANCIAL STATEMENTS 2019

In direct insurance, the insurance liability is calculated by
policy, while in reinsurance it is calculated on the basis of
the reports of the ceding company or the company’s own
bases of calculation.
The interest rate used in discounting liabilities is, at most,
the maximum rate accepted by the authorities in each
country.
The provision for claims outstanding is intended to cover
the anticipated future payments of all claims incurred,
including claims not yet reported to the company (the
“IBNR” provision). The provision for claims outstanding
includes claim payments plus all costs of claim settlements.
The amounts of short- and long-term liabilities in
technical provisions are determined annually.
Liability adequacy testA liability adequacy test is applied to all portfolios and the
need for augmentation is checked, company by company,
on the basis of the adequacy of the whole technical
provisions. The test includes all the expected contractual
cash flows for non-unit-linked liabilities. The expected
contractual cash flows include expected premiums,
claims, bonuses and expenses. The claims have been
estimated including surrenders and other insurance
transactions based on historical data. The amounts of
claims include the guaranteed interest and an estimation
of future bonuses. The present values of the cash flows
have been discounted to the balance sheet date.
For the unit-linked business, the present values of
the insurance risk and expense results are calculated
correspondingly. If the aggregate amount of the liability
for the unit-linked and other business presumes an
augmentation, the liability is increased by the amount
shown by the test and recognised in profit or loss.
Principle of fairnessAccording to Chapter 13, Section 2 of the Finnish
Insurance Companies’ Act, the Principle of Fairness must
be observed in life insurance and investment contracts
with a discretionary participation feature. If the solvency
requirements do not prevent it, a reasonable part of the
surplus has to be returned to these policies as bonuses.
Mandatum aims at giving a total return before charges
and taxes on the original insurance portfolio’s policy-
holders’ savings in contracts with DPF that is at least the
yield of those long term bonds, which are considered
to have lowest risk. The total return consists of the
guaranteed interest rate and bonuses determined
annually. Continuity is pursued in the level of bonuses.
Employee benefits
Post-employment benefits
Post-employment benefits include pensions and life
insurance.
Sampo has defined benefit plans in Sweden and Norway,
and defined contribution plans in other countries. The
most significant defined contribution plan is that arranged
through the Employees’ Pensions Act (TyEL) in Finland.
In the defined contribution plans, the Group pays fixed
contributions to a pension insurance company and
has no legal or constructive obligation to pay further
contributions. The obligations arising from a defined
c ontribution plan are recognised as an expense in the
period that the obligation relates to.
In the defined benefit plans, the company still has
obligations after paying the contributions for the financial
period and bears their actuarial and/or investment risk.
The obligation is calculated separately for each plan
using the projected unit credit method. In calculating the
amount of the obligation, actuarial assumptions are used.
The pension costs are recognised as an expense for the
service period of employees.
BOARD OFDIRECTORS’ REPORT
AUDITOR’S REPORT
SAMPO PLC’S FINANCIAL STATEMENTS
Sampo plc’s Notes to the Accounts
GROUP’S IFRS FINANCIAL STATEMENTS
Group’s Notes to the Accounts
57FINANCIAL STATEMENTS 2019
Defined benefit plans are both funded and unfunded.
The amounts reported as pension costs during a financial
year consist of the actuarially calculated earnings of
old-age pensions during the year, calculated straight-line,
based on pensionable income at the time of retirement.
The calculated effects in the form of interest expense for
crediting/appreciating the preceding years’ established
pension obligations are then added. The calculation of
pension costs during the financial year starts at the begin-
ning of the year and is based on assumptions about such
factors as salary growth and price inflation throughout
the duration of the obligation and on the current market
interest rate adjusted to take into account the duration of
the pension obligations.
The current year pension cost and the net interest of the
net liability is recognised thru p/l in pension costs. The
actuarial gains and losses and the return of the plan assets
(excl. net interest) are recognised as a separate item in
other comprehensive income.
The fair value of the plan assets covered by the plan
is deducted from the present value of future pension
obligations and the remaining net liability (net asset) is
recognised separately in the balance sheet.
The Group has also certain voluntary defined benefit
plans. These are intra-Group and have no material
significance.
Termination benefits
An obligation based on termination of employment is
recognised as a liability when the Group is verifiably
committed to terminate the employment of one or more
persons before the normal retirement date or to grant
benefits payable upon termination as a result of an offer to
promote voluntary redundancy. As no economic benefit
is expected to flow to the employer from these benefits
in the future, they are recognised immediately as an
expense. Obligations maturing more than 12 months later
than the balance sheet date are discounted. The benefits
payable upon termination at Sampo are the monetary and
pension packages related to redundancy.
Share-based payments
During the financial year, Sampo had four valid share-
based incentive schemes settled in cash (the long-term
incentive schemes 2014 I, 2014 II,2017 I and 2017 II for the
management and key employees). Topdanmark had one
mainly share-settled incentive scheme for the executive
board and senior executives during the financial year.
The schemes have been measured at fair value at the
grant date and at every reporting date thereafter.
In the schemes settled in cash, the valuation is recognised
as a liability and changes recognised through profit or loss.
In the schemes settled in shares, the strike amounts
received on the exercise of the options are recognised in
the shareholder’s equity.
The fair value of the schemes has been determined using
the Black-Scholes-pricing model. The fair value of the
market- based part of the incentive takes into consideration
the model’s forecast concerning the number of incentive
units to be paid as a reward. The effects of non-market
based terms are not included in the fair value of the
incentive; instead, they are taken into account in the
number of those incentive units that are expected to be
exercised during the vesting period. In this respect, the
Group will update the assumption on the estimated final
number of incentive units at every interim or annual
balance sheet date.
Income taxes
Item Tax expenses in the income statement comprise
current and deferred tax. Tax expenses are recognised
through profit or loss, except for items recognised directly
in equity or other comprehensive income, in which case
the tax effect will also be recognised those items. Current
tax is calculated based on the valid tax rate of each country.
Tax is adjusted by any tax related to previous periods.
Deferred tax is calculated on all temporary differences
between the carrying amount of an asset or liability in
BOARD OFDIRECTORS’ REPORT
AUDITOR’S REPORT
SAMPO PLC’S FINANCIAL STATEMENTS
Sampo plc’s Notes to the Accounts
GROUP’S IFRS FINANCIAL STATEMENTS
Group’s Notes to the Accounts
58FINANCIAL STATEMENTS 2019

the balance sheet and its tax base. Deferred tax is not
recognised on non-deductible goodwill impairment, and
nor is it recognised on the undistributed profits of subsidi-
aries to the extent that it is probable that the temporary
difference will not reverse in the foreseeable future.
Deferred tax is calculated by using the enacted tax
rates prior to the balance sheet date. A deferred tax
asset is recognised to the extent that it is probable that
future taxable income will be available against which a
temporary difference can be utilised.
Share capital
The incremental costs directly attributable to the issue of
new shares or options or to the acquisition of a business
are included in equity as a deduction, net of tax, from the
proceeds.
Dividends are recognised in equity in the period when
they are approved by the Annual General Meeting. When
the parent company or other Group companies purchase
the parent company’s equity shares, the consideration
paid is deducted from the equity as treasury shares until
they are cancelled. If such shares are subsequently sold or
reissued, any consideration received is included in equity.
Cash and cash equivalents
Cash and cash equivalents comprise cash and short-term
deposits (3 months).
Sampo presents cash flows from operating activities
using the indirect method in which the profit (loss) before
taxation is adjusted for the effects of transactions of a
non-cash nature, deferrals and accruals, and income and
expense associated with investing or financing cash flows.
In the cash flow statement, interest received and paid
is presented in cash flows from operating activities. In
addition, the dividends received are included in cash
flows from operating activities. Dividends paid are
presented in cash flows from financing.
Accounting policies requiring management judgement and key sources of estimation uncertainties
Preparation of the accounts in accordance with the
IFRS requires management estimates and assumptions
that affect the revenue, expenses, assets, liabilities
and contingent liabilities presented in the financial
statements. Judgement is needed also in the application
of accounting policies. The estimates made are based on
the best information available at the balance sheet date.
The estimation is based on historical experiences and
most probable assumptions concerning the future at the
balance sheet date. The actual outcome may deviate from
results based on estimates and assumptions. Any changes
in the estimates will be recognised in the financial year
during which the estimate is reviewed and in all subse-
quent periods.
Sampo’s main assumptions concerning the future and
the key uncertainties related to balance sheet estimates
are related, for example, to assumptions used in actuarial
calculations, determination of fair values of non-quoted
financial assets and liabilities and investment property
and determination of the impairment of financial
assets and intangible assets. From Sampo’s perspective,
accounting policies concerning these areas require most
significant use of estimates and assumptions.
Actuarial assumptions
Evaluation of insurance liabilities always involves
uncertainty, as technical provisions are based on
estimates and assumptions concerning future claims
costs. The estimates are based on statistics on historical
claims available to the Group on the balance sheet date.
The uncertainty related to the estimates is generally
greater when estimating new insurance portfolios or
portfolios where clarification of a loss takes a long time
because complete claims statistics are not yet available.
In addition to the historical data, estimates of insurance
liabilities take into consideration other matters such
as claims development, the amount of unpaid claims,
BOARD OFDIRECTORS’ REPORT
AUDITOR’S REPORT
SAMPO PLC’S FINANCIAL STATEMENTS
Sampo plc’s Notes to the Accounts
GROUP’S IFRS FINANCIAL STATEMENTS
Group’s Notes to the Accounts
59FINANCIAL STATEMENTS 2019

legislative changes, court rulings and the general
economic situation.
A substantial part of the Group’s P&C insurance liabilities
concerns statutory accident and traffic insurance. The
most significant uncertainties related to the evaluation
of these liabilities are assumptions about inflation,
mortality, discount rates and the effects of legislative
revisions and legal practices.
The actuarial assumptions applied to life insurance
liabilities are discussed in more detail under 'Insurance
and investment contract liabilities and reinsurance assets'.
Defined benefit plans as intended in IAS 19 are also
estimated in accordance with actuarial principles. As the
calculation of a pension plan reserve is based on expected
future pensions, assumptions must be made not only
of discount rates, but also of matters such as mortality,
employee turnover, price inflation and future salaries.
Determination of fair value
The fair value of any non-quoted financial assets is
determined using valuation methods that are generally
accepted in the market. These methods are discussed in
more detail above under 'Fair value'.
Fair values of investment property have been determined
internally during the financial year on the basis of
comparative information derived from the market. They
include management assumptions concerning market
return requirements and the discount rate applied.
Impairment tests
Goodwill, intangible assets not yet available for use,
and intangible assets with an indefinite useful life are
tested for impairment at least annually. The recoverable
amounts from cash-generating units have mainly been
determined using calculations based on value in use.
These require management estimates on matters such as
future cash flows, the discount rate, and general economic
growth and inflation.
Application of new or revised ifrss and interpretations
The Group will apply the following new or amended
standards and interpretations related to the Group’s
business in later financial years when they become
effective, or if the effective date is other than the
beginning of the financial year, during the financial year
following the effective date.
The amendments to IFRS 9 Financial Instruments
(effective for annual periods beginning on 1 Jan 2018 or
after) supersede IAS 39 Financial Instruments: Recognition
and Measurement. Sampo is going to utilise the temporary
exception option, outlined in the next chapter, and apply
the standard on the annual period beginning on 1 Jan
2022.The new standard changes the classification and
measurement of financial assets and includes a new
impairment model based on expected credit losses. The
hedge accounting will continue to have three different
hedging relationships.
As the upcoming IFRS 4 superseding standard IFRS 17
Insurance Contracts (by IASB tentative decision effective
for annual periods beginning on 1 Jan 2022 or after) will
have an impact on the insurance liabilities valuation, the
insurance companies have been given additional options
regarding the adoption of IFRS 9. If certain preconditions
regarding the insurance liabilities are met, the company
may apply the so-called temporary exception option and
defer the implementation until the adoption of IFRS 17
standard, at the latest on annual period beginning on 1 Jan
2022. The temporary exemption may be applied, if the
Group’s amount of insurance liabilities is greater than 90%
of the total amount of liabilities. The application is also
possible, if the ratio is greater than 80%, and the Group
does not engage in a significant activity unconnected
with insurance. Another allowed option is to apply IFRS 9
BOARD OFDIRECTORS’ REPORT
AUDITOR’S REPORT
SAMPO PLC’S FINANCIAL STATEMENTS
Sampo plc’s Notes to the Accounts
GROUP’S IFRS FINANCIAL STATEMENTS
Group’s Notes to the Accounts
60FINANCIAL STATEMENTS 2019

from 1 Jan 2018 on, but to remove some of the accounting
mismatches, caused by the different valuation methods
of assets and liabilities, from the income statement and
transfer them to other comprehensive income.
The Group has analyzed the preconditions for applying
the temporary exemption, and stated that they are met.
Therefore, the Group will apply the exemption and apply
IFRS 9 standard at the same time with the upcoming IFRS
17 standard. The Group has started analyzing the effects
of applications in all the other areas as well, as the new
standards will have a significant impact on the Group’s
financial statements.
The Group’s associate Nordea has applied IFRS 9 standard
in its financial statements from 1 January 2018 on.
European Commission had not at the balance sheet date
endorsed IFRS 17 standard to be adopted in the EU. In
addition, IASB has announced that it might take into
consideration some amendments to IFRS 17 standard
before its effective date.
BOARD OFDIRECTORS’ REPORT
AUDITOR’S REPORT
SAMPO PLC’S FINANCIAL STATEMENTS
Sampo plc’s Notes to the Accounts
GROUP’S IFRS FINANCIAL STATEMENTS
Group’s Notes to the Accounts
61FINANCIAL STATEMENTS 2019
Segment Information
Geographical information has been disclosed about
income from external customers and non-current
assets. The reported areas are Finland, Sweden, Norway,
Denmark and the Baltic countries.
Segment information has been produced in accordance
with the accounting policies adopted for preparing and
presenting the consolidated financial statements.The
segment revenue, expense, assets and liabilities, either
directly attributable or reasonably allocable, have been
allocated to the segments. Inter-segment pricing is based
on market prices. The transactions, assets and liabilities
between the segments are eliminated in the consolidated
financial statements on a line-by-line basis.
Depreciation and amortisation by segment are disclosed
in notes 10–12 and investments in associates in note 13.
BOARD OFDIRECTORS’ REPORT
AUDITOR’S REPORT
SAMPO PLC’S FINANCIAL STATEMENTS
Sampo plc’s Notes to the Accounts
GROUP’S IFRS FINANCIAL STATEMENTS
Group’s Notes to the Accounts
62FINANCIAL STATEMENTS 2019

EURm IfTop-
danmark Mandatum HoldingElimi- nation Group
Insurance premius written 4,475 2,677 1,596 - - 8,749
Net income from investments 229 1,037 1,267 -2 -15 2,515
Other operating income 33 3 23 16 -15 60
Claims incurred -2,751 -1,223 -1,492 - - -5,466
Change in liabilities for insurance and investment contracts -87 -1,864 -971 - 3 -2,919
Staff costs -558 -272 -52 -15 - -897
Other operating expenses -443 -131 -81 -13 15 -653
Finance costs -16 -10 -9 10 12 -13
Share of associates' profit/loss 1 22 0 298 - 321
- Valuation loss on dividend distribution of associate shares - - - -155 - -155
Profit before taxes 884 238 280 139 0 1,541
Taxes -192 -53 -58 -1 - -304
Profit for the year 692 185 222 138 0 1,237
EURm IfTop-
danmark Mandatum HoldingElimi- nation Group
Other comprehensive income for the period
Items reclassifiable to profit or loss
Exchange differences -33 -2 - -4 - -39
Available-for-sale financial assets 285 - 114 147 20 566
Share of associate's other comprehensive income - - - -30 - -30
Taxes -63 - -27 -29 -4 -123
Total items reclassifiable to profit or loss, net of tax 189 -2 87 83 16 373
Items not reclassifiable to profit or loss
Actuarial gains and losses from defined pension plans -58 - - - - -58
Taxes 13 - - - - 13
Total items not reclassifiable to profit or loss, net of tax -45 - - - - -45
TOTAL COMPREHENSIVE INCOME FOR THE YEAR 836 183 308 222 16 1,565
Profit attributable to
Owners of the parent 1,130
Non-controlling interests 107
Total comprehensive income attributable to
Owners of the parent 1,458
Non-controlling interests 107
Consolidated Income Statement by Business Segment for Year Ended 31 December 2019
BOARD OFDIRECTORS’ REPORT
AUDITOR’S REPORT
SAMPO PLC’S FINANCIAL STATEMENTS
Sampo plc’s Notes to the Accounts
GROUP’S IFRS FINANCIAL STATEMENTS
Group’s Notes to the Accounts
63FINANCIAL STATEMENTS 2019

Consolidated Income Statement by Business Segment for Year Ended 31 December 2018
EURm IfTop-
danmark Mandatum HoldingElimi- nation Group
Insurance premius written 4,325 2,509 1,074 - -1 7,907
Net income from investments 229 -280 -26 2 -28 -104
Other operating income 30 3 212 17 -18 244
Claims incurred -2,716 -1,198 -1,116 - 15 -5,015
Change in liabilities for insurance and investment contracts -35 -458 426 - -18 -85
Staff costs -529 -269 -46 -11 - -855
Other operating expenses -445 -119 -67 -14 18 -627
Finance costs -15 -11 -7 3 12 -18
Share of associates' profit/loss 4 22 0 621 - 647
Profit before taxes 848 199 450 618 -20 2,094
Taxes -187 -43 -91 0 4 -317
Profit for the year 661 156 360 618 -16 1,778
EURm IfTop-
danmark Mandatum HoldingElimi- nation Group
Other comprehensive income for the period
Items reclassifiable to profit or loss
Exchange differences -87 -9 - -2 - -97
Available-for-sale financial assets -364 - -314 -61 - -739
Share of associate's other comprehensive income - - - -61 - -61
Taxes 80 - 67 12 - 159
Total items reclassifiable to profit or loss, net of tax -372 -9 -247 -112 - -739
Items not reclassifiable to profit or loss
Actuarial gains and losses from defined pension plans -6 - - - - -6
Taxes 1 - - - - 1
Total items not reclassifiable to profit or loss, net of tax -5 - - - - -5
TOTAL COMPREHENSIVE INCOME FOR THE YEAR 284 147 112 506 -16 1,034
Profit attributable to
Owners of the parent 1,687
Non-controlling interests 91
Total comprehensive income attributable to
Owners of the parent 943
Non-controlling interests 91
BOARD OFDIRECTORS’ REPORT
AUDITOR’S REPORT
SAMPO PLC’S FINANCIAL STATEMENTS
Sampo plc’s Notes to the Accounts
GROUP’S IFRS FINANCIAL STATEMENTS
Group’s Notes to the Accounts
64FINANCIAL STATEMENTS 2019

Consolidated Balance Sheet by Business Segment at 31 December 2019
EURm Group
Equity
Share capital 98
Reserves 1,530
Retained earnings 10,062
Other components of equity 217
Equity attributable to parent company's equity holders 11,908
Non-controlling interests 635
Total equity 12,542
Total equity and liabilities 51,939
EURm IfTop-
danmark Mandatum HoldingElimi- nation Group
Assets
Property, plant and equipment 153 127 14 8 - 302
Investment property 2 540 138 - - 679
Intangible assets 544 1,443 162 2 - 2,151
Investments in associates 14 223 1 6,979 - 7,217
Financial assets 10,726 6,916 4,671 5,168 -4,039 23,443
Investments related to unit-linked insurance contracts - 4,832 8,170 - -27 12,975
Tax assets 19 3 - 0 -4 19
Reinsurers' share of insurance liabilities 210 78 1 - - 289
Other assets 1,759 239 137 58 -9 2,185
Cash and cash equivalents 331 74 952 1,321 - 2,677
Total assets 13,759 14,476 14,247 13,535 -4,079 51,939
Liabilities
Liabilities for insurance and investment contracts 8,778 5,337 3,926 - - 18,041
Liabilities for unit-linked insurance and investment contracts - 6,278 8,117 - -27 14,368
Subordinated debt 396 234 349 494 -271 1,202
Other financial liabilities 25 100 15 3,452 - 3,592
Tax liabilities 281 171 121 15 - 587
Provisions 20 - - - - 20
Employee benefits 99 - - - - 99
Other liabilities 908 320 197 73 -9 1,489
Total liabilities 10,506 12,440 12,724 4,034 -308 39,396
BOARD OFDIRECTORS’ REPORT
AUDITOR’S REPORT
SAMPO PLC’S FINANCIAL STATEMENTS
Sampo plc’s Notes to the Accounts
GROUP’S IFRS FINANCIAL STATEMENTS
Group’s Notes to the Accounts
65FINANCIAL STATEMENTS 2019

Consolidated Balance Sheet by Business Segment at 31 December 2018
EURm Group
Equity
Share capital 98
Reserves 1,530
Retained earnings 10,944
Other components of equity -186
Equity attributable to parent company's equity holders 12,386
Non-controlling interests 628
Total equity 13,014
Total equity and liabilities 49,340
Geographical Information
EURm Finland Sweden Norway Denmark Baltic Total2019
Revenue from external customers 2,515 1,510 1,382 3,162 176 8,744
Non-current assets 437 7,483 73 2,350 7 10,350
2018
Revenue from external customers 1,992 1,488 1,327 2,989 169 7,965
Non-current assets 404 8,263 13 2,353 1 11,034
The revenue includes insurance premiums according to the underwriting country, consisting of premiums earned for P&C insurance and premiums written for life insurance, and net investment income and other operating income in the holding segment.
Non-current assets comprise of intangible assets, investments in associates, property, plant and equipment, and investment property.
EURm IfTop-
danmark Mandatum HoldingElimi- nation Group
Assets
Property, plant and equipment 24 130 5 3 - 162
Investment property 4 513 148 - - 665
Intangible assets 512 1,472 158 0 - 2,143
Investments in associates 14 225 3 7,823 - 8,065
Financial assets 10,753 6,028 4,902 5,069 -4,058 22,693
Investments related to unit-linked insurance - 3,735 6,960 - -24 10,671
Tax assets 11 2 - 15 -4 24
Reinsurers' share of insurance liabilities 208 85 1 - - 294
Other assets 1,704 279 182 107 -8 2,263
Cash and cash equivalents 294 34 586 1,448 - 2,361
Total assets 13,525 12,502 12,944 14,465 -4,095 49,340
Liabilities
Liabilities for insurance and investment contracts 8,934 5,259 4,221 - - 18,415
Liabilities for unit-linked insurance and investment contracts - 4,460 6,955 - -24 11,390
Subordinated debt 400 234 100 -271 464
Other financial liabilities 4 105 33 4,104 - 4,247
Tax liabilities 207 188 96 - -4 487
Provisions 18 - - - - 18
Employee benefits 51 - - - - 51
Other liabilities 785 227 173 78 -9 1,254
Total liabilities 10,401 10,473 11,578 4,182 -308 36,326
BOARD OFDIRECTORS’ REPORT
AUDITOR’S REPORT
SAMPO PLC’S FINANCIAL STATEMENTS
Sampo plc’s Notes to the Accounts
GROUP’S IFRS FINANCIAL STATEMENTS
Group’s Notes to the Accounts
66FINANCIAL STATEMENTS 2019

Equity interest held by non-controlling
interestsName Country 2019 2018Topdanmark A/S Denmark 51.8 51.4
Accumulated balances of material non-controlling interests 635 628
The summarised financial information.
Figures are before inter-company eliminations.
Summarised statement of profit or loss
EURm 2019 2018Insurance premius written 1,386 1,290
Net income from investments 537 -144
Other operating income 1 2
Claims incurred -633 -616
Change in liabilities for insurance and investment contracts -965 -236
Staff costs -143 -138
Other operating expenses -52 -47
Finance costs -5 -6
Share of associates' profit/loss 11 11
Profit before taxes 137 116
Taxes -30 -25
Profit for the year attributable to non-controlling interests 107 91
Share of non-controlling interests of the balance sheetEURm 2019 2018Assets
Property, plant and equipment 66 67
Investment property 279 264
Intangible assets 357 341
Investments in associates 116 116
Financial assets 3,580 3,099
Investments related to unit-linked insurance 2,501 1,920
Tax assets 2 1
Reinsurers' share of insurance liabilities 41 44
Other assets 124 143
Cash and cash equivalents 38 17
Total assets 7,103 6,011
Liabilities
Liabilities for insurance and investment contracts 2,762 2,704
Liabilities for unit-linked insurance and investment contracts 3,250 2,293
Subordinated debt 121 120
Other financial liabilities 52 54
Tax liabilities 118 96
Other liabilities 166 117
Total liabilities 6,469 5,383
Total equity attributable to non-controlling interests 635 628
Material Partly-Owned Subsidiairies
BOARD OFDIRECTORS’ REPORT
AUDITOR’S REPORT
SAMPO PLC’S FINANCIAL STATEMENTS
Sampo plc’s Notes to the Accounts
GROUP’S IFRS FINANCIAL STATEMENTS
Group’s Notes to the Accounts
67FINANCIAL STATEMENTS 2019

Business Acquisitions
Year 2019
In December 2019, the Group's subsidiary If
Skadeförsäkring Holding AB(p) acquired the whole capital
stock of a Norwegian Vertikal Helseassistanse AS. The
purchase price was EURm 33 and the acquired net assets
EURm 7. The acquisition had no material impact on
Sampo Group's financial reporting.
Year 2018
The Swedish NDX Intressenter AB became an associate
of the Group in March 2018 with an ownership of 36.25%.
The p/l and balance sheet of the company are presented
in the Holding segment.
The purchase price allocation on the acquisition is presented below:
EURmCost of the business acquisition 241
Net assets acquired without the pre-acquisition goodwill 84
Purchase consideration to be allocated 157
Allocated to other intangible assets
Customer relations 54
Other intangible assets 1
Deferred tax liability related to allocations -12
Goodwill 114
Total 157
The allocations to the customer relations and other intangible assets are amortised over 8 years. Their total net effect sums to about EUR 43 million. The net effect of annual amortisation is about EUR 5 million.
BOARD OFDIRECTORS’ REPORT
AUDITOR’S REPORT
SAMPO PLC’S FINANCIAL STATEMENTS
Sampo plc’s Notes to the Accounts
GROUP’S IFRS FINANCIAL STATEMENTS
Group’s Notes to the Accounts
68FINANCIAL STATEMENTS 2019

1 Insurance premiums writtenEURm 2019 2018
P&C insurance 5,947 5,737
Life insurance
Insurance contracts 2,060 1,751
Investment contracts 1,030 687
Insurance premiums written, gross 9,037 8,174
Reinsurers' shareP&C insurance -281 -259
Life insurance, insurance contracts -7 -7
Reinsurers' share, total -288 -267
Group insurance premiums written total, net ¹) 8,749 7,9071) The change in unearned premiums is presented in note 4, The change in insurance and investment
liabilities.
2 Net income from investments
If
EURm 2019 2018Financial assets
Derivative financial instrumentsGains/losses -15 -34
Loans and receivablesInterest income 9 10
EURm 2019 2018Financial assets available-for-sale
Debt securities
Interest income 162 158
Impairment losses 0 15
Gains/losses 10 18
Exchange differences 0 -2
Equity securities
Gains/losses 92 109
Impairment losses -20 -36
Dividend income 40 47
Total 286 310
Total from financial assets 279 286
Other assetsInvestment properties
Gains/losses 2 1
Expense on other than financial liabilities -6 -6
Effect of discounting annuities -29 -31
Fee and commission expensesAsset management -18 -21
If insurance, total 229 229
Included in gains/losses from financial assets available-for-sale is a net gain of EURm -84 (-23) transferred from the fair value reserve.
Group’s Other Notes to the Accounts
BOARD OFDIRECTORS’ REPORT
AUDITOR’S REPORT
SAMPO PLC’S FINANCIAL STATEMENTS
Sampo plc’s Notes to the Accounts
GROUP’S IFRS FINANCIAL STATEMENTS
Group’s Notes to the Accounts
69FINANCIAL STATEMENTS 2019

Topdanmark
EURm 2019 2018Financial assets
Derivative financial instruments
Gains/losses 44 -32
Financial assets for trading
Debt securities
Interest income 103 89
Gains/losses -27 -54
Equity securities
Gains/losses 146 -46
Dividend income 23 26
Total 244 15
Investments related to unit-linked contracts
Debt securities
Interest income 82 71
Gains/losses -35 -51
Equity securities
Gains/losses 627 -166
Dividend income 87 43
Derivatives
Interest income -44 -35
Gains/losses 158 -108
Other financial assets
Gains/losses 55 -26
Total 929 -273
Loans and receivables
Interest income 3 2
Total from financial assets 1,221 -287
EURm 2019 2018
Net income from investment properties 48 18
Pension tax return -147 4
Effect of discounting annuities, insurance liabilities -82 -12
Other expenses related to investment activities -3 -2
Topdanmark, total 1,037 -280
BOARD OFDIRECTORS’ REPORT
AUDITOR’S REPORT
SAMPO PLC’S FINANCIAL STATEMENTS
Sampo plc’s Notes to the Accounts
GROUP’S IFRS FINANCIAL STATEMENTS
Group’s Notes to the Accounts
70FINANCIAL STATEMENTS 2019
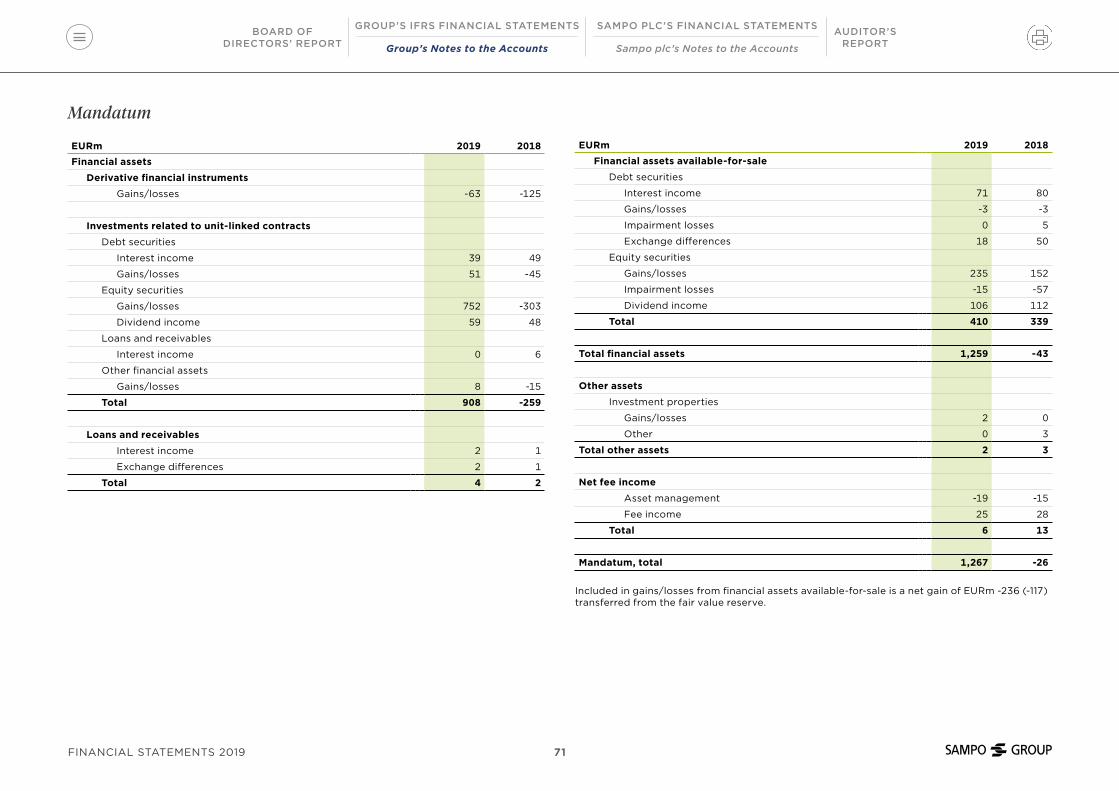
Mandatum
EURm 2019 2018Financial assets
Derivative financial instruments
Gains/losses -63 -125
Investments related to unit-linked contracts
Debt securities
Interest income 39 49
Gains/losses 51 -45
Equity securities
Gains/losses 752 -303
Dividend income 59 48
Loans and receivables
Interest income 0 6
Other financial assets
Gains/losses 8 -15
Total 908 -259
Loans and receivables
Interest income 2 1
Exchange differences 2 1
Total 4 2
EURm 2019 2018Financial assets available-for-sale
Debt securities
Interest income 71 80
Gains/losses -3 -3
Impairment losses 0 5
Exchange differences 18 50
Equity securities
Gains/losses 235 152
Impairment losses -15 -57
Dividend income 106 112
Total 410 339
Total financial assets 1,259 -43
Other assets
Investment properties
Gains/losses 2 0
Other 0 3
Total other assets 2 3
Net fee income
Asset management -19 -15
Fee income 25 28
Total 6 13
Mandatum, total 1,267 -26
Included in gains/losses from financial assets available-for-sale is a net gain of EURm -236 (-117) transferred from the fair value reserve.
BOARD OFDIRECTORS’ REPORT
AUDITOR’S REPORT
SAMPO PLC’S FINANCIAL STATEMENTS
Sampo plc’s Notes to the Accounts
GROUP’S IFRS FINANCIAL STATEMENTS
Group’s Notes to the Accounts
71FINANCIAL STATEMENTS 2019
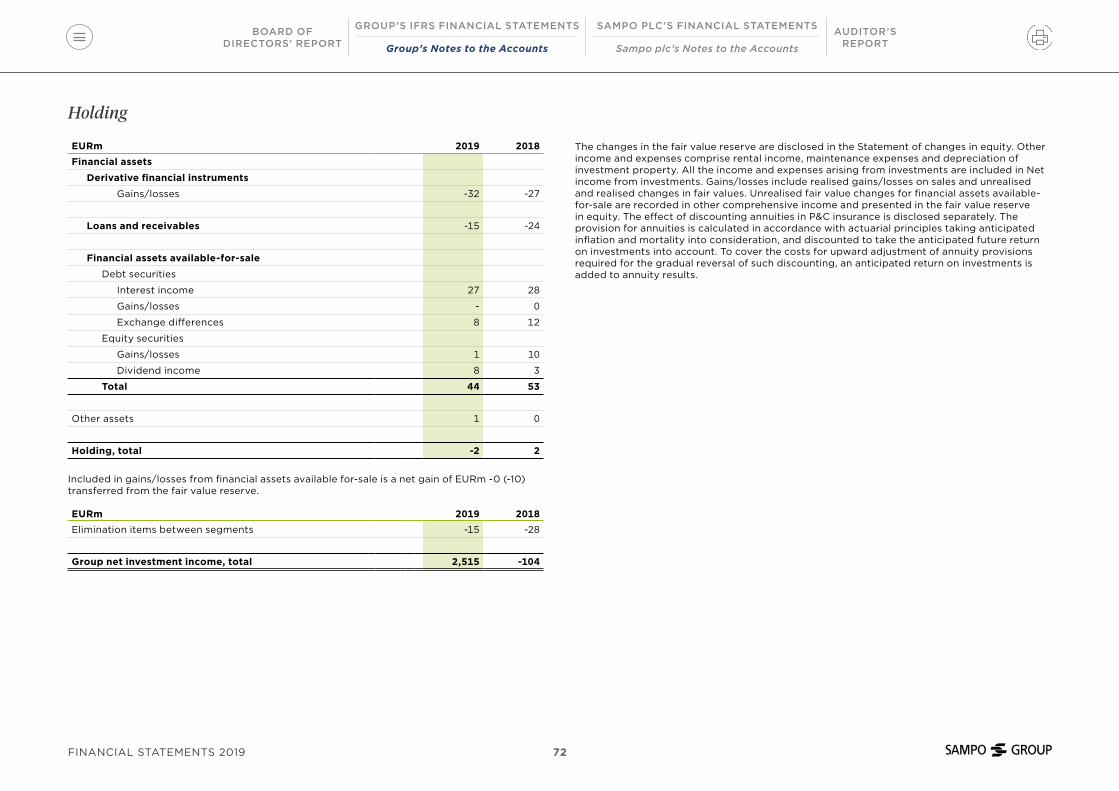
Holding
EURm 2019 2018Financial assets
Derivative financial instruments
Gains/losses -32 -27
Loans and receivables -15 -24
Financial assets available-for-sale
Debt securities
Interest income 27 28
Gains/losses - 0
Exchange differences 8 12
Equity securities
Gains/losses 1 10
Dividend income 8 3
Total 44 53
Other assets 1 0
Holding, total -2 2
Included in gains/losses from financial assets available for-sale is a net gain of EURm -0 (-10) transferred from the fair value reserve.
EURm 2019 2018Elimination items between segments -15 -28
Group net investment income, total 2,515 -104
The changes in the fair value reserve are disclosed in the Statement of changes in equity. Other income and expenses comprise rental income, maintenance expenses and depreciation of investment property. All the income and expenses arising from investments are included in Net income from investments. Gains/losses include realised gains/losses on sales and unrealised and realised changes in fair values. Unrealised fair value changes for financial assets available-for-sale are recorded in other comprehensive income and presented in the fair value reserve in equity. The effect of discounting annuities in P&C insurance is disclosed separately. The provision for annuities is calculated in accordance with actuarial principles taking anticipated inflation and mortality into consideration, and discounted to take the anticipated future return on investments into account. To cover the costs for upward adjustment of annuity provisions required for the gradual reversal of such discounting, an anticipated return on investments is added to annuity results.
BOARD OFDIRECTORS’ REPORT
AUDITOR’S REPORT
SAMPO PLC’S FINANCIAL STATEMENTS
Sampo plc’s Notes to the Accounts
GROUP’S IFRS FINANCIAL STATEMENTS
Group’s Notes to the Accounts
72FINANCIAL STATEMENTS 2019
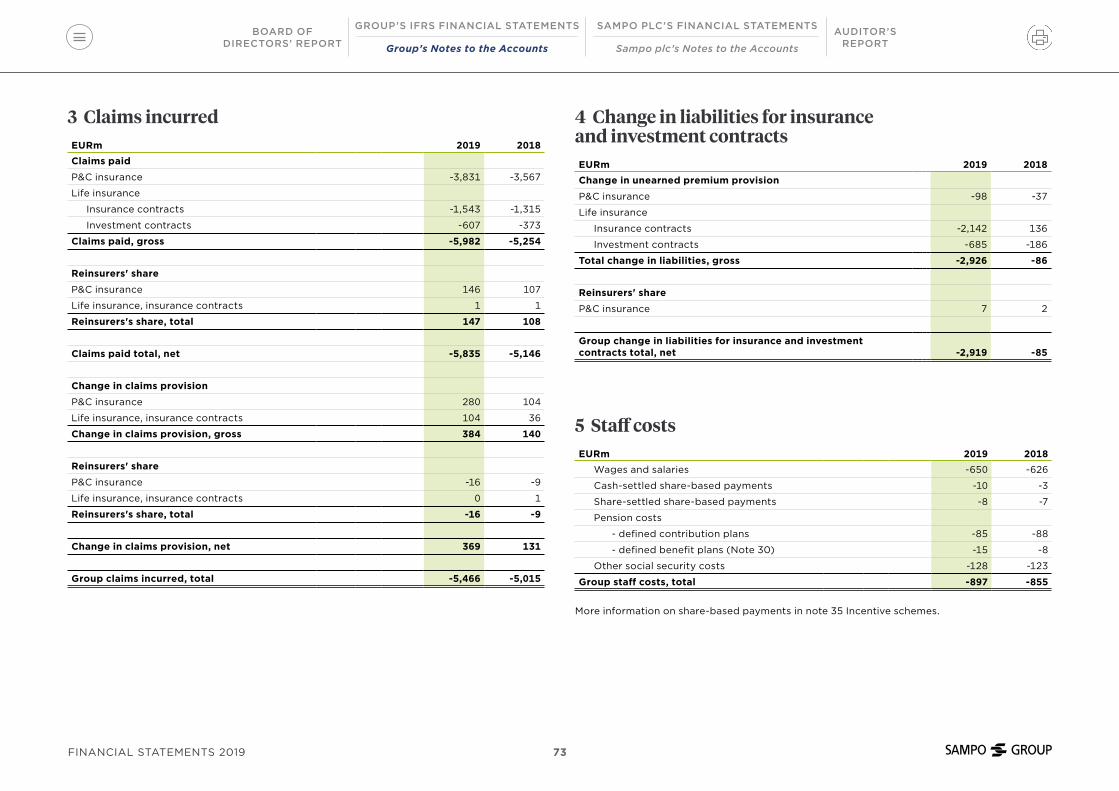
3 Claims incurredEURm 2019 2018Claims paid
P&C insurance -3,831 -3,567
Life insurance
Insurance contracts -1,543 -1,315
Investment contracts -607 -373
Claims paid, gross -5,982 -5,254
Reinsurers' share
P&C insurance 146 107
Life insurance, insurance contracts 1 1
Reinsurers's share, total 147 108
Claims paid total, net -5,835 -5,146
Change in claims provision
P&C insurance 280 104
Life insurance, insurance contracts 104 36
Change in claims provision, gross 384 140
Reinsurers' share
P&C insurance -16 -9
Life insurance, insurance contracts 0 1
Reinsurers's share, total -16 -9
Change in claims provision, net 369 131
Group claims incurred, total -5,466 -5,015
4 Change in liabilities for insurance and investment contractsEURm 2019 2018Change in unearned premium provision
P&C insurance -98 -37
Life insurance
Insurance contracts -2,142 136
Investment contracts -685 -186
Total change in liabilities, gross -2,926 -86
Reinsurers' share
P&C insurance 7 2
Group change in liabilities for insurance and investment contracts total, net -2,919 -85
5 Staff costsEURm 2019 2018
Wages and salaries -650 -626
Cash-settled share-based payments -10 -3
Share-settled share-based payments -8 -7
Pension costs
- defined contribution plans -85 -88
- defined benefit plans (Note 30) -15 -8
Other social security costs -128 -123
Group staff costs, total -897 -855
More information on share-based payments in note 35 Incentive schemes.
BOARD OFDIRECTORS’ REPORT
AUDITOR’S REPORT
SAMPO PLC’S FINANCIAL STATEMENTS
Sampo plc’s Notes to the Accounts
GROUP’S IFRS FINANCIAL STATEMENTS
Group’s Notes to the Accounts
73FINANCIAL STATEMENTS 2019
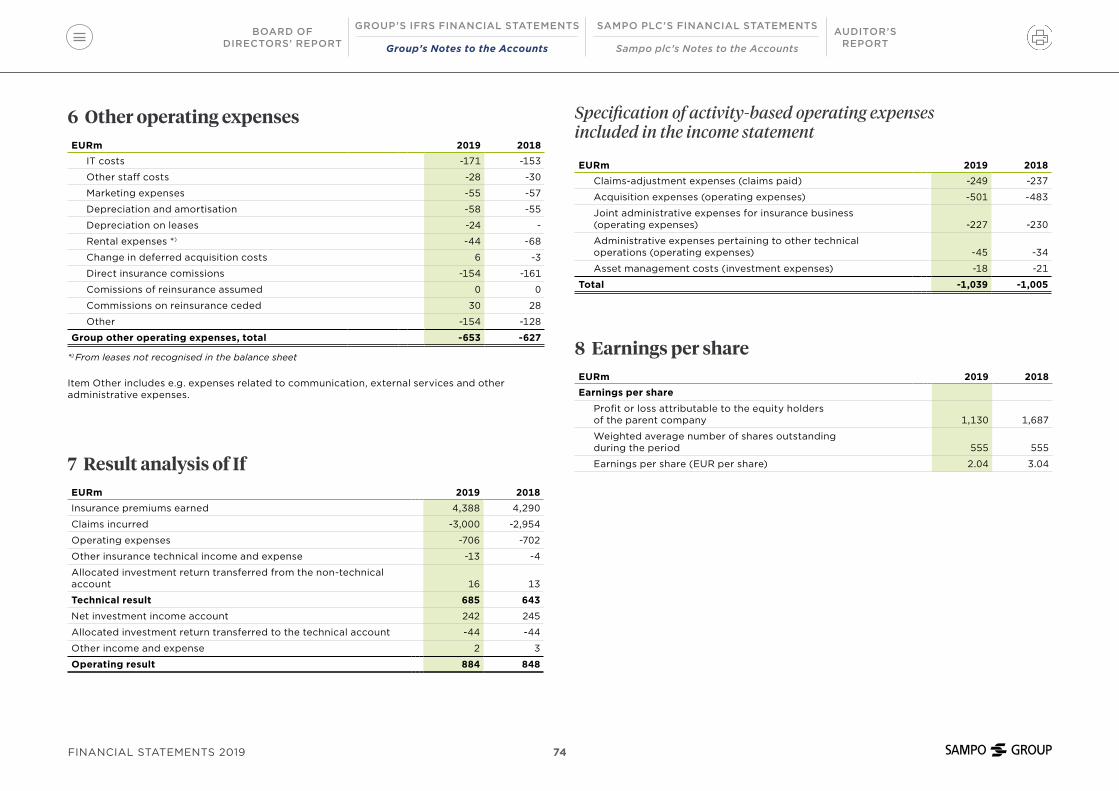
6 Other operating expensesEURm 2019 2018
IT costs -171 -153
Other staff costs -28 -30
Marketing expenses -55 -57
Depreciation and amortisation -58 -55
Depreciation on leases -24 -
Rental expenses *) -44 -68
Change in deferred acquisition costs 6 -3
Direct insurance comissions -154 -161
Comissions of reinsurance assumed 0 0
Commissions on reinsurance ceded 30 28
Other -154 -128
Group other operating expenses, total -653 -627
*) From leases not recognised in the balance sheet
Item Other includes e.g. expenses related to communication, external services and other administrative expenses.
7 Result analysis of IfEURm 2019 2018Insurance premiums earned 4,388 4,290
Claims incurred -3,000 -2,954
Operating expenses -706 -702
Other insurance technical income and expense -13 -4
Allocated investment return transferred from the non-technical account 16 13
Technical result 685 643
Net investment income account 242 245
Allocated investment return transferred to the technical account -44 -44
Other income and expense 2 3
Operating result 884 848
Specification of activity-based operating expenses included in the income statement
EURm 2019 2018Claims-adjustment expenses (claims paid) -249 -237
Acquisition expenses (operating expenses) -501 -483
Joint administrative expenses for insurance business (operating expenses) -227 -230
Administrative expenses pertaining to other technical operations (operating expenses) -45 -34
Asset management costs (investment expenses) -18 -21
Total -1,039 -1,005
8 Earnings per shareEURm 2019 2018Earnings per share
Profit or loss attributable to the equity holders of the parent company 1,130 1,687
Weighted average number of shares outstanding during the period 555 555
Earnings per share (EUR per share) 2.04 3.04
BOARD OFDIRECTORS’ REPORT
AUDITOR’S REPORT
SAMPO PLC’S FINANCIAL STATEMENTS
Sampo plc’s Notes to the Accounts
GROUP’S IFRS FINANCIAL STATEMENTS
Group’s Notes to the Accounts
74FINANCIAL STATEMENTS 2019

9 Financial assets and liabilitiesFinancial assets and liabilities have been categorised in accordance with IAS 39.9. In the table are also included interest income and expenses, realised and unrealised gains and losses recognised in P/L, impairment losses and dividend income arising from those assets and liabilities. The financial assets in the table include balance sheet items Financial assets and Cash and cash equivalents.
2019
EURmCarrying amount
Interest inc./exp.
Gains/losses
Impairment losses
Dividend income
FINANCIAL ASSETS
Financial assets at fair value through p/l
Derivative financial instruments 82 20 -87 - -
Financial assets for trading 6,522 103 118 - 23
Loans and receivables 3,226 14 -5 - -
Financial assets available-for-sale 16,291 247 361 -35 154
Group financial assets, total 26,121 384 387 -35 178
FINANCIAL LIABILITIES
Financial liabilities at fair value through p/l
Derivative financial instruments 168 - -
Other financial liabilities 4,625 -89 77
Group financial liabilities, total 4,794 -89 77
2018
EURmCarrying amount
Interest inc./exp.
Gains/losses
Impairment losses
Dividend income
FINANCIAL ASSETS
Financial assets at fair value through p/l
Derivative financial instruments 72 -11 -207 - -
Financial assets for trading 5,429 89 -99 - 26
Loans and receivables 3,046 12 -18 - -
Financial assets available-for-sale 16,507 254 325 -73 162
Group financial assets, total 25,053 344 1 -73 189
FINANCIAL LIABILITIES
Financial liabilities at fair value through p/l
Derivative financial instruments 169 - -
Other financial liabilities 4,542 -71 53
Group financial liabilities, total 4,711 -71 53
BOARD OFDIRECTORS’ REPORT
AUDITOR’S REPORT
SAMPO PLC’S FINANCIAL STATEMENTS
Sampo plc’s Notes to the Accounts
GROUP’S IFRS FINANCIAL STATEMENTS
Group’s Notes to the Accounts
75FINANCIAL STATEMENTS 2019

10 Property, plant and equipment 2019
EURmRight-of-
use assets 1)Land and buildings
Plant and equipment 2) Total
At 1 January
Cost - 121 121 242
Accumulated depreciation - -4 -77 -80
Net carrying amount at 1 January - 117 44 162
Carrying amount at 1 January - 117 44 162
IFRS 16 adoption 140 - - 140
Additions 23 1 17 42
Disposals - -3 -2 -5
Depreciation -24 0 -14 -38
Exchange differences 2 0 -1 1
Carrying amount at 31 December 141 115 46 302
At 31 December
Cost 165 119 136 420
Accumulated depreciation -24 -4 -90 -118
Net carrying amount at 31 December 141 115 46 302
2018
EURmLand and buildings
Plant and equipment 2) Total
At 1 January
Cost 119 122 241
Accumulated depreciation -2 -81 -83
Net carrying amount at 1 January 118 40 158
Net carrying amount at 1 January 118 40 158
Additions 0 19 19
Disposals - -2 -2
Depreciation 0 -12 -13
Exchange differences 0 0 -1
Net carrying amount at 31 December 117 44 162
At 31 December
Cost 119 138 257
Accumulated depreciation -2 -94 -96
Net carrying amount at 31 December 117 44 162
1) The Group acts as a lessee in various leases of office premises, vehicles and office equipment. Right-of-use assets relate to lease contracts for large office premises.
The Group leases premises mainly for its own use. The expected lease term varies from 2 to 12 years. Most contracts include an option to extend the contract at the term end. Some lease contracts have an option to terminate the contract before the term end.
Variable lease payments are generally linked to consumer price indexes.
If has signed three office lease contracts that have not yet commenced and therefore are not recognized in the balance sheet. Lease terms vary from 7 to 14 years. The new premises will subsequently replace currently leased premises included into the right-of-use assets.
More information on leases in note 31 Other liabilities.2) Equipment in different segments comprise IT equipment and furniture.
BOARD OFDIRECTORS’ REPORT
AUDITOR’S REPORT
SAMPO PLC’S FINANCIAL STATEMENTS
Sampo plc’s Notes to the Accounts
GROUP’S IFRS FINANCIAL STATEMENTS
Group’s Notes to the Accounts
76FINANCIAL STATEMENTS 2019

11 Investment propertyEURm 2019 2018
At 1 January
Cost 771 753
Accumulated depreciation -75 -71
Accumulated impairment losses -32 -29
Net carrying amount at 1 January 665 653
Net carrying amount at 1 January 665 653
Transfers to property, plant and equipment - -9
Additions 121 64
Disposals -101 -35
Depreciation -3 -4
Impairment losses -1 -3
Exchange differences -1 -1
Net carrying amount at 31 December 679 665
At 31 December
Cost 790 771
Accumulated depreciation -78 -75
Accumulated impairment losses -33 -32
Net carrying amount at 31 December 679 665
Rental income from investment property 50 46
Property rented out under operating lease
Non-cancellable minimum rental
- not later than one year 46 38
- later than one year and not later than five years 59 57
- later than five years 24 30
Total 129 124
EURm 2019 2018Expenses arising from investment property
- direct operating expenses arising from investment property generating rental income during the period -22 -28
- direct operating expenses arising from investment property not generating rental income during the period -2 0
Total -23 -28
Fair value of investment property at 31 December 833 745
Fair values for the Group's investment property are entirely determined by the Group based on the market evidence. The determination and hierarchy of financial assets and liabilities at fair value is disclosed in note 17. Based on the principles of this determination, the investment property falls under levels 2 and 3.
The premises in investment property for different segments are leased on market-based, irrevocable contracts. The lengths of the contracts vary from those for the time being to those for several years.
BOARD OFDIRECTORS’ REPORT
AUDITOR’S REPORT
SAMPO PLC’S FINANCIAL STATEMENTS
Sampo plc’s Notes to the Accounts
GROUP’S IFRS FINANCIAL STATEMENTS
Group’s Notes to the Accounts
77FINANCIAL STATEMENTS 2019

2019
EURm Goodwill
Customer relations
and trademark
Other intangible
assets Total
At 1 January
Cost 1,454 602 247 2,303
Accumulated amortisation - -27 -133 -160
Net carrying amount at 1 January 1,454 575 115 2,143
Net carrying amount at 1 January 1,454 575 115 2,143
Business acquisitions 26 7 10 43
Additions - - 46 46
Disposals - -28 0 -28
Depreciation - -27 -15 -43
Exchange differences -9 0 0 -9
Net carrying amount at 31 December 1,471 526 154 2,151
At 31 December
Cost 1,471 581 303 2,354
Accumulated amortisation - -54 -148 -202
Net carrying amount at 31 December 1,471 526 154 2,151
2018
EURm Goodwill
Customer relations
and trademark
Other intangible
assets Total
At 1 January
Cost 1,476 632 210 2,318
Accumulated amortisation - - -122 -122
Net carrying amount at 1 January 1,476 632 87 2,196
Net carrying amount at 1 January 1,476 632 87 2,196
Additions - - 39 39
Disposals - -30 - -30
Depreciation - -27 -11 -38
Exchange differences -23 0 -1 -24
Net carrying amount at 31 December 1,454 575 115 2,143
At 31 December
Cost 1,454 602 247 2,303
Accumulated amortisation - -27 -133 -160
Net carrying amount at 31 December 1,454 575 115 2,143
Goodwill is split between the segments as follows: 2019 2018If 507 490
Topdanmark 810 811
Mandatum 153 153
Total 1,471 1,454
At the business acquisition of Topdanmark, EURm 95 were allocated to trademark. The useful life of trademark is deemed indefinite and it will not be amortised.
Other intangible assets in all segments comprise mainly IT software.
Depreciation and impairment losses are included in the income statement item Other operating expenses.
12 Intangible assets
BOARD OFDIRECTORS’ REPORT
AUDITOR’S REPORT
SAMPO PLC’S FINANCIAL STATEMENTS
Sampo plc’s Notes to the Accounts
GROUP’S IFRS FINANCIAL STATEMENTS
Group’s Notes to the Accounts
78FINANCIAL STATEMENTS 2019
Testing goodwill for impairment
Goodwill is tested for impairment in accordance with IAS 36 Impairment of assets. No impairment losses have been recognised based on these tests.
For the purpose of testing goodwill for impairment, Sampo determines the recoverable amount of its cash-generating units, to which goodwill has been allocated, on the basis of value in use. Sampo has defined these cash-generating units as If Group, Topdanmark Group and Mandatum Life Insurance Company Ltd (Mandatum hereafter).
The recoverable amounts for If and Mandatum have been determined by using a discounted cash flow model. The model is based on Sampo’s management’s best estimates of both historical evidence and economic conditions such as volumes, interest rates, margins, capital structure and income and cost development. The value in use model for Mandatum is greatly influenced by the long-term development of insurance liabilities, affecting e.g. the required solvency capital and thus the recoverable amount. That is why the forecast period is longer for Mandatum, 10 years. The derived cash flows were discounted at the pre-tax rates of the cost of equity which for If was 8.8% and for Mandatum Life 9.6%. The cost of equity is used as the cost of capital as neither company has principal outstanding.
Forecasts for If, approved by the management, cover years 2020 – 2022. The cash flows beyond that have been extrapolated using a 2% growth rate. A 2% growth rate for years beyond 2029 has been used for the for Mandatum Life as well, as it is believed to be close to the anticipated inflation in both cases.
In Mandatum Life, the recoverable amount exceeds its carrying amount by some EURm 570. With the calculation method used, e.g. an increase of about 2% point in the cost of equity combined with a long term 0% growth rate could lead to a situation where the recoverable amount of the entity would equal its carrying amount.
As for the If Group, the management believes that any reasonably possible change in any of these key assumptions would not cause the aggregate carrying amount to exceed the aggregate recoverable amount.
IAS 36 permits determing the recoverable amount by using the fair value less costs to sell. For Topdanmark, the valuation of goodwill has been tested on the balance sheet date by using that method. Topdanmark's share price at the acquisition date 30 September 2017 was 247.70 Danish crowns and 328.40 Danish crowns on 31 December 2019. The fair value of Topdanmark on the balance sheet date exceeds its carrying amount in the Group.
BOARD OFDIRECTORS’ REPORT
AUDITOR’S REPORT
SAMPO PLC’S FINANCIAL STATEMENTS
Sampo plc’s Notes to the Accounts
GROUP’S IFRS FINANCIAL STATEMENTS
Group’s Notes to the Accounts
79FINANCIAL STATEMENTS 2019

Associates that have been accounted for by the equity method at 31 December 2018
EURmName Domicile
Carrying amount Fair value*)
Interest held %
Nordea Bank Abp Finland 7,535 6,255 21.25
NDX Intressenter AB Sweden 289 36.25
Precast Holding Oy Finland 3 20.43
CAP Group AB Sweden 3 21.98
Svithun Assuranse AS Norway 1 33.00
Digiconsept AS Norway 1 34.00
Boligselskapenes Service Senter AS Norway 1 34.00
SOS International A/S Denmark 8 25.23
Bornholms Brandforsikring A/S Denmark 8 27.00
Komplementarselskabet Margretheholm ApS Denmark 0 50.00
Komplementarselskabet Havneholmen ApS Denmark 0 50.00
Margretheholm P/S Denmark 34 50.00
Havneholmen P/S Denmark 66 50.00
P/S Ejendomsholding Banemarksvej Denmark 6 40.00
Komplementarselskabet Banemarksvej ApS Denmark 0 40.00
Carlsberg Byen P/S Denmark 75 22.51
P/S Ottilia København Denmark 0 50.00
Komplementarselskabet Ottilia København ApS Denmark 35 50.00
*) Published price quatation
13 Investments in associates
Associates that have been accounted for by the equity method at 31 December 2019
EURmName Domicile
Carrying amount Fair value*)
Interest held %
Nordea Bank Abp Finland 6,712 5,828 19.87
NDX Intressenter AB Sweden 267 36.25
Precast Holding Oy Finland 3 20.43
CAP Group AB Sweden 3 22.00
Svithun Assuranse AS Norway 1 33.00
Digiconsept AS Norway 1 34.00
Boligselskapenes Service Senter AS Norway 1 34.00
SOS International A/S Denmark 7 25.74
Bornholms Brandforsikring A/S Denmark 9 27.00
Komplementarselskabet Margretheholm ApS Denmark 0 50.00
Komplementarselskabet Havneholmen ApS Denmark 0 50.00
Margretheholm P/S Denmark 42 50.00
Havneholmen P/S Denmark 73 50.00
P/S Ejendomsholding Banemarksvej Denmark 6 40.00
Komplementarselskabet Banemarksvej ApS Denmark 0 40.00
Carlsberg Byen P/S Denmark 55 22.51
Heap A/S Denmark 0 50.00
P/S Ottilia København Denmark 38 50.00
Komplementarselskabet Ottilia København ApS Denmark 0 50.00
*) Published price quatation
BOARD OFDIRECTORS’ REPORT
AUDITOR’S REPORT
SAMPO PLC’S FINANCIAL STATEMENTS
Sampo plc’s Notes to the Accounts
GROUP’S IFRS FINANCIAL STATEMENTS
Group’s Notes to the Accounts
80FINANCIAL STATEMENTS 2019

Changes in investments in associates
2019 2018
EURm NordeaOther
associates Total NordeaOther
associates TotalAt 1 January 7,535 530 8,065 7,578 187 7,765
Share of loss/profit 290 31 321 625 19 644
Valuation loss on dividend distribution of associate shares *) -155 - -155 - - -
Additions - 0 0 - 279 279
Disposals -941 0 -941 -585 -3 -588
Changes in the equity of associates -17 -50 -67 -83 50 -33
Exchange differences - -6 -6 - -3 -3
At 31 December 6,712 505 7,217 7,535 530 8,065
*) The valuation loss on dividend distribution of associate shares comprises the valuation difference between the consolidated carrying amount and the fair value of the shares EURm -143, on the date of the distribution, and the recycling of Nordea-related other comprehensive income items to the profit or loss EURm -11.
The carrying amount of investments in associates included goodwill EURm 922 (986), including goodwill from the Nordea acquisition EURm 915 (978).
BOARD OFDIRECTORS’ REPORT
AUDITOR’S REPORT
SAMPO PLC’S FINANCIAL STATEMENTS
Sampo plc’s Notes to the Accounts
GROUP’S IFRS FINANCIAL STATEMENTS
Group’s Notes to the Accounts
81FINANCIAL STATEMENTS 2019
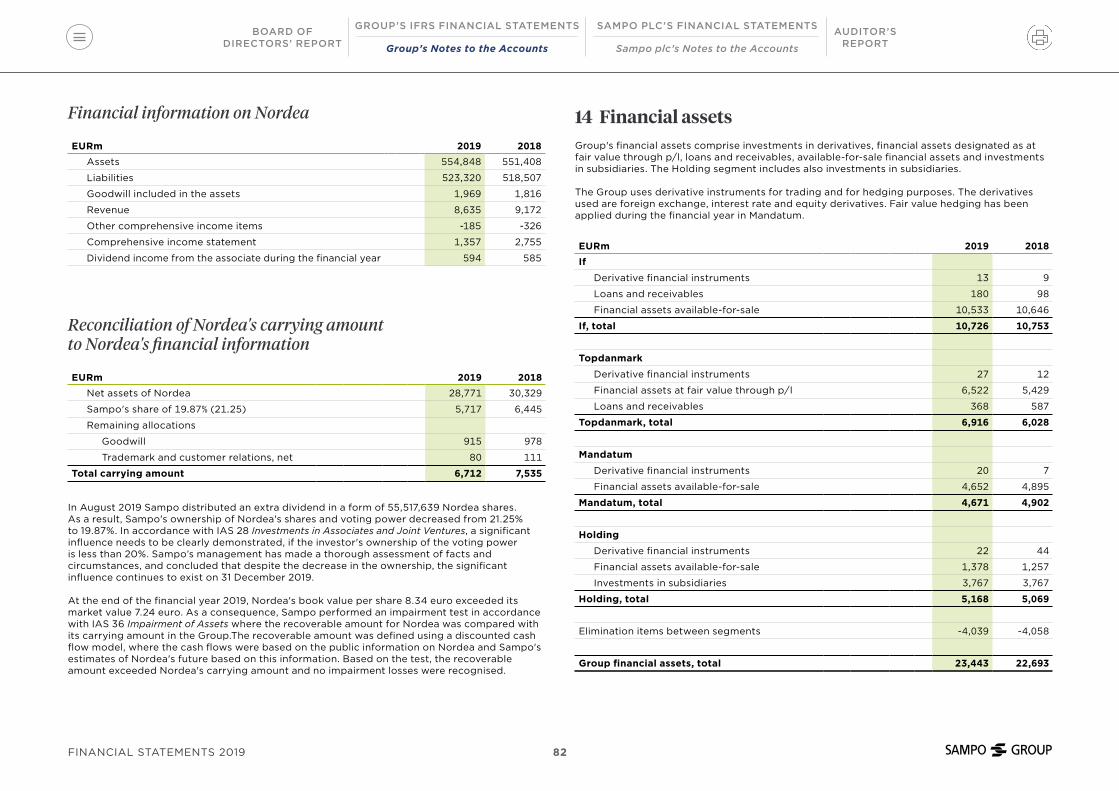
Financial information on Nordea
EURm 2019 2018Assets 554,848 551,408
Liabilities 523,320 518,507
Goodwill included in the assets 1,969 1,816
Revenue 8,635 9,172
Other comprehensive income items -185 -326
Comprehensive income statement 1,357 2,755
Dividend income from the associate during the financial year 594 585
Reconciliation of Nordea's carrying amount to Nordea's financial information
EURm 2019 2018Net assets of Nordea 28,771 30,329
Sampo's share of 19.87% (21.25) 5,717 6,445
Remaining allocations
Goodwill 915 978
Trademark and customer relations, net 80 111
Total carrying amount 6,712 7,535
In August 2019 Sampo distributed an extra dividend in a form of 55,517,639 Nordea shares. As a result, Sampo's ownership of Nordea's shares and voting power decreased from 21.25% to 19.87%. In accordance with IAS 28 Investments in Associates and Joint Ventures, a significant influence needs to be clearly demonstrated, if the investor's ownership of the voting power is less than 20%. Sampo’s management has made a thorough assessment of facts and circumstances, and concluded that despite the decrease in the ownership, the significant influence continues to exist on 31 December 2019.
At the end of the financial year 2019, Nordea's book value per share 8.34 euro exceeded its market value 7.24 euro. As a consequence, Sampo performed an impairment test in accordance with IAS 36 Impairment of Assets where the recoverable amount for Nordea was compared with its carrying amount in the Group.The recoverable amount was defined using a discounted cash flow model, where the cash flows were based on the public information on Nordea and Sampo's estimates of Nordea's future based on this information. Based on the test, the recoverable amount exceeded Nordea's carrying amount and no impairment losses were recognised.
14 Financial assetsGroup's financial assets comprise investments in derivatives, financial assets designated as at fair value through p/l, loans and receivables, available-for-sale financial assets and investments in subsidiaries. The Holding segment includes also investments in subsidiaries.
The Group uses derivative instruments for trading and for hedging purposes. The derivatives used are foreign exchange, interest rate and equity derivatives. Fair value hedging has been applied during the financial year in Mandatum.
EURm 2019 2018If
Derivative financial instruments 13 9
Loans and receivables 180 98
Financial assets available-for-sale 10,533 10,646
If, total 10,726 10,753
Topdanmark
Derivative financial instruments 27 12
Financial assets at fair value through p/l 6,522 5,429
Loans and receivables 368 587
Topdanmark, total 6,916 6,028
Mandatum
Derivative financial instruments 20 7
Financial assets available-for-sale 4,652 4,895
Mandatum, total 4,671 4,902
Holding
Derivative financial instruments 22 44
Financial assets available-for-sale 1,378 1,257
Investments in subsidiaries 3,767 3,767
Holding, total 5,168 5,069
Elimination items between segments -4,039 -4,058
Group financial assets, total 23,443 22,693
BOARD OFDIRECTORS’ REPORT
AUDITOR’S REPORT
SAMPO PLC’S FINANCIAL STATEMENTS
Sampo plc’s Notes to the Accounts
GROUP’S IFRS FINANCIAL STATEMENTS
Group’s Notes to the Accounts
82FINANCIAL STATEMENTS 2019

Derivative financial instruments2019 2018
Fair value Fair value
EURmContract/
notional amount Assets LiabilitiesContract/
notional amount Assets Liabilities
Derivatives held for trading
Interest rate derivatives
OTC derivatives
Interest rate swaps 2,741 53 44 2,750 48 100
Inflation cover 470 0 - - - -
Interest options, bought and sold 503 - 68 - - -
Total interest rate derivatives 3,714 53 112 2,750 48 100
Foreign exchange derivatives
OTC derivatives
Currency forwards 7,063 24 57 10,890 21 63
Currency options, bought and sold 154 2 0 414 3 2
Total foreign exchange derivatives 7,217 26 57 11,304 24 65
Equity derivatives
OTC derivatives
Equity futures 73 0 0 41 - -
Total derivatives held for trading 11,004 79 168 14,096 72 166
Derivatives held for hedging
Fair value hedges
Currency forwards 364 3 - 364 - 4
Group financial derivatives, total 11,369 82 168 14,460 72 169
Fair value hedges
In Mandatum, fair value hedging is used to hedge a proportion of foreign exchange and interest risk in available-for-sale financial assets. The interest elements of forward contracts have been excluded from hedging relationships in foreign exchange hedges. Net result from exchange derivatives designated as fair value hedges amounted to EURm 6 (12). Net result from hedged risks in fair value hedges of available for sale financial assets amounted to EURm -6 (-12).
BOARD OFDIRECTORS’ REPORT
AUDITOR’S REPORT
SAMPO PLC’S FINANCIAL STATEMENTS
Sampo plc’s Notes to the Accounts
GROUP’S IFRS FINANCIAL STATEMENTS
Group’s Notes to the Accounts
83FINANCIAL STATEMENTS 2019

Other financial assets
EURm 2019 2018Financial assets designated as at fair value through p/l
Debt securities 5,840 4,432
Equty securities 682 726
Total financial assets designated as at fair value through p/l 6,522 5,158
Loans and receivables 548 685
Financial assets available-for-sale
Debt securities 12,016 12,888
Equity securities 4,275 3,889
Total financial assets available-for-sale 16,291 16,777
Group other financial assets, total 23,361 22,620
Financial assets available-for-sale include impairment losses EURm 187 (269).
Group financial assets, total 23,443 22,693
15 Fair values2019 2018
EURm Fair valueCarrying
ammount Fair valueCarrying amount
Financial assets, group
Financial assets 23,444 23,443 22,693 22,693
Investments related to unit-linked contracts 12,975 12,975 10,671 10,671
Other assets 17 17 39 39
Cash and cash equivalents 2,677 2,677 2,361 2,361
Total 39,114 39,113 35,764 35,763
Financial liablities, group
Financial liabilities 5,068 4,794 4,793 4,711
Other liabilities 46 46 43 43
Total 5,113 4,839 4,836 4,754
In the table above are presented fair values and carrying amounts of financial assets and liabilities. The detailed measurement bases of financial assets and liabilities are disclosed in the Group Accounting policies.
The fair value of investment securities is assessed using quoted prices in active markets. If published price quotations are not available, the fair value is assessed using discounting method. Values for the discount rates are taken from the market’s yield curve.
The fair value of the derivative instruments is assessed using quoted market prices in active markets, discounting method or option pricing models.
The fair value of loans and other financial instruments which have no quoted price in active markets is based on discounted cash flows, using quoted market rates. The market’s yield curve is adjusted by other components of the instrument, e.g. by credit risk.
The fair value for short-term non-interest-bearing receivables and payables is their carrying amount.
Disclosed fair values are "clean" fair values, i.e. less interest accruals.
BOARD OFDIRECTORS’ REPORT
AUDITOR’S REPORT
SAMPO PLC’S FINANCIAL STATEMENTS
Sampo plc’s Notes to the Accounts
GROUP’S IFRS FINANCIAL STATEMENTS
Group’s Notes to the Accounts
84FINANCIAL STATEMENTS 2019
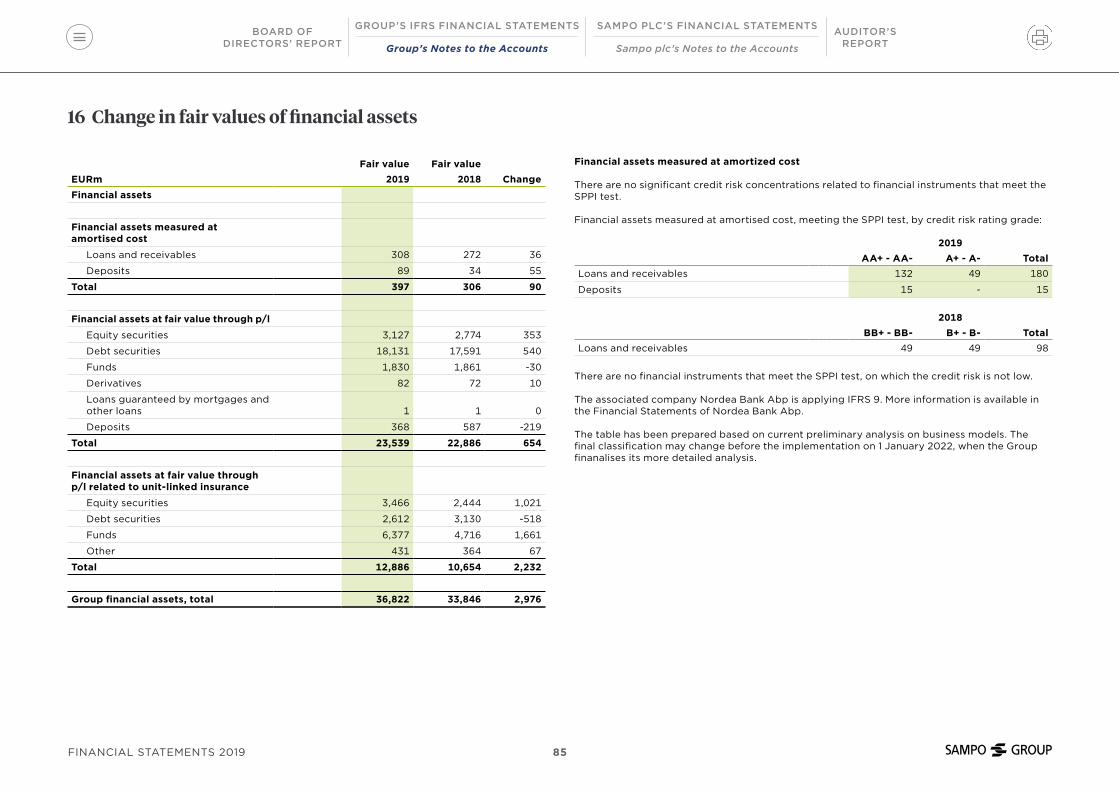
16 Change in fair values of financial assets
Fair value Fair valueEURm 2019 2018 ChangeFinancial assets
Financial assets measured at amortised cost
Loans and receivables 308 272 36
Deposits 89 34 55
Total 397 306 90
Financial assets at fair value through p/l
Equity securities 3,127 2,774 353
Debt securities 18,131 17,591 540
Funds 1,830 1,861 -30
Derivatives 82 72 10
Loans guaranteed by mortgages and other loans 1 1 0
Deposits 368 587 -219
Total 23,539 22,886 654
Financial assets at fair value through p/l related to unit-linked insurance
Equity securities 3,466 2,444 1,021
Debt securities 2,612 3,130 -518
Funds 6,377 4,716 1,661
Other 431 364 67
Total 12,886 10,654 2,232
Group financial assets, total 36,822 33,846 2,976
Financial assets measured at amortized cost
There are no significant credit risk concentrations related to financial instruments that meet the SPPI test.
Financial assets measured at amortised cost, meeting the SPPI test, by credit risk rating grade:
2019AA+ - AA- A+ - A- Total
Loans and receivables 132 49 180
Deposits 15 - 15
2018BB+ - BB- B+ - B- Total
Loans and receivables 49 49 98
There are no financial instruments that meet the SPPI test, on which the credit risk is not low.
The associated company Nordea Bank Abp is applying IFRS 9. More information is available in the Financial Statements of Nordea Bank Abp.
The table has been prepared based on current preliminary analysis on business models. The final classification may change before the implementation on 1 January 2022, when the Group finanalises its more detailed analysis.
BOARD OFDIRECTORS’ REPORT
AUDITOR’S REPORT
SAMPO PLC’S FINANCIAL STATEMENTS
Sampo plc’s Notes to the Accounts
GROUP’S IFRS FINANCIAL STATEMENTS
Group’s Notes to the Accounts
85FINANCIAL STATEMENTS 2019

17 Determination and hierarchy of fair values A large majority of Sampo Group's financial assets are valued at fair value. The valuation is based on either published price quatations or valuation techniques based on market observable inputs, where available. For a limited amount of assets the value needs to be determined using other techniques. The financial instruments measured at fair value have been classified into three hierarchy levels in the notes, depending on e.g. if the market for the instrument is active, or if the inputs used in the valuation technique are observable.
On level 1, the measurement of the instrument is based on quoted prices in active markets for identical assets or liabilities.
On level 2, inputs for the measurement of the instrument include also other than quoted prices observable for the asset or liability, either directly or indirectly by using valuation techniques.
In level 3, the measurement is based on other inputs rather than observable market data. The majority of Sampo Group’s level 3 assets are private equity and alternative funds.
For private equity funds the valuation of the underlying investments is conducted by the fund manager who has all the relevant information required in the valuation process. The valuation is usually updated quarterly based on the value of the underlying assets and the amount of debt in the fund. There are several valuation methods, which can be based on, for example, the acquisition value of the investments, the value of publicly traded peer companies, the multiple based valuation or the cashflows of the underlying investments. Most private equity funds follow the International Private Equity and Venture Capital (IPEV) guidelines which give detailed instructions on the valuation of private equity funds.
For alternative funds the valuation is also conducted by the fund managers. Alternative funds often have complicated structures and the valuation is dependent on the nature of the underlying investments. There are many different valuation methods that can be used, for example, the method based on the cashflows of the underlying investments. The operations and valuation of alternative funds are regulated for example by the Alternative Investment Fund Managers Directive (AIFMD), which determines the principles and documentation requirements of the valuation process.
EURm Level 1 Level 2 Level 3 TotalFINANCIAL ASSETS AT 31 DECEMBER 2019
Financial assets at fair value
Derivative financial instruments
Interest rate swaps - 53 - 53
Foreign exchange derivatives - 0 - 0
Equity derivatives - 29 - 29
Total - 82 - 82
Assets held for trading
Equity securities 483 199 - 682
Debt securities 5,298 497 44 5,840
Total 5,781 696 44 6,522
Financial assets designated at fair value through profit or loss
Deposits - 367 - 367
Financial assets related to unit-linked insurance
Equity securities 3,416 3 18 3,437
Debt securities 918 1,667 26 2,611
Funds 4,686 691 1,000 6,377
Derivative financial instruments - 17 - 17
Other assets - - 120 120
Total 9,019 2,377 1,165 12,561
Financial assets available-for-sale
Equity securities 2,066 - 379 2,446
Debt securities 8,483 3,472 61 12,016
Other assets 903 48 879 1,830
Total 11,452 3,520 1,318 16,291
Total financial assests measured at fair value 26,253 7,043 2,528 35,824
BOARD OFDIRECTORS’ REPORT
AUDITOR’S REPORT
SAMPO PLC’S FINANCIAL STATEMENTS
Sampo plc’s Notes to the Accounts
GROUP’S IFRS FINANCIAL STATEMENTS
Group’s Notes to the Accounts
86FINANCIAL STATEMENTS 2019

EURm Level 1 Level 2 Level 3 TotalOther financial assets
Financial assets at amortised cost
Loans and receivables - 414 180 595
Group financial assets, total 26,253 7,458 2,708 36,418
EURm Level 1 Level 2 Level 3 TotalFINANCIAL LIABILITIES AT 31 DECEMBER 2019
Financial liabilities at fair value
Derivative financial instruments
Interest rate derivatives - 112 - 112
Foreign exchange derivatives - 57 - 57
Total - 168 - 168
Financial liabilities designated as at fair value through p/l
Deposits - - 9 9
Total financial liabilities at fair value - 168 9 178
Other financial liabilities
Subordinated debt securities
Subordinated loans 803 467 - 1,270
Debt securities in issue
Bonds 3,208 396 - 3,604
Total other liabilities 4,011 863 - 4,874
Group financial liabilities, total 4,011 1,032 - 5,052
BOARD OFDIRECTORS’ REPORT
AUDITOR’S REPORT
SAMPO PLC’S FINANCIAL STATEMENTS
Sampo plc’s Notes to the Accounts
GROUP’S IFRS FINANCIAL STATEMENTS
Group’s Notes to the Accounts
87FINANCIAL STATEMENTS 2019
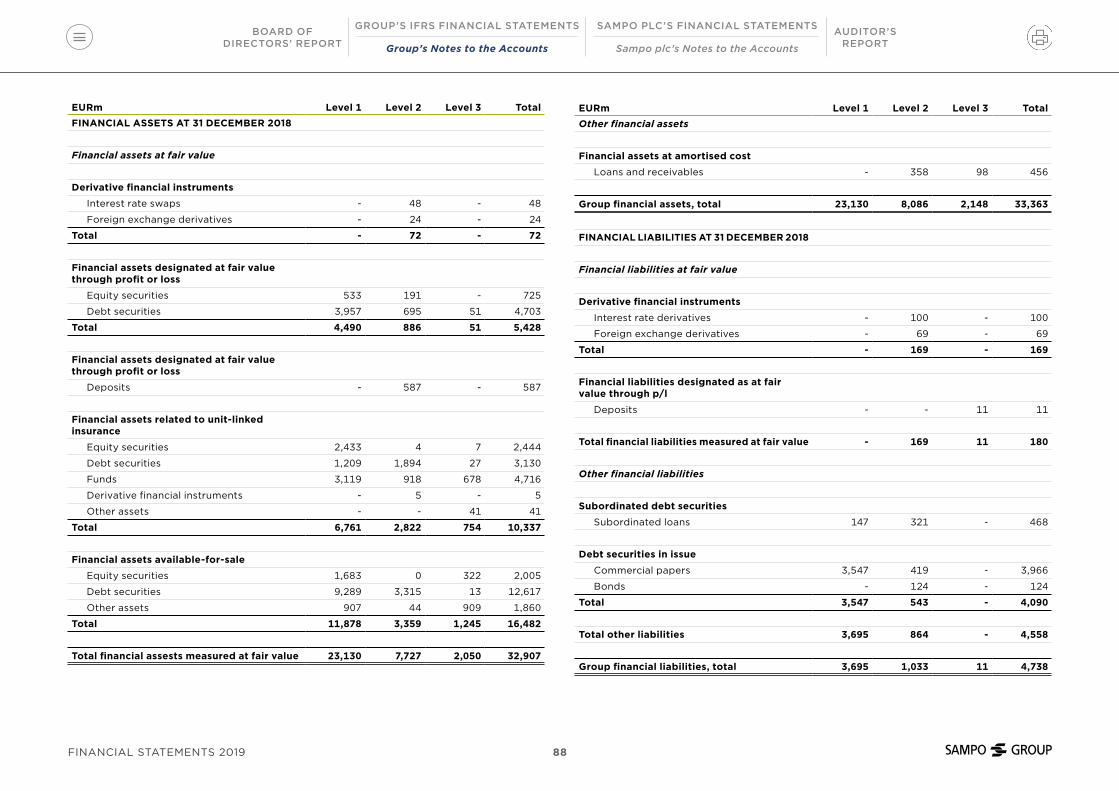
EURm Level 1 Level 2 Level 3 TotalFINANCIAL ASSETS AT 31 DECEMBER 2018
Financial assets at fair value
Derivative financial instruments
Interest rate swaps - 48 - 48
Foreign exchange derivatives - 24 - 24
Total - 72 - 72
Financial assets designated at fair value through profit or loss
Equity securities 533 191 - 725
Debt securities 3,957 695 51 4,703
Total 4,490 886 51 5,428
Financial assets designated at fair value through profit or loss
Deposits - 587 - 587
Financial assets related to unit-linked insurance
Equity securities 2,433 4 7 2,444
Debt securities 1,209 1,894 27 3,130
Funds 3,119 918 678 4,716
Derivative financial instruments - 5 - 5
Other assets - - 41 41
Total 6,761 2,822 754 10,337
Financial assets available-for-sale
Equity securities 1,683 0 322 2,005
Debt securities 9,289 3,315 13 12,617
Other assets 907 44 909 1,860
Total 11,878 3,359 1,245 16,482
Total financial assests measured at fair value 23,130 7,727 2,050 32,907
EURm Level 1 Level 2 Level 3 TotalOther financial assets
Financial assets at amortised cost
Loans and receivables - 358 98 456
Group financial assets, total 23,130 8,086 2,148 33,363
FINANCIAL LIABILITIES AT 31 DECEMBER 2018
Financial liabilities at fair value
Derivative financial instruments
Interest rate derivatives - 100 - 100
Foreign exchange derivatives - 69 - 69
Total - 169 - 169
Financial liabilities designated as at fair value through p/l
Deposits - - 11 11
Total financial liabilities measured at fair value - 169 11 180
Other financial liabilities
Subordinated debt securities
Subordinated loans 147 321 - 468
Debt securities in issue
Commercial papers 3,547 419 - 3,966
Bonds - 124 - 124
Total 3,547 543 - 4,090
Total other liabilities 3,695 864 - 4,558
Group financial liabilities, total 3,695 1,033 11 4,738
BOARD OFDIRECTORS’ REPORT
AUDITOR’S REPORT
SAMPO PLC’S FINANCIAL STATEMENTS
Sampo plc’s Notes to the Accounts
GROUP’S IFRS FINANCIAL STATEMENTS
Group’s Notes to the Accounts
88FINANCIAL STATEMENTS 2019

Transfers between levels 1 and 2
2019 2018
EURm
Transfers from level 2
to level 1
Transfers from level 1
to level 2
Transfers from level 2
to level 1
Transfers from level 1
to level 2Financial assets held for trading
Debt securities - - 1 58
Financial assets related to unit-linked insurance
Equity securities 8 0 17 64
Funds 3 - - 44
Total 11 0 17 108
Financial assets available-for-sale
Debt securities 582 302 461 477
Transfers are based mainly on the changes of trading volume information provided by an external service provider.
Sensitivity analysis of fair values
The sensitivity of financial assets and liabilites to changes in exchange rates is assessed on business area level due to different base currencies. In If, 10 percentage point depreciation of all other currencies against SEK would result in an increase recognised in profit/loss of EURm 12 (1) and in a decrease recognised directly in equity of EURm -10 (-1). In Topdanmark, 10 percentage depreciation of all other currencies against DKK would result in a decrease recognised in profit/loss of EURm -5 (0), but would not have an impact on equity. In Mandatum, 10 percentage point depreciation of all other currencies against EUR would result in an increase recognised in profit/loss of EURm 48 (29) and in a decrease recognised directly in equity of EURm -68 (-67). In Holding, 10 percentage point depreciation of all other currencies against EUR would have no impact in profit/loss, but a decrease recognised in equity of EURm -156 (-249).
The sensitivity analysis of the Group's fair values of financial assets and liabilities in differenct market risk scenarios is presented below. The effects represent the instantaneous effects of a one-off change in the underlying market variable on the fair values on 31 December 2019.
The sensitivity analysis includes the effects of derivative positions. All sensitivities are calculated before taxes.
The debt issued by Sampo plc is not included.
Interest rate Equity
Other financial
investments1% parallel shift down
1% parallel shift up
20% fall in prices
20% fall in prices
Effect recognised in profit/loss 372 -181 -97 -73
Effect recognised directly in equity 285 -258 -656 -195
Total effect 658 -440 -753 -268
BOARD OFDIRECTORS’ REPORT
AUDITOR’S REPORT
SAMPO PLC’S FINANCIAL STATEMENTS
Sampo plc’s Notes to the Accounts
GROUP’S IFRS FINANCIAL STATEMENTS
Group’s Notes to the Accounts
89FINANCIAL STATEMENTS 2019

18 Movements in level 3 financial instruments measured at fair value
EURm 1 Jan
Total gains/losses in income
statement
Total gains/losses recorded in other
comprehensive income Purchases Sales 31 Dec
Gains/losses included in p/l for financial assets at
31 Dec 2019FINANCIAL ASSETS AT 31 DECEMBER 2019
Financial assets held for trading
Debt securities 51 0 - 7 -14 44 0
Financial assets related to unit-linked insurance
Equity securities 7 0 - 11 0 18 0
Debt securities 27 0 - 27 -28 26 -1
Funds 678 13 - 471 -162 1,000 11
713 13 - 510 -191 1,045 11
Financial assets available-for-sale
Equity securities 323 0 -1 67 -10 380 -1
Debt securities 13 0 0 138 -91 60 0
Funds 909 3 -33 124 -125 878 -28
1,245 4 -34 329 -226 1,318 -29
Total financial assests measured at fair value 2,009 17 -34 846 -430 2,408 -18
2019EURm Realised gains/losses Fair value gains and losses TotalTotal gains or losses included in profit or loss for the financial year 17 -33 -17
Total gains or losses included in profit and loss for assets held at the end of the financial year 16 -33 -18
BOARD OFDIRECTORS’ REPORT
AUDITOR’S REPORT
SAMPO PLC’S FINANCIAL STATEMENTS
Sampo plc’s Notes to the Accounts
GROUP’S IFRS FINANCIAL STATEMENTS
Group’s Notes to the Accounts
90FINANCIAL STATEMENTS 2019
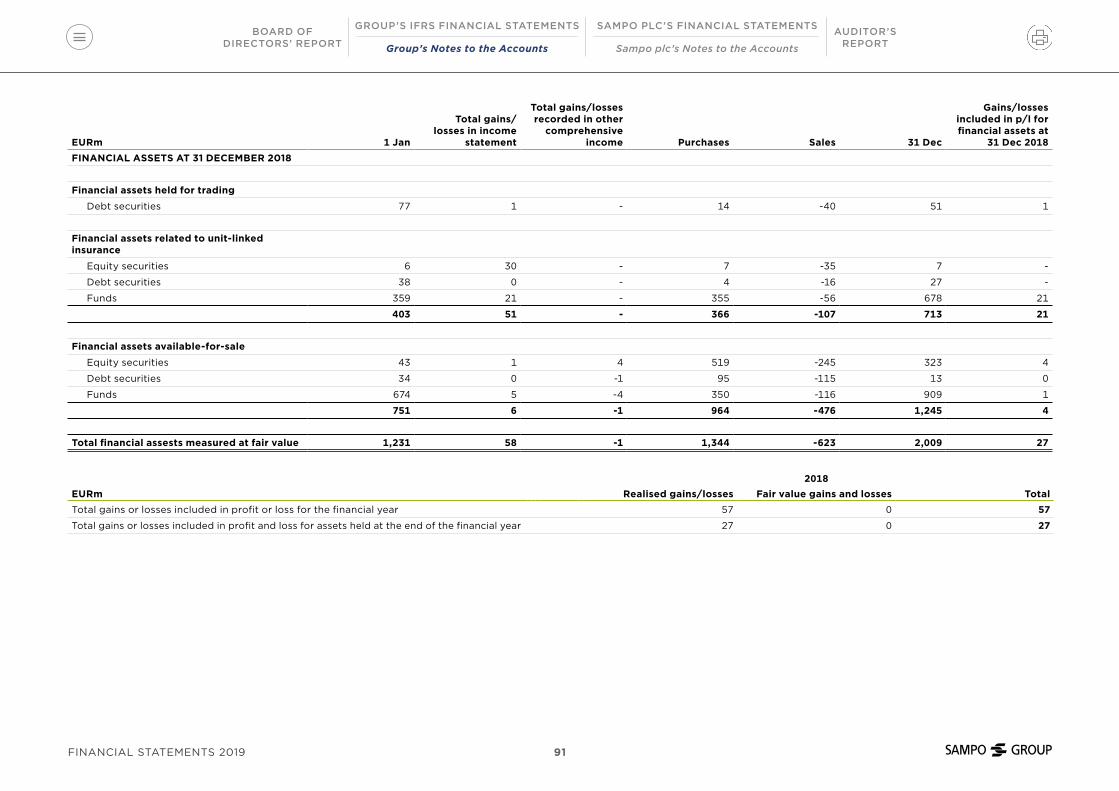
EURm 1 Jan
Total gains/losses in income
statement
Total gains/losses recorded in other
comprehensive income Purchases Sales 31 Dec
Gains/losses included in p/l for financial assets at
31 Dec 2018FINANCIAL ASSETS AT 31 DECEMBER 2018
Financial assets held for trading
Debt securities 77 1 - 14 -40 51 1
Financial assets related to unit-linked insurance
Equity securities 6 30 - 7 -35 7 -
Debt securities 38 0 - 4 -16 27 -
Funds 359 21 - 355 -56 678 21
403 51 - 366 -107 713 21
Financial assets available-for-sale
Equity securities 43 1 4 519 -245 323 4
Debt securities 34 0 -1 95 -115 13 0
Funds 674 5 -4 350 -116 909 1
751 6 -1 964 -476 1,245 4
Total financial assests measured at fair value 1,231 58 -1 1,344 -623 2,009 27
2018EURm Realised gains/losses Fair value gains and losses TotalTotal gains or losses included in profit or loss for the financial year 57 0 57
Total gains or losses included in profit and loss for assets held at the end of the financial year 27 0 27
BOARD OFDIRECTORS’ REPORT
AUDITOR’S REPORT
SAMPO PLC’S FINANCIAL STATEMENTS
Sampo plc’s Notes to the Accounts
GROUP’S IFRS FINANCIAL STATEMENTS
Group’s Notes to the Accounts
91FINANCIAL STATEMENTS 2019

19 Sensitivity analysis of level 3 financial instruments measured at fair value
2019 2018
EURmCarrying amount
Effect of reasonably
possible alternative
assumptions (+ / -)
Carrying amount
Effect of reasonably
possible alternative
assumptions (+ / -)
Financial assets
Financial assets available-for-sale
Equity securities 370 -74 322 -64
Debt securities 61 -4 13 -1
Funds 887 -177 909 -182
Total 1,318 -255 1,245 -248
The value of financial assets regarding the debt security instruments has been tested by assuming a rise of 1 per cent unit in interest rate level in all maturities. For other financial assets, the prices were assumed to go down by 20 per cent. Sampo Group bears no investment risks related to unit-linked insurance, so a change in assumptions regarding these assets does not affect profit or loss. On the basis of the these alternative assumptions, a possible change in interest levels would cause a descend of EURm -4 (-1) for the debt instruments, and EURm -252 (-246) valuation loss for other instruments in the Group's other comprehensive income. The reasonably possible effect, proportionate to the Group's equity, would thus be 2.1 per cent (2.0).
20 Investments related to unit-linked insurance contractsEURm 2019 2018Financial assets designated at fair value through p/l
Debt securities 2,611 3,130
Equity securities 9,528 6,901
Loans and receivables 414 358
Financial derivative instruments 17 5
Other 406 277
Group investments related to unit-linked contracts, total 12,975 10,671
BOARD OFDIRECTORS’ REPORT
AUDITOR’S REPORT
SAMPO PLC’S FINANCIAL STATEMENTS
Sampo plc’s Notes to the Accounts
GROUP’S IFRS FINANCIAL STATEMENTS
Group’s Notes to the Accounts
92FINANCIAL STATEMENTS 2019

21 Deferred tax assets and liabilities
Changes in deferred tax during the financial period 2019
EURm 1 Jan
Recognised in comprehensive
income statementRecognised in
equityExchange
differences 31 Dec
Deferred tax assets
Tax losses carried forward 15 - - - 15
Pension liabilities 15 -2 13 0 26
Other deductible temporary differences 17 -2 2 0 17
Total 47 -4 16 0 58
Netting of deferred taxes -39
Deferred tax assets in the balance sheet 19
Deferred tax liabilities
Depreciation differences and untaxed reserves 185 0 - -1 183
Changes in fair values 126 -1 132 0 257
Other taxable temporary differences 200 -18 3 1 187
Total 510 -19 135 0 627
Netting of deferred taxes -39
Total deferred tax liabilities in the balance sheet 587
BOARD OFDIRECTORS’ REPORT
AUDITOR’S REPORT
SAMPO PLC’S FINANCIAL STATEMENTS
Sampo plc’s Notes to the Accounts
GROUP’S IFRS FINANCIAL STATEMENTS
Group’s Notes to the Accounts
93FINANCIAL STATEMENTS 2019
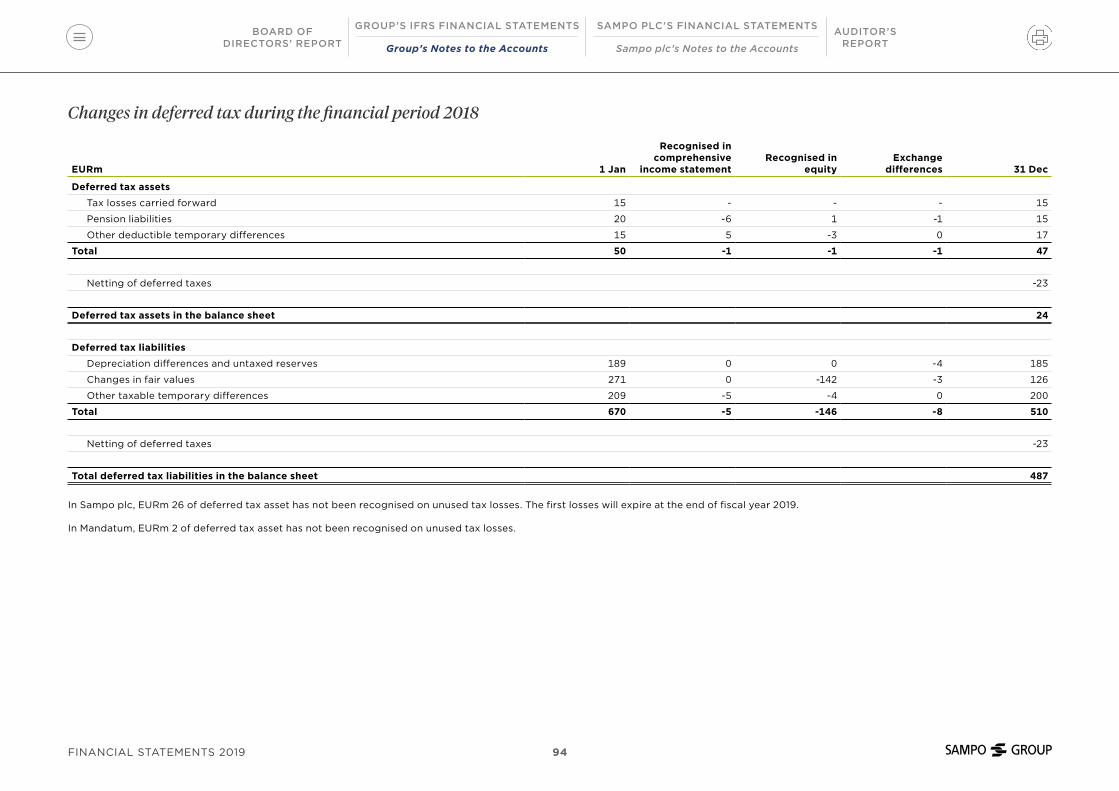
Changes in deferred tax during the financial period 2018
EURm 1 Jan
Recognised in comprehensive
income statementRecognised in
equityExchange
differences 31 Dec
Deferred tax assets
Tax losses carried forward 15 - - - 15
Pension liabilities 20 -6 1 -1 15
Other deductible temporary differences 15 5 -3 0 17
Total 50 -1 -1 -1 47
Netting of deferred taxes -23
Deferred tax assets in the balance sheet 24
Deferred tax liabilities
Depreciation differences and untaxed reserves 189 0 0 -4 185
Changes in fair values 271 0 -142 -3 126
Other taxable temporary differences 209 -5 -4 0 200
Total 670 -5 -146 -8 510
Netting of deferred taxes -23
Total deferred tax liabilities in the balance sheet 487
In Sampo plc, EURm 26 of deferred tax asset has not been recognised on unused tax losses. The first losses will expire at the end of fiscal year 2019.
In Mandatum, EURm 2 of deferred tax asset has not been recognised on unused tax losses.
BOARD OFDIRECTORS’ REPORT
AUDITOR’S REPORT
SAMPO PLC’S FINANCIAL STATEMENTS
Sampo plc’s Notes to the Accounts
GROUP’S IFRS FINANCIAL STATEMENTS
Group’s Notes to the Accounts
94FINANCIAL STATEMENTS 2019
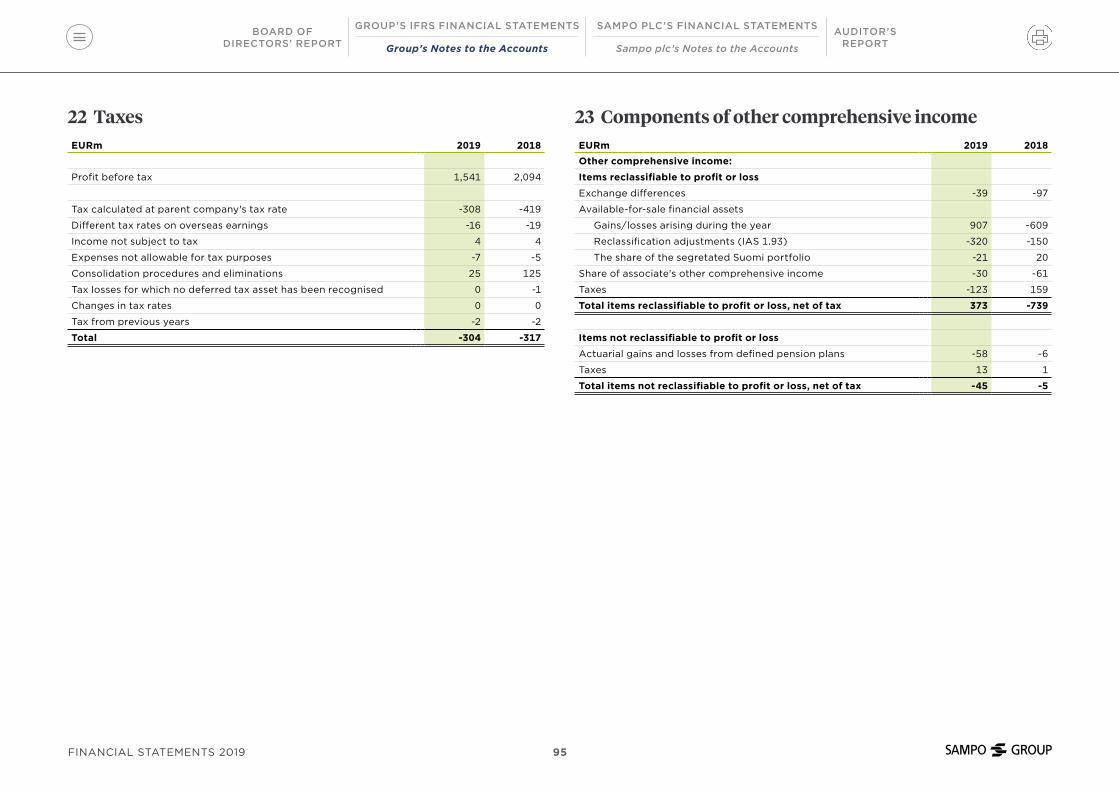
22 TaxesEURm 2019 2018
Profit before tax 1,541 2,094
Tax calculated at parent company's tax rate -308 -419
Different tax rates on overseas earnings -16 -19
Income not subject to tax 4 4
Expenses not allowable for tax purposes -7 -5
Consolidation procedures and eliminations 25 125
Tax losses for which no deferred tax asset has been recognised 0 -1
Changes in tax rates 0 0
Tax from previous years -2 -2
Total -304 -317
23 Components of other comprehensive incomeEURm 2019 2018Other comprehensive income:
Items reclassifiable to profit or loss
Exchange differences -39 -97
Available-for-sale financial assets
Gains/losses arising during the year 907 -609
Reclassification adjustments (IAS 1.93) -320 -150
The share of the segretated Suomi portfolio -21 20
Share of associate's other comprehensive income -30 -61
Taxes -123 159
Total items reclassifiable to profit or loss, net of tax 373 -739
Items not reclassifiable to profit or loss
Actuarial gains and losses from defined pension plans -58 -6
Taxes 13 1
Total items not reclassifiable to profit or loss, net of tax -45 -5
BOARD OFDIRECTORS’ REPORT
AUDITOR’S REPORT
SAMPO PLC’S FINANCIAL STATEMENTS
Sampo plc’s Notes to the Accounts
GROUP’S IFRS FINANCIAL STATEMENTS
Group’s Notes to the Accounts
95FINANCIAL STATEMENTS 2019

25 Other assetsEURm 2019 2018
Interests 125 131
Assets arising from direct insurance operations 1,431 1,357
Assets arising from reinsurance operations 79 59
Settlement receivables 17 39
Deferred acquisition costs *) 154 147
Assets related to Patient Insurance Pool 71 119
Other 309 411
Group other assets, total 2,185 2,263
Item Other comprise rental deposits, salary and travel advancements and assets held for resale.
Other assets include non-current assets EURm 66 (114).
*) Change in deferred acquisition costs in the period
EURm 2019 2018At 1 January 147 152
Net change in the period 7 -3
Exchange differences 0 -2
At 31 December 154 147
24 Tax effects relating to components of other comprehensive income
2019 2018
EURm
Before-tax
amount Tax
Net-of-tax
amount
Before-tax
amount Tax
Net-of-tax
amountItems reclassifiable to profit or loss
Exchange differences -39 - -39 -97 - -97
Available-for-sale financial assets 566 -123 442 -739 159 -580
Share of associate's other comprehensive income -30 - -30 -61 - -61
Total 496 -123 373 -898 159 -739
BOARD OFDIRECTORS’ REPORT
AUDITOR’S REPORT
SAMPO PLC’S FINANCIAL STATEMENTS
Sampo plc’s Notes to the Accounts
GROUP’S IFRS FINANCIAL STATEMENTS
Group’s Notes to the Accounts
96FINANCIAL STATEMENTS 2019
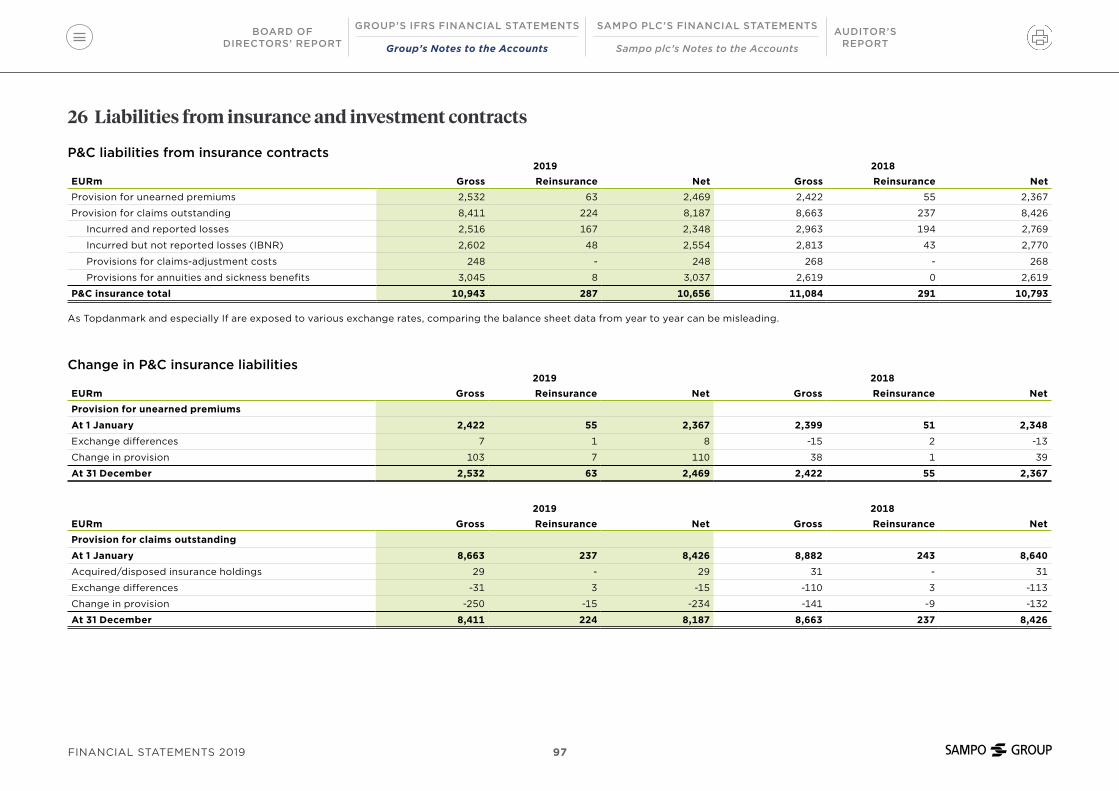
26 Liabilities from insurance and investment contracts
P&C liabilities from insurance contracts2019 2018
EURm Gross Reinsurance Net Gross Reinsurance NetProvision for unearned premiums 2,532 63 2,469 2,422 55 2,367
Provision for claims outstanding 8,411 224 8,187 8,663 237 8,426
Incurred and reported losses 2,516 167 2,348 2,963 194 2,769
Incurred but not reported losses (IBNR) 2,602 48 2,554 2,813 43 2,770
Provisions for claims-adjustment costs 248 - 248 268 - 268
Provisions for annuities and sickness benefits 3,045 8 3,037 2,619 0 2,619
P&C insurance total 10,943 287 10,656 11,084 291 10,793
As Topdanmark and especially If are exposed to various exchange rates, comparing the balance sheet data from year to year can be misleading.
Change in P&C insurance liabilities 2019 2018
EURm Gross Reinsurance Net Gross Reinsurance NetProvision for unearned premiums
At 1 January 2,422 55 2,367 2,399 51 2,348
Exchange differences 7 1 8 -15 2 -13
Change in provision 103 7 110 38 1 39
At 31 December 2,532 63 2,469 2,422 55 2,367
2019 2018EURm Gross Reinsurance Net Gross Reinsurance NetProvision for claims outstanding
At 1 January 8,663 237 8,426 8,882 243 8,640
Acquired/disposed insurance holdings 29 - 29 31 - 31
Exchange differences -31 3 -15 -110 3 -113
Change in provision -250 -15 -234 -141 -9 -132
At 31 December 8,411 224 8,187 8,663 237 8,426
BOARD OFDIRECTORS’ REPORT
AUDITOR’S REPORT
SAMPO PLC’S FINANCIAL STATEMENTS
Sampo plc’s Notes to the Accounts
GROUP’S IFRS FINANCIAL STATEMENTS
Group’s Notes to the Accounts
97FINANCIAL STATEMENTS 2019

The tables below show the cost trend for the claims for different years. The upper part of the tables shows how an estimate of the total claims costs per claims year evolves annually. The lower
section shows how large a share of this is presented in the balance sheet. More information on insurance liabilities in the risk management note 40.
If
Claims cost trend of P&C insurance
Claims costs before reinsurance Estimated claims cost
EURm < 2009 2010 2011 2012 2013 2014 2015 2016 2017 2018 2019 TotalAt the close of the claims year 21,243 2,654 2,735 2,774 2,681 2,661 2,687 2,729 2,766 2,910 3,032
One year later 21,106 2,691 2,842 2,763 2,706 2,654 2,705 2,761 2,803 3,012
Two years later 20,923 2,639 2,838 2,777 2,708 2,661 2,693 2,760 2,798
Three years later 20,746 2,638 2,826 2,768 2,713 2,673 2,669 2,719
Four years later 20,706 2,632 2,801 2,739 2,719 2,678 2,643
Five years later 20,667 2,630 2,786 2,706 2,707 2,648
Six years later 20,782 2,615 2,764 2,687 2,695
Seven years later 20,687 2,608 2,759 2,673
Eight years later 20,636 2,592 2,759
Nine years later 20,489 2,579
Ten years later 20,366
Current estimate of total claims costs 20,366 2,579 2,759 2,673 2,695 2,648 2,643 2,719 2,798 3,012 3,032 47,924
Total disbursed 17,715 2,407 2,570 2,491 2,457 2,379 2,382 2,407 2,410 2,475 1,823 41,517
Provision reported in the balance sheet 2,651 172 189 182 238 268 261 312 388 536 1,209 6,407
of which established vested annuities 1,608 79 75 77 84 85 72 60 52 56 4 2,251
Provision for claims-adjustment costs 221
Total provision reported in the BS of If 6,628
BOARD OFDIRECTORS’ REPORT
AUDITOR’S REPORT
SAMPO PLC’S FINANCIAL STATEMENTS
Sampo plc’s Notes to the Accounts
GROUP’S IFRS FINANCIAL STATEMENTS
Group’s Notes to the Accounts
98FINANCIAL STATEMENTS 2019
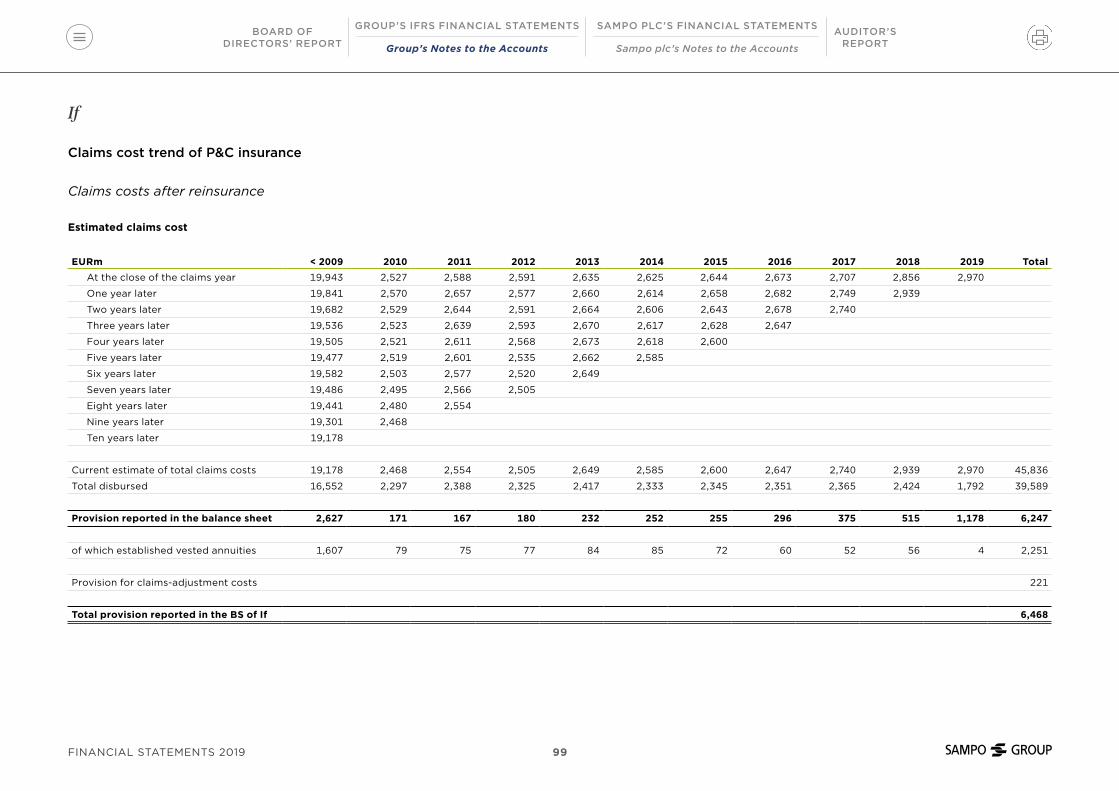
If
Claims cost trend of P&C insurance
Claims costs after reinsurance Estimated claims cost
EURm < 2009 2010 2011 2012 2013 2014 2015 2016 2017 2018 2019 TotalAt the close of the claims year 19,943 2,527 2,588 2,591 2,635 2,625 2,644 2,673 2,707 2,856 2,970
One year later 19,841 2,570 2,657 2,577 2,660 2,614 2,658 2,682 2,749 2,939
Two years later 19,682 2,529 2,644 2,591 2,664 2,606 2,643 2,678 2,740
Three years later 19,536 2,523 2,639 2,593 2,670 2,617 2,628 2,647
Four years later 19,505 2,521 2,611 2,568 2,673 2,618 2,600
Five years later 19,477 2,519 2,601 2,535 2,662 2,585
Six years later 19,582 2,503 2,577 2,520 2,649
Seven years later 19,486 2,495 2,566 2,505
Eight years later 19,441 2,480 2,554
Nine years later 19,301 2,468
Ten years later 19,178
Current estimate of total claims costs 19,178 2,468 2,554 2,505 2,649 2,585 2,600 2,647 2,740 2,939 2,970 45,836
Total disbursed 16,552 2,297 2,388 2,325 2,417 2,333 2,345 2,351 2,365 2,424 1,792 39,589
Provision reported in the balance sheet 2,627 171 167 180 232 252 255 296 375 515 1,178 6,247
of which established vested annuities 1,607 79 75 77 84 85 72 60 52 56 4 2,251
Provision for claims-adjustment costs 221
Total provision reported in the BS of If 6,468
BOARD OFDIRECTORS’ REPORT
AUDITOR’S REPORT
SAMPO PLC’S FINANCIAL STATEMENTS
Sampo plc’s Notes to the Accounts
GROUP’S IFRS FINANCIAL STATEMENTS
Group’s Notes to the Accounts
99FINANCIAL STATEMENTS 2019

Topdanmark
Claims cost trend of P&C insurance
Claims costs before reinsurance Estimated claims cost
EURm < 2010 2011 2012 2013 2014 2015 2016 2017 2018 2019 TotalAt the close of the claims year 912 964 859 1,010 890 883 866 793 857 874
One year later 915 983 862 1,038 899 895 863 809 879
Two years later 930 975 864 1,040 896 882 852 811
Three years later 927 974 857 1,036 890 882 849
Four years later 919 965 846 1,023 866 876
Five years later 911 958 844 1,013 853
Six years later 906 953 834 1,001
Seven years later 905 941 832
Eight years later 902 941
Nine years later 907
Current estimate of total claims costs 907 941 832 1,001 853 876 849 811 879 874 8,823
Total disbursed 847 885 763 926 770 760 715 660 651 450 7,427
Discounting 0 0 0 0 0 0 0 0 0 0 1
Provision reported in the balance sheet 60 56 69 75 83 116 135 151 228 424 1,397
Discounting of previous years 353
Total provision reported in the BS of Topdanmark 1,749
BOARD OFDIRECTORS’ REPORT
AUDITOR’S REPORT
SAMPO PLC’S FINANCIAL STATEMENTS
Sampo plc’s Notes to the Accounts
GROUP’S IFRS FINANCIAL STATEMENTS
Group’s Notes to the Accounts
100FINANCIAL STATEMENTS 2019

Topdanmark
Claims cost trend of P&C insurance
Claims costs after reinsurance Estimated claims cost
EURm < 2010 2011 2012 2013 2014 2015 2016 2017 2018 2019 TotalAt the close of the claims year 855 825 807 855 838 828 804 768 805 841
One year later 861 839 816 865 843 839 807 781 826
Two years later 879 832 818 867 842 829 795 784
Three years later 877 830 812 863 835 827 793
Four years later 871 823 802 850 812 816
Five years later 863 817 799 840 798
Six years later 858 812 789 827
Seven years later 857 800 788
Eight years later 854 799
Nine years later 859
Current estimate of total claims costs 859 799 788 827 798 816 793 784 826 841 8,131
Total disbursed 799 743 719 754 720 714 663 635 613 439 6,799
Discounting 0 0 0 0 0 0 0 0 0 0 1
Provision reported in the balance sheet 60 56 69 73 78 102 130 149 214 402 1,333
Discounting of previous years 353
Total provision reported in the BS of Topdanmark 1,685
BOARD OFDIRECTORS’ REPORT
AUDITOR’S REPORT
SAMPO PLC’S FINANCIAL STATEMENTS
Sampo plc’s Notes to the Accounts
GROUP’S IFRS FINANCIAL STATEMENTS
Group’s Notes to the Accounts
101FINANCIAL STATEMENTS 2019

Life insurance liabilities from insurance and investment contracts2019 2018
EURm Gross Reinsurance Net Gross Reinsurance NetProvision for unearned premiums
Insurance contracts 4,992 2 4,991 5,043 2 5,040
Investment contracts 25 - 25 24 - 24
Provision for claims outstanding 2,080 1 2,080 2,263 1 2,262
Group liabilities from insurance and investment contracts, total 7,097 2 7,095 7,330 3 7,326
Change in liabilities from insurance contracts Gross
EURmContracts with discretionary
participation features
At 1 January 2019 7,306
Premiums 272
Claims paid -680
Expense charge -46
Guaranteed interest 157
Bonuses 44
Other 19
Total life insurance liabilities at 31 December 2019 7,073
Gross
EURmContracts with discretionary
participation features
At 1 January 2018 7,791
Premiums 286
Claims paid -678
Expense charge -48
Guaranteed interest 200
Bonuses 1
Exchange differences -10
Other -237
Total life insurance liabilities at 31 December 2018 7,305
BOARD OFDIRECTORS’ REPORT
AUDITOR’S REPORT
SAMPO PLC’S FINANCIAL STATEMENTS
Sampo plc’s Notes to the Accounts
GROUP’S IFRS FINANCIAL STATEMENTS
Group’s Notes to the Accounts
102FINANCIAL STATEMENTS 2019

Life insurance liabilities from investment contracts
EURm 2019 2018Investment contracts with discretionary participation feature 25 24
The change between financial years is mainly due to the claims paid.
Change in liabilities from life insurance investment contracts
EURm
Contracts with discretionary participation
features
At 1 January 2019 24
Other 1
Life insurance liabilities from investment contracts at 31 December 2019, total 25
EURm
Contracts with discretionary participation
features
At 1 January 2018 26
Other (includes i.e. conversions between different insurance classes) -2
Life insurance liabilities from investment contracts at 31 December 2018, total 24
The liabilities at 1 January and at 31 December include the future bonus reserves and the effect of the reserve for the decreased discount rate. The calculation is based on items before reinsurers' share. More details on the insurance liabilities are presented in the risk management note 40.
Investment contracts do not include a provision for claims outstanding.
Liability adequacy test does not give rise to supplementary claims.
Exemption allowed in IFRS 4 Insurance contracts has been applied to investment contracts with DPF or contracts with a right to trade-off for an investment contract with DPF. These investment contracts have been valued like insurance contracts.
Reconciliation to the consolidated insurance and investment contracts
EURm 2019 2018P&C insurance 10,943 11,084
Life insurance 7,097 7,330
Group consolidated insurance and investment contracts, total 18,041 18,414
27 Liabilities from unit-linked insurance and investment contractsEURm 2019 2018
Unit-linked insurance contracts 4,906 4,399
Unit-linked investment contracts 3,184 2,531
Life insurance liabilities 6,278 4,460
Group liabilities from unit-linked insurance and investment contracts, total 14,368 11,390
BOARD OFDIRECTORS’ REPORT
AUDITOR’S REPORT
SAMPO PLC’S FINANCIAL STATEMENTS
Sampo plc’s Notes to the Accounts
GROUP’S IFRS FINANCIAL STATEMENTS
Group’s Notes to the Accounts
103FINANCIAL STATEMENTS 2019
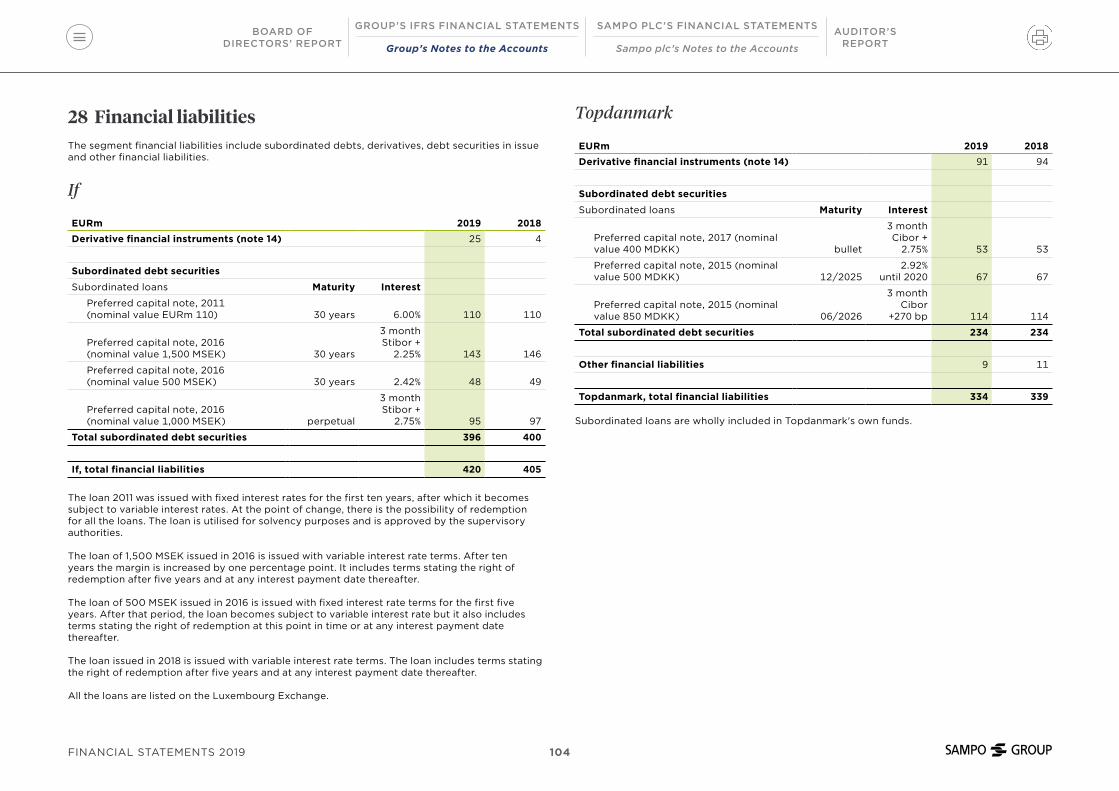
28 Financial liabilitiesThe segment financial liabilities include subordinated debts, derivatives, debt securities in issue and other financial liabilities.
If
EURm 2019 2018Derivative financial instruments (note 14) 25 4
Subordinated debt securities
Subordinated loans Maturity Interest
Preferred capital note, 2011 (nominal value EURm 110) 30 years 6.00% 110 110
Preferred capital note, 2016 (nominal value 1,500 MSEK) 30 years
3 month Stibor +
2.25% 143 146
Preferred capital note, 2016 (nominal value 500 MSEK) 30 years 2.42% 48 49
Preferred capital note, 2016 (nominal value 1,000 MSEK) perpetual
3 month Stibor +
2.75% 95 97
Total subordinated debt securities 396 400
If, total financial liabilities 420 405
The loan 2011 was issued with fixed interest rates for the first ten years, after which it becomes subject to variable interest rates. At the point of change, there is the possibility of redemption for all the loans. The loan is utilised for solvency purposes and is approved by the supervisory authorities.
The loan of 1,500 MSEK issued in 2016 is issued with variable interest rate terms. After ten years the margin is increased by one percentage point. It includes terms stating the right of redemption after five years and at any interest payment date thereafter.
The loan of 500 MSEK issued in 2016 is issued with fixed interest rate terms for the first five years. After that period, the loan becomes subject to variable interest rate but it also includes terms stating the right of redemption at this point in time or at any interest payment date thereafter.
The loan issued in 2018 is issued with variable interest rate terms. The loan includes terms stating the right of redemption after five years and at any interest payment date thereafter.
All the loans are listed on the Luxembourg Exchange.
Topdanmark
EURm 2019 2018Derivative financial instruments (note 14) 91 94
Subordinated debt securities
Subordinated loans Maturity Interest
Preferred capital note, 2017 (nominal value 400 MDKK) bullet
3 month Cibor +
2.75% 53 53
Preferred capital note, 2015 (nominal value 500 MDKK) 12/2025
2.92% until 2020 67 67
Preferred capital note, 2015 (nominal value 850 MDKK) 06/2026
3 month Cibor
+270 bp 114 114
Total subordinated debt securities 234 234
Other financial liabilities 9 11
Topdanmark, total financial liabilities 334 339
Subordinated loans are wholly included in Topdanmark's own funds.
BOARD OFDIRECTORS’ REPORT
AUDITOR’S REPORT
SAMPO PLC’S FINANCIAL STATEMENTS
Sampo plc’s Notes to the Accounts
GROUP’S IFRS FINANCIAL STATEMENTS
Group’s Notes to the Accounts
104FINANCIAL STATEMENTS 2019

Mandatum
EURm 2019 2018Derivative financial instruments (note 14) 15 33
Subordinated debt securities
Subordinated loan, 2002 100 100
Subordinated loan, 2019 249 -
Total subordinated debt securities 349 100
Mandatum, total financial liabilities 364 133
Mandatum Life issued in 2002 EURm 100 Capital Notes. The loan is perpetual and pays floating rate interest. The interest is payable only from distributable capital. The loan is repayable only with the consent of the Insurance Supervisory Authority and at the earliest on 2012 or any interest payment date after that. The loans is wholly subscribed by Sampo Plc.
In 2019 Mandatum Life issued Solvency II Tier 2 loan of EURm 250. The loan matures on 4 October, 2049. The loan has a fixed interest rate until the first possible redemption date on 4 October, 2024, whereafter it becomes subject to variable interest rates.
Holding
EURm 2019 2018Derivative financial instruments (note 14) 38 37
Debt securities in issue
Commercial papers - 124
Bonds 3,414 3,943
Total 3,414 4,067
Subordinated debt securities Maturity Interest
Subordinated loan, 2019 (nominal value EURm 500) 30 years 3.38% 494 -
Holding, total financial liabilities 3,946 4,104
The subordinated loan of the Holding has a fixed interest rate for the first ten years. After that, the loan becomes subject to variable interest rate but it also includes terms stating the right of redemption at this point in time or at any interest payment date thereafter. The loan is listed on the London Stock Exchange.
The determination and hierarchy of fair values of financial assets and liabilities measured at acquisition cost is disclosed in note 17. According to this determination the subordinated debt securities and bonds are categorised either on level 1 or 2.
EURm 2019 2018
Elimination items between segments -271 -271
Group, total financial liabilities 4,794 4,677
BOARD OFDIRECTORS’ REPORT
AUDITOR’S REPORT
SAMPO PLC’S FINANCIAL STATEMENTS
Sampo plc’s Notes to the Accounts
GROUP’S IFRS FINANCIAL STATEMENTS
Group’s Notes to the Accounts
105FINANCIAL STATEMENTS 2019

Change in liabilities from financing activities
EURm 1 Jan 2019 Cash flows Exchange differences Other 31 Dec 2019Commercial papers 124 -124 - 0 0
Bonds 3,943 -27 -8 0 3,908
Total liabilities from financing activities 4,067 -151 -8 0 3,908
EURm 1 Jan 2018 Cash flows Exchange differences Other 31 Dec 2018Commercial papers 293 -168 - 0 124
Bonds 2,884 1,041 18 - 3,943
Total liabilities from financing activities 3,177 873 18 0 4,067
29 ProvisionsEURm 2019
At 1 January 2019 18
Exchange rate differences 0
Additions 7
Amounts used during the period -5
Unused amounts reversed during the period 0
At 31 December 2019 20
Current (less than 1 year) 7
Non-current (more than 1 year) 13
Total 20
EURm 8 (9) of the provision consist of assets reserved for the already implemented or planned development of efficient administrative and claims-adjustment processes and structural changes in distribution channels, resulting in organisational changes that affect all business areas. In addition, the item includes a provision of about EURm 11 (9) for law suits and other uncertain liabilities.
BOARD OFDIRECTORS’ REPORT
AUDITOR’S REPORT
SAMPO PLC’S FINANCIAL STATEMENTS
Sampo plc’s Notes to the Accounts
GROUP’S IFRS FINANCIAL STATEMENTS
Group’s Notes to the Accounts
106FINANCIAL STATEMENTS 2019

30 Employee benefits
Employee benefits
Sampo has defined benefit plans in P&C insurance business in Sweden and Norway.
In addition to statutory retirement pension insurance, the Group has certain voluntary defined benefit plans. The voluntary defined benefit plans are intra-Group and included in the insurance liabilities of Mandatum Life. The amount is negligible and they have no material impact on the Group profit or loss or equity.
Employee benefit obligations of If
EURm 2019 2018Present value of estimated pension obligation, including social costs 330 268
Fair value of plan assets 231 217
Net pension obligation recognised in the balance sheet 99 51
The main Swedish defined-benefit pension plan is closed to new employees born in 1972 or later. The corresponding Norwegian pension plan consists solely of active people employed prior to 2006 and born 1957 and earlier.
For both countries, the pension benefits referred to are old-age pension and survivors’ pension. A common feature of the defined-benefit plans is that the employees and survivors encompassed by the plans are entitled to a guaranteed pension that depends on the employees’ service period and pensionable salary at the time of retirement. The dominating benefit is the old-age pension, which refers in part to temporary pension before the anticipated retirement age and in part to a life-long pension after the anticipated retirement age.
The retirement age for receiving premature pension is normally 62 years in Sweden and normally 65 years in Norway. In Sweden, premature old-age pension following a complete service period is payable at a rate of approximately 65% of the pensionable salary and applies to all employees born in 1955 or earlier and who were covered by the insurance sector’s collective bargaining agreement of 2006. In Norway, premature old-age pension following a complete service period is payable at a rate of approximately 70% of the pensionable salary and applies to all employees born in 1957 or earlier and who were employed by If in 2013.
The anticipated retirement age in connection with life-long pension is 65 years for Sweden and 67 years for Norway. In Sweden, life-long old-age pension following a complete service period is payable at a rate of 10% of the pensionable salary between 0 and 7.5 income base amounts, 65%
of salary between 7.5 and 20 income base amounts and 32.5% between 20 and 30 income base amounts. In Norway, life-long old-age pension following a complete service period is payable at a rate of 70% of the pensionable salary up to 12 National Insurance base amounts, together with the estimated statutory old-age pension. Paid-up policies and pension payments from the Swedish plans are normally indexed upwards in an amount corresponding to the change in the consumer price index. However, there is no agreement guaranteeing the value and future supplements in addition to the contractual pension benefit could either rise or fall. If is not responsible for indexation of paid-up policies and/or pension payments from the Norwegian insured plans.
The pensions are primarily funded through insurance whereby the insurers establish the premiums and disburse the benefits. If’s obligation is primarily fulfilled through payment of the premiums. Should the assets that are attributable to the pension benefits not be sufficient to enable the insurers to cover the guaranteed pension benefits, If could be forced to pay supplementary insurance premiums or secure the pension obligations in some other way. In addition to insured pension plans, there are also unfunded pension benefits in Norway for which If is responsible for ongoing payment.
To cover the insured pension benefits, the related capital is managed as part of the insurers’ management portfolios. In such management, the characteristics of the investment assets are analyzed in relation to the characteristics of the obligations, in a process known as Asset Liability Management. New and existing asset categories are evaluated continuously in order to diversify the asset portfolios with a view to optimizing the anticipated risk-adjusted return. Any surplus that arises from management of the assets normally accrues to If and/or the insured and there is no form of transfer of the asset value to other members of the insurance collective.
The insurers and If are jointly responsible for monitoring the pension plans, including investment decisions and contributions. The pension plans are essentially exposed to similar material risks regarding the final amount of the benefits, the investment risk associated with the plan assets and the fact that the choice of discount interest rate affects their valuation in the financial statements.
When applying IAS 19, the pension obligation and the pension cost attributed to the fiscal period are calculated annually using the Projected Unit Credit method. The calculation of the defined benefit obligation is based on future expected pension payments and includes yearly updated actuarial assumptions such as salary growth, inflation, mortality and employee turnover. The expected pension payments are then discounted to a present value using a discount rate set with reference to AAA and AA corporate bonds issued in local currency, including mortgage-backed bonds, as at mid December. The discount rates chosen in Sweden and Norway take into account the duration of the company’s pension obligations in each respective country. After a deduction for the plan assets, a net asset or a net liability is recognized in the balance sheet.
The following tables contain a number of material assumptions, specifications of pension costs, assets and liabilities and a sensitivity analysis showing the potential effect on the obligations of reasonable changes in those assumptions as at the end of the fiscal year.
The carrying amounts have been stated including special payroll tax in Sweden (24.26%) and a corresponding fee in Norway (14.1%-19.1%).
BOARD OFDIRECTORS’ REPORT
AUDITOR’S REPORT
SAMPO PLC’S FINANCIAL STATEMENTS
Sampo plc’s Notes to the Accounts
GROUP’S IFRS FINANCIAL STATEMENTS
Group’s Notes to the Accounts
107FINANCIAL STATEMENTS 2019

Specification of employee benefit obligations by country2019 2018
Sweden Norway Total Sweden Norway TotalRecognised in income statement and other comprehensive income
Current service cost 5 2 6 5 2 7
Past service cost - - - 0 - 0
Interest expense on net pension liability 0 1 1 0 1 1
Total in income statement 5 2 8 5 3 8
Remeasurement of the net pension liability 54 3 57 9 -3 6
Total in comprehensive income statement 59 6 65 14 0 14
Recognised in balance sheet
Present value of estimated pension liability, including social costs 275 55 330 210 58 268
Fair value of plan assets 202 28 231 186 31 217
Net liability recognised in balance sheet 72 27 99 24 28 51
Distribution by asset class
Debt instruments, level 1 45% 49% 44% 51%
Debt instruments, level 2 0% 12% 0% 13%
Equity instruments, level 1 22% 13% 23% 14%
Equity instruments, level 3 10% 1% 9% 2%
Property, level 3 11% 14% 11% 14%
Other, level 1 1% 9% 0% 6%
Other, level 2 5% 2% 6% 1%
Other, level 3 6% 0% 7% 0%
BOARD OFDIRECTORS’ REPORT
AUDITOR’S REPORT
SAMPO PLC’S FINANCIAL STATEMENTS
Sampo plc’s Notes to the Accounts
GROUP’S IFRS FINANCIAL STATEMENTS
Group’s Notes to the Accounts
108FINANCIAL STATEMENTS 2019
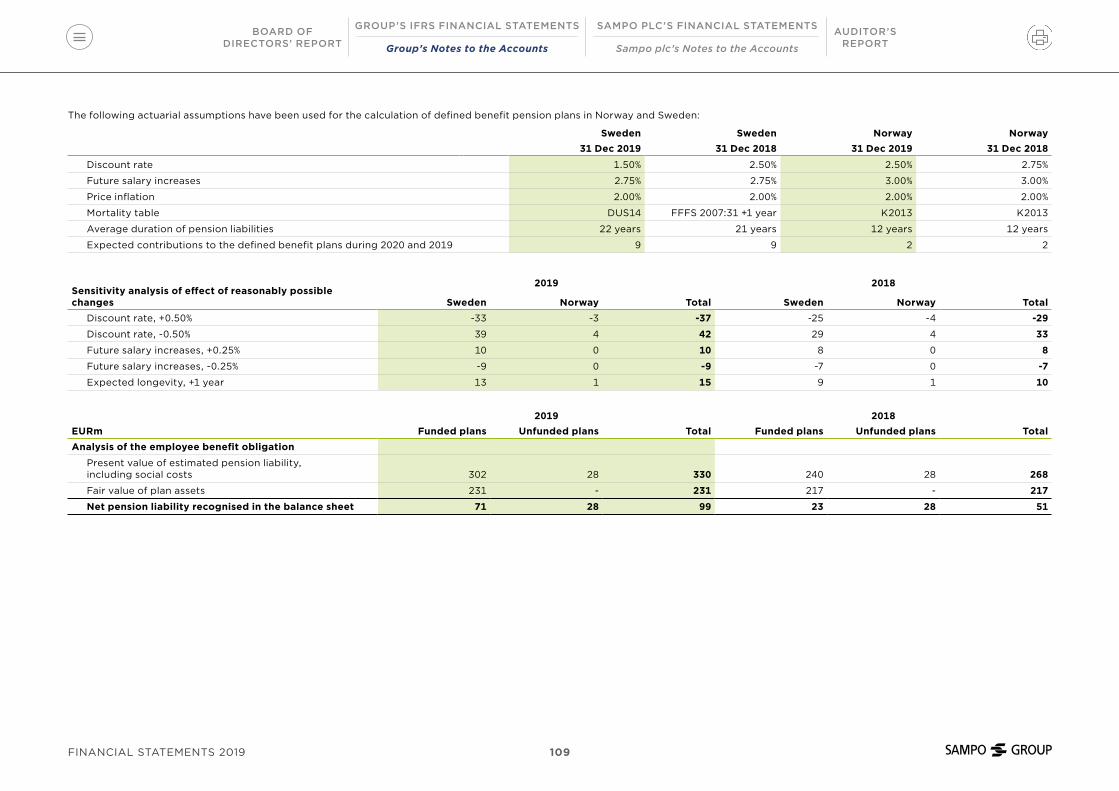
The following actuarial assumptions have been used for the calculation of defined benefit pension plans in Norway and Sweden:
Sweden Sweden Norway Norway31 Dec 2019 31 Dec 2018 31 Dec 2019 31 Dec 2018
Discount rate 1.50% 2.50% 2.50% 2.75%
Future salary increases 2.75% 2.75% 3.00% 3.00%
Price inflation 2.00% 2.00% 2.00% 2.00%
Mortality table DUS14 FFFS 2007:31 +1 year K2013 K2013
Average duration of pension liabilities 22 years 21 years 12 years 12 years
Expected contributions to the defined benefit plans during 2020 and 2019 9 9 2 2
2019 2018Sensitivity analysis of effect of reasonably possible changes Sweden Norway Total Sweden Norway Total
Discount rate, +0.50% -33 -3 -37 -25 -4 -29
Discount rate, -0.50% 39 4 42 29 4 33
Future salary increases, +0.25% 10 0 10 8 0 8
Future salary increases, -0.25% -9 0 -9 -7 0 -7
Expected longevity, +1 year 13 1 15 9 1 10
2019 2018EURm Funded plans Unfunded plans Total Funded plans Unfunded plans TotalAnalysis of the employee benefit obligation
Present value of estimated pension liability, including social costs 302 28 330 240 28 268
Fair value of plan assets 231 - 231 217 - 217
Net pension liability recognised in the balance sheet 71 28 99 23 28 51
BOARD OFDIRECTORS’ REPORT
AUDITOR’S REPORT
SAMPO PLC’S FINANCIAL STATEMENTS
Sampo plc’s Notes to the Accounts
GROUP’S IFRS FINANCIAL STATEMENTS
Group’s Notes to the Accounts
109FINANCIAL STATEMENTS 2019

Analysis of the change in net liability recognised in the balance sheet
EURm 2019 2018Pension liabilities:
At the beginning of the year 268 268
Earned during the financial year 6 7
Costs pertaining to prior-year service - 0
Interest cost 7 7
Actuarial gains (-)/losses (+) on financial assumptions 61 14
Actuarial gains (-)/losses (+), experience adjustments 4 -
Exchange differences on foreign plans 2 0
Benefits paid -2 -8
Settlements -15 -20
Defined benefit plans at 31 December 330 268
Reconciliation of plan assets:
At the beginning of the year 217 211
Interest income 5 6
Difference between actual return and calculated interest income 9 8
Contributions paid 14 15
Exchange differences on foreign plans -3 -7
Benefits paid -12 -17
Plan assets at 31 December 231 217
Other short-term employee benefits
There are other short-term staff incentive programmes in the Group, the terms of which vary according to country, business area or company. Benefits are recognised in the profit or loss for the year they arise from. An estimated amount of these short-term incentives, social security costs included, for 2019 is EURm 56.
31 Other liabilitiesEURm 2019 2018
Liabilities arising out of direct insurance operations 239 251
Liabilities arising out of reinsurance operations 35 33
Liabilities related to Patient Insurance Pool 69 174
Tax liabilities 176 139
Premium taxes 68 62
Settlement liabilities 46 43
Interests 42 46
Leases *) 137 -
Prepayments and accrued income 231 235
Other 446 271
Group other liabilities, total 1,489 1,254
Item Other includes e.g. witholding taxes, social expenses related to Workers Compensation insurance policies and employee benefits and unpaid premium taxes.
The non-current share of other liabilities is EURm 70 (113).
*) The total effect of leasese on the statement of cashflows was EURm -25. Non-cash flow additions from IFRS 16 leases to the balance sheet items was EURm 27.
Reconciliation of transition to IFRS 16 Leases
The Group as a lessee
The Group applied the modified retrospective approach allowed by the standard from 1 January 2019. The comparison year is not disclosed and the right-of-use asset equals the lease liability at the time of the transition. The ROU asset is depreciated on straight-line basis over the lease period.
The Group does not apply IFRS 16 to short-term under 12 months leases, or to leases for which the underlying asset is of low-value.
BOARD OFDIRECTORS’ REPORT
AUDITOR’S REPORT
SAMPO PLC’S FINANCIAL STATEMENTS
Sampo plc’s Notes to the Accounts
GROUP’S IFRS FINANCIAL STATEMENTS
Group’s Notes to the Accounts
110FINANCIAL STATEMENTS 2019
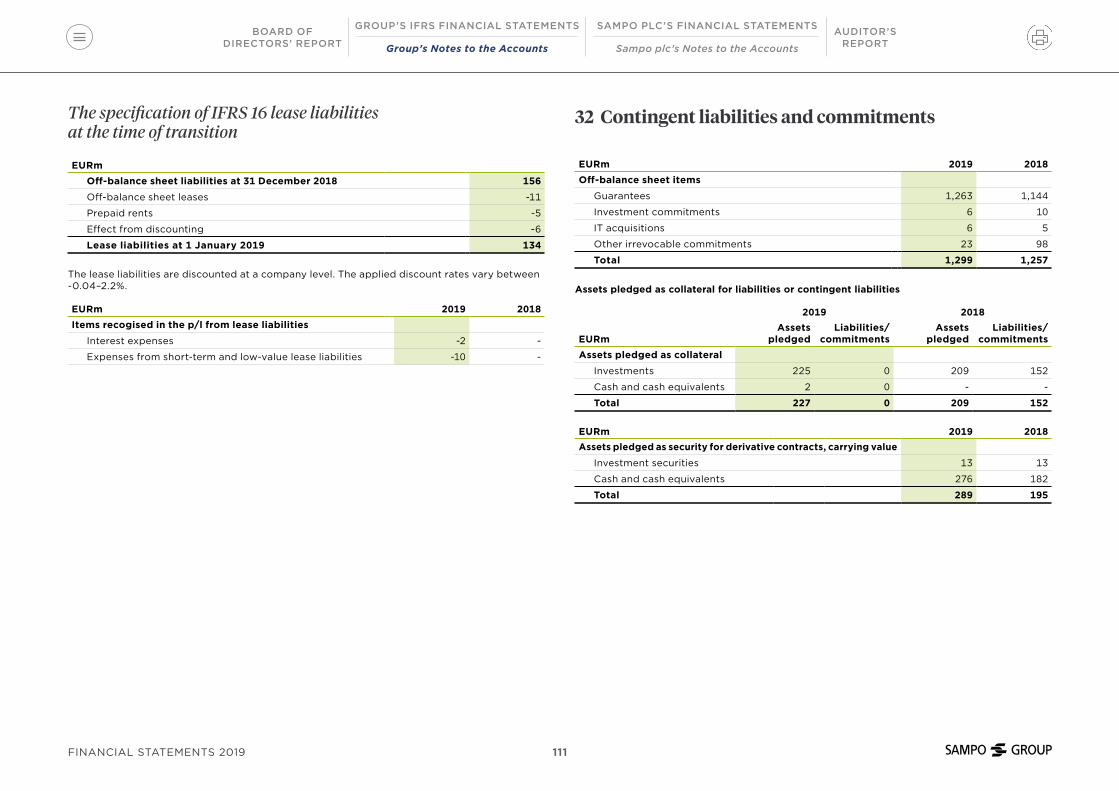
The specification of IFRS 16 lease liabilities at the time of transition
EURmOff-balance sheet liabilities at 31 December 2018 156
Off-balance sheet leases -11
Prepaid rents -5
Effect from discounting -6
Lease liabilities at 1 January 2019 134
The lease liabilities are discounted at a company level. The applied discount rates vary between -0.04–2.2%.
EURm 2019 2018Items recogised in the p/l from lease liabilities
Interest expenses -2 -
Expenses from short-term and low-value lease liabilities -10 -
32 Contingent liabilities and commitments
EURm 2019 2018Off-balance sheet items
Guarantees 1,263 1,144
Investment commitments 6 10
IT acquisitions 6 5
Other irrevocable commitments 23 98
Total 1,299 1,257
Assets pledged as collateral for liabilities or contingent liabilities
2019 2018
EURmAssets
pledgedLiabilities/
commitmentsAssets
pledgedLiabilities/
commitmentsAssets pledged as collateral
Investments 225 0 209 152
Cash and cash equivalents 2 0 - -
Total 227 0 209 152
EURm 2019 2018Assets pledged as security for derivative contracts, carrying value
Investment securities 13 13
Cash and cash equivalents 276 182
Total 289 195
BOARD OFDIRECTORS’ REPORT
AUDITOR’S REPORT
SAMPO PLC’S FINANCIAL STATEMENTS
Sampo plc’s Notes to the Accounts
GROUP’S IFRS FINANCIAL STATEMENTS
Group’s Notes to the Accounts
111FINANCIAL STATEMENTS 2019

33 Equity and reserves
Equity (1,000 shares)
2019 2018
Equity (1,000 shares) 555,352 555,352
At the end of the financial year, the mother company or other Group companies held no shares in the parent company.
Reserves and retained earnings
Legal reserveThe legal reserve comprises the amounts to be transferred from the distributable equity according to the articles of association or on the basis of the decision of the AGM.
Invested unrestricted equityThe reserve includes other investments of equity nature, as well as issue price of shares to an extent it is not recorded in share capital by an express decision.
Other components of equityOther components of equity include fair value changes of financial assets available for sale and derivatives used in cash flow hedges, and exchange differences.
Changes in the reserves and retained earnings are presented in the Group's statement of changes in equity.
EURm 2019 2018Other contingent liabilities
Contract liabilities - 53
Adjustments to VAT liabilities 18 14
Other liabilities - 2
Total 18 69
Other contingent liabilities belong to Topdanmark.
The subsidiary If P&C Insurance Ltd provides insurance with mutual undertakings within the Nordic Nuclear Insurance Pool, Norwegian Natural Perils’ Pool and the Dutch Terror Pool.
In connection with the transfer of property and casualty insurance business from the Skandia group to the If Group as of March 1, 1999, If P&C Holding Ltd and If P&C Insurance Ltd issued a guarantee for the benefit of Försäkringsaktiebolaget Skandia (publ.) whereby the aforementioned companies in the If Group mutually guarantee that companies in the Skandia group will be indemnified against any claims or actions due to guarantees or similar commitments made by companies in the Skandia group within the property and casualty insurance business transferred to the If Group.
If P&C Insurance Holding Ltd and If P&C Insurance Ltd have separately entered into contracts with Försäkringsaktiebolaget Skandia (publ.) and Tryg-Baltica Forsikrings AS whereby Skandia and Tryg-Baltica will be indemnified against any claims attributable to guarantees issued by Försäkringsaktiebolaget Skandia (publ.) and Vesta Forsikring AS, on behalf of Skandia Marine Insurance Company (U.K.) Ltd. (now Marlon Insurance Company Ltd.) in favor of the Institute of London Underwriters. Marlon Insurance Company Ltd. was disposed during 2007, and the purchaser issued a guarantee in favour of If for the full amount that If may be required to pay under these guarantees.
If P&C Insurance Company Ltd has outstanding commitments to private equity funds totalling EURm 5, which is the maximum amount that the company has committed to invest in the funds. Capital will be called to these funds over several years as the funds make investments. In addition, If P&C Insurance Ltd has outstanding commitments to borrowers totalling approximately EURm 4.
With respect to certain IT systems If and Sampo use jointly, If P&C Insurance Holding Ltd has undertaken to indemnify Sampo for any costs caused by It that Sampo may incur in relation to the owners of the systems.
Sampo Group's Danish companies and Topdanmark Group's companies are jointly taxed, with Topdanmark A/S being the management company. Pursuant to the specific rules on corporation taxes etc. in the Danish Companies Act, the companies are liable for the jointly taxed companies and for any obligations to withhold tax from interests, royalties and dividend for companies concerned.
In connection with implementation of a new customer and core system, Topdanmark Forsikring A/S has undertaken to give support towards specific suppliers to fulfill Topdanmark EDB IV ApS' obligations in accordance with the contracts.
BOARD OFDIRECTORS’ REPORT
AUDITOR’S REPORT
SAMPO PLC’S FINANCIAL STATEMENTS
Sampo plc’s Notes to the Accounts
GROUP’S IFRS FINANCIAL STATEMENTS
Group’s Notes to the Accounts
112FINANCIAL STATEMENTS 2019
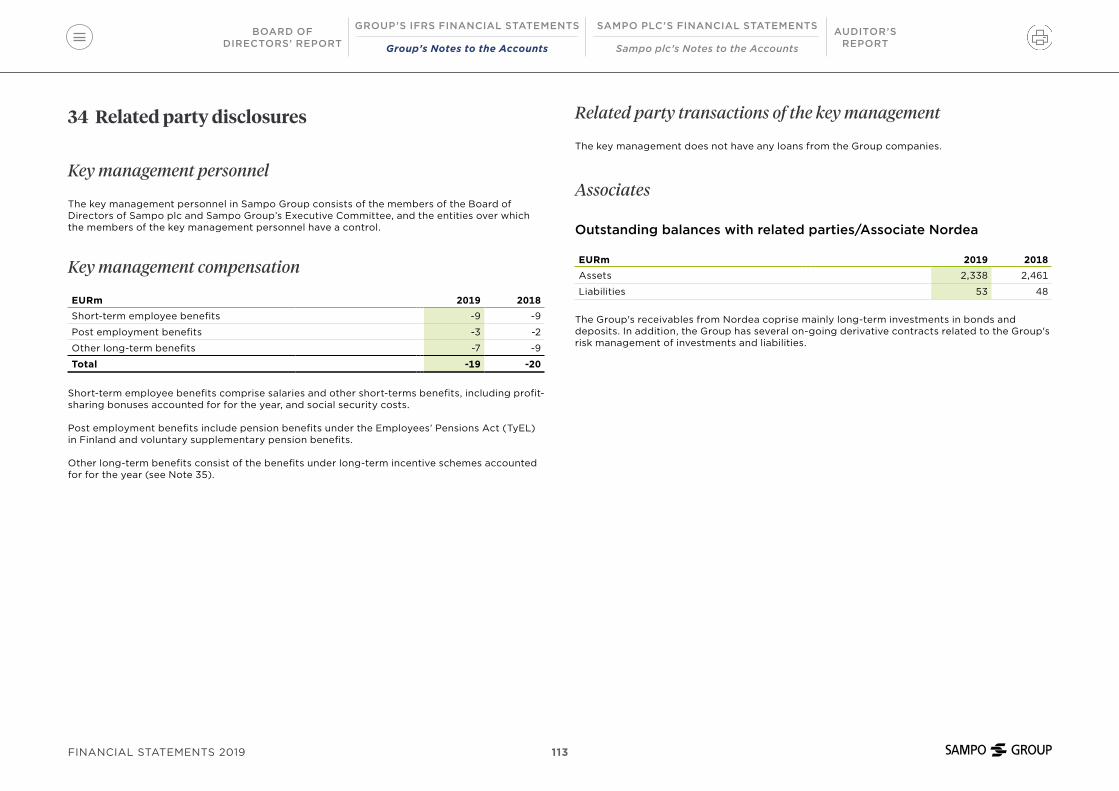
34 Related party disclosures
Key management personnel
The key management personnel in Sampo Group consists of the members of the Board of Directors of Sampo plc and Sampo Group’s Executive Committee, and the entities over which the members of the key management personnel have a control.
Key management compensation
EURm 2019 2018Short-term employee benefits -9 -9
Post employment benefits -3 -2
Other long-term benefits -7 -9
Total -19 -20
Short-term employee benefits comprise salaries and other short-terms benefits, including profit-sharing bonuses accounted for for the year, and social security costs.
Post employment benefits include pension benefits under the Employees’ Pensions Act (TyEL) in Finland and voluntary supplementary pension benefits.
Other long-term benefits consist of the benefits under long-term incentive schemes accounted for for the year (see Note 35).
Related party transactions of the key management
The key management does not have any loans from the Group companies.
Associates
Outstanding balances with related parties/Associate Nordea
EURm 2019 2018Assets 2,338 2,461
Liabilities 53 48
The Group's receivables from Nordea coprise mainly long-term investments in bonds and deposits. In addition, the Group has several on-going derivative contracts related to the Group's risk management of investments and liabilities.
BOARD OFDIRECTORS’ REPORT
AUDITOR’S REPORT
SAMPO PLC’S FINANCIAL STATEMENTS
Sampo plc’s Notes to the Accounts
GROUP’S IFRS FINANCIAL STATEMENTS
Group’s Notes to the Accounts
113FINANCIAL STATEMENTS 2019

35 Incentive schemes
Long-term incentive schemes 2014 I - 2017 II
The Board of Directors of Sampo plc has decided on the long-term incentive schemes 2014 I - 2017 II for the management and key employees of Sampo Group. The Board has authorised the CEO to decide who will be included in the scheme, as well as the number of calculated incentive units granted for each individual used in determining the amount of the incentive reward. In the schemes, the number of calculated incentive units granted for the members of the Group Executive Committee is decided by the Board of Directors. Some 120 persons were included in the schemes at the end of year 2019.
The amount of the performance-related bonus is based on the value performance of Sampo's A share and on the insurance margin (IM) and on Sampo's return on the risk adjusted capital (RoCaR). The value of one calculated incentive unit is the trade-weighted average price of Sampo's A-share at the time period specified in the terms of the scheme, and reduced by the starting price adjusted with the dividends per share distributed up to the payment date. The pre-dividend starting prices vary between eur 38.26–44.10. The maximum value of one incentive unit varies between eur 57.26–63.10, reduced by the dividend-adjusted starting price. In all the schemes, the incentive reward depends on two benchmarks. If the IM is 6 per cent or more, the IM-based reward is paid in full. If the IM is between 4–5.99 per cent, half of the incentive reward is paid. No IM-related reward will be paid out, if the IM stays below these. In addition, the return on the risk adjusted capital is taken into account. If the return is at least risk free return + 4 per cent, the RORAC-based incentive reward is paid out in full. If the return is risk free return + 2 per cent, but less than risk free return + 4 percent, the payout is 50 per cent. If the return stays below these benchmarks, no RORAC-based reward will be paid out.
Each plan has three performance periods and incentive rewards are settled in cash in three installments. The employee shall authorise Sampo plc to buy Sampo's A-shares with 50 per cent (scheme 2017 I) or 60 percent (scheme 2014 I) of the amount of the reward after taxes and other comparable charges. The shares are subject to transfer restrictions for three years from the day of payout. A premature payment of the reward may occur in the event of changes in the group structure or in the case of employment termination on specifically determined bases. The fair value of the incentive schemes is estimated by using the Black-Scholes pricing model.
2014 I 2014 I/2 2017 I 2017 I/2
Terms approved *)17 Sep
201417 Sep
201414 Sep
201714 Sep
2017
Granted (1,000) 31 Dec 2016 4,211 62 - -
Granted (1,000) 31 Dec 2017 2,874 62 4,092 -
Granted (1,000) 31 Dec 2018 1,411 43 3,978 85
Granted (1,000) 31 Dec 2019 22 3,948 85
End of performance period I 30% Q2-2017 Q2-2018 Q2-2020 Q2-2021
End of performance period II 35% Q2-2018 Q2-2019 Q2-2021 Q2-2022
End of performance period III 35% Q2-2019 Q2-2020 Q2-2022 Q2-2023
Payment I 30% 9-2017 9-2018 9-2020 9-2021
Payment II 35% 9-2018 9-2019 9-2021 9-2022
Payment III 35% 9-2019 9-2020 9-2022 9-2023
Price of Sampo A at terms approval date *) 37.22 37.22 44.02 44.02
Starting price **) 38.26 43.38 43.81 44.10
Dividend-adjusted starting price at 31 December 2019 32.91 37.79 40.68
Sampo A closing price at 31 December 2019 38.91
Total intrinsic value, EURm 0 7 0
Total debt 7
Total cost for the financial period, EURm (incl. social costs) 12
*) Grant dates vary**) Trade-weighted average for ten trading days from the approval of terms
BOARD OFDIRECTORS’ REPORT
AUDITOR’S REPORT
SAMPO PLC’S FINANCIAL STATEMENTS
Sampo plc’s Notes to the Accounts
GROUP’S IFRS FINANCIAL STATEMENTS
Group’s Notes to the Accounts
114FINANCIAL STATEMENTS 2019

Long-term incentive scheme of Topdanmark
Topdanmark's share option scheme is for its Executive Board and senior executives. The strike price has been fixed at 110% of the market price on the last trading date in the prior financial year (average of all trades). The options may be exercised 3–5 years subsequent to the granting. The scheme is settled by shares.
Strike price Executive board Senior executives Resigned TotalTotal number of options (1,000)
At 1 January 2019 28 139 788 365 1,293
Granted 45 59 207 10 276
Transferred 0 -113 113 0
Exercised 25 -20 -235 -222 -477
Forfeited 43 0 0 -7 -7
At 31 December 2019 31 178 648 260 1,086
At 1 January 2018 27 192 986 266 1,444
Granted 40 49 238 24 311
Transferred -33 -163 195 0
Exercised 25 -69 -274 -82 -425
Forfeited 29 - - -37 -37
At 31 December 2018 28 139 788 365 1,293
Per granting
2015, exercise period January 2018–2020 25 11 0 20 32
2016, exercise period January 2019–2021 24 12 24 38 74
2017, exercise period January 2020–2022 22 55 256 105 415
2018, exercise period January 2021–2023 35 41 175 79 295
2019, exercise period January 2022–2024 43 59 193 18 269
The option scheme requires employment during the whole year of the allocation. Options are allocated at beginning of year and in connection with resignation in the year of allocation a proportional deduction in the number of allocated options is made.
The tabels below show option holder's standing at the year end.
BOARD OFDIRECTORS’ REPORT
AUDITOR’S REPORT
SAMPO PLC’S FINANCIAL STATEMENTS
Sampo plc’s Notes to the Accounts
GROUP’S IFRS FINANCIAL STATEMENTS
Group’s Notes to the Accounts
115FINANCIAL STATEMENTS 2019

Executive board Senior executives Resigned TotalAverage market price on date of exercise 2019 44
Average market price on date of exercise 2018 39
Fair value of granting 2019 0 1 0 1
Fair value of granting 2018 0 1 0 1
Fair value at 31 December 2019 2 9 4 15
Fair value at 31 December 2018 2 10 5 17
The fair value of the granting for the year has been calculated using the Black and Scholes model assuming a share price of EUR 41 (36) . The interest rate corresponds to the zero coupon rate based on the swap curve on 31 December of the previous year. Future volatility is assumed to be 22 per cent and the average life of the options approximately 4 years. The volatility based on previous years' volatility is still the best estimate of the future volatility. The strike prices are adjusted by dividend distribution for outstanding options.
At 31 December 2019, there were 106,000 options (163,000) which could be exercised.
BOARD OFDIRECTORS’ REPORT
AUDITOR’S REPORT
SAMPO PLC’S FINANCIAL STATEMENTS
Sampo plc’s Notes to the Accounts
GROUP’S IFRS FINANCIAL STATEMENTS
Group’s Notes to the Accounts
116FINANCIAL STATEMENTS 2019

36 Auditors’ fees
EURm 2019 2018Auditing fees -3 -2
Ernst & Young -1 -1
Other -1 -2
Other fees 0 -1
Ernst & Young 0 0
Other 0 0
Total -3 -3
37 Legal proceedingsThere are a number of legal proceedings against the Group companies outstanding on 31 December 2019, arising in the ordinary course of business. The companies estimate it unlikely that any significant loss will arise from these proceedings.
39 Events after the balance sheet dateIn the meeting of 6 Feb 2020, the Board of Directors decided to propose at the Annual General Meeting on 23 April 2020 a dividend distribution of EUR 2.20 per share, or total EUR 1,221,774,070.00, for 2019. The dividends to be paid will be accounted for in the equity in 2020 as a deduction of retained earnings.
38 Investments in subsidiaries
Name Group holding % Carrying amountIf P&C Insurance Holding Ltd 100 1,886
If P&C Insurance Ltd 100 1,581
If P&C Insurance AS 100 42
Support Services AS 100 0
If Livförsäkring Ab 100 7
Vertikal Helseassistanse AS 100 33
If Services AB 100 1
Topdanmark A/S 48.24* 1,398
Topdanmark Kapitalforvaltning A/S 100 14
Topdanmark Forsikring A/S 100 839
Topdanmark Liv Holding A/S 100 304
Topdanmark Livsforsikring A/S 100 489
Topdanmark Ejendom A/S 100 426
Mandatum Life Insurance Company Ltd 100 484
Mandatum Life Services Ltd 100 4
Mandatum Life Investment Services Ltd 100 2
Saka Hallikiinteistöt GP Oy 100 0
Mandatum Life Vuokratontit I GP Oy 100 0
Mandatum Life Fund Management S.A. 100 5
If IT Services A/S 100 0
Sampo Capital Oy 100 1
*) The Group's ownership of votes.
The table excludes property and housing companies accounted for in the consolidated accounts.
BOARD OFDIRECTORS’ REPORT
AUDITOR’S REPORT
SAMPO PLC’S FINANCIAL STATEMENTS
Sampo plc’s Notes to the Accounts
GROUP’S IFRS FINANCIAL STATEMENTS
Group’s Notes to the Accounts
117FINANCIAL STATEMENTS 2019
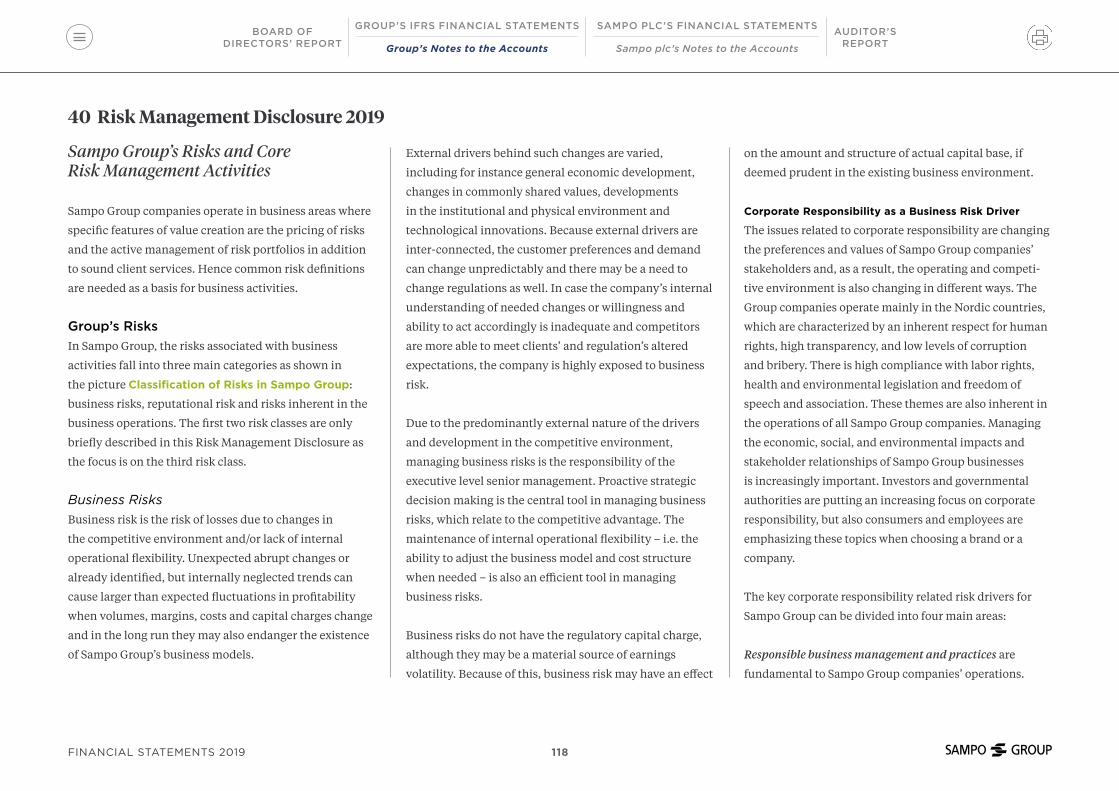
40 Risk Management Disclosure 2019
External drivers behind such changes are varied,
including for instance general economic development,
changes in commonly shared values, developments
in the institutional and physical environment and
technological innovations. Because external drivers are
inter-connected, the customer preferences and demand
can change unpredictably and there may be a need to
change regulations as well. In case the company’s internal
understanding of needed changes or willingness and
ability to act accordingly is inadequate and competitors
are more able to meet clients’ and regulation’s altered
expectations, the company is highly exposed to business
risk.
Due to the predominantly external nature of the drivers
and development in the competitive environment,
managing business risks is the responsibility of the
executive level senior management. Proactive strategic
decision making is the central tool in managing business
risks, which relate to the competitive advantage. The
maintenance of internal operational flexibility – i.e. the
ability to adjust the business model and cost structure
when needed – is also an efficient tool in managing
business risks.
Business risks do not have the regulatory capital charge,
although they may be a material source of earnings
volatility. Because of this, business risk may have an effect
on the amount and structure of actual capital base, if
deemed prudent in the existing business environment.
Corporate Responsibility as a Business Risk Driver
The issues related to corporate responsibility are changing
the preferences and values of Sampo Group companies’
stakeholders and, as a result, the operating and competi-
tive environment is also changing in different ways. The
Group companies operate mainly in the Nordic countries,
which are characterized by an inherent respect for human
rights, high transparency, and low levels of corruption
and bribery. There is high compliance with labor rights,
health and environmental legislation and freedom of
speech and association. These themes are also inherent in
the operations of all Sampo Group companies. Managing
the economic, social, and environmental impacts and
stakeholder relationships of Sampo Group businesses
is increasingly important. Investors and governmental
authorities are putting an increasing focus on corporate
responsibility, but also consumers and employees are
emphasizing these topics when choosing a brand or a
company.
The key corporate responsibility related risk drivers for
Sampo Group can be divided into four main areas:
Responsible business management and practices are
fundamental to Sampo Group companies’ operations.
Sampo Group’s Risks and Core Risk Management Activities
Sampo Group companies operate in business areas where
specific features of value creation are the pricing of risks
and the active management of risk portfolios in addition
to sound client services. Hence common risk definitions
are needed as a basis for business activities.
Group’s RisksIn Sampo Group, the risks associated with business
activities fall into three main categories as shown in
the picture Classification of Risks in Sampo Group:
business risks, reputational risk and risks inherent in the
business operations. The first two risk classes are only
briefly described in this Risk Management Disclosure as
the focus is on the third risk class.
Business RisksBusiness risk is the risk of losses due to changes in
the competitive environment and/or lack of internal
operational flexibility. Unexpected abrupt changes or
already identified, but internally neglected trends can
cause larger than expected fluctuations in profitability
when volumes, margins, costs and capital charges change
and in the long run they may also endanger the existence
of Sampo Group’s business models.
BOARD OFDIRECTORS’ REPORT
AUDITOR’S REPORT
SAMPO PLC’S FINANCIAL STATEMENTS
Sampo plc’s Notes to the Accounts
GROUP’S IFRS FINANCIAL STATEMENTS
Group’s Notes to the Accounts
118FINANCIAL STATEMENTS 2019

Good governance in Sampo Group means effective policies
and management practices, which provide assurance
that the Group companies and their business partners,
such as suppliers in claims handling, comply with laws,
regulations and generally accepted principles on human
rights, labor rights, environment, anti-money laundering,
counter-terrorism financing and anti-corruption and
bribery. Further, it comprises comprehensive information
security governance systems, cybersecurity preparedness
and personal data protection activities. Additionally,
responsible business practices require being attentive of
the risks relating to inappropriate customer advice and
product sales, lack of clarity on conditions, prices and fees,
and errors in claims handling and complaint processes.
Sales and marketing practices’ focus is on meeting the
demands and needs of the customer and providing the
customer with the information necessary for them to
make well-informed decisions on their insurance coverage
needs.
Responsible corporate culture includes factors relating
to the work environment, diversity, equality, employee
well-being, employee engagement, professional
development, and talent attraction and retention. Sampo
Group companies want to provide customers with the
best service in all situations. Here skilled and motivated
employees is an essential success factor. Losing talent or
being perceived as an unattractive employer would pose
large risks for the businesses. Therefore, Sampo Group
companies strive to ensure a sound work environment,
not only because it is stipulated by law, but also because it
lays the foundation for sustainable business performance.
Diversity and equality are key focus areas for Sampo
Group companies, which are committed in providing
a non-discriminatory, open and agreeable working
environment where everyone is treated fairly and equally.
Risks related to these themes are managed for example by
having strong internal policies, conducting organizational
development programs, and offering employees training,
interesting career opportunities and attractive remunera-
tion packages.
Responsible investment management and operations are
important in managing long-term investment risks and in
mitigating potential adverse impacts on the Group’s repu-
tation. Therefore, Sampo Group companies take environ-
mental, social and governance (“ESG”) issues into account
when assessing the security, quality, liquidity, profitability
and availability of investments. Investment opportunities
are carefully studied before any investments are made and
ESG issues are considered along with other factors that
might affect the risk-return ratio of separate investments.
ESG issues have an impact on the long-term performance,
risk and value of all companies. Taking these issues into
consideration in the investment process is an important
mean to improve the risk-return profile of investments,
and it is a critical success factor of investment activities.
Depending on the asset class, Sampo uses different
ESG strategies to ensure the effective consideration and
management of investment risks arising from ESG issues.
The strategies used include for example ESG integration,
sector-based screening, norm-based screening, and active
ownership. Sampo Group is also a signatory of the United
Nations Principles for Responsible Investment (“PRI”).
Environmental issues and climate change are factors
affecting Sampo Group’s businesses via investment
operations, but effects are also recognized in insurance
operations in an increasing manner. Sampo Group com-
panies help customers to manage risks and they provide
customers support when accidents occur. By providing
customers with guidance on how to prevent losses, the
Group companies help customers to reduce risks and
economic costs, and at the same time to protect the
environment. Natural catastrophes and extreme weather
conditions, on the other hand, are risk factors affecting
the financial position and results of non-life insurers.
Since climate change could increase the frequency and/or
severity of natural catastrophes, Sampo Group companies
have conducted sensitivity analyses, using scenarios
where the severity of natural catastrophes is assumed to
increase. As a potential side effect, climate change could
also result in large migrations or prolonged concentrations
of people and animals where deceases can be transmitted
or the change in environment could create new versions of
known diseases. These risks are managed effectively with
reinsurance programs.
BOARD OFDIRECTORS’ REPORT
AUDITOR’S REPORT
SAMPO PLC’S FINANCIAL STATEMENTS
Sampo plc’s Notes to the Accounts
GROUP’S IFRS FINANCIAL STATEMENTS
Group’s Notes to the Accounts
119FINANCIAL STATEMENTS 2019

Reputational RiskManaging stakeholder relationships means satisfied
customers, professional staff, good co-operation with
authorities and the trust and approval of the environ-
ment. These contribute to a key success factor of the
company, its reputation.
Reputational risk refers to the risk that adverse publicity
regarding the company’s business practices or associa-
tions, whether accurate or not, causes a loss of confidence
in the integrity of the institution. Reputational risk is
often a consequence of a materialized operational or
compliance risk and often manifests as a deterioration of
reputation amongst customers and other stakeholders.
Reputational risk is related to all activities shown in the
graph Classification of Risks in Sampo Group. As the roots
of reputational risk are varied, the tools to prevent it must
be diverse and embedded within the corporate culture.
These are reflected in how Sampo deals with environ-
mental issues and its core stakeholders (i.e. customers,
personnel, investors, other co-operation partners, tax
authorities and supervisory authorities) and how Sampo
Group has organized its Corporate Governance system.
Classification of Risks in Sampo Group
External drivers
Negative impact on financial results, capitalization and long-term profitability
Non-life insurance underwriting risks
Premium and Catastrophe risks
Reserve risks
Reputational risk
Life insurance underwriting risks
Biometric risksPolicyholder
behavior risksExpense risk
Investment portfolio market
risks
Interest rate riskCurrency riskSpread riskEquity riskOther risks
Counterparty default risks
Derivative counterpartyReinsurance counterparty
Operational risks
ProcessesPersonnelSystems
External eventsLegal risk
Compliance risk
Business risks
VolumesMargins
Number of Clients
Concentration risk Concentration risk Concentration risk Concentration risk Concentration risk Concentration risk
ALM risks
Earnings risks / capital charge
Earnings risks / no capital charge
Consequential risks / capital charge
Consequential risks / no capital charge
BOARD OFDIRECTORS’ REPORT
AUDITOR’S REPORT
SAMPO PLC’S FINANCIAL STATEMENTS
Sampo plc’s Notes to the Accounts
GROUP’S IFRS FINANCIAL STATEMENTS
Group’s Notes to the Accounts
120FINANCIAL STATEMENTS 2019

Risks Inherent in Business OperationsIn its underwriting and investment operations, Sampo
Group is consciously taking certain risks in order to
generate earnings. These earnings risks are carefully
selected and actively managed. Underwriting risks are
priced to reflect their inherent risk levels and the expected
return of investments is compared to the related risks.
Successful management of underwriting risks and invest-
ment portfolio market risks is the main source of earnings
for Sampo Group companies. Day-to-day management of
these risks, i.e. maintaining them within given limits and
authorizations is the responsibility of the business areas
and the investment unit.
Some risks, such as counterparty default risks and opera-
tional risks presented in the graph Classification of Risks
in Sampo Group are indirect repercussions of Sampo’s
normal business activities. They are one-sided risks,
which in principle have no related earnings potential.
Accordingly, the risk management objective is to mitigate
these risks efficiently rather than actively manage them.
Mitigation of consequential risks is the responsibility of
the business areas and the investment unit. The capital
need for these risks is measured by independent risk
management functions.
Some risks such as interest rate, currency and liquidity
risks are by their nature simultaneously linked to various
activities. In order to manage these risks efficiently,
Sampo Group companies have to have a detailed
understanding of expected cash flows and their variance
within each of the company’s activities. In addition, a
thorough understanding of how the market values of
assets and liabilities may fluctuate at the total balance
sheet level under different scenarios is needed. These
balance sheet level risks are commonly defined as Asset
and Liability Management (“ALM”) risks. In addition to
interest rate, currency and liquidity risk, inflation risk and
risks relating to GDP growth rates are central ALM risks
in Sampo Group. The ALM risks are one of the focus areas
of senior management because of their relevance to risks
and earnings in the long run.
In general, concentration risk arises when the company’s
risk exposures are not diversified enough. When this is
the case, an individual extremely unfavourable claim or
financial market event, for instance, could threaten the
solvency of the company.
Concentrations can evolve within separate activities
– large single name or industry specific insurance or
investment exposures – or across activities when a
single name or an industry is contributing widely to
the profitability and risks of the company through both
insurance and investment activities.
Concentration risk may also materialize indirectly when
profitability and capital position react similarly to general
economic developments or to structural changes in the
institutional environment in different areas of business.
Core Risk Management ActivitiesTo create value for all stakeholders in the long run, Sampo
Group companies must have the following forms of capital
in place:
• Financial flexibility in the form of adequate capital and
liquidity.
• Good technological infrastructure.
• Intellectual capital in the form of comprehensive
proprietary actuarial data and analytical tools to
convert this data to information.
• Human capital in the form of skilful and motivated
employees.
• Social and relationship capital in the form of good
relationships with society and clients to understand the
changing needs of different stakeholders.
At the company level, these resources are continuously
developed. They are in use when the following core
activities related to risk pricing, risk taking, and active
management of risk portfolios are conducted.
Appropriate selection and pricing of underwriting risks
• Underwriting risks are carefully selected and are priced
to reflect their inherent risk levels.
• Insurance products are developed proactively to meet
clients’ changing needs and preferences.
BOARD OFDIRECTORS’ REPORT
AUDITOR’S REPORT
SAMPO PLC’S FINANCIAL STATEMENTS
Sampo plc’s Notes to the Accounts
GROUP’S IFRS FINANCIAL STATEMENTS
Group’s Notes to the Accounts
121FINANCIAL STATEMENTS 2019

Effective management of underwriting exposures
• Diversification is actively sought.
• Reinsurance is used effectively to reduce largest
exposures.
Careful selection and execution of investment transactions
• Risk return ratios and sustainability issues of separate
investments opportunities are carefully analysed.
• Transactions are executed effectively.
Effective mitigation of consequential risks
• Counterparty default risks are mitigated by carefully
selecting counterparties, applying collateral
agreements and assuring adequate diversification.
• High quality and cost-efficient business processes are
maintained.
• Continuity and recovery plans are continuously
developed to secure business continuity.
Effective management of investment portfolios
and the balance sheet
• Balance between expected returns and risks in
investment portfolios and the balance sheet is
optimized, considering the features of insurance
liabilities, internally assessed capital needs, regulatory
solvency rules and rating requirements.
• Liquidity risks are managed by having an adequate
portion of investments in liquid instruments. The
portion is mainly dependent on the features of the
liabilities.
At the Group level, the risk management focus is on
the Group-wide capitalization and liquidity. It is also
essential to identify potential risk concentrations and to
have a thorough understanding of how reported profits of
companies would develop under different scenarios. These
concentrations and correlations may have an effect on the
Group level capitalization and liquidity buffers as well as on
the Group level management actions.
When the above-mentioned core activities are successfully
implemented, a balance between profits, risks and
capitalization can be achieved both at company and group
level and shareholder value can be created.
If Group
Underwriting Risks As shown in the following graph Breakdown of Gross
Written Premiums by Business Area, Country and Line of
Business, If, 31 December 2019, the If insurance portfolio is
well diversified across Business Areas, Countries and Lines
of Business. The six Lines of Business are segmented in
accordance with insurance class segmentation used in IFRS. Graph 1, 2, 3
Breakdown of Gross Written PremiumsIf, 31 December 2019, total EUR 4,675 million
● Private 2,706
● Commercial 1,188
● Industrial 632
● Baltic 149
The following adjustments from IFRS LoBs to Solvency II LoBs are made:• IFRS Line of Business Motor other and Motor third party liability (1,918) include Solvency II Line of Business Motor vehicle liability insurance (541) and Other motor insurance (1,377). • IFRS Line of Business Accident (651) includes Solvency II Line of Businesss Income protection insurance (331), Other life (45), Medical expense insurance (275) and Assistance (0).
By Business Area By Country By Line of Business
● Norway 1,641
● Sweden 1,481
● Finland 963
● Denmark 441
● Baltic 149
● Motor other and motor third party liability 1,918
● Workers' compensation 187
● Liability 291
● Accident 651
● Property 1,511
● Marine, aviation, transport 117
BOARD OFDIRECTORS’ REPORT
AUDITOR’S REPORT
SAMPO PLC’S FINANCIAL STATEMENTS
Sampo plc’s Notes to the Accounts
GROUP’S IFRS FINANCIAL STATEMENTS
Group’s Notes to the Accounts
122FINANCIAL STATEMENTS 2019
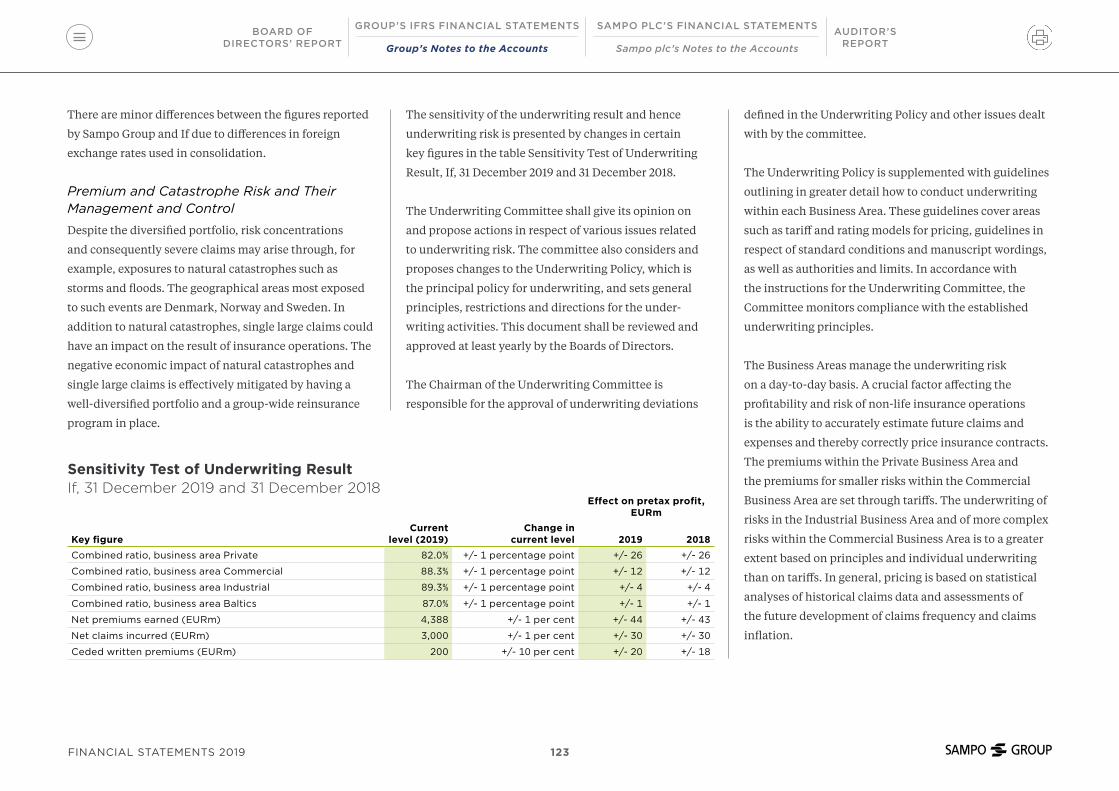
There are minor differences between the figures reported
by Sampo Group and If due to differences in foreign
exchange rates used in consolidation.
Premium and Catastrophe Risk and Their Management and Control
Despite the diversified portfolio, risk concentrations
and consequently severe claims may arise through, for
example, exposures to natural catastrophes such as
storms and floods. The geographical areas most exposed
to such events are Denmark, Norway and Sweden. In
addition to natural catastrophes, single large claims could
have an impact on the result of insurance operations. The
negative economic impact of natural catastrophes and
single large claims is effectively mitigated by having a
well-diversified portfolio and a group-wide reinsurance
program in place.
The sensitivity of the underwriting result and hence
underwriting risk is presented by changes in certain
key figures in the table Sensitivity Test of Underwriting
Result, If, 31 December 2019 and 31 December 2018.
The Underwriting Committee shall give its opinion on
and propose actions in respect of various issues related
to underwriting risk. The committee also considers and
proposes changes to the Underwriting Policy, which is
the principal policy for underwriting, and sets general
principles, restrictions and directions for the under-
writing activities. This document shall be reviewed and
approved at least yearly by the Boards of Directors.
The Chairman of the Underwriting Committee is
responsible for the approval of underwriting deviations
defined in the Underwriting Policy and other issues dealt
with by the committee.
The Underwriting Policy is supplemented with guidelines
outlining in greater detail how to conduct underwriting
within each Business Area. These guidelines cover areas
such as tariff and rating models for pricing, guidelines in
respect of standard conditions and manuscript wordings,
as well as authorities and limits. In accordance with
the instructions for the Underwriting Committee, the
Committee monitors compliance with the established
underwriting principles.
The Business Areas manage the underwriting risk
on a day-to-day basis. A crucial factor affecting the
profitability and risk of non-life insurance operations
is the ability to accurately estimate future claims and
expenses and thereby correctly price insurance contracts.
The premiums within the Private Business Area and
the premiums for smaller risks within the Commercial
Business Area are set through tariffs. The underwriting of
risks in the Industrial Business Area and of more complex
risks within the Commercial Business Area is to a greater
extent based on principles and individual underwriting
than on tariffs. In general, pricing is based on statistical
analyses of historical claims data and assessments of
the future development of claims frequency and claims
inflation.
Sensitivity Test of Underwriting ResultIf, 31 December 2019 and 31 December 2018
Effect on pretax profit, EURm
Key figureCurrent
level (2019)Change in
current level 2019 2018Combined ratio, business area Private 82.0% +/- 1 percentage point +/- 26 +/- 26
Combined ratio, business area Commercial 88.3% +/- 1 percentage point +/- 12 +/- 12
Combined ratio, business area Industrial 89.3% +/- 1 percentage point +/- 4 +/- 4
Combined ratio, business area Baltics 87.0% +/- 1 percentage point +/- 1 +/- 1
Net premiums earned (EURm) 4,388 +/- 1 per cent +/- 44 +/- 43
Net claims incurred (EURm) 3,000 +/- 1 per cent +/- 30 +/- 30
Ceded written premiums (EURm) 200 +/- 10 per cent +/- 20 +/- 18
BOARD OFDIRECTORS’ REPORT
AUDITOR’S REPORT
SAMPO PLC’S FINANCIAL STATEMENTS
Sampo plc’s Notes to the Accounts
GROUP’S IFRS FINANCIAL STATEMENTS
Group’s Notes to the Accounts
123FINANCIAL STATEMENTS 2019

If’s Reinsurance Policy stipulates guidelines for the
purchase of reinsurance. The need and optimal choice
of reinsurance is evaluated by considering the expected
cost versus the benefit of the reinsurance, the impact
on result volatility and capital requirements. The main
tool for this evaluation is If’s internal model in which
frequency claims, large claims and natural catastrophes
are modelled.
A group-wide reinsurance program has been in place in
If since 2003. In 2019, retention levels were between SEK
100 million (approximately EUR 9.4 million) and SEK 250
million (approximately EUR 23.6 million) per risk and SEK
250 million (approximately EUR 23.6 million) per event.
Reserve Risk and Its Management and ControlThe main reserve risks for If are stemming from
uncertainty in the claim amounts caused by higher
than expected claims inflation, change in the indexing
of annuities in Sweden, change in discount rates or an
increased retirement age with the consequences that both
annuities and lump sum payments would increase.
In the table Technical Provisions by Line of Business
and Major Geographical Area, If, 31 December 2019, the
technical provisions and durations of If are presented by
Line of Business and major geographical area. Finland’s
and Sweden’s share of technical provisions is larger than
the share of gross written premiums, which is mainly due
to Sweden and Finland having a long duration of Motor
other and Motor third party liability (“MTPL”) and Finland
also having a long duration of Workers compensation. The
long duration is mainly due to annuities in these Lines
of Business, which increases the amount of technical
provisions. The duration of the provisions, and thus the
sensitivity to changes in interest rates, varies with each
product portfolio. The weighted average duration for 2019
across the product portfolios was 6.5 years.
Technical Provisions by Line of Business and Major Geographical AreaIf, 31 December 2019
Sweden Norway Finland Denmark Baltics TotalEURm Duration EURm Duration EURm Duration EURm Duration EURm Duration EURm Duration
Motor other and MTPL 2,120 7.2 534 1.4 1,020 13.3 160 1.7 111 4.5 3,945 7.7
Workers' compensation 0 0.0 186 4.9 1,169 12.4 258 8.0 0 0.0 1,613 10.9
Liability 280 2.8 114 3.2 105 4.0 77 2.8 26 2.7 601 3.1
Accident 371 6.3 397 5.1 169 4.3 104 1.6 7 0.6 1,048 5.0
Property 402 1.1 493 1.1 239 0.9 103 0.8 34 0.8 1,271 1.0
Marine, aviation, transport 25 1.3 36 1.1 8 1.3 17 1.0 2 0.7 89 1.1
Total 3,198 5.9 1,760 2.6 2,710 10.9 719 3.5 181 3.3 8,568 6.5
BOARD OFDIRECTORS’ REPORT
AUDITOR’S REPORT
SAMPO PLC’S FINANCIAL STATEMENTS
Sampo plc’s Notes to the Accounts
GROUP’S IFRS FINANCIAL STATEMENTS
Group’s Notes to the Accounts
124FINANCIAL STATEMENTS 2019

annuities. The choice of index is stipulated in regulation
and is therefore exposed to regulatory change through e.g.
a political decision. The retirement age is another factor
that affects the value of annuities since these decrease or
expire at retirement. An increased retirement age through
for example a political decision, will therefore increase the
value of annuities. The present value of annuities is also
sensitive to changes in the discount rates used to discount
the nominal cash flows. The most material balances in If
of annuities with significant sensitivity to discount rates
relates to the business in Sweden, Finland and Denmark.
The Board of Directors of If decides on the guidelines
governing the calculation of technical provisions. The
Chief Actuary is responsible for developing and presenting
guidelines on how the technical provisions are to be
calculated and for assessing whether the level of total
provisions is sufficient. On If level, the Chief Actuary issues
a quarterly report on the adequacy of technical provisions.
Reserves are exposed mainly to inflation and discount rates
and to some extent to life expectancy. The sensitivity of If’s
technical provisions to an increase in inflation, an increase
in life expectancy and a decrease in the discount rate is
presented in the table Sensitivities of Technical Provisions,
If, 31 December 2019.
The technical provisions are further analyzed by claims
years. The output from this analysis is illustrated
both before and after reinsurance in the claims cost
trend tables. These are disclosed in the Note 26 to
the Financial Statements.
The anticipated inflation trend is considered when
calculating all provisions and is of the utmost importance
for claims settled over a long period of time, such as
Motor other, Motor third party liability and Workers’
compensation. The anticipated inflation is based on
external assessments of the inflation trend in various
areas, such as the consumer price index and payroll index,
combined with If’s own estimation of costs for various
types of claims. For Lines of Business such as Motor other,
Motor third party liability and Workers’ compensation,
legislation differs significantly between countries. Some of
the technical provisions for these lines include annuities
which are sensitive to changes in mortality assumptions
and discount rates. The proportion of technical provisions
related to Motor other, Motor third party liability and
Workers’ compensation was 65 per cent.
The indexing of Swedish Motor third party liability
annuities is one of the factors that affects the value of
Sensitivities of Technical ProvisionsIf, 31 December 2019
Technical provision item Risk factor Change in risk parameter CountryEffect
EURm 2019
Nominal provisions Inflation increase Increase by 1 percentage point
Sweden 158.3
Denmark 12.2
Norway 51.5
Finland 33.4
Annuities and estimated share of claims provisions to future annuities Decrease in mortality Life e xpectancy increase
by 1 year
Sweden 24.5
Denmark 1.7
Finland 67.0
Discounted provisions (annuities and part of Finnish IBNR)
Decrease in discount rate Decrease by 1 percentage point
Sweden 68.0
Denmark 17.8
Finland 299.4
The Actuarial Committee is a preparatory and advisory
board for If Chief Actuary. The committee secures a
comprehensive view over reserve risk, discusses and
gives recommendations on policies and guidelines for
calculating technical provisions.
The actuaries continuously monitor the level of provisions
to ensure that they comply with the established guidelines.
The actuaries also develop methods and systems to support
these processes.
The actuarial estimates are based on historical claims and
existing exposures that are available at the balance sheet
date. Factors that are monitored include loss development
trends, the level of unpaid claims, changes in legislation,
case-law and economic conditions. When setting the non-
life and life provisions, established actuarial and statistical
methods are used.
BOARD OFDIRECTORS’ REPORT
AUDITOR’S REPORT
SAMPO PLC’S FINANCIAL STATEMENTS
Sampo plc’s Notes to the Accounts
GROUP’S IFRS FINANCIAL STATEMENTS
Group’s Notes to the Accounts
125FINANCIAL STATEMENTS 2019

Investment AllocationIf, 31 December 2019 and 31 December 2018
31 Dec 2019 31 Dec 2018
Asset ClassMarket value,
EURm WeightAverage maturity,
yearsMarket value,
EURm WeightAverage maturity,
yearsFixed income total 9,808 88% 2.8 9,949 90% 2.7
Money market securities and cash 454 4% 0.1 370 3% 0.0
Government bonds 662 6% 3.8 884 8% 3.1
Credit bonds, funds and loans 8,692 78% 2.8 8,696 78% 2.8
Covered bonds 2,616 24% 2.5 2,683 24% 2.4
Investment grade bonds and loans 3,582 32% 2.8 3,770 34% 2.7
High-yield bonds and loans 1,587 14% 3.4 1,469 13% 3.4
Subordinated / Tier 2 467 4% 3.2 428 4% 4.0
Subordinated / Tier 1 440 4% 2.2 346 3% 2.5
Hedging swaps 0 0% - 0 0% -
Policy loans 0 0% 0.0 0 0% 0.0
Listed equity total 1,281 12% - 1,113 10% -
Finland 0 0% - 0 0% -
Scandinavia 865 8% - 769 7% -
Global 417 4% - 344 3% -
Alternative investments total 21 0% - 31 0% -
Real estate 3 0% - 12 0% -
Private equity 9 0% - 19 0% -
Biometric 0 0% - 0 0% -
Commodities 0 0% - 0 0% -
Other alternative 9 0% - 0 0% -
Trading derivatives 0 0% - -2 0% -
Asset classes total 11,109 100% - 11,092 100% -
FX Exposure, gross position 113 - - 229 - -
Market RisksFixed income investments and listed equity instruments
form the major part of the investment portfolio of EUR
11,109 million (11,092). A large part of the fixed income
investments was at 31 December 2019 concentrated to
financial institutions. The role of real estate, private
equity, and other alternative investments is immaterial.
The composition of the investment portfolios by asset
classes in If at year end 2019 and at year end 2018 and
average maturities of fixed income investments are shown
in the table Investment Allocation, If, 31 December 2019
and 31 December 2018.
BOARD OFDIRECTORS’ REPORT
AUDITOR’S REPORT
SAMPO PLC’S FINANCIAL STATEMENTS
Sampo plc’s Notes to the Accounts
GROUP’S IFRS FINANCIAL STATEMENTS
Group’s Notes to the Accounts
126FINANCIAL STATEMENTS 2019

and rating in the following table, which also includes
counterparty risk exposures relating to derivative
transactions. Counterparty default risks are described in
more detail in section Counterparty Default Risks. Due
to differences in the reporting treatment of derivatives,
the figures in the table are not fully comparable with other
tables in Sampo Group’s Financial Statements.
If’s investment management strategy is conservative,
with a low equity share and low fixed-income duration.
Both investment performance and market risk are actively
monitored and controlled by the Investment Control
Committee monthly and reported to the Own Risk and
Solvency Assessment Committee (“ORSA Committee”)
quarterly. In addition, the allocation limits, issuer and
counterparty limits, the sensitivity limits for interest rates
and credit spreads as well as regulatory capital require-
ments are regularly monitored.
Market Risks of Fixed Income and Equity Instruments
Spread Risk and Equity Risk
Spread risk and equity risk are derived only from the asset
side of the balance sheet. Exposures in fixed income and
equity instruments are presented by sector, asset class
BOARD OFDIRECTORS’ REPORT
AUDITOR’S REPORT
SAMPO PLC’S FINANCIAL STATEMENTS
Sampo plc’s Notes to the Accounts
GROUP’S IFRS FINANCIAL STATEMENTS
Group’s Notes to the Accounts
127FINANCIAL STATEMENTS 2019

Exposures by Sector, Asset Class and RatingIf, 31 December 2019
EURm AAA
AA+ -
AA-
A+ -
A-
BBB+ -
BBB-
BB+ -
C D Non-rated
Fixed income
totalListed
equities OtherCounter-
party risk Total
Change from
31 Dec 2018
Basic industry 0 0 20 87 20 0 11 139 39 0 0 178 18
Capital goods 0 0 61 41 10 0 121 232 454 0 0 686 134
Consumer products 0 0 170 275 16 0 85 546 221 0 0 768 -83
Energy 0 0 0 0 34 0 128 163 8 0 0 171 -140
Financial institutions 37 1,015 1,058 743 84 0 54 2,991 0 0 3 2,995 115
Governments 9 0 0 0 0 0 0 9 0 0 0 9 -124
Government guaranteed 9 27 0 0 0 0 0 36 0 0 0 36 0
Health care 7 0 10 27 0 0 36 80 82 0 0 162 -4
Insurance 0 0 42 82 26 0 42 192 0 0 0 192 2
Media 0 0 0 0 0 0 16 16 0 0 0 16 -6
Packaging 0 0 0 0 0 0 15 15 0 0 0 15 10
Public sector, other 514 66 0 0 0 0 0 579 0 0 0 579 -136
Real estate 0 5 88 268 55 0 545 961 0 3 0 965 171
Services 0 0 0 44 69 0 33 146 0 0 0 146 -34
Technology and electronics 0 0 19 13 10 0 105 147 0 0 0 147 48
Telecommunications 0 0 21 133 48 0 0 202 60 0 0 261 -22
Transportation 0 58 27 31 0 0 231 347 1 0 0 348 77
Utilities 0 0 61 114 118 0 29 322 0 0 0 322 -46
Others 0 26 0 0 0 0 27 53 0 9 0 63 21
Asset-backed securities 0 0 0 0 0 0 0 0 0 0 0 0 0
Covered bonds 2,535 70 11 0 0 0 0 2,616 0 0 0 2,616 -67
Funds 0 0 0 0 0 0 0 0 417 8 0 425 62
Clearing house 0 0 0 0 0 0 0 0 0 0 0 0 0
Total 3,110 1,268 1,589 1,858 491 0 1,478 9,794 1,281 21 3 11,099 -3Change from 31 Dec 2018 -270 -111 -124 80 102 0 161 -163 168 -10 2 -3 0
The figures include bank account balances related to insurance activities.
BOARD OFDIRECTORS’ REPORT
AUDITOR’S REPORT
SAMPO PLC’S FINANCIAL STATEMENTS
Sampo plc’s Notes to the Accounts
GROUP’S IFRS FINANCIAL STATEMENTS
Group’s Notes to the Accounts
128FINANCIAL STATEMENTS 2019

Most of the fixed income exposures are in investment
grade issues and currently the role of Nordic covered
bonds and Nordic banks as issuers is central. Within fixed
income investments part of the money market securities,
cash and investment grade government bonds form a
liquidity buffer.
The changes in equity positions during the year can
be seen in the graph Breakdown of Listed Equity
Investments by Geographical Regions, If, 31 December
2019 and 31 December 2018.
Market Risks of Balance Sheet
Asset and Liability Management Risk
The ALM risk is considered through the risk appetite
framework and its management and governance are
based on If’s Investment Policies. In general, to maintain
the ALM risk within the overall risk appetite, the cash
flows of insurance liabilities are matched by investing
in fixed income instruments denominated in the same
currencies as the liabilities. Derivatives can be used to
manage the ALM risk.
Interest Rate Risk
In general, If is negatively affected when interest rates
are decreasing or remaining at low levels, as the duration
of liabilities in If is longer than the duration of assets.
If has over the years gradually decreased its combined
ratio level to counteract falling interest rates. Interest
rate sensitivity in terms of the average duration of fixed
income investments was 1.3. The respective duration of
insurance liabilities was 6.5. Interest rate risk is managed
by changing the duration of assets and interest rate
derivatives based on the market view and risk appetite.
In the financial accounts, most of the technical
provisions are nominal, while the annuity and annuity
IBNR reserves, are discounted using interest rates in
accordance with the regulatory rules. Accordingly,
from an accounting perspective, If is mainly exposed
to changes in inflation and regulatory discount rates.
From an economic perspective, in which the cash flows
of insurance liabilities are discounted with prevailing
interest rates, If is exposed to changes both in inflation
and nominal interest rates. For more information see the
table Sensitivities of Technical Provisions, If, 2019 in
the section Underwriting Risks.
Currency Risk
If writes insurance policies that are mostly denominated
in the Scandinavian currencies and in the euro. The
currency risk is to a large extent reduced by matching
technical provisions with investment assets denominated
in the corresponding currencies or by using currency
derivatives. The currency exposure in insurance
146 120
83 86
117 147
48 26
748 622
139 112
Breakdown of Listed Equity Investments by Geographical RegionsIf
● Denmark 0%
● Norway 9%
● Sweden 58%
● Finland 0%
● Western Europe 11%
● Eastern Europe 0%
● North America 7%
● Latin America 4%
● Far East 11%
● Denmark X
● Norway X
● Sweden X
● Finland X
● Länsi-Eurooppa X
● Itä-Eurooppa X
● Pohjois-Amerikka X
● Latinalainen Amerikka X
● Kaukoitä X
● Denmark 0%
● Norway 13%
● Sweden 56%
● Finland 0%
● Western Europe 10%
● Eastern Europe 0%
● North America 8%
● Latin America 2%
● Far East 11%
31 December 2019total EUR 1,281 million
31 December 2018Total EUR 1,113 million
BOARD OFDIRECTORS’ REPORT
AUDITOR’S REPORT
SAMPO PLC’S FINANCIAL STATEMENTS
Sampo plc’s Notes to the Accounts
GROUP’S IFRS FINANCIAL STATEMENTS
Group’s Notes to the Accounts
129FINANCIAL STATEMENTS 2019
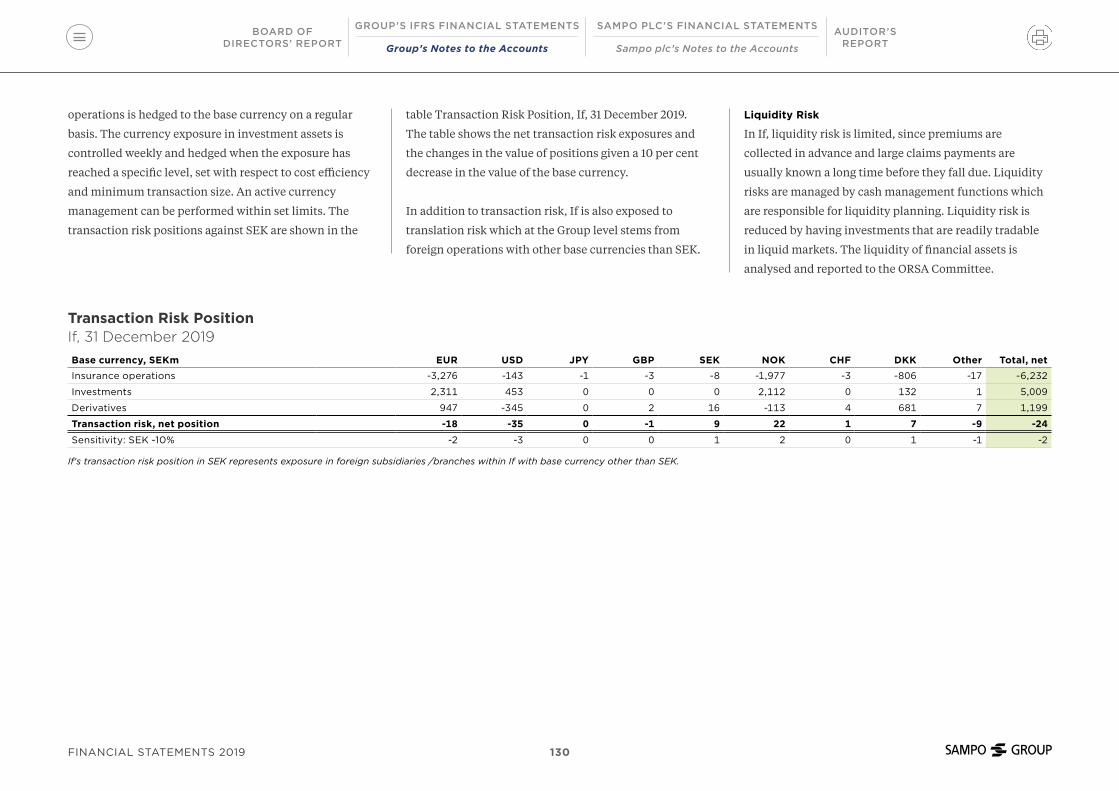
operations is hedged to the base currency on a regular
basis. The currency exposure in investment assets is
controlled weekly and hedged when the exposure has
reached a specific level, set with respect to cost efficiency
and minimum transaction size. An active currency
management can be performed within set limits. The
transaction risk positions against SEK are shown in the
table Transaction Risk Position, If, 31 December 2019.
The table shows the net transaction risk exposures and
the changes in the value of positions given a 10 per cent
decrease in the value of the base currency.
In addition to transaction risk, If is also exposed to
translation risk which at the Group level stems from
foreign operations with other base currencies than SEK.
Liquidity Risk
In If, liquidity risk is limited, since premiums are
collected in advance and large claims payments are
usually known a long time before they fall due. Liquidity
risks are managed by cash management functions which
are responsible for liquidity planning. Liquidity risk is
reduced by having investments that are readily tradable
in liquid markets. The liquidity of financial assets is
analysed and reported to the ORSA Committee.
Transaction Risk PositionIf, 31 December 2019Base currency, SEKm EUR USD JPY GBP SEK NOK CHF DKK Other Total, netInsurance operations -3,276 -143 -1 -3 -8 -1,977 -3 -806 -17 -6,232
Investments 2,311 453 0 0 0 2,112 0 132 1 5,009
Derivatives 947 -345 0 2 16 -113 4 681 7 1,199
Transaction risk, net position -18 -35 0 -1 9 22 1 7 -9 -24
Sensitivity: SEK -10% -2 -3 0 0 1 2 0 1 -1 -2
If's transaction risk position in SEK represents exposure in foreign subsidiaries /branches within If with base currency other than SEK.
BOARD OFDIRECTORS’ REPORT
AUDITOR’S REPORT
SAMPO PLC’S FINANCIAL STATEMENTS
Sampo plc’s Notes to the Accounts
GROUP’S IFRS FINANCIAL STATEMENTS
Group’s Notes to the Accounts
130FINANCIAL STATEMENTS 2019
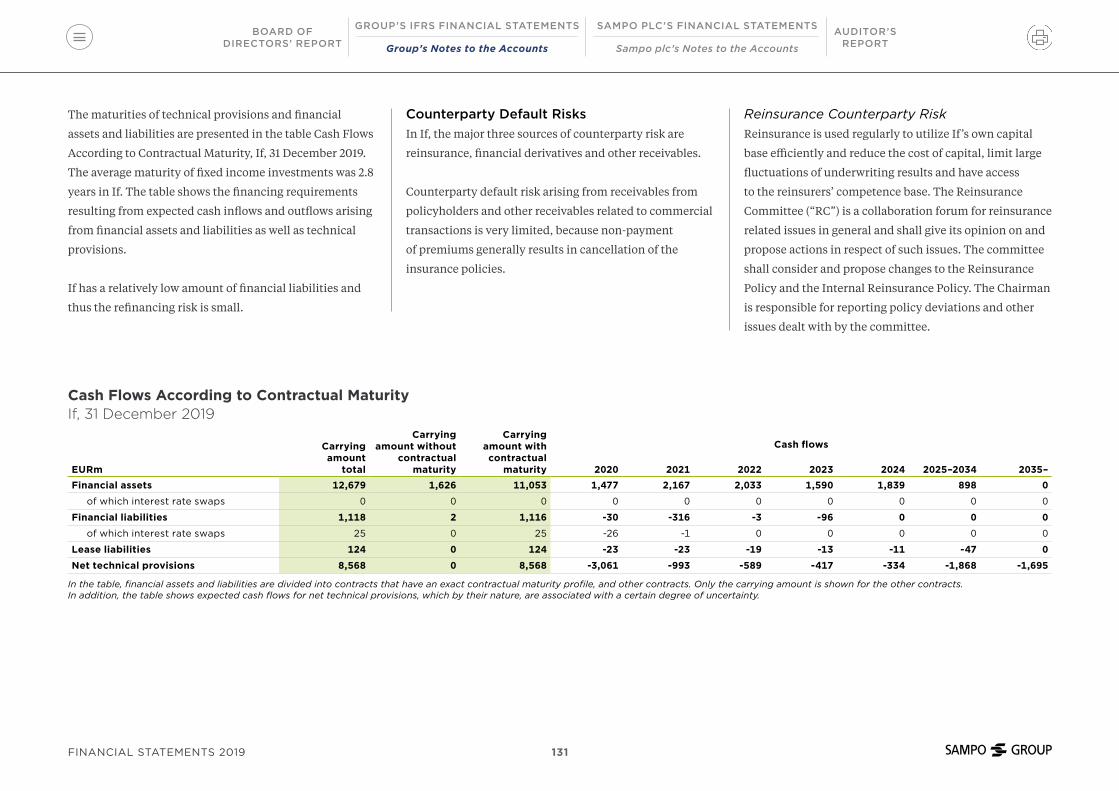
The maturities of technical provisions and financial
assets and liabilities are presented in the table Cash Flows
According to Contractual Maturity, If, 31 December 2019.
The average maturity of fixed income investments was 2.8
years in If. The table shows the financing requirements
resulting from expected cash inflows and outflows arising
from financial assets and liabilities as well as technical
provisions.
If has a relatively low amount of financial liabilities and
thus the refinancing risk is small.
Cash Flows According to Contractual MaturityIf, 31 December 2019
EURm
Carrying amount
total
Carrying amount without
contractual maturity
Carrying amount with contractual
maturity
Cash flows
2020 2021 2022 2023 2024 2025–2034 2035–Financial assets 12,679 1,626 11,053 1,477 2,167 2,033 1,590 1,839 898 0
of which interest rate swaps 0 0 0 0 0 0 0 0 0 0
Financial liabilities 1,118 2 1,116 -30 -316 -3 -96 0 0 0
of which interest rate swaps 25 0 25 -26 -1 0 0 0 0 0
Lease liabilities 124 0 124 -23 -23 -19 -13 -11 -47 0
Net technical provisions 8,568 0 8,568 -3,061 -993 -589 -417 -334 -1,868 -1,695
In the table, financial assets and liabilities are divided into contracts that have an exact contractual maturity profile, and other contracts. Only the carrying amount is shown for the other contracts. In addition, the table shows expected cash flows for net technical provisions, which by their nature, are associated with a certain degree of uncertainty.
Counterparty Default Risks In If, the major three sources of counterparty risk are
reinsurance, financial derivatives and other receivables.
Counterparty default risk arising from receivables from
policyholders and other receivables related to commercial
transactions is very limited, because non-payment
of premiums generally results in cancellation of the
insurance policies.
Reinsurance Counterparty RiskReinsurance is used regularly to utilize If’s own capital
base efficiently and reduce the cost of capital, limit large
fluctuations of underwriting results and have access
to the reinsurers’ competence base. The Reinsurance
Committee (“RC”) is a collaboration forum for reinsurance
related issues in general and shall give its opinion on and
propose actions in respect of such issues. The committee
shall consider and propose changes to the Reinsurance
Policy and the Internal Reinsurance Policy. The Chairman
is responsible for reporting policy deviations and other
issues dealt with by the committee.
BOARD OFDIRECTORS’ REPORT
AUDITOR’S REPORT
SAMPO PLC’S FINANCIAL STATEMENTS
Sampo plc’s Notes to the Accounts
GROUP’S IFRS FINANCIAL STATEMENTS
Group’s Notes to the Accounts
131FINANCIAL STATEMENTS 2019

The distribution of reinsurance receivables and
reinsurers’ portion of outstanding claims on 31 December
2019 per rating category is presented in the table Reinsur-
ance Recoverables, If, 31 December 2019 and 31 December
Reinsurance RecoverablesIf, 31 December 2019 and 31 December 2018
31 Dec 2019 31 Dec 2018Rating Total, EURm % of total Total, EURm % of totalAAA 0 0% 0 0%
AA+ - A- 94 99% 82 99%
BBB+ - BBB- 1 1% 1 1%
BB+ - C 0 0% 0 0%
D 0 0% 0 0%
Non-rated 0 0% 0 0%
Total 95 100% 83 100%
Because the recoverables reported above are typically not
covered by collaterals the whole amount is exposed to
counterparty risk.
If has a Reinsurance Security Policy that sets
requirements for the reinsurers’ minimum credit ratings
and the maximum exposure to individual reinsurers.
Also, the own credit-analysis plays a central role when
counter parties are selected.
The Reinsurance Security Committee shall give input
and suggestions to decisions in respect of various issues
regarding reinsurance default risk and risk exposure,
as well as proposed deviations from the Reinsurance
Security Policy. The Chairman is responsible for reporting
policy deviations and other issues dealt with by the
committee.
Most of the reinsurers have ratings between AA+ and
A-. The ten largest individual reinsurance recoverables
amounted to EUR 161 million, representing 70 per cent of
the total reinsurance recoverables including captives and
statutory pooled solutions.
The total ceded premium related to treaty and facultative
reinsurance amounted to EUR 55.2 million. Of this
amount, 100 per cent was related to reinsurance counter-
parties with a credit rating of A- or higher.
2018. In the table EUR 136 million (142) of reinsurance
recoverables are excluded, which mainly relates to
captives and statutory pooled solutions.
Counterparty Risk Related to Financial Derivatives
In If, the default risk of derivative counterparties is
a by-product of managing market risks. The role of
long-term interest rate derivatives has been immaterial
and counterparty risk stems mainly from short-term
FX-derivatives. The counterparty risk of bilaterally
settled derivatives is mitigated by a careful selection
of counterparties, by diversification of counterparties
to prevent risk concentrations and by using collateral
techniques, e.g. ISDA Master Agreements backed by
Credit Support Annexes. If settles interest rate swaps
in central clearing houses, which mitigates bilateral
counterparty risk but also results in a systemic risk
exposure related to centralised clearing parties.
BOARD OFDIRECTORS’ REPORT
AUDITOR’S REPORT
SAMPO PLC’S FINANCIAL STATEMENTS
Sampo plc’s Notes to the Accounts
GROUP’S IFRS FINANCIAL STATEMENTS
Group’s Notes to the Accounts
132FINANCIAL STATEMENTS 2019

Topdanmark Group
Underwriting Risks
Non-Life Underwriting Risks As shown in the graph Breakdown of Gross Written
Premiums by Business Area, Country and Line of
Business, Topdanmark Non-Life, 2019, Topdanmark’s
insurance portfolio is diversified across Business Areas
and Lines of Business.
Graph 7, 8, 9
Breakdown of Gross Written Premiums Topdanmark Non-Life, 2019, total EUR 1,272 million
● Norway 0
● Sweden 0
● Finland 0
● Denmark 1,272
● Baltic 0
By Business Area By Country By Line of Business
● Motor other and motor third party liability 288
● Workers' compensation 98
● Liability 76
● Accident 251
● Property 552
● Marine, aviation, transport 7
● Private 690
● Commercial 581
● Industrial 0
Premium and Catastrophe Risk and Their Management and Control
The main underwriting risk that influences the
performance is the risk of catastrophe events. However,
Topdanmark Forsikring has a very comprehensive rein-
su rance programme in place contributing to the low level
of underwriting risk. The largest retention level of DKK
100 million plus reinstatement for each event is on storm
events. The maximum retention on fire events is DKK 25
million and in workers' compensation risks are covered up
to DKK 1 billion with a retention of DKK 50 million.
With certain restrictions, acts of terrorism are covered by
the reinsurance contracts. The national Danish pool for
NBCR (nuclear, biological, chemical, radiological) risks
was closed as of 1 July 2019. Starting 1 July 2019, the NBCR
acts of terrorism are covered by a public organization.
This is based on a new Act on NBCR acts of terrorism.
Under the new scheme the costs from a NBCR attack in
Denmark will initially be borne by the State, but those
costs will subsequently be recovered from policyholders.
BOARD OFDIRECTORS’ REPORT
AUDITOR’S REPORT
SAMPO PLC’S FINANCIAL STATEMENTS
Sampo plc’s Notes to the Accounts
GROUP’S IFRS FINANCIAL STATEMENTS
Group’s Notes to the Accounts
133FINANCIAL STATEMENTS 2019

Premium risk reduction measures taken at different levels
of operations are as follows:
• Collection of data on risk and claims history
• Use of collected and processed data in profitability
reporting, risk analyses and in the internal model
• Ongoing follow-up on risk developments as well as
quarterly forecasts for future risk development
• Pricing using a statistical model tool including
customer scoring tools
• Reinsurance cover that reduces the risk especially for
catastrophe events
• Ongoing follow-up on the risk picture and reinsurance
coverage in the Risk Committee.
To maintain product and customer profitability,
Topdanmark monitors changes in its customer portfolios.
Provisions are recalculated, and the profitability reports
are updated in the same context on a monthly basis.
Based on this reporting, trends in claim levels are
carefully assessed and price levels may be adjusted if
considered necessary.
In the private market segment, customer scoring is used,
and customers are divided into groups according to their
expected profitability levels. The customer scoring has
two roles. First it helps to maintain the balance between
the individual customer's price and risk. Secondly it
facilitates the fairness between individual customers
by ensuring that no customers are paying too large
premiums to cover losses from customers who pay too
small premiums.
The historical profitability of major SME customers
with individual insurance schemes is monitored using
customer assessment systems. These assessment systems
enable Topdanmark to achieve accurate information
about income, claims expenses, combined ratio etc. for
each customer.
Reserve Risk and Its Management and Control
The insurance lines of business are divided into short-tail
i.e. those lines where the period from notification until
settlement is short and long-tail i.e. those lines where
the period from notification until settlement is long. The
main short-tail lines in Topdanmark are buildings and
other property and comprehensive motor insurance. For
the short-tail lines the claims are mainly settled within
Non-Life Insurance Risk ScenariosTopdanmark, 31 December 2019
Key figureCurrent level
(2019) Change in current level EURm after taxCombined ratio, business area Private 86.6% +/- 1 percentage point +/- 5.4
Combined ratio, business area Commercial 80.3% +/- 1 percentage point +/- 4.6
Net premiums earned (EURm) 1,178 +/- 1 per cent +/- 9.2
Net claims incurred (EURm) 779 +/- 1 per cent +/- 6.0
Ceded written premiums (EURm) -81 +/- 10 per cent +/- 6.3
In addition to the analysis described above, Topdanmark
continuously improves its administration systems to
achieve more detailed data, which in turn enables the
company to identify the claims trends at an earlier point
in time and compile information on the constituent parts
of the various types of claims.
The non-life risk scenarios are presented in the table
Non-Life Insurance Risk Scenarios, Topdanmark,
31 December 2019.
the first year. Long-tail lines relate to personal injury and
liability and consist of the lines Workers' compensation,
Accident, Motor third party insurance and Commercial
liability. Composition of non-life provisions for
outstanding claims is presented in the following table.
BOARD OFDIRECTORS’ REPORT
AUDITOR’S REPORT
SAMPO PLC’S FINANCIAL STATEMENTS
Sampo plc’s Notes to the Accounts
GROUP’S IFRS FINANCIAL STATEMENTS
Group’s Notes to the Accounts
134FINANCIAL STATEMENTS 2019

Due to the longer period of claims settlement, the
long-tail lines of business are generally riskier than the
short-tail lines. It is not unusual that claims in long-tail
lines are settled three to five years after notification and in
rare cases up to 10–15 years.
The reserve risk is calculated using Topdanmark’s partial
internal model for insurance risk. Workers’ compensation
claims provision has by far the biggest risk, followed by
the other long-tail claims provisions.
During such a long period of settlement, the levels of
compensation could be significantly affected by changes
in legislation, case-law or practice in the compensation
of claim incidents adopted by the Danish Labour Market
Insurance which decides on compensation for injury
and loss of earnings potential in all cases of serious
industrial injuries. The practice adopted by the Danish
Labour Market Insurance also has some impact on the
levels of compensation for accident and personal injury
within motor, liability and commercial liability insurance.
Supreme court decisions can also influence the provisions
for former years especially for Workers’ compensation.
The provisioning risk represents mostly the ordinary
uncertainty of calculation and claims inflation, i.e. an
increase in the level of compensation due to the annual
increase in compensation per policy being higher than
Composition of Non-Life Provisions for Outstanding ClaimsTopdanmark, 31 December 2019 and 31 December 2018
2019 2018Provisions for outstanding claims % Duration % DurationShort-tail 12.2 1.0 12.1 1.0
Annuity provisions in workers' compensation 26.7 10.5 24.3 10.6
Other claims provisions in workers' compensation 21.8 1.7 24.1 2.8
Accident 28.8 3.9 27.3 3.8
Motor personal liability 6.9 2.3 8.9 2.2
Commercial liability 3.5 1.8 3.3 1.8
the general development in prices or due to a change
in judicial practice or legislation. The sufficiency of
the provisions is tested in key lines by calculating the
provisions using alternative models as well, and then
comparing the compensation with information from
external sources, primarily statistical material from the
Danish Labour Market Insurance and the Danish Road
Sector/Road Directorate.
The actuarial team has a continuous dialogue with the
claims departments on any changes in the practices
regarding new legislation, case-law or compensation
practices as well as on the impact of such changes on the
routines used to calculate individual provisions.
BOARD OFDIRECTORS’ REPORT
AUDITOR’S REPORT
SAMPO PLC’S FINANCIAL STATEMENTS
Sampo plc’s Notes to the Accounts
GROUP’S IFRS FINANCIAL STATEMENTS
Group’s Notes to the Accounts
135FINANCIAL STATEMENTS 2019

Life Underwriting Risks The split of premiums between products during the
last two years is presented in the table Sources of Gross
Sources of Gross PremiumsTopdanmark Life Insurance, 31 December 2019 and 31 December 2018
EURm 2019 2018With profit schemes 62.4 66.1
Unit-linked schemes 340.2 273.7
Group life 36.0 43.2
Regular premiums 438.6 383.0
With profit schemes 46.1 71.3
Unit-linked schemes 1,002.8 902.3
Single premiums 1,048.9 973.6
Gross premiums 1,487.5 1,356.6
Risk return on shareholders’ equity together with other
main components of life business result are shown in the
table Result of Life Insurance, Topdanmark 31 December
2019 and 31 December 2018.
Profit on life insurance consists of the following items:
• Investment return on shareholders’ equity, which is the
actual return on assets allocated to own funds.
• Sales and administration, which consists mainly of
the cost fees received from the customers deducted by
actual costs.
• Insurance risk, which is the insurance risk result on
death, invalidity, and other such items.
• Risk return on shareholders’ equity (divided into
a fair risk return and a profit margin) from with
profit schemes. The risk return is calculated for each
contribution group and has been based on their
estimated risk for the company and the desired level of
profit margin. The risk return is conditional. The risk
return is transferred to shareholders’ equity if it can be
covered primarily by collective bonus potentials.
The focus of sales is on unit-linked schemes and the
premiums received are mostly of unit-linked schemes.
The regular premiums are growing steadily while the
single premiums are fluctuating more from year to year.
The risk inherent in the life business is firstly related to
the with profit technical provisions. As the majority of
new contracts are written as unit-linked contracts, the risk
will not increase as much as the volume of premiums and
total provisions.
Group life insurance is a collective life insurance without
savings – that is, a risk insurance – where the sum insured
Result of Life InsuranceTopdanmark, 31 December 2019 and 31 December 2018
EURm 2019 2018Investment return on shareholders' equity 24.9 14.7
Sales and administration -2.9 -2.7
Insurance risk 3.0 -0.3
Risk return on shareholders' equity 18.8 18.8
Profit on life insurance 43.9 30.5
Premiums, Topdanmark Life Insurance, 31 December 2019
and 31 December 2018.
is paid only to the beneficiaries in case of the insured’s
death during the insurance period. It is irrelevant whether
the death is due to accident or illness.
BOARD OFDIRECTORS’ REPORT
AUDITOR’S REPORT
SAMPO PLC’S FINANCIAL STATEMENTS
Sampo plc’s Notes to the Accounts
GROUP’S IFRS FINANCIAL STATEMENTS
Group’s Notes to the Accounts
136FINANCIAL STATEMENTS 2019
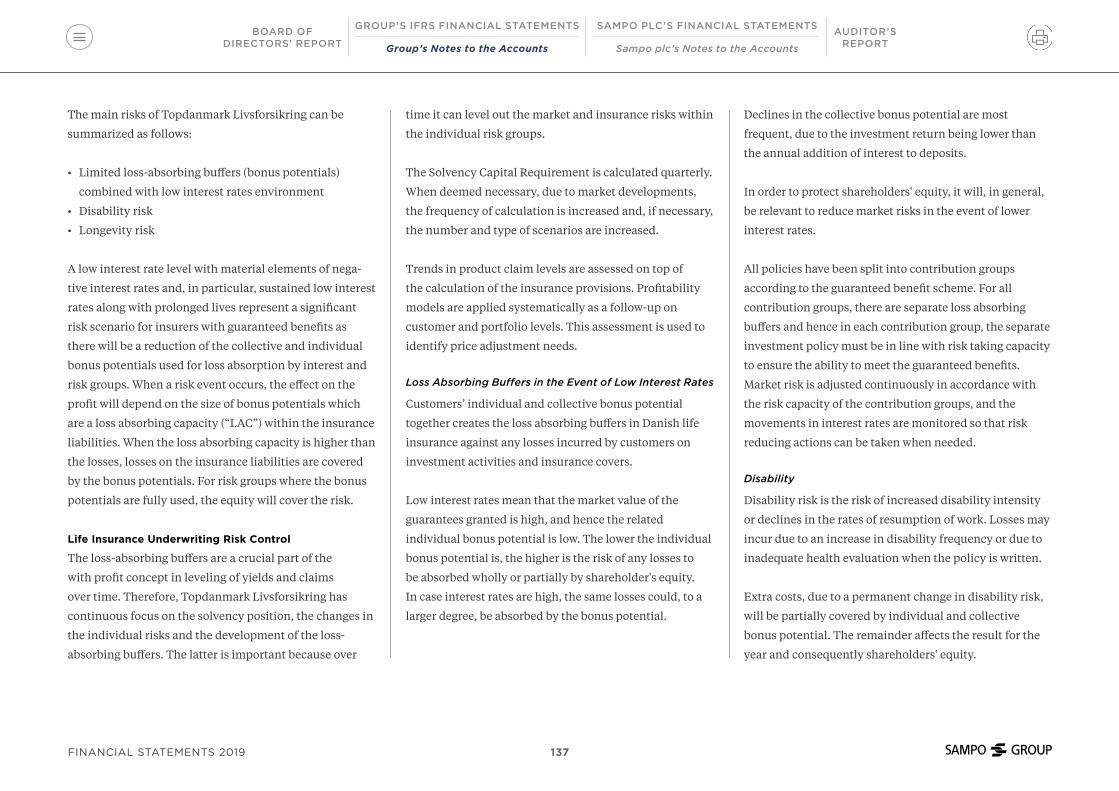
The main risks of Topdanmark Livsforsikring can be
summarized as follows:
• Limited loss-absorbing buffers (bonus potentials)
combined with low interest rates environment
• Disability risk
• Longevity risk
A low interest rate level with material elements of nega-
tive interest rates and, in particular, sustained low interest
rates along with prolonged lives represent a significant
risk scenario for insurers with guaranteed benefits as
there will be a reduction of the collective and individual
bonus potentials used for loss absorption by interest and
risk groups. When a risk event occurs, the effect on the
profit will depend on the size of bonus potentials which
are a loss absorbing capacity (“LAC”) within the insurance
liabilities. When the loss absorbing capacity is higher than
the losses, losses on the insurance liabilities are covered
by the bonus potentials. For risk groups where the bonus
potentials are fully used, the equity will cover the risk.
Life Insurance Underwriting Risk Control
The loss-absorbing buffers are a crucial part of the
with profit concept in leveling of yields and claims
over time. Therefore, Topdanmark Livsforsikring has
continuous focus on the solvency position, the changes in
the individual risks and the development of the loss-
absorbing buffers. The latter is important because over
time it can level out the market and insurance risks within
the individual risk groups.
The Solvency Capital Requirement is calculated quarterly.
When deemed necessary, due to market developments,
the frequency of calculation is increased and, if necessary,
the number and type of scenarios are increased.
Trends in product claim levels are assessed on top of
the calculation of the insurance provisions. Profitability
models are applied systematically as a follow-up on
customer and portfolio levels. This assessment is used to
identify price adjustment needs.
Loss Absorbing Buffers in the Event of Low Interest Rates
Customers’ individual and collective bonus potential
together creates the loss absorbing buffers in Danish life
insurance against any losses incurred by customers on
investment activities and insurance covers.
Low interest rates mean that the market value of the
guarantees granted is high, and hence the related
individual bonus potential is low. The lower the individual
bonus potential is, the higher is the risk of any losses to
be absorbed wholly or partially by shareholder's equity.
In case interest rates are high, the same losses could, to a
larger degree, be absorbed by the bonus potential.
Declines in the collective bonus potential are most
frequent, due to the investment return being lower than
the annual addition of interest to deposits.
In order to protect shareholders' equity, it will, in general,
be relevant to reduce market risks in the event of lower
interest rates.
All policies have been split into contribution groups
according to the guaranteed benefit scheme. For all
contribution groups, there are separate loss absorbing
buffers and hence in each contribution group, the separate
investment policy must be in line with risk taking capacity
to ensure the ability to meet the guaranteed benefits.
Market risk is adjusted continuously in accordance with
the risk capacity of the contribution groups, and the
movements in interest rates are monitored so that risk
reducing actions can be taken when needed.
Disability
Disability risk is the risk of increased disability intensity
or declines in the rates of resumption of work. Losses may
incur due to an increase in disability frequency or due to
inadequate health evaluation when the policy is written.
Extra costs, due to a permanent change in disability risk,
will be partially covered by individual and collective
bonus potential. The remainder affects the result for the
year and consequently shareholders' equity.
BOARD OFDIRECTORS’ REPORT
AUDITOR’S REPORT
SAMPO PLC’S FINANCIAL STATEMENTS
Sampo plc’s Notes to the Accounts
GROUP’S IFRS FINANCIAL STATEMENTS
Group’s Notes to the Accounts
137FINANCIAL STATEMENTS 2019

Longevity
Longevity risk is the risk that customers with life
dependent policies, primarily annuities, live longer
than expected. That will increase provisions for lifetime
products.
Extra costs, due to longer lifetimes, will be partially
covered by individual and collective bonus potential.
The remainder affects profit/loss for the year and
consequently shareholders' equity.
The following risk reduction measures and methods are
used in Topdanmark Livsforsikring:
• All policies in the average return environment are
divided according to the granted benefit guarantee and
the investment policy is designed to ensure the ability
to meet the guarantees
• Market risk is freely adjustable in relation to the
individual customer groups’ risk capacity
• Normal fluctuations in ROI and risk results in the
average interest rate environment are captured by
bonus potentials per contribution group
• Reinsurance
• Prices for death and disability covers are adjusted
continuously in relation to the market situation and the
observed claims history
• The basis of new subscription is changed as needed
• Establishing business procedures that ensure that the
products are sold at the right price/risk mix
• Changes in insurance contract conditions that con-
tribute to risk mitigation for similar claims in the future
The monitoring of whether the risk reduction methods
are still effective is i.a. via continuous follow-up of the
company’s risk profile and reinsurance cover in the Risk
Market RisksIn general, the long-term value creation shall be based
mainly on the acceptance of insurance risks. To supple-
ment the Group’s profit from its insurance activities,
Topdanmark accepts a certain level of financial market
risks as well, given its strong liquidity position and stable,
high earnings from insurance operations. Hence, in
addition to fixed income instruments, Topdanmark has
invested, among other things, in equities, properties and
CDOs in order to improve the average investment return.
Risk Scenarios in Life InsuranceTopdanmark, 31 December 2019 and 31 December 2018
EURm after tax 2019 2018Disability intensity - 35% increase* -1.0 -1.4
Mortality intensity - 20% decline -3.4 -3.3
* 35% increase first year, subsequently 25%, coincident with 20% decline in reactivation rates
Committee and via the on-going follow-up of forecasts. If
the forecasts are not met, the risk reduction methods may
need to be corrected.
The life insurance risk scenarios can be found in the
following table.
Market risks are limited to the extent that is considered
appropriate, so that it is highly probable that the
company gains a profit even in the very unfavourable
financial market scenarios. Large risk exposures or highly
correlated risks are covered to prevent unnecessary losses
and market risks originating from insurance operations.
The investment portfolio shall be managed in a way
that market risk taking shall not endanger the normal
operations or implementation of planned actions in
unfavourable market conditions.
BOARD OFDIRECTORS’ REPORT
AUDITOR’S REPORT
SAMPO PLC’S FINANCIAL STATEMENTS
Sampo plc’s Notes to the Accounts
GROUP’S IFRS FINANCIAL STATEMENTS
Group’s Notes to the Accounts
138FINANCIAL STATEMENTS 2019

To reach the aforementioned general goals, the invest-
ment policy sets the company's objectives, strategies,
organization and reporting practices on investments.
The investment strategy is more precisely determined
in terms of market risk limits and specific requirements
for certain types of positions and sub-portfolios (risk
appetite). The investment strategy is determined by
the Board and revised at least once a year. Appropriate
financial risk mitigation techniques are used.
When selecting the investment assets, a portfolio compo-
sition that matches the risk features of the corresponding
liabilities is sought. The purpose of the investment policy
is also to ensure that the company has implemented
effectively the organization, systems and processes
necessary to identify, measure, monitor, manage and
report on investment risks to which it is exposed.
At the same time, the policy sets the framework for
investment of customers' savings, bonus schemes and
unit-linked savings (customer funds) in Topdanmark
Livsforsikring, so that the company can continue to offer
attractive savings products to its clients with competitive
returns in relation to the investment risks accepted by the
clients.
In addition to the investment policies, the companies
have a capital plan and a capital emergency plan if
sudden changes occur on the asset or liability side.
When market risks are measured and managed, all
exposures are included, regardless of whether they arise
from active portfolio management of investments or from
annuities, which are considered as market risk.
Asset Allocations: Topdanmark Excluding Unit-Linked
As described earlier, in life insurance different contribution
groups have their own investment strategies and their
loss absorbing buffers and hence it is relevant to assess
allocations and returns of these assets only in relation
to their respective contribution groups. However, the
company bears some market risk and thus the non-life
and life investment allocations are shown in the
table Investment Allocations Excluding Unit-Linked,
Topdanmark, 31 December 2019 and 31 December 2018
without assets covering unit-linked liabilities.
BOARD OFDIRECTORS’ REPORT
AUDITOR’S REPORT
SAMPO PLC’S FINANCIAL STATEMENTS
Sampo plc’s Notes to the Accounts
GROUP’S IFRS FINANCIAL STATEMENTS
Group’s Notes to the Accounts
139FINANCIAL STATEMENTS 2019

Investment Allocations Excluding Unit-LinkedTopdanmark, 31 December 2019 and 31 December 2018
Topdanmark Non-Life Topdanmark Life 31 Dec 2019 31 Dec 2018 31 Dec 2019 31 Dec 2018
Asset classMarket value,
EURm WeightMarket value,
EURm WeightMarket value,
EURm WeightMarket value,
EURm WeightFixed income total 2,089 90% 1,992 91% 4,103 77% 3,283 72%
Money market securities and cash 127 5% 258 12% 241 5% 329 7%
Government and mortgage bonds 1,812 78% 1,585 72% 3,456 65% 2,507 55%
Credit bonds 6 0% 14 1% 141 3% 168 4%
Index-linked bonds 72 3% 68 3% 170 3% 167 4%
CDOs 72 3% 68 3% 95 2% 112 2%
Listed equity total 124 5% 104 5% 360 7% 430 9%
Denmark 38 2% 30 1% 73 1% 84 2%
Scandinavia 2 0% 2 0% 8 0% 8 0%
Global 84 4% 72 3% 279 5% 337 7%
Alternative investments total 107 5% 93 4% 869 16% 852 19%
Real estate 57 2% 47 2% 520 10% 501 11%
Unlisted equities and hedge funds 50 2% 46 2% 349 7% 351 8%
Asset classes total 2,321 100% 2,189 100% 5,332 100% 4,564 100%
The exposure in equities outside Denmark and credit bonds has been adjusted by the use of derivatives. Unlisted equities and hedge funds include also private equity and direct holdings in non-listed equities.
The equity portfolios are well diversified and without
major single positions, when associated companies are
disregarded.
The main investment assets are government and
mortgage bonds, which comprise primarily Danish
mortgage bonds. The assets in this asset class are interest
rate sensitive and to a significant extent equivalent to
the interest rate sensitivity of the non-life insurance
provisions. Consequently, the return on government and
mortgage bonds should be assessed in connection with
return and revaluation of non-life insurance provisions.
Credit bonds are composed of a well-diversified
portfolio, primarily exposed to businesses in Europe,
predominantly in the investment grade segment.
Index-linked bonds comprise bonds – primarily Danish
mortgage bonds – for which the coupon and principal are
index-linked.
The CDO category primarily includes positions in CDO
equity tranches. The underlying assets consist for
the most part of senior secured bank loans, while the
remaining part consists primarily of investment grade
investments in corporate bonds. The real estate portfolio
comprises mainly owner-occupied real estate.
BOARD OFDIRECTORS’ REPORT
AUDITOR’S REPORT
SAMPO PLC’S FINANCIAL STATEMENTS
Sampo plc’s Notes to the Accounts
GROUP’S IFRS FINANCIAL STATEMENTS
Group’s Notes to the Accounts
140FINANCIAL STATEMENTS 2019

Market Risks of Balance Sheet
Interest Rate Risk
Interest rate risk is calculated for assets, liabilities and
derivative instruments, for which the carrying amount is
dependent on the interest rate level. Regarding insurance
liabilities Topdanmark is exposed to interest rate risk due
to provisions for outstanding claims in non-life insurance
and guaranteed benefits in life insurance.
Shifting the market yield curve upwards and downwards or
changing its shape leads to changed market values of assets
and derivatives and thus to unrealized gains or losses.
When assessing the value and sensitivity of insurance
provisions Topdanmark uses the Solvency II discount
curve that has its basis on market yield curve with volatility
adjustment (“VA”). The VA component of the DKK yield
curve comprises a corrective element based on the spreads
of Danish mortgage bonds and European credit bonds. The
VA component was 45 bps at the end of 2018 and 19 bps at
the end of 2019.
Generally, the interest rate risk is limited and controlled by
investing in interest-bearing assets in order to reduce the
overall interest rate exposure of the assets and liabilities to
the desired level. Therefore, the Danish mortgage bonds
and government bonds have a central role in the asset
portfolios. To further decrease the interest rate sensitivity
of the balance sheet, swaps and standard swaptions have
been used for hedging purposes.
Equity Risk
The Danish part of the equity portfolio is composed
based on the OMXCCAP index. The rest of the equity
holdings are in the foreign equity portfolio that is based
on the MSCI World DC in its original currency. As a result,
Topdanmark’s equity holdings are well-diversified. A
breakdown of Topdanmark’s listed equity investments by
geographical regions is presented in the following graph.
Real Estate Risk
The real estates are all located in Denmark, with the
material part in the areas of Copenhagen and Århus. The
holding is covering life insurance provisions and it is
diversified over office buildings and residential buildings.
The majority of the holding related to Topdanmark’s
property within equity is Topdanmark’s own offices. The
properties are valued in accordance with the rules of the
Danish FSA i.e. at market value taking the level of rent and
the terms of the tenancy agreements into consideration.
Graph 13Breakdown of Listed Equity Investments by Geographical RegionsTopdanmark
● Denmark 111
● Norway 6
● Sweden 4
● Finland 0
● Western Europe 129
● Eastern Europe 0
● North America 232
● Latin America 0
● Far East 2
● Denmark 114
● Norway 6
● Sweden 4
● Finland 0
● Western Europe 139
● Eastern Europe 0
● North America 270
● Latin America 0
● Far East 0
31 December 2019 total EUR 483 million
31 December 2018 total EUR 534 million
23% 21%
48% 51%1%
1%
27%26%
1%1%
Equities held by unit-linked customers in Topdanmark Livsforsikring are excluded.
BOARD OFDIRECTORS’ REPORT
AUDITOR’S REPORT
SAMPO PLC’S FINANCIAL STATEMENTS
Sampo plc’s Notes to the Accounts
GROUP’S IFRS FINANCIAL STATEMENTS
Group’s Notes to the Accounts
141FINANCIAL STATEMENTS 2019

Spread Risk
Most of Topdanmark's interest-bearing assets comprise
of AAA rated Danish mortgage bonds and debt issued
or guaranteed by top-rated European states. The risk of
losses is considered to be minor due to the high credit
quality of the issuers and because investments have been
made at spreads which are in balance with Topdanmark’s
desired risk ratio levels. The portfolio is well diversified
both geographically and by issuer type and, therefore, the
exposure to concentration risk is insignificant.
The investment policy stipulates that the portfolio must
be well-diversified by the number of counterparties and
by the amount of exposure to individual counterparties.
The main source of spread risk is the mortgage bonds.
Concentration Risk
Topdanmark’s fixed income investments by rating classes
are presented in the table Interest-bearing Assets by
Rating, Topdanmark, 31 December 2019 and 31 December
2018.
Topdanmark has no significant concentrations on the
investment side, except for the category treasury and
mortgage bonds that consists primarily of AAA rated
Danish mortgage bonds.
As earlier described, these assets have an interest rate
sensitivity that significantly corresponds to the interest
rate sensitivity of the technical provisions.
Currency Risk
In practice, the investment assets are the only source
of currency risk while the insurance liabilities are in
the Danish krones. The currency risk is mitigated by
derivatives and net exposures in different currencies are
minor except in the euro.
The currency risk is assessed based on SCR. The value of
the base currency is shocked by 25 per cent against most
of the currencies except against the euro where the largest
exposure exists, and the shock is 0.39 per cent, because
the Danish krone is pegged to the euro.
Inflation Risk
Future inflation is implicitly included in the models
Topdanmark uses to calculate its provisions. The general
principles regarding the inclusion of an allowance for
inflation differs when you look at the Workers' compen-
sation and Illness and Accident insurance. In the former
the provisions are calculated based on the expected future
indexation of wages and salaries, and in the latter based
on the expected development in the net price index.
An expected higher future inflation rate would generally
be included in the provisions with a certain time delay,
while at the same time the result would be impacted by
higher future indexation of premiums. To reduce the risk
of inflation within Workers' compensation and Illness
and Accident insurance, Topdanmark uses index-linked
bonds and derivatives to hedge a significant proportion of
the expected cash flows sensitive to future inflation.
Interest-bearing Assets by RatingTopdanmark, 31 December 2019 and 31 December 2018
Rating class, % 2019 2018>A+ 82.2 75.9
A+, A, A- 6.7 3.8
BBB+, BBB, BBB- 0.3 0.4
<BBB- 9.0 11.0
Money market deposits 1.8 8.9
BOARD OFDIRECTORS’ REPORT
AUDITOR’S REPORT
SAMPO PLC’S FINANCIAL STATEMENTS
Sampo plc’s Notes to the Accounts
GROUP’S IFRS FINANCIAL STATEMENTS
Group’s Notes to the Accounts
142FINANCIAL STATEMENTS 2019

Market Risk Sensitivities
The adjacent table is a summary of selected market risk
sensitivities. It can be seen from the table that the net
effect of 1 percentage point parallel change in interest
rates would be a less than 10 per cent drop in equity or
property prices.
Liquidity Risk
Topdanmark Group has a strong liquidity position. Firstly,
as premiums are paid in the beginning of the coverage
period the liquidity risk related to customers’ payments
is very limited. Secondly, the combination of insurance
businesses is of a character in which it is highly unlikely
that a liquidity shock could occur, because insurance
liabilities are by their nature stable liabilities and in asset
portfolios money market investments are complemented
by a large portfolio of liquid listed Danish government
and mortgage bonds.
Experience from quite significant and sudden movements
in long-term interest rates have confirmed that the
liquidity of these assets is not significantly affected by
market shocks.
The maturity structure of technical provisions and the
bond portfolio is presented in the adjacent table.
Market Risk Sensitivities, Topdanmark, 31 December 2019 and 31 December 2018
EURm after tax Risk scenario 2019 2018Effective interest rate 1 percentage point increase -1.3 3.3
Interest-bearing assets -69.7 -64.2
Provisions for claims and benefits etc. 68.3 67.5
Index-linked bonds 5% decrease in value -2.9 -2.7
Equities 10% decrease in value -11.5 -9.5
CDOs < AA 10% decrease in value -7.8 -7.5
Properties 10% decrease in value -19.2 -20.0
CurrencyAnnual loss with up to a 2.5% probability -0.7 -0.1
Expected Cash Flows for Provisions and the Bond PortfolioTopdanmark, 31 December 2019 and 31 December 2018
Cash flow years
EURm Carrying amount 1 2–6 7–16 17–26 27–36 >36Provisions for claims
2018 1,741 -522 -736 -378 -151 -69 -12
2019 1,749 -509 -711 -373 -142 -62 -1
Life insurance provisions guarantees and profitsharing
2018 3,098 -344 -941 -1,366 -619 -195 -57
2019 3,161 -277 -1,011 -1,296 -540 -159 -41
Bond portfolio including interest rate derivatives
2018 4,362 1,938 1,355 1,381 150 0 0
2019 5,543 1,755 2,720 1,816 598 0 0
Life insurance provisions for unit-linked products are covered by corresponding investment assets and therefore are not stated in the table.
The expected cash flows of the bond portfolio are calculated based on option adjusted durations that are used to measure the duration of the bond portfolio. The option adjustment relates primarily to Danish mortgage bonds and reflects the expected duration capturing the shortening effect of the borrower´s option to have the bond to be redeemed through the mortgage institution at any point in time.
BOARD OFDIRECTORS’ REPORT
AUDITOR’S REPORT
SAMPO PLC’S FINANCIAL STATEMENTS
Sampo plc’s Notes to the Accounts
GROUP’S IFRS FINANCIAL STATEMENTS
Group’s Notes to the Accounts
143FINANCIAL STATEMENTS 2019

Because of the aforementioned reasons Topdanmark's
liquidity risk is primarily related to the parent company
Topdanmark A/S. Topdanmark A/S finances its activities
and dividend programme by receiving dividends from its
subsidiaries. Further financing requirements are covered
by short-term money market loans, typically with a
maturity of one month or less.
Counterparty Default RisksTopdanmark is exposed to counterparty risk in both its
insurance and investment activities.
The main sources of counterparty risk are deposits made
to individual banks, derivative contracts with banks and
current receivables from reinsurance companies with the
addition of potential receivables that will arise in case of a
200-year catastrophe event. Topdanmark's counterparty
risk is assessed by the SCR standard formula.
Reinsurance Within insurance activities the reinsurance companies'
ability to pay is the most important counterparty risk
factor. Topdanmark minimises this risk by primarily
buying reinsurance cover from reinsurance companies
with a minimum rating of A- and by spreading
reinsurance cover over many reinsurers.
Mandatum Life Group
Underwriting RisksThe development of insurance liabilities during 2019 is
shown in the table Analysis of the Change in Provisions
Before Reinsurance, Mandatum Life, 31 December 2019.
For reinsurance counterparties, the Board approves
security guidelines which determine the maximum size of
reinsurance contract cover per a separate reinsurer. This
portion is dependent on the reinsurer's rating as well as
on Topdanmark’s own assessment of the reinsurer. The
largest risk concentrations may occur in case of major
catastrophe events, including storms and cloudbursts.
InvestmentsTopdanmark may suffer losses due to their counter-
parties’ inability to meet their obligations on bonds, loans
and other contracts including derivatives. The majority
of Topdanmark’s interest bearing assets comprise of
Danish mortgage bonds. In order to minimize the risk
to a single debtor, Topdanmark strives to always have a
well- diversified portfolio of bonds not only in regard to a
debtor but also geographically.
To limit the counterparty risk of financial contracts,
including derivative contracts, the choice of counterpar-
ties is restrictive, and collateral is required when the value
of the financial contracts exceeds the predetermined
limits. The size of the limits depends on the counterpar-
ty's credit rating and the terms of the contract.
BOARD OFDIRECTORS’ REPORT
AUDITOR’S REPORT
SAMPO PLC’S FINANCIAL STATEMENTS
Sampo plc’s Notes to the Accounts
GROUP’S IFRS FINANCIAL STATEMENTS
Group’s Notes to the Accounts
144FINANCIAL STATEMENTS 2019

Analysis of the Change in Provisions Before ReinsuranceMandatum Life, 31 December 2019
EURmLiability
2018 Premiums Claims paidExpense charges
Guaranteed interest Bonuses Other
Liability 2019 Share %
Unit-linked, excl. Baltic 6,810 1,448 -1,116 -77 0 0 886 7,952 66%Individual pension insurance 1,298 55 -19 -14 0 0 191 1,511 13%
Individual life 2,195 285 -474 -21 0 0 291 2,277 19%
Capital redemption operations 2,519 1,018 -601 -31 0 0 259 3,164 26%
Group pension 797 89 -22 -10 0 0 145 1,000 8%
With profit and others, excl. Baltic 4,208 125 -457 -33 112 8 -49 3,913 32%Group pension insurance, segregated portfolio 1,008 2 -57 -1 22 8 -17 964 8%
Basic liabilities. guaranteed rate 3.5% 658 2 -57 -1 22 8 -7 623 5%
Reserve for decreased discount rate (3.5% -> 0.50%) 250 0 0 0 0 0 13 263 2%
Future bonus reserves 100 0 0 0 0 0 -22 78 1%
Group pension 1,879 51 -225 -6 57 0 -25 1,732 14%Guaranteed rate 3.5% 1,603 2 -193 -3 53 0 -40 1,424 12%
Guaranteed rate 2.5%, 1.5% or 0.0% 276 48 -32 -3 4 0 14 308 3%
Individual pension insurance 763 7 -138 -4 28 0 28 684 6%Guaranteed rate 4.5% 567 4 -77 -3 23 0 -19 495 4%
Guaranteed rate 3.5% 128 2 -32 -1 4 0 21 122 1%
Guaranteed rate 2.5% or 0.0% 68 1 -29 0 1 0 26 67 1%
Individual life insurance 153 31 -27 -10 5 0 -10 142 1%Guaranteed rate 4.5% 52 1 -1 -1 2 0 -6 48 0%
Guaranteed rate 3.5% 76 1 -8 -3 3 0 4 73 1%
Guaranteed rate 2.5% or 0.0% 25 30 -18 -6 0 0 -9 22 0%
Capital redemption operations 24 0 0 0 0 0 1 25 0%Guaranteed rate 3.5% 0 0 0 0 0 0 0 0 0%
Guaranteed rate 2.5% or 0.0% 24 0 0 0 0 0 1 25 0%
Future bonus reserves 0 0 0 0 0 0 0 0 0%Reserve for decreased discount rate 232 0 0 0 0 0 -2 230 2%Longevity reserve 95 0 0 0 0 0 -9 86 1%Assumed reinsurance 3 0 0 0 0 0 0 3 0%Other liabilities 50 34 -11 -13 0 0 -15 47 0%Total, excl. Baltic 11,017 1,574 -1,573 -110 112 8 836 11,865 99%Baltic 159 30 -24 -4 1 0 17 178 1%
Unit-linked liabilities 145 28 -22 -3 0 0 18 166 1%
Other liabilities 14 2 -2 -1 1 0 0 13 0%
Mandatum Life Group total 11,176 1,603 -1,597 -114 113 8 854 12,043 100%
BOARD OFDIRECTORS’ REPORT
AUDITOR’S REPORT
SAMPO PLC’S FINANCIAL STATEMENTS
Sampo plc’s Notes to the Accounts
GROUP’S IFRS FINANCIAL STATEMENTS
Group’s Notes to the Accounts
145FINANCIAL STATEMENTS 2019
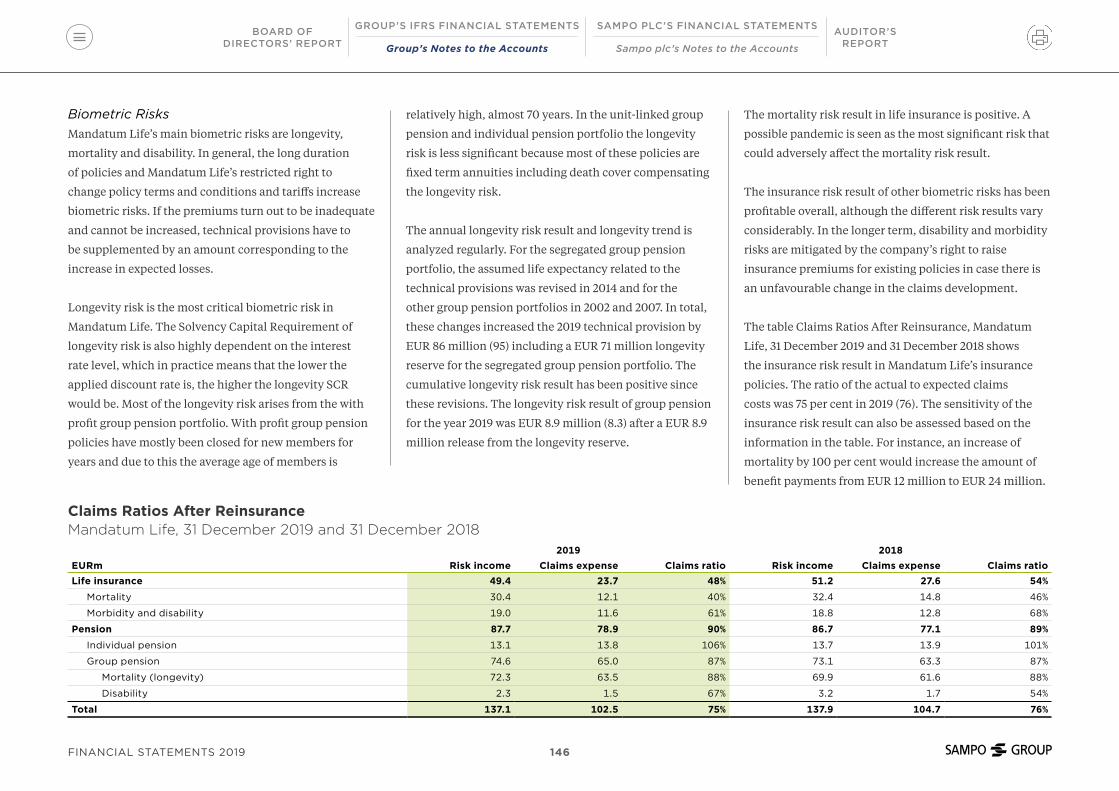
Biometric Risks Mandatum Life’s main biometric risks are longevity,
mortality and disability. In general, the long duration
of policies and Mandatum Life’s restricted right to
change policy terms and conditions and tariffs increase
biometric risks. If the premiums turn out to be inadequate
and cannot be increased, technical provisions have to
be supplemented by an amount corresponding to the
increase in expected losses.
Longevity risk is the most critical biometric risk in
Mandatum Life. The Solvency Capital Requirement of
longevity risk is also highly dependent on the interest
rate level, which in practice means that the lower the
applied discount rate is, the higher the longevity SCR
would be. Most of the longevity risk arises from the with
profit group pension portfolio. With profit group pension
policies have mostly been closed for new members for
years and due to this the average age of members is
relatively high, almost 70 years. In the unit-linked group
pension and individual pension portfolio the longevity
risk is less significant because most of these policies are
fixed term annuities including death cover compensating
the longevity risk.
The annual longevity risk result and longevity trend is
analyzed regularly. For the segregated group pension
portfolio, the assumed life expectancy related to the
technical provisions was revised in 2014 and for the
other group pension portfolios in 2002 and 2007. In total,
these changes increased the 2019 technical provision by
EUR 86 million (95) including a EUR 71 million longevity
reserve for the segregated group pension portfolio. The
cumulative longevity risk result has been positive since
these revisions. The longevity risk result of group pension
for the year 2019 was EUR 8.9 million (8.3) after a EUR 8.9
million release from the longevity reserve.
The mortality risk result in life insurance is positive. A
possible pandemic is seen as the most significant risk that
could adversely affect the mortality risk result.
The insurance risk result of other biometric risks has been
profitable overall, although the different risk results vary
considerably. In the longer term, disability and morbidity
risks are mitigated by the company’s right to raise
insurance premiums for existing policies in case there is
an unfavourable change in the claims development.
The table Claims Ratios After Reinsurance, Mandatum
Life, 31 December 2019 and 31 December 2018 shows
the insurance risk result in Mandatum Life’s insurance
policies. The ratio of the actual to expected claims
costs was 75 per cent in 2019 (76). The sensitivity of the
insurance risk result can also be assessed based on the
information in the table. For instance, an increase of
mortality by 100 per cent would increase the amount of
benefit payments from EUR 12 million to EUR 24 million.
Claims Ratios After ReinsuranceMandatum Life, 31 December 2019 and 31 December 2018
2019 2018EURm Risk income Claims expense Claims ratio Risk income Claims expense Claims ratioLife insurance 49.4 23.7 48% 51.2 27.6 54%
Mortality 30.4 12.1 40% 32.4 14.8 46%
Morbidity and disability 19.0 11.6 61% 18.8 12.8 68%
Pension 87.7 78.9 90% 86.7 77.1 89%
Individual pension 13.1 13.8 106% 13.7 13.9 101%
Group pension 74.6 65.0 87% 73.1 63.3 87%
Mortality (longevity) 72.3 63.5 88% 69.9 61.6 88%
Disability 2.3 1.5 67% 3.2 1.7 54%
Total 137.1 102.5 75% 137.9 104.7 76%
BOARD OFDIRECTORS’ REPORT
AUDITOR’S REPORT
SAMPO PLC’S FINANCIAL STATEMENTS
Sampo plc’s Notes to the Accounts
GROUP’S IFRS FINANCIAL STATEMENTS
Group’s Notes to the Accounts
146FINANCIAL STATEMENTS 2019

Reinsurance is used to limit the amount of individual
mortality and disability risks. The Board of Directors
annually approves the Reinsurance Policy and determines
the maximum amount of risk to be retained on the
company’s own account. The highest retention of
Mandatum Life is EUR 1.5 million per insured.
The risk result is actively followed and thoroughly
analyzed on an annual basis. Mandatum Life measures
the efficiency of risk selection and the adequacy of
tariffs by collecting information about the actual claims
expenditure for each product line and each type of risk
and comparing it to the claims expenditure assumed in
insurance premiums of every risk cover.
Technical provisions are analyzed and the possible
supplemental needs are assessed regularly. Assumptions
related to technical provisions are reviewed annually. The
adequacy of the technical provisions is tested quarterly.
Tariffs for new policies are set and the Underwriting
Policy and assumptions used in calculating technical
provisions are updated based on adequacy tests and risk
result analysis.
Policyholder Behavior and Expense RisksFrom an Asset and Liability Management point of view,
surrender risk is not material because in Mandatum Life
around 90 per cent of with profit technical provisions
consists of pension policies in which surrender is possible
only in exceptional cases. Surrender risk is therefore only
relevant in individual life and capital redemption policies
of which the related technical provisions amount to less
than 5 per cent (below EUR 200 million) of the total with
profit technical provisions. Furthermore, the supplements
to technical provisions are not paid out at surrender
which also reduces the surrender risk related to the with
profit policies. Due to the limited surrender risk, the
future cash flows of Mandatum Life’s insurance liabilities
are quite predictable.
Policy terms and tariffs cannot usually be changed
materially during the lifetime of the insurance, which
increases the expense risk. The behavior of financial
markets has also an influence on expense risk since
normally the company’s fee income is linked to policy
reserves in unit-linked policies. The main challenge is
to keep the expenses related to insurance administrative
The underwriting portfolio of Mandatum Life is
relatively well diversified and does not include any major
concentration of biometric risks. To further mitigate the
effects of possible risk concentrations, Mandatum Life has
catastrophe reinsurance in place.
In general, biometric risks are managed by careful risk
selection, by setting prices to reflect the risks and costs, by
setting upper limits for the protection granted and by use
of reinsurance. Mandatum Life’s Underwriting Policy sets
principles for risk selection and limits for sums insured.
The Reinsurance Policy governs the use of Reinsurance.
The Board approves the Underwriting policy, Reinsurance
Policy, pricing guidelines and the central principles for
the calculation of technical provisions.
The Insurance Risk Committee is responsible for
maintaining the Underwriting Policy and monitoring the
functioning of the risk selection and claims processes. The
Committee also reports all deviations from the Under-
writing Policy to the RMC. The Insurance Risk Committee
is chaired by the Chief Actuary who is responsible for
ensuring that the principles for pricing policies and for the
calculation of technical provisions are adequate and in line
with the underwriting and claims management processes.
BOARD OFDIRECTORS’ REPORT
AUDITOR’S REPORT
SAMPO PLC’S FINANCIAL STATEMENTS
Sampo plc’s Notes to the Accounts
GROUP’S IFRS FINANCIAL STATEMENTS
Group’s Notes to the Accounts
147FINANCIAL STATEMENTS 2019

processes and complex IT infrastructure at an effective
and competitive level. In year 2019, the expense result
of Mandatum Life Group was EUR 24 million (35).
Mandatum Life does not defer insurance acquisition costs.
Since 2012 the expense result has grown significantly,
especially due to increased fee income from unit-linked
business, as presented in the graph Expense Result,
Mandatum Life Group, 2010–2019.
20 255 3010 15 35
2019
2018
2017
2016
2015
2014
2013
2012
2011
2010
Expense Result Mandatum Life Group, 2010–2019
EURm
34.5
24.4
33.2
26.1
26.8
19.6
15.3
6.8
9.8
7.8
Market RisksThis section covers market risk related to Mandatum
Life’s with profit business i.e. that part of the business
where Mandatum Life carries the investment risk. As
mentioned earlier, the behavior of financial markets has
also an influence on unit-linked business since normally
the company’s fee income is linked to policy reserves in
unit-linked policies. This risk is taken into account as part
of expense risk.
In Mandatum Life, the approach to market risk
management is based on an analysis of technical
provisions’ expected cash flows, interest rate level and
current solvency position, i.e. active Asset and Liability
Management. A common feature for all with profit
technical provisions is the guaranteed rate and bonuses.
The cash flows of Mandatum Life's technical provisions
are relatively well predictable because in most of the
company’s with profit policies, surrenders and additional
investments are not possible.
Mandatum Life’s market risks arise mainly from equity
investments and interest rate risk related to fixed income
assets and insurance liabilities with a guaranteed interest
rate. The most significant interest rate risk in the life
insurance business is that fixed income investments
will not, over a long period of time, generate a return at
least equal to the guaranteed interest rate of technical
provisions. The probability of this risk increases when
market interest rates fall and stay at a low level. The
duration gap between the balance sheet’s technical
provisions and fixed income investments is constantly
monitored and managed. Control levels based on an
internal risk capacity model are used to manage and
ensure adequate capital in different market situations.
Mandatum Life has prepared for low interest rates on
the liability side by for example reducing the minimum
guaranteed interest rate in new contracts and by
supplementing the technical provisions with reserve
for decreased discount rate. In addition, existing
BOARD OFDIRECTORS’ REPORT
AUDITOR’S REPORT
SAMPO PLC’S FINANCIAL STATEMENTS
Sampo plc’s Notes to the Accounts
GROUP’S IFRS FINANCIAL STATEMENTS
Group’s Notes to the Accounts
148FINANCIAL STATEMENTS 2019

contracts have been changed to accommodate improved
management of reinvestment risk.
Fixed income investments and listed equity instruments
form a major part of the investment portfolio, but the role
of alternative investments – real estate, private equity,
biometric and other alternative investments – is also
material being 12.3 per cent of total investments.
Investment allocations and average maturities of fixed
income investments as at year-end 2019 and 2018 are
presented in the table Investment Allocation, Mandatum
Life, 31 December 2019 and 31 December 2018.
Investment AllocationMandatum Life, 31 December 2019 and 31 December 2018
31 Dec 2019 31 Dec 2018
Asset classMarket value,
EURm WeightAverage maturity,
yearsMarket value,
EURm WeightAverage maturity,
yearsFixed income total 3,669 65% 2.9 3,524 63% 2.8
Money market securities and cash 819 14% 0.0 486 9% 0.0
Government bonds 2 0% 2.7 50 1% 1.6
Credit bonds, funds and loans 2,848 50% 3.8 2,988 53% 3.3
Covered bonds 14 0% 4.7 133 2% 1.4
Investment grade bonds and loans 1,257 22% 3.5 1,563 28% 2.7
High-yield bonds and loans 1,170 21% 3.7 953 17% 3.6
Subordinated / Tier 2 135 2% 4.7 99 2% 5.6
Subordinated / Tier 1 272 5% 5.1 240 4% 5.7
Hedging swaps 0 0% - 0 0% -
Policy loans 0 0% - 0 0% 0.0
Listed equity total 1,308 23% - 1,334 24% -Finland 387 7% - 459 8% -
Scandinavia 1 0% - 1 0% -
Global 921 16% - 875 16% -
Alternative investments total 700 12% - 741 13% -Real estate 191 3% - 213 4% -
Private equity* 247 4% - 230 4% -
Biometric 0 0% - 12 0% -
Commodities 0 0% - 0 0% -
Other alternative 261 5% - 286 5% -
Trading derivatives 3 0% - 2 0% -Asset classes total 5,680 100% - 5,602 100% -FX Exposure, gross position 225 - - 410 - -
*Private equity also includes direct holdings in non-listed equities
BOARD OFDIRECTORS’ REPORT
AUDITOR’S REPORT
SAMPO PLC’S FINANCIAL STATEMENTS
Sampo plc’s Notes to the Accounts
GROUP’S IFRS FINANCIAL STATEMENTS
Group’s Notes to the Accounts
149FINANCIAL STATEMENTS 2019

Market Risks of Fixed Income and Equity Exposures
Fixed income and equity exposures are presented by
sector, asset class and rating together with counterparty
Exposures by Sector, Asset Class and RatingMandatum Life, 31 December 2019
EURm AAA
AA+ -
AA-
A+ -
A-
BBB+ -
BBB-
BB+ -
C D Non-rated
Fixed income
totalListed
equities OtherCounter-
party risk Total
Change from
31 Dec 2018Basic industry 0 0 0 10 60 0 15 85 85 0 0 170 52
Capital goods 0 0 4 5 26 0 60 95 152 0 0 247 24
Consumer products 0 0 52 95 77 0 20 245 127 0 0 372 -89
Energy 0 1 0 0 0 0 47 47 0 8 0 55 5
Financial institutions 0 560 823 354 65 0 17 1,819 32 8 5 1,864 108
Governments 0 0 0 0 0 0 0 0 0 0 0 0 0
Government guaranteed 0 0 0 0 0 0 0 0 0 0 0 0 0
Health care 0 0 5 23 90 0 33 151 92 18 0 261 21
Insurance 0 0 17 51 0 0 17 85 3 8 0 96 12
Media 0 0 0 0 6 0 0 6 9 0 0 15 -12
Packaging 0 0 0 0 9 0 24 33 12 0 0 44 18
Public sector, other 0 2 25 0 0 0 0 27 0 0 0 27 -47
Real estate 0 0 1 87 5 0 144 236 0 175 0 411 89
Services 0 0 4 44 157 0 60 265 86 0 0 351 58
Technology and electronics 1 0 6 5 47 0 11 70 188 10 0 268 58
Telecommunications 0 0 8 44 72 0 0 124 15 0 0 139 -22
Transportation 0 0 0 12 0 0 1 12 29 0 0 42 8
Utilities 0 0 2 38 111 0 0 150 0 0 0 151 36
Others 0 0 0 0 16 0 2 17 0 25 0 42 -15
Asset-backed securities 0 0 0 0 0 0 0 0 0 0 0 0 0
Covered bonds 14 0 0 0 0 0 0 14 0 0 0 14 -120
Funds 0 0 0 0 0 0 187 187 478 448 0 1,112 -108
Clearing house 0 0 0 0 0 0 0 0 0 0 6 6 2
Total 15 563 946 767 741 0 637 3,669 1,308 700 11 5,688 79
Change from 31 Dec 2018 -134 -44 -164 151 262 0 73 145 -26 -41 2 79
risk exposures relating to reinsurance and derivative
transactions in the table Exposures by Sector, Asset Class
and Rating, Mandatum Life, 31 December 2019. Counter-
party default risks are described in more detail in the
section Counterparty Default Risks. Due to differences
in the reporting treatment of derivatives, the figures in the
table may not be fully comparable with other tables in this
annual report.
BOARD OFDIRECTORS’ REPORT
AUDITOR’S REPORT
SAMPO PLC’S FINANCIAL STATEMENTS
Sampo plc’s Notes to the Accounts
GROUP’S IFRS FINANCIAL STATEMENTS
Group’s Notes to the Accounts
150FINANCIAL STATEMENTS 2019

The role of non-investment grade bonds is material in
Mandatum Life’s portfolio. A part of the money market
securities issued by Nordic banks and cash in Nordic
banks form a liquidity buffer within the fixed income
investments. At the moment, the total amount of these
investments is higher than what is needed for liquidity
purposes.
Nordic equity exposure includes almost only direct
investments to Finnish equities, and they account for
almost one third of equity exposure. Two thirds of equity
investments are allocated globally consisting of both fund
investments and direct investments. The breakdown
of Mandatum Life’s listed equity investments by
geographical regions is presented in the following graph.
Alternative Investments
The role of alternative investments has been significant
in Mandatum Life over the years. The current allocation
weight is 12 per cent.
The amount of private equity and alternative investments
has remained at the same level as in 2018. Since the
beginning of 2018, these asset classes have been managed
by Sampo plc’s investment operations instead of external
asset managers. The real estate portfolio is also managed
by Sampo Group’s own real estate management unit. The
real estate portfolio includes both direct investments in
properties and indirect investments in real estate funds as
well as in shares of real estate companies and it has been
quite stable.
Market Risks of Balance SheetThe Board of Directors of Mandatum Life annually
approves the Investment Policy, which covers both the
segregated assets and the company’s other assets that
carry investment risk. This policy sets principles and
limits for investment portfolio activities and they are
based on the features of insurance liabilities, risk taking
capacity and shareholders’ return requirements.
The Investment Policy for segregated assets defines the
risk bearing capacity and the corresponding control
levels for the respective portfolio. Since the future bonus
reserves of the segregated group pension portfolio is the
first buffer against possible investment losses, the risk
bearing capacity is also based on the amount of the future
Breakdown of Listed Equity Investments by Geographical RegionsMandatum Life
● Denmark 0
● Norway 0
● Sweden 1
● Finland 387
● Western Europe 430
● Eastern Europe 24
● North America 251
● Latin America 0
● Far East 215
● Denmark 0
● Norway 0
● Sweden 1
● Finland 459
● Western Europe 521
● Eastern Europe 24
● North America 180
● Latin America 0
● Far East 151
31 December 2019total EUR 1,308 million
31 December 2018total EUR 1,334 million
19%
2%
2%
16%11%
13%
33% 39%
30%
34%
BOARD OFDIRECTORS’ REPORT
AUDITOR’S REPORT
SAMPO PLC’S FINANCIAL STATEMENTS
Sampo plc’s Notes to the Accounts
GROUP’S IFRS FINANCIAL STATEMENTS
Group’s Notes to the Accounts
151FINANCIAL STATEMENTS 2019

bonus reserve. Different control levels are based on the
fixed stress scenarios of assets.
The Investment Policy for other investment assets defines
the company level risk bearing capacity, the control levels
for the maximum acceptable risk and respective measures
to manage the risk. The control levels are set above the
Solvency II SCR and are based on predetermined market
stress tests. When the above-mentioned control levels are
crossed, the Asset and Liability Committee reports to the
Board which then takes responsibility for the decisions
related to the capitalization and the market risks in the
balance sheet.
The cash flows of Mandatum Life’s with profit technical
provisions are relatively predictable, because in most
of the company’s with profit products, surrenders and
premiums are restricted. In addition, the company’s
claims costs do not contain a significant inflation risk
element.
The long-term target for investments is to provide
sufficient return to cover the guaranteed interest rate plus
bonuses based on the principle of fairness as well as the
shareholder’s return requirement with an acceptable level
of risk. In the long run, the most significant risk is that
fixed income investments will not generate an adequate
return compared to the applied discount rate.
In addition to investment and capitalization decisions,
Mandatum Life has implemented active measures on the
liability side to manage the balance sheet level interest
rate risk. The company has reduced the minimum
guaranteed interest rate in new contracts, supplemented
the technical provisions with discount rate reserves and
adjusted policy terms and conditions as well as policy
administration processes to enable more efficient interest
rate risk management.
Interest Rate Risk
Mandatum Life is negatively affected when rates are
decreasing or staying at low levels, because the duration of
liabilities is longer than the duration of assets. A growing
part of Mandatum Life’s business, i.e. unit-linked and life
and health business, is not interest rate sensitive, which
partially mitigates the whole company’s interest rate risk.
The average duration of fixed income investments was
2.8 years including the effect of hedging derivatives. The
respective duration of the insurance liabilities was around
12 years. Interest rate risk is managed at the balance sheet
level by changing the duration of assets and by using
interest rate derivatives.
Currency Risk
Currency risk can be divided into transaction and
translation risk. Mandatum Life is exposed to transaction
risk, which refers to currency risk arising from contractual
cash flows in foreign currencies.
In Mandatum Life, transaction risk arises mainly from
investments in other currencies than the euro as the
company’s technical provisions are denominated in the
euro. Mandatum Life does not automatically close its FX
position in foreign currencies, but instead, the currency
risk strategy is based on active management of the
currency position. The objective is to achieve a positive
return compared to a situation where the currency risk
exposure is fully hedged.
The transaction risk positions of Mandatum Life against
the euro are shown in the table Transaction Risk Position,
Mandatum Life, 31 December 2019. The table shows the
net transaction risk exposures and the changes in the
value of positions given a 10 per cent decrease in the value
of the base currency.
BOARD OFDIRECTORS’ REPORT
AUDITOR’S REPORT
SAMPO PLC’S FINANCIAL STATEMENTS
Sampo plc’s Notes to the Accounts
GROUP’S IFRS FINANCIAL STATEMENTS
Group’s Notes to the Accounts
152FINANCIAL STATEMENTS 2019

Transaction Risk PositionMandatum Life, 31 December 2019
Base currency, EURm EUR USD JPY GBP SEK NOK CHF DKK Other Total, netTechnical provisions 0 0 0 0 -3 0 0 0 0 -3
Investments 0 767 8 94 47 51 71 17 182 1,237
Derivatives 0 -736 -1 -94 -45 23 -76 -20 -82 -1,032
Transaction risk, net position 0 31 7 0 -1 73 -4 -3 100 203
Sensitivity: EUR -10% 0 3 1 0 0 7 0 0 10 20
Liquidity Risks
Liquidity risk is relatively immaterial for Mandatum Life
because liability cash flows in most lines of business are
fairly stable and predictable and an adequate share of the
investment assets is in cash or short-term money market
instruments.
In life insurance companies in general, a large change
in surrender rates could influence the liquidity position.
Cash Flows According to Contractual MaturityMandatum Life, 31 December 2019
EURm Carrying amount
total
Carrying amount without
contractual maturity
Carrying amount with contractual
maturity
Cash flows
2020 2021 2022 2023 2024 2025–2034 2035-Financial assets 5,634 2,961 2,674 355 197 280 398 733 843 12
of which interest rate swaps 11 0 11 0 0 2 2 1 7 0
Financial liabilities 402 0 402 -15 -9 -10 -10 -260 -55 -191
of which interest rate swaps 9 0 9 0 0 -1 -1 -1 -3 -5
Lease liabilities 9 0 9 -2 -2 -2 -2 -2 -1 0
Net technical provisions 3,347 0 3,347 -296 -295 -273 -258 -241 -1,643 -1,302
In the table, financial assets and liabilities are divided into contracts that have an exact contractual maturity profile, and other contracts. Only the carrying amount is shown for the other contracts. In addition, the table shows expected cash flows for net technical provisions, which by their nature, are associated with a certain degree of uncertainty.
However, in Mandatum Life, only a relatively small
part of the insurance policies can be surrendered, and
it is therefore possible to forecast short-term cash flows
related to claims payments with a very high accuracy.
The maturities of technical provisions and financial
assets and liabilities are presented in the table Cash
Flows According to Contractual Maturity, Mandatum
Life, 31 December 2019. The average maturity of fixed
income investments was 2.9 years in Mandatum Life. The
table shows the financing requirements resulting from
expected cash inflows and outflows arising from financial
assets and liabilities as well as technical provisions.
Mandatum Life has a relatively low amount of financial
liabilities and thus the refinancing risk is relatively small.
BOARD OFDIRECTORS’ REPORT
AUDITOR’S REPORT
SAMPO PLC’S FINANCIAL STATEMENTS
Sampo plc’s Notes to the Accounts
GROUP’S IFRS FINANCIAL STATEMENTS
Group’s Notes to the Accounts
153FINANCIAL STATEMENTS 2019

Counterparty Default RisksIn Mandatum Life, the three major sources of counter-
party risk are financial derivatives, reinsurance, and
other receivables. Counterparty default risk arising
from reinsurance or receivables from policyholders and
other receivables related to commercial transactions is,
however, very limited.
Counterparty Risk Related to Financial Derivatives
In Mandatum Life, the default risk of derivative counter-
parties is a by-product of managing market risks. This
stems from the fact that Mandatum Life is a frequent user
of long-term interest rate derivatives in addition to FX
forwards and options.
The counterparty risk of bilaterally settled derivatives
is mitigated by careful selection of counterparties,
by diversification of counterparties to prevent risk
concentrations and by using collateral arrangements,
e.g. ISDA Master Agreements backed by Credit Support
Annexes. Since 2016, Sampo Group companies apart from
Topdanmark have settled interest rate swaps in central
counterparty clearing houses, which, while further
mitigating bilateral counterparty risk, also expose Sampo
Group companies to the systemic risk related to central
counterparty clearing houses.
Risk Considerations at Sampo Group Level and Sampo plc
Sampo Group is first and foremost exposed to general
performance of the Nordic economies. However, the
Nordic economies typically are at any given time in some-
what different stages of their economic cycles, because
of reasons such as different economic structures and
separate currencies. Also, geographically the Nordics as a
large area is more a source of underwriting diversification
than a concentration. Hence, inherently the Nordic area is
a good basis for diversified business.
To further maintain diversification of businesses Sampo
Group proactively prevents concentrations to the extent
possible by segregating the duties of separate business
areas. As a result, separate companies have very few
overlapping areas in their underwriting and investments
activities. Despite proactive strategic decisions on
segregation of duties, concentrations in underwriting and
investments may appear and hence liabilities and assets
are monitored at the Group level to identify potential
concentrations at a single company or risk factor level.
It is regarded that the current business model where all
companies have their own processes and agreements with
counterparties is preventing accumulation of counter-
party default risks and operational risks. Hence, these
risks are mainly managed at company level.
In addition to the “segregation of duties at strategic level”
principle, Sampo Group has two principles proactively
preventing the Group risks. The amount of intragroup
exposures between the Group companies is small and the
parent company is the only source of liquidity and the
main source of capital within the Group. These principles
effectively prevent the contagion risk and hence potential
problems of one company will not affect directly the other
Group companies.
Underwriting and market risk concentrations and their
management are described in the next sections as well as
the parent company's role as a risk manager of group-wide
risks and as a source of liquidity.
Underwriting Risks at Sampo GroupWith respect to the underwriting businesses carried out
in the subsidiary companies, it has been established that
If, Topdanmark and Mandatum Life all operate within
the Nordic countries, but mostly in different geographical
areas and in different lines of business and hence their
underwriting risks are different by nature. There are some
BOARD OFDIRECTORS’ REPORT
AUDITOR’S REPORT
SAMPO PLC’S FINANCIAL STATEMENTS
Sampo plc’s Notes to the Accounts
GROUP’S IFRS FINANCIAL STATEMENTS
Group’s Notes to the Accounts
154FINANCIAL STATEMENTS 2019

common risk factors like the life expectancy in Finland.
Also, in Denmark If and Topdanmark have some overlap-
ping areas. However, there are no material underwriting
risk concentrations in the normal course of business.
Consequently, business lines as such are contributing
diversification benefits rather than a concentration of
risks. This general risk picture has not changed with
increased holding in Topdanmark, because Topdanmark
underwrites mainly Danish risks with a focus on client
bases which only marginally overlap with If’s client bases.
Market Risks at Sampo Group LevelFor all subsidiaries, their insurance liabilities and the
company specific risk appetite are the starting points
for their investment activities. The insurance liabilities
including loss absorbing buffers as well as the risk appetite
of Mandatum Life, If and Topdanmark differ, and as a result
the structures and risks of the investment portfolios and
balance sheets of the three companies differ respectively.
Sampo Group’s investment assets presented in the tables
and graphs in this section do not include investments in the
subsidiaries or in the associated companies (e.g. Nordea).
The total amount of Sampo Group’s investment assets as
at 31 December 2019 was EUR 26,820 million (25,887) as
presented in the following graph. Mandatum Life’s and
Topdanmark’s investment assets presented here do not
include assets which cover unit-linked contracts.
BOARD OFDIRECTORS’ REPORT
AUDITOR’S REPORT
SAMPO PLC’S FINANCIAL STATEMENTS
Sampo plc’s Notes to the Accounts
GROUP’S IFRS FINANCIAL STATEMENTS
Group’s Notes to the Accounts
155FINANCIAL STATEMENTS 2019
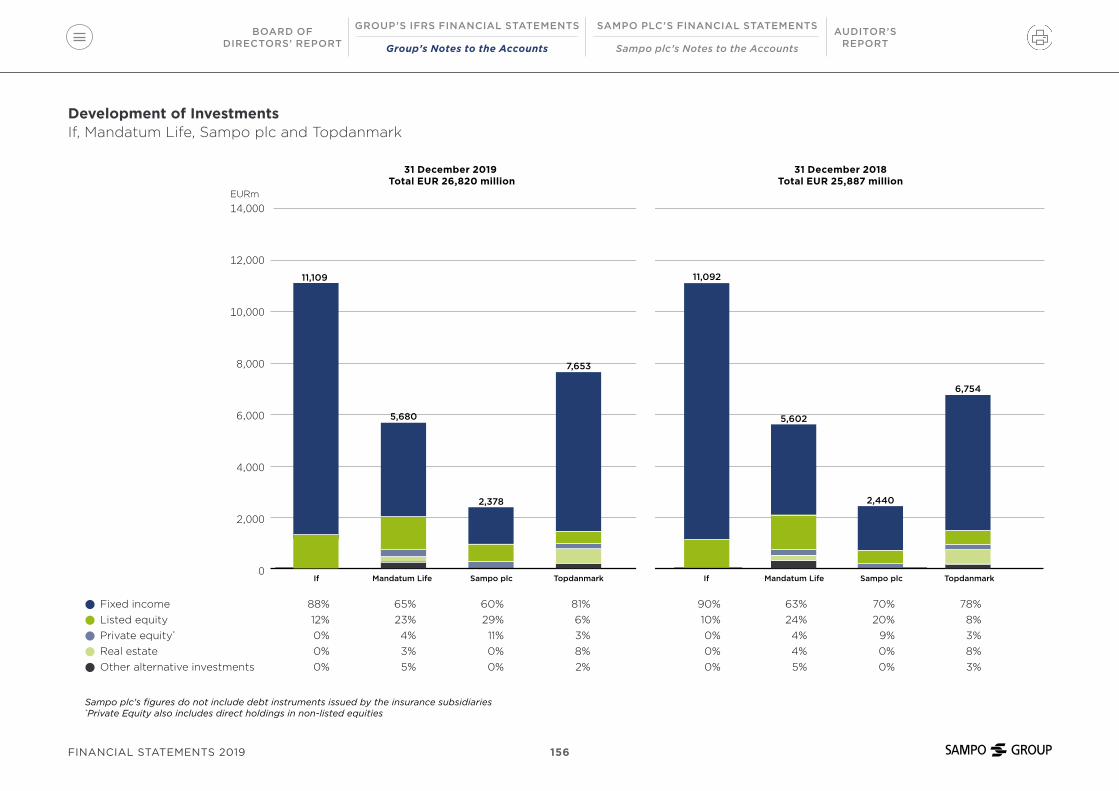
Graph 21
● Fixed income 88% 65% 60% 81% 90% 63% 70% 78%
● Listed equity 12% 23% 29% 6% 10% 24% 20% 8%
● Private equity* 0% 4% 11% 3% 0% 4% 9% 3%
● Real estate 0% 3% 0% 8% 0% 4% 0% 8%
● Other alternative investments 0% 5% 0% 2% 0% 5% 0% 3%
Sampo plc's figures do not include debt instruments issued by the insurance subsidiaries *Private Equity also includes direct holdings in non-listed equities
If Mandatum Life Sampo plc Topdanmark
Development of InvestmentsIf, Mandatum Life, Sampo plc and Topdanmark
EURm
14,000
12,000
10,000
8,000
6,000
4,000
2,000
0
7,653
6,754
2,378 2,440
5,680 5,602
11,109 11,092
If Mandatum Life Sampo plc Topdanmark
31 December 2019 Total EUR 26,820 million
31 December 2018Total EUR 25,887 million
BOARD OFDIRECTORS’ REPORT
AUDITOR’S REPORT
SAMPO PLC’S FINANCIAL STATEMENTS
Sampo plc’s Notes to the Accounts
GROUP’S IFRS FINANCIAL STATEMENTS
Group’s Notes to the Accounts
156FINANCIAL STATEMENTS 2019
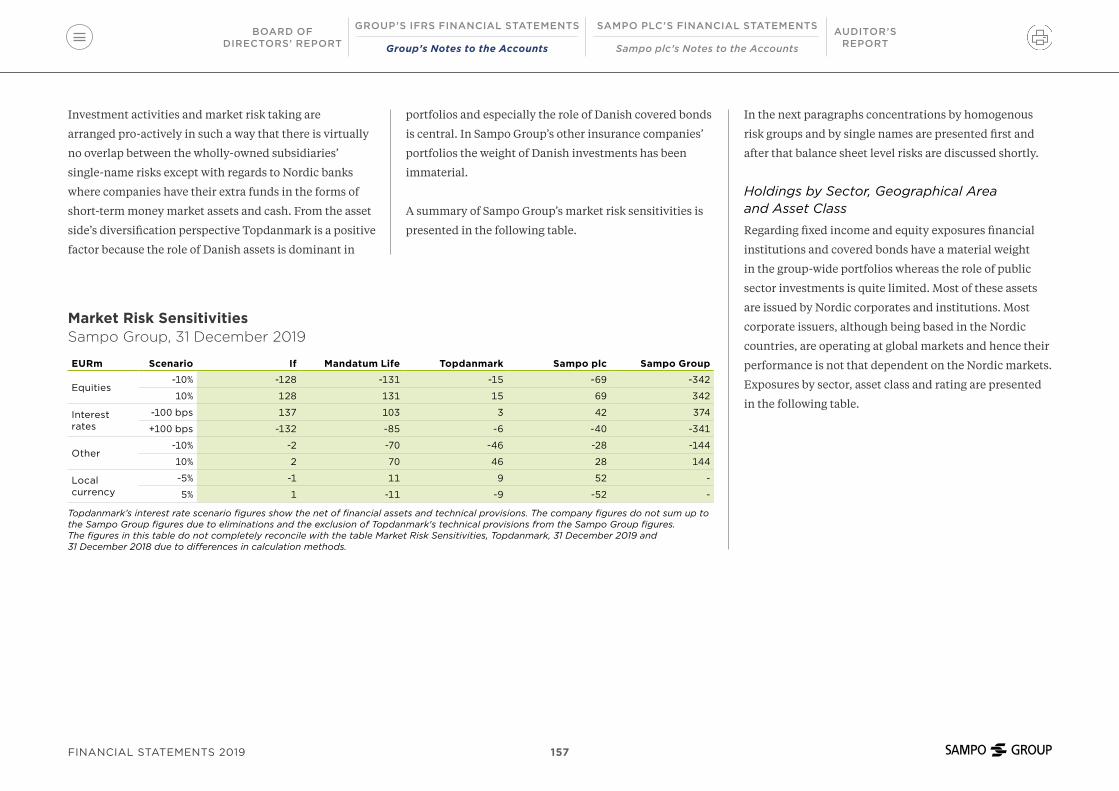
Market Risk SensitivitiesSampo Group, 31 December 2019
EURm Scenario If Mandatum Life Topdanmark Sampo plc Sampo Group
Equities-10% -128 -131 -15 -69 -342
10% 128 131 15 69 342
Interest rates
-100 bps 137 103 3 42 374
+100 bps -132 -85 -6 -40 -341
Other-10% -2 -70 -46 -28 -144
10% 2 70 46 28 144
Local currency
-5% -1 11 9 52 -
5% 1 -11 -9 -52 -
Topdanmark’s interest rate scenario figures show the net of financial assets and technical provisions. The company figures do not sum up to the Sampo Group figures due to eliminations and the exclusion of Topdanmark's technical provisions from the Sampo Group figures. The figures in this table do not completely reconcile with the table Market Risk Sensitivities, Topdanmark, 31 December 2019 and 31 December 2018 due to differences in calculation methods.
Investment activities and market risk taking are
arranged pro-actively in such a way that there is virtually
no overlap between the wholly-owned subsidiaries’
single-name risks except with regards to Nordic banks
where companies have their extra funds in the forms of
short-term money market assets and cash. From the asset
side’s diversification perspective Topdanmark is a positive
factor because the role of Danish assets is dominant in
portfolios and especially the role of Danish covered bonds
is central. In Sampo Group’s other insurance companies’
portfolios the weight of Danish investments has been
immaterial.
A summary of Sampo Group’s market risk sensitivities is
presented in the following table.
In the next paragraphs concentrations by homogenous
risk groups and by single names are presented first and
after that balance sheet level risks are discussed shortly.
Holdings by Sector, Geographical Area and Asset Class
Regarding fixed income and equity exposures financial
institutions and covered bonds have a material weight
in the group-wide portfolios whereas the role of public
sector investments is quite limited. Most of these assets
are issued by Nordic corporates and institutions. Most
corporate issuers, although being based in the Nordic
countries, are operating at global markets and hence their
performance is not that dependent on the Nordic markets.
Exposures by sector, asset class and rating are presented
in the following table.
BOARD OFDIRECTORS’ REPORT
AUDITOR’S REPORT
SAMPO PLC’S FINANCIAL STATEMENTS
Sampo plc’s Notes to the Accounts
GROUP’S IFRS FINANCIAL STATEMENTS
Group’s Notes to the Accounts
157FINANCIAL STATEMENTS 2019

Exposures by Sector, Asset Class and RatingSampo Group, 31 December 2019
EURm AAA
AA+ -
AA-
A+ -
A-
BBB+ -
BBB-
BB+ -
C D Non-rated
Fixed income
totalListed
equities OtherCounter-
party risk Total
Change from 31
Dec 2018Basic industry 0 0 20 97 80 0 73 270 130 0 0 400 96
Capital goods 0 0 64 46 36 0 181 327 606 0 0 933 157
Consumer products 0 0 222 370 94 0 106 791 348 0 0 1,140 -171
Energy 0 1 0 0 34 0 175 210 8 8 0 226 -135
Financial institutions 37 2,279 2,477 1,188 149 0 71 6,201 429 8 8 6,647 69
Governments 9 0 0 0 0 0 0 9 0 0 0 9 -124
Government guaranteed 9 27 0 0 0 0 0 36 0 0 0 36 0
Health care 7 0 15 50 90 0 69 232 174 18 0 423 17
Insurance 0 0 59 133 26 0 59 277 3 25 0 305 15
Media 0 0 0 0 6 0 16 22 9 0 0 30 -18
Packaging 0 0 0 0 9 0 39 48 12 0 0 60 28
Public sector, other 514 68 25 0 0 0 0 606 0 0 0 606 -183
Real estate 0 5 88 355 60 0 689 1,198 0 181 0 1,378 260
Services 0 0 4 88 226 0 93 411 362 0 0 773 90
Technology and electronics 1 0 25 18 57 0 115 217 188 10 0 415 106
Telecommunications 0 0 30 176 120 0 0 326 75 0 0 401 -44
Transportation 0 58 27 43 0 0 231 359 30 0 0 390 84
Utilities 0 0 62 152 229 0 29 472 0 0 0 472 -10
Others 0 26 0 0 16 0 29 71 0 34 0 105 7
Asset-backed securities 0 0 0 0 0 0 0 0 0 0 0 0 0
Covered bonds 2,548 70 11 0 0 0 0 2,630 0 0 0 2,630 -187
Funds 0 0 0 0 0 0 187 187 906 693 0 1,786 -24
Clearing house 0 0 0 0 0 0 0 0 0 0 16 16 -34
Total excluding Topdanmark 3,125 2,534 3,131 2,716 1,232 0 2,161 14,900 3,281 977 25 19,182 -1Change from 31 Dec 2018 -404 -398 -185 91 364 0 257 -275 344 -29 -42 -1
Topdanmark TotalGroup excluding life insurance 1,670 0 142 0 0 0 150 1,963 124 108 127 2,321
Life insurance 3,221 0 239 11 9 0 381 3,862 359 870 241 5,332
Total Topdanmark 4,892 0 382 11 9 0 531 5,825 483 978 367 7,653
BOARD OFDIRECTORS’ REPORT
AUDITOR’S REPORT
SAMPO PLC’S FINANCIAL STATEMENTS
Sampo plc’s Notes to the Accounts
GROUP’S IFRS FINANCIAL STATEMENTS
Group’s Notes to the Accounts
158FINANCIAL STATEMENTS 2019
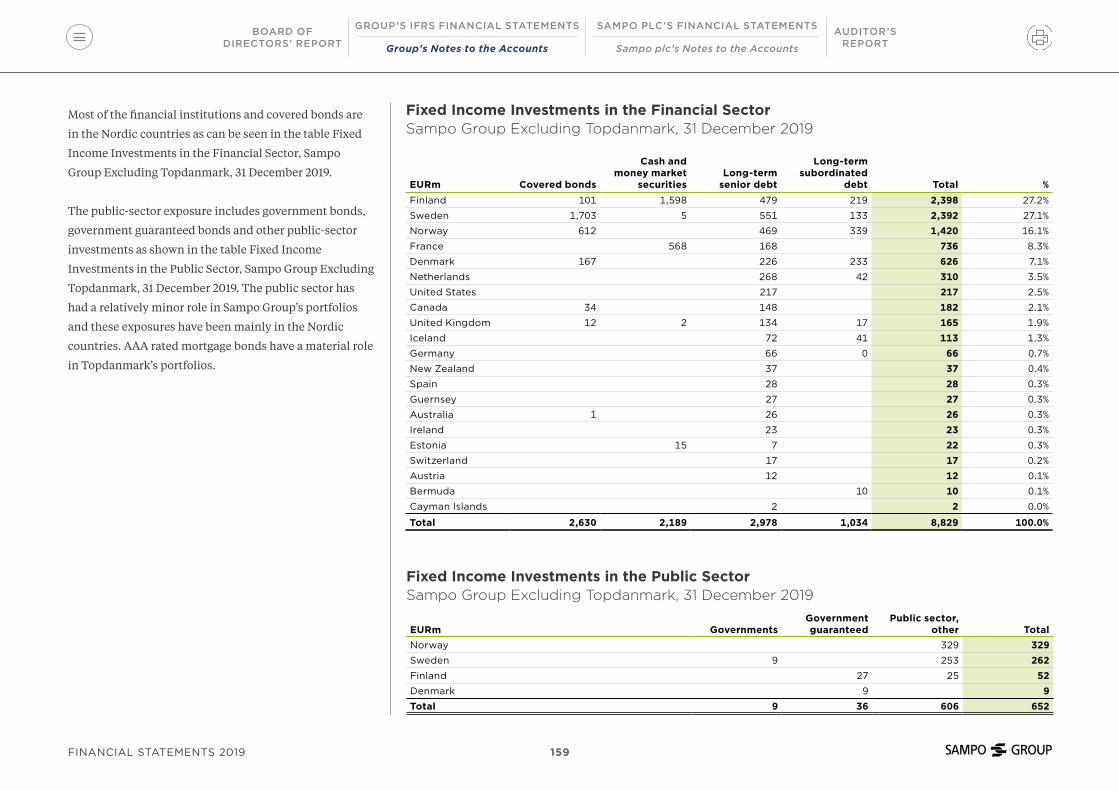
Most of the financial institutions and covered bonds are
in the Nordic countries as can be seen in the table Fixed
Income Investments in the Financial Sector, Sampo
Group Excluding Topdanmark, 31 December 2019.
The public-sector exposure includes government bonds,
government guaranteed bonds and other public-sector
investments as shown in the table Fixed Income
Investments in the Public Sector, Sampo Group Excluding
Topdanmark, 31 December 2019. The public sector has
had a relatively minor role in Sampo Group’s portfolios
and these exposures have been mainly in the Nordic
countries. AAA rated mortgage bonds have a material role
in Topdanmark’s portfolios.
Fixed Income Investments in the Financial SectorSampo Group Excluding Topdanmark, 31 December 2019
EURm Covered bonds
Cash and money market
securitiesLong-term
senior debt
Long-term subordinated
debt Total %Finland 101 1,598 479 219 2,398 27.2%
Sweden 1,703 5 551 133 2,392 27.1%
Norway 612 469 339 1,420 16.1%
France 568 168 736 8.3%
Denmark 167 226 233 626 7.1%
Netherlands 268 42 310 3.5%
United States 217 217 2.5%
Canada 34 148 182 2.1%
United Kingdom 12 2 134 17 165 1.9%
Iceland 72 41 113 1.3%
Germany 66 0 66 0.7%
New Zealand 37 37 0.4%
Spain 28 28 0.3%
Guernsey 27 27 0.3%
Australia 1 26 26 0.3%
Ireland 23 23 0.3%
Estonia 15 7 22 0.3%
Switzerland 17 17 0.2%
Austria 12 12 0.1%
Bermuda 10 10 0.1%
Cayman Islands 2 2 0.0%
Total 2,630 2,189 2,978 1,034 8,829 100.0%
Fixed Income Investments in the Public SectorSampo Group Excluding Topdanmark, 31 December 2019
EURm GovernmentsGovernment guaranteed
Public sector, other Total
Norway 329 329Sweden 9 253 262Finland 27 25 52Denmark 9 9Total 9 36 606 652
BOARD OFDIRECTORS’ REPORT
AUDITOR’S REPORT
SAMPO PLC’S FINANCIAL STATEMENTS
Sampo plc’s Notes to the Accounts
GROUP’S IFRS FINANCIAL STATEMENTS
Group’s Notes to the Accounts
159FINANCIAL STATEMENTS 2019

Nordic companies. However, these Nordic companies
are mainly competing in global markets, only a few are
operationally purely domestic companies. Hence, the
ultimate risk is not highly dependent on the Nordic
economies. A breakdown of the listed equity exposures of
Sampo Group is shown in the graph Breakdown of Listed
Equity Investments by Geographical Regions, Sampo
Group Excluding Topdanmark, 31 December 2019 and
31 December 2018.
EUR 484 million at the end of year 2019 (534). Within
Topdanmark Group, the allocation to listed equity is
higher in the life company.
The geographical core of Sampo Group’s equity
investments is in the Nordic companies. The proportion
of Nordic companies’ equities corresponds to 59 per
cent of the total equity portfolio. This is in line with
Sampo Group’s investment strategy of focusing on
The listed equity investments of Sampo Group totaled
EUR 3,281 million at the end of year 2019 (2,937). At the
end of year 2019, the listed equity exposure of If was EUR
1,281 million (1,113). The proportion of listed equities in
If’s investment portfolio was 12 per cent. In Mandatum
Life, the listed equity exposure was EUR 1,308 million at
the end of year 2019 (1,334) and the proportion of listed
equities was 23 per cent of the investment portfolio.
In Topdanmark Group, the listed equity exposure was
Graph 22
Breakdown of Listed Equity Investments by Geographical RegionsSampo Group Excluding Topdanmark
● Denmark 284
● Norway 231
● Sweden 932
● Finland 484
● Western Europe 582
● Eastern Europe 24
● North America 334
● Latin America 48
● Far East 362
● Denmark 264
● Norway 147
● Sweden 761
● Finland 537
● Western Europe 643
● Eastern Europe 24
● North America 265
● Latin America 26
● Far East 271
31 December 2019total EUR 3,281 million
28%26%
1%1%
1%
1%
9% 9%11% 9%
10%9%7% 5%
18%22%
15% 18%
31 December 2018total EUR 2,937 million
BOARD OFDIRECTORS’ REPORT
AUDITOR’S REPORT
SAMPO PLC’S FINANCIAL STATEMENTS
Sampo plc’s Notes to the Accounts
GROUP’S IFRS FINANCIAL STATEMENTS
Group’s Notes to the Accounts
160FINANCIAL STATEMENTS 2019

Largest Exposures by Issuer and Asset ClassSampo Group Excluding Topdanmark, 31 December 2019
Issuer, EURm Total
% of total investment
assets
Cash & short-term fixed
income
Long-term fixed
income, total
Long-term fixed
income: Government guaranteed
Long-term fixed
income: Covered
bonds
Long-term fixed
income: Senior bonds
Long-term fixed
income: Tier 1 and
Tier 2 Equities
Uncolla-teralized
part of derivatives
Nordea Bank 1,268 7% 425 839 0 459 189 191 0 4
Skandinaviska Enskilda Banken 873 5% 676 196 0 177 6 13 0 0
Danske Bank 770 4% 503 265 0 155 59 51 0 3
BNP Paribas 627 3% 568 59 0 0 59 0 0 0
Svenska Handelsbanken 543 3% 0 543 0 485 18 40 0 0
DnB 514 3% 0 514 0 194 196 125 0 0
Norway 474 3% 0 474 0 0 372 102 0 0
Swedbank 427 2% 0 427 0 277 119 31 0 0
Saxo Bank 301 2% 0 17 0 0 0 17 284 0
Landshypotek 254 1% 0 254 0 200 34 20 0 0
Total top 10 exposures 6,051 32% 2,172 3,588 0 1,948 1,049 590 284 7
Other 12,847 68%
Total investment assets 18,898 100%
Largest Holdings by Single NameThe largest exposures by individual issuers and counter-
parties are presented in the table Largest Exposures
by Issuer and Asset Class, Sampo Group Exluding
Topdanmark, 31 December 2019. The largest single name
investments in Topdanmark’s portfolios are in AAA rated
Danish covered bonds.
BOARD OFDIRECTORS’ REPORT
AUDITOR’S REPORT
SAMPO PLC’S FINANCIAL STATEMENTS
Sampo plc’s Notes to the Accounts
GROUP’S IFRS FINANCIAL STATEMENTS
Group’s Notes to the Accounts
161FINANCIAL STATEMENTS 2019

The largest high-yield and non-rated fixed income
investment single-name exposures are presented in
the table Ten Largest Direct High Yield and Non-rated
Fixed Income Investments, Sampo Group Excluding
Topdanmark, 31 December 2019. Furthermore, the largest
direct listed equity exposures are presented in the table
Ten Largest Direct Listed Equity Investments, Sampo
Group Excluding Topdanmark, 31 December 2019.
The exposures in fixed income instruments issued by
non-investment grade issuers are significant, because a
relatively small number of Nordic companies are rated.
Further, many of the rated companies have a rating lower
than investment grade rating (high yield).
Ten Largest Direct High Yield and Non-rated Fixed Income Investments and Direct Listed Equity InvestmentsSampo Group Excluding Topdanmark, 31 December 2019
Ten largest direct high yield and non-rated fixed income investments Rating
Total, EURm
% of total direct fixed income investments
High Street Shopping NR 154 1.1%
TDC B+ 99 0.7%
Teollisuuden Voima BB+ 98 0.7%
Sponda NR 95 0.7%
Evergood 4 ApS B+ 80 0.6%
Trevian Finland Properties I NR 77 0.5%
Saab NR 57 0.4%
Pohjolan Voima NR 52 0.4%
Veningen NR 51 0.4%
Intrum BB 50 0.3%
Total top 10 exposures 812 5.6%
Other direct fixed income investments 13,622 94.4%
Total direct fixed income investments 14,435 100.0%
Ten largest direct listed equity investmentsTotal, EURm
% of total direct equity investments
Saxo Bank 284 11.9%
Intrum 184 7.7%
Volvo 134 5.6%
Nobia 122 5.1%
Norwegian Finans Holding 114 4.8%
Asiakastieto 92 3.9%
ABB 86 3.6%
Sectra 80 3.3%
Veidekke 67 2.8%
Telia Company 60 2.5%
Total top 10 exposures 1,222 51.4%
Other direct equity investments 1,156 48.6%
Total direct equity investments 2,378 100.0%
BOARD OFDIRECTORS’ REPORT
AUDITOR’S REPORT
SAMPO PLC’S FINANCIAL STATEMENTS
Sampo plc’s Notes to the Accounts
GROUP’S IFRS FINANCIAL STATEMENTS
Group’s Notes to the Accounts
162FINANCIAL STATEMENTS 2019
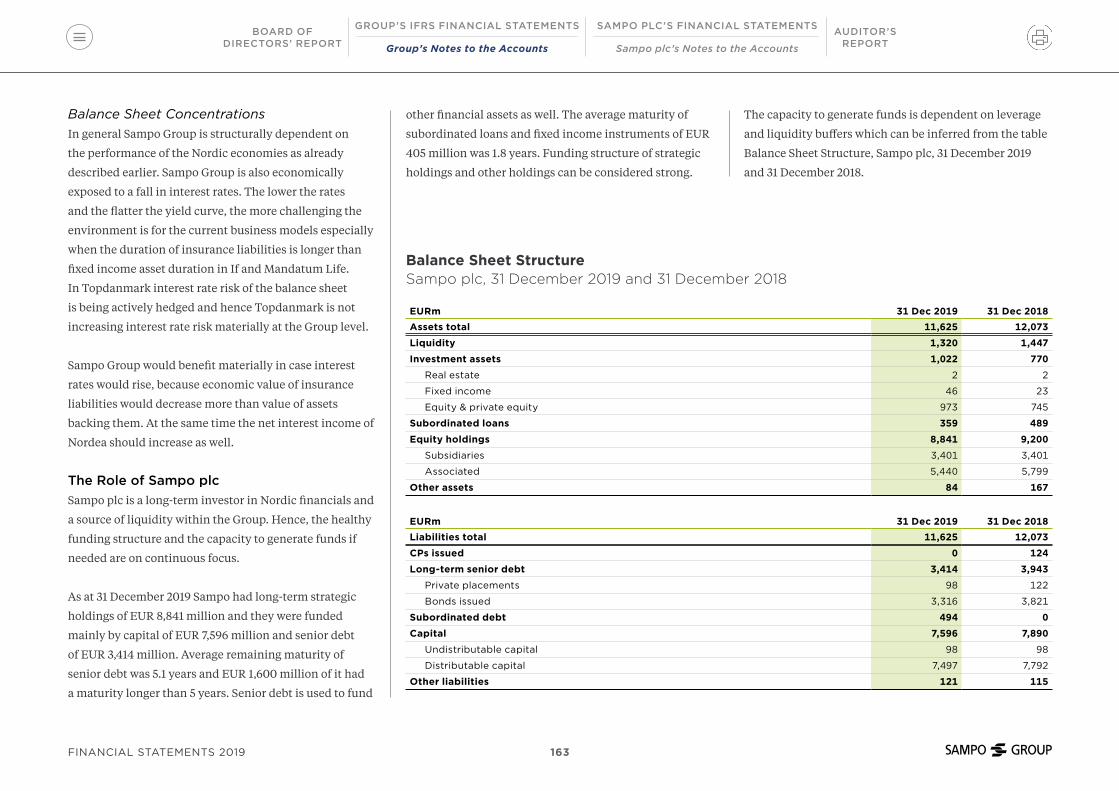
Balance Sheet ConcentrationsIn general Sampo Group is structurally dependent on
the performance of the Nordic economies as already
described earlier. Sampo Group is also economically
exposed to a fall in interest rates. The lower the rates
and the flatter the yield curve, the more challenging the
environment is for the current business models especially
when the duration of insurance liabilities is longer than
fixed income asset duration in If and Mandatum Life.
In Topdanmark interest rate risk of the balance sheet
is being actively hedged and hence Topdanmark is not
increasing interest rate risk materially at the Group level.
Sampo Group would benefit materially in case interest
rates would rise, because economic value of insurance
liabilities would decrease more than value of assets
backing them. At the same time the net interest income of
Nordea should increase as well.
The Role of Sampo plcSampo plc is a long-term investor in Nordic financials and
a source of liquidity within the Group. Hence, the healthy
funding structure and the capacity to generate funds if
needed are on continuous focus.
As at 31 December 2019 Sampo had long-term strategic
holdings of EUR 8,841 million and they were funded
mainly by capital of EUR 7,596 million and senior debt
of EUR 3,414 million. Average remaining maturity of
senior debt was 5.1 years and EUR 1,600 million of it had
a maturity longer than 5 years. Senior debt is used to fund
other financial assets as well. The average maturity of
subordinated loans and fixed income instruments of EUR
405 million was 1.8 years. Funding structure of strategic
holdings and other holdings can be considered strong.
The capacity to generate funds is dependent on leverage
and liquidity buffers which can be inferred from the table
Balance Sheet Structure, Sampo plc, 31 December 2019
and 31 December 2018.
Balance Sheet StructureSampo plc, 31 December 2019 and 31 December 2018
EURm 31 Dec 2019 31 Dec 2018Assets total 11,625 12,073
Liquidity 1,320 1,447
Investment assets 1,022 770
Real estate 2 2
Fixed income 46 23
Equity & private equity 973 745
Subordinated loans 359 489
Equity holdings 8,841 9,200
Subsidiaries 3,401 3,401
Associated 5,440 5,799
Other assets 84 167
EURm 31 Dec 2019 31 Dec 2018Liabilities total 11,625 12,073
CPs issued 0 124
Long-term senior debt 3,414 3,943
Private placements 98 122
Bonds issued 3,316 3,821
Subordinated debt 494 0
Capital 7,596 7,890
Undistributable capital 98 98
Distributable capital 7,497 7,792
Other liabilities 121 115
BOARD OFDIRECTORS’ REPORT
AUDITOR’S REPORT
SAMPO PLC’S FINANCIAL STATEMENTS
Sampo plc’s Notes to the Accounts
GROUP’S IFRS FINANCIAL STATEMENTS
Group’s Notes to the Accounts
163FINANCIAL STATEMENTS 2019

The leverage of Sampo plc was modest at year end
according to for example these measures:
• The financial leverage measured as the portion of debt
within all liabilities was 34 (34) per cent.
• Sampo’s net debt of EUR 2,183 (2,108) million is modest
when compared to Sampo’s equity holdings and
financial assets.
In regard to liquidity, the liquid funds of Sampo plc were
EUR 1,320 (1,447) million. Liquidity is mainly affected
by received and paid dividends as well as changes in
issued debt instruments and changes in investments.
Sampo’s dividend payment takes place in April and it
will significantly lower the liquidity position of Sampo.
A significant portion of subordinated loans issued by the
Group companies (359) and a part of other investment
assets (1,022) can be sold in case liquidity is needed.
Short-term liquidity can be considered to be adequate.
All in all, Sampo plc is in a good position to refinance
its current debt and even issue more debt. This capacity
together with the tradable financial assets, means that
Sampo plc is able to generate liquid funds.
Currently Sampo Group has a capital buffer in excess of
the Solvency Capital Requirement. The subordinated
loans presented in the table Balance Sheet Structure,
Sampo plc, 31 December 2019 and 31 December 2018 are
all issued by If, Mandatum Life, Nordea and Topdanmark.
Apart from Nordea, they are eliminated from Group’s own
funds. In case these assets would be sold, in addition to
liquidity in Sampo plc, also own funds and Sampo Group
solvency ratio would increase.
Sampo plc balances risks within Sampo Group. When
Sampo plc is managing its funding, capital structure and
liquidity it takes into account that some of its operative
companies have other base currencies (the Swedish krona,
the Danish krone) than the euro and that all its operative
business areas are exposed to low interest rates. These
risks may affect Sampo’s decisions on the issuance of
debt instruments and the composition of the liquidity
portfolio.
This is why part of Sampo plc’s debt instruments are
issued in the Swedish krona and interest rate duration
is maintained relatively short. However, management’s
market views are also affecting these decisions and for
instance at the moment the Swedish krona denominated
dividends paid by If are still in the Swedish krona, and
the Swedish krona debt is converted into the euro using
cross-currency swaps, due to tactical market view reasons.
Sampo Group Capitalization
Capitalization at the Group LevelThe sub-group level balance of profits, risks and capital is
the primary focus of Sampo Group. When all subsidiaries
are well capitalized, as a result the Group should be
adequately capitalized as well although for example the
subordinated loans, which are eliminated from own
funds, decrease the solvency. In addition, changes in
the solvency capital requirements of the subsidiaries
and Nordea’s market value have an effect on the level of
capitalization in Sampo Group.
However, at Sampo Group level there are more factors
affecting capitalization than at the sub-group level.
These factors are illustrated in the graph Sampo Group’s
Capitalization Framework.
BOARD OFDIRECTORS’ REPORT
AUDITOR’S REPORT
SAMPO PLC’S FINANCIAL STATEMENTS
Sampo plc’s Notes to the Accounts
GROUP’S IFRS FINANCIAL STATEMENTS
Group’s Notes to the Accounts
164FINANCIAL STATEMENTS 2019

Capital requirements
Group’s own funds
Sampo plc
Mandatum Life
If
Topdanmark
NDX and other related undertakings
Group level buffer
Factors affecting the size of group level buffer:• Profit diversification• Sampo plc’s liquidity capacity• Issuance capacity • Shareholders’ dividend
expectations• Business risks & arrangements• Balance sheet volatility
Other items
Consolidated Group equity / Excess of
assets over liabilities
Sampo Group’s Capitalization Framework
The Group’s capital requirement is dependent mainly
on the capital requirements of the business areas.
The market risk stemming from Nordea holding is a
significant part of Sampo plc’s capital requirement, but
apart from that the parent company’s contribution to the
Group capital need is minor most of the time, because
Sampo plc does not have any business activities of its own
other than the management of its capital structure and
liquidity portfolio. In addition, investments in the Nordic
financial service companies increase Sampo plc’s capital
requirement.
Diversification benefit exists at two levels, within the
companies and between the companies. The former is
included in the companies’ SCRs.
Conceptually, the Group’s own funds is the difference
between the market value of assets and liabilities plus
the subordinated liabilities. This difference has accrued
during the lifetime of the Group and it includes the
following main components:
• Accrued profits that have not been paid as dividends
over the years.
• Market value adjustment to the book values of assets
and liabilities.
• Issued capital and subordinated liabilities meeting
Solvency II requirements.
At the Group level, the capital requirement and own
funds are both exposed to foreign currency translation
risk. Translation risk may realize when the actual
capital and the capital needs of If and Topdanmark are
converted from their reporting currencies to the euro.
When the reporting currencies of If and Topdanmark
depreciate, the actual amount of the Group’s capital in
the euros decreases and the capital requirements of If and
Topdanmark will be lower in the euro terms. Translation
BOARD OFDIRECTORS’ REPORT
AUDITOR’S REPORT
SAMPO PLC’S FINANCIAL STATEMENTS
Sampo plc’s Notes to the Accounts
GROUP’S IFRS FINANCIAL STATEMENTS
Group’s Notes to the Accounts
165FINANCIAL STATEMENTS 2019

currency risk is monitored internally and its effect on
Sampo Group’s solvency on a going concern basis is
analyzed regularly. However, internally no capital need is
set for translation risk, because it is realized only when a
sub-group is divested.
The Group level buffer is the difference between the
amount of the Group’s own funds and the Group capital
requirement. In addition to the sub-group level factors
– expected profits and their volatility, business growth
prospects and ability to issue Solvency II compliant
capital instruments – there are Group level factors that are
also relevant when considering the size of the Group level
buffer. The most material Group level factors affecting
the size of the buffer are correlation of sub-groups’
reported profits, volatility of the balance sheet due to
fluctuations in the market value of the equity portfolio
and the insurance liabilities, parent company’s capacity
to generate liquidity, probability of business risks and
arrangements and shareholders’ dividend expectations.
BOARD OFDIRECTORS’ REPORT
AUDITOR’S REPORT
SAMPO PLC’S FINANCIAL STATEMENTS
Sampo plc’s Notes to the Accounts
GROUP’S IFRS FINANCIAL STATEMENTS
Group’s Notes to the Accounts
166FINANCIAL STATEMENTS 2019

SAMPO PLC'S FINANCIAL STATEMENTS
168Sampo plc’s
Income Statement
170Sampo plc’s
Statement of Cash Flows
169Sampo plc’s
Balance Sheet
BOARD OFDIRECTORS’ REPORT
AUDITOR’S REPORTSampo plc’s Notes to the Accounts
GROUP’S IFRS FINANCIAL STATEMENTS
Group’s Notes to the Accounts
SAMPO PLC’S FINANCIAL STATEMENTS
167FINANCIAL STATEMENTS 2019

EURm Note 2019 2018Other operating income 1 16 17
Staff expenses
Salaries and remunerations -13 -9
Social security costs
Pension costs -2 -2
Other 0 0
Other operating expenses 2 -57 -14
Operating profit -56 -8
Financial income and expense 4
Income from shares in Group companies 936 1,084
Income from other shares 602 588
Other interest and financial income
Group companies 12 12
Other 17 27
Other investment income and expense 11 -36
Other interest income 27 25
Interest and other financial expense -79 -63
Exchange result 22 41
Proft before taxes 1,491 1,669
Income taxes -1 0
Profit for the financial year 1,490 1,669
Sampo plc’s Financial StatementsIncome Statement
BOARD OFDIRECTORS’ REPORT
AUDITOR’S REPORTSampo plc’s Notes to the Accounts
GROUP’S IFRS FINANCIAL STATEMENTS
Group’s Notes to the Accounts
SAMPO PLC’S FINANCIAL STATEMENTS
168FINANCIAL STATEMENTS 2019
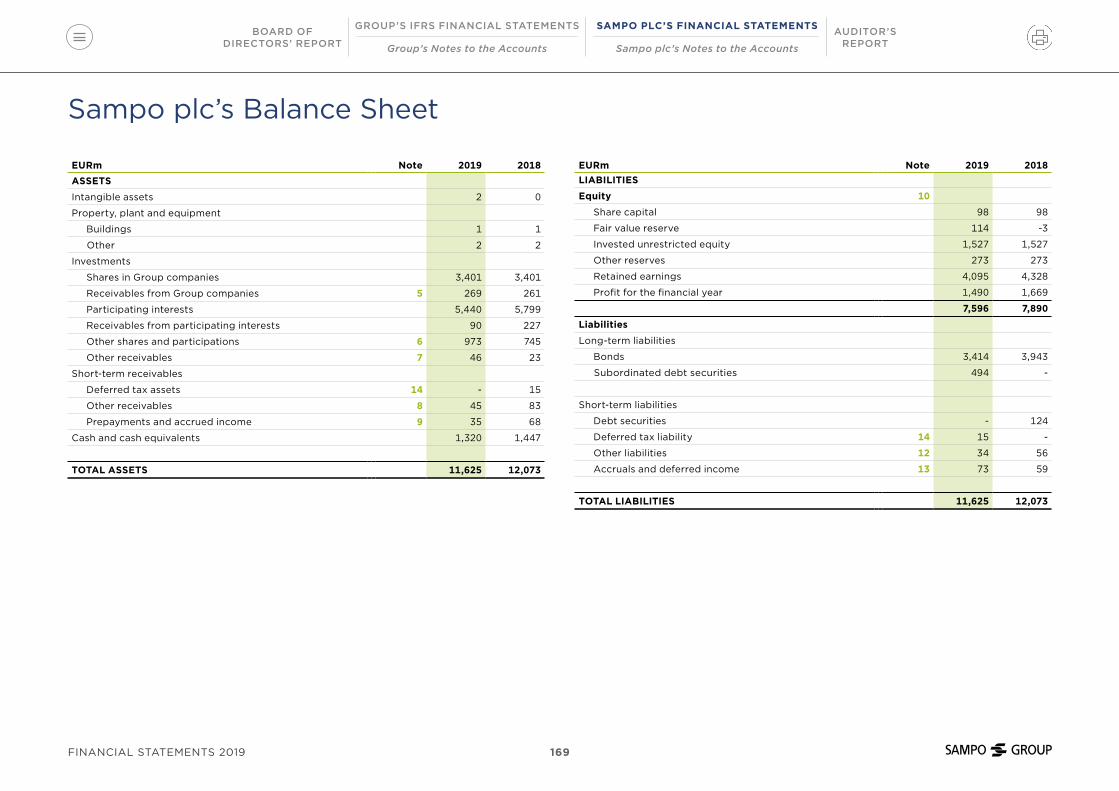
EURm Note 2019 2018ASSETS
Intangible assets 2 0
Property, plant and equipment
Buildings 1 1
Other 2 2
Investments
Shares in Group companies 3,401 3,401
Receivables from Group companies 5 269 261
Participating interests 5,440 5,799
Receivables from participating interests 90 227
Other shares and participations 6 973 745
Other receivables 7 46 23
Short-term receivables
Deferred tax assets 14 - 15
Other receivables 8 45 83
Prepayments and accrued income 9 35 68
Cash and cash equivalents 1,320 1,447
TOTAL ASSETS 11,625 12,073
EURm Note 2019 2018LIABILITIES
Equity 10
Share capital 98 98
Fair value reserve 114 -3
Invested unrestricted equity 1,527 1,527
Other reserves 273 273
Retained earnings 4,095 4,328
Profit for the financial year 1,490 1,669
7,596 7,890
Liabilities
Long-term liabilities
Bonds 3,414 3,943
Subordinated debt securities 494 -
Short-term liabilities
Debt securities - 124
Deferred tax liability 14 15 -
Other liabilities 12 34 56
Accruals and deferred income 13 73 59
TOTAL LIABILITIES 11,625 12,073
Sampo plc’s Balance Sheet
BOARD OFDIRECTORS’ REPORT
AUDITOR’S REPORTSampo plc’s Notes to the Accounts
GROUP’S IFRS FINANCIAL STATEMENTS
Group’s Notes to the Accounts
SAMPO PLC’S FINANCIAL STATEMENTS
169FINANCIAL STATEMENTS 2019

EURm 2019 2018Operating activities
Profit before taxes 1,491 1,669
Adjustments:
Realised gains and losses on investments -1 -11
Other adjustments -565 -639
Adjustments total -565 -649
Change (+/-) in assets of operating activities
Investments *) 55 -609
Other assets 49 -74
Total 104 -683
Change (+/-) in liabilities of operating activities
Financial liabilities 1 27
Other liabilities -21 28
Paid interests 4 -2
Paid taxes 5 13
Total -11 65
Net cash from operating activities 1,018 401
EURm 2019 2018Investing activities
Investments in group and associated undertakings 594 417
Financing activities
Dividends paid -1,588 -1,444
Issue of debt securities 496 1,482
Repayments of debt securities in issue -647 -609
Net cash used in financing activities -1,739 -571
Total cash flows -127 248
Cash and cash equivalents at 1 January 1,447 1,199
Cash and cash equivalents at 31 December 1,320 1,447
Net change in cash and cash equivalents -127 248
*) Investments include both investment property and financial assets.
Additional information to the statement of cash flows:
EURm 2019 2018Interest income received 65 42
Interest expense paid -74 -50
Dividend income received 1,538 1,671
Sampo plc’s Statement of Cash Flows
BOARD OFDIRECTORS’ REPORT
AUDITOR’S REPORTSampo plc’s Notes to the Accounts
GROUP’S IFRS FINANCIAL STATEMENTS
Group’s Notes to the Accounts
SAMPO PLC’S FINANCIAL STATEMENTS
170FINANCIAL STATEMENTS 2019
SAMPO PLC’S NOTES TO THE ACCOUNTS
Summary of Significant Account Policies ................................................................. 172
Notes to the Income Statement 1–41 Other operating income ...................................................... 1722 Other operating expenses .................................................. 1723 Auditors’ fees .......................................................................... 1724 Financial income and expense .......................................... 172
Notes to the Assets 5–95 Receivables from Group companies ............................... 1736 Other shares and participations ....................................... 1737 Other investment receivables ........................................... 1738 Other receivables ................................................................... 1739 Prepayments and accrued income ................................. 173
Notes to the Liabilities 10–1310 Movements in the parent company's equity .............. 17411 Share capital ............................................................................ 17512 Other liabilities ........................................................................ 17513 Accruals and deferred income .......................................... 175
Note to the Income Taxes 1414 Deferred tax assets and liabilities .................................... 175
Notes to the Liabilities and Commitments 15–1615 Pension liabilities .................................................................... 17616 Future rental commitments ............................................... 176
Notes to the Staff and Management 17–1917 Staff numbers .......................................................................... 17618 Board fees and management remuneration................ 17619 Pension contributions to the CEO, deputy CEO and the members of the Board .............. 177
Note to the Shares Held 2020 Shares held as of 31 Dec 2019 .......................................... 177
BOARD OFDIRECTORS’ REPORT
AUDITOR’S REPORT
SAMPO PLC’S FINANCIAL STATEMENTSGROUP’S IFRS FINANCIAL STATEMENTS
Group’s Notes to the Accounts Sampo plc’s Notes to the Accounts
171FINANCIAL STATEMENTS 2019
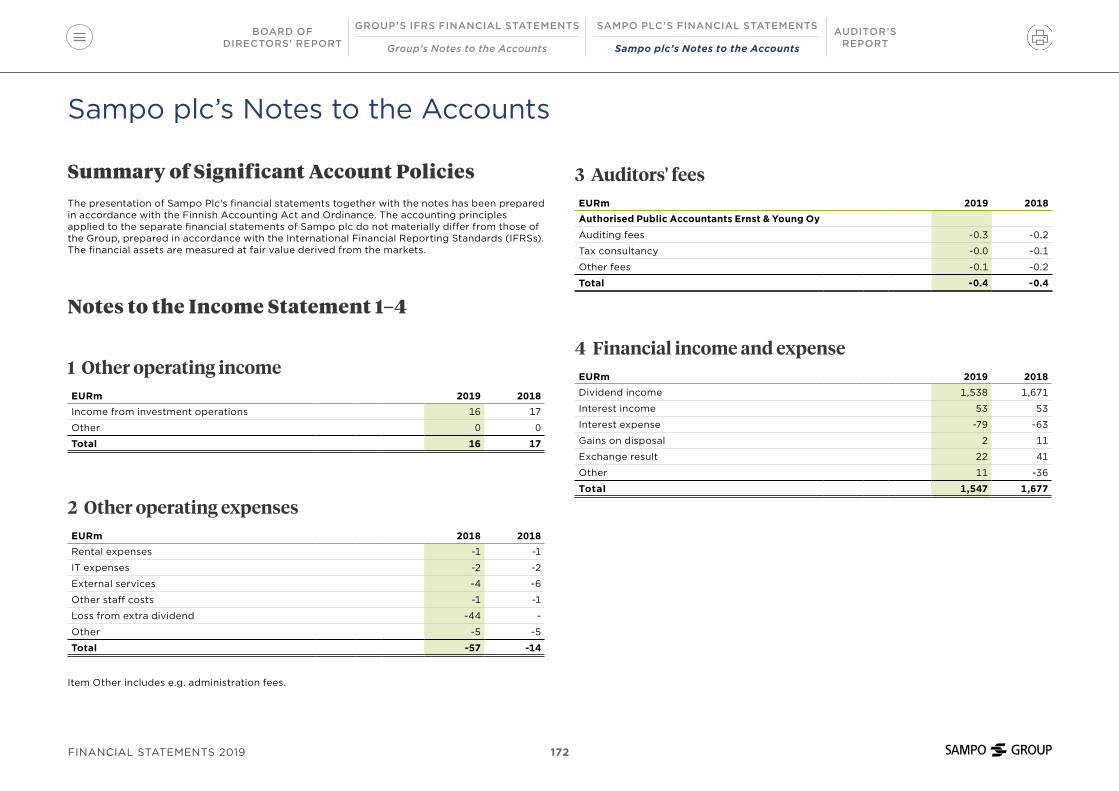
Summary of Significant Account PoliciesThe presentation of Sampo Plc's financial statements together with the notes has been prepared in accordance with the Finnish Accounting Act and Ordinance. The accounting principles applied to the separate financial statements of Sampo plc do not materially differ from those of the Group, prepared in accordance with the International Financial Reporting Standards (IFRSs). The financial assets are measured at fair value derived from the markets.
Notes to the Income Statement 1–4
1 Other operating incomeEURm 2019 2018Income from investment operations 16 17
Other 0 0
Total 16 17
2 Other operating expensesEURm 2018 2018Rental expenses -1 -1
IT expenses -2 -2
External services -4 -6
Other staff costs -1 -1
Loss from extra dividend -44 -
Other -5 -5
Total -57 -14
Item Other includes e.g. administration fees.
3 Auditors' feesEURm 2019 2018Authorised Public Accountants Ernst & Young Oy
Auditing fees -0.3 -0.2
Tax consultancy -0.0 -0.1
Other fees -0.1 -0.2
Total -0.4 -0.4
4 Financial income and expenseEURm 2019 2018Dividend income 1,538 1,671
Interest income 53 53
Interest expense -79 -63
Gains on disposal 2 11
Exchange result 22 41
Other 11 -36
Total 1,547 1,677
Sampo plc’s Notes to the Accounts
BOARD OFDIRECTORS’ REPORT
AUDITOR’S REPORT
SAMPO PLC’S FINANCIAL STATEMENTSGROUP’S IFRS FINANCIAL STATEMENTS
Group’s Notes to the Accounts Sampo plc’s Notes to the Accounts
172FINANCIAL STATEMENTS 2019

Notes to the Assets 5–9
5 Receivables from Group companiesEURm 2019 2018Cost at beginning of year 261 266
Additions 8 0
Disposals 0 -5
Carrying amount at end of year 269 261
Receivables are subordinated loans issued by subsidiaries. More information in the consolidated note 29 Financial liabilities.
6 Other shares and participations2019 Fair value changes 2018 Fair value changes
EURmFair
valueRecognised
in p/l
Recognised in fair value
reserveFair
valueRecognised
in p/l
Recognised in fair value
reserve
Avalaible-for-sale equity securities 973 0 -131 745 10 32
7 Other investment receivables2019 Fair value changes 2018 Fair value changes
EURmFair
valueRecognised
in p/l
Recognised in fair value
reserveFair
valueRecognised
in p/l
Recognised in fair value
reserve
Bonds 46 - -16 23 0 19
8 Other receivablesEURm 2019 2018Trading receivables 1 1
Derivatives 1 1
Other 43 82
Total 45 83
9 Prepayments and accrued incomeEURm 2019 2018Accrued interest 13 24
Derivatives 20 40
Other 3 3
Total 35 68
BOARD OFDIRECTORS’ REPORT
AUDITOR’S REPORT
SAMPO PLC’S FINANCIAL STATEMENTSGROUP’S IFRS FINANCIAL STATEMENTS
Group’s Notes to the Accounts Sampo plc’s Notes to the Accounts
173FINANCIAL STATEMENTS 2019
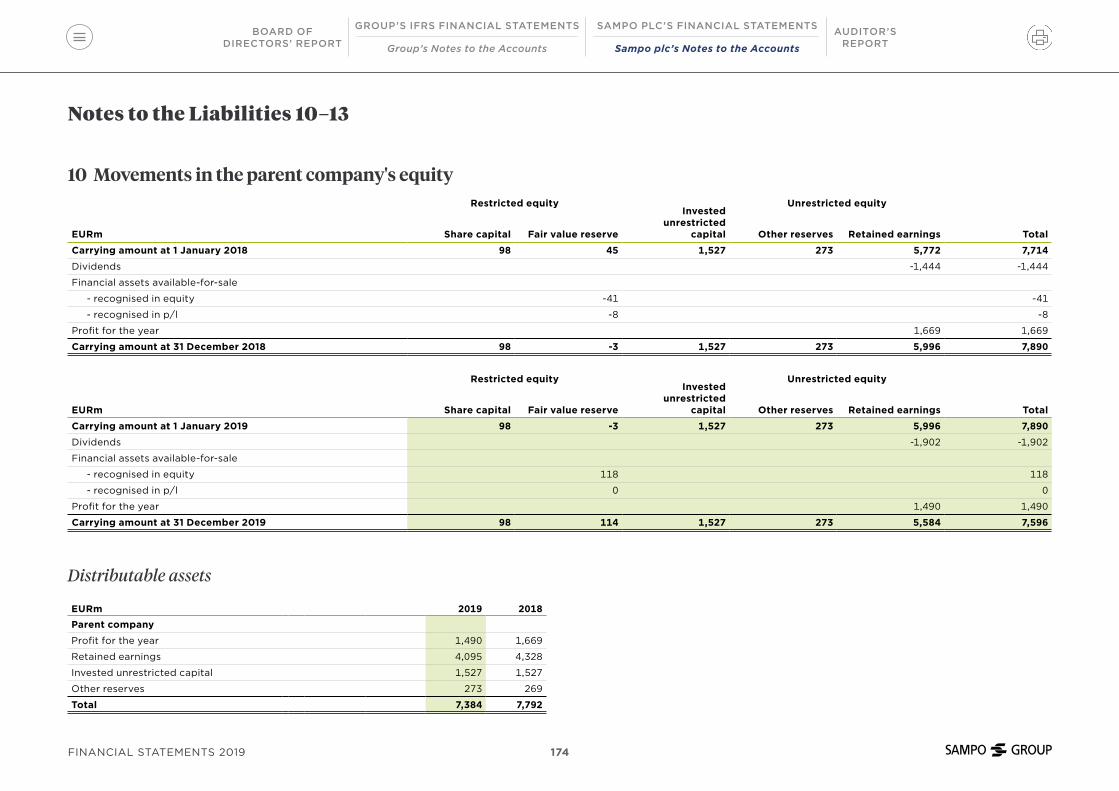
Notes to the Liabilities 10–13
10 Movements in the parent company's equity Restricted equity Unrestricted equity
EURm Share capital Fair value reserve
Invested unrestricted
capital Other reserves Retained earnings Total
Carrying amount at 1 January 2018 98 45 1,527 273 5,772 7,714
Dividends -1,444 -1,444
Financial assets available-for-sale
- recognised in equity -41 -41
- recognised in p/l -8 -8
Profit for the year 1,669 1,669
Carrying amount at 31 December 2018 98 -3 1,527 273 5,996 7,890
Restricted equity Unrestricted equity
EURm Share capital Fair value reserve
Invested unrestricted
capital Other reserves Retained earnings Total
Carrying amount at 1 January 2019 98 -3 1,527 273 5,996 7,890
Dividends -1,902 -1,902
Financial assets available-for-sale
- recognised in equity 118 118
- recognised in p/l 0 0
Profit for the year 1,490 1,490
Carrying amount at 31 December 2019 98 114 1,527 273 5,584 7,596
Distributable assets
EURm 2019 2018Parent company
Profit for the year 1,490 1,669
Retained earnings 4,095 4,328
Invested unrestricted capital 1,527 1,527
Other reserves 273 269
Total 7,384 7,792
BOARD OFDIRECTORS’ REPORT
AUDITOR’S REPORT
SAMPO PLC’S FINANCIAL STATEMENTSGROUP’S IFRS FINANCIAL STATEMENTS
Group’s Notes to the Accounts Sampo plc’s Notes to the Accounts
174FINANCIAL STATEMENTS 2019

11 Share capitalInformation on share capital is disclosed in Note 33 in the consolidated financial statements.
12 Other liabilitiesEURm 2019 2018Derivatives 4 14
Guarantees for derivate contracts 20 41
Other 10 1
Total 34 56
13 Accruals and deferred incomeEURm 2019 2018Deferred interest 31 26
Derivatives 29 22
Other 13 11
Total 73 59
Note to the Income Taxes 14
14 Deferred tax assets and liabilitiesEURm 2019 2018Deferred tax assets
Losses 14 14
Fair value reserve - 1
Deferred tax liabilities
Fair value reserve -28 -
Total, net -15 15
BOARD OFDIRECTORS’ REPORT
AUDITOR’S REPORT
SAMPO PLC’S FINANCIAL STATEMENTSGROUP’S IFRS FINANCIAL STATEMENTS
Group’s Notes to the Accounts Sampo plc’s Notes to the Accounts
175FINANCIAL STATEMENTS 2019

Notes to the Liabilities and Commitments 15–16
15 Pension liabilitiesThe basic and suplementary pension insurance of Sampo plc's staff is handled through insurances in Varma Mutual Insurance Company and in Mandatum Life Insurance Company Limited.
16 Future rental commitments
EURm 2019 2018Not more than one year 1 1
Over one year but not more than five years 4 4
Over five years - 0
Total 5 5
Notes to the Staff and Management 17–19
17 Staff numbers
EURm
2019 Average
during the year
2018 Average
during the year
Full-time staff 63 62
Part-time staff 1 2
Temporary staff 1 1
Total 65 65
18 Board fees and management remunerationEURk 2019 2018Managing Director Kari Stadigh 3,891 4,143
Members of the Board of Directors
Björn Wahlroos 175 175
Fiona Clutterbuck 96 -
Christian Clausen 96 96
Jannica Fagerholm 140 115
Adine Grate Axén - 96
Johanna Lamminen 96 -
Veli-Matti Mattila 90 90
Risto Murto 90 90
Antti Mäkinen 90 96
Eira Palin-Lehtinen - 115
In accordance with the decision of the Annual General Meeting in 2019, the company has compensated the transfer tax related to the acquisition of the company shares, in total EUR 11,220.32 (EUR 1,116.82 pertaining to the Vice Chairman and EUR 10,130.50 pertaining to the other Finnish members of the Board).
Pension liability
The Group CEO is entitled to a defined contribution pension in accordance with the pension contract in force. The annual pension premium is fixed at EUR 400,000.
BOARD OFDIRECTORS’ REPORT
AUDITOR’S REPORT
SAMPO PLC’S FINANCIAL STATEMENTSGROUP’S IFRS FINANCIAL STATEMENTS
Group’s Notes to the Accounts Sampo plc’s Notes to the Accounts
176FINANCIAL STATEMENTS 2019
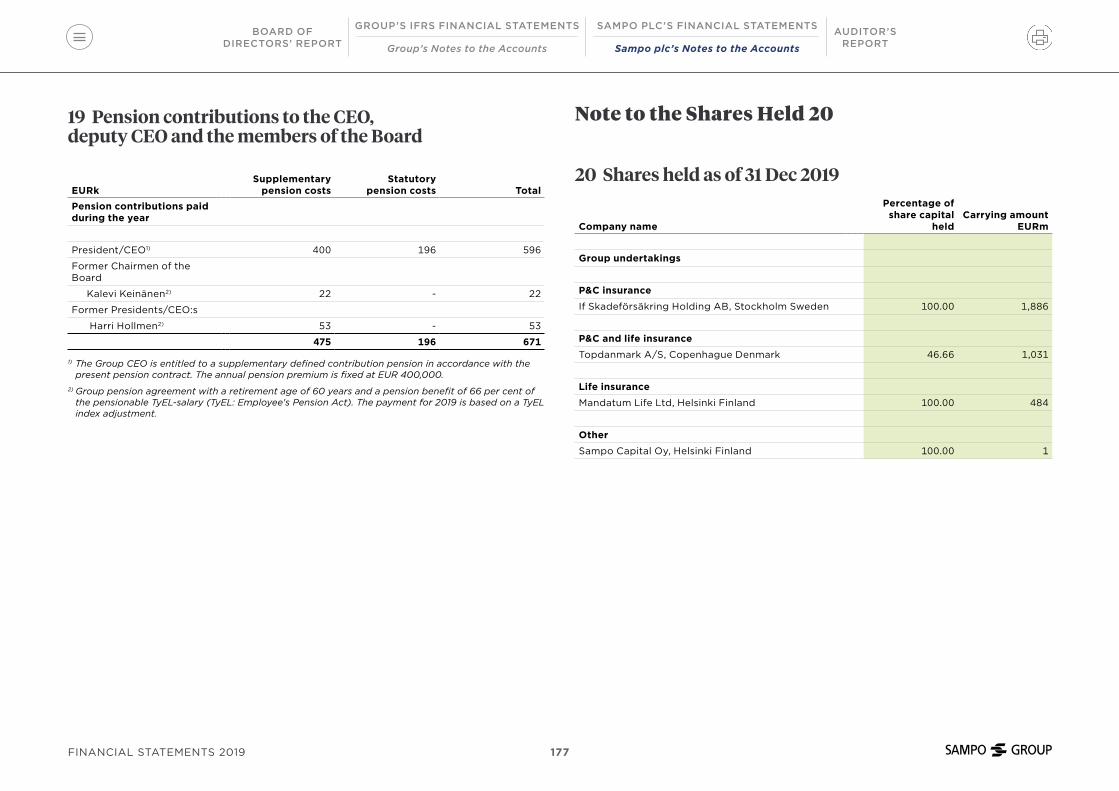
19 Pension contributions to the CEO, deputy CEO and the members of the Board
EURkSupplementary
pension costsStatutory
pension costs TotalPension contributions paid during the year
President/CEO1) 400 196 596
Former Chairmen of the Board
Kalevi Keinänen2) 22 - 22
Former Presidents/CEO:s
Harri Hollmen2) 53 - 53
475 196 671
1) The Group CEO is entitled to a supplementary defined contribution pension in accordance with the present pension contract. The annual pension premium is fixed at EUR 400,000.
2) Group pension agreement with a retirement age of 60 years and a pension benefit of 66 per cent of the pensionable TyEL-salary (TyEL: Employee's Pension Act). The payment for 2019 is based on a TyEL index adjustment.
Note to the Shares Held 20
20 Shares held as of 31 Dec 2019
Company name
Percentage of share capital
heldCarrying amount
EURm
Group undertakings
P&C insurance
If Skadeförsäkring Holding AB, Stockholm Sweden 100.00 1,886
P&C and life insurance
Topdanmark A/S, Copenhague Denmark 46.66 1,031
Life insurance
Mandatum Life Ltd, Helsinki Finland 100.00 484
Other
Sampo Capital Oy, Helsinki Finland 100.00 1
BOARD OFDIRECTORS’ REPORT
AUDITOR’S REPORT
SAMPO PLC’S FINANCIAL STATEMENTSGROUP’S IFRS FINANCIAL STATEMENTS
Group’s Notes to the Accounts Sampo plc’s Notes to the Accounts
177FINANCIAL STATEMENTS 2019

Approval of the Financial Statements and the Board of Directors’ Report
Helsinki, 6 February 2020
Sampo plcBoard of Directors
Christian Clausen Fiona Clutterbuck Jannica Fagerholm
Johanna Lamminen Veli-Matti Mattila Risto Murto
Antti Mäkinen
Björn Wahlroos
Chairman
Torbjörn Magnusson
Group CEO
BOARD OFDIRECTORS’ REPORT
AUDITOR’S REPORT
SAMPO PLC’S FINANCIAL STATEMENTSGROUP’S IFRS FINANCIAL STATEMENTS
Group’s Notes to the Accounts Sampo plc’s Notes to the Accounts
178FINANCIAL STATEMENTS 2019

Auditor’s Report (Translation of the Finnish original) To the Annual General Meeting of Sampo plc
Report on the Audit of Financial Statements
Opinion
We have audited the financial statements of Sampo plc (busi-
ness identity code 0142213-3) for the year ended 31 December
2019. The financial statements comprise the consolidated
balance sheet, income statement, statement of comprehen-
sive income, statement of changes in equity, statement of
cash flows and notes, including a summary of significant
accounting policies, as well as the parent company’s balance
sheet, income statement, statement of cash flows and notes
In our opinion
• the consolidated financial statements give a true and
fair view of the group’s financial position as well as its
financial performance and its cash flows in accordance
with International Financial Reporting Standards (IFRS)
as adopted by the EU.
• the financial statements give a true and fair view of the
parent company’s financial performance and financial
position in accordance with the laws and regulations
governing the preparation of financial statements in
Finland and comply with statutory requirements.
Our opinion is consistent with the additional report
submitted to the Audit Committee.
Basis for Opinion
We conducted our audit in accordance with good auditing
practice in Finland. Our responsibilities under good
auditing practice are further described in the Auditor’s
Responsibilities for the Audit of Financial Statements section
of our report.
We are independent of the parent company and of
the group companies in accordance with the ethical
requirements that are applicable in Finland and are rele-
vant to our audit, and we have fulfilled our other ethical
responsibilities in accordance with these requirements.
In our best knowledge and understanding, the non-audit
services that we have provided to the parent company
and group companies are in compliance with laws
and regulations applicable in Finland regarding these
services, and we have not provided any prohibited
non-audit services referred to in Article 5(1) of
regulation (EU) 537/2014. The non-audit services that
we have provided have been disclosed in note 36 to the
consolidated financial statements and note 3 to the parent
company financial statements.
We believe that the audit evidence we have obtained
is sufficient and appropriate to provide a basis for our
opinion.
Key Audit Matters
Key audit matters are those matters that, in our
professional judgment, were of most significance in our
audit of the financial statements of the current period.
These matters were addressed in the context of our audit
of the financial statements as a whole, and in forming our
opinion thereon, and we do not provide a separate opinion
on these matters.
We have fulfilled the responsibilities described in the
Auditor’s responsibilities for the audit of the financial
statements section of our report, including in relation
to these matters. Accordingly, our audit included the
performance of procedures designed to respond to our
assessment of the risks of material misstatement of the
financial statements. The results of our audit procedures,
including the procedures performed to address the matters
below, provide the basis for our audit opinion on the
accompanying financial statements.
We have also addressed the risk of management override of
internal controls. This includes consideration of whether
there was evidence of management bias that represented a
risk of material misstatement due to fraud.
BOARD OFDIRECTORS’ REPORT
SAMPO PLC’S FINANCIAL STATEMENTS
Sampo plc’s Notes to the Accounts
GROUP’S IFRS FINANCIAL STATEMENTS
Group’s Notes to the Accounts
AUDITOR’S REPORT
179FINANCIAL STATEMENTS 2019

Key Audit Matter How our audit addressed the Key Audit Matter
Valuation of insurance contract liabilities
We refer to the Summary of significant accounting policies, Accounting policies regarding
management judgment and key sources of estimation uncertainties and Notes 26 and 27.
At 31 December 2019 the Group has insurance contract liabilities representing amounting
to mEUR 32,409 (31 December 2018: mEUR 29,805) which represents 82% of the Group’s
total liabilities and it is thus the single largest liability of the Group. The insurance
contract liabilities comprise life and non-life insurance contract liabilities.
The life insurance contract liabilities are based on estimate of future claims payments.
The estimate is based on assumptions which include uncertainty. Changes in assumptions
can result in material impacts to the valuation of the liabilities. Key assumption areas
include interest rate and life expectancy of policy holders.
The estimation of non-life insurance contract liabilities involves significant assumptions
to be made in provisions for claims outstanding. Key assumption areas include inflation
rate and life expectancy of beneficiaries. The liabilities are based on a best estimate of
ultimate cost of all claims incurred but not settled, whether reported or not, together with
claims handling costs.
Our audit procedures included evaluation of the governance around the overall Group
reserving process and included testing the operating effectiveness of key controls over
the identification, measurement and management of the Group’s calculation of insurance
liabilities.
We evaluated the appropriateness of methodologies and assumptions used, and
independently re-projected the reserve balances for certain classes of business.
We involved our internal actuarial specialists to assist us in assessing the appropriateness
of assumptions used.
We assessed the adequacy of disclosures relating to insurance contracts liabilities.
BOARD OFDIRECTORS’ REPORT
SAMPO PLC’S FINANCIAL STATEMENTS
Sampo plc’s Notes to the Accounts
GROUP’S IFRS FINANCIAL STATEMENTS
Group’s Notes to the Accounts
AUDITOR’S REPORT
180FINANCIAL STATEMENTS 2019
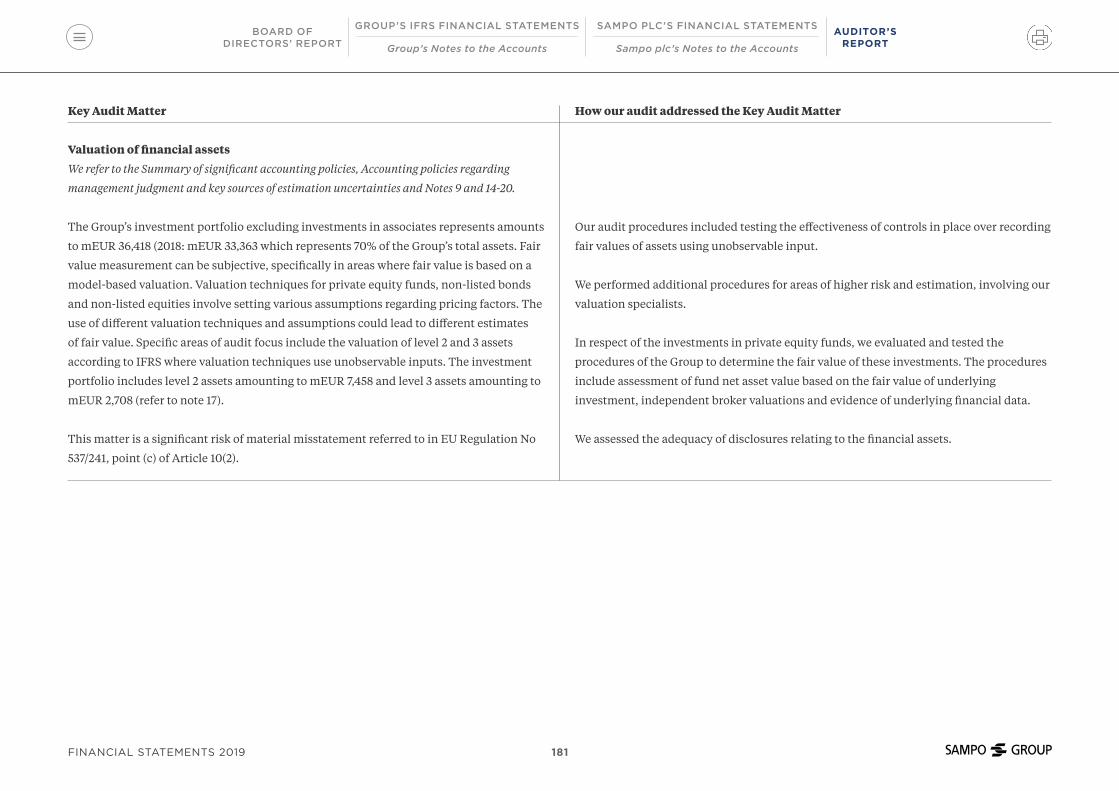
Key Audit Matter How our audit addressed the Key Audit Matter
Valuation of financial assets
We refer to the Summary of significant accounting policies, Accounting policies regarding
management judgment and key sources of estimation uncertainties and Notes 9 and 14-20.
The Group’s investment portfolio excluding investments in associates represents amounts
to mEUR 36,418 (2018: mEUR 33,363 which represents 70% of the Group’s total assets. Fair
value measurement can be subjective, specifically in areas where fair value is based on a
model-based valuation. Valuation techniques for private equity funds, non-listed bonds
and non-listed equities involve setting various assumptions regarding pricing factors. The
use of different valuation techniques and assumptions could lead to different estimates
of fair value. Specific areas of audit focus include the valuation of level 2 and 3 assets
according to IFRS where valuation techniques use unobservable inputs. The investment
portfolio includes level 2 assets amounting to mEUR 7,458 and level 3 assets amounting to
mEUR 2,708 (refer to note 17).
This matter is a significant risk of material misstatement referred to in EU Regulation No
537/241, point (c) of Article 10(2).
Our audit procedures included testing the effectiveness of controls in place over recording
fair values of assets using unobservable input.
We performed additional procedures for areas of higher risk and estimation, involving our
valuation specialists.
In respect of the investments in private equity funds, we evaluated and tested the
procedures of the Group to determine the fair value of these investments. The procedures
include assessment of fund net asset value based on the fair value of underlying
investment, independent broker valuations and evidence of underlying financial data.
We assessed the adequacy of disclosures relating to the financial assets.
BOARD OFDIRECTORS’ REPORT
SAMPO PLC’S FINANCIAL STATEMENTS
Sampo plc’s Notes to the Accounts
GROUP’S IFRS FINANCIAL STATEMENTS
Group’s Notes to the Accounts
AUDITOR’S REPORT
181FINANCIAL STATEMENTS 2019

Key Audit Matter How our audit addressed the Key Audit Matter
Associated company Nordea
We refer to the Summary of significant accounting policies and note 13.
The value of the Nordea shares in the consolidated balance sheet amounts to mEUR 6,712
(31 December 2018: mEUR 7,535). The Group’s ownership in Nordea Bank Abp is 19.87%.
Nordea Bank Abp is an associated company of the Group and is accounted for based on
equity accounting. The holding in Nordea Bank Abp represents 13% of the Group’s total
assets.
The book value of the Nordea holding exceeded the market value of the Group’s
ownership at the reporting date, due to which an impairment test has been prepared at
31 December 2019.
Our audit procedures included testing the effectiveness of controls in place over
recognizing the Group’s share of Nordea’s financial information.
Our audit procedures included, among others, involving our valuation specialists to assist
us in evaluating the assumptions and methodologies used by the Group in preparing the
impairment test.
We assessed the adequacy of disclosures relating to associated companies.
Responsibilities of the Board of Directors and the Managing Director for the Financial Statements
The Board of Directors and the Managing Director are
responsible for the preparation of consolidated financial
statements that give a true and fair view in accordance
with International Financial Reporting Standards (IFRS)
as adopted by the EU, and of financial statements that
give a true and fair view in accordance with the laws
and regulations governing the preparation of financial
statements in Finland and comply with statutory
requirements. The Board of Directors and the Managing
Director are also responsible for such internal control as
they determine is necessary to enable the preparation
of financial statements that are free from material
misstatement, whether due to fraud or error.
In preparing the financial statements, the Board of
Directors and the Managing Director are responsible for
assessing the parent company’s and the group’s ability
to continue as going concern, disclosing, as applicable,
matters relating to going concern and using the going
concern basis of accounting. The financial statements
are prepared using the going concern basis of accounting
unless there is an intention to liquidate the parent
company or the group or cease operations, or there is no
realistic alternative but to do so.
Auditor’s Responsibilities for the Audit of Financial Statements
Our objectives are to obtain reasonable assurance on
whether the financial statements as a whole are free from
material misstatement, whether due to fraud or error,
and to issue an auditor’s report that includes our opinion.
Reasonable assurance is a high level of assurance, but is
not a guarantee that an audit conducted in accordance
with good auditing practice will always detect a material
misstatement when it exists. Misstatements can arise
from fraud or error and are considered material if,
individually or in aggregate, they could reasonably be
BOARD OFDIRECTORS’ REPORT
SAMPO PLC’S FINANCIAL STATEMENTS
Sampo plc’s Notes to the Accounts
GROUP’S IFRS FINANCIAL STATEMENTS
Group’s Notes to the Accounts
AUDITOR’S REPORT
182FINANCIAL STATEMENTS 2019

expected to influence the economic decisions of users
taken on the basis of the financial statements.
As part of an audit in accordance with good auditing
practice, we exercise professional judgment and maintain
professional skepticism throughout the audit. We also:
• Identify and assess the risks of material misstatement of
the financial statements, whether due to fraud or error,
design and perform audit procedures responsive to
those risks, and obtain audit evidence that is sufficient
and appropriate to provide a basis for our opinion. The
risk of not detecting a material misstatement resulting
from fraud is higher than for one resulting from error,
as fraud may involve collusion, forgery, intentional
omissions, misrepresentations, or the override of
internal control.
• Obtain an understanding of internal control relevant
to the audit in order to design audit procedures that
are appropriate in the circumstances, but not for the
purpose of expressing an opinion on the effectiveness of
the parent company’s or the group’s internal control.
• Evaluate the appropriateness of accounting policies
used and the reasonableness of accounting estimates
and related disclosures made by management.
• Conclude on the appropriateness of the Board of
Directors’ and the Managing Director’s use of the going
concern basis of accounting and based on the audit evi-
dence obtained, whether a material uncertainty exists
related to events or conditions that may cast significant
doubt on the parent company’s or the group’s ability
to continue as a going concern. If we conclude that a
material uncertainty exists, we are required to draw
attention in our auditor’s report to the related disclo-
sures in the financial statements or, if such disclosures
are inadequate, to modify our opinion. Our conclusions
are based on the audit evidence obtained up to the
date of our auditor’s report. However, future events or
conditions may cause the parent company or the group
to cease to continue as a going concern.
• Evaluate the overall presentation, structure and content
of the financial statements, including the disclosures,
and whether the financial statements represent the
underlying transactions and events so that the financial
statements give a true and fair view.
• Obtain sufficient appropriate audit evidence regarding
the financial information of the entities or business
activities within the group to express an opinion on the
consolidated financial statements. We are responsible for
the direction, supervision and performance of the group
audit. We remain solely responsible for our audit opinion.
We communicate with those charged with governance
regarding, among other matters, the planned scope and
timing of the audit and significant audit findings, including
any significant deficiencies in internal control that we
identify during our audit.
We also provide those charged with governance with a
statement that we have complied with relevant ethical
requirements regarding independence, and communicate
with them all relationships and other matters that may
reasonably be thought to bear on our independence, and
where applicable, related safeguards.
From the matters communicated with those charged with
governance, we determine those matters that were of most
significance in the audit of the financial statements of the
current period and are therefore the key audit matters. We
describe these matters in our auditor’s report unless law or
regulation precludes public disclosure about the matter or
when, in extremely rare circumstances, we determine that a
matter should not be communicated in our report because
the adverse consequences of doing so would reasonably be
expected to outweigh the public interest benefits of such
communication.
BOARD OFDIRECTORS’ REPORT
SAMPO PLC’S FINANCIAL STATEMENTS
Sampo plc’s Notes to the Accounts
GROUP’S IFRS FINANCIAL STATEMENTS
Group’s Notes to the Accounts
AUDITOR’S REPORT
183FINANCIAL STATEMENTS 2019
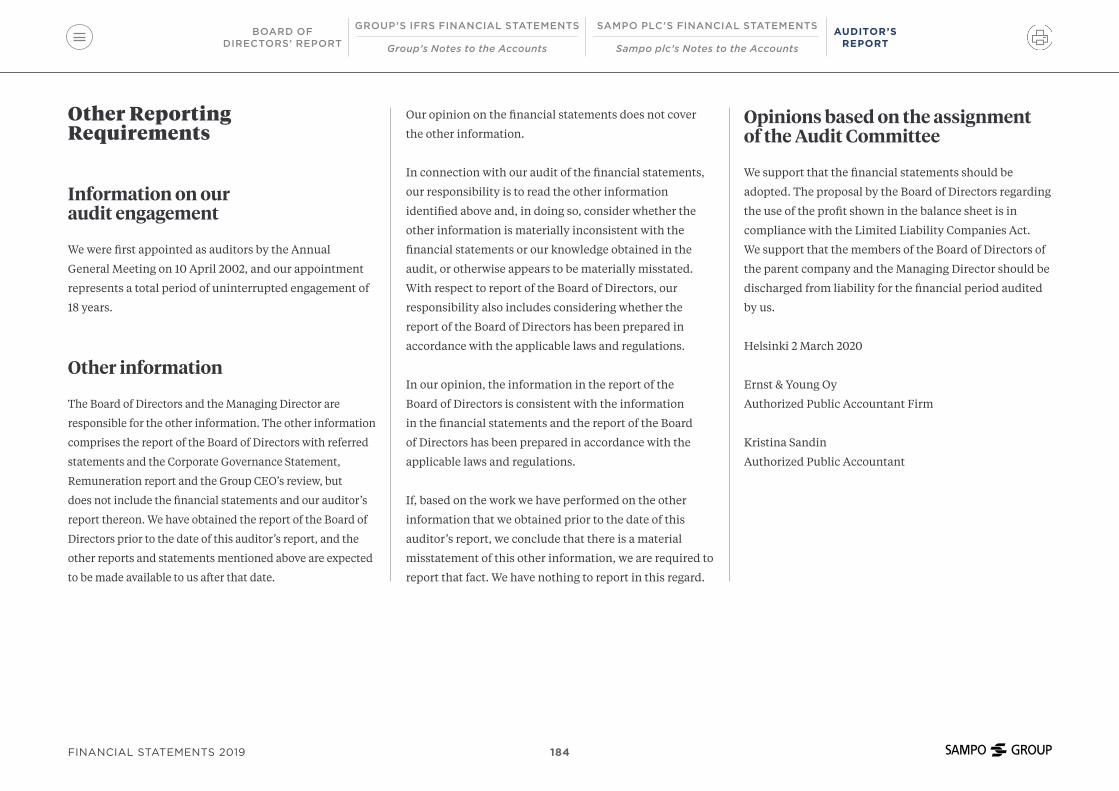
Other Reporting Requirements
Information on our audit engagement
We were first appointed as auditors by the Annual
General Meeting on 10 April 2002, and our appointment
represents a total period of uninterrupted engagement of
18 years.
Other information
The Board of Directors and the Managing Director are
responsible for the other information. The other information
comprises the report of the Board of Directors with referred
statements and the Corporate Governance Statement,
Remuneration report and the Group CEO’s review, but
does not include the financial statements and our auditor’s
report thereon. We have obtained the report of the Board of
Directors prior to the date of this auditor’s report, and the
other reports and statements mentioned above are expected
to be made available to us after that date.
Our opinion on the financial statements does not cover
the other information.
In connection with our audit of the financial statements,
our responsibility is to read the other information
identified above and, in doing so, consider whether the
other information is materially inconsistent with the
financial statements or our knowledge obtained in the
audit, or otherwise appears to be materially misstated.
With respect to report of the Board of Directors, our
responsibility also includes considering whether the
report of the Board of Directors has been prepared in
accordance with the applicable laws and regulations.
In our opinion, the information in the report of the
Board of Directors is consistent with the information
in the financial statements and the report of the Board
of Directors has been prepared in accordance with the
applicable laws and regulations.
If, based on the work we have performed on the other
information that we obtained prior to the date of this
auditor’s report, we conclude that there is a material
misstatement of this other information, we are required to
report that fact. We have nothing to report in this regard.
Opinions based on the assignment of the Audit Committee
We support that the financial statements should be
adopted. The proposal by the Board of Directors regarding
the use of the profit shown in the balance sheet is in
compliance with the Limited Liability Companies Act.
We support that the members of the Board of Directors of
the parent company and the Managing Director should be
discharged from liability for the financial period audited
by us.
Helsinki 2 March 2020
Ernst & Young Oy
Authorized Public Accountant Firm
Kristina Sandin
Authorized Public Accountant
BOARD OFDIRECTORS’ REPORT
SAMPO PLC’S FINANCIAL STATEMENTS
Sampo plc’s Notes to the Accounts
GROUP’S IFRS FINANCIAL STATEMENTS
Group’s Notes to the Accounts
AUDITOR’S REPORT
184FINANCIAL STATEMENTS 2019

Sampo plcFabianinkatu 2700100 Helsinki, Finland
Phone: +358 10 516 0100Business ID: 0142213-3
www.sampo.com @Sampo_plc @sampo_oyj sampo-plc
2019