Home Food Availability, Dietary Intake and Child Weight Status
115
University of Tennessee, Knoxville Trace: Tennessee Research and Creative Exchange Masters eses Graduate School 5-2011 Home Food Availability, Dietary Intake and Child Weight Status Manasi Barot [email protected] is esis is brought to you for free and open access by the Graduate School at Trace: Tennessee Research and Creative Exchange. It has been accepted for inclusion in Masters eses by an authorized administrator of Trace: Tennessee Research and Creative Exchange. For more information, please contact [email protected]. Recommended Citation Barot, Manasi, "Home Food Availability, Dietary Intake and Child Weight Status. " Master's esis, University of Tennessee, 2011. hps://trace.tennessee.edu/utk_gradthes/857
Transcript of Home Food Availability, Dietary Intake and Child Weight Status
University of Tennessee, KnoxvilleTrace: Tennessee Research and CreativeExchange
Masters Theses Graduate School
5-2011
Home Food Availability, Dietary Intake and ChildWeight StatusManasi [email protected]
This Thesis is brought to you for free and open access by the Graduate School at Trace: Tennessee Research and Creative Exchange. It has beenaccepted for inclusion in Masters Theses by an authorized administrator of Trace: Tennessee Research and Creative Exchange. For more information,please contact [email protected].
Recommended CitationBarot, Manasi, "Home Food Availability, Dietary Intake and Child Weight Status. " Master's Thesis, University of Tennessee, 2011.https://trace.tennessee.edu/utk_gradthes/857

To the Graduate Council:
I am submitting herewith a thesis written by Manasi Barot entitled "Home Food Availability, DietaryIntake and Child Weight Status." I have examined the final electronic copy of this thesis for form andcontent and recommend that it be accepted in partial fulfillment of the requirements for the degree ofMaster of Science, with a major in Nutrition.
Marsha L. Spence, Major Professor
We have read this thesis and recommend its acceptance:
Carol Costello, Betty Greer
Accepted for the Council:Dixie L. Thompson
Vice Provost and Dean of the Graduate School
(Original signatures are on file with official student records.)

To the Graduate Council:
I am submitting herewith a thesis written by Manasi Barot entitled “Home Food Availability, Dietary Intake and Child Weight Status.” I have examined the final electronic copy of this thesis for form and content and recommend that it be accepted in partial fulfillment of the requirements for the degree of Master of Science, with a major in Nutrition.
Marsha Spence, Major Professor
We have read this thesis
and recommend its acceptance:
Carol Costello
Betty Greer
Accepted for the Council
Carolyn R. Hodges
Vice Provost and Dean of the Graduate School
(Original signatures are on file with official student records.)

Home Food Availability, Dietary Intake and
Child Weight Status
A Thesis Presented for the
Master of Science
Degree
The University of Tennessee, Knoxville
Manasi Barot
May 2011

ii
Copyright © 2010 by Manasi Barot.
All rights reserved.

iii
ACKNOWLEDGEMENTS
I would like to thank my advisor, Dr. Marsha Spence, for all of your guidance and
support since my freshman year to graduate school and through this process. You have
really inspired me and I will always strive to become as good of a Public Health
Nutritionist like you. This thesis simply could not have happened without you.
I would also like to thank my committee members, Dr. Carol Costello and Dr.
Betty Greer, for the time, interest and guidance you devoted to this project. Dr. Costello
gave me the opportunity to learn and grow through the Destination Imagination Healthy
Eating Project and Dr. Greer for sharing her years of experience working in the Public
Health Nutrition Field.
I would like to acknowledge the USDA, who funded the DI Healthy Eating
Project.
Finally, I would like to thank my father Pankaj Barot for the immense sacrifices he
made to see me graduate with my Masters degree, my mother Hina Barot for being the
pillar of strength for the entire family, and my Husband Poorak Mody for your undying
faith in me.

iv
ABSTRACT
Background : Childhood obesity is a critical public health problem. There is a crucial need to identify environmental factors that either encourage or prevent obesogenic behaviors. The home food environment is one of the primary environments in which children are exposed to food. Therefore, it is crucial to study how the home food availability influences dietary intake and weight status. Objective: This study examines parental report of household food availability of fruits, vegetables, and milk, and its association with child weight status and child dietary intake of these foods. Methods: This is a cross-sectional study, based on surveys from 489 students in grades 3-12 their parents in 2009. Child participants were Destination ImagiNation® finalists. Child data collection included surveys based on the Youth Risk Surveillance Survey and anthropometric measurements of height and weight used to calculate child z-BMI. Parents self-reported their heights and weights and home food availability. Descriptive statistics were conducted and multiple linear regression was used to predict whether or not a relationship existed between home food availability, child weight status, and dietary intake of fruits, vegetables, and milk. Results: Overall, 12.5% of participants were overweight and 6.7% were obese. Approximately26% of participants consumed 5 or more servings of fruits and vegetables per day and 17% consumed 3 or more glasses of milk per day. However, a no significant relationship was found between home availability of fruits, vegetables, and milk and the reported intake of these foods. Although a significant association was also found between parent and child weight status, no significant association was found between home food availability and child weight status. Conclusions: Compared to national data, a larger proportion of this sample was classified as normal weight and consumed the recommended intake of fruits and vegetables and milk. Parents reported high availability of fruits, vegetables, and milk products. However, no significance was found between the reported availability of these foods and weight status or dietary intake of fruits, vegetables, or milk.
v
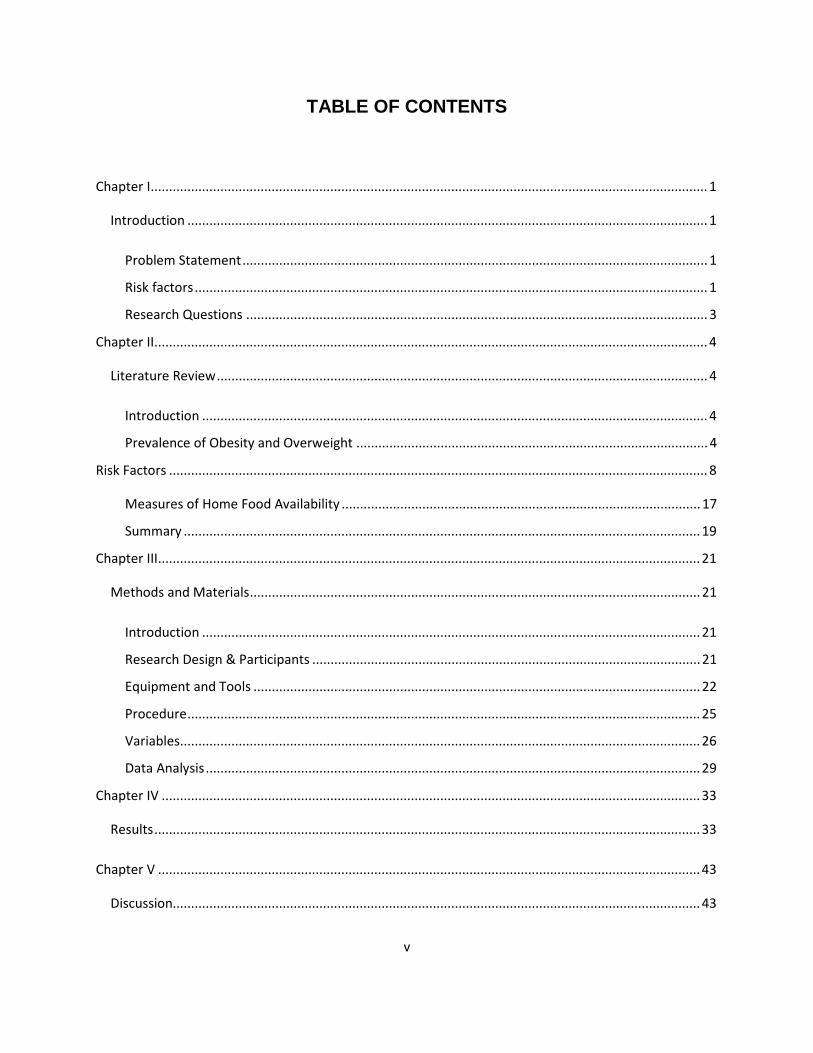
TABLE OF CONTENTS
Chapter I ........................................................................................................................................................ 1
Introduction .............................................................................................................................................. 1
Problem Statement ............................................................................................................................... 1
Risk factors ............................................................................................................................................ 1
Research Questions .............................................................................................................................. 3
Chapter II ....................................................................................................................................................... 4
Literature Review ...................................................................................................................................... 4
Introduction .......................................................................................................................................... 4
Prevalence of Obesity and Overweight ................................................................................................ 4
Risk Factors ................................................................................................................................................... 8
Measures of Home Food Availability .................................................................................................. 17
Summary ............................................................................................................................................. 19
Chapter III .................................................................................................................................................... 21
Methods and Materials ........................................................................................................................... 21
Introduction ........................................................................................................................................ 21
Research Design & Participants .......................................................................................................... 21
Equipment and Tools .......................................................................................................................... 22
Procedure ............................................................................................................................................ 25
Variables.............................................................................................................................................. 26
Data Analysis ....................................................................................................................................... 29
Chapter IV ................................................................................................................................................... 33
Results ..................................................................................................................................................... 33
Chapter V .................................................................................................................................................... 43
Discussion................................................................................................................................................ 43

vi
Prevalence of Overweight/Obesity ..................................................................................................... 43
Dietary Behaviors ................................................................................................................................ 43
Home Availability ................................................................................................................................ 45
Interaction between home food availability and dietary behavior .................................................... 47
Interaction home food availability and weight status ........................................................................ 50
Limitations, strengths and future research......................................................................................... 50
References .................................................................................................................................................. 53
Appendices .................................................................................................................................................. 61
Vita ............................................................................................................................................................ 105

vii
List of tables
Chapter II
TABLE 1: PERCENTAGE OF STUDENTS (9TH-12TH GRADE), OVERWEIGHT AND OBESE, BY AGE AND SEX, 2007 YOUTH RISK BEHAVIOR
SURVEY .................................................................................................................................................................... 7
Chapter IV
TABLE 1. PROJECT HEALTHY PARTICIPANT DEMOGRAPHICS. ...................................................................................................... 34
TABLE 2. WEIGHT CATEGORY BY GENDER AND SCHOOL ........................................................................................................... 35
TABLE 3. PROJECT HEALTHY PARENT DEMOGRAPHICS. ............................................................................................................ 36
TABLE 4. CHILD PARTICIPANTS MEETING RECOMMENDED SERVINGS OF FRUITS, VEGETABLES AND MILK IN THE PAST WEEK ..................... 37
TABLE 5. PERCENT OF PARTICIPANT HOUSEHOLDS THAT HAVE MILK, VEGETABLES AND FRUITS AVAILABLE ........................................... 39
TABLE 6. TOTAL FAT SCORES, TOTAL GROUP FAT SCORES, TOTAL FIBER SCORES, AND TOTAL GROUP FIBER SCORES ........................... 42
1
Chapter I
Introduction
Problem Statement
Overweight and obesity rates have been increasing for the past three decades
and have reached epidemic levels (1). Approximately 67% of American adults are
overweight. However, the most alarming rise in the epidemic has been among children.
In 2007, among 6 to 19 year-old males, 16.6% were overweight (age- and gender-
specific BMI > 85th percentile and < 95th percentile) and 18% were obese (age- and
gender-specific BMI >95th percentile) and among females, ages 6 to 19 years, 13.2%
were overweight and 16% were obese (1). Many believe that the obesity epidemic
among adults and children is the result of an “obesogenic” environment, which is
characterized by the ubiquitous availability of unhealthy food options, large
consumptions of these types of foods, and increasingly sedentary lifestyles (1). Much
research must still be done to fully understand the environmental factors that contribute
to the childhood and adolescent overweight and obesity epidemic.
Risk factors
In Tennessee, obesity in 10 to 17 year-olds is approximately 20%, which is the
fourth highest prevalence rate in the nation (2). This is a concern because obesity puts
children and adolescents at significant health risk. Health conditions that were once
considered to be adult diseases are readily being observed in children (3). These
conditions include, but are not limited to, hypertension, atherosclerosis, type I and II
diabetes, metabolic syndrome, asthma, and nonalcoholic fatty liver disease (4). Further,
2
many obese children have been observed to suffer from psychosocial problems such as
depression, which is often associated with low body satisfaction (3). It is difficult to
assess the exact cause of the obesity epidemic, as researchers believe that there are
many contributing factors (3-4). However, there does seem to be general consensus
that two major factors contribute to the epidemic: greater caloric consumption and
decreased physical activity levels (3-4). Children’s primary environments, including both
home and school, can greatly impact these factors (4-8). Although research regarding
the school food environment is increasing, little research exists on the home food
environment. For this reason, this study will examine the home food environment of
children using a home food inventory (HFI). The home food environment is often
shaped by parental food preference, as parents are the “gatekeepers” for what is
available in the home (4-5). Home food availability is believed to drive children’s food
preference and eating behavior (4-5). Therefore, it is important to study the role of the
foods available in the home environment on children’s weight status.
This study was part of a larger study of 2,800 children. Child participants were
part of a creative afterschool program, Destination ImagiNation® (DI). Children were
asked to complete a questionnaire when they came for the DI finals in Knoxville, TN.
Their heights and weights were measured and recorded by trained research assistants.
In addition, parents were asked to complete an online survey and self-report their
heights and weights. The parental survey included a HFI, which contained a list of 80
food items. For this portion of the survey, parents were asked to indicate whether or not
items on the list were present in the home at the time of survey completion.

3
Research Questions
This study explores four research questions. The questions included: 1) Do Total
Fat Score, Total Fiber Score, and Family income predict child z-BMI score, while
controlling for parent weight status? 2) If Total Fat and Fiber Scores significantly predict
child z-BMI scores, do any of the six Total Group Fat Scores and Total Group Fiber
Scores predict child z-BMI scores? 3) Do the Total Vegetable Fiber Score and Total
Fruit Fiber Score predict child z-BMI score? 4) Does the availability of fruits, vegetable
and milk in participants’ homes influence whether the participant consumed the
recommended servings of these foods?

4
Chapter II
Literature Review
Introduction
The obesity rate in the United States has reached an epidemic level (1), with
approximately one-third of the adult population classified as obese (Body Mass Index
(BMI) ≥30). BMI is calculated using an individual’s weight in kilograms divided by his or
her height in meters, squared (1). The most alarming rise in overweight and obesity
rates has been among children and adolescents. Overweight and obesity among
children are defined by the Center of Disease Control and Prevention gender- and age-
specific growth charts. Overweight is defined as a gender- and age-specific BMI ≥ the
85th percentile and < the 95th percentile. Childhood obesity is defined as a gender-and
age-specific BMI ≥ the 95th percentile.
Prevalence of Obesity and Overweight
In the U.S., child and adolescent rates of overweight and obesity are primarily
collected by two national surveys. One of the largest national surveys, the National
Health and Nutrition Examination Survey (NHANES), has collected health and nutrition
data for U.S. children and adults since the 1960s (9). Each participant is interviewed by
a trained professional. Questions include socio-economic, demographic, nutrition, and
other health related information. Additionally, participant anthropometrics are measured
by trained individuals. The other national survey is the Youth Risk Behavior Surveillance
Survey (YRBSS), which consists of self-reported data, including height and weight, from
adolescents. It includes information regarding health risk behaviors (unintentional
injuries and violence, tobacco use, alcohol and other drug use, sexual behaviors,

5
unhealthy dietary behaviors, and physical inactivity), overweight and obesity, and
asthma (10).
According to Ogden and colleagues, who used NHANES data, in the past two
decades the prevalence of obesity among children and adolescents tripled for those
aged 2 to19 years (11). Although obesity levels among school-aged children showed
no significant increase from 1999-2006, levels still remain high. Between 2003 and
2006, a large number of 2 to19 year-olds were found to have high BMIs. In total, 11.9%
were >the 97th percentile (morbidly obese), 16.9% were > the 95th percentile (obese),
and 31.7% were > the 85th percentile and < the 95th percentile (overweight) for age and
gender-specific BMIs. Further, it was observed that adolescents were more likely to be
overweight or obese compared to younger children. There were no significant gender
differences found among non-Hispanic white and non-Hispanic black school-aged
children, except for Mexican-American boys aged 2 to 19 years. Boys were more likely
than girls to have a high BMI (> the 97th, 95th, or 85th percentile) compared to girls of the
same age. Similar gender differences were observed among Hispanic boys and girls,
but only at the 95th percentile or above.
There were significant differences in overweight and obesity trends among
children and adolescents. According to NHANES, 2003-2006, non-Hispanic black girls
and Mexican-American girls were more likely to be overweight or obese compared to
their non-Hispanic white counterparts. Similar trends were observed among ethnically
diverse boys as well. Mexican American boys were more likely to be overweight or
obese compared to both Non-Hispanic white and black boys. However, non-Hispanic

6
black boys were more likely to be overweight and obese compared to their Non-
Hispanic white counterparts. The 2007, YRBS showed similar gender differences and
race/ethnicity trends for overweight and obesity (Table 1). Table 1 displays the
percentage of male and female students in 9th-12th grade, who were either overweight
(>85th percentile and <95th percentile) or obese (>95th percentile) for gender- and age-
specific BMI.
Research has shown that there are not only racial and gender differences in the
prevalence of overweight and obesity among children, but that these rates are
influenced by socio-economic status as well (12-13). Over the past three decades, there
was a significant rise in the prevalence of obesity among low-income older children and
adolescents (12). Although studies by Alaimo and colleagues and Wang and
associates found no association between low-income younger children and weight
status regardless of race/ethnicity (12-13), there was a significant association between
low-income and weight status in white adolescent boys and girls (ages 10 to18 years).
The opposite relationship existed between black adolescent girls and family income.
The study revealed that black adolescent girls from homes with high family income were
twice as likely to be overweight then their medium and low-income counterparts.
However, Wang and colleagues failed to find a consistent relationship between family
income and weight status among Mexican-American adolescents (12). Researchers
believe that there are many reasons that contribute to the weight disparities that exist
based on gender, race/ethnicity, and income groups (10-11). The predominant findings
have shown a decrease in physical activity and increase in energy consumption among

7
Table 1: Percentage of Students (9th-12th grade), O verweight and Obese, by Age
and Sex, 2007 Youth Risk Behavior Survey
White Black Hispanic
Gender: Girls
Overweight
(≥ 85th-<95th Percentiles)
12.8% 21.4% 17.9%
Obese
(≥95th Percentile)
6.8% 17.8% 12.7%
Gender: Boys
Overweight
(≥ 85th-<95th Percentiles)
15.7% 16.6% 18.3%
Obese
(≥95th Percentile)
14.6% 18.9% 20.3%

8
all groups of children and adolescents (3). These and other factors that may contribute
to childhood and adolescent conditions of being overweight and obese will be discussed
in further detail in the following sections.
Risk Factors
Dietary Factors
According to the World Health Organization (WHO), global obesity is a growing
epidemic. The WHO has identified the causes of obesity as increased consumption of
foods that are high in fat and sugar and decreased physical activity due to the increase
in sedentary work, convenient transportation, and urbanization (14). Additionally, other
research has demonstrated that genetics and the environment play a significant role in
the development of obesity among children, adolescents, and adults (14-15).
Generally, high-energy. dense foods tend to be high in fat and low in fiber
content (16). The American Academy of Pediatrics recommends a fat intake of 30-35%
of kcal for 2 to 3 year-olds, and 25-35% of kcal for 4 to 18 year-olds (17). Many studies
have shown that increased fat intake is positively related to higher adiposity in adults as
well as children. In a longitudinal study that included 1,432 children ages 5 to 9 years-
old, researchers identified dietary patterns associated with childhood fatness. The
study’s results demonstrated a strong positive relationship between energy-dense, low-
fiber, and high-fat foods with higher adiposity in children (p<0.0001). This pattern was
especially observed in 7 year-olds and indicated a direct relationship between high-
energy intake and the consumption of low-fiber bread, sweets, confectionaries, cakes,
crisps, and savory snacks (16). These findings were reaffirmed by Nicklas and

9
colleagues, who studied 1,562 10-year-old children. Data were collected by 24-hour-
dietary-recalls. Results showed that consumption of low quality foods, such as sweets
(p<0.001) and salty snacks (p<0.05), was positively correlated with being overweight
among the sample (18).
The WHO states that one of the contributing factors to the obesity epidemic is the
low consumption of fiber. Fruits and vegetables are a good source of fiber, as well as
vitamins, and minerals (14). According to the 2007 YRBSS, only 21% of students
consumed the recommended five servings or more of fruits and vegetables in a period
of one week (19). Research suggests that consumption of fruits and vegetables is
essential because they are rich in vitamins, minerals, and fiber. In addition, fruits and
vegetables contain soluble and insoluble fibers, which may act as a natural hunger
suppressant, reducing gastric-emptying and hence reducing “snacking” between meals
(20). The WHO states that high consumption of fruits and vegetables has the potential
to displace high-fat or energy-dense foods. Hence, high consumption of fruits and
vegetables may be a strategy to reduce the conditions of being overweight and obese
among children and adolescents.
Several research studies support this WHO recommendation for high
consumption of fruits and vegetables. For example, the Bogalusa Heart Study found
that African American girls who consumed a diet rich in fruits, fruit juice, and vegetables
and who consumed breakfast were less likely to be overweight or obese. On the other
hand, European American girls who had a diet composed of seafood, sweets, and
sweetened beverages, were more likely to be overweight and obese(18). Similarly, in a

10
study by Lakkakula and colleagues, who studied 341 low-income African American
children, the researchers found that children who did not highly prefer fruits and
vegetables were nearly six times more likely to be overweight or obese compared to
their counterparts who did highly prefer fruits and vegetables (21). Further, in a study by
Langevin and others, which had total of 193 subjects between the ages of 7 to 13 years,
22.0% were overweight and 43.0% were obese. The researchers found 75.0% of the
participants failed to meet the recommended fruit, vegetable, grain, and dairy intake.
The researchers concluded that a correlation existed between children being overweight
and obesity and the failure to consume the recommended fruit, vegetable and other
major food groups (22).
Most researchers agree that maintenance of a healthy weight depends upon a
sensitive balance between energy consumption and expenditure (15). Some
researchers believe that an imbalance in this equation has occurred and can be linked
to the increased intake of sugar-sweetened beverages (SSB) (15). Excess consumption
of SSB is a concern, as it leads to increased carbohydrate intake. Carbohydrates are
the body’s primary energy source, but excess intake can lead to excess energy that
may be difficult to expend (23). Sugar consumption in the U.S. went up 22% from 1977
(13.1%) to 1996 (16.0%). Presently, a total of 15.8% of dietary calories come from SSB
(23-24). Further, the 2007 YRBS data showed that approximately 34% of youth
consumed at least one glass of soda or pop per day in the seven days prior to the
survey (23-24). These numbers are of concern to many researchers, as the Dietary
Guidelines for American suggest that no more than 10% of total daily caloric intake
come from added sugars (23).

11
Many studies have shown the positive association between high SSB
consumption and high weight status. For example, the Bogalusa Heart Study found that
10-year-old children who consumed beverages such as soft drinks, fruit flavor drinks,
and sweetened tea and coffee were more likely to be overweight (p<0.001) (18).
Another study by Gillis and associates found that obese children and adolescents
consumed significantly more SSB (p<0.002) compared to their non-obese counterparts
and consumption of soda was positively associated with body fat percentage. They
recommended that obese children and adolescents limit their intake of SSB (25).
These findings are strongly supported by a controlled study conducted by
Ebbeling and associates (26). They randomly assigned 103 adolescents into two
groups, an intervention and control group, for 25 weeks. Prior to intervention, each
adolescent reported consuming at least 12 fluid ounces of SSB per day. In the
intervention group, all SSB were replaced with non-caloric beverages and no changes
were made with the control group (26). After a 25-week study duration, results revealed
a significant difference in BMI in the intervention group compared to the control group (-
0.63 ± 0.23 kg/m2 and +0.12 ± 0.26 kg/m2, respectively; p=0.03) for children in the upper
BMI percentile (p=0.04). Further, significant differences in BMI were noticed in
participants who had previously consumed greater amounts of SSB (26). These studies
suggest that there is a significant relationship between SSB intake and obesity.
Therefore, health professionals do recommend that the consumption of SSB be limited.
Activity Factors
High sedentary and low physical activity levels have added to the imbalance
between increased caloric intake and expenditure among children, adolescents, and

12
adults. With the increasing use of technology, such as television, mobile phones,
convenient transportation options, video games, and computers, life is increasingly
sedentary and physical activity levels among children and adolescents have decreased
considerably (27). The Physical Activity Guidelines Advisory Committee recommends
that children and adolescents get a total of 60 minutes of moderate to vigorous physical
activity a day, each day of the week. However, 2007 YRBS data show that only 35% of
students were physically active for at least 60 minutes a day for seven days. In addition,
these data show that 36% of students watched three or more hours of television on an
average school day and 25% of students played video or computer games or used a
computer for non-school related work for more than three hours on an average school
day (19). Research has demonstrated that there is a strong association between
sedentary behavior and high weight status (28-29).
In a study that used the School Health Action, Planning and Evaluation System
(SHAPES) module and collected data from 25,060 high school students, researchers
used logistic regression to evaluate the association between BMI and activity levels.
Students were classified as high active-low sedentary, high active-high sedentary, low
active-low sedentary, and low active-high sedentary. Odds ratios were performed with
high active–low sedentary as the reference. This revealed that girls who were low
active-high sedentary had were 2.24 times more likely to be overweight than high
active-low sedentary girls. Whereas girls who were high active–high sedentary were
1.91 times more likely to be overweight than high active–low sedentary girls (28). On
the other hand, results revealed that boys who were low active-high sedentary were 1.5
times more likely than high active–low sedentary boys to be overweight.

13
In a study by Purslow and others, which examined children (176 boys and 169
girls) between the ages of 8 and 9 years old (29), linear regression was used to
examine the relationships between gender, physical activity and weight status. Similar
to the Wong study, Purslow found that boys were significantly more moderately and
vigorously active than girls (t = 8.8, df = 267, p < 0.001). Boys were more likely to meet
the daily recommendation of 60 minutes of physical activity than girls (t = 7.2, df = 299,
p < 0.001). In addition, among boys, the duration of physical activity was lower among
overweight and obese boys than compared to leaner boys (β = -0.26, p = 0.002) (29).
However, the relationship between the duration of physical activity and weight status
was not significant among girls. Similarly, there was a significant negative relationship
between fat mass and physical activity in boys (β =-0.27, p = 0.001). However, this was
not the case in girls (29).
Home Environment
A child’s environment is usually controlled by parents or caregivers, who act as
gate keepers (30). Historically, most parents have always responded promptly to a
child’s needs, by providing as much food as possible and as frequently as possible.
Parents are often responsible for children’s early food experience, which generally leads
to lifelong food preferences. The foods that parents provide are usually influenced by
culture, availability, prices, and convenience, which in turn shape a child’s food
environment. Further, parents and caregivers act as role models to children and
subsequently, children usually acquire eating behaviors demonstrated by parents or
caregivers (30). Several studies found that children were more likely to consume
unfamiliar foods if their caregivers consumed them (30-32).

14
Further, children’s food consumption is greatly influenced by parents’ feeding
styles (33). Parental feeding practices are said to influence children’s food choices,
quantity of consumption, dietary quality, and BMI. Parents may be concerned that their
children are or will become overweight; hence, they may try to restrict or control their
children’s diets. However, research has shown that parents who restrict their children’s
food intake may negatively affect food preferences and self-control. On the other hand,
parents who use sweet and energy-dense foods as rewards may increase preferences
of such foods in their children. Additionally, parents who deny children access to certain
types of foods, such that foods are in sight, but out of reach, may cause the children to
have poor self-control and to consume food excessively. Parents who pressure their
children to eat when they are not hungry may influence children’s dietary intake and
affect self-control (33).
Varied parenting styles are associated with children’s eating behaviors, as well
(33). Authoritative parents have high expectations of children’s eating behaviors and are
highly sensitive to their children’s needs. Research has shown that these families tend
to have a home food environment with easy access to vegetables and fruits and lower
access to “junk foods.” On the other hand, authoritarian parents tend to have high
expectations but low sensitivity to their children’s needs. Research has shown that
children of authoritarian parents are five times more likely to be overweight compared to
children of authoritative parents. Additionally, a permissive parenting style is
demonstrated by low expectations of children’s eating behaviors and low sensitivity to
their needs. Permissive parenting may lead to overeating and a greater risk for adult
obesity (33).

15
As explained above, parenting styles can provide an environment that can easily
accommodate the development of obesity or not (33). Parents are responsible for
creating the home food environment, as they are the primary purchasers of foods. Most
researchers concur that the greater the availability of foods related to obesity (high-fat
and high-sugar foods), the more likely children or adolescents are to consume them
(cite). The opposite is observed with greater availability of low-fat, nutrient-dense foods
such as fruits and vegetables (7). Foods purchased by parents determine what foods
are available in the home. Research has shown that food availability strongly correlates
with food intake (4-8).
In a study by Hanson and coworkers, the authors conducted a cross-sectional
study with 902 families with adolescents (6). Their objective was to investigate the
associations of home food availability, parents’ dietary intake and how it influenced their
children’s vegetable, fruit, and dairy intake. The authors conducted telephone interviews
with parents using the Project Eating Among Teens survey. Adolescents completed this
survey and the Youth Adolescent Food Frequency Questionnaire at school (6). They
found that many of the adolescents and their parent did not meet the recommended
fruit, vegetable, and dairy servings per day. Further, parents’ reports on home food
availability reflected that 90.4% of families had vegetables and fruits available “at least
usually.” Many parents reported serving both vegetables (87.0%) and dairy (66.6%) at
least at meals. The authors found that the availability of vegetables and fruits showed a
positive relationship with their intake by girls (p < 0.01). However, the relationship
between home food availability and intake was not observed in boys. The opposite was
observed with the availability of milk, as boys seemed to consume more milk servings at

16
meals (p <0.01). Further, in girls the consumption of dairy increased when soft drinks
were less available (p = 0.04). In homes where soft drinks were always present, girls
consumed 0.9 servings less of dairy compared to girls in whose homes soft drinks were
never present (6).
Similarly, in a study by Spurrier and colleagues, the authors studied 280
preschool children and their families (8). Data regarding the type of home food
environment and children’s dietary intake were collected by observation, parent
interviews, and questionnaires. The researchers found, that the high availability of fruits
and vegetables was strongly associated with children’s consumption of these types of
foods (p= <0.001). A similar pattern was observed with the high availability of
sweetened beverages and snack foods. A strong association was observed with the
availability of sweetened beverages (p = 0.004), and non-core snack foods (p = 0.01 ),
and the consumption of these types of foods (8). Also, the study found that parents who
restricted their children from consuming sweetened beverages (p = 0.02) and high fat
and sugar foods (p = 0.009) consumed more fruits and vegetables. Therefore, this study
found that less availability and less access to high fat and sugar foods and beverages
results in higher intakes of fruits and vegetables (8).
In an Australian-based, cross sectional study by Campbell and colleagues, the
researchers studied 347 youths, ages 12 to13, as well as their families and their home
food environments (5). Researches collected data using self-completed surveys, as well
as Food Frequency Questionnaires (FFQ). Researchers used multiple linear regression
to determine associations between variables. The study found that boys with

17
authoritarian parents were more likely to consume high energy drinks (p=0.002) (5). The
report of mothers’ dietary intake of both sweet snacks (p=0.010) and savory snacks
(p=0.008) and the availability of unhealthy foods (p=0.002) in the home were positively
related to boys’ dietary intake of these foods. The consumption of high energy drinks by
both parents was positively associated with girls’ intake of high energy drinks (mothers
p=0.025 and fathers p=0.058) (5). The availability of unhealthy foods was positively
related to girls’ dietary intake of unhealthy foods (p<0.001) (5). Thus, this study clearly
showed the association between parental consumption of foods and its association with
their children’s intake (5). Further, this study reaffirmed that the availability of foods in
the home is positively associated with adolescents’ food intake.
Measures of Home Food Availability
Most home food availability is measured using a self-reported list of food and
beverages, known as a home food inventory (HFI) or home shelf inventory. These
inventories are used to evaluate the presence and/or absence of foods within a
household. One of the most widely-used HFIs contains a list of 80 foods that is broken
down into 12 categories (32). This HFI was originally validated by Crockett and
colleagues. In 1992, Crockett and coauthors reported the findings of two studies that
used the HFI with 75 subjects. After the subjects completed the HFI, trained
interviewers went to the homes and completed the HFI based on the foods available at
the time of the interview (32).
The HFI completed by subjects and interviewers were then compared to
calculate the specificity and sensitivity of the HFI. Sensitivity was defined as correctly

18
identifying the actual presence of a food item by the subject and was confirmed by the
interviewer. Specificity was defined as the correct reporting of the unavailability of a
food item by the subject. In the first study, the researchers found a sensitivity of 0.86
and a specificity of 0.92. In the second study, they found that the HFI had a sensitivity of
0.87 and a specificity of 0.90. Crocket and colleagues further found no differences in
self-reporting by gender (32).
In 2002, Miller and associates validated the HFI with subjects who were 65 years
or older and who had Type II diabetes (33). They determined the validity of a HFI by
calculating specificity and sensitivity of the HFI. These researchers compared
participant and interviewer questionnaires, as well as pre- and post-test differences, and
used the same specificity and sensitivity definitions as Crockett and researchers. The
HFI had a sensitivity of 0.90 and a specificity of 0.97(33). This study reaffirmed that the
HFI was valid and was a sound tool to evaluate household food availability. In a similar
study, Marsh and coauthors assessed the validity of the self-reported availability of
vegetables, fruit, and fruit juices. A total of 48 parents of children in fourth through the
sixth grades completed a self-reported inventory that included three types of juices, 13
types of fruit, and 18 types of vegetables (34). Trained interviewers then completed the
HFI based on the actual foods present in the homes. Self-reports were compared to
interviewers’ reports of home food availability. The researchers found great
resemblance between the parents’ and interviewers’ reports (75.9%). They found a
sensitivity of 36.8% and a specificity of 39.1% for all fruits, juices, and vegetables.
These numbers were significant according to the Cohen Kappa agreement scale (p <

19
0.05). The researchers concluded that HFI for fruits, juices, and vegetables was valid
and an accurate tool for assessment of home food availability (34).
In a study by Fulkerson and colleagues, the authors took a different approach to
that of the previous researchers (35). They developed a 13-food category HFI, which
they validated in order to determine the availability of foods that they believed may
contribute to obesity. They tested the HFI using two samples. In the first sample, 6
researchers and 51 adult participants each completed the HFI. Information provided by
the participants was compared to the information gathered by the six researchers, to
check for accurate reporting. The second sample included parents and their children.
Children completed 24-hour-recalls and their parents completed the HFI and a Diet
History Questionnaire. The authors derived an obesogenic scale to assess obesogenic
home environments (35). The results of the study revealed that this HFI had a specificity
of 0.86-0.95 and a sensitivity of 0.69-0.89. Also, they observed that only about half of
the 24-hour–recalls had a significant relationship with the HFI scores (p <0.05).
However, they found that all of the Diet History Questionnaire results had a significant
relationship with HFI scores (p < 0.05). Fulkerson and colleagues agreed with the
previous authors that the HFI is a valid tool that can be used to assess the home food
environment (35).
Summary
Childhood obesity has reached epidemic levels in the U.S. Research has shown
that in addition to poor dietary intake and lack of physical activity, the environment may
be another major factor that has significantly contributed to the epidemic (1-9).

20
Environmental factors such as home food availability have been studied extensively and
have shown that a high availability of fruits, vegetables, snacks, soda, and dairy is
positively correlated with high consumption of these foods, which may potentially
influence children’s weight status (4-8, 23-25). One HFI (Appendix C), which consists of
a list of 80 food items to assess home food availability, has been validated by several
studies and may be used to identify accurately the foods that are and are not available
in the household. This study used this HFI to assess home food availability and its
relationship to children meeting fruit and vegetable and dairy recommendations and
their weight status.

21
Chapter III
Methods and Materials
Introduction
This study was a part of the Healthy Project, a larger study that collected data
from 2,800 finalists at the DestiNation Imagination© (DI) Global Finals, an annual event
on The University of Tennessee, Knoxville campus. Both the Healthy Project and this
subsequent study project were approved by the Institutional Review Board at The
University of Tennessee. The Healthy Project’s aim was to design and implement a
creative afterschool program in the effort to prevent childhood obesity. Participants in
grades 3-12 and their parents were asked to provide information on their demographics,
activity levels, dietary intake of selected food groups, perceived social status, and
weight maintenance and weight loss strategies. Child participants’ heights and weights
were measured and recorded by trained individuals, whereas parents’ heights and
weights were self-reported. In 2009, the Healthy Project collected data from 2,397 DI
finalists. However, this study will focus on 489 parent and child dyads who completed
onsite (children) and online (parents) surveys. This chapter will provide an overview of
the methods and materials used to collect and analyze the data.
Research Design & Participants
This study used a cross-sectional, observational research design to examine
whether or not a relationship existed between HFA and child weight status. From the
subset of 489 parent/child dyads that participated in 2009, data from a total of 489 child
participants and their parents were used in this study. In 2009, approximately 6,000
finalists attended that DI Global Finals, from which parental consents were obtained

22
from 2,991 participants. Parental consent forms were sent out to parents of participants
with the DI attendance package. Upon arrival to the University of Tennessee, Knoxville
(UTK) campus, parental consents forms were collected at the event registration. During
the DI Global Finals data were collected from 2,397 participants (response rate =
80.1%). Some participants, who had not presented at registration with a signed consent
form, were allowed to participate if they were with a parent or a legal guardian who
signed a parent consent form at one of the data collection sites. Once parental consent
was confirmed, the child participant received a four-digit identification code which was
placed on his or her badge the signed parent consent form, and the survey which also
contained the anthropometric data collection form.
After the completion of onsite data collection from child participants, a letter was
sent to their parents/guardians requesting parental participation in an online survey. The
letter included the same identification code as their participating child, which parents
used to log onto the online survey. The identification code enabled the researchers to
match the child participants to the parent participants.
Equipment and Tools
Youth Survey
The youth survey for child participants was formed using relevant questions from
the 2007 Youth Risk Surveillance Survey (YRBS) (37). The YRBS, an annually
conducted school-based survey, is conducted in collaboration with the Center for
Disease Control and Prevention (CDC) by various state, local, educational agencies.

23
The youth survey for this study asked questions regarding demographic information,
activity levels, sedentary behavior, dietary intake of selected food groups, and weight
loss methods (Appendix A). The following section will discuss the questions relevant to
this study.
Demographic Information Participants’ demographic information was collected
from the survey. Questions regarding their age, the month they were born in, their
grade, gender, years of DI participation, and race and ethnicity, were collected.
Dietary Habits Questions regarding participants’ dietary habits were asked as well.
Participants were asked to estimate how many times in the past seven days did they
eat/drink 100% fruit juice, fruits, vegetables, soda and milk (Appendix A)
Adult Survey
Questions for the adult survey were adapted from two sources: the Behavioral
Risk Factor Surveillance Survey (BRFSS) and the Home Shelf/Food Inventory (HFI)
(Appendix B). Similar to the YRBS, the BRFSS is a nationwide survey, but it is
administered to adults. Through the BRFSS, the CDC collects data on risky behaviors,
health precautions, and access to health care for chronic disease conditions. However,
this study only included questions from the BRFSS about adult participants’ current
height, weight, income, physical activity, sedentary behavior, and dietary intake of
selected food groups.
Home food availability was assessed using the HFI (Appendix C, a validated list
of 80 foods items. Subjects were asked to check a “yes” or “no” box next to each item,

24
indicating the presence or absence of a food item in the home at the time the survey
was completed. A copy of the HFI and permission to use it was obtained from Dr. Susan
Crockett. Dr. Crockett and colleagues developed and evaluated HFI in 1992 (33).
Anthropometric Measurements
After child assent was obtained from participants, the Seca S-882 strain gauge
digital scales and Seca S-214 Road Rod free-standing stadiometers were used to
collect child participants’ weights and heights. Prior to data collection, both the scale
and stadiometer were placed on a plank of wood to ensure that each station had a hard
and even surface. For the purpose of confidentiality the scale and stadiometers were
curtained off. Further, the scales were calibrated prior to data collection. Prior to data
collection, accuracy of the scales was checked by placing a 10lbs weight on each scale.
Prior to obtaining anthropometric measurements, participants were asked to remove
any excess clothing such as hats, jackets, shoes, wallets, and watches.
Height and weight measurement were conducted by trained individuals. Weight
measurements were taken twice, each to the nearest 1/10 of a pound. If the
measurements differed by more than 1/4 of a pound, then a third measurement was
taken. Averages of the two closest weight measurements were recorded. Similarly,
height measurements were taken twice, each to the nearest 1/8 of an inch. If
measurements differed more than a 1/4 of an inch from each other, a third
measurement was completed and averages of the two closest height readings were

25
recorded. Height and weight measurements were taken after the participant completed
the youth survey questions.
Procedure
Child Participants There were four data collection sites, which were strategically
placed in high traffic areas of the DI finals. When a child came to the data collection site,
the four-digit identification code was written on a survey/data collection form by a
trained individual. After verbal assent was obtained, the participant was asked to
complete the survey. Tables, chairs, and pencils were provided by the research team.
Designated team members were available to answer the participant’s questions about
the survey questions. After the participants completed the survey, they were asked to
move to another area of the data collection site for height and weight measurements. If
the participants assented, they were asked to remove extra clothing layers, hats, head
pieces, shoes, and items in the pockets. Heights and weights were measured per
protocol and then recorded on the last page of the survey, which served as the
anthropometric data collection form. Research assistants collected the survey, thanked
the children for participating in the study, and offered them complementary low fat milk
and a Healthy Project collectable pin.
Adult Participants When parents/guardians signed the parental consent forms,
they were asked to provide their mailing address. Within a week after the DI finals,
parents and guardians of participants received a letter that thanked them for allowing
the child to participate in the study and asked them to complete an online survey.
Parents were provided with the same identification codes that were provided to their

26
children at the finals. The adult surveys were uploaded to mrInterview, an online survey
management program (SPSS 17, 2009). Parents entered the website by using their
identification codes and answered survey questions. The data were directly entered into
a downloadable spreadsheet using the mrInterview program.
Variables
Z-Body Mass Index Scores (z-BMI) BMI z scores were the dependent variable
in this study. Prior to calculation of BMI z scores, BMIs were calculated using height and
weight of each individual child participant. BMI z scores were calculated using the BMI
percentile and a standard normal distribution table. Calculated z scores indicated the
deviation of the individual’s BMI from the mean BMI of the reference population.
Adult Body Mass Index (BMI) Adult BMI refers to the parent/guardian BMIs,
which were self-reported by parents/guardians. Adult BMI was hypothesized as a co-
variable in this study. Like child BMI, adult BMI is calculated by dividing weight in
kilograms by height in meters squared. A BMI of less18.5 is classified as underweight, a
BMI 18.5 – 24.9 is healthy weight, a BMI greater than 25.0 but less than 29.9 is
considered to be overweight and a BMI greater than 30.0 is considered to be obese.
Food Availability Adult participants were asked to fill out an 80-food item HFI.
The HFI is a tool that helps to identify the types of foods available within a household.
Adult participants were asked to check the “Yes” box if a food item was present within
their household at the time they were taking the survey or check the “No” box if it was
not present. The 80-item HFI was then broken into five groups: Dairy, Dressing,

27
Cereals, Baked Goods, Vegetables and Fruits. This break-down enabled the
researchers to look at selected food groups individually.
Food Fat Score Food Fat Score was an independent variable in this study,
which enabled researchers to evaluate whether the amount of fat content per serving of
each item in a food group correlates with child BMI z scores. Food Fat scores were
calculated by inputting each food item list into a nutrition analysis program known as
Nutrition Data System for Research (NDSR). NDSR was developed by the Nutrition
Coordinating Center at the University of Minnesota. NDSR utilizes the USDA’s nutrient
database as a reference and is periodically updated with data from new scientific
literature.
NDSR displays different forms in which that food is available. For example, bagels
can be available in many forms such as whole, white, sesame, and blueberry. In order
to calculate “fat score,” the researchers took the average of percent calories from fat per
serving of each option available and that became that food item’s “fat score.” If the
parent participant selected “yes” (food was present) then the item would be given the
“fat score” but if the parent participant selected “no” (food not present) then a score of 0
would be given for that food item. For example, if a participant selected “yes” for regular
mayonnaise, which contains 100% of calories per serving came from fat, the food item
(mayonnaise) was given a score of 100. If the participant selected “no” for this item,
then it was scored as 0.
Total Group Fat Scores Total Group Fat Score was an independent variable in
this study and was calculated by adding all of the Food Fat Scores of each food item in

28
each of the six food groups: Total Dairy Fat Score, Total Dressing Fat Score, Total
Cereal Fat Score, Total Baked Goods Scores, Total Vegetables Fat Score, and Total
Fruits Fat Score. Total Group Fat Scores were calculated for each participant.
Total Fat Score All fat scores for all 80 food items were summed to calculate a
Total Fat Score for each participant. A higher Total Fat Score corresponded to a higher
availability of high-fat foods in the household.
Food Fiber Scores This was an independent variable in this study. It enabled
researchers to evaluate whether the amount of fiber in grams per serving of each food
item on the HFI correlated with child BMI z scores. Like Food Fat Scores, Food Fiber
Scores were calculated by inputting each food item into NDSR. In order to calculate
“fiber score,” the researchers took the average of grams of fiber per serving of each
food option. If the participant selected “yes” (food was present) then the item was given
the fiber score, but if the participant selected “no” (food not present), then a score of 0
was given to the food item. For example, if a participant selected “yes” for regular Corn
Flakes, the item received a fiber score of 2.22, as the fiber content in a serving of Corn
Flakes is 2.22 g. If the participant selected “no,” then the food item was scored as 0.
Total Group Fiber Scores The Total Group Fiber Score was an independent
variable and was calculated by adding all the Food Fiber Scores of each food item in
the six food groups: Total Dairy Fiber Score, Total Dressing Fiber Score, Total Cereal
Fiber Score, Total Baked Goods Fiber Scores, Total Vegetables Fiber Score, and Total
Fruits Fiber Score. Total Group Fiber Scores were calculated for each participant.

29
Total Fiber Scores All fiber scores for all 80 food items were summed to
calculate a Total Fiber Score per participant. A higher Total Fiber Score corresponded
to a higher availability of high-fiber foods in the household.
Data Analysis
Four research questions were proposed in this study:
Question 1: Do Total Fat Score, Total Fiber Score, and Family income predict
child z-BMI score, while controlling for parent weight status?
The researchers predicted that the higher the Total Fat Score, the lower the Total Fiber
Score, and the lower the income, the higher the child weight status would be.
Question 2: If Total Fat and Fiber Scores significantly predict child z-BMI
scores, do any of the six Total Group Fat Scores and Total Group Fiber Scores predict
child z-BMI scores?
The researchers predicted that if Total Fat and Fiber Scores significantly correlated with
child z-BMI, then a significant correlation would be observed between the six Total
Group Fat Scores and child z-BMI and a significant relationship would be observed
between the six Total Fiber Score and child z-BMI.
Question 3: Do the Total Vegetable Fiber Score and Total Fruit Fiber Score predict
child z-BMI score?

30
The researchers predicted that a significant relationship would be observed between
Total Vegetable and Fruit Fiber Scores. The higher the Total Vegetable and Fruit Fiber
Score the lower the child z-BMI will be.
Question 4: Does the availability of fruits, vegetable and milk in participants’ homes
influence whether the participant consumed the recommended servings of these foods?
The researchers predicted that the higher the availability of vegetables, fruits, and milk
in a household, the more likely the child participant would be to meet the recommended
servings of these foods.
In order to answer the research questions proposed by this study, general
descriptive and multiple linear regression statistics were conducted. Data analysis was
performed using SPSS 17.0 statistical software for Windows. Significance for all
statistical analyses was set at p < 0.05.
Descriptive Statistics
Demographic characteristics including child participants’ age, gender, z-BMI
scores, as well as adult participants’ age, gender, BMI, and income, were summarized
using frequencies and means. In addition, analysis of the demographic variables was
conducted using appropriate parametric and non-parametric tests. If significant
differences existed, these differences were controlled in the multiple linear regression
analysis.
Whether a child participant met the USDA recommended servings of vegetables,
fruits and milk were calculated by using the YRBS survey questions. Questions on the

31
survey asked participants how often during the week prior did they eat a particular type
of vegetable, as well as fruits, and fruit juices. Similarly, participants were asked how
many glasses of milk they consumed in the past seven days. If a child participant
indicated that they ate five or more servings of fruits and vegetables per day, they were
classified as meeting the recommended servings of fruits and vegetables. If they
consumed less than five servings of fruits and vegetables per day, they were classified
as not meeting the recommended servings. Likewise, if child participants reported that
they drank three or more glasses of milk per day, they were classified as meeting the
recommended servings of milk and if not, they were classified as not meeting the
recommendation.
Statistical Analysis
Linear regression models show the relationship between the independent and
dependent variable. Regression analysis can be supported by a general formula y = f
(x), meaning y is a function of x. To elaborate, y depends on x, therefore x determines
the value of y. In other words, x would be the independent variable and y would be the
dependent variable. If a linear relationship exists between the x and y variables, an
equation determined by plotting x against y will describe the mathematical relationship
between the two variables. In this case, our independent variables were Total Fat
Scores, Total Group Fat Scores, Total Fiber Score, and Total Group Fiber Scores.
Parent BMI was a co-variable and the dependent variable was child z-BMI score.
Therefore, a multiple linear regression analysis was performed in order to explore
whether linear relationships exist between these variables.
32
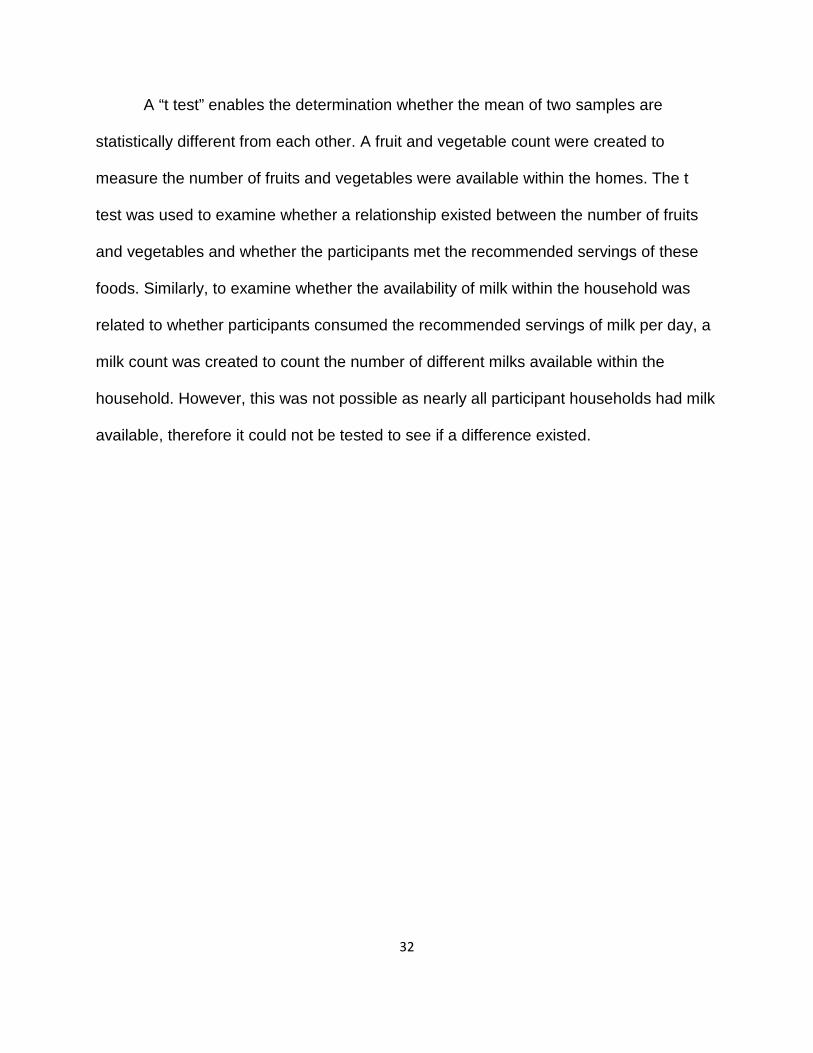
A “t test” enables the determination whether the mean of two samples are
statistically different from each other. A fruit and vegetable count were created to
measure the number of fruits and vegetables were available within the homes. The t
test was used to examine whether a relationship existed between the number of fruits
and vegetables and whether the participants met the recommended servings of these
foods. Similarly, to examine whether the availability of milk within the household was
related to whether participants consumed the recommended servings of milk per day, a
milk count was created to count the number of different milks available within the
household. However, this was not possible as nearly all participant households had milk
available, therefore it could not be tested to see if a difference existed.

33
Chapter IV
Results
As seen in Table 1, the mean age of the 489 child participants was 12.8 ± 1.7
years. Approximately, 93% of participants were non-Hispanic White while only 7% of
them reported to be of other races, which included non-Hispanic Black or African
American, American Indian, Alaskan native, native Hawaiian or Pacific Islander, and
Asian. There were a total of 258 (52.8 %) female participants and 231 (47.2 %) male
participants. The majority of participants attended middle school. As seen Table 2, the
majority of the participants were classified as normal weight (78.9%) (BMI percentile
<85th percentile), whereas only 1.8% were classified as underweight and approximately
12.5% and 6.7% of participants were classified as overweight (BMI percentile ≥85th
percentile and <95th percentile) or obese (BMI percentile ≥ 95th percentile),
respectively.
Table 3 displays the adult participant weight status and annual household income
distribution. Approximately 1% of parents were underweight (BMI <18), 52% were
normal weight (BMI > 18 but <25), 29% were overweight (BMI >25), and 18% were
classified as obese (BMI > 30). Further, less than 8% of parents reported a household
income of > $25,000 -$50, 000, 35% earned $ 50,001-$100,000, 30% earned $100,001-
$150,000, and 22% earned >$150,000.
Table 4 represents the number of child participants who consumed the recommended
five to six servings of fruits and vegetables per day in the week prior to data collection.
This table shows that 26% of the child participants consumed the recommended

34
Table 1. 2009 Healthy Project Child Participant Dem ographics for Parent/Child
Dyads.
N %
Overall 489 100.0
Age ( x̅, SD) 12.8 1.7
Gender
Female 258 52.8
Male 231 47.2
Race
Non-Hispanic White 455 93.0
Other* 34 7.0
School Ŧ
Elementary 29 5.9
Middle 319 65.2
High 140 34.9
Weight Status x SD
Child z-BMI 0.24 0.92
*Includes: non-Hispanic Black or African American, American Indian, Alaskan native, native Hawaiian or Pacific Islander, and Asian.Ŧ Elementary includes 4-5th grade; Middle includes 6-8th grade; High includes 9-12th grade.

35
Table 2. 2009 Healthy Project Child Participant Wei ght Categories by Gender and
School Level for Parent/Child Dyads.
Underweight Normal Weight Overweight Obese
N % N % N % N %
Total 9 1.8 386 78.9 61 12.5 33 6.7
Gender
Female 5 1.9 206 79.8 29 11.2 18 7.0
Male 4 1.7 180 77.9 32 13.9 15 6.5
School
Elementary 1 3.4 26 89.7 1 3.4 1 3.4
Middle 4 1.3 248 77.7 42 13.1 25 7.8
High 4 2.9 112 80.0 17 12.1 7 5.0

36
Table 3. 2009 Healthy Project Parent Participant De mographics for Parent/Child
Dyads.
N %
Parent Weight Status
Underweight 5 1.0
Normal weight 254 51.9
Overweight 140 28.6
Obese 90 18.4
Income
Less than $25,000 - $50,000 35 7.1
$50,001 – $100,000 169 34.6
$100,001 – $150,000 147 30.1
More than $150,000 105 21.5
Missing 21 4.3

37
Table 4. . Percent of 2009 Healthy Project Child Pa rticipants (from Parent/Child
Dyads) Who Met Recommended Servings of Fruits and V egetables and Milk in the
Week Prior to Global Finals
Met recommended servings of 5 or more servings of fruits and
vegetables N %
Total 128 26.0
Female 68 26.4
Male 60 26.0
Met recommended 3 or more servings of milk
N %
Total 83 17.0
Female 35 13.6
Male 48 20.8

38
servings of fruits and vegetables. A total of 26.4% of female participants consumed 5 or
more servings of fruits and vegetables per day in the past 7 days. Whereas, 26% their
male counterparts consumed the same.
Similarly, this study looked at child participants who consumed more than three
glasses of milk per day for the week prior to the data collection. Approximately 17% of
participants met the recommendations. Further, 13.6% of middle and high school
female participants consumed more than three glasses of milk per day in the week prior
to data collection, but male participants tended to consume more milk than their female
counterparts.
Table 5 describes the types of milk that were available in participants’
households. From a total of 487 participants, 9% reported having whole milk available,
35% reported having 2% milk available, 36% reported having 1% milk available, and
43% reported having fat-free (skim) milk available in their households. Table 5 indicates
that most all of the participants reported having some type of milk available to them. The
least number of participants (9%) reported having whole milk available, while the
greatest number of participants (43%) reported having skim milk.
Further, Table 5 represents the types of vegetables that are available in
participant households as reported by parents. The table is sorted from the least
available to the most available vegetable. Table 5 shows that fresh carrots were
reported to be in 80% of homes, as were frozen corn and frozen peas. The least
available vegetables were brussels sprouts, fresh peas, and cabbage. Also, compared
to fresh vegetables, the results showed that frozen vegetables were more readily

39
Table 5. Percent of 2009 Healthy Project Participan t Households (from
Parent/Child Dyads) that Have Milk, Vegetables and Fruits Available
N %
Total Participant Households 487 100
Milk
Whole Milk 46 9
2% Milk 169 35
1% Milk 174 36
Skim Milk 208 43
Frozen Vegetables
Frozen Brussels Sprouts 64 13
Frozen Cauliflower 108 22
Frozen Carrots 126 26
Frozen California Blend 168 34
Frozen Spinach 178 36
Frozen Broccoli 258 53
Frozen Mixed Vegetables 300 61
Frozen Peas 343 70
Frozen Corn 351 72

40
Fresh Vegetables
Brussels Sprouts 44 9
Peas 98 20
Cabbage 99 20
Cauliflower 128 26
Spinach 190 39
Corn 210 43
Broccoli 293 60
Carrots 419 86
Fruits
Grapefruit 97 20
Pears 124 25
Oranges 253 52
Blueberries 265 54
Strawberries 389 80
Bananas 417 85
Apples 439 90

41
available in participants’ households. Also, Table 5 shows the types of fruits available in
participant households. Apples and bananas were available in the largest number of
households, while grapefruit and pears were the least available.
Table 6 shows the mean and SD total fat and fiber scores as well as group fat
and fiber scores. For Total Fat Score the mean per household was 990 and had a SD of
244. The data showed that the Total Fiber Score mean per household was 58 and the
SD was 19.
Through the use of linear regression it was found that parent weight status did
seem to have a moderate correlation with child z-BMI (α=0.00). However, by using
multiple linear regression no significance relationship was found between Total Fat
Score, Total Fiber Score, and Family income and child z-BMI while controlling for parent
weight status. No significance was found between Total Fat and Fiber scores and child
z-BMI. Hence no significance was found between Total Group Fat and Total Group
Fiber score (the six groups were: Dairy, Dressing, Cereal, Baked Goods, Vegetables,
and Fruits) and child z-BMI score. No significance was found between Total Vegetable
and Fruit Fiber scores and child z-BMI scores. Therefore, the value of the Total
Vegetable Fruit Fiber score did not influence the participant’s weight status. Through t
test it was found that there was no significant association between the availability of
fruits and vegetables meeting recommendations for these food. A Mann-Whitney test
was not run because only 3 households reported not having any type of milk available
within the household. Therefore, it was not possible to compare participants who met
recommendations with those who did not meet recommendations.

42
Table 6. 2009 Healthy Project Participant Household s (from Parent/Child Dyads)
Total Fat Scores, Total Group Fat Scores, Total Fib er Scores, and Total Group
Fiber Scores
Fat Score x SD
Total Fat Score 990 244
Total Vegetable Fat Score 42 19
Total Fruit Fat Score 17 7
Total Dairy Fat Score 369 120
Fiber Score
Total Fiber Score 58 19
Total Vegetable Fiber Score 8 4
Total Fruit Fiber Score 8 3

43
Chapter V
Discussion
Prevalence of Overweight/Obesity
According to NHANES data from 2007-2008, 16% of children ages 6-19 years
were overweight and 18.7% were obese (34.7% were overweight/obese). Compared to
national rates of overweight and obesity, only a small proportion of the child participants
in this study were classified as overweight or obese (19.2%), of which 12.5% were
overweight and 6.7% were obese.
Compared to the national statistics of overweight and obesity among females
aged 6-19 years, female participants in this study were leaner. In 2009, nationwide
16.8% and 17.3% of females were classified as overweight and obese, respectively,
whereas in this study only 11.2% and 7% of females were overweight and obese,
respectively (11, 39). Similar to national prevalence trends, in this study, the prevalence
of overweight among female participants tended to be lower than male participants in
this study. However, the prevalence of male overweight and obesity among participants
in this study was lower than the national averages. Nationwide, 15.2% of males, aged 6-
19 years, were overweight and 20.1% were obese compared to this study, which
showed that only 13.9 % of male participants were overweight and 6.5% were obese.
Dietary Behaviors
In this study, participants’ vegetable, fruit, and milk consumption was investigated
by a survey using questions taken from the YRBS survey. At this time, the YRBS survey

44
is only distributed at the high school level. However, there is not another national survey
that includes middle school respondents. Thus, for the purpose of discussion, the data
in this study, which includes both middle and high school age participants, will be
compared to the 2009 high school YRBS data.
According to YRBS 2009, only 22.3% of 9-12th graders consumed five or more
fruits and vegetables (100% fruit juices, fruit, green salad, potatoes [excluding French
fries, fried potatoes, or potato chips], carrots, or other vegetables) per day during the
seven days prior to the survey (39). According to national trends, female adolescents
consumed less fruits and vegetables (20.5%) whereas, 23.9% of male adolescents
consumed five or more servings of fruits and vegetables per day during the seven days
prior to the survey (39). However, in this study a total of 26% of middle and high school
participants consumed fruits and vegetables five or more times per day during the
seven days prior to the survey, which was slightly higher than the national average.
Unlike national trends, both male (26.0%) and female (26.4%) adolescents
proportionally consumed approximately the same amount of fruits and vegetables.
This study assessed milk consumption among middle and high school students
as well. According to the YRBS 2009 data, a total of 14.5% of 9-12th graders consumed
three or more glasses per day of milk during the seven days prior to the survey (39).
Overall, results showed that participants in this study consumed more milk than national
data. It is important to note that the DI finals were sponsored by the National Dairy
Council that provided free milk to participants at the finals, which could have potentially
influenced results. However, the results showed that a total of 17.0% of middle and high

45
school participants consumed three or more glasses of milk per day during the week
prior to data collection. Nationwide, male adolescents tended to consume more milk
(19.8%) per day compared to their female counterparts (8.7%). A similar trend was
observed in this study as well, as male participants tended to consume more milk per
day than females did (20.8% and 13.6%, respectively). However, female participants in
this study consumed more milk per day than female adolescents nationwide.
Overall, both the national survey data and this study data show that respondents
did not consume the recommended servings of fruit, vegetables and milk. However,
compared to YRBS 2009 results, the participants in this study consumed more fruits,
vegetables and milk on a daily basis in the week prior to data collection.
Home Availability
Several studies have shown that the availability of fruits, vegetables and dairy
products in the household significantly predicts the consumption of these products by
family members (4-8). However, many of these studies had small sample sizes and
failed to discuss the types of foods that were actually available within the households.
This study is unique as it had a large sample size and identified the types of food
available to the participants in their households that may influence their dietary intake.
In this study, there was a high availability of fresh and frozen vegetables.
However, it was observed that in these households frozen vegetables were
predominantly available. Except for the availability of fresh carrots and broccoli, three of
the five most available vegetables were frozen mixed vegetables, frozen peas, and
frozen corn. In a pilot study by Sisk and colleagues, which looked at home food

46
availability over a 30-day period in nine households, the most common types of fresh
vegetable, were lettuce and carrots (41). Also, in this study, the most commonly
available frozen vegetables were corn, peas, mixed, and broccoli. Similarly in the study
by Sisk, the researchers found that mixed frozen vegetables was one of the most
commonly available vegetables. However, unlike the current study one of the least
available frozen vegetables was corn. In a study by Morland and Filemena, which
studied 50% of stores, and fruit and vegetable markets in two Brooklyn Community
Districts, found that frozen vegetables were readily available in all neighborhoods. Fruits
and vegetables were more readily available in racially diverse neighborhoods (42). Even
though there is no difference nutritionally between fresh and frozen vegetables, it was
an interesting observation of this study and Morland’s study that frozen vegetables were
more available in household and neighborhoods compared to fresh vegetables (42).
This availability may be attributed to several reasons, such as convenience,
affordability, store availability even though it may not be in season, accessibility, and
shelf life (42). The most common type of fresh fruits available were apples and bananas
and the least common type of fruit available was grapefruit. These findings show
consistently that apples and bananas were the most common types of fresh fruit
available.
A large proportion of participant households had milk available in them. The
majority of participant households had low-fat milk available (skim and 1% milk), and a
lower proportion had 2% and whole milk. In the study by Sisk, the researchers found
that approximately half of their participants had whole milk available and the other half
had low fat milk available over a 30-day period (41).

47
Interaction between home food availability and dietary behavior
Dietary behavior can vary dramatically, as it can be influenced by multiple factors
such as personal beliefs as well as environmental factors such as the availability and
accessibility of particular foods (43). Several studies have found that the availability of
these foods in the household significantly influences the intake of these food items (4-
8). Despite the findings of these studies, in this study a significant relationship between
the availability of fruits, vegetables, and milk, and the reported intake of these foods was
not observed, even though participants reported consuming more servings of fruits and
vegetables compared to YRBS 2009 data participants (40).
There could multiple reasons that could explain the findings of this study. A
strong relationship may not have been observed between home food availability and
dietary behaviors because this study did not focus on other factors that may influence
children’s dietary behaviors such as parental eating behaviors, foods served at family
meals, foods consumed away from home, especially at school, and soft drinks available
in the home.
Studies by Hanson and colleagues and Arcan and colleagues found that
availability of healthier foods in the household did not influence child intake unless
parents modeled eating healthier foods and offered and encouraged them at meal times
(4, 6). Similarly, a study done with 366 middle schools students found that the
consumption of vegetables, fruits, and milk increased when children observed parents
consuming these foods (44). Further, according to Videon and Manning, in addition to
seeing their parents as role models, children often associate family meals with healthful
eating behavior (45). However, due to the increasing number of households where both

48
parents work, family meals have become less frequent. However, the importance of
family meals cannot be underestimated. The study by Videon and Manning revealed
that adolescents who ate meals with a parent present more than three times a week
were at a lower risk of poor consumption of fruits, vegetables and dairy (45). The
current study did not look at parental dietary behavior and foods served at family meals,
which could explain why a correlation between home availability and intake was found
to be weak.
Due to time constraints families are finding it difficult to consume home-prepared
meals together, fast foods provide an easy and affordable alternative (46). However,
studies have shown that fast food tends to be energy dense, higher in fat, sugar content
and lower in nutrients (46). In a study by Boutelle and colleagues, researchers found
that children whose parents reported eating fast food more than three times per week
more likely to report the availability of soda, pop and chips within the home (46). The
presence of soda within the household has been suggested by Arcan and colleagues to
be strongly be correlated with its intake, which is inversely related to the intake of milk
(6). On the other hand, the study by Boutelle revealed that families who did not report
the purchase of fast food were more likely to have fruit, vegetables, and dairy present
within their household and were more likely to report these foods being served at family
meals (46). As mentioned earlier, adolescents were more likely to report a higher
consumption of fruits, vegetables and dairy when present at family meals. The current
study did not look at foods available or consumed by the participants outside the home,
which could also explain the weak correlation between foods within the home and the
dietary intake of these foods and child weight status.

49
Schools are another location where children obtain and consume meals away
from home. Schools are the primary place where children spend the majority of their
time and on average consume at least one meal at school (47). Approximately, 31
million children participate in the National School Lunch Program each day, and despite
being obligated to adhere to the Dietary Guidelines for Americans, a recent study
revealed that nearly half the children who consume school lunches also consume too
much energy and do not consume enough micronutrients (30, 47). Also, schools
provide students access to competitive foods such as sodas and other beverages and
snacks in vending machines and school stores (30). In one noteworthy study, the
results showed that consumption of soda was indirectly proportional to the intake of milk
(6). Hence, the availability of different types of foods in the school environment can
strongly influence children’s dietary behaviors, And so, in this study, a significant
relationship between the home availability of fruits, vegetables, and milk and dietary
behaviors was not observed.
Overall, as described by numerous studies (4-36), a child’s diet can be
influenced by multiple factors. It seems that in this study, that availability of foods in the
household does not predict dietary intake. However, dietary intake can be strongly
influenced by parent modeling, availability of foods at family meals, and meals
consumed away from home in the form of fast food or school meals. Therefore, future
research could try incorporating key areas that have been demonstrated by others to
strongly influence children’s diet.

50
Interaction home food availability and weight status
Studies have shown that a high home availability of high-fat, low-fiber foods
(whole milk, potato chips, candy) was correlated with higher weight status among
children. Similarly, a high availability of low-fat, high- fiber foods (fruits, vegetables,
legumes) was associated with lower weight status children (5, 7, 48-49). The findings of
the current study with DI participants were not consistent with the findings of previous
studies. A significant relationship between the home availability and weight status was
not observed. As discussed earlier, participants’ food intake may be influenced by
parents’ dietary behaviors, family meals, and foods consumed away from home, all of
which can potentially affect weight status. In addition to these factors, a child’s home
physical activity environment can influence weight status. A previous study conducted
with DI participants in 2008 revealed that these participants tended to be moderately to
vigorously active on a daily basis, which was also associated with participants’ weight
status (50). High levels of physical activity can negate the calories consumed, and thus
not influence weight status. The current study did not look at physical activity levels in
relationship to weight status and home food availability. However, this may have been
a covariate that influenced the findings of this study.
Limitations, strengths and future research
In this study, there were a number of limitations. Primarily, this study was cross-
sectional, in that it represents a snap shot in time, and may not have represented what
is typical of participants’ dietary behaviors and home food environments. The survey
questions, which were derived from the YRBS survey, required participants to report the
quantity of fruits, vegetables and milk consumed in the week prior to DI finals and

51
travelling, which may have led to participants reporting food that may not be typically
consumed. Further, the overall response rate of 39.9% reflects that some DI
participants chose not to participate in this study (50). This may have resulted in
researchers not acquiring information from parents and guardians who could be
potentially overweight and who did not wish for their children to participate. Further,
there were a number of children who received parental consent, but chose not to
participate at the data collection site. Again, this may have caused researchers not to
collect information from children who were comparatively overweight and had
unhealthier behaviors compared to their healthier counterparts (50).
Another limitation of this study was that home food availability was self-reported
by parents and guardians, without direct objective measures, meaning that there was no
method of evaluating the accuracy of the reported item. Therefore, misreporting of foods
could have been possible, so that food items were reported present might not have
been actually present, and so that foods that were present were not reported as present
within the household. Further, information on the types and quantities of foods that are
typically consumed by children away from home was not asked. Of course, this too
could have been a significant contributing factor to participants’ food intake and weight
status.
There were several strengths in this study, including a large sample size for
which heights and weights were measured and recorded by trained individuals. This
study was unique, as it compared data collected from parent and child dyads, parent
weights were compared to their child’s measured weight. Further, this study is the first

52
of its kind that describes the types of foods that were available in the households of 489
U.S. middle and high school children. For the purposes of future research, researchers
would recommend including measures for parental dietary behaviors, family meals,
soda availability at home, participants’ physical activity level, participants’ sedentary
behavior, as well as parents’ physical activity level.

53
References

54
1. Center of Disease Control and Prevention. Childhood Overweight and Obesity.
Overweight and Obesity 2009; Childhood Obesity rates. Available at:
http://www.cdc.gov/obesity/childhood/index.html. Accessed 8th June, 2009.
2. Tennessee Department of Education and Office of Coordinated School Health.
Childhood Obesity Fact Sheet page. Available at:
http://state.tn.us/education/schoolhealth/overweight/doc/ChObesityFactSheet.pdf
. Accessed 29th October, 2009.
3. Daniels SR. The Consequences of childhood overweight and obesity. The Future
of Children. 2006;16:47-67.
4. Arcan C, Hannan P, Van der Berg P. Parental eating behaviors, home food
environment and adolescent intakes of fruits, vegetables and dairy foods:
longitudinal findings from Project EAT. Public Health Nutrition. 2007;10(11):1257-
1265.
5. Campbell KJ Crawford DA, Salmon J, Carver A, Garnett SP, Baur LA.
Asssocitations between the home food environment and obesity-promoting
eating behaviors in adolescence. Obesity. 2007;15(3):719-730.
6. Hanson N, Neumark-Sztainer D, Eisenberg ME, Story M, Wall M. Associtions
between parental report of the home food environment and adolescent intakes of
fruits, vegetables and dairy foods. Public Health Nutrition. 2004;8(1):77-85.
7. Rosenkranz RR, Dzewaltowski D. Model of the home food environment
pertaining to childhood obesity. Nutrition Reviews. 2008;66(3):123-140.
8. Spurrier NJ, Magarey AM, Golley R, Curnow F, Sawyer MG. Relationships
betweent the home food environment and physical activity and dietary patterns of
55
preschool children: a cross-sectional study. International Journal of Behavioral
Nutrition and Physical Activity. 2008;5(31).
9. Center of Disease Control and Prevention . About the National Health and
Nutrition Examination Survey. 2009. Accessed 13th July, 2009.
10. Center of Disease Control and Prevention . Youth Risk Behaviroal Survey :
Background 2008. Accessed 13th July 2009.
11. Ogden CL, Carroll MD, Curtin LR, McDowell MA, Tabak CJ, Flegal KM.
Prevalence of overweight and obesity in the United States, 1999-2004. JAMA.
Apr 5 2006;295(13):1549-1555.
12. Wang Y, Zhang Q. Are American children and adolescents of low socioeconomic
status at increased risk of obesity? Changes in the association between
overweight and family income between 1971 and 2002. American Journal of
Clinical Nutrition. 2006;84:707-716.
13. Alaimo K, Olson CM, Frongillo EA,. Low Family Income and Food Insufficiency in
Relation to Overweight in US Children: Is There a Paradox? Archives of Pediatric
and Adolescent Medicine. 2001;155:1161-1167.
14. World Health Organization. What causes obesity and overweight? Obesity and
overweight 2009; http://www.who.int/mediacentre/factsheets/fs311/en/index.html,
2009.
15. Schmidt CW. Obesity: A weight issue. Environmental Health Perspectives.
2003;111(13):A 701- A 707.

56
16. Johnson L, Mander AP, Jones LR, Emmett PM, Jebb SA. Energy-dense, low-
fiber, high-fat dietary pattern is associated with increased fatness in childhood.
Amer. J. Clin Ntr. 2008;87:846 –854.
17. Dennison BA, Birch LL, Daniels SR, Gilman MW, Lichtenstein AH, Rattay KT,
Steinburg J, Stettler N, Horn LV. Dietary Recommendations for Children and
Adolescents: A Guide for Practitioners. Pediatrics. 2006;117:544-559.
18. Nicklas TA, Baranowski T, Zakeri I, Berenson G. Eating Patterns and Obesity in
Children: The Bogalusa Heart Study. Amer J. Prev Med. 2003;25(1):9-16.
19. Center of Disease Control and Prevention. Youth online: Comprehensive
Results. 2007; Who ate fruits and vegetables five or more times per day during
the 7 days before the survey. Available at:
http://apps.nccd.cdc.gov/yrbss/SelectLocyear.asp?cat=5&Quest=508. Accessed
June 2009.
20. Newby PK. Plant foods and plant-based diets: protective against childhood
obesity?. Am J Clin Nutr. 2009;89:1572S-1587S.
21. Lakkakula AP, Zanovec M, Silverman L, Murphy E, Tuuri G. Black Children with
High Preferences for Fruits and Vegetables Are at Less Risk of Being at Risk of
Overweight or Overweight. JADA. 2008;108:1912--1915.
22. Langevin DD, Kwiatkowski C, McKay G, Maillet JO, Touger-Decker R, Smith
JK, Perlman A. Evaluation of Diet Quality and Weight Status of Children from a
Low Socioeconomic Urban Environment Supports “At Risk” Classification. JADA.
2007;107:1973-1977.

57
23. Malik VS, Matthias B, Hu FB. Intake of sugar-sweetened beverages and weight
gain: a systematic review. Am J Clin Nutr. 2006;84:274-288.
24. The Center for Disease Control and Prevention. Percentage of students who
drank a can, bottle, or glass of soda or pop (not including diet soda or diet pop) at
least 1 time per day during the seven days before the survey. Available at:
http://apps.nccd.cdc.gov/yrbss/QuestYearTable.asp?path=byHT&ByVar=CI&cat=
5&quest=Q78&year=2007&loc=XX. Accessed September 2008.
25. Gillis LJ, Bar-Or O. Food away from home, sugar-sweetened drink consumption
and juvenile obesity. J the Amer College of Nutr. 2003,22(6): 539–545
26. Ebbeling CB, Feldman HA, Osganian SK, Chomitz VR, Ellenbogen SJ, Ludwig
DS. Effects of decreasing sugar-sweetened beverage consumption on body
weight in adolescents: a randomized, control pilot study. Pediatrics. 2006, 117:
673-680
27. Rey-Lo´pez JP, Vincente-Rodriguez G, Biosca M, Moreno LA. Sedentary
behaviour and obesity development in children and adolescents. Nutrition,
Metabolism & Cardiovascular Diseases. 2008;18:242.
28. Wong SL, Leatherdale S. Association Between Sedentary Behavior, Physical
Activity, and Obesity: Inactivity Among Active Kids. Preventing Chronic Disease
Public Health Research, Practice, and Policy. 2009;6(1):1-13.
29. Purslow LR Hill C, Saxton J, Corder K, Wardle J. Differences in physical activity
and sedentary time in relation to weight in 8-9 year old children. International
Journal of Behavioral Nutrition and Physical Activity. 2008;5(67).

58
30. Savage J, Fisher J, Birch LL. Parental Influence on Eating Behavior: Conception
to Adolescence. J Law Med Ethics. 2007;35(1):22-34.
31. Birch L. Influences on the development of children's eating behavior from infancy
to adolescence. Can J Diet Pract Res. 2007, 68(1): s1-s56.
32. Addessi E, Galloway AT,Visalberghi E, Birch LL. Specific social influences on the
acceptance of novel foods in 2-5-year old children. Appetite. 2005, 45:264-271.
33. Crockett SJ, Potter JD, Wright MS, Bacheller A. Valdation of a self-reported shelf
inventory to measure food purchase behavior. JADA. 1992;92(6):694-697.
34. Miller C, Edwards L. Development and validation of a shelf inventory to evaluate
household food purchases among older adults with diabetes mellitus. J. Nutr
Education and behavior. 2002;34(1):261-267.
35. Marsh T Cullen KW, Baranowski T. Validation of fruit, juice, and vegetable
availabilty questionnaire. J. Nutr Education and behavior. 2003;35(100):100-104.
36. Fulkerson JA, Nelson MC, Lytle L, Moe S, Heitzler C, Pasch KE. The validation
of a home food inventory. Methodology. 2008;5(55).
37. The Center for Disease Control. Youth Risk Behavior Surveillance System home
page. Available at: http://www.cdc.gov/HealthyYouth/yrbs/index.htm. Accessed
June 2009.
38. The Center for Disease Control. The Behavioral Risk Factor Surveillance System
home page. Available at: http://www.cdc.gov/HealthyYouth/yrbs/index.htm.
Accessed June 2009.

59
39. The Center for Disease Control and Prevention. Note on the 2007-2008 Data
Documentation. Available at:http://www.cdc.gov/nchs/nhanes/nhanes2007-
2008/datadoc_changes_0708.htm. Accessed October 9, 2010.
40. Department of Health and Human Services. Youth Risk Behavior Surveillance-
United States, 2009. MMWR. 2010; 55(SS-5): 1-148.
41. Sisk C, Sharkey JR, McIntosh WA, Anding J. Using multiple household food
inventories to measure food availability in the home over 30 days: a pilot study.
Nutr J. 2010; 9(19):2-12.
42. Morland K, Filomena S. Disparities in the availability of fruits and vegetables
between racially segregated urban neighborhoods. Public Health Nutrition. 2006;
10(12): 1481-1489.
43. Cullen KW, Baronowski T, Owens E, Marsh T, Rittenberry L, Moor CD.
Availability, accessibility, and preferences for fruit, 100% fruit juice, and
vegetables influence children’s dietary behavior. Health Education & Behavior.
2003; 30(5):615-626.
44. Young EM, Fors SW, Hayes DM. Association between perceived parent
behaviors and middle school student fruit and vegetable consumption. J. Nutr
Edu Behav. 2004; 36: 2-12.
45. Videon TM, Manning CK. Influences on adolescent eating patterns: The
importance of family meals. J Adolescent Health. 2003; 32:365-373.

60
46. Boutelle KN, Fulkerson JA, Neumark-Sztainer D, Story M, French SA. Fast food
for family meals: relationships with parent and adolescent food intake, home food
availability and weight status. Public Health Nutrition. 2005; 10(1): 16-23.
47. United States Department of Agriculture and Food and Nutrition Service. National
School Lunch Program. Available at: http://www.fns.usda.gov/cnd/lunch/.
Accessed 12th October 2010.
48. Hummenikova L, Gate GE. Social and physical environment factors and child
overweight in a sample of American and Czech school-aged children: a pilot
study. J Nutr Educ Behav. 2008;40:251-257
49. Blanchette L, Brug J. Determinants of fruit and vegetable consumption among 6-
12-year-old children and effective interventions to increase consumption. Journal
Human Nutrition and Dietetics. 2005; 18 (6): 413-443.
50. Murren J. Physical Activity, Sedentary, and Dietary Behaviors Related to
Overweight/Obesity among Adolescents Involved in a Creative, Problem-
Solving Program. The University of Tennessee, Knoxville. 2009.

61
Appendices

62
Appendix A
5th Grade
& Under
1. What grade will you be going into next year?
o 3rd o 4th o 5th
2. In what month were you born?
o January o February o March o April o May o June o July o August o September o October o November o December
3. In what year were you born?
o 1998 o 1999 o 2000
4. What is your gender? o Girl o Boy
5. Are you Hispanic or Latino?
o Yes o No
6. What is your race? (Select one or
more responses.) o American Indian or Alaska
Native o Asian o Black or African American o Native Hawaiian/Other
Pacific Islander o White
7. Including this year, how many years
have you participated in DI®? o 1 year (My first year) o 2 years o 3 years o 4 years o 5 or more years

63
Appendix A
6th Grade Survey Instructions
This survey is about health behavior. The information you give will be used to develop better health education for young people like yourself.
DO NOT write your name on this survey. The answers you give will be kept private. No one will know what you write. Answer the questions based on what you really do.
Completing the survey is voluntary. If you don’t want to answer a question, just leave it blank. The questions that ask about you specifically will only be used to describe the types of young people completing this survey. The information will not be used to find out your name.
Make sure to read every question. Fill in the circles
completely. When you are finished, follow the
instructions of the person giving you the survey.
Thank you very much for your help.
1. How old are you?
DIRECTIONS
• Use a #2 pencil only.
• Make dark marks.
• Fill in a response like this:
• If you change your answer, erase your old answer completely.

64
o 9 years old or younger
o 10 years old
o 11 years old
o 12 years old
o 13 years old
2. In what month were you born?
o January
o February
o March
o April
o May
o June
o July
o August
o September
o October
o November
o December
3. In what year were you born?
o 1996
o 1997
o 1998
o 1999
o 2000
o 2001
4. What is your sex?
o Female
o Male

65
5. What grade will you be going into next year?
o 6th grade
6. Including this year, how many years have you participated in Destination ImagiNation®?
o 1 year (My first year)
o 2 years
o 3 years
o 4 years
o 5 or more years
7. Are you Hispanic or Latino?
o Yes
o No
8. What is your race? (Select one or more responses.)
o American Indian or Alaska Native
o Asian
o Black or African American
o Native Hawaiian or Other Pacific Islander
o White
The next 7 questions ask about a different subject.
9. How do you describe your weight?
o Very underweight
o Slightly underweight
o About the right weight

66
o Slightly overweight
o Very overweight
10. Which of the following are you trying to do about your weight?
o Lose weight
o Gain weight
o Stay the same weight
o I am not trying to do anything about my weight
11. During the past 30 days, did you exercise to lose weight or to keep from gaining weight?
o Yes
o No
12. During the past 30 days, did you eat less food, fewer calories, or foods low in fat to lose weight or to keep from gaining weight?
o Yes
o No
13. During the past 30 days, did you go without eating for 24 hours or more (also called fasting) to lose weight or to keep from gaining weight?
o Yes
o No

67
14. During the past 30 days, did you take any diet pills, powders, or liquids without a doctor's advice to lose weight or to keep from gaining weight? (Do not include meal replacement products such as Slim Fast.)
o Yes
o No
15. During the past 30 days, did you vomit or take laxatives to lose weight or to keep from gaining weight?
o Yes
o No
The next 5 questions ask about your physical activi ty.
16. During the past 7 days, on how many days were you physically active for a total of at least 60 minutes per day ? (Add up all the time you spend in any kind of physical activity that increases your heart rate and makes you breathe hard some of the time.)
o 0 days
o 1 day
o 2 days
o 3 days
o 4 days
o 5 days
o 6 days
o 7 days
17. On an average school day, how many hours do you watch TV?
o I do not watch TV on an average school day
o Less than 1 hour per day

68
o 1 hour per day
o 2 hours per day
o 3 hours per day
o 4 hours per day
o 5 or more hours per day
18. On an average school day, how many hours do you play video or computer games or use a computer for something that is not school work? (Include activities such as Nintendo, Game Boy, PlayStation, Xbox, computer games, and the Internet.)
o I do not play video or computer games or use a computer for something that is not school work
o Less than 1 hour per day
o 1 hour per day
o 2 hours per day
o 3 hours per day
o 4 hours per day
o 5 or more hours per day
19. In an average week when you are in school, on how many days do you go to physical education (PE) classes?
o 0 days
o 1 day
o 2 days
o 3 days
o 4 days
o 5 days
20. During the past 12 months, on how many sports teams did you play? (Include any teams run by your school or community groups.)

69
o 0 teams
o 1 team
o 2 teams
o 3 or more teams
The next 8 questions ask about food you ate or dran k during the past 7 days. Think about all the meals and snacks you had from the time you got up until you went to bed. Be sure to include food you ate at home, at school, at rest aurants, or anywhere else.
21. During the past 7 days, how many times did you drink 100% fruit juices such as orange juice, apple juice, or grape juice? (Do not count punch, Kool-Aid, sports drinks, or other fruit-flavored drinks.)
o I did not drink 100% fruit juice during the past 7 days
o 1 to 3 times during the past 7 days
o 4 to 6 times during the past 7 days
o 1 time per day
o 2 times per day
o 3 times per day
o 4 or more times per day
22. During the past 7 days, how many times did you eat fruit ? (Do not count fruit juice.)
o I did not eat fruit during the past 7 days
o 1 to 3 times during the past 7 days
o 4 to 6 times during the past 7 days
o 1 time per day
o 2 times per day
o 3 times per day
o 4 or more times per day

70
23. During the past 7 days, how many times did you eat green salad ?
o I did not eat green salad during the past 7 days
o 1 to 3 times during the past 7 days
o 4 to 6 times during the past 7 days
o 1 time per day
o 2 times per day
o 3 times per day
o 4 or more times per day
24. During the past 7 days, how many times did you eat potatoes ? (Do not count French fries, fried potatoes, or potato chips.)
o I did not eat potatoes during the past 7 days
o 1 to 3 times during the past 7 days
o 4 to 6 times during the past 7 days
o 1 time per day
o 2 times per day
o 3 times per day
o 4 or more times per day
25. During the past 7 days, how many times did you eat carrots ?
o I did not eat carrots during the past 7 days
o 1 to 3 times during the past 7 days
o 4 to 6 times during the past 7 days
o 1 time per day
o 2 times per day
o 3 times per day

71
o 4 or more times per day
26. During the past 7 days, how many times did you eat other vegetables ? (Do not count green salad, potatoes, or carrots.)
o I did not eat other vegetables during the past 7 days
o 1 to 3 times during the past 7 days
o 4 to 6 times during the past 7 days
o 1 time per day
o 2 times per day
o 3 times per day
o 4 or more times per day
27. During the past 7 days, how many times did you drink a can, bottle, or glass of soda or pop, such as Coke, Pepsi, or Sprite? (Do not include diet soda or diet pop.)
o I did not drink soda or pop during the past 7 days
o 1 to 3 times during the past 7 days
o 4 to 6 times during the past 7 days
o 1 time per day
o 2 times per day
o 3 times per day
o 4 or more times per day

72
28. During the past 7 days, how many glasses of milk did you drink? (Include the milk you drank in a glass or cup, from a carton, or with cereal. Count the half pint of milk served at school as equal to one glass.)
o I did not drink milk during the past 7 days
o 1 to 3 glasses during the past 7 days
o 4 to 6 glasses during the past 7 days
o 1 glass per day
o 2 glasses per day
o 3 glasses per day o 4 or more glasses per day
The End!

73
Appendix A
7th – 12th Grade Survey Instructions
This survey is about health behavior. The information you give will be used to develop better health education for young people like yourself.
DO NOT write your name on this survey. The answers you give will be kept private. No one will know what you write. Answer the questions based on what you really do.
Completing the survey is voluntary. If you don’t want to answer a question, just leave it blank. The questions that ask about you specifically will only be used to describe the types of young people completing this survey. The information will not be used to find out your name. Make sure to read every question. Fill in the circles
completely. When you are finished, follow the
instructions of the person giving you the survey.
Thank you very much for your help.
DIRECTIONS
• Use a #2 pencil only.
• Make dark marks.
• Fill in a response like this:

74
1. How old are you?
o 11 years old or younger
o 12 years old
o 13 years old
o 14 years old
o 15 years old
o 16 years old
o 17 years old
o 18 years old
o 19 years old or older
2. In what month were you born?
o January
o February
o March
o April
o May
o June
o July
o August
o September
o October
o November
o December

75
3. In what year were you born?
o 1990
o 1991
o 1992
o 1993
o 1994
o 1995
o 1996
o 1997
o 1998
o 1999
4. What is your sex?
o Female
o Male
5. What grade will you be going into next year?
o 7th grade
o 8th grade
o 9th grade
o 10th grade
o 11th grade
o 12th grade
6. Including this year, how many years have you participated in Destination ImagiNation®?
o 1 year (My first year)
o 2 years
o 3 years
o 4 years

76
o 5 or more years
7. Are you Hispanic or Latino?
o Yes
o No
8. What is your race? (Select one or more responses.)
o American Indian or Alaska Native
o Asian
o Black or African American
o Native Hawaiian or Other Pacific Islander
o White
9. Imagine that this ladder pictures how American society is set up …
At the top of the ladder are the people who are the best off –
they have the most money, the highest amount of schooling,
and the jobs that bring the most respect.
At the bottom are people who are the worst off – they
have the least money, little or no education, no job or
jobs that no one wants or respects.
Now think about your family. Please tell us where you
think your family would be on this ladder. Fill in the circle
that best represents where your family
would be on this ladder.
10. Now assume that the ladder is a way of picturing your school.

77
At the top of the ladder are the people in your school with the most
respect, the highest grades, and the highest standing.
At the bottom, are the people who no one respects, no one
wants to hang around with, and have the worst grades.
Where would you place yourself on this ladder?
Fill in the circle that best represents where you
would be on this ladder.

78
The next 7 questions ask about a different subject.
11. How do you describe your weight?
o Very underweight
o Slightly underweight
o About the right weight
o Slightly overweight
o Very overweight
12. Which of the following are you trying to do about your weight?
o Lose weight
o Gain weight
o Stay the same weigh
o I am not trying to do anything about my weight
13. During the past 30 days, did you exercise to lose weight or to keep from gaining weight?
o Yes
o No
14. During the past 30 days, did you eat less food, fewer calories, or foods low in fat to lose weight or to keep from gaining weight?
o Yes
o No
15. During the past 30 days, did you go without eating for 24 hours or more (also called fasting) to lose weight or to keep from gaining weight?
o Yes
o No

79
16. During the past 30 days, did you take any diet pills, powders, or liquids without a doctor's advice to lose weight or to keep from gaining weight? (Do not include meal replacement products such as Slim Fast.)
o Yes
o No
17. During the past 30 days, did you vomit or take laxatives to lose weight or to keep from gaining weight?
o Yes
o No
The next 5 questions ask about your physical activi ty.
18. During the past 7 days, on how many days were you physically active for a total of at least 60 minutes per day ? (Add up all the time you spend in any kind of physical activity that increases your heart rate and makes you breathe hard some of the time.)
o 0 days
o 1 day
o 2 days
o 3 days
o 4 days
o 5 days
o 6 days
o 7 days
19. On an average school day, how many hours do you watch TV?
o I do not watch TV on an average school day
o Less than 1 hour per day1 hour per day
o 2 hours per day
o 3 hours per day
o 4 hours per day
o 5 or more hours per day

80
20. On an average school day, how many hours do you play video or computer games or use a computer for something that is not school work? (Include activities such as Nintendo, Game Boy, PlayStation, Xbox, computer games, and the Internet.)
o I do not play video or computer games or use a computer for something that is not school work
o Less than 1 hour per day
o 1 hour per day
o 2 hours per day
o 3 hours per day
o 4 hours per day
o 5 or more hours per day
21. In an average week when you are in school, on how many days do you go to physical education (PE) classes?
o 0 days
o 1 day
o 2 days
o 3 days
o 4 days
o 5 days
22. During the past 12 months, on how many sports teams did you play? (Include any teams run by your school or community groups.)
o 0 teams
o 1 team
o 2 teams
o 3 or more teams
The next 8 questions ask about food you ate or dran k during the past 7 days. Think about all the meals and snacks you had from the time you got up until you went to bed. Be sure to include food you ate at home, at school, at rest aurants, or anywhere else.

81
23. During the past 7 days, how many times did you drink 100% fruit juices such as orange juice, apple juice, or grape juice? (Do not count punch, Kool-Aid, sports drinks, or other fruit-flavored drinks.)
o I did not drink 100% fruit juice during the past 7 days
o 1 to 3 times during the past 7 days
o 4 to 6 times during the past 7 days
o 1 time per day
o 2 times per day
o 3 times per day
o 4 or more times per day
24. During the past 7 days, how many times did you eat fruit ? (Do not count fruit juice.)
o I did not eat fruit during the past 7 days
o 1 to 3 times during the past 7 days
o 4 to 6 times during the past 7 days
o 1 time per day
o 2 times per day
o 3 times per day
o 4 or more times per day
25. During the past 7 days, how many times did you eat green salad ?
o I did not eat green salad during the past 7 days
o 1 to 3 times during the past 7 days
o 4 to 6 times during the past 7 days
o 1 time per day
o 2 times per day
o 3 times per day
o 4 or more times per day

82
26. During the past 7 days, how many times did you eat potatoes ? (Do not count French fries, fried potatoes, or potato chips.)
o I did not eat potatoes during the past 7 days
o 1 to 3 times during the past 7 days
o 4 to 6 times during the past 7 days
o 1 time per day
o 2 times per day
o 3 times per day
o 4 or more times per day
27. During the past 7 days, how many times did you eat carrots ?
o I did not eat carrots during the past 7 days
o 1 to 3 times during the past 7 days
o 4 to 6 times during the past 7 days
o 1 time per day 2 times per day
o 3 times per day 4 or more times per day
28. During the past 7 days, how many times did you eat other vegetables ? (Do not count green salad, potatoes, or carrots.)
o I did not eat other vegetables during the past 7 days
o 1 to 3 times during the past 7 days
o 4 to 6 times during the past 7 days
o 1 time per day
o 2 times per day
o 3 times per day
o 4 or more times per day

83
29. During the past 7 days, how many times did you drink a can, bottle, or glass of soda or pop, such as Coke, Pepsi, or Sprite? (Do not include diet soda or diet pop.)
o I did not drink soda or pop during the past 7 days
o 1 to 3 times during the past 7 days
o 4 to 6 times during the past 7 days
o 1 time per day 2 times per day
o 3 times per day
o 4 or more times per day
30. During the past 7 days, how many glasses of milk did you drink? (Include the milk you drank in a glass or cup, from a carton, or with cereal. Count the half pint of milk served at school as equal to one glass.)
o I did not drink milk during the past 7 days
o 1 to 3 glasses during the past 7 days
o 4 to 6 glasses during the past 7 days
o 1 glass per day
o 2 glasses per day
o 3 glasses per day
o 4 or more glasses per day
The End!

84

85
Appendix B
Parent Survey 2009
Thank you for taking time to complete this survey.
Your time is appreciated!
Fruits and Vegetables
These next questions are about the foods you usually eat or drink. How often you eat or drink each one, for example, three times a day, twice a week, and so forth. Include all foods you eat, both at home and away from home.
How often do you drink fruit juices such as orange, grapefruit, or tomato?
___ Per day OR ___ Per week
Not counting juice, how often do you eat fruit?
___ Per day OR ___ Per week
How often do you eat green salad?
___ Per day OR ___ Per week
How often do you eat potatoes not including French fries, fried potatoes, or potato chips?
___ Per day OR ___ Per week
How often do you eat carrots?
___ Per day OR ___ Per week
Not counting carrots, potatoes, or salad, how many servings of vegetables do you
usually eat? (Example: A serving of vegetables at both lunch and dinner would be two servings.)
___ Per day OR ___ Per week

86
Shelf Inventory Please use this check list to tell us which foods are present in your home right now. Be sure to look in all places where you store food. Please check “Yes” box when you find a food present now. Check “No” when the food is not present now. Do not count frozen or canned food unless they are specified.
Milk/Dairy Yes
No
Whole Milk
Low Fat Milk (2%)
Low Fat Milk (1%) or Buttermilk
Skim Milk
Low Fat Yogurt
No Fat Yogurt
Sour cream and Sour Cream Dips
Light, Lowfat, and Lean Sour Cream and Light Sour Cream Dips
Cream and Half and Half
Cheese Yes
No
Regular Cottage Cheese
Low Fat (1% - 2%) or Dry Curd Cottage Cheese
Cream Cheese
Light Cream Cheese
Valveeta, Cheese Food and spreads, Colby, Cheddar, American, Swiss,

87
Monterey Jack cheese
Blue, Brick, Limburger, Muenster, Provolone, Gouda, Brie, Romano, Parmesan,
Mozzarella cheese (made with skim milk)
String Cheese
Farmer Cheese
Diet Cheese (Such as Weight Watchers)
Salad Dressing Yes
No
Regular Salad Dressing
Reduced Calorie, Low Fat, No Fat, or Light Dressing
Regular Mayonnaise
Weight Watchers, Low Fat, or Light Mayonnaise
Cereals Yes
No
100% Bran Cereals (Such as 100% Bran, all Bran, Fiber One, Quaker Oar Bran, Bran Buds)
All other bran cereals (such as Raisin Bran, Bran Flakes, Nutrific, Bran Chez, Fruit and Fiber, Muselix Bran, Fruitful Bran)
Oatmeal (Including Instant Oatmeal and Quick Oatmeal)
Shredded Wheat Types (Such as Shredded Wheat, Fruit Wheats, Strawberry Squares, Frosted Miniwheats, Quaker Oat Squares)
Cheerios
Rice Krispies

88
Corn, Oat or Wheat Flake Types (such as corn flakes and wheaties)
Others (please specify)

89
Breads, Pastas, Rice – do not count frozen foods Yes
No
Whole Wheat or Whole Grain Bread or Rolls (First ingredient should be whole wheat or whole grain flour)
Other Brown Bread or Rolls
White Bread or Rolls
Brown or Wild Rice
White Rice
Pasta (such as macaroni and spaghetti)
Whole Wheat Pasta (such as macaroni and spaghetti)
Baked Goods Yes
No
Pastry
Donuts
Other Cakes and Cookies
Fresh Vegetables Yes
No
Peas
Potatoes
Corn
Carrots
Brussels Sprouts
Spinach

90
Broccoli
Cabbage
Cauliflower
Frozen Vegetables Yes
No
Peas
Corn
Carrots
Brussels Sprouts
Spinach
Broccoli
Cauliflower
Mixed Vegetables
Broccoli and Cauliflower Mix, California Blend
Fresh Fruits Yes
No
Apples
Pears
Oranges
Bananas
Strawberries (fresh or frozen)

91
Blueberries (fresh or frozen)
Grapefruit
Fresh or Frozen Meat & Sausage Yes
No
Extra Lean Ground Beef
Lean Ground Beef
Regular Ground Beef
Sausage (such as smoked, links, Polish, Liver, Salami, Pepperoni, Bratwurst, Breakfast)
Bacon
Balogna
Frankfurters
Crackers and Chips Yes
No
Rye and Wheat Crispbread
Triscuits
Other Crackers
Snack Foods (such as Potato, Corn, or Tortilla Chips: Corn puffs and curls
Legumes Yes
No

92
Dried Peas, Beans, or Lentils
Canned Beans (such as butter, garbanzo, kidney, navy, northern, pinto, red or baked beans)
Dried beans and Chili with beans
Please answer the following questions by placing a check in the
appropriate blank
Do you usually do the grocery shopping? Yes No When did you or someone in the household last shop for groceries? (Check One)
Today
Yesterday
2 days ago
3 days ago
4 days ago
5 days ago
6 days ago
1 week ago
More than one week ago
How often do you eat away from home? (Check One)
Never to 2 times a week
3 to 5 times a week

93
6 to 8 times a week
9 to 11 times a week
12 or more times a week
Physical Activity These next questions ask about your physical activity.
When you are at work or if you stay at home, which of the following best describes what you do? (If you have multiple jobs, include all jobs) Would you say you are —
o Mostly sitting or standing
o Mostly walking
o Mostly involved in heavy labor or physically demanding work
We are interested in two types of physical activity - vigorous and
moderate. Vigorous activities cause large increases in breathing or heart
rate while moderate activities cause small increases in breathing or heart
rate. Think about any physical activity that you get at work, at home
taking care of the household, and in your leisure time.
Now, thinking about the moderate activities you do in a usual week, do you do moderate activities for at least 10 minutes at a time, such as brisk walking, bicycling, vacuuming, gardening, or anything else that causes some increase in breathing or heart rate?
o Yes
o No
If yes skip to Vigorous PA Question
How many days per week do you do these moderate activities for at least 10 minutes at a time?
o Do not do any moderate physical activity for at least 10 minutes at a time

94
o 1 Day
o 2 Days
o 3 Days
o 4 Days
o 5 Days
o 6 Days
o 7 Days
On days when you do moderate activities for at least 10 minutes at a time, how much total time in minutes per day do you spend doing these activities?
______ Minutes/Day Now, thinking about the vigorous activities you do in a usual week, do you do vigorous activities for at least 10 minutes at a time, such as running, aerobics, heavy yard work, or anything else that causes large increases in breathing or heart rate?
o Yes
o No
If yes skip to MacArthur Scale
How many days per week do you do these vigorous activities for at least 10 minutes
at a time?
o Do not do any vigorous physical activity for at least 10 minutes at a time
o 1 Day
o 2 Days
o 3 Days
o 4 Days
o 5 Days
o 6 Days
o 7 Days

95
On days when you do vigorous activities for at least 10 minutes at a time, how much total time in minutes per day do you spend doing these activities?
_______ Minutes/Day
These next questions refer to a different subject.
Think of this ladder as representing where people stand in our society.
At the top of the ladder are the people who are the best off,
those who have the most money, most education, and the best jobs. At the bottom are people who are the worst off – they
have the least money, little or no education, no job or
jobs that no one wants or respects.
Please tell us where you think you stand on the lad der.
People define community in different ways; please define it in whatever way is most meaningful to you.
At the top of the ladder are the people who have the highest Standing in their community.
At the bottom are the people who have the lowest Standing in their community.

96
Where would you place yourself on this ladder?
How do you describe your weight?
o Very underweight
o Slightly underweight
o About the right weight
o Slightly overweight
o Very over weight
During the past year, how has your weight changed?
o Stayed the same
o Decreased a lot
o Decreased a little
o Increased a little
o Increased a lot
In the past month, which were you trying to do about your weight?
o Lose weight
o Gain weight
o Stay the same weight
o I am not trying to do anything about my weight
If you selected the last option skip to Demographics

97
During the past month, did you diet or exercise to lose weight or to keep from gaining
weight?
o Diet only
o Exercise only
o Diet and exercise
o Neither
Demographics
What is your relationship to the Destination ImagiNation® participant?
o Mother
o Father
o Grandmother
o Grandfather
o Female Guardian
o Male Guardian
Other (specify) _________________
What is your age? ____ Years
Are you Hispanic or Latino?
o Yes
o No

98
Which one or more of the following would you say is your race? (Check all that apply)
o White
o Black or African American
o Asian
o Native Hawaiian or Other Pacific Islander
o American Indian or Alaska Native
o Other

99
Are you…?
o Married
o Divorced
o Widowed
o Separated
o Never married
o A member of an unmarried couple
What is the highest grade or year of school you completed?
o Grade 8 or less
o Grades 9 through 11 (Some high school)
o Grades 12 or GED (High school graduate)
o College 1 year to 3 years (Some college or technical school)
o College 4 years or more (College graduate)
Is your annual household income from all sources—
o Less than $25,000
o $25,000 - $50,000
o $50,001 - $75,000
o $75,001 - $100,000
o More than $100,000

100
About how much do you weigh (in pounds) without shoes?
---------------- Pounds
About how tall are you without shoes?
_____ Feet / _____ Inches
May we contact you once more time? We would like to get a little more dietary information from your Destination ImagiNation® participant. Further participation will qualify you for additional incentive opportunities.
o Yes
o No
Would you prefer to be contacted by mail or email?
Please enter your email address.
Thank you so much for your cooperation!
Please click the NEXT button
to submit your response and complete the survey .

101
Appendix C

102

103

104

105
Vita
Manasi Barot was born in Navsari, India but spent most of her childhood and
adolescence in Gaborone, Botswana. Manasi graduated from Maru A Pula International
High School in 2003. In December 2003 she made her journey to the USA to start her
bachelor’s degree program at The University of Tennessee. In May of 2008, Manasi
graduated with a Bachelor of Science in Nutrition. In August of 2008 she was accepted
as a graduate student into the Public Health Nutrition Graduate Program at The
University of Tennessee, where she had the privilege to work as a Graduate Research
Assistant on the Destination Imagination® Healthy Project. In 2009, she married her
childhood friend Poorak Mody. Manasi is now settled in Waukesha, WI.