Occurrence, Distribution, Content, and Dietary Intake of Phytate
Improving dietary intake and achieving food product improvementPolicy opportunities and challenges for the WHO European Region in reducing salt and sugar in the diet
Featuring case studies fromUnited KingdomIsraelSpainPortugalNetherlands

Address requests about publications of the WHO Regional Office for Europe to:
Publications WHO Regional Office for Europe UN City, Marmorvej 51 DK-2100 Copenhagen Ø, Denmark
Alternatively, complete an online request form for documentation, health information, or for permission to quote or translate, on the Regional Office website: http://www.euro.who.int/pubrequest.
© World Health Organization 2020
All rights reserved. The Regional Office for Europe of the World Health Organization welcomes requests for permission to reproduce or translate its publications, in part or in full.
The designations employed and the presentation of the material in this publication do not imply the expression of any opinion whatsoever on the part of the World Health Organization concerning the legal status of any country, territory, city or area or of its authorities, or concerning the delimitation of its frontiers or boundaries. Dotted lines on maps represent approximate border lines for which there may not yet be full agreement.
The mention of specific companies or of certain manufacturers’ products does not imply that they are endorsed or recommended by the World Health Organization in preference to others of a similar nature that are not mentioned. Errors and omissions excepted, the names of proprietary products are distinguished by initial capital letters.
All reasonable precautions have been taken by the World Health Organization to verify the information contained in this publication. However, the published material is being distributed without warranty of any kind, either expressed or implied. The responsibility for the interpretation and use of the material lies with the reader. In no event shall the World Health Organization be liable for damages arising from its use. The views expressed by authors, editors, or expert groups do not necessarily represent the decisions or the stated policy of the World Health Organization.

ContentsACKNOWLEDGEMENTS ������������������������������������������������������������������������������������������������������������������������������������������������������������������� iv
ABBREVIATIONS ����������������������������������������������������������������������������������������������������������������������������������������������������������������������������������� v
1 INTRODUCTION ���������������������������������������������������������������������������������������������������������������������������������������������������������������������������������11.1 Background �����������������������������������������������������������������������������������������������������������������������������������������������������������������������������������11.2 Rationale for publication and overview �������������������������������������������������������������������������������������������������������������������������������21.3 Key themes covered by the case studies ���������������������������������������������������������������������������������������������������������������������������21.4 Lessons on food product improvement from a workshop on “first mover” countries’ experience ������������������������������ 51.5 Key considerations discussed in the case studies ���������������������������������������������������������������������������������������������������������71.6 References ������������������������������������������������������������������������������������������������������������������������������������������������������������������������������������8
2 UNITED KINGDOM ������������������������������������������������������������������������������������������������������������������������������������������������������������������������� 112.1 Summary ������������������������������������������������������������������������������������������������������������������������������������������������������������������������������������� 112.2 Introduction �������������������������������������������������������������������������������������������������������������������������������������������������������������������������������� 122.3 Analysis of the policy process ��������������������������������������������������������������������������������������������������������������������������������������������� 122.4 Details of the sugar reduction and wider reformulation programmes ����������������������������������������������������������������� 172.5 References ��������������������������������������������������������������������������������������������������������������������������������������������������������������������������������� 20
3 ISRAEL ������������������������������������������������������������������������������������������������������������������������������������������������������������������������������������������������� 223.1 Summary ������������������������������������������������������������������������������������������������������������������������������������������������������������������������������������� 223.2 Background and context �������������������������������������������������������������������������������������������������������������������������������������������������������� 233.3 Implementation process �������������������������������������������������������������������������������������������������������������������������������������������������������� 273.4 Monitoring and evaluation ���������������������������������������������������������������������������������������������������������������������������������������������������� 283.5 Challenges, concluding remarks and further considerations ���������������������������������������������������������������������������������� 283.6 References �������������������������������������������������������������������������������������������������������������������������������������������������������������������������������� 29
4 SPAIN ��������������������������������������������������������������������������������������������������������������������������������������������������������������������������������������������������� 304.1 Summary ������������������������������������������������������������������������������������������������������������������������������������������������������������������������������������� 304.2 Background and context �������������������������������������������������������������������������������������������������������������������������������������������������������� 314.3 Formalizing the Plan ��������������������������������������������������������������������������������������������������������������������������������������������������������������� 324.4 Implementation process: monitoring and evaluation ������������������������������������������������������������������������������������������������� 334.5 Challenges anticipated and further considerations ����������������������������������������������������������������������������������������������������� 344.6 References ��������������������������������������������������������������������������������������������������������������������������������������������������������������������������������� 35
5 PORTUGAL ���������������������������������������������������������������������������������������������������������������������������������������������������������������������������������������� 365.1 Summary ������������������������������������������������������������������������������������������������������������������������������������������������������������������������������������� 365.2 Noncommunicable diseases (NCDs): a threat to universal health coverage ����������������������������������������������������� 365.3 The importance of involving different sectors in Portugal ���������������������������������������������������������������������������������������� 375.4 Integrated Strategy for the Promotion of Healthy Eating ������������������������������������������������������������������������������������������ 375.5 Food price policies as a means to prevent NCDs ��������������������������������������������������������������������������������������������������������� 385.6 Portuguese Special Consumption Tax Levied on Sweetened Beverages ������������������������������������������������������������ 395.7 Preliminary results ������������������������������������������������������������������������������������������������������������������������������������������������������������������� 395.8 Redesigning the Portuguese Special Consumption Tax Levied on Sweetened Beverages ��������������������������� 425.9 Discussion and conclusions ������������������������������������������������������������������������������������������������������������������������������������������������ 425.10 References ������������������������������������������������������������������������������������������������������������������������������������������������������������������������������ 44
6 NETHERLANDS ������������������������������������������������������������������������������������������������������������������������������������������������������������������������������� 466.1 Introduction �������������������������������������������������������������������������������������������������������������������������������������������������������������������������������� 466.2 National Agreement to Improve Product Composition (AVP) ���������������������������������������������������������������������������������� 476.3 Monitoring of progress ����������������������������������������������������������������������������������������������������������������������������������������������������������� 506.4 Results of monitoring ������������������������������������������������������������������������������������������������������������������������������������������������������������� 516.5 Discussion ���������������������������������������������������������������������������������������������������������������������������������������������������������������������������������� 516.6 Conclusion ���������������������������������������������������������������������������������������������������������������������������������������������������������������������������������� 526.7 References ��������������������������������������������������������������������������������������������������������������������������������������������������������������������������������� 57

iv IMPROVING DIETARY INTAKE AND ACHIEVING FOOD PRODUCT IMPROVEMENT
AcknowledgementsThis report was produced under the coordination of Kremlin Wickramasinghe, Technical Officer at the WHO European Office for the Prevention and Control of Noncommunicable Diseases, headed by Dr João Breda, and under the leadership of Bente Mikkelsen, Director of the Division of Noncommunicable Diseases and Promoting Health through the Life-course at the WHO Regional Office for Europe.
Special appreciation goes to all the authors of the case studies included in this report – namely, Tazeem Bhatia, Victoria Targett, Alison Tedstone, Ronit Endevelt, Itamar Grotto, Rebecca Goldsmith, Maya Golan, Ehud Kaliner, Siegal Sadetzki, Moshe Barsimantov, María José Yusta Boyo, Marta García Solano, Carmen Villar Villalba, María Ángeles Dal Re Saavedra, Francisco Goiana-da-Silva, David Cruz-e-Silva, Afonso Oom-Sousa, Alexandre Morais Nunes, Maria João Gregório, Tânia Cordeiro, Conceição Calhau, Carla Lopes, Ana Rito, Marisa Miraldo, Alexandra Bento, Ara Darzi, Fernando Araújo, Elisabeth H.M. Temme, Caroline Wilson and Ivon Milder.
Thanks are also owed to Jo Jewell, Karen McColl, Francisco Goiana da Silva and Lea Nash Castro from WHO Regional Office for Europe for their contributions to this report.
This report and related activities were supported by the Russian Federation in the context of the activities at the WHO European Office for the Prevention and Control of Noncommunicable Diseases.

POLICY OPPORTUNITIES AND CHALLENGES v
AbbreviationsAESAN Spanish Agency for Consumer Affairs, Food Safety and Nutrition
BMI body mass index
COSI Childhood Obesity Surveillance Initiative
FOP front-of-pack
FSA Food Standards Agency
HFSS high in saturated fat, free sugars and salt
HiAP Health in All Policies
NAOS Strategy for Nutrition, Physical Activity and the Prevention of Obesity
NCD noncommunicable disease
NGO nongovernmental organization
NHS National Health Service
OECD Organisation for Economic Co-operation and Development
PHE Public Health England
PHRD Public Health Responsibility Deal
PRIME Preventable Risk Integrated ModEl
PROBEB Portuguese Association for Non-Alcoholic Drinks
RIVM Dutch National Institute for Public Health
SACN Scientific Advisory Committee on Nutrition
SDIL Soft Drink Industry Levy
SNS Portuguese National Health Service (Serviço Nacional de Saúde)
SSB sugar-sweetened beverage
TFA trans fatty acid
WHO World Health Organization
POLICY OPPORTUNITIES AND CHALLENGES 1
1.1 BackgroundPatterns of food consumption in the World Health Organization (WHO) European Region have changed rapidly in recent decades, and consumption of processed foods high in saturated fat, free sugars and salt (HFSS foods) is high.1,2
Non-adherence to dietary guidelines is widespread among both adults and children in most European countries where data are available,3,4 and HFSS foods are aggressively promoted via multiple media channels and in different settings.5, 6,7 As a result, dietary risk factors (characterized by excess energy, saturated fat, free sugar and salt, and low intakes of fruit, vegetables and wholegrains) are a leading cause of mortality and morbidity in the WHO European Region,8 contributing to hypertension and cardiovascular diseases, overweight/obesity, type 2 diabetes and some types of cancer.
Many governments have been grappling with this challenge and looking for effective policy solutions. The term “obesogenic environment” was first coined in 1997;9 since then, a large body of research has investigated ways in which environmental factors (such as the availability, price and promotion of foods) influence dietary behaviour and encourage weight gain.10 While the term “obesogenic” focuses on the weight gain effects of such environments, the wider concept of food environments influencing diets also applies to a broader range of nutritional concerns. Looking at these issues and potential solutions from a food environment perspective means that attention focuses not only on ways to encourage individuals to “make the healthy choice”, but also on the role of governments in ensuring that day-to-day environments are supportive of healthy options, and manufacturers, retailers and advertisers produce, sell and promote food in a responsible way. The evidence in
favour of implementing food environment policies has grown significantly, alongside a deeper understanding of the importance of policy design and scope in mediating success or failure.11 As a result, policies aimed at creating healthier, more supportive food environments are now a priority.12
Countries in the WHO European Region have implemented a wide range of mandatory and voluntary policies to this effect, including a growing number of interpretive nutrition labelling schemes, targeted food and beverage taxes, comprehensive reformulation strategies, and restrictions on the marketing of unhealthy foods.13 These approaches have been supported by evidence of their cost–effectiveness and health impact, both theoretically (i.e. modelled) and in real-world settings. For its part, WHO has issued more guidance in this area via regional and global policy frameworks and the updated Appendix 3 to the WHO Global Action Plan on the Prevention and Control of Noncommunicable Diseases, which outlines “best buys” and recommended interventions, including salt reduction and taxes on sugar-sweetened beverages (SSBs).14 The need for policy action is also recognized by non-health actors; a report by the McKinsey Global Institute called for implementation of “as many interventions as possible”, including a number of measures to drive product improvement such as reducing default portion sizes and reformulating foods, in addition to changing the way that food is promoted. Such interventions should be delivered “at scale and … effectively by the full range of sectors in society” in order to “overcome obesity” and limit the damaging costs to economies.15
Nevertheless, when the current extent of policy implementation in countries is examined more closely, it becomes clear that the breadth and depth of policies in many countries is unlikely to be sufficient to achieve
1INTRODUCTION

2 IMPROVING DIETARY INTAKE AND ACHIEVING FOOD PRODUCT IMPROVEMENT
change at scale. Either individual policies themselves are too narrowly defined, or the range of policies in place does not adequately address the multiple factors influencing dietary intake. Previous analyses of reformulation strategies, marketing restrictions and labelling schemes are testament to this, and isolated and patchy initiatives have been shown to yield limited gains and potentially widen inequalities.16, 17,18 It is becoming increasingly clear that complex, multi-causal problems cannot be solved by a series of single, unlinked interventions – as repeatedly stated, there are no “silver bullets”, but a combination of well-crafted, mutually supportive policies is likely to work.19 What is therefore required is a multifaceted, integrated approach that is underpinned by coherent and supportive wider policy frameworks.
There are important contextual factors that can, in part, explain limited progress. Governments operate within a political environment and may feel that their mandate or
scope to drive such a suite of policies is limited and the food industry may also vocally oppose some of the proposed policies.20 Additionally, not all governments currently have equal capacity to design and manage policies, nor do they have the same ability to hold industry to account.10 However, some countries have managed to overcome significant barriers and have made concerted efforts to develop policies that are comprehensive, ambitious, highly managed and accountable.
This paper provides case studies of several food product improvement policies from across the WHO European Region. The aim is to share country experience, assess the various merits of the different approaches, discuss lessons learned, and provide guidance for best practice that may be more widely applicable across the European Region.
1.2 Rationale for publication and overviewIn the initial stages of the epidemic of obesity and unhealthy diets, little concrete guidance was available on which policies countries should aim to implement and by which mechanism. Recommendations for policy action from intergovernmental bodies and national governments in the area of obesity and unhealthy diets often lacked specificity, and there was still a need to (i) build the case for action and (ii) generate more robust supporting evidence.21 Moreover, nutrition communication and education commanded a disproportionate focus.22 Examples of early adopters successfully taking stronger action to improve dietary intake do exist (notably, Finland’s efforts to address excess salt and saturated fat intake among its population).23 However, this remained the exception; European policy development generally fell short in attempting to meet the dietary challenges faced by Member States.
Over time, WHO and national authorities issued stronger guidance in terms of dietary intake goals, and the available policy evidence also grew exponentially.24, 25, 26,27 Global, regional and national policy frameworks expanded and countries adopted time-bound commitments to address noncommunicable diseases (NCDs) and nutrition.28 Among the priorities, governments agreed to increase efforts to improve the nutritional quality of the food supply and drive reformulation by reducing the excessive use of salt, sugars and fats.29 They also committed to promote and implement fiscal measures “as appropriate” and to further reduce the exposure of children to marketing of HFSS foods and beverages. In this context, a growing number of countries have announced more ambitious combinations of policy action.30, 31, 32,33
The persistently high rates of obesity and diet-related NCDs across all WHO European Member States make it difficult to identify one country that has “solved the problem”, and arguably there is no country that has developed a fully comprehensive response.34, 35 Indeed, while average rates of childhood overweight and obesity may have stabilized or even slightly decreased in some populations (albeit at high
levels), wide socioeconomic inequalities persist and severe childhood obesity seems to be on the increase.36, 37 As such, the need for ambitious policies is more pressing than ever.
This publication provides a small selection of case studies from WHO European Member States; it describes the successes and challenges experienced in developing food policies aimed at driving dietary improvements, focusing mainly on efforts to reduce sugar and salt intakes. Case studies do not necessarily represent the ideal approach; the purpose is to share opportunities for both best practice and lessons learned. The policy development and implementation process that countries have adopted will be described and assessed to better understand how challenges were overcome. The publication will also outline the steps taken to evaluate each country’s efforts and reflect upon future policy directions. Such information is not typically presented in academic publications; the case studies have therefore been informed by collaboration between WHO and country experts.
The case studies are as follows:
◉ the United Kingdom’s sugar reduction programme
◉ Israel’s front-of-pack (FOP) labelling scheme
◉ Spain’s Collaboration Plan for the Improvement of Food and Beverage Composition
◉ Portugal’s tax on SSBs
◉ the Netherlands’ National Agreement to Improve Product Composition.

POLICY OPPORTUNITIES AND CHALLENGES 3
1.3 Key themes covered by the case studies
1.3.1 Focus on policies to drive food product improvementProduct reformulation commonly refers to policies and practices aimed at reducing the quantities of nutrients associated with NCDs in processed foods; these “nutrients to limit” include salt, free sugars, saturated fats and trans fatty acids (TFAs), and reformulation may also aim at calorie reduction.38,39 Reformulation has been identified as a cost–effective policy, and (for the most part) a politically feasible one, and studies have demonstrated that diets containing more products meeting nutritional targets are associated with an overall reduction in disease risk.15, 40 Given the high proportion of processed foods in current diets, many European countries have chosen to focus efforts on dietary improvement by improving the composition of processed foods. In a context where up to 50% of foods available in households are highly processed, it is impossible not to engage in efforts to improve their nutritional quality.2,41 For example, up to 75–80% of salt comes from processed foods in some countries. Reformulation may be accompanied by efforts to change individual purchase habits and consumption behaviour, but it is often done “by stealth”, i.e. without announcement to consumers.
A small group of countries in Europe have been able to demonstrate a significant reduction in population-level salt intakes by setting comprehensive salt reduction targets for the food industry across a range of product categories.42 The model has subsequently been replicated in other countries across the European Region, albeit with varying degrees of success in terms of achieving the same level of reductions in salt content of foods and salt intake.43 While reformulation of a single but frequently consumed food category may have positive impact, it is generally recommended to cover all major food categories that contribute to excess nutrient intake in order to have impact at scale.44
The experience with salt reformulation has also strongly influenced policy development on sugar reduction in the Region.38 Recognizing that elevated sugar intake is a factor driving the obesity epidemic, countries have begun to apply similar principles of reformulation to sugar and calorie reduction to address the high sugar content of many processed foods.
In the majority of WHO European countries, there is now some form of government-led initiative to reformulate processed foods.13 However, some nutrition experts have raised concerns about the current emphasis on reformulation policies, fearing that they are not enough to truly address the scale of challenges we face with food and “may serve to legitimate, endorse and even promote, rather than significantly challenge the consumption of ultra-processed foods”.45 Their arguments are fourfold.
◉ While the focus of reformulation strategies has been on the laudable goal of reducing nutrient intakes, less attention has been given to monitoring the quality of the ingredients being substituted. While nutrition
and public health experts have emphasized the need to avoid replacing one nutrient to limit with another, systematic examinations of the ingredient changes before and after reformulation are not systematically undertaken in all countries.
◉ Reformulation policies may provide positive endorsement for the consumption of (reformulated) processed products, as long as these reformulated products have met the required single-nutrient goals, which may be based on political feasibility rather than optimal nutrition. If reformulation of processed foods is promoted as the main solution, it potentially undermines policies that aim to reduce consumption of processed foods overall and to promote increased consumption of minimally processed foods.
◉ Modest population-wide reductions in such nutrients to limit could be expected in countries with already high consumption of processed foods and a history of product reformulation. However, in countries where consumption patterns remain in transition and/or capacity to drive accountable reformulation initiatives is low, a better focus might be on slowing the displacement of traditional, freshly prepared and minimally processed meals.46
◉ Meeting population dietary intake goals through reformulation alone would require very significant reductions (perhaps in the region of 30–50% for some product categories). This raises questions of technological feasibility and willingness of industry actors to make such significant changes to their products.
Recognizing the limitations of reformulation and the need for complementary policies, most countries also consider measures such as FOP labelling, advertising and marketing restriction, and taxes as important additional ways to influence food product composition, consumer choices, diet, and health outcomes.47 Collectively, these policies would be more effective than focusing solely on a single measure.
In light of this, this publication also considers the limitations of reformulation and the role of alternative or complementary policies. Here, we consider country experiences in establishing taxes and FOP nutrition labelling to reduce sugar and salt in the diet.
Interpretive FOP labelling that provides evaluative judgement about the nutritional quality of pre-packed foods can encourage improvements in food purchase and dietary intake, and may also incentivize the food industry to reformulate products in order to achieve a favourable FOP label.17,48 Different FOP nutrition labelling schemes have been developed across Europe and vary in the extent to which they help consumers judge product healthfulness. The use of interpretive elements such as colours, words and symbols are shown to be most successful, allowing consumers to differentiate between products at a glance.

4 IMPROVING DIETARY INTAKE AND ACHIEVING FOOD PRODUCT IMPROVEMENT
Schemes that incorporate the widest range of products and provide negative evaluative judgements are likely to perform most effectively.
The adoption of taxes on SSBs has increased significantly in the WHO European Region since 2015, when the European Food and Nutrition Action Plan recommended that countries consider the use of fiscal measures to influence purchase and consumption habits and product composition. Price has a well-established role in influencing food choice, and there is growing evidence, including from real-world policies, that taxes and subsidies influence consumer decision-making and incentivize healthy eating.49, 50,51 Recent evidence from the United Kingdom indicates that taxes encourage reformulation when thresholds are designed to incentivize producers to reduce the relevant nutrient content in order to avoid the higher tax rate.52
1.3.2 Focus on efforts to reduce salt intake and salt content of foodsWHO guidelines recommend a reduction in sodium intake to less than 2 g/day, equivalent to 5 g of salt, for improved health outcomes. Approximately 99% of the world’s adult population currently has a mean salt intake above the recommended levels, causing raised blood pressure and increasing the risk of cardiovascular diseases – namely, stroke and coronary heart disease.53 In 2013, WHO recommended a global target of a 30% reduction in mean population salt intake by 2025 for the prevention and control of NCDs.54 Although reductions of that magnitude are challenging, some countries in the WHO European Region – notably Finland – have demonstrated that they are achievable.55, 56 Other countries have achieved important reductions, albeit not yet at the levels proposed in the target.57
In order to achieve this target, the WHO Food and Nutrition Action Plan encourages countries to “develop, extend and evaluate, as a priority, salt reduction strategies to continue progress across food product categories and market segments”. This approach is detailed in the WHO SHAKE package and calls on countries to adopt integrated salt reduction programmes that include monitoring of the food supply, stakeholder engagement, and establishment of benchmarks and targets for processed foods.58
Monitoring of the salt content of packaged foods within and between countries in the WHO European Region, conducted by the Dutch National Institute for Public Health (RIVM) using nutrient data provided by EuroFIR, reveals a wide range of salt levels available on the market within the same product category, indicating significant scope for improvements towards “best in class” products. Together this means that reducing salt in processed food categories through reformulation targets or other means is an essential part of any salt reduction strategy.59,60
Voluntary reformulation initiatives have been widely adopted, and perhaps the best-known example is the United Kingdom’s “voluntary but open, accountable, and highly managed” salt reduction initiative.31 However, despite the clear successes in reducing population salt
intake and salt content of food, in many countries salt intake remains above the recommended levels for large sections of the population.61 Barriers to further salt reduction through reformulation include fears of an “unequal playing field”, where some industry actors are pulling their weight and others are not.62
Other available measures include mandatory warning labels (e.g. Finland and Israel) and/or legislated maximum limits for salt in food (e.g. South Africa and Argentina).63,64 Mandatory labelling in Finland was primarily intended to help consumers choose lower-salt foods, but when the legislation came into force, it also led manufacturers to reduce the salt in their products.23 In Europe, legislative limits for salt content in foods are most common for bread, as in the Netherlands, where the maximum permitted salt content of bread has fallen gradually over the past decade, from 2.5% per 100 g of dry matter in 2009 to 1.8% in 2013, equivalent to approximately 1.15 g salt/100 g bread.65 Many bread producers supported the legislation, as it limited unfair competition and ensured consumer tastes were adapted to universally reduced salt. Nevertheless, to date, the use of mandatory maximum limits on a broader range of product categories is not widespread in Europe. This could be due in part to a wider resistance from industry.
The case studies for the Netherlands, Spain and Israel included in this report describe their efforts to advance salt reduction. In the Netherlands, salt reduction in processed foods is considered a crucial intervention and is pursued via a voluntary agreement with industry sectors. Continued monitoring of salt levels in processed foods shows that there has been some progress in salt reduction, but there is still much variation within product groups, and the food industry as a whole has not yet achieved its targets for salt reduction in processed foods. Furthermore, efforts to study the impact of salt reformulation on population salt intakes in the Netherlands have produced a mixed result, which presents additional challenges in designing future salt reduction strategies.
In Israel, as in the Netherlands, the government has historically pursued voluntary salt reformulation across 11 major food categories, which produced some successes in terms of salt reduction in foods. However, in order to stimulate further change, a Food Regulatory Committee was established in 2015 with the aim of determining the most effective and far-reaching actions, achieved through changes to the food environment, to deal with the unacceptably high prevalence of obesity and NCDs. One of the most visible outcomes of the Food Regulatory Committee to date has been the successful adoption of mandatory warning labels (with a specific red symbol) on food products that contain high amounts of saturated fat, salt and sugar. This regulation is due to come into force in 2020. The Israeli case study describes the process of developing the red warning labels, including how difficult challenges were overcome.

POLICY OPPORTUNITIES AND CHALLENGES 5
1.3.3 Focus on efforts to reduce sugar intake and sugar content of foodsExcessive sugar consumption has also received growing attention in recent years, as high intakes of free or added sugars are associated with an increased risk of overweight, obesity and diet-related NCDs. Responding to these concerns, WHO reviewed all available evidence and published guidelines in 2015 that recommend limiting free sugars intake to less than 10% of total energy intake in both adults and children (strong recommendation) and preferably below 5% of total energy intake (conditional recommendation) for additional health benefit.25 While intakes vary across countries in Europe, the available data show that in all countries adults are, on average, consuming more than 5% of energy from added sugars.3 Children and adolescents gain a higher percentage of their total energy intake from sugars, consuming more than 10% of their daily energy intake from added sugars in many countries.4 Leading sources of sugar in the diet for both adults and children include cakes, biscuits, pastries and confectionery; SSBs and juice drinks; jam, honey and table sugar; ice cream; and sweetened dairy products.
Consequently, many countries have started to develop sugar reduction initiatives, combining various food policy approaches. However, to date, the concept of comprehensive sugar reduction initiatives has received less attention than salt reduction, and there has been less clarity over the key characteristics of programmes, the specific food and drinks categories prioritized in policies, and details of any specific targets/criteria established.66,67
As with salt, setting targets to reduce the sugar content of foods and beverages may, if fully implemented, directly influence consumer intake levels and, ideally, lead to calorie reduction. In a recent policy sweep for the WHO Regional Office for Europe, information on reformulation efforts targeting sugar was found for 13 WHO European countries.* As part of their reformulation strategies, six countries (Finland, Germany, Portugal, Spain, the Netherlands and the United Kingdom) selected food groups or food categories that were widely consumed or shown to contribute highly to sugar intake, based on national dietary surveys. In contrast, the decision about which food products should be targeted for reformulation was defined by the manufacturers or food retailers in Belgium, France, Italy, Lithuania and Norway. Portion size reduction has also been identified as a way to reduce absolute sugar content where product reformulation might be challenging because of its functional properties in certain products, or as an additional measure alongside reformulation to further reduce sugar intakes.68
* An unpublished policy sweep identified sugar reduction initiatives in Belgium, Finland, France, Germany, Israel, Italy, Lithuania, the Netherlands, Norway, Portugal, Spain, Switzerland and the United Kingdom.
Such approaches to driving sugar reduction are in their infancy; consequently, the evidence of effectiveness in reducing both the sugar content of foods and sugar intakes requires further monitoring and evaluation. However, results of the impact of sugar reformulation strategies on the sugar content of different products are starting to become available.52 The experience from the United Kingdom in establishing and evaluating its sugar and calorie reduction programme will be discussed within the relevant case study.
Taxation on high-sugar products constitutes another policy aimed at reducing sugar intake. Ten countries now report fiscal policies in the WHO European Region, and the scope of taxation varies across countries. SSBs constitute the most common product subject to taxation.13 The Soft Drink Industry Levy (SDIL) introduced in the United Kingdom in April 2018 already promises positive impact, with many beverage companies reformulating products to reduce sugar content to below the 5 g threshold, leaving just one third of soft drinks eligible for taxation. A recent report published by Public Health England (PHE) found that, as a result of the levy, sugar in soft drinks had been reduced by 11% and average calories per portion by 6% for retailer own-label and manufacturer private-label products. Sales of beverages below the 5 g/100 g SDIL threshold have also increased.68 Similarly, in Portugal a tax on sugary drinks is divided into two tiers.69 The lower tier includes drinks with sugar content below 8 g/100 ml and the upper tier covers drinks with sugar content equal to or above 8 g/100 ml. The tax became effective on 1 February 2017. Preliminary results show a reduction in overall sales of approximately 4.3%, and a 24% reduction in the consumption of the upper-tier drinks. This is most likely due to reformulation by the industry in terms of sugar content.
The PHE case study describes the United Kingdom experience with sugar reduction. PHE oversees and evaluates the sugar reduction programme, which challenged all food industry sectors to reduce sugar levels in the categories that contribute most to sugar intakes in children up to 18 years by 20% by 2020. A short-term target of a 5% reduction in the first year of the programme was also set. In March 2017 PHE published guidelines designed to help industry achieve the 20% reduction; these were for total sugar levels per 100 g and for the calorie content of products likely to be consumed on a single occasion, for the food categories included in the programme.
The contribution from Portugal describes its experience introducing the first Integrated Strategy for the Promotion of Healthy Eating, which is a cross-government and multisector policy document. The strategy led, in turn, to the adoption of multi-tiered tax on sugary drinks. Early results indicate that the tax led to the reformulation of sugary drinks to avoid the higher tier of taxation.

6 IMPROVING DIETARY INTAKE AND ACHIEVING FOOD PRODUCT IMPROVEMENT
1.4 Lessons on food product improvement from a workshop on first mover countries’ experience
* For a more detailed meeting report, see Improving dietary intake and achieving food product improvement: a workshop of “first mover” countries to exchange experience and identify wider policy implications for the WHO European Region (Copenhagen: WHO Regional Office for Europe; 2019).
Some key points for food product improvement policies emerged from a workshop co-convened in March 2019 by the WHO Regional Office for Europe, PHE and the Royal Institute of International Affairs (Chatham House).* Nine countries that were early implementers of policies or are particularly ambitious in their approach to food product improvement exchanged experiences.
At this workshop, some common challenges were identified with respect to the specific aspects of food product improvement considered in the present report – namely, product reformulation, price policies and FOP labelling; opportunities for collaborative work to address these challenges were also identified. These findings chime with many of the key themes identified in Section 1.3 above.
1.4.1 Food product reformulationAs highlighted in Section 1.3.1, the workshop found broad agreement that food reformulation belongs as part of a wider package of measures, including nutrition labelling, economic measures and marketing restrictions. Several common challenges were identified:
◉ The process of engagement on reformulation can be very time-consuming and requires considerable human resources, which is particularly challenging for small countries.
◉ Private sector stakeholders can sometimes appear to engage with the process while employing delaying tactics to impede real progress.
◉ Access to three types of data (product composition, sales volume and population intakes) and the right to publish such data are vital in order to set reformulation targets and to inform clear, transparent and independent monitoring of progress.
◉ Some food product categories can prove particularly challenging – either as a result of technical challenges or because of industry resistance to change – and it can be difficult to maintain momentum on reformulation.
◉ Improving the nutritional quality of food eaten out of the home (in restaurants, cafés and other food service outlets) is increasingly important, but it is challenging because there is no easy mechanism for monitoring.
A number of learning points emerged from countries’ collective experience of food product improvement:
◉ Setting targets based on sales-weighted figures is important to ensure that the biggest-selling products are covered, thereby facilitating bigger improvements in overall diets.
◉ It is important that processes are based on government definitions of portion sizes, based on dietary survey data. Such estimates are likely to be more reflective of actual consumer behaviour than industry-defined serving sizes.
◉ Taxes, whether actual taxes or mooted possible taxes, and the potential for legislation on product standards and/or improvement are particularly strong levers to push reformulation. It is worth noting that, even if taxes or legislation have only been introduced for one product category (e.g. SSBs), other sectors of industry may also be acutely aware that further taxes/regulations may be introduced in the future.
◉ Reformulation should be accompanied by efforts to reduce portion size and shift consumer behaviour, as part of a package of wider, complementary measures. In cases where reformulation is problematic (e.g. reducing sugars in fruit nectars), a focus on reducing portion sizes may be appropriate.
◉ Mandatory nutrition labelling, including sodium, sugars, and saturated and trans fats, is extremely important to facilitate monitoring (including monitoring of unpackaged foods). FOP nutrition labelling can be a useful lever to encourage reformulation. Nutrition information for food eaten outside the home is also important.
◉ In contexts where online food shopping is common, web-scraping technology can extract nutrition data from online retailers’ websites. Smartphone apps have also been developed to crowdsource data.
◉ It is important not to neglect the quality of food in public institutions. It is possible to set nutrient criteria to drive improvement in public procurement and food served or sold in public institutions.
◉ Governments should be aware that there can be consequences of reformulation. Sugar reduction, for example, could lead to increased use of non-sugar sweeteners, which are extremely difficult to monitor, especially as labels are usually required to declare only the presence (not the quantity) of such sweeteners.
1.4.2 Price policiesAs noted in Section 1.3.1, there has been growing momentum for implementation of SSB taxes across the WHO European Region, and there remains considerable scope to extend implementation of such taxes and/or to introduce other taxes, subsidies or policies on price promotions. Some key lessons were identified from countries’ experience to date.
◉ Price policies are a powerful lever for food product improvement – even in the case of products that are not covered by taxes, where there is awareness that the scope of taxes could be expanded in the future.

POLICY OPPORTUNITIES AND CHALLENGES 7
◉ Strategies to counter opposition to taxes are required. In collaboration with WHO, countries can work together in this area, compiling evidence of successful experiences, developing a playbook to address opposing arguments, and capturing better data to counteract these arguments (e.g. impact on smuggling, jobs and local economies; competition distortion).
◉ Ministries of economy/finance can be strong allies, since they tend to be supportive of taxation to raise revenue. Care should be taken to be clear that revenue generation is secondary to the impact of the tax on food product improvement and is not the primary aim.
◉ Public support for health-related taxes is both crucial and achievable; it may be fostered by earmarking tax revenue for health-related purposes and/or framing issues in relation to child health (particularly childhood obesity) and child rights.
◉ In addition to impact on demand (sales), evaluation of the impact of taxes should, where possible, include monitoring of changes in the supply (product composition); this will help to capture the impact on reformulation and other changes to products prior to and after introduction of taxes. Evaluation could also look at whether there are changes in public perception of the healthfulness of products following imposition of taxes.
1.4.3 FOP nutrition labellingAs well as influencing dietary purchases and consumption, FOP nutrition labelling can incentivize food product improvement, as described in Section 1.3.1. There are lessons to be learned from several countries’ experiences in implementing FOP nutrition labelling schemes that have been, or are in the process of being, implemented. The key learning points are as follows.
◉ FOP labels are a powerful lever to encourage manufacturers to reformulate their products and can be used as a benchmark for new product development.
◉ There is robust scientific evidence on the impact of labels on objective consumer understanding of the nutritional quality of foods – countries do not need to repeat all this research. Countries can draw on these research findings and, where needed, use the methods, protocols and resources from previous studies.
◉ When conducting consumer testing, it is advisable to do comparative tests to investigate whether different labelling systems improve objective understanding (rather than only investigating consumer preference or subjective performance).
◉ Mandatory back-of-pack nutrition declarations are an essential requirement for implementation of any FOP label.
◉ In order to ensure the maximum effect of a voluntary scheme, it is possible to attach some conditions of use to the label (e.g. requirement to include label on all products if used at all; provision of data on product composition).
◉ Retailers have also used the nutrient profile models that underpin FOP label systems as a basis for internal rules on promotions.
◉ FOP labelling belongs as part of a package of complementary measures that mutually reinforce one another.
1.4.4 Emergent themesSome common themes emerged from the workshop relevant to these areas of food product improvement, reinforcing many of the points from the case studies included in this report.
As with all areas of food policy, a key challenge is to create sufficient will among political leaders and policy decision-makers to take action. For this reason, provision of robust scientific evidence, expert advice and credible, quantified economic arguments is essential.
Policy-makers face vigorous opposition from vested interests using a variety of tactics, and this can prevent countries from taking action. Implementation of an open and transparent approach to policy processes, covering all communications, can be helpful for policy-makers.
Although it is challenging to put into practice, a whole-of-government approach is critical; health ministries can find important allies in other departments, such as finance, media, and regional or local government.
Public support for policies is also important, and the media (including media personalities) and civil society can be valuable allies to encourage such support. Support can be strengthened by framing issues around children’s health or child rights, and – in relation to taxes – earmarking revenue for health purposes can be valuable.
It is recognized that a comprehensive package of synergistic, complementary measures is vital, and this should include education and social marketing measures to support policy interventions.
It is important to acknowledge that implementation of these measures requires resources. Governments need to pursue programmes that are appropriate to their level of resources, and there is value in exploring how countries can ensure the most effective use of resources, including by working with regional and local government.
Finally, there is a great deal of potential for countries to work together in strategic ways. Policy-makers are all working to encourage an improved nutritional offer from a global food and beverage industry, and these efforts are more likely to be successful if countries work more closely together. Policy-makers require a strong evidence base for action, for example, and much could be achieved by sharing, drawing on and building on work – including both successes and failures – done in other countries.

8 IMPROVING DIETARY INTAKE AND ACHIEVING FOOD PRODUCT IMPROVEMENT
1.5 Key considerations discussed in the case studiesThe types and combination of policies that countries in the WHO European Region have chosen to introduce vary in terms of context and prior experience. Some countries have placed greater emphasis on voluntary reformulation, while others have pursued mandatory limits, taxation and labelling. A number of countries have introduced a combination of policies to try to ensure that the many and varied factors influencing obesity and unhealthy diets are covered. These case studies from such countries provide further context in terms of:
◉ how the problem has been defined in each country and the ways in which the case for action was built;
◉ the framework within which policies have been developed and implemented;
◉ why the specific approach and focus were chosen, the process of reaching agreement, and how the details were negotiated;
◉ how decisions were taken in terms of scale of ambition – optimal versus politically feasible;
◉ the actors involved in designing, implementing and evaluating action (and how these roles were assigned);
◉ the accountability mechanisms put in place to monitor progress and the approach taken to incentivize action/change; and
◉ any challenges and opposition experienced on the way and how countries overcame them.
The case studies also aim to describe how countries will evaluate their efforts in terms of changes in dietary intake, and how they respond to challenges such as slower-than-expected progress.

POLICY OPPORTUNITIES AND CHALLENGES 9
1.6 References *
* Unless otherwise stated, all websites mentioned in the References were accessed on 18 March 2019.
1. Slimani N, Deharveng G, Southgate DA, Biessy C, Chajès V, van Bakel MM et al. Contribution of highly industrially processed foods to the nutrient intakes and patterns of middle-aged pop-ulations in the European Prospective Investigation into Cancer and Nutrition study. Eur J Clin Nutr. 2009;63 Suppl 4:S206–25 (http://dx.doi.org/10.1038/ejcn.2009.82).
2. Monteiro CA, Moubarac JC, Levy RB, Canella DS, Louzada MLDC, Cannon G. Household availability of ultra-processed foods and obesity in nineteen European countries. Public Health Nutr. 2018;21(1):18–26 (http://dx.doi.org/10.1017/S1368980017001379).
3. Rippin HL, Hutchinson J, Jewell J, Breda JJ, Cade JE. Adult Nutrient Intakes from Current National Dietary Surveys of European Populations. Nutrients 2017; 9,1288 (https://doi.org/10.3390/nu9121288).
4. Rippin HL, Hutchinson J, Jewell J, Breda JJ, Cade JE. Child and adolescent nutrient intakes from current national dietary surveys of European populations. Nutr Res Rev. 2018;3:1–32 (http://dx.doi.org/ 10.1017/S0954422418000161).
5. Evaluating implementation of the WHO set of recommenda-tions on the marketing of foods and non-alcoholic beverages to children: progress, challenges and guidance for next steps in the WHO European Region. Copenhagen: WHO Regional Office for Europe; 2018 (http://www.euro.who.int/__data/assets/pdf_file/0003/384015/food-marketing-kids-eng.pdf).
6. Wright J, Kamp E, White M, Adams J, Sowden S. Food at checkouts in non-food stores: a cross-sectional study of a large indoor shopping mall. Public Health Nutr. 2015;18(15):2786–93 (http://dx.doi.org/10.1017/S1368980015000178).
7. Ravensbergen EA, Waterlander WE, Kroeze W, Steenhuis IH. Healthy or unhealthy on sale? A cross-sectional study on the proportion of healthy and unhealthy foods promoted through flyer advertising by supermarkets in the Netherlands. BMC Public Health. 2015;6;15:470 (http://dx.doi.org/10.1186/s12889-015-1748-8).
8. Institute for Health Metrics and Evaluation. GBD compare. Seat-tle: University of Washington; 2016 (https://vizhub.healthdata.org/gbd-compare).
9. Egger G, Swinburn B. An “ecological” approach to the obesity pandemic. BMJ. 1997;315(7106):477.
10. Swinburn B, Kraak V, Rutter H, Vandevijvere S, Lobstein T, Sacks G et al. Strengthening of accountability systems to create healthy food environments and reduce global obesity. Lancet. 2015;26;385(9986):2534–45.
11. Hawkes C, Smith TG, Jewell J, Wardle J, Hammond RA, Friel S et al. Smart food policies for obesity prevention. Lancet. 2015;13;385(9985):2410–21 (http://dx.doi.org/10.1016/S0140-6736(14)61745-1).
12. European Food and Nutrition Action Plan 2015–2020. Copen-hagen: WHO Regional Office for Europe; 2014 (http://www.euro.who.int/__data/assets/pdf_file/0008/253727/64wd14e_FoodNutAP_140426.pdf).
13. Better food and nutrition in Europe: a progress report moni-toring policy implementation in the WHO European Region. Copenhagen: WHO Regional Office for Europe; 2018 (http://www.euro.who.int/__data/assets/pdf_file/0005/355973/ENP_eng.pdf).
14. “Best buys” and other recommended interventions for the pre-vention and control of noncommunicable diseases. Geneva: World Health Organization; 2017 (http://www.who.int/ncds/management/WHO_Appendix_BestBuys_LS.pdf).
15. Dobbs R, Sawers C, Thompson F, Manyika J, Woetzel JR, Child P et al. Overcoming obesity: an initial economic analysis. McKinsey Global Institute; 2014 (https://www.mckinsey.com/~/media/McKinsey/Business%20Functions/Economic%20Studies%20TEMP/Our%20Insights/How%20the%20world%20could%20better%20fight%20obesity/MGI_Overcoming_obesi-ty_Full_report.ashx).
16. Kraak VI, Vandevijvere S, Sacks G, Brinsden H, Hawkes C, Barquera S et al. Progress achieved in restricting the marketing of high-fat, sugary and salty food and beverage products to children. Bull World Health Organ. 2016;1;94(7):540–8 (http://dx.doi.org/10.2471/BLT.15.158667).
17. Kelly B, Jewell J. What is the evidence on the policy spec-ifications, development processes and effectiveness of existing front-of-pack food labelling policies in the WHO European Region? Copenhagen: WHO Regional Office for Europe; 2018 (http://www.euro.who.int/__data/assets/pdf_file/0007/384460/Web-WHO-HEN-Report-61-on-FOPL.pdf).
18. Boyland E, Garde A, Jewell J, Tatlow-Golden M. Evaluating implementation of the WHO set of recommendations on the marketing of foods and non-alcoholic beverages to children: progress, challenges and guidance for next steps in the WHO European Region. Copenhagen: WHO Regional Office for Europe; 2018 (http://www.euro.who.int/__data/assets/pdf_file/0003/384015/food-marketing-kids-eng.pdf).
19. Hawkes C, Jewell J, Allen K. A food policy package for healthy diets and the prevention of obesity and diet-related non-com-municable diseases: the NOURISHING framework. Obes Rev. 2013;14 Suppl 2:159–68 (http://dx.doi.org/10.1111/obr.12098).
20. Roberto CA, Swinburn B, Hawkes C, Huang TT, Costa SA, Ashe M et al. Patchy progress on obesity prevention: emerging examples, entrenched barriers, and new thinking. Lancet. 2015;385(9985):2400–9 (http://dx.doi.org/10.1016/S0140-6736(14)61744-X).
21. First Action Plan for Food and Nutrition Policy in the WHO Eu-ropean Region 2000–2005. Copenhagen: WHO Regional Office for Europe; 2001 (http://www.euro.who.int/__data/assets/pdf_file/0013/120244/E72199.pdf).
22. Global nutrition policy review: what does it take to scale up nutrition action? Geneva: World Health Orga-nization; 2013 (http://apps.who.int/iris/bitstream/han-dle/10665/84408/9789241505529_eng.pdf).
23. Pietinen P, Valsta LM, Hirvonen T, Sinkko H. Labelling the salt content in foods: a useful tool in reducing sodium intake in Finland. Public Health Nutr. 2008;11(4):335–40 (https://doi.org/10.1017/S1368980007000249).
24. Guideline: sodium intake for adults and children. Geneva: World Health Organization; 2012 (https://www.who.int/nu-trition/publications/guidelines/sodium_intake_printversion.pdf).
25. Guideline: sugars intake for adults and children. Geneva: World Health Organization; 2015 (http://apps.who.int/iris/bitstream/handle/10665/149782/9789241549028_eng.pdf).

10 IMPROVING DIETARY INTAKE AND ACHIEVING FOOD PRODUCT IMPROVEMENT
26. Cecchini M, Warin L. Impact of food labelling systems on food choices and eating behaviours: a systematic review and me-ta-analysis of randomized studies. Obes Rev. 2016;17(3):201–10 (https://doi.org/10.1111/obr.12364).
27. Escobar MA, Veerman JL, Tollman SM, Bertram MY, Hofman KJ. Evidence that a tax on sugar-sweetened beverages reduces the obesity rate: a meta-analysis. BMC Public Health. 2013;13:1072 (https://doi.org/10.1186/1471-2458-13-1072).
28. NCD Global Monitoring Framework. Geneva: World Health Organization; 2014 (https://www.who.int/nmh/global_moni-toring_framework/en).
29. Political Declaration of the Third High-level Meeting of the General Assembly on the Prevention and Control of Non-communicable Diseases. New York (NY): United Nations; 2018 (http://www.un.org/ga/search/view_doc.asp?symbol-=A/73/L.2&Lang=E).
30. Corvalán C, Reyes M, Garmendia ML, Uauy R. Structural responses to the obesity and non-communicable diseases epidemic: the Chilean Law of Food Labeling and Advertising. Obes Rev. 2013;14 Suppl 2:79–87 (https://doi.org/10.1111/obr.12099).
31. Tedstone AE. Repeating the success of the salt reduction programme. BMJ. 2016;355:i6079 (https://doi.org/10.1136/bmj.i6079).
32. Department of Health and Social Care: Global Public Health Directorate: Obesity, Food and Nutrition. Childhood obesity action plan. Chapter 2. London: HM Government; 2018 (https://assets.publishing.service.gov.uk/government/uploads/system/uploads/attachment_data/file/718903/childhood-obesity-a-plan-for-action-chapter-2.pdf).
33. Nutri-Score. Saint-Maurice: Santé publique France; 2018 (https://www.santepubliquefrance.fr/Sante-publique-France/Nutri-Score).
34. Noncommunicable diseases: progress monitor 2017. Geneva: World Health Organization; 2017 (http://apps.who.int/iris/bit-stream/handle/10665/258940/9789241513029-eng.pdf).
35. Global nutrition policy review 2016–2017: country progress in creating enabling policy environments for promoting healthy diets and nutrition (DRAFT). Geneva: World Health Organiza-tion; 2018 (https://www.who.int/nutrition/topics/global-nutri-tion-policy-review-2016.pdf).
36. Rito A, Cruz de Sousa R, Mendes S, Graça P. Childhood Obesity Surveillance Initiative: COSI Portugal 2016. Lisbon: Instituto Nacional de Saúde Doutor Ricardo Jorge/Ministry of Health of Portugal; 2017 (http://repositorio.insa.pt/bit-stream/10400.18/4857/8/COSI%202016_V2_fev2018.pdf).
37. Public Health England. Record high levels of severe obesity found in year 6 children [press release]. London: HM Govern-ment; 2018 (https://www.gov.uk/government/news/record-high-levels-of-severe-obesity-found-in-year-6-children).
38. MacGregor GA, Hashem KM. Action on sugar: lessons from UK salt reduction programme. Lancet. 2014;15;383(9921):929–31 (https://doi.org/10.1016/S0140-6736(14)60200-2).
39. van Raaij JM, Hendriksen M, Verhagen H. Potential for improve-ment of population diet through reformulation of commonly eaten foods. Public Health Nutr. 2009;12(3):325–30 (https://doi.org/10.1017/S1368980008003376).
40. Lehmann U, Charles VR, Vlassopoulos A, Masset G, Spield-enner J. Nutrient profiling for product reformulation: public health impact and benefits for the consumer. Proc Nutr Soc. 2017;76(3):255–264 (https://doi.org/10.1017/S0029665117000301).
41. Kloss L, Meyer JD, Graeve L, Vetter W. Sodium intake and its reduction by food reformulation in the European Union: a review. NFS Journal. 2015;1:9–19 (https://doi.org/10.1016/j.nfs.2015.03.001).
42. Trieu K, Neal B, Hawkes C, Dunford E, Campbell N, Rodri-guez-Fernandez R et al. Salt reduction initiatives around the world: a systematic review of progress towards the global tar-get. PLoS One. 2015;10(7):e0130247 (https://doi.org/10.1371/journal.pone.0130247).
43. Mapping salt reduction initiatives in the WHO Europe-an Region. Copenhagen: WHO Regional Office for Eu-rope; 2013 (http://www.euro.who.int/__data/assets/pdf_file/0009/186462/Mapping-salt-reduction-initia-tives-in-the-WHO-European-Region.pdf).
44. Using dietary intake modelling to achieve population salt reduction: a guide to developing a country-specific salt reduction model. Copenhagen: WHO Regional Office for Europe; 2018 (http://www.euro.who.int/__data/assets/pdf_file/0004/365242/salt-report-eng.pdf).
45. Scrinis G, Monteiro CA. Ultra-processed foods and the limits of product reformulation. Public Health Nutr. 2018;21(1):247–52 (https://doi.org/10.1017/S1368980017001392).
46. Baker P, Friel S. Processed foods and the nutrition transition: evidence from Asia. Obes Rev. 2014;15(7):564–77 (https://doi.org/10.1111/obr.12174).
47. Tedstone A, Targett V. Public Health England replies to Mike Rayner and colleagues. BMJ. 2015;351:h6591 (https://doi.org/10.1136/bmj.h6591).
48. Ares G, Aschemann-Witzel J, Curutchet MR, Antúnez L, Machín L, Vidal L et al. Product reformulation in the con-text of nutritional warning labels: exploration of consumer preferences towards food concepts in three food categories. Food Res Int. 2018;107:669–74 (https://doi.org/10.1016/j.foodres.2018.03.021).
49. Fiscal policies for diet and prevention of noncommunicable diseases: technical meeting report, 5–6 May 2015, Geneva, Switzerland. Geneva: World Health Organization; 2016 (http://apps.who.int/iris/bitstream/handle/10665/250131/9789241511247-eng.pdf).
50. Colchero MA, Guerrero-López CM, Molina M, Rivera JA. Bev-erages sales in Mexico before and after implementation of a sugar sweetened beverage tax. PLoS One. 2016;11(9):e0163463 (https://doi.org/10.1371/journal.pone.0163463).
51. Colchero MA, Rivera-Dommarco J, Popkin BM, Ng SW. In Mexico, evidence of sustained consumer response two years after implementing a sugar-sweetened beverage tax. Health Aff (Millwood). 2017;36(3):564–71 (https://doi.org/10.1377/hlthaff.2016.1231).
52. Tedstone A, Coulton V, Targett V, Bennett A, Sweeney K, Morgan K et al. Sugar reduction and wider reformulation programme: report on progress towards the first 5% reduction and next steps. London: Public Health England; 2018 (https://assets.publishing.service.gov.uk/government/uploads/system/uploads/attachment_data/file/709008/Sugar_reduction_prog-ress_report.pdf).

POLICY OPPORTUNITIES AND CHALLENGES 11
53. Powles J, Fahimi S, Micha R, Khatibzadeh S, Shi P, Ezzati M et al. Global, regional and national sodium intakes in 1990 and 2010: a systematic analysis of 24 h urinary sodium excretion and dietary surveys worldwide. BMJ Open. 2013;3(12):e003733 (https://doi.org/10.1136/bmjopen-2013-003733).
54. Global Action Plan for the Prevention and Control of NCDs 2013–2020. Geneva: World Health Organiza-tion; 2013 (http://apps.who.int/iris/bitstream/han-dle/10665/94384/9789241506236_eng.pdf).
55. Laatikainen T, Pietinen P, Valsta L, Sundvall J, Reinivuo H, Tuomilehto J. Sodium in the Finnish diet: 20-year trends in urinary sodium excretion among the adult population. Eur J Clin Nutr. 2006;60(8):965–70.
56. Karppanen H, Mervaala E. Sodium intake and hypertension. Prog Cardiovasc Dis. 2006;49(2):59–75.
57. He FJ, Brinsden HC, MacGregor GA. Salt reduction in the United Kingdom: a successful experiment in public health. J Hum Hypertens. 2014;28(6):345–52 (https://doi.org/10.1038/jhh.2013.105).
58. The SHAKE Technical Package for Salt Reduction. Geneva: World Health Organization; 2016 (http://apps.who.int/iris/bit-stream/handle/10665/250135/9789241511346-eng.pdf).
59. Milder I, Toxopeus I, Westenbrink S, van den Bogaard C, van Raaij JM, Temme E. Salt, saturated fat and sugars in selected foods in EU Member States. EuroFIR, edited by Dutch National Institute for Public Health (RIVM); 2015 (http://www.akkoord-verbeteringproductsamenstelling.nl).
60. Finglas PM, Berry R, Astley S. The contribution of food compo-sition resources to nutrition science methodology. Nutr Bull. 2017;42(3):198–206 (https://doi.org/10.1111/nbu.12274).
61. Hendriksen MA, Verkaik-Kloosterman J, Noort MW, van Raaij JM. Nutritional impact of sodium reduction strategies on sodium intake from processed foods. Eur J Clin Nutr. 2015;69(7):805–10 (https://doi.org/10.1038/ejcn.2015.15).
62. Lacey C, Clark B, Frewer L, Kuznesof S. “Reaching its lim-its”: industry perspectives on salt reduction. Br Food J. 2016;118(7):1610–24 (http://dx.doi.org/10.1108/BFJ-01-2016-0027).
63. Charlton K, Webster J, Kowal P. To legislate or not to legislate? A comparison of the UK and South African approaches to the development and implementation of salt reduction programs. Nutrients. 2014;6(9):3672–95 (http://dx.doi.org/10.3390/nu6093672).
64. Allemandi L, Tiscornia MV, Ponce M, Castronuovo L, Dunford E, Schoj V. Sodium content in processed foods in Argentina: compliance with the national law. Cardiovasc Diagn Ther. 2015;5(3):197–206 (http://dx.doi.org/10.3978/j.issn.2223-3652.2015.04.01).
65. Besluit van 15 November 2012, houdende wijziging van het Warenwetbesluit Meel en brood inzake het maximale zout-gehalte van brood [Commodities Act with regulation of the maximum level of salt in bread]. No. 598. The Hague: Ministry of Health, Welfare and Sport; 2012 (in Dutch) (https://zoek. officielebekendmakingen.nl/stb-2012-598.html).
66. Incentives and disincentives for reducing sugar in man-ufactured foods. Copenhagen: WHO Regional Office for Europe; 2017 (http://www.euro.who.int/__data/assets/pdf_file/0004/355972/Sugar_Report_eng.pdf).
67. Popkin BM, Hawkes C. Sweetening of the global diet, par-ticularly beverages: patterns, trends, and policy responses. Lancet Diabetes Endocrinol. 2016;4(2):174–86 (http://dx.doi.org/10.1016/S2213-8587(15)00419-2).
68. Tedstone A, Targett V, Owtram G, Pyne V, Allen R, Bathrellou K et al. Sugar reduction – achieving the 20%: a technical report outlining progress to date, guidelines for industry, 2015 baseline levels in key foods and next steps. London: Public Health England; 2017 (https://assets.publishing.service.gov.uk/government/uploads/system/uploads/attachment_data/file/604336/Sugar_reduction_achieving_the_20_.pdf).
69. Goiana da Silva F, Cruz e Silva D, Gregorio MJ, Miraldo M, Darzi A, Araujo F. The future of the sweetened beverages tax in Portugal. Lancet Public Health. 2018;3(12):e562 (http://dx.doi.org/10.1016/S2468-2667 (18)30240-8).

12 IMPROVING DIETARY INTAKE AND ACHIEVING FOOD PRODUCT IMPROVEMENT
2.1 SummaryPublic Health England (PHE) oversees for the United Kingdom government the sugar reduction and wider reformulation programme. The United Kingdom government outlined its commitment to reformulation, the overall approach and PHE’s responsibilities in Childhood obesity: a plan for action, published in August 2016;2 the second and third chapter of the plan, following in June 2018 and July 2019 respectively, builds on the earlier publication, outlining the scale of change required and the broad set of policy actions needed to maintain momentum.3 The plan sets out the government’s bold ambition to halve childhood obesity by 2030 and to significantly reduce the gap in obesity between children from the most and least deprived areas by that year.
The United Kingdom, led by England, where most global food and beverage businesses have their main UK headquarters, has three reformulation and reduction programmes; these work with the food and beverage industry (retailers, manufacturers and the out-of-home sector – cafés, coffee shops, restaurants, takeaways, deliveries, etc.) to achieve salt, sugar and calorie reduction. These programmes are supported by the other countries that form the United Kingdom (Scotland, Wales and Northern Ireland).
The key elements of the voluntary reduction and reformulation programmes are as follows.
◉ Action is called for across the food manufacturing and supply chain, including the out-of-home sector. Working in this way has the advantage of keeping an even playing field and does not affect competitiveness
◉ Clear targets or guidelines are set for the food and drink categories that contribute most to intakes.
◉ There is independent, effective and regular monitoring and reporting that is consistent across all participants and ensures openness and transparency.
◉ The programmes ensure that there is regular and comprehensive stakeholder engagement with all parts of the food industry, nongovernmental organizations (NGOs), other government departments, etc.
◉ Consumer demand for healthier products is encouraged through social marketing and campaigns.
◉ The health and economic case for the programmes and the expected benefits to the National Health Service (NHS) have been published.
◉ The government has made it clear that, if there is not sufficient action or achievement through the voluntary programmes to reduce sugar and calories, then other actions will follow.
The sugar and calorie reduction programmes are based on the model established for the salt reduction programme devised by the Food Standards Agency (FSA) over 10 years ago. They have also drawn on learning from the Public Health Responsibility Deal (PHRD), a public–private partnership launched in 2011 that included a calorie reduction element.4 Since publication of the Foresight report on obesity in 2007,5 which highlighted that obesity is a complex problem with multiple drivers, most of them outside the health sector, strategies for tackling obesity have been cross-government. All parts of Childhood obesity: a plan for action, launched in 2016, 2018 and 2019, are cross-government plans.2,3
The growing evidence on sugar as a cause of tooth decay and determinant of high energy intake, weight gain and diabetes underpins some of the policy actions outlined in the Childhood obesity: a plan for action strategy.6 There is also convincing evidence that high intakes of very calorific and energy-dense foods that are high in fat and/or sugar specifically – similar to the current United Kingdom diet – increase the risk of gaining weight and
2UNITED KINGDOMSugar reduction and wider reformulation programme: a case study on the approach and how it was developed
Tazeem Bhatia, Victoria Targett, Alison Tedstone 1

POLICY OPPORTUNITIES AND CHALLENGES 13
becoming overweight.5,6,7 Physical activity can help with weight maintenance, but to tackle obesity it is vital to target changes in diet.
Overweight and obesity is estimated to depress the UK economy by 3.4% of GDP.1 The health and economic benefits of reducing sugar consumption to 5% energy intake are higher the faster they are achieved. If achieved within five years, 77 300 deaths and 6.03 million cases of dental caries could be averted, saving the NHS £14.4 billion over 25 years.8 Similarly, a 20% reduction in calories from everyday foods, resulting in a decreased consumption of 52–87 daily
calories (depending on the age of the individual), if achieved over five years, would prevent 35 370 premature deaths, save the NHS £4.5 billion health care costs, and save social care costs of around £4.48 billion over a 25-year period.9
A clear ambition to reduce sugar by 20% in the most consumed foods has been made possible by a combination of the scientific evidence, recognition of the health and economic benefits of both sugar and calorie reduction, increasing international agreement on the need to test cost–effective interventions, the availability of detailed nutritional content and purchase data, growing consumer concern and coherent advocacy.
2.2 IntroductionGlobally, obesity prevalence has nearly tripled since 1975.10 Obesity prevalence in the England has risen from 15% in 1993 to 29% in 20172; this is one of the highest rates in Europe.11 Limited success from motivating individual behavioural change and recognition that the environment has a key influence on choice and that overconsumption is the key driver of contemporary increases in obesity have brought about a fundamental shift in the policy approach to obesity.12 Interventions that focus on individual choice are being complemented by policy that takes an ecological approach, recognizing that individuals are ultimately responsible for their health behaviours but that children have less agency than adults and that choices are made in the context of a larger, “obesogenic” environment.5
This case study consists of two major sections. Section 2.3 uses a theory of political economy to analyse England’s policy experiences and the way in which these have shaped the current sugar and calorie reduction programmes in the United Kingdom. Section 2.4 describes the reformulation and reduction programmes, the achievements so far, and the challenges still to be faced. The case study is a combination of synthesized published information (principally, Sugar reduction: achieving the 20%13 and Calorie reduction: the scope and ambition for action9) and interviews with key stakeholders from PHE, the food and beverage industry, and NGOs.
2.3 Analysis of the policy processThe United Kingdom is the first country to introduce a structured and closely monitored product reformulation process, in collaboration with the food industry, to reduce both the sugar content and calories consumed by children. To explain this process, the paper adopts John Kingdon’s 1984 political economy theory of organizing different forces.14
According to Kingdon, several different critical forces must converge to establish policy reform, known as three “streams”:
◉ the problem stream, which forces policy-makers to recognize the importance of a problem and give it priority;
◉ the policy stream, which is the process by which policy proposals are generated, debated, revised, and put forth for serious consideration; and
◉ the politics stream, which refers to political factors that influence agendas, such as changes in elected officials or in the political climate or mood, and the voices of advocacy or opposition groups.
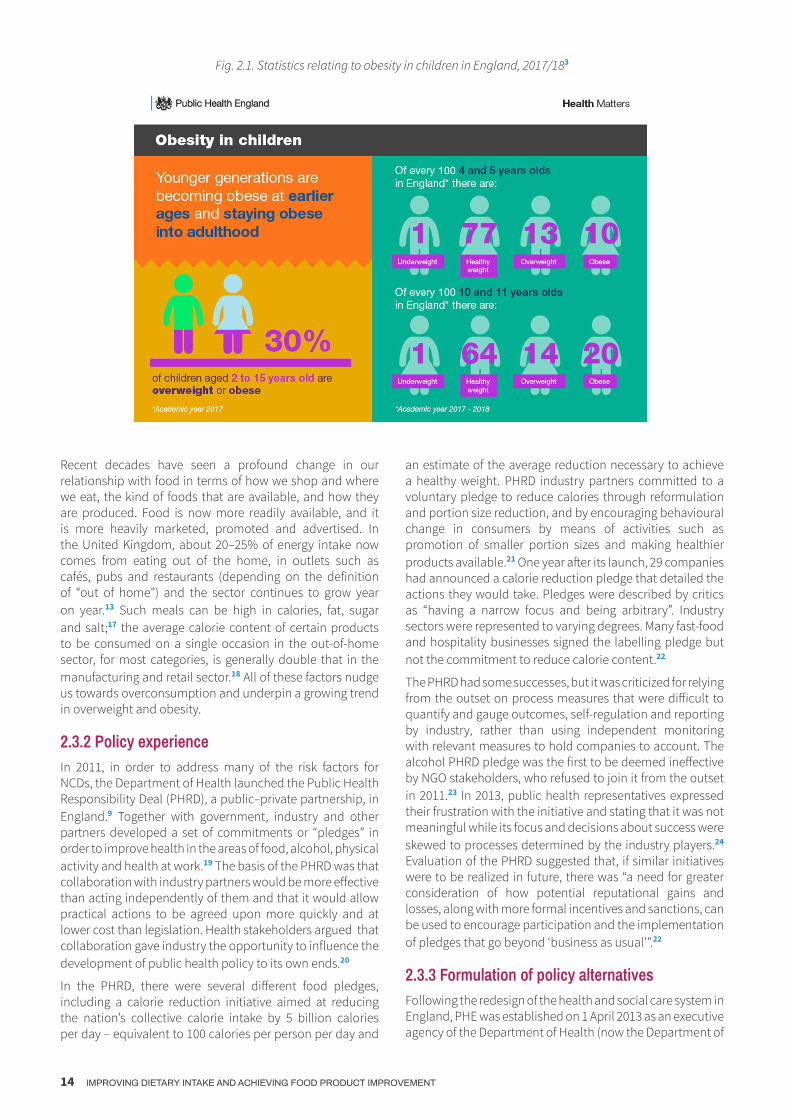
2.3.1 Size of the “problem”In 2017, in England, 64% of adults, 30% of 2-15-year-olds were overweight or obese.2 (Fig. 2.1).15 Obesity puts an individual at increased risk of other diseases, such as type 2 diabetes, some cancers and heart disease, and it affects the emotional and educational life chances of children.16,17 According to calculations by the OECD, managing overweight accounts for 8.4% of health expenditure in the UK and people live on average 2.7 years less due to overweight.Further, OECD estimate that obesity has an impact on economic development and lowers labour market outputs by the equivalent of 944 thousand full-time workers per year, reducing UK’s GDP by 3.4% because of lost work days, lower productivity at work, mortality and permanent disability. To cover these costs, this is equivalent to each person in the United Kingdom paying an additional GBP 409 in taxes per year.1
14 IMPROVING DIETARY INTAKE AND ACHIEVING FOOD PRODUCT IMPROVEMENT
Fig. 2.1. Statistics relating to obesity in children in England, 2017/183
Recent decades have seen a profound change in our relationship with food in terms of how we shop and where we eat, the kind of foods that are available, and how they are produced. Food is now more readily available, and it is more heavily marketed, promoted and advertised. In the United Kingdom, about 20–25% of energy intake now comes from eating out of the home, in outlets such as cafés, pubs and restaurants (depending on the definition of “out of home”) and the sector continues to grow year on year.13 Such meals can be high in calories, fat, sugar and salt;17 the average calorie content of certain products to be consumed on a single occasion in the out-of-home sector, for most categories, is generally double that in the manufacturing and retail sector.18 All of these factors nudge us towards overconsumption and underpin a growing trend in overweight and obesity.
2.3.2 Policy experienceIn 2011, in order to address many of the risk factors for NCDs, the Department of Health launched the Public Health Responsibility Deal (PHRD), a public–private partnership, in England.9 Together with government, industry and other partners developed a set of commitments or “pledges” in order to improve health in the areas of food, alcohol, physical activity and health at work.19 The basis of the PHRD was that collaboration with industry partners would be more effective than acting independently of them and that it would allow practical actions to be agreed upon more quickly and at lower cost than legislation. Health stakeholders argued that collaboration gave industry the opportunity to influence the development of public health policy to its own ends.20
In the PHRD, there were several different food pledges, including a calorie reduction initiative aimed at reducing the nation’s collective calorie intake by 5 billion calories per day – equivalent to 100 calories per person per day and
an estimate of the average reduction necessary to achieve a healthy weight. PHRD industry partners committed to a voluntary pledge to reduce calories through reformulation and portion size reduction, and by encouraging behavioural change in consumers by means of activities such as promotion of smaller portion sizes and making healthier products available.21 One year after its launch, 29 companies had announced a calorie reduction pledge that detailed the actions they would take. Pledges were described by critics as “having a narrow focus and being arbitrary”. Industry sectors were represented to varying degrees. Many fast-food and hospitality businesses signed the labelling pledge but not the commitment to reduce calorie content.22
The PHRD had some successes, but it was criticized for relying from the outset on process measures that were difficult to quantify and gauge outcomes, self-regulation and reporting by industry, rather than using independent monitoring with relevant measures to hold companies to account. The alcohol PHRD pledge was the first to be deemed ineffective by NGO stakeholders, who refused to join it from the outset in 2011.23 In 2013, public health representatives expressed their frustration with the initiative and stating that it was not meaningful while its focus and decisions about success were skewed to processes determined by the industry players.24 Evaluation of the PHRD suggested that, if similar initiatives were to be realized in future, there was “a need for greater consideration of how potential reputational gains and losses, along with more formal incentives and sanctions, can be used to encourage participation and the implementation of pledges that go beyond ‘business as usual’”.22
2.3.3 Formulation of policy alternativesFollowing the redesign of the health and social care system in England, PHE was established on 1 April 2013 as an executive agency of the Department of Health (now the Department of

POLICY OPPORTUNITIES AND CHALLENGES 15
Health and Social Care or DHSC). From its inception, PHE in its statutory role began to review the evidence and support the Department of Health in rethinking its approach to tackling obesity. In 2014, the Scientific Advisory Committee on Nutrition (SACN) published its draft recommendation that the average population intakes of sugar should not exceed 5% of total dietary energy for the population aged 2 years and over, halving the previous recommendation;6 it noted that sugar intakes of all population groups in England were above the recommendations, contributing up to 15.6% of dietary energy.24
In October 2015, PHE published Sugar reduction: the evidence for action.8 The report set out several potential actions that could be taken to reduce sugar intake. It claimed that no single action alone would be effective in reducing sugar intake, but that a combination of demand- and supply-side actions was required. Some of the proposed actions then went on to form the basis of the government’s plan to reduce the prevalence of childhood obesity, Childhood obesity: a plan for action, published in August 2016.4
A key action in the plan was the introduction of a broad, structured and transparently monitored programme of gradual sugar reduction in food and drink that contribute most to children’s intakes across all sectors of the food industry. The ambition set out by the programme would still be voluntary, but – unlike the PHRD – all sectors of industry (manufacturers, retailers and the out-of-home sector) would have the same guidelines and would have their progress measured against them.
The idea was modelled on the United Kingdom’s salt reduction programme, which had been successful in driving down population intakes of salt by 11% between 2005 and 2014.25 This had been achieved predominantly through reformulation of processed foods, with the result that the public had continued to eat the same foods but had not necessarily been aware that they were consuming less salt.26 There were a number of key lessons to be learned from the salt reduction programme.28
◉ (1) A collaborative approach with clear direction was needed in which progressively lower targets were set with industry.
◉ (2) A strong evidence base for action on a broad front was required.
◉ (3) Market share analysis should be used to determine where to focus efforts, although guidance should apply to a broad range of product types and to all food businesses.
◉ (4) Clear, independent monitoring through a “commitments table” was required, which would allow organizations to demonstrate progress using transparent, meaningful data and to operate on a level playing field that would avoid issues of competition.
* The social marketing plan aims to develop and execute campaigns targeted at lower sociodemographic populations who suffer disproportionately negative health outcomes and to report their success against this group to ensure measurable, long-term impact, while taking all appropriate steps to avoid increasing health inequalities.
◉ (5) There should be simultaneous monitoring of population consumption data – in the case of salt, through 24-hour urinary samples – to measure population change.
◉ (6) Consumer demand for healthier products should be encouraged through application of demand-side initiatives such as food labelling and consumer awareness campaigns.*
Earlier in 2016, the same year as the launch of Childhood obesity: a plan for action, HM Treasury provided another part of the government’s sugar reduction programme when it picked up a recommendation from the evidence review and announced a levy on soft drinks with added sugar (soft drinks industry levy or SDIL). The levy was intended to encourage producers to reformulate their product ranges by reducing added sugar content, helping customers choose low- or no-added-sugar products, and reducing portion size.
2.3.4 Changing political climateIn 1994, the evidence identifying sodium, and therefore salt intake, as a key determinant of high blood pressure was considered sufficient that the Committee on Medical Aspects of Food and Nutrition Policy (COMA) recommended a reduction in salt intake to < 6 g per day.27 The then Department of Health did not accept the recommendation made based on a light-touch review. This mobilized a civil society response to advocate for action on salt, most notably by the group Consensus Action on Salt (CASH).
In 2000, the FSA was set up to be an independent food safety and standards body that was free from ministerial control but could report to parliament through the public health minister. The independent SACN was set up at the same time, replacing COMA, to advise both the FSA and the government on the evidence for nutrition and health. The FSA had an independently elected board, which decided on policy in open meetings.28
In 2001, SACN conducted an in-depth review of the increasing evidence base, re-endorsed the recommendation made by COMA seven years previously, and thus refuted the challenges that had been levelled at COMA’s findings.29 The FSA then devised a strategy for salt reduction and, after extensive discussions with the food industry and NGOs, published a first set of targets in 2006 to be met by 2010. The aim of the programme was to have a cyclical process of gradually reducing targets that were reviewed and against which progress was regularly measured. Simultaneously the FSA set up robust mechanisms to measure the effect on population consumption. The targets have subsequently been reviewed and revised in 2009, 2011 and 2014.
The United Kingdom salt reduction programme succeeded in reducing levels of salt in foods by up to 50% and population average salt intakes by 11% (to 8.0 g per day) between 2004 and 2014.30 The resulting reduction in blood pressure has contributed to a reduction in stroke and cardiovascular disease. Many other countries, including

16 IMPROVING DIETARY INTAKE AND ACHIEVING FOOD PRODUCT IMPROVEMENT
Argentina, Australia, Brazil, Canada, Chile, South Africa and the United States, have since adopted the salt reduction model that the FSA pioneered.30
The success of the salt reduction programme demonstrated that a voluntary, but structured, reduction and reformulation can result in action by industry and significantly improved health outcomes. The FSA demonstrated its ability to broker and achieve voluntary agreements with the food industry that also responded to the concerns and critical support of civil society. This is in contrast to the PHRD, which was self-regulated and failed to demonstrate significant improvements in health outcomes.
With obesity rates growing faster in England in the 1990s than in most other OECD countries and England having the second highest obesity rates in Europe,31 the first decade of the millennium saw obesity policy emerge as a priority, with an ever-increasing number of policy reports and media and public scrutiny of policy actions.32 In 2007, a government-commissioned programme, the Foresight programme, released a report with a clear and stark message: obesity is a complex problem with multiple drivers, most of them outside the health sector; it has huge cost implications for government and the wider economy; and it will become even more serious unless a comprehensive, coordinated approach is taken.5 The report set out a framework and a clear sense of direction for obesity policy. A cross-government obesity strategy was released in 2008, followed by another in 2011 following the change in administration. Both recognized the importance of overconsumption as a key driver of the contemporary increases in obesity and placed the emphasis firmly on reducing energy intake.
By the time SACN’s draft report Carbohydrates and health was published in 2014,6 advising that free sugars should contribute no more than 5% to energy intakes, nutrition policy advice had moved to PHE, which – though (unlike the FSA) not completely independent of ministerial control – was operationally autonomous and independent in its advice. PHE began reviewing the evidence on interventions to reduce sugar intake, given that the United Kingdom population was far exceeding consumption recommendations. In 2014, WHO also consulted on new draft global sugar guidelines that included a conditional recommendation for adults and children to reduce the intake of free sugars to 5% of total energy intake to achieve the best health.33
At that time, other countries were experimenting with different policy measures to curb consumption of sugar. Between 2002 and 2004 Mexico had implemented a sales tax on sweetened soft drinks with high fructose corn syrup but dropped the tax after losing several law suits; finally, in 2014, it succeeded in introducing a sugar tax on all soft drinks.34 Chile, Barbados and Dominica followed with similar taxes. France had also introduced a soda tax in 2013.
The strength of the evidence reviewed by an independent scientific body enabled critical understanding; increasing international agreement on the need for cost–effective solutions to reduce sugar consumption and the deployment of civil society, including celebrity advocates such as the
chef Jamie Oliver calling for action on sugar, worked to build public support for policies such as the sugar-sweetened beverage tax.
Attention was further drawn to the need for public health action to tackle obesity when in October 2015 the Health Select Committee (HSC), a cross-party parliamentary committee that oversees the operations of the Department of Health and Social Care, held an inquiry into childhood obesity. A great deal of attention was focused on the committee’s proceedings because of the breadth of stakeholder and press interest and expectations surrounding PHE’s evidence review.35 PHE’s report Sugar reduction: the evidence for action was published two days after PHE gave verbal evidence to the HSC.8 The subsequent HSC report Childhood obesity: brave and bold action demanded bold and urgent action by the government.36
In August 2016, the government published the first part of its childhood obesity plan.2 Although the plan was criticized for not incorporating all PHE’s proposed actions, the plan did include a commission for PHE to oversee a structured and closely monitored sugar reduction and wider reformulation programme (salt, calories). The details of the programme are outlined in Section 2.4. The subsequent childhood obesity plan chapters 2 and 3, published in 2018 and 2019 respectively45, have expanded the policy package to include many of the PHE proposed actions on promotions, advertising and menu calorie labelling, most of which were consulted on in early 2019.
As was the case with the salt reduction programme, a national effort to influence the food environment was coupled with initiatives to increase consumer demand for healthier products. Over the last decade information on obesity and the role of diet has significantly increased, with regular, if not daily, articles in the print media; the use of advertising and social media such as the Change4Life and One You campaigns;37,38 and the launch of user-friendly apps such as the Sugar Smart app and sugar swaps.
2.3.5 Results of the voluntary sugar reduction and wider reformulation programmeThis structured programme of gradual sugar reduction overseen by PHE was launched in August 2016. The five-year ambition was to remove 20% of sugar from the foods most consumed by children; a one-year ambition of 5% reduction was also set so that efforts could be measured and discussed early in the programme.13
The results of the first year of the programme were published in May 2018.20 The report looks at progress made by retailers and manufacturers (in home sector), the out of home sector (for example quick service restaurants, cafés, pubs etc.) and through the soft drinks industry levy (SDIL). For manufacturers and retailers, five out of the eight categories measured achieved a sugar reduction. Overall, this equated to a 2% reduction in sales weighted average39 total sugar per 100 g and a 2% reduction in calories in products consumed on a single occasion. Products sold in the out-of-home sector generally had similar average sugar content, but calories in products to be consumed on a single occasion
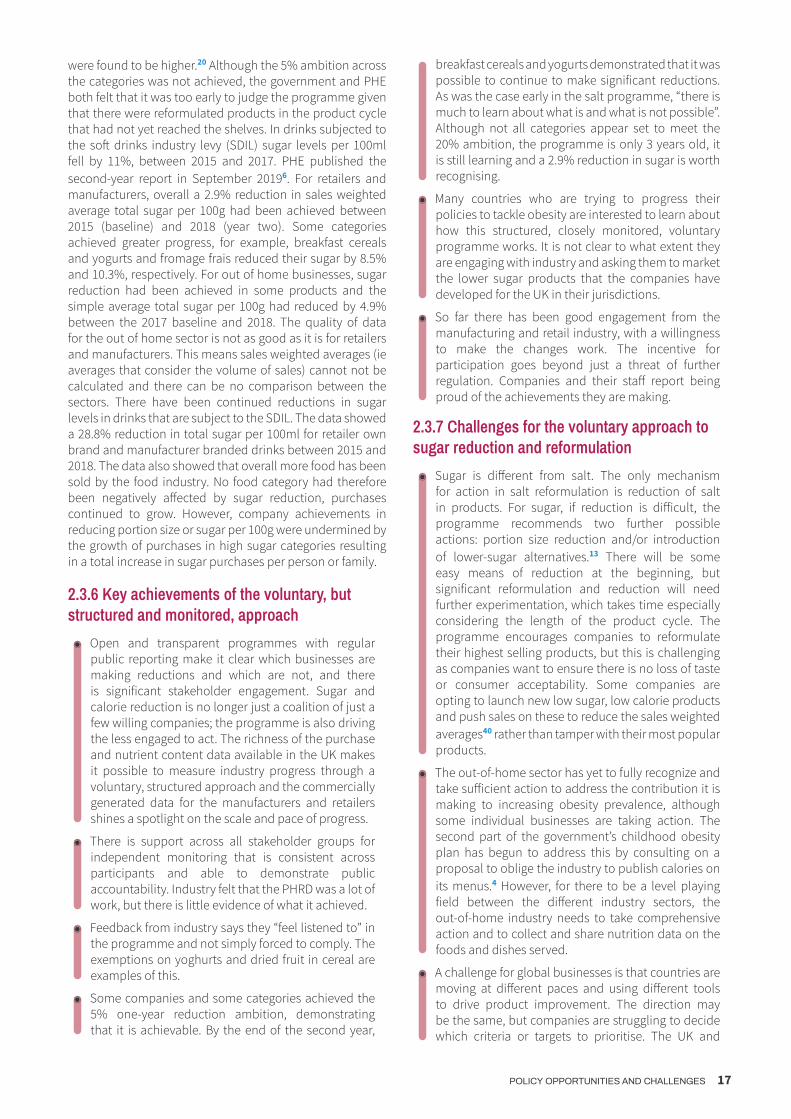
POLICY OPPORTUNITIES AND CHALLENGES 17
were found to be higher.20 Although the 5% ambition across the categories was not achieved, the government and PHE both felt that it was too early to judge the programme given that there were reformulated products in the product cycle that had not yet reached the shelves. In drinks subjected to the soft drinks industry levy (SDIL) sugar levels per 100ml fell by 11%, between 2015 and 2017. PHE published the second-year report in September 20196. For retailers and manufacturers, overall a 2.9% reduction in sales weighted average total sugar per 100g had been achieved between 2015 (baseline) and 2018 (year two). Some categories achieved greater progress, for example, breakfast cereals and yogurts and fromage frais reduced their sugar by 8.5% and 10.3%, respectively. For out of home businesses, sugar reduction had been achieved in some products and the simple average total sugar per 100g had reduced by 4.9% between the 2017 baseline and 2018. The quality of data for the out of home sector is not as good as it is for retailers and manufacturers. This means sales weighted averages (ie averages that consider the volume of sales) cannot not be calculated and there can be no comparison between the sectors. There have been continued reductions in sugar levels in drinks that are subject to the SDIL. The data showed a 28.8% reduction in total sugar per 100ml for retailer own brand and manufacturer branded drinks between 2015 and 2018. The data also showed that overall more food has been sold by the food industry. No food category had therefore been negatively affected by sugar reduction, purchases continued to grow. However, company achievements in reducing portion size or sugar per 100g were undermined by the growth of purchases in high sugar categories resulting in a total increase in sugar purchases per person or family.
2.3.6 Key achievements of the voluntary, but structured and monitored, approach
◉ Open and transparent programmes with regular public reporting make it clear which businesses are making reductions and which are not, and there is significant stakeholder engagement. Sugar and calorie reduction is no longer just a coalition of just a few willing companies; the programme is also driving the less engaged to act. The richness of the purchase and nutrient content data available in the UK makes it possible to measure industry progress through a voluntary, structured approach and the commercially generated data for the manufacturers and retailers shines a spotlight on the scale and pace of progress.
◉ There is support across all stakeholder groups for independent monitoring that is consistent across participants and able to demonstrate public accountability. Industry felt that the PHRD was a lot of work, but there is little evidence of what it achieved.
◉ Feedback from industry says they “feel listened to” in the programme and not simply forced to comply. The exemptions on yoghurts and dried fruit in cereal are examples of this.
◉ Some companies and some categories achieved the 5% one-year reduction ambition, demonstrating that it is achievable. By the end of the second year,
breakfast cereals and yogurts demonstrated that it was possible to continue to make significant reductions. As was the case early in the salt programme, “there is much to learn about what is and what is not possible”. Although not all categories appear set to meet the 20% ambition, the programme is only 3 years old, it is still learning and a 2.9% reduction in sugar is worth recognising.
◉ Many countries who are trying to progress their policies to tackle obesity are interested to learn about how this structured, closely monitored, voluntary programme works. It is not clear to what extent they are engaging with industry and asking them to market the lower sugar products that the companies have developed for the UK in their jurisdictions.
◉ So far there has been good engagement from the manufacturing and retail industry, with a willingness to make the changes work. The incentive for participation goes beyond just a threat of further regulation. Companies and their staff report being proud of the achievements they are making.
2.3.7 Challenges for the voluntary approach to sugar reduction and reformulation
◉ Sugar is different from salt. The only mechanism for action in salt reformulation is reduction of salt in products. For sugar, if reduction is difficult, the programme recommends two further possible actions: portion size reduction and/or introduction of lower-sugar alternatives.13 There will be some easy means of reduction at the beginning, but significant reformulation and reduction will need further experimentation, which takes time especially considering the length of the product cycle. The programme encourages companies to reformulate their highest selling products, but this is challenging as companies want to ensure there is no loss of taste or consumer acceptability. Some companies are opting to launch new low sugar, low calorie products and push sales on these to reduce the sales weighted averages40 rather than tamper with their most popular products.
◉ The out-of-home sector has yet to fully recognize and take sufficient action to address the contribution it is making to increasing obesity prevalence, although some individual businesses are taking action. The second part of the government’s childhood obesity plan has begun to address this by consulting on a proposal to oblige the industry to publish calories on its menus.4 However, for there to be a level playing field between the different industry sectors, the out-of-home industry needs to take comprehensive action and to collect and share nutrition data on the foods and dishes served.
◉ A challenge for global businesses is that countries are moving at different paces and using different tools to drive product improvement. The direction may be the same, but companies are struggling to decide which criteria or targets to prioritise. The UK and

18 IMPROVING DIETARY INTAKE AND ACHIEVING FOOD PRODUCT IMPROVEMENT
EU have sugar reduction and reformulation targets. Other countries might be using front of pack labelling or advertising restrictions that use a nutrient profile model that includes more than just sugar to drive product improvement. For example, a yogurt that has been celebrated for having achieved significant sugar reduction in this programme may still not be allowed to advertise to children because it is too high in other elements and as such does not pass the nutrient profile criteria. There is a frustration that reductionist approach of the programme compares food categories, such as yogurts with chocolate, on the basis of their negative components such as sugar and does not acknowledge the positive and beneficial elements of the food product.
◉ For other countries considering emulating the United Kingdom approach and the use of sales-weighted average guidelines,* thought needs to be given to how important data are in this approach. Independent monitoring requires the availability of comprehensive data on nutrition content and volume sales. For a competitive market like the United Kingdom, there is a high volume of sales data, but this is not true for all countries and regions.
◉ This is a voluntary approach where sanctions for noncompliance beyond negative media and NGO pressure have yet to be implemented. In the assessment of progress at Year 1 of the sugar reduction programme, only five out of the eight categories measured had reduced their sugar content, and one category (puddings) had slightly increased in sugar content. At the end of year two, both puddings and sweet confectionary had increased total sugar per 100g by 0.5% and 0.6%, respectively. Beyond public scrutiny, there have so far been no sanctions applied to producers of puddings or sweet confectionary. PHE is working with relevant food industry actors to both encourage and advise them to reformulate within the timescale of the programme.
◉ The Year 1 results for sugar also showed the SDIL to be five times more effective to date in reducing sugar levels than the voluntary measures applied through the sugar reduction programme and the SDIL continues to have an effect in year 2. A comparison between sweetened beverages and the foods covered
* A sales-weighted average in the sugar reformulation programme would account for both the sugar in a product and the volume of sales.
by the sugar reduction programme is unfair, as removal of sugar from drinks is technically simpler and diet drinks were an established and accepted part of the market before the introduction of the SDIL making the shift less risky for businesses. However, this stark difference in achievement has encouraged NGOs to call for a levy on HFSS foods that do not comply with the reduction programme. NGOs will be reassured by the government response to this call in the second part of its childhood obesity plan: “We may also consider further use of the tax system to promote healthy food if the voluntary sugar reduction programme does not deliver sufficient progress.”4
◉ Concern has been raised that the calorie reduction programme has no Year 1 ambition. NGOs question how PHE will use annual measurements to demonstrate if it is not working before the end of the five years. However, learning from the sugar reduction programme suggested that the Year 1 ambition distracted businesses from focusing on the harder five-year ambition of reducing sugar by 20% in the foods most eaten by children, and the one-year report did not capture all the work that industry had undertaken to date.
◉ Given that obesity is a complex problem with multiple drivers, the reduction and wider reformulation programme is only one action in a range of policy actions required to tackle obesity and therefore will not alone be able to demonstrate the key tangible benefit – a reduction in obesity prevalence. In England, the childhood obesity plans include an array of complementary activities at the local level and in schools, ranging from physical activity initiatives to improving school food standards. The second chapter of the Childhood obesity plan published in 2018 includes ambitious commitments such as consulting on: restricting promotions of HFSS foods in key selling locations in stores and volume-based price promotions such as two-for-one offers; introducing consistent calorie labelling in the out-of-home sector; restricting TV advertising for HFSS foods before 21.00 and also online; and banning the sale of energy drinks to children.4 These restrictions have the potential to further improve the food environment in England and have a measurable impact when applied together.
2.4 Details of the sugar reduction and wider reformulation programmes
2.4.1 Sugar reduction programmeScope and ambition. PHE is working with all sectors of the food industry (retailers, manufacturers and the out-of-home sector, e.g. quick-service restaurants, pubs, coffee shops, takeaway and meal delivery businesses) to reduce the amount of sugar in the foods that contribute most to children’s diets by 20% by 2020, with a 5% reduction in the first year (by August 2017). This is against a baseline of 2015.
The reductions in sugar should also be accompanied by reductions in calories, and where possible no increases in saturated fat, and the achievement of 2017 salt targets.
The food categories included in the programme are yoghurts and fromage frais; biscuits; cakes; morning goods (e.g. buns and pastries); puddings; ice-cream; lollies and sorbets; breakfast cereals; confectionery (split to separate sweet and chocolate confectionery); and sweet spreads and sauces.

POLICY OPPORTUNITIES AND CHALLENGES 19
The programme covers children up to the age of 18, so all foods in each category are included, not just those that are manufactured for or marketed to children.
There are three main mechanisms industry can use to achieve a reduction: to lower the amount of sugar per 100 g (reformulation); to reduce portion size; and to shift consumers’ purchasing patterns towards lower- and no-added-sugar products.
Progress to date. The first technical report for the programme – Sugar reduction: achieving the 20% – was published in March 2017.13 The report set out guidelines for each product category included in the programme and all sectors of industry. These guidelines applied to:
◉ sales-weighted average levels of total sugar per 100 g of product;
◉ average and maximum calorie or portion size for products likely to be consumed by an individual at one time (i.e. a single serve portion).
The technical report and guidelines were devised and published following a comprehensive programme of engagement with industry, public health NGOs and other key stakeholders; details of this engagement were published in a separate summary report in March 2017.41
In May 2018 PHE published a report on industry’s progress towards achieving the 5% sugar reduction in the first year of the programme.20 It provided a detailed assessment of progress made across categories, by business and in top-selling products. It also included an assessment of changes made in products covered by the SDIL. More recently, PHE published its second report on progress made by the food industry towards achieving the government’s challenge to reduce, by 20% by 2020, sugar in the foods that contribute most to children’s intakes*. The report looks at progress made by retailers and manufacturers (in home sector), the out of home sector (for example quick service restaurants, cafés, pubs etc.) and through the soft drinks industry levy (SDIL).
The results are as follows:
◉ For retailers and manufacturers, overall a 2.9% reduction in sales weighted average total sugar per 100g has been achieved between 2015 (baseline) and 2018 (year two). Some categories have achieved greater progress, for example, breakfast cereals and yogurts and fromage frais have reduced their sugar by 8.5% and 10.3%, respectively.
◉ For out of home businesses, sugar reduction has been achieved in some products and the simple average total sugar per 100g has reduced by 4.9% between the 2017 baseline and 2018. The data for out of home businesses is not comparable to retailers and manufacturers.
◉ There have been continued reductions in sugar levels in drinks that are subject to the SDIL. The data shows a 28.8% reduction in total sugar per 100ml for retailer own brand and manufacturer branded drinks
* Sugar reduction: report on progress between 2015 and 2018 https://www.gov.uk/government/publications/sugar-reduction-progress-be-tween-2015-and-2018
between 2015 and 2018. Results for drinks consumed out of the home are similar with simple average total sugar per 100mls reducing by 27.2% between 2017 and 2018.
◉ Analysis by socio-economic group shows that the total sugar purchased per household from drinks subject to SDIL has decreased in all socio-economic groups by between 9 and 29%. The smallest reduction is in the lowest socio-economic group (group E). It should be noted that only a small proportion (11%) of group E are families and 57% are single person households.
◉ The data also shows that overall more food has been sold by the food industry. The total tonnes of sugar sold in the foods included in the reformulation programme from the in-home sector increased by 2.6% between 2015 and 2018 (excluding cakes and morning goods), whereas the sugar sold in soft drinks subject to SDIL has decreased by 21.6%.
The next progress report, due in the first half of 2020 will provide a further assessment of progress by all sectors of industry towards achieving the 20% reduction ambition.
PHE has set guidance for reducing sugar in the two categories of drinks that are out of scope of the SDIL (Sugar reduction: juice and milk-based drinks).42 This document includes details of the guidelines set for sugar reduction and calories per single serve portion for these drinks, and the baseline from which progress will be measured.
2.4.2 Calorie reduction programmeBackground. In August 2017 PHE was commissioned to consider the evidence on children’s calorie consumption and to set the ambition, scope and timeline for extending the reformulation programme to include calorie reduction.
Scope and ambition. The calorie reduction programme challenges all sectors of the food industry to achieve a 20% reduction in calories by 2024 in product categories that contribute significantly to children’s calorie intakes (up to the age of 18 years) and where there is scope for substantial reformulation and/or portion size reduction.9 The year ending August 2017 will be the baseline against which progress is measured.
Mechanisms for action. The mechanisms industry can use to achieve a reduction are the same as for the sugar reduction programme.
Progress to date. In 2018 PHE consulted with stakeholders on its initial calorie reduction proposals. PHE has reviewed and considered feedback from stakeholders and is in the process of producing final guidelines for the foods included in the calorie reduction programme.
Next steps. Businesses are encouraged to work now to reduce the calorie content of foods in their portfolio.
PHE will support businesses’ efforts by setting guidelines for products; establishing baseline calorie levels in each food category; and regularly reporting progress across the different sectors, for the various food categories, and for

20 IMPROVING DIETARY INTAKE AND ACHIEVING FOOD PRODUCT IMPROVEMENT
the top-contributing businesses and products. PHE will provide advice to government if the monitoring of industry data demonstrates that not enough progress is being made across all the sectors.
2.4.3 Salt reductionBackground. The most recent set of salt targets, which were originally devised through the Department of Health’s PHRD, were republished by PHE in March 2017 and were due to be met by all sectors of industry by the end of 2017. Several sets of targets had been set prior to this date, at the time when the programme was the responsibility of the FSA. Reductions of up to 50% have already been seen in a wide range of foods as a result of the programme, and population salt intakes were also reduced by around 11% between 2004 and 2014.32 Results from the next urinary sodium survey, due for publication in early 2020 will show whether this progress has been sustained.
Progress to date. A report setting out industry’s progress towards meeting the 2017 salt reduction targets was published by PHE in December 2018. This was the first time that a detailed assessment of salt levels in foods against salt reduction targets had been published in the UK. Analysis showed a mixed picture in relation to achievement of the targets. For retailers and manufacturers just over half of average targets were met, and 81% of products overall had salt levels at or below maximum targets. For the eating out of home sector, 71% of products were at or below maximum targets.*
Next steps. The government remains committed to reducing population salt intakes and the Prevention Green Paper – Advancing our health in the 2020’s set out government’s ambition to reduce the population’s salt intakes to 7g per day. PHE will publish revised salt reduction targets in 2020 for industry to achieve by mid-2023 and will report on industry’s progress in 2024.
2.4.4 Product ranges aimed at babies and young childrenBackground. Chapter 2 of the government’s childhood obesity plan committed to a programme to review the scope for reformulation of product ranges aimed exclusively at babies and young children, aged up to 36 months.**
Progress to date. PHE was commissioned to review the evidence and make recommendations for action on commercial baby foods and drinks. PHE’s report, Foods and drinks aimed at infants and young children: evidence and opportunities for action, published in June 2019,*** set out PHE’s advice to government on the opportunities for action to improve foods and drinks aimed at infants and young children.
* https://assets.publishing.service.gov.uk/government/uploads/system/uploads/attachment_data/file/765571/Salt_targets_2017_progress_report.pdf** https://assets.publishing.service.gov.uk/government/uploads/system/uploads/attachment_data/file/718903/childhood-obesity-a-plan-for-action-chapter-2.pdf*** https://assets.publishing.service.gov.uk/government/uploads/system/uploads/attachment_data/file/812204/Foods_and_drinks_aimed_at_in-fants_and_young_children_June_2019.pdf
The evidence presented in the report highlighted some clear inconsistencies between government advice and some commercial baby foods and drinks in terms of the types of products available, their ingredient and nutrient composition, and the labelling and marketing of products.
Next steps. The government’s Prevention Green Paper – Advancing our health in the 2020’s set out government’s intention to challenge businesses to improve the nutritional content of commercially available baby food and drinks. PHE was commissioned to develop guidelines for industry, and to undertake open and transparent monitoring of progress. Work to develop guidelines is underway.
POLICY OPPORTUNITIES AND CHALLENGES 21
2.5 References *
* Unless otherwise stated, all websites mentioned in the References were accessed on 17 March 2019.
1. Authors are affiliated to Public Health England, London, United Kingdom.
2. Childhood obesity: a plan for action. London: HM Government; 2016 (https://www.gov.uk/government/publications/child-hood-obesity-a-plan-for-action).
3. Childhood obesity: a plan for action, chapter 2. London: HM Government; 2018 (https://www.gov.uk/government/publica-tions/childhood-obesity-a-plan-for-action-chapter-2).
4. Public Health Responsibility Deal. London: Department of Health; 2011 (http://responsibilitydeal.dh.gov.uk).
5. Butland B, Jebb S, Kopelman P, McPherson K, Thomas S, Mar-dell J et al. Foresight tackling obesities: future choices project. London: Government Office for Science; 2007.
6. Carbohydrates and health. London: Scientific Advisory Com-mittee on Nutrition; 2015 (https://www.gov.uk/government/publications/sacn-carbohydrates-and-health-report).
7. Swinburn BA, Caterson I, Seidell JC, James WP. Diet, nutrition and the prevention of excess weight gain and obesity. Public Health Nutr. 2004;7(1a):123–46.
8. Tedstone A, Targett V, Allen R. Sugar reduction: the evidence for action. London: Public Health England; 2015 (https://assets.publishing.service.gov.uk/government/uploads/system/up-loads/attachment_data/file/470179/Sugar_reduction_The_ev-idence_for_action.pdf).
9. Tedstone A, Targett V, Mackinlay B, Owtram G, Coulton V, Morgan K et al. Calorie reduction: the scope and ambition for action. London: Public Health England; 2018 (https://www.gov.uk/government/publications/calorie-reduc-tion-the-scope-and-ambition-for-action).
10. Obesity and overweight: fact sheet. Geneva: World Health Or-ganization; 2018 (http://www.who.int/news-room/fact-sheets/detail/obesity-and-overweight).
11. OECD. Health at a glance 2017: OECD health indicators. Paris: OECD Publishing; 2017 (http://www.oecd.org/health/health-systems/health-at-a-glance-19991312.htm).
12. Jebb S, Aveyard P, Hawkes C. The evolution of policy and actions to tackle obesity in England. Obes Rev. 2013;14 Suppl 2:42–59.
13. Tedstone A, Targett V, Owtram G, Pyne V, Allen R, Bathrellou K et al. Sugar reduction – achieving the 20%: a technical report outlining progress to date, guidelines for industry, 2015 base-line levels in key foods and next steps. London: Public Health England; 2017(https://assets.publishing.service.gov.uk/govern-ment/uploads/system/uploads/attachment_data/file/604336/Sugar_reduction_achieving_the_20_.pdf).
14. Kingdon JW. Agendas, alternatives, and public policies. New York (NY): Little, Brown; 1984.
15. Statistics on obesity, physical activity and diet, England 2018. NHS Digital; 2018 (https://www.gov.uk/government/statistics/statistics-on-obesity-physical-activity-and-diet-england-2018).
16. Childhood obesity: applying All Our Health. London: Public Health England; 2015 (https://www.gov.uk/government/publications/childhood-obesity-applying-all-our-health/childhood-obesity-applying-all-our-health#facts-about-child-hood-obesity).
17. Carey FR, Singh GK, Brown HS 3rd, Wilkinson AV. Education-al outcomes associated with obesity in the United States: cross-sectional results from the 2011–2012 National Survey of Children’s Health. Int J Behav Nutr Phys Act. 2015;12 Suppl 1:S3.
18. Tedstone A, Coulton V, Targett V, Bennett A, Sweeney K, Morgan K et al. Sugar reduction and wider reformulation programme: report on progress towards the first 5% reduction and next steps. London: Public Health England; 2018 (https://assets.publishing.service.gov.uk/government/uploads/system/uploads/attachment_data/file/709008/Sugar_reduction_prog-ress_report.pdf).
19. Bryden A, Petticrew M, Mays N, Eastmure E, Knai C. Voluntary agreements between government and business: a scoping review of the literature with specific reference to the Public Health Responsibility Deal. Health Policy. 2013;110(2–3):186–97.
20. Durand MA, Petticrew M, Goulding L, Eastmure E, Knai C, Mays N. An evaluation of the Public Health Responsibility Deal: infor-mants’ experiences and views of the development, implemen-tation and achievements of a pledge-based, public–private partnership to improve population health in England. Health Policy. 2015;119(11):1506–14.
21. Healthy lives, healthy people: a call to action on obesity in England. London: Department of Health; 2011 (https://assets.publishing.service.gov.uk/government/uploads/system/up-loads/attachment_data/file/213720/dh_130487.pdf).
22. Panjwani C, Caraher M. The Public Health Responsibility Deal: brokering a deal for public health, but on whose terms? Health Policy. 2014;114(2–3):163–73.
23. Coalition’s alcohol policy comes under attack. London: Insti-tute of Alcohol Studies; 2011 (http://www.ias.org.uk/What-we-do/Alcohol-Alert/Issue-1-2011/Coalitions-alcohol-poli-cy-comes-under-attack.aspx).
24. National Diet and Nutrition Survey: results from years 1, 2, 3 and 4 (combined) of the rolling programme (2008/2009–2011/2012). London: Public Health England/Food Standards Agency; 2014 (revised 2017) (https://assets.publishing.service.gov.uk/government/uploads/system/uploads/attachment_data/file/594361/NDNS_Y1_to_4_UK_report_full_text_re-vised_February_2017.pdf).
25. National Diet and Nutrition Survey: assessment of dietary so-dium – adults (19 to 64 years) in England, 2014. London: Public Health England; 2016 (https://assets.publishing.service.gov.uk/government/uploads/system/uploads/attachment_data/file/773836/Sodium_study_2014_England_Text_final.pdf).
26. Tedstone A, Targett V, Allen R. Sugar reduction: the evidence for action. Annexe 5: Food supply. London: Public Health England; 2015
27. Wyness L, Butriss J, Stanner S. Reducing the population’s sodium intake: the UK Food Standards Agency’s salt reduction programme. Public Health Nutr. 2012;15(2):254–61.
28. MacGregor G, He F, Pombo-Rodrigues S. Food and the respon-sibility deal: how the salt reduction strategy was derailed. BMJ. 2015;350:h1936.

22 IMPROVING DIETARY INTAKE AND ACHIEVING FOOD PRODUCT IMPROVEMENT
29. Salt and health. London: Scientific Advisory Committee on Nu-trition; 2003 (https://assets.publishing.service.gov.uk/govern-ment/uploads/system/uploads/attachment_data/file/338782/SACN_Salt_and_Health_report.pdf).
30. Feng H, Pombo-Rodrigues S, MacGregor G. Salt reduction in England from 2003 to 2011: its relationship to blood pressure, stroke and ischaemic heart disease mortality. BMJ Open. 2014;4(4):e004549.
31. OECD. Obesity and the economics of prevention: fit not fat. En-gland update 2014. Paris: OECD Publishing; 2010 (http://www.oecd.org/els/health-systems/obesity-and-the-economics-of-prevention-9789264084865-en.htm).
32. Jebb S, Aveyard P, Hawkes C. The evolution of policy and actions to tackle obesity in England. Obes Rev. 2013;14 Suppl 2:42–59.
33. Sugars intake for adults and children: guideline. Geneva: World Health Organization; 2015 (http://www.who.int/nutrition/pub-lications/guidelines/sugars_intake/en).
34. Ainger K, Klein K. A spoonful of sugar: how the food lobby fights sugar regulation in the EU. Brussels: Corporate Europe Observatory: 2016 (https://corporateeurope.org/sites/default/files/a_spoonful_of_sugar_final.pdf).
35. Press Association. Jeremy Hunt accused of suppressing evidence on benefits of “sugar tax”. The Guardian. 11 October 2015 (https://www.theguardian.com/politics/2015/oct/11/jere-my-hunt-accused-suppressing-benefits-sugar-tax).
36. House of Commons Health Committee. Childhood obesity: brave and bold action. First Report of Session 2015–2016. London: HM Stationery Office; 2015 (https://publications.par-liament.uk/pa/cm201516/cmselect/cmhealth/465/465.pdf).
37. Change4Life. NHS choices (https://www.nhs.uk/change4life).
38. One You. NHS choices (https://www.nhs.uk/oneyou).
39. A sales-weighted average in the sugar reformulation pro-gramme would account for both the sugar in a product and the volume of sales.
40. A sales-weighted average in the sugar reformulation pro-gramme would account for both the sugar in a product and the volume of sales.
41. Tedstone A, Owtram G, Targett V, Pyne V, Allen R, Bathrellou K et al. Sugar reduction and wider reformulation programme: stakeholder engagement, May 2016 to March 2017. London: Public Health England; 2017 (https://assets.publishing.service.gov.uk/government/uploads/system/uploads/attachment_data/file/604332/Sugar_reduction_stakeholder_engage-ment_2016_to_2017.pdf).
42. Tedstone A, Owtram G, Montel S, O’Kennedy E, Coulton V, Targett V et al. Sugar reduction: juice and milk-based drinks: a technical report outlining guidelines for industry, 2017 baseline levels for drinks in scope and next steps. London: Public Health England; 2018 (https://www.gov.uk/government/publications/sugar-reduction-juice-and-milk-based-drinks).
POLICY OPPORTUNITIES AND CHALLENGES 23
3.1 SummaryIsrael has recently introduced regulations on front-of-pack (FOP) labelling that will require food manufacturers to include a red warning label on the package if certain thresholds are exceeded. Israel is the first country in the WHO European Region to apply such a system and it is the only country to date that will require such mandatory labelling. To complement the red warning label, the Israeli government has also proposed that food manufacturers and retailers will be able to voluntarily use a green endorsement logo to promote consumption of healthier products, for products that meet specific criteria. The rationale behind the policies is the high rate of overweight, obesity and diet-related noncommunicable diseases (NCDs) seen in the Israeli population. Notably, the selection of the labelling system was based on evidence indicating that the Israeli population has inadequate understanding of the nutritional hazards derived from frequent consumption of certain products, especially ultra-processed ones, and lower literacy/numeracy when compared to other countries of similar economic development. The Israeli government concluded that, without substantial mandatory measures to urgently improve the public’s understanding of these risks and without a simple measure that could affect their behaviour, the above-mentioned health measures would not improve, particularly among lower-income groups. To address this, the Israeli Ministry of Health submitted a regulation to ensure that information is displayed on relevant foods and beverages in a clear, straightforward and unambiguous manner.
The groundwork for these policies dates back to 2006, when the Ministry of Health initiated the “Healthy Future 2020” strategy, which led to the development of the “Efsharibari – Healthy is possible” programme in 2011. As a result of the increased prevalence of obesity, diabetes and other NCDs related to excessive consumption of sugar, saturated fat and sodium, and ultra-processed products, the Israeli
government decided, by means of various ministries, to adopt the Healthy Israel 2020 programme, which specifically aims to promote population health via changes to the built food environment in which people make their daily decisions about food.
As part of the “Healthy Future 2020” strategy, a voluntary cooperative effort was also initiated with certain local producers in 2012 to reduce salt in locally manufactured processed food products. This process will continue in parallel with the mandatory labelling regulations, but it is obviously expected that there will be synergies between the two initiatives. In addition, a positive labelling scheme (currently available only on whole-wheat bread) will be developed for a number of eligible food categories. Experience indicates that positive labelling contributed to a significant increase in sales of whole-grain breads and a decrease in sales of white breads.
The overall aim of this package of population measures (both mandatory and voluntary) is (i) to increase/promote public awareness of healthy food in a simple and accessible way, thereby leading to healthier food consumption habits and a reduction in the purchase of foods high in sugar, saturated fat and sodium; and (ii) to increase the availability of healthier options via product reformulation and new product development. Informative front- and back-of-pack nutritional labelling will give additional information on sugar content (in teaspoon measures), saturated fat, calories and sodium; this was the outcome of recommendations from Israeli and international scientists, other stakeholders and strong public support. The expected outcome of the mandatory legislation, which will come into force in 2020, is that each individual will be empowered to make informed choices and the nutritional composition of food will improve, giving Israeli consumers access to, and ability to identify, foods conducive to a healthier diet.
3ISRAELProtection of Public Health Regulations (Food) (Nutritional Labelling) 2017
Ronit Endevelt, Itamar Grotto, Rebecca Goldsmith, Maya Golan, Ehud Kaliner, Siegal Sadetzki, Moshe Barsimantov 1

24 IMPROVING DIETARY INTAKE AND ACHIEVING FOOD PRODUCT IMPROVEMENT
3.2 Background and contextThrough routine public health surveillance and monitoring, the Israeli Ministry of Health has revealed concerning levels of overweight and diet-related NCDs. The MABAT national dietary surveys and the national quality assurance registry show that 60% of the adult population suffer from excess weight and 8% from diabetes, rising to 25% in lower socioeconomic groups. Israel also has excessive consumption of salt and sugar, with an average daily salt consumption of 9.5 g in adults and 12 g in adolescents.2 12% of energy intake comes from sugar, and surveys show that Israeli adolescents consume the highest amount of sweet beverages across Europe;3 reducing sugar consumption by 3% would allow a saving of more than $US 30 million annually.4 These figures suggest that a major portion of the Israeli population do not make healthy consumption choices.
Action to address these challenges in Israel is carried out under the broad banner “Healthy Future 2020”, which subsequently led to the development of a national programme for healthy nutrition and physical activity: “Efsharibari – Healthy is possible”, which was established in 2011. This programme is jointly carried out by three government ministries – the Ministry of Health, the Ministry of Education, and the Ministry of Sport and Culture – and was co-signed by the prime minister. Within the context of this programme, the Ministry of Health annually budgets $5–6 million to fund projects which promote healthy nutrition and physical activity at the national and local level. Activities and policies operate concurrently through several programmes, in line with policies and approaches recommended by the World Health Organization (WHO). These include interpretive FOP labelling, school-based nutrition education, regulations on health nutrition in cafeteria and kiosks, physical activity policies, and a national programme to reduce salt consumption in the population through reformulation and public awareness. Taxation on unhealthy foods has been considered but rejected for the time being because of the potential negative impact on the cost of living.5 In addition, a pilot project recently commenced in some major hospitals, in which only foods not requiring a red label can be sold.
3.2.1 Salt reductionThe main activities in the domain of salt reduction include surveillance, FOP labelling and food product reformulation. A sodium survey based on sodium excretion in a 24-hour urine collection highlighted elevated population intakes
and a tendency for individuals to underestimate intakes. Many people reported not checking sodium listings on the back-of-pack nutrition labels, and few were aware of the health risks associated with high intakes. These findings indicated a need to improve the population’s understanding of such risks, with an emphasis on education to change consumption habits, including the purchase of sodium-rich products. They also highlighted that, in order to reduce salt closer to recommended levels (a nearly 50% reduction is required to meet WHO guidelines), changes to the composition of widely available foods were needed.
The main food categories contributing to salt consumption in Israel were determined on the basis of their reported consumption in the sodium survey and contribution to salt intake reported in the MABAT national dietary survey series. Sodium reduction goals were developed for the food industry focusing on these categories. Major sources of sodium in the diet included bread, hard cheeses and cheese spreads, kosher meat and processed meat products, pastrami and sausages, various fish products, prepared food products such as schnitzels and similar soy-based products, nuts, biscuits, salted pastries, cereal, snacks, ready-made salads, pickles, sauces, ready-made powder mixtures, soup and seasoning powders.
The Ministry of Health worked in collaboration with the food industry with the aim of gradually reducing the sodium content in the aforementioned food categories. Numerous meetings were held to define and set targets (Table 3.1). The Ministry employed a nutritionist and food technologists specifically for this purpose. Within each category, the most widely consumed foods were tested for sodium content. The Ministry conducted 297 tests, in addition to further testing by the food companies to determine whether sodium reduction targets were being met. A short-term overall aim of a 10% reduction in salt in processed foods was set, together with the goal of the salt reduction programme to reduce salt intake by 3 g by 2020. For some categories, after consultations with leading manufacturers within that category, average value targets were set. The modelling done indicated that, if the targets were reached, the average sodium intake would be 6 g of salt daily, as opposed to the current 9.5 g. The meetings focused on setting achievable reductions within specific timeframes and also took into consideration any specific technological challenges. There were no signed agreements, but regular consultations were held to check on progress towards the defined targets.
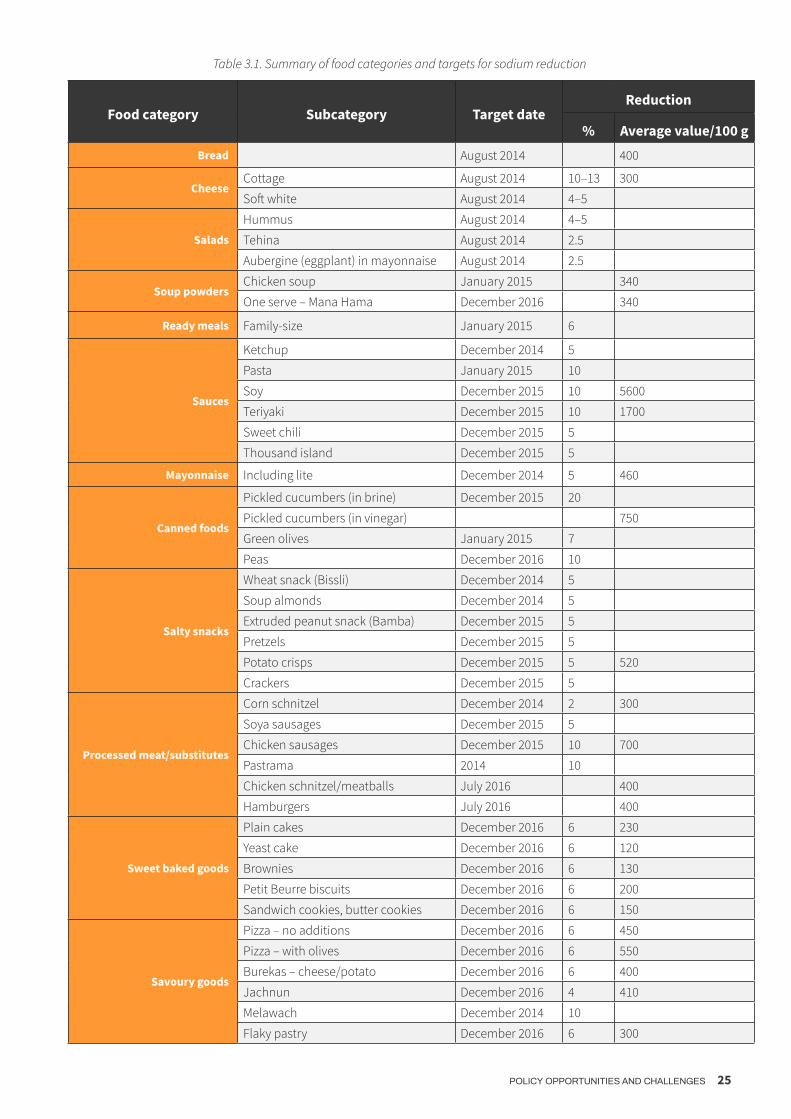
POLICY OPPORTUNITIES AND CHALLENGES 25
Table 3.1. Summary of food categories and targets for sodium reduction
Food category Subcategory Target dateReduction
% Average value/100 gBread August 2014 400
CheeseCottage August 2014 10–13 300
Soft white August 2014 4–5
Salads
Hummus August 2014 4–5
Tehina August 2014 2.5
Aubergine (eggplant) in mayonnaise August 2014 2.5
Soup powders Chicken soup January 2015 340
One serve – Mana Hama December 2016 340
Ready meals Family-size January 2015 6
Sauces
Ketchup December 2014 5
Pasta January 2015 10
Soy December 2015 10 5600
Teriyaki December 2015 10 1700
Sweet chili December 2015 5
Thousand island December 2015 5
Mayonnaise Including lite December 2014 5 460
Canned foods
Pickled cucumbers (in brine) December 2015 20
Pickled cucumbers (in vinegar) 750
Green olives January 2015 7
Peas December 2016 10
Salty snacks
Wheat snack (Bissli) December 2014 5
Soup almonds December 2014 5
Extruded peanut snack (Bamba) December 2015 5
Pretzels December 2015 5
Potato crisps December 2015 5 520
Crackers December 2015 5
Processed meat/substitutes
Corn schnitzel December 2014 2 300
Soya sausages December 2015 5
Chicken sausages December 2015 10 700
Pastrama 2014 10
Chicken schnitzel/meatballs July 2016 400
Hamburgers July 2016 400
Sweet baked goods
Plain cakes December 2016 6 230
Yeast cake December 2016 6 120
Brownies December 2016 6 130
Petit Beurre biscuits December 2016 6 200
Sandwich cookies, butter cookies December 2016 6 150
Savoury goods
Pizza – no additions December 2016 6 450
Pizza – with olives December 2016 6 550
Burekas – cheese/potato December 2016 6 400
Jachnun December 2016 4 410
Melawach December 2014 10
Flaky pastry December 2016 6 300
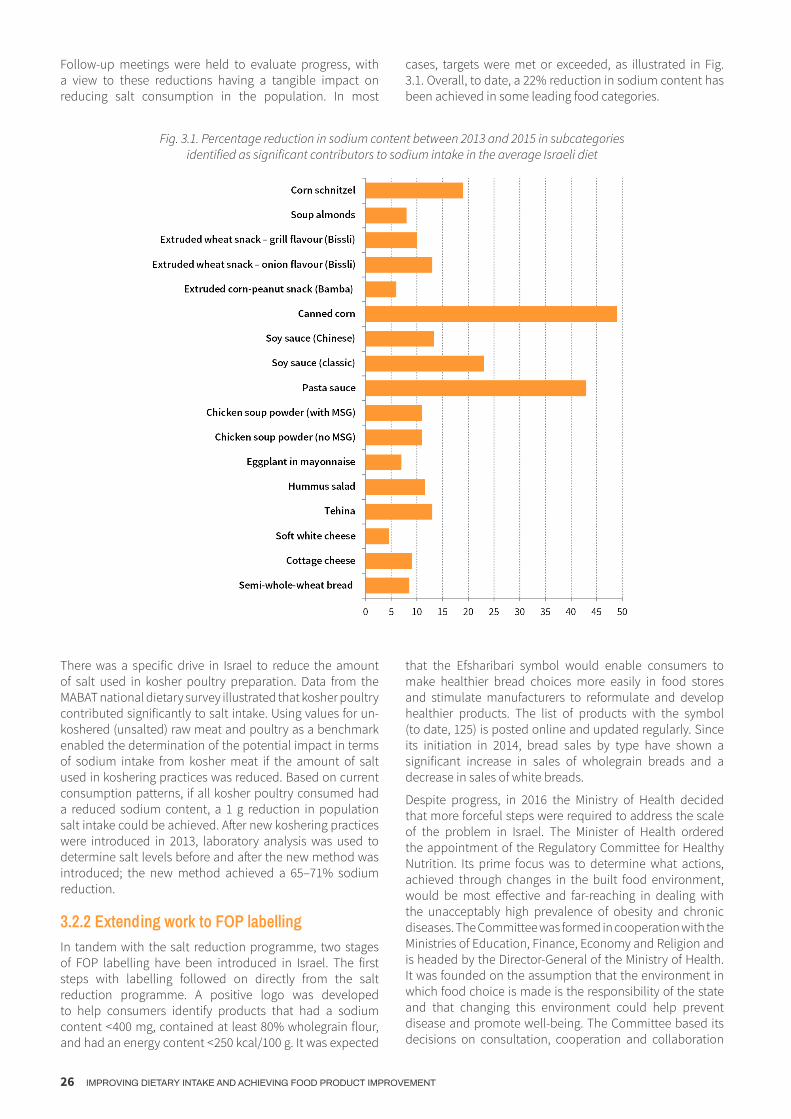
26 IMPROVING DIETARY INTAKE AND ACHIEVING FOOD PRODUCT IMPROVEMENT
Follow-up meetings were held to evaluate progress, with a view to these reductions having a tangible impact on reducing salt consumption in the population. In most
cases, targets were met or exceeded, as illustrated in Fig. 3.1. Overall, to date, a 22% reduction in sodium content has been achieved in some leading food categories.
Fig. 3.1. Percentage reduction in sodium content between 2013 and 2015 in subcategories identified as significant contributors to sodium intake in the average Israeli diet
There was a specific drive in Israel to reduce the amount of salt used in kosher poultry preparation. Data from the MABAT national dietary survey illustrated that kosher poultry contributed significantly to salt intake. Using values for un-koshered (unsalted) raw meat and poultry as a benchmark enabled the determination of the potential impact in terms of sodium intake from kosher meat if the amount of salt used in koshering practices was reduced. Based on current consumption patterns, if all kosher poultry consumed had a reduced sodium content, a 1 g reduction in population salt intake could be achieved. After new koshering practices were introduced in 2013, laboratory analysis was used to determine salt levels before and after the new method was introduced; the new method achieved a 65–71% sodium reduction.
3.2.2 Extending work to FOP labellingIn tandem with the salt reduction programme, two stages of FOP labelling have been introduced in Israel. The first steps with labelling followed on directly from the salt reduction programme. A positive logo was developed to help consumers identify products that had a sodium content < 400 mg, contained at least 80% wholegrain flour, and had an energy content < 250 kcal/100 g. It was expected
that the Efsharibari symbol would enable consumers to make healthier bread choices more easily in food stores and stimulate manufacturers to reformulate and develop healthier products. The list of products with the symbol (to date, 125) is posted online and updated regularly. Since its initiation in 2014, bread sales by type have shown a significant increase in sales of wholegrain breads and a decrease in sales of white breads.
Despite progress, in 2016 the Ministry of Health decided that more forceful steps were required to address the scale of the problem in Israel. The Minister of Health ordered the appointment of the Regulatory Committee for Healthy Nutrition. Its prime focus was to determine what actions, achieved through changes in the built food environment, would be most effective and far-reaching in dealing with the unacceptably high prevalence of obesity and chronic diseases. The Committee was formed in cooperation with the Ministries of Education, Finance, Economy and Religion and is headed by the Director-General of the Ministry of Health. It was founded on the assumption that the environment in which food choice is made is the responsibility of the state and that changing this environment could help prevent disease and promote well-being. The Committee based its decisions on consultation, cooperation and collaboration

POLICY OPPORTUNITIES AND CHALLENGES 27
with many relevant professional parties, which included widely circulated, evidence-based position papers and expert opinions.
The objectives and aims of the Committee dovetailed with those of Healthy Israel 2020 and the “Healthy is possible” initiative:
◉ (1) to improve the nutrition environment to allow easier and healthier food choices for the population;
◉ (2) to lower obesity prevalence, especially in young children;
◉ (3) to reduce sugar and salt consumption by 10%;
◉ (4) to promote the use of whole wheat and whole grain in all products;
◉ (5) to change norms of drinking sugar-sweetened drinks and eating salty snacks, especially among the younger population.
The Committee mandate was to define clear actions that would lead to significant changes in food production and consumption patterns, and improved knowledge of and
attitudes towards optimal nutrition. The Committee met 13 times over several months and sought input from local and international experts from various fields related to nutrition and environment. The large Israeli scientific community, familiar with domestic conditions and circumstances, was present, alongside industry representatives and the McKinsey economic consulting agency. An extensive literature search was also undertaken.
The process was shared with the public through invitations to journalists to observe committee meetings, open discussions with the media, publication of presentations, and an option for the public to express their opinion via email or the Ministry of Health Facebook page, a dedicated website and focus groups that included more than 1000 people with high incidence of obesity and chronic morbidity. Altogether, nine priority themes were identified by the public, including the need for nutritional education; physical accessibility of healthy food; economic accessibility of healthy food; food labelling for healthier and more nutritious choices; and designing point of sale, i.e. food stores, to support healthy food accessibility (Table 3.2).
Table 3.2. Priority themes identified by the public
Theme no. Theme No. of responders1 Front-of-pack labelling 1882 Use of economic measures including taxing of unhealthy foods 3983 Prevention of advertising of harmful food to children 564 Nutrition promotion within the health system 415 Improvement of nutrition education within the education system 1926 Increased nutrition education of the public 90
7 Reformulation of processed foods including assistance to small enterprises for this purpose 138
8 Improvements in food served in places of work 39 Changes in design of stores selling food 71
After collating and discussing all the available information, the Committee communicated its main recommendations in terms of policy steps to be taken, which were as follows:
◉ mandatory positive and negative FOP labelling;
◉ restriction on marketing and advertising of harmful foods, particularly those aimed at children;
◉ reformulation by the food industry to reduce sodium, sugar and saturated fat in various products;
◉ promotion and regulation of nutrition in education systems and the media;
◉ promotion of healthy nutrition in large institutions where food is supplied by the state;
◉ encouragement of small and medium-sized enterprises to produce healthy, affordable food;
◉ availability of research grants as an incentive to support and encourage production of healthy food.
Following this stage, there was a need to prioritize the actions to be taken, and it was decided to commence with the steps needed for implementation of FOP labelling. This required the greatest input of the Ministry’s resources (primarily staff time), as well as significant amounts of legislation to be prepared.
Formative research was conducted in Israel to inform the decision-making process with regards to FOP labelling. Two studies concerning FOP choices were conducted: one regarding food choices and nutrition labelling, including logo design, among a specific population group in Israel; the other concerning the positions and perceptions of leading health policy-makers in Israel with regards to FOP labelling.6,7 Furthermore, data from the 2015 Israeli national survey regarding the population’s general health and nutritional literacy status (PIAAC) showed a population literacy level below the Organisation for Economic Co-operation and Development (OECD) average, particularly in certain minority population groups.8 Together, this

28 IMPROVING DIETARY INTAKE AND ACHIEVING FOOD PRODUCT IMPROVEMENT
preparatory work indicated that the label should be (i) clear, simple and based on graphics, and (ii) managed by the government rather than voluntarily by industry.
In addition to the scientific foundations guiding decisions behind the draft regulations, Israel was encouraged by the success of the Chilean government in addressing similar nutritional problems by implementing food labelling regulations in June 2016. The Chilean system, which uses warning labels for products high in calories, saturated fat, sugar and salt, has been shown to have positive impact.9,10,11 Following lengthy consultations between the Director of the Nutrition Division (Israeli Ministry of Health), an international nutrition expert (Professor Barry Popkin), and Chilean colleagues, including a visit to Israel by the relevant Chilean
expert, it was decided that this system would best suit the Israeli environment. It was proposed that, in Israel, separate warning indicators would be used for individual negative nutrients, including both graphics (spoon, salt shaker, solid fat and knife) and interpretive text (high in [nutrient]). Graphics were included to increase accessibility of the label for those with low literacy. Surveys in Chile have shown that merely presenting draft regulations as mandatory prompted industry to reformulate more than 1500 foodstuffs.12
The Committee published its conclusions, including on FOP labelling, in November 2016 after hearing presentations from the Federation of Israeli Chambers of Commerce and the Manufacturers’ Association of Israel.
3.3 Implementation processA scientific committee set the criteria for the warning label without industry involvement. The Chilean threshold values were adopted as they matched the WHO recommendations13 and were thought to be compatible with Israeli nutritional habits.14
The decision to use a red FOP warning logo for HFSS foods was adopted as part of a revision of the Israel Nutritional Labelling Regulations, which were renamed “Protection of Public Health Regulations (Food) (Nutritional Labelling)”.15 A phased implementation is foreseen, between 1 January 2018 and 1 January 2020, meaning that there is a two-year lead-in period. This lead-in period was agreed at the request of industry to allow time to prepare and reformulate products gradually, to ensure public acceptance from a taste perspective. After this date, all pre-packaged foods, imported or locally manufactured, will be required to label food products which contain high amounts of saturated fat, salt and sugar with a specific red symbol, denoting that these products are considered harmful. A second set of stricter maximum thresholds for the label will come into effect in January 2021. Following the phased introduction of the labelling, the final nutrient thresholds will correspond to the Chilean regulations on warning labels. According to MABAT national dietary survey data, 16–20% of foods consumed as currently formulated will carry the red label. Reformulation has already begun, and it is intended that the labelling will encourage manufacturers on a wide scale to continue to reformulate foods to improve the nutritional profile of red-labelled products, thereby gradually reducing the content of nutrients of concern and eliminating the need to “red-label” products.
While the red label is statutory, the Israeli regulation will also have a positive voluntary green label for products that meet category-specific criteria; it will be similar to that defined in the Scandinavian “Keyhole” system and adapted to Israeli food consumption patterns.16 The food manufacturing industry was very keen that a positive label could be on the market alongside the negative warning label. It is intended that this will primarily apply to natural and minimally processed foods. The current Efsharibari symbol will remain for bread, while the new green symbol will be used for all other approved categories. Additionally,
the Ministry of Health website has many videos, posts and posters that deal with educating the population in reducing salt consumption.
The green label criteria are determined by nutritional profiling by food category, according to recommendations from the Regulation Committee Promoting Healthy Nutrition. The Ministry of Health will advertise the enforcement date via a specific decree and on its website, thereby ensuring transparency. The criteria for the red label are shown in Table 3.3. Examples of the positive (green) and negative (red) logos are shown in Fig. 3.2.
Table 3.3. Criteria used to determine use of the red label
first stage 1/2020
second stage 1/2021
100 g
sodium mg 500 400
sugar g 13.5 10saturated fat g 5 4
100 ml
sodium mg 400 300
sugar g 5 5saturated fat g 3 3
Fig. 3.2. Examples of green and red logos used in the FOP warning system
Red labelling applies only to pre-packaged food, not to bulk or single-ingredient foods, as the latter cannot be reformulated. However, because of their high sugar content and their broad consumption in Israel, fruit juices and vegetable juices containing at least one additional ingredient (for example, strawberry and banana juice) will be

POLICY OPPORTUNITIES AND CHALLENGES 29
labelled where appropriate. Liquid milk without additional ingredients or flavours is considered a natural product, so will be exempt, whereas flavoured milks, milk desserts and other milk-based products will be marked where appropriate. Breast-milk substitutes (formulas) for infants and toddlers, specific sports formulas and food formulas for weight loss are excluded. However, complementary foods, such as “cookies” for babies, will be included as there is a link between consuming processed foods high in sodium, sugar and saturated fat at an early age and unhealthy eating habits that cause obesity and chronic illness in later years.17,18,19 Use of the green endorsement logo will be
precluded on products that contain artificial sweeteners. This stipulation is in response to experiences in Chile, where the food industry responded to the introduction of warning label regulations by replacing added sugar with artificial sweeteners.20
Labelling foods with a red symbol is not intended to prohibit sales, but to point consumers to the sodium, saturated fat and sugar content, enabling them to make healthier choices. It is thought that many foods which would currently be eligible for a red label will be reformulated, so that by the time the legislation is enforced, these foods will have healthier profiles, and therefore may not require a red label.
3.4 Monitoring and evaluationEnforcement and monitoring of the nutrition and dietary behaviour elements will be carried out by a team associated with the national “Efsharibari – Healthy is possible” programme. Other organizations for assessment are also being considered, such as Brookdale, alongside a professional market research company, to assess both stakeholder and public understanding of the use of the new labelling. Additional insights will be given by consumer purchasing data collected by companies such as Nielsen or StoreNext. Indicators include impact on dietary intake (as measured in future dietary surveys), purchasing (StoreNext and Nielsen data), composition (laboratory tests) and advertising patterns. A steering committee will also be
established to oversee the implementation. A repeat of the national sodium survey that preceded the legislation will be conducted in 3–4 years to examine the impact of the new FOP labelling and the public information activities directed at reducing sodium consumption. It is also currently proposed to establish a central registry of manufacturers who voluntarily “green-label” their products.
Manufacturers and importers (in the case of products from outside Israel) will be required to retain and annually update nutritional labelling documentation or laboratory test results verifying the nutritional composition of all their products.
3.5 Challenges, concluding remarks and further considerationsChallenges to the FOP label were made to the World Trade Organization (WTO) Technical Barriers to Trade Enquiry Point in Israel, which represents the point of contact between Israel and the WTO regarding potential trade barriers. The objections raised were addressed by the Ministry of Health and included the requirement to label sugar in teaspoons on the back-of-pack nutrition table, which was retained but not adopted as part of the FOP proposals. Other concerns focused on potential trade barriers and the impact on prices due to increased packaging costs. However, Israel has argued that the labelling requirements are identical for domestic and imported products, so do not impose a trade barrier, and that the two-year lead-in period was adopted to allow reformulations to occur naturally within the product life cycle, minimizing the cost impact.
Israel also demonstrated that other FOP labelling formats were considered, such as the Guideline Daily Amount (GDA), which is based on serving size rather than per 100 g. However, in view of the relatively low nutrition literacy levels in Israel, a simplified label was deemed more appropriate and likely to have greater impact on improving diets and reducing NCD levels. Having said this, the proposed draft regulations do not prohibit the use of GDA markings alongside the warning label.
Food policy in the modern obesogenic environment requires a collaborative approach involving a range of actors in order to implement long-term, sustainable population behaviour change. The Israeli experience demonstrates how joined-
up activities by the government, across ministries, can help put in place policies to promote diets that are aligned to national dietary recommendations and the healthy Israeli Mediterranean diet. The approach in Israel aims to use the built food environment as a way to improve the availability of healthy food while simultaneously building health and nutritional literacy across all sections of the Israeli population.

30 IMPROVING DIETARY INTAKE AND ACHIEVING FOOD PRODUCT IMPROVEMENT
3.6 References *
* Unless otherwise stated, all websites mentioned in the References were accessed on 19 March 2019.
1. Ronit Endevelt – Ministry of Health, Israel; University of Haifa, Israel Itamar Grotto – Ministry of Health, Israel; Ben-Gurion University of the Negev, Israel Rebecca Goldsmith – Ministry of Health, Israel Maya Golan – Ministry of Health, Israel; Ariel University, Israel Ehud Kaliner – Ministry of Health, Israel Siegal Sadetzki – Ministry of Health, Israel; Tel Aviv University, Israel Moshe Barsimantov – Ministry of Health, Israel
2. Israel National Salt Survey (in process of publication).
3. Heath Behaviour in School-aged Children: Israel (http://www.hbsc.org/membership/countries/israel.html).
4. Ginsberg GM. Mortality, hospital days and treatment costs of current and reduced sugar consumption in Israel. Isr J Health Policy Res. 2017;6:1 (doi: 10.1186/s13584-016-0129-9).
5. Mandatory labelling of trans fats on food packaging has come into force. State of Israel Ministry of Health. 1 April 2014 (http://www.health.gov.il/English/News_and_Events/Spokespersons_Messages/Pages/01042014_2.aspx).
6. Gesser-Edelsburg A, Endevelt R, Zemach M, Tirosh-Ka-mienchick Y. Food consumption and nutritional labeling among immigrants to Israel from the former Soviet Union. J Immigr Minor Health. 2015;17(2):459–66 (doi: 10.1007/s10903-013-9885-6).
7. Gesser-Edelsburg A, Endevelt R, Tirosh-Kamienchick Y. Nu-trition labelling and the choices logo in Israel: positions and perceptions of leading health policy makers. J Hum Nutr Diet. 2014;27(1):58–68 (doi: 10.1111/jhn.12050. Epub 2013 May 9).
8. Program for the International Assessment of Adult Competen-cies (PIAAC) (http://www.cbs.gov.il/statistical/stat_150.pdf).
9. Arrúa A, Machín L, Curutchet MR, Martínez J, Antúnez L, Alcaire F et al. Warnings as a directive front-of-pack nutrition labelling scheme: comparison with the Guideline Daily Amount and traffic-light systems. Public Health Nutr. 2017;20(13):2308–17.
10. Lima M, Ares G, Deliza R. How do front of pack nutrition labels affect healthfulness perception of foods targeted at children? Insights from Brazilian children and parents. Food Qual Pref. 2018;64:111–19.
11. Machín L, Aschemann-Witzel J, Curutchet MR, Giménez A, Ares G. Does front-of-pack nutrition information improve consumer ability to make healthful choices? Performance of warnings and the traffic light system in a simulated shopping experi-ment. Appetite. 2018;121:55–62.
12. Professional dialogue with the Chilean Ministry of Health.
13. Healthy diet [online fact sheet]. Geneva: World Health Orga-nization; 2018 (http://www.who.int/mediacentre/factsheets/fs394/en).
14. Report of the Committee for the Regulation of Healthy Nu-trition: recommendations. State of Israel Ministry of Health; 2016 (in Hebrew) (https://www.health.gov.il/publicationsfiles/healthydietcommittee_recommendation.pdf).
15. Protection of Public Health Regulations (Food) (Nutritional Labelling) 5777-2017. Reference: G/TBT/N/ISR/946. Brus-sels: European Commission; 2017 (http://ec.europa.eu/growth/tools-databases/tbt/en/search/?tbtaction=search.detail&Country_ID=ISR&num=946&dspLang=en&basdat-edeb=01/04/2017&basdatefin=30/04/2017&baspays=&basno-tifnum=&basnotifnum2=&bastypepays=ANY&baskeywords).
16. The Keyhole: healthy choices made easy. Copenhagen: Nordic Council of Ministers; 2010 (http://norden.diva-portal.org/smash/get/diva2:700822/FULLTEXT01.pdf).
17. Maalouf J, Cogswell ME, Yuan K, Martin C, Gunn JP, Pehrsson P et al. Top sources of dietary sodium from birth to age 24 mo, United States, 2003–2010. Am J Clin. Nutr. 2015;101(5):1021–8.
18. Cogswell ME, Gunn JP, Yuan K, Park S, Merritt R. Sodium and sugar in complementary infant and toddler foods sold in the United States. Pediatrics. 2015;135(3):416–23.
19. Elliott CD, Conlon MJ. Toddler foods, children’s foods: as-sessing sodium in packaged supermarket foods targeted at children. Public Health Nutr. 2011;14(3):490–8.
20. Freeman E. Israel’s healthy food revolution. Leatherhead Food Research white paper 52. Epsom: Leatherhead Food Research; 2017 (https://www.leatherheadfood.com/files/2017/07/White-paper-Israels-Healthy-Food-Revolution.pdf).

POLICY OPPORTUNITIES AND CHALLENGES 31
4.1 SummaryOn behalf of the Ministry of Health, Consumer Affairs and Social Well-being, the Food Safety and Nutrition Spanish Agency (AESAN) has developed and launched an ambitious voluntary collaboration plan for food product reformulation, intended to be implemented together with various industry actors by 2020. The objective is to improve product composition in major food and beverage categories regularly consumed by children, young people and families, and to increase the offer of more balanced menus outside the home, including in restaurants, canteens, schools and vending machines. This plan is in response to growing consumer demand for healthier foods and calls from European health bodies to make healthier choices easier. The longer-term goal of the plan is to improve diet quality and contribute to the prevention of obesity and diet-related noncommunicable diseases (NCDs).
The Collaboration Plan for the Improvement of Food and Beverage Composition and other Measures 2020 (hereafter “the Plan”) has clear public health objectives: to decrease consumption of added sugars, salt and saturated fats and to improve the overall nutritional quality of the diet.2 The structure, scope and details of the Plan move beyond previous reformulation agreements by taking a more comprehensive approach that includes agreements with the manufacturing, retail, contract catering, modern restaurant and vending sectors in order to substantially increase healthier offerings in a number of different settings.
The role of AESAN in this context is to manage and drive reformulation by setting category-based targets through sectoral commitments; to ensure transparency and communication on progress; to carry out monitoring and evaluation of commitments via prespecified methodologies; and to request the collaboration of other administrations where necessary. It is also responsible for leading complementary activities to improve consumer education
on the benefits of reducing intakes of nutrients of concern and engaging in physical activity, particularly in the case of children.
The Plan consists of 180 different commitments to added sugar, salt and saturated fat reduction in the manufacturing and retail sectors, and other measures to increase the offer of healthier menus in the contract catering, modern restaurant and vending sectors. The Plan was negotiated with sector associations representing the five sectors; companies are expected to conform to the targets that have been agreed and signed by their sector associations. Further companies and sectors not currently covered by the Plan will have the opportunity to sign up in future. The large number of sectors and companies involved means that the measures, if achieved, will have a significant impact on the nutrition composition of the national shopping basket, and healthier choices will become available in all arenas, including schools, workplaces and institutions. It is also expected that the broad scope will help to minimize health inequalities in accessing a healthy diet.
Although the Plan is voluntary, the visibility of the commitments and the role of AESAN in monitoring the process closely should incentivize signatories to fulfil their obligations and pave the way for other companies to join. The visibility and scale of the Plan may also boost consumer awareness of the importance of healthier dietary habits. In addition to fulfilling their commitments, signatories are encouraged to innovate and collaborate in initiatives to promote healthier diets. It is also hoped that signatories will promote such measures across Europe, in order to create a level playing field and spread the effects of the commitments beyond the Spanish borders.
The Plan is inspired by current European Union (EU) and World Health Organization (WHO) recommendations and guidance; it aims to contribute to the elimination of barriers to healthier diets across European populations.
4SPAINCollaboration Plan for the Improvement of Food and Beverage Composition and other Measures 2020
María José Yusta Boyo, Marta García Solano, Carmen Villar Villalba, María Ángeles Dal Re Saavedra 1

32 IMPROVING DIETARY INTAKE AND ACHIEVING FOOD PRODUCT IMPROVEMENT
4.2 Background and contextUnhealthy diets, overweight and obesity in Spain, as in the rest of Europe, are significant public health issues and the leading risk factor for NCDs such as coronary heart disease, stroke and diabetes. Despite positive indications that overweight and obesity may be stabilizing or declining among children and adolescents, cross-country comparisons made as part of the WHO European Childhood Obesity Surveillance Initiative reveal that Spain currently has some of the highest rates of overweight and obesity among children (41% among children aged 6–9 in 2015).3 Salt intake in both adults (9.8 g in 2009) and children (7.8 g in 2014) exceeds the WHO recommendation for adults of 5 g/day or less. Added sugar intakes are also above the WHO ideal recommended 5% energy intake/day, at 8% in adults; they also exceed the maximum 10% energy intake/day recommendation in children aged 3–9 years, at 11.7% (2013–2015).4
The Spanish government has recognized that obesity and unhealthy diets are complex and multifaceted problems, and that “lifestyle factors” are a major contributor. The response in Spain has been to advocate a multicomponent and multisectoral approach, with the aim of creating healthier environments that improve eating habits and physical activity. By ensuring that a variety of healthier foods are available and affordable to the whole population, it is expected that obesity prevalence will decrease and health inequalities will fall. In this context, the government launched the AESAN Strategy for Nutrition, Physical Activity and the Prevention of Obesity (NAOS) in 2005, in an attempt to put in place this comprehensive approach.5
The NAOS Strategy takes an intersectoral approach and operates along a number of different axes, including school, family, community, business and health sectors; it engages both public and private stakeholders. Environments particularly relevant to children, such as school, family and community, are a priority, as actions and interventions at early ages are important to minimize immediate harm to children but also to prevent obesity in the adult population.
While there are many pillars of the NAOS Strategy (including infant nutrition, school food and marketing restrictions), a key intervention has been to engage the business sector in reformulation of manufactured food products. This was not an entirely new approach; for example, already in 2004 a collaborative agreement was signed between AESAN, the Spanish Confederation of Bakers (CEOPAN) and the Spanish Association of Manufacturers of Frozen Dough (ASEMAC) to reduce the amount of salt used in bread over four years.6 A follow-up assessment study in 2008 confirmed that this objective had been achieved, showing an average salt content of 1.63 g/100 g product. A more recent study in 2014 concluded that salt levels in commonly consumed bread remained stable at 1.64 g/100 g product.7
In 2008 AESAN wanted to advance salt reduction further and developed a Plan for the Reduction of Salt Intake in Spain.8 Meetings were held in November 2009 to establish the objectives and main lines of action. These discussions were attended by representatives from AESAN and the
Ministry of Health, Social Services and Equality (now Health, Consumer Affairs and Social Well-being); the Autonomous Communities; doctors’ and nurses’ associations; scientific associations; business and consumer groups; and national and international experts. A further 2012 study of salt content in food showed a statistically significant decrease in salt content between 2009 and 2012 for breakfast cereals, broths, canned fish and shellfish, and industrial breads.9 The reformulation efforts were supported by public awareness campaigns to highlight foods high in salt and to encourage consumers to use on-pack nutrition information and to use less discretionary salt.
AESAN also promoted policies to reduce industrial trans fatty acid (TFA) intakes and levels in food, based on a combination of legislative measures, information campaigns and product reformulation. Two studies in 2010 and 2015 concluded that the majority of food groups in Spain contained < 2 g TFA per 100 g total fat, suggesting that TFA levels in Spain were, on average, very low.10
Experience with these reformulation measures in Spain highlighted several factors and lessons learned for future initiatives. Specifically, it emphasized the need to:
◉ define clear public health objectives – i.e. to decrease consumption of sugar, salt and fats and improve the nutritional quality of the diet;
◉ ensure AESAN and the Ministry of Health have leadership authority in the coordination, promotion and evaluation of agreements with the different sectors and administrations, in order to maintain consensus and set an implementation deadline;
◉ use an evidence-based approach and document decisions so as to lend credibility to the process, including by establishing specific, measurable, achievable, realistic and time-bound (SMART) objectives;
◉ be clear as to expectations and what has been agreed – it is better to achieve modest reductions than fail to achieve more ambitious but vague ambitions;
◉ align with WHO and EU strategies as a reference framework;
◉ carry out continuous monitoring and periodic evaluation of all commitments;
◉ communicate and make transparent all ongoing works, including outcomes of dialogue with the food industry;
◉ aim to arrive at agreements that achieve the objective of the Ministry of Health while also taking into consideration any valid technical, food safety, legislative and competition aspects;
◉ facilitate healthier options by both (i) improving the composition of products most commonly consumed by families, children and young people, and (ii) increasing the offer of balanced menus outside the home;

POLICY OPPORTUNITIES AND CHALLENGES 33
◉ ensure that measures contribute to the reduction of inequalities in access to healthier food;
◉ operate a multi- and cross-sectoral approach to ensure that reformulation “at scale” is achieved, meaning that efforts cover as much of the food supply as possible;
◉ prefer transversal agreements so that commitments by sectoral associations are assumed by all companies; and
◉ account for all environments, including supermarkets, schools, work, restaurants, canteens and residential care homes.
* This objective of the Plan refers to maintaining or improving the previous reductions that have already been achieved for salt, fat and TFAs. AESAN signed an agreement in 2015 with the Spanish Snack Manufacturers Association (AFAP), in which the sector made a commitment to reduce the aver-age salt content of potato chips and savoury snacks by an additional 5% in the following five years.
Successes with salt and TFA reduction motivated the Spanish government to consider expanding the scope of its work. Supported by calls from WHO and initiatives of the European Commission High Level Group on Nutrition and Physical Activity, work on reformulation was expanded to include saturated fats and added sugars. Increase in consumer demand for healthier food options, alongside better data and scientific evidence for the effectiveness and feasibility of sugar reformulation, also played a motivating and enabling role.11 In 2016 the EU Council conclusions invited Member States to develop national plans for food product reformulation; this also lay the ground for new agreements between public health bodies and food businesses.12
4.3 Formalizing the PlanThe Plan was first presented by the Ministry of Health in 2018, when the Ministry underlined support for concrete measures to ensure a comprehensive approach to reformulation. The manufacturing, retail, contract catering, modern restaurant and vending sectors also publicly backed the agreements developed by AESAN in order to set a benchmark for the entire food and drink sector, including all Spanish food companies.
The Plan requires the reformulation of nutrients of concern without increasing energy levels, maintaining food safety, and preserving organoleptic properties to ensure consumer acceptance. As the commitments have been adopted by a large number of organizations and sectors, reformulation will reach a greater proportion of the market, and consumer exposure to, and therefore acceptance of, reformulated products will be increased.
The Plan objectives include:
◉ reducing added sugars by 10% of the median baseline content by 2020 across product categories typically consumed by children and young people;
◉ continuing to reduce salt, saturated fats and industrial TFAs in products according to EU reformulation frameworks and previous agreements with the Spanish food industry; *
◉ ensuring that the energy content of reformulated products does not rise;
◉ increasing use of reformulated products and the offer of healthier menus in restaurants, catering and vending sectors;
◉ promoting research and development in products that can form part of a healthier diet, improving scientific knowledge and monitoring, and extending these across Europe, given the cross-border trade of products;
◉ having a positive health and social impact on the family “shopping basket” to promote high-quality diets.
To reach these agreements, AESAN – acting on behalf of the Ministry of Health – engaged industry actors in extensive consultation over the period 2016–2017. Regular meetings were conducted with sectoral associations, where AESAN provided technical expertise and support. Manufacturing, retailer and other food industry representatives were engaged in negotiating targets and technical aspects of achieving them. The Ministry’s objective was to secure comprehensive commitments engaging the whole supply, at the same time as taking into consideration some of the concerns that were important to industry actors, such as technical uncertainties on conducting reformulation, fear of rising costs and losing market share. These concerns were voiced by representatives of small, medium-sized and large enterprises. Small and medium-sized enterprises find it more difficult to apply agreements for resource reasons, while for large multinationals it is more complicated because of their global policies.
Previous experience in negotiating and implementing reformulation agreements in Spain had indicated that real and perceived technological constraints, existing technical regulations, and competition between enterprises were important factors to be addressed during the negotiations. All reduction targets and other proposed measures were based on a clear public health rationale (i.e. alignment with WHO guidelines), evidence of potential benefit to the Spanish population, and demonstrable technical feasibility.
Taking into account public health objectives and anticipating potential barriers from the food industry perspective, AESAN commissioned several studies that considered approaches to setting challenging but feasible nutrient composition targets for different food categories. These were important tools used during meetings with the sectoral associations to demonstrate and discuss the feasibility of reformulation, by giving detailed descriptions of reference values and best practices. Baseline data were gathered in 2016 for the total and added sugar, saturated and total fats and salt content of leading food product categories. A representative sample of 1173 products was studied, corresponding to the highest-selling products according to market data for 2015.13 Compositional information was obtained using both
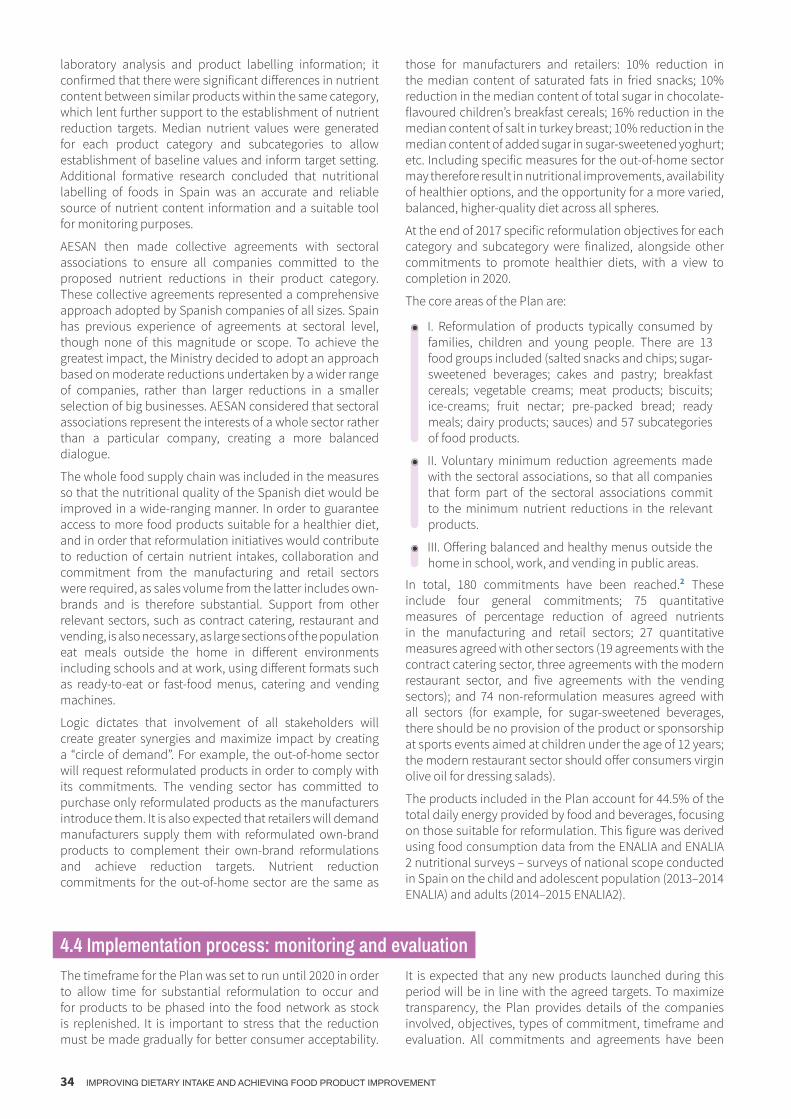
34 IMPROVING DIETARY INTAKE AND ACHIEVING FOOD PRODUCT IMPROVEMENT
laboratory analysis and product labelling information; it confirmed that there were significant differences in nutrient content between similar products within the same category, which lent further support to the establishment of nutrient reduction targets. Median nutrient values were generated for each product category and subcategories to allow establishment of baseline values and inform target setting. Additional formative research concluded that nutritional labelling of foods in Spain was an accurate and reliable source of nutrient content information and a suitable tool for monitoring purposes.
AESAN then made collective agreements with sectoral associations to ensure all companies committed to the proposed nutrient reductions in their product category. These collective agreements represented a comprehensive approach adopted by Spanish companies of all sizes. Spain has previous experience of agreements at sectoral level, though none of this magnitude or scope. To achieve the greatest impact, the Ministry decided to adopt an approach based on moderate reductions undertaken by a wider range of companies, rather than larger reductions in a smaller selection of big businesses. AESAN considered that sectoral associations represent the interests of a whole sector rather than a particular company, creating a more balanced dialogue.
The whole food supply chain was included in the measures so that the nutritional quality of the Spanish diet would be improved in a wide-ranging manner. In order to guarantee access to more food products suitable for a healthier diet, and in order that reformulation initiatives would contribute to reduction of certain nutrient intakes, collaboration and commitment from the manufacturing and retail sectors were required, as sales volume from the latter includes own-brands and is therefore substantial. Support from other relevant sectors, such as contract catering, restaurant and vending, is also necessary, as large sections of the population eat meals outside the home in different environments including schools and at work, using different formats such as ready-to-eat or fast-food menus, catering and vending machines.
Logic dictates that involvement of all stakeholders will create greater synergies and maximize impact by creating a “circle of demand”. For example, the out-of-home sector will request reformulated products in order to comply with its commitments. The vending sector has committed to purchase only reformulated products as the manufacturers introduce them. It is also expected that retailers will demand manufacturers supply them with reformulated own-brand products to complement their own-brand reformulations and achieve reduction targets. Nutrient reduction commitments for the out-of-home sector are the same as
those for manufacturers and retailers: 10% reduction in the median content of saturated fats in fried snacks; 10% reduction in the median content of total sugar in chocolate-flavoured children’s breakfast cereals; 16% reduction in the median content of salt in turkey breast; 10% reduction in the median content of added sugar in sugar-sweetened yoghurt; etc. Including specific measures for the out-of-home sector may therefore result in nutritional improvements, availability of healthier options, and the opportunity for a more varied, balanced, higher-quality diet across all spheres.
At the end of 2017 specific reformulation objectives for each category and subcategory were finalized, alongside other commitments to promote healthier diets, with a view to completion in 2020.
The core areas of the Plan are:
◉ I. Reformulation of products typically consumed by families, children and young people. There are 13 food groups included (salted snacks and chips; sugar-sweetened beverages; cakes and pastry; breakfast cereals; vegetable creams; meat products; biscuits; ice-creams; fruit nectar; pre-packed bread; ready meals; dairy products; sauces) and 57 subcategories of food products.
◉ II. Voluntary minimum reduction agreements made with the sectoral associations, so that all companies that form part of the sectoral associations commit to the minimum nutrient reductions in the relevant products.
◉ III. Offering balanced and healthy menus outside the home in school, work, and vending in public areas.
In total, 180 commitments have been reached.2 These include four general commitments; 75 quantitative measures of percentage reduction of agreed nutrients in the manufacturing and retail sectors; 27 quantitative measures agreed with other sectors (19 agreements with the contract catering sector, three agreements with the modern restaurant sector, and five agreements with the vending sectors); and 74 non-reformulation measures agreed with all sectors (for example, for sugar-sweetened beverages, there should be no provision of the product or sponsorship at sports events aimed at children under the age of 12 years; the modern restaurant sector should offer consumers virgin olive oil for dressing salads).
The products included in the Plan account for 44.5% of the total daily energy provided by food and beverages, focusing on those suitable for reformulation. This figure was derived using food consumption data from the ENALIA and ENALIA 2 nutritional surveys – surveys of national scope conducted in Spain on the child and adolescent population (2013–2014 ENALIA) and adults (2014–2015 ENALIA2).
4.4 Implementation process: monitoring and evaluationThe timeframe for the Plan was set to run until 2020 in order to allow time for substantial reformulation to occur and for products to be phased into the food network as stock is replenished. It is important to stress that the reduction must be made gradually for better consumer acceptability.
It is expected that any new products launched during this period will be in line with the agreed targets. To maximize transparency, the Plan provides details of the companies involved, objectives, types of commitment, timeframe and evaluation. All commitments and agreements have been

POLICY OPPORTUNITIES AND CHALLENGES 35
officially signed, published in the Spanish Official Bulletin (BOE), and made available on the AESAN website,2 in a benchmarking approach designed to provide a national standard, enhance accountability, and encourage leaders to improve and others to follow.
Before 2005, monitoring and evaluation mechanisms for voluntary initiatives in Spain were largely informal, with no explicit accountability frameworks in the event of non-compliance. Rather than continuing a situation where industry self-reported, the NAOS Strategy, launched in 2005 and consolidated and reinforced in 2011 by Law 17/2011 (art. 36),14 stipulated the creation of an obesity observatory as an independent public platform which would monitor the application and adherence of voluntary agreements. The Observatory of Nutrition and of the Study of Obesity was set up in 2013 as an information system to determine the nutritional situation and evolution of obesity in the Spanish population.15 It routinely carries out nutritional surveys and obesity and overweight surveillance, and monitors the nutrient content in food and beverages; and it now has a major role in monitoring and assessing compliance with the commitment targets of the Plan.
Monitoring will be conducted at the latest in the final year of the Plan (2020) in the same manner as the establishment of baseline data, to ensure a fair comparison and measure of success. Monitoring progress after a few years of implementation allows companies to develop new products
and get them onto the market. The exact nature of the assessment depends on the agreements; those agreements that are based on nutrient reduction targets will be assessed by a study of the nutrient content in food and beverages, following a predefined European methodology and using median contents of food categories. Compliance indicators for specific non-quantitative agreements with the contract catering, modern restaurant and vending sectors will be established. To facilitate transparency and dialogue with the sector associations during the monitoring process, “follow-up commissions” have recently been established by AESAN, through the Observatory of Nutrition and of the Study of Obesity. If required, AESAN will request the collaboration of the regional authorities.
While the accountability mechanism is “soft” rather than “hard” (i.e. there are no penalties or legal consequences for non-compliance), there are several mechanisms to ensure transparency, publicity, monitoring and evaluation of agreements. In addition, monitoring has been designed in such a way that AESAN can maximize its leverage by comparing progress to the baseline. If progress is not as expected and/or there are significant examples of non-adherence to the commitments, the Ministry has confirmed that other options are available, such as working with the legislative framework. Other complementary policies are also being developed, including introduction of easy-to-understand front-of-pack labelling – a move announced in November 2018.16
4.5 Challenges anticipated and further considerationsSuch a wide-ranging voluntary reformulation programme inevitably presents some challenges, which include the scale and pace of change. Larger companies, with their headquarters outside Spain, had to seek authorization for product composition changes, which slowed down some sectoral agreements and the setting of commitments. By contrast, some smaller companies have greater difficulty improving the composition of their products, so agreements that could be adopted by all companies were prioritized. Moreover, some companies did not belong to any sectoral association, which made it a challenge to ensure that they were also involved; some have taken on the same commitments as those agreed with the relevant and closest comparable association. Participating companies are publicly named on the AESAN website, encouraging others to sign up.
The catering and restaurant sectors represent a wide and heterogeneous range of establishments. The contract catering association represents companies that offer services to schools, hospitals, businesses, armed and security forces, residential homes and public administration centres. The modern restaurant association represents seated establishments, establishments without table service and take-away outlets. Given this variability of stakeholders, commitments have been agreed that depend on the type of establishment involved, while establishments that offer their services to public sector clients have commitments that can be integrated into public procurement procedures.
It is expected that the Plan will be a “framework of reference”, with the outcomes of the monitoring in 2020 directly serving to inform future initiatives. Evaluation of the Plan will consider whether the objectives have been achieved, whether they have been achieved through change across the board, and also whether more ambitious reformulation is required in the future. This case study highlights that the health sector cannot be a passive partner and must take a leading role in coordinating and managing the process; this role should include providing technical and formative guidance to inform efforts to engage the food industry in food reformulation, defining objectives, goals and roles, facilitating negotiations, monitoring adherence to agreed targets, and evaluating overall success. Such processes can be adversarial, so being prepared with data that provide an overall picture of the baseline situation and current market is essential. In addition, to prevent “window dressing” strategies and to ensure that the effort delivers maximum benefit, health actors need to assess the individual contribution that each private entity can make (i.e. what changes they can be expected to make, where, for which products); they should also have a clear vision of the objective and purpose of the collaboration to ensure that they are as far-reaching as possible.

36 IMPROVING DIETARY INTAKE AND ACHIEVING FOOD PRODUCT IMPROVEMENT
4.6 References *
* Unless otherwise stated, all websites mentioned in the References were accessed on 27 March 2019.
1. Authors are affiliated to NAOS Strategy. Food Safety and Nutri-tion Spanish Agency. Ministry of Health, Consumer Affairs and Social Well-being, Spain.
2. Plan de colaboración para la mejora de la composición de los alimentos y bebidas y otras medidas 2020 [Collaboration Plan for the Improvement of Food and Beverage Composition and other Measures 2020]. Madrid: Agencia Española de Seguri-dad Alimentaria y Nutrición (AESAN). Ministerio de Sanidad, Servicios Sociales e Igualdad; 2018 (in Spanish) (http://www.aecosan.msssi.gob.es/AECOSAN/web/nutricion/seccion/plan_colaboracion.htm).
3. Estudio ALADINO 2015: estudio de vigilancia del crecimiento, alimentación, actividad física, desarrollo infantil y obesidad en España 2015 [Study ALADINO 2015: study of growth, nutrition, physical activity, child development and obesity in Spain 2015]. Madrid: Agencia Española de Seguridad Alimentaria y Nutrición (AESAN). Ministerio de Sanidad, Servicios Sociales e Igualdad; 2016 (in Spanish) (http://www.aecosan.msssi.gob.es/AECOSAN/docs/documentos/nutricion/observatorio/Estu-dio_ALADINO_2015.pdf).
4. Added sugar intakes have been calculated taking into account data from: Estudio ENALIA 2012–2014: Encuesta Nacional de consumo de Alimentos en población Infantil y Adolescente [National Survey of Food Consumption in Children and Adoles-cents]. Madrid: Agencia Española de Seguridad Alimentaria y Nutrición. Ministerio de Sanidad, Consumo y Bienestar Social (AESAN); 2017 (in Spanish) (http://www.aecosan.msssi.gob.es/AECOSAN/docs/documentos/seguridad_alimentaria/ges-tion_riesgos/Informe_ENALIA2014_FINAL.pdf); López-Sobaler AM, Aparicio A, Rubio J, Marcos V, Sanchidrián R, Santos S et al. Adequacy of usual macronutrient intake and macronutrient distribution in children and adolescents in Spain: a national dietary survey on the child and adolescent population, ENALIA 2013–2014. Eur J Nutr. 2019;58(2):705–19; and data from a study of the sugar content in certain groups of food and bever-ages carried out in 2016, pending publication.
5. NAOS Strategy – Strategy for Nutrition, Physical Activity and the Prevention of Obesity. Madrid: Agencia Española de Segu-ridad Alimentaria y Nutrición (AESAN). Ministerio de Sanidad, Servicios Sociales e Igualdad (http://www.aecosan.msssi.gob.es/en/AECOSAN/web/nutricion/seccion/estrategia_naos.htm).
6. Agreement to reduce salt in bread (2004). Food reformulation – collective agreements. Madrid: Agencia Española de Seguridad Alimentaria y Nutrición (AESAN). Ministerio de Sanidad, Servi-cios Sociales e Igualdad; 2004 (http://www.aecosan.msssi.gob.es/en/AECOSAN/web/nutricion/ampliacion/reformulacion_al-imentos.htm).
7. Pérez Farinós N, Santos Sanz S, Dal Re MªÁ, Yusta Boyo J, Robledo T, Castrodeza JJ et al. Salt content in bread in Spain, 2014. Nutr Hosp. 2018;35(3):650–4.
8. Plan de reducción del consumo de sal [Plan for the Reduction of Salt Intake]. Madrid: Agencia Española de Seguridad Ali-mentaria y Nutrición (AESAN). Ministerio de Sanidad, Servicios Sociales e Igualdad; 2008 (http://www.aecosan.msssi.gob.es/en/AECOSAN/web/nutricion/subseccion/plan_consumo_sal.htm).
9. Contenido de sal en los alimentos en España, 2012 [Salt content in foods in Spain, 2012]. Madrid: Agencia Española de Seguridad Alimentaria y Nutrición (AESAN). Ministerio de Sanidad, Servicios Sociales e Igualdad; 2015 (http://www.aecosan.msssi.gob.es/AECOSAN/docs/documentos/nutricion/observatorio/sal_alimentos.pdf).
10. Pérez-Farinós N, Dal Re Saavedra MÁ, Villar Villalba C, Robledo de Dios T. Trans-fatty acid content of food products in Spain in 2015. Gac Sanit. 2016;30(5):379–82.
11. Moreiras GV, Iglesias MS, Aperte EA, González AG, Achón y Tuñón M. Alimentación y sociedad en la España del siglo XXI [Food and society in Spain in the 21st century]. Madrid: Fundación Mapfre; 2015 (in Spanish) (http://www.fen.org.es/storage/app/media/imgPublicaciones/30112015123848.pdf).Nuevos hábitos de compra y consumo de alimentos. Informe 2015 [New purchase habits and food consumption. Report 2015]. Confederación Española de Organizaciones de Amas de Casa, Consumidores y Usuarios; 2015 (in Spanish) (http://www.fuci.es/wp-content/uploads/2015/09/Nuevos-ha_bi-tos-de-Compra-y-Consumo-de-Alimentos-2015.pdf).
12. Council conclusions on food product improvement. Brussels: Council of the European Union; 2016 (https://publications.europa.eu/en/publication-detail/-/publication/a55f47a0-5096-11e6-89bd-01aa75ed71a1).
13. Study of the sugar content in certain groups of food and bev-erages. Madrid: Agencia Española de Seguridad Alimentaria y Nutrición (AESAN). Ministerio de Sanidad, Servicios Sociales e Igualdad; [unpublished].
14. Ley 17/2011, de 5 de julio, de seguridad alimentaria y nutrición [Law 17/2011, of 5 July, on food security and nutrition]. Madrid: Boletín Oficial del Estado; 2011 (https://www.boe.es/boe/dias/2011/07/06/pdfs/BOE-A-2011-11604.pdf).
15. Observatory of Nutrition and of the Study of Obesity: what is it? Madrid: Agencia Española de Seguridad Alimentaria y Nu-trición (AESAN). Ministerio de Sanidad, Servicios Sociales e Ig-ualdad; 2013 (http://www.aecosan.msssi.gob.es/en/AECOSAN/web/nutricion/subseccion/que_es_observatorio.htm).
16. Carcedo: “Vamos a implantar el etiquetado frontal de calidad nutricional para aportar mejor información a los consumi-dores de alimentos y bebidas” [Carcedo: “We will implement the front labelling of nutritional quality to provide better information to consumers on food and beverages”]. Madrid: La Moncloa; 12 November 2018 (in Spanish) (http://www.lamoncloa.gob.es/serviciosdeprensa/notasprensa/sanidad/Paginas/2018/121118premiosnaos.aspx).

POLICY OPPORTUNITIES AND CHALLENGES 37
5.1 SummaryUnhealthy eating habits are among the most important risk factors for the loss of healthy life years in the Portuguese population. As such, the development of comprehensive policies was an urgent priority. The Integrated Strategy for the Promotion of Healthy Eating, adopted by the Portuguese government, defines a broad set of measures, including the use of taxation, to curb consumption of sweetened beverages. This case study describes the context and process that led to the adoption of the Integrated Strategy, as well as the preliminary results of one of its first initiatives: the Portuguese Special Consumption Tax Levied on Sweetened Beverages.
This tax is levied on sweetened beverages and was, originally, structured into two tiers: the lower tier included drinks with sugar contents below 80 g per litre of final product; the upper tier covered drinks with sugar contents equal to or above 80 g per litre. In order to better understand the impact of this policy on the nutritional composition and sales of sweetened beverages, data provided by the Portuguese Association for Non-alcoholic Drinks and by the Portuguese National Tax and Customs Authority were analysed. After implementation of the tax, the share of products consumed within the upper tier saw a reduction of 23.7%; this corresponds to a nominal reduction of 5630 tons of sugar consumed by the Portuguese through sweetened beverages, equivalent to a yearly reduction of
15.2% compared to 2016. The reduction achieved by the Portuguese Special Consumption Tax Levied on Sweetened Beverages is more significant than that achieved by self-regulation mechanisms applied between 2013 and 2016.
Further technical analysis of the policy’s impact, which was led by a national task force specifically created for the purpose, identified reformulation of sweetened beverages, and consequent reduction in sugar contents, as one of the main consequences of the tax. This task force estimated the impact of this policy on health outcomes (mortality and obesity rates). According to the Preventable Risk Integrated ModEl (PRIME), endorsed by the WHO Regional Office for Europe, the reduction in sugar consumption attributable to sweetened beverages in 2017 is expected to delay or avoid a total of at least 27 deaths every year. Based on the impact analysis, the task force issued recommendations to add intermediate tiers to the initial taxation model. The Portuguese government determined the addition of these tiers from January 2019 onwards. This progressive taxation model is expected to further promote reformulation processes within the sweetened beverages sector, thus reducing sugar intake by an additional 15% until 2021. As such, we argue that this policy intervention has great potential in terms of public health impact and national and economic development, and could be viewed as a best practice by other countries.
5.2 Noncommunicable diseases (NCDs): a threat to universal health coverageAlmost 40 years after the creation of the Portuguese National Health Service (Serviço Nacional de Saúde (SNS)), Portugal has made great advances in public health. However, the country is also witnessing profound demographic and epidemiological changes.2
Living longer is one of the most remarkable achievements. The average life expectancy in Portugal is above the European Union (EU) average and now stands at over 80 years. However, along with longer life expectancy comes an ageing population. More than 20% of the Portuguese
5PORTUGALThe Portuguese sweetened beverages tax
Francisco Goiana-da-Silva, David Cruz-e-Silva, Afonso Oom-Sousa, Alexandre Morais Nunes, Maria João Gregório, Tânia Cordeiro, Conceição Calhau, Carla Lopes, Ana Rito, Marisa Miraldo, Alexandra Bento, Ara Darzi, Fernando
Araújo 1

38 IMPROVING DIETARY INTAKE AND ACHIEVING FOOD PRODUCT IMPROVEMENT
population is over 65 years old.3 This presents challenges in terms of increasing prevalence of NCDs, comorbidity, a shrinking pool of taxpayers and spiralling health care costs.4
At the same time, lifestyle patterns are changing among the population and have serious implications for both health and economic well-being.5,6 For example, according to WHO’s Childhood Obesity Surveillance Initiative (COSI),7 it is estimated that 30.7% of all Portuguese children aged 6–9 years are overweight and that 11.7% are obese; international comparisons reveal that the prevalence of child overweight in Portugal is above the average of all Member States of the Organisation for Economic Co-operation and Development
(OECD).8 In addition, more than 50% of the adult Portuguese population is overweight. Underpinning these figures is a worrying behavioural trend. People are shifting from the protective Mediterranean diet towards unhealthy eating. In fact, less than 20% of the Portuguese population adheres to the Mediterranean diet.9 Unhealthy diets are estimated to be responsible for the loss of 15.8% of healthy years of life among the Portuguese population.10
Several factors actively threaten the health of the population, as well as the universality and viability of the SNS. As such, controlling the prevalence of NCDs and tackling important risk factors, such as unhealthy diets, have become urgent priorities for Portugal in recent years.
5.3 The importance of involving different sectors in PortugalIn recent years several actions were taken as part of the National Programme for the Promotion of Healthy Eating.11 Even though this vertical programme produced some positive outcomes, they were not sufficient to significantly shift the current NCDs epidemiology and turn the tide on obesity. A broader, more intensive and intersectoral approach was needed for more effective health outcomes. A “Health in All Policies” (HiAP) approach was considered the best avenue for addressing these challenges.
According to WHO, HiAP is “an approach to public policies across sectors that systematically takes into account the health implications of decisions, seeks synergies, and avoids harmful health impacts in order to improve population
health and health equity”.12 HiAP can be useful in promoting efficiency through collaboration across sectors and resolving conflict.
The Portuguese government had already recognized the policy of promoting healthy eating as a priority.13 Historically, however, promotion of healthy eating by the Ministry of Health in Portugal has faced strong opposition as it conflicted with the interests and goals of other government sectors, such as agriculture, economy and industry. The great complexity involved in managing the traditionally conflicting interests of different sectors represented a barrier to policy development. More recently, faced with the growing challenge of NCDs and obesity, the government has managed to regroup and find common ground.
5.4 Integrated Strategy for the Promotion of Healthy EatingOn 15 September 2016, by Deliberation No. 334/2016, the Portuguese Council of Ministers recommended the creation of an interministerial working group for the purpose of developing a national strategy for the promotion of healthy eating.14 According to the instructions of the Council of Ministers, the working group should be composed of representatives of the Ministries of Finance, Internal Affairs, Education, Health, Economy, Agriculture and Sea. The nominated ministries devoted a significant amount of time to selecting their representatives, identifying their main objectives and priorities, determining the overall negotiation strategy and, finally, establishing the working group.
The first meeting was held in December 2016 at the headquarters of the Ministry of Health and focused on outlining the work to be done, identifying food products to be monitored, defining the monitoring process, establishing the objectives to be achieved, and clarifying the role of the public entities involved. Four overarching objectives were agreed in order to frame all further discussions:
◉ (1) change the availability of food products with high salt, sugar and fat contents;
◉ (2) improve the quality of available information on the risks associated with the consumption of salt, sugar and fats;
◉ (3) identify and promote intersectoral and integrated measures to reduce salt, sugar and fat consumption, namely in the agriculture, economy and education sectors;
◉ (4) improve the qualifications and methods used by professionals who can influence consumers’ eating and buying behaviours.
All the meetings were coordinated by a representative of the Ministry of Health. In addition to representatives of the above-mentioned ministries, the group also took into consideration input from national associations representing the food and distribution industry and consumers. All the logistical and administrative processes required for the meetings were coordinated by the Secretary-General of the Ministry of Health.
The interministerial working group subsequently held 10 meetings between December 2016 and July 2017 to devise a strategy promoting healthy eating that would help prevent and control NCDs. Approximately six months after its first meeting, the group delivered the final draft of an integrated healthy eating strategy to members of government. Upon reviewing the document, and in order to broaden the scope of external contributions by civil society, the Portuguese government submitted it for public consultation on 1 August

POLICY OPPORTUNITIES AND CHALLENGES 39
2017. Several nongovernmental organizations (NGOs), health authorities and civil society members offered their comments and recommendations. Sixteen position reports were submitted and forwarded to the interministerial working group for assessment. An initial strategy proposal was then reviewed and adapted to include all accepted contributions. In October 2017, a final consensual reviewed version of the strategy was sent to the government.
The consensus document became the basis for drafting an official order in a process led by the Ministry of Health. The Integrated Strategy for the Promotion of Healthy Eating (Estratégia Integrada para a Promoção da Alimentação Saudável (EIPAS)) was published on 29 December 2017.15
Fig. 5.1. Process leading to publication of Order No. 11418/2017 of the Portuguese Official State Gazette16
The strategy is structured into four strategic axes.
◉ Axis 1. Change the environment where people choose and buy food.
◉ Axis 2. Improve quality and accessibility of information available to consumers.
◉ Axis 3. Promote and develop literacy and autonomy for healthier consumer choices.
◉ Axis 4. Promote innovation and entrepreneurship in promoting healthy eating.17,18
Axis 1 explicitly included recommendations to introduce fiscal measures, such as taxation of unhealthy foods, intended to influence the practices of the agricultural sector and food industry.
5.5 Food price policies as a means to prevent NCDsGrowing evidence shows that taxing unhealthy foods is a promising policy intervention to promote healthy eating and the prevention of NCDs. The available evidence combines experimental, cross-sectional, modelling and natural experiment designs. In addition, several European countries have implemented taxes on different foods and
ingredients, mostly motivated by revenue-raising objectives (though the health gains and reformulation objectives are increasingly acknowledged). Combined, scientific evidence and country experiences indicate that changes in consumption patterns can be expected in response to price signalling. Based on this evidence, the Action Plan for the

40 IMPROVING DIETARY INTAKE AND ACHIEVING FOOD PRODUCT IMPROVEMENT
Prevention and Control of Noncommunicable Diseases in the WHO European Region 2016–2025 identified the use of fiscal policies as a priority intervention in the promotion of healthy food consumption.19 Moreover, levying taxes on sweetened beverages in the range of 20% is widely called for as an effective measure. 20,21,22,23
Taxation of sweetened beverages is advocated on the basis of consistent evidence showing that lowering intake of free sugars to less than 10% of the total energy intake reduces risk of overweight and tooth decay. Even though the estimated magnitude of the effect of pricing on food
consumption might be small, studies show that substantial health benefits may be achieved at the population level from reducing consumption of sweetened beverages.24,25
Sweetened beverages are a major source of excess sugar intake and their consumption is high in most countries, especially among children and adolescents. The positive association between consumption of sweetened beverages and higher risk of NCDs has consistently been shown in several studies. Most of these studies suggest that consumption of sweetened beverages is positively correlated with adiposity and obesity.26 Other studies show that consumption of soft drinks, given their high glycaemic index, might be positively correlated with the risk for developing diabetes.27,28
5.6 Portuguese Special Consumption Tax Levied on Sweetened BeveragesAccording to the latest National Food, Nutrition and Physical Activity Survey, the mean daily intake of free sugars in the Portuguese population is 35 g/day, contributing 7.5% of the total energy intake. These numbers are higher for children and adolescents. The intake of free sugars corresponds to 9.6% and 10.5% of the total energy intake of children and adolescents, respectively. In Portugal, 40.7% of children and 48.7% of adolescents have an intake of free sugars above the WHO recommendation of 10% of the total energy intake.9
In Portugal, consumption of sweetened beverages seems to be higher among younger age groups. Data from the Generation 21 cohort, which followed 8647 Portuguese children, showed that 35% of children aged 2 years old consume sweetened beverages on a weekly basis and that 52% of children aged 4 years old have a daily intake of these beverages (including nectars). Additionally, data from the latest National Food, Nutrition and Physical Activity Survey show that 40.6% of Portuguese teenagers reported a daily intake of sweetened beverages (including nectars).29 Data from this survey also show that sweetened beverages are one of the main contributors to free sugars intake, representing 11.9% of the total intake.9
Previously, Portugal had focused its efforts on promoting healthy eating through self-regulation. Working groups that included a variety of stakeholders, notably the food industry and the Ministry of Health, were established; one example was the National Platform to Fight Childhood Obesity. However, since there was no official endorsement for these initiatives from other government sectors, all commitments
assumed by the food industry were made on a fully voluntary basis. The lack of external, objective and robust monitoring methods, capable of making the food industry accountable, limited the potential outcomes. In fact, nowadays evidence on the effectiveness of these initiatives in Portugal is very scarce.
Following adoption of the Integrated Strategy, the Portuguese government considered that it was time to innovate and to deliver. It therefore created the Special Consumption Tax Levied on Sweetened Beverages, which is applicable to soft drinks (excluding nectars).30 According to the policy, the unit of taxation is the number of hectolitres of final product. The original applicable rates were: €8.22 per hectolitre, for beverages with less than 80 g of sugar per litre of final product; and €16.46 per hectolitre, for beverages with 80 g or more of sugar per litre of final product.
The Special Consumption Tax came into force on 1 February 2017. All businesses stocking sweetened beverages had up until 31 March 2017 to sell them without application of the new tax. After this period, the tax was levied on all sweetened beverages available on the Portuguese market.
The reaction of the general public to this measure was particularly positive. As a result, public criticism by the food industry seems to have lessened overtime. Instead, producers of sweetened beverages have focused on negotiating long-term redesign of the tax in order to make it “more progressive”. A more progressive tax is posited to allow for reformulation and higher health gains for consumers.
5.7 Preliminary resultsTo evaluate the effect of the Special Consumption Tax Levied on Sweetened Beverages, in 2018 the Portuguese government created an interministerial task force. This task force was intended to evaluate the impact of the taxation on:
◉ (1) consumer behaviours and consumption patterns;
◉ (2) distribution, production and catering industry practices, namely: (i) changes in content of sugar and artificial sweeteners in existing products; and (ii) changes in the range of products offered; and
◉ (3) competitiveness of Portuguese companies measured against foreign companies.
Data were obtained from the Portuguese Association for Non-alcoholic Drinks (PROBEB) via Global Data and from the Portuguese National Tax and Customs Authority. All the data presented refer to the first year of implementation of the tax.
The sales evolution of sweetened beverage brands in Portugal, based on the Portuguese government’s Task Force for the Sweetened Beverages Taxation Impact Assessment
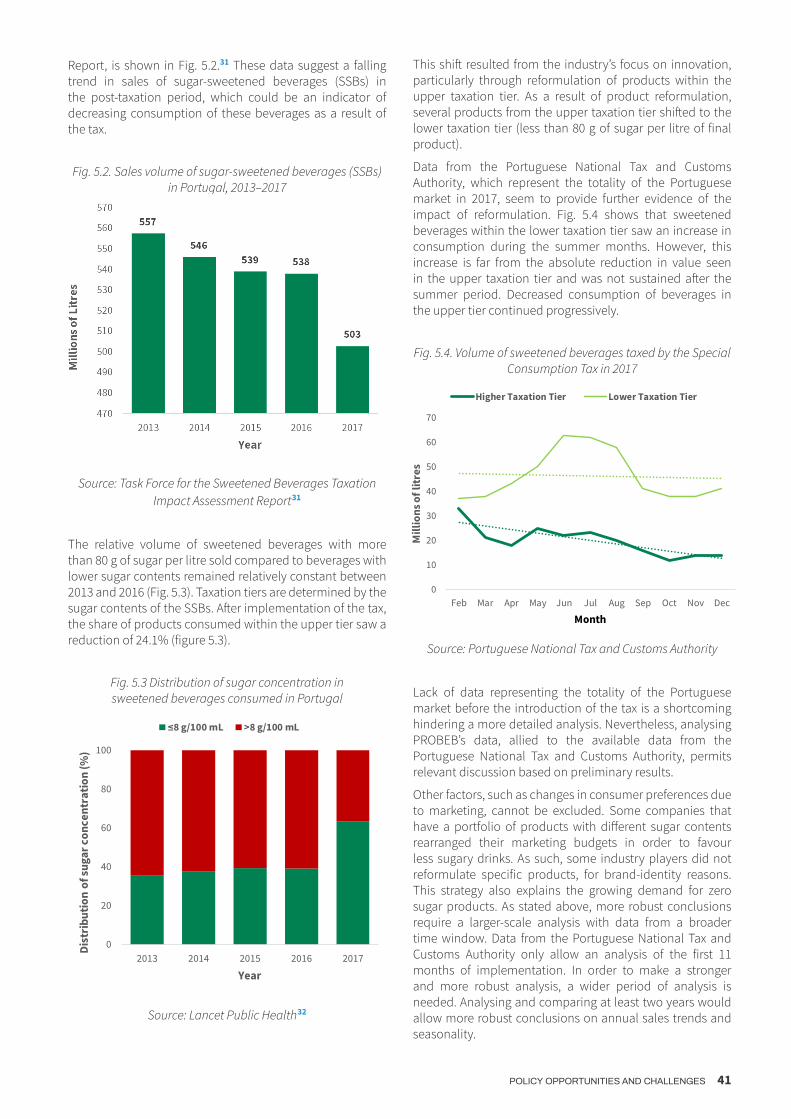
POLICY OPPORTUNITIES AND CHALLENGES 41
Report, is shown in Fig. 5.2.31 These data suggest a falling trend in sales of sugar-sweetened beverages (SSBs) in the post-taxation period, which could be an indicator of decreasing consumption of these beverages as a result of the tax.
Fig. 5.2. Sales volume of sugar-sweetened beverages (SSBs) in Portugal, 2013–2017
Source: Task Force for the Sweetened Beverages Taxation Impact Assessment Report 31
The relative volume of sweetened beverages with more than 80 g of sugar per litre sold compared to beverages with lower sugar contents remained relatively constant between 2013 and 2016 (Fig. 5.3). Taxation tiers are determined by the sugar contents of the SSBs. After implementation of the tax, the share of products consumed within the upper tier saw a reduction of 24.1% (figure 5.3).
Fig. 5.3 Distribution of sugar concentration in sweetened beverages consumed in Portugal
0
20
40
60
80
100
2013 2014 2015 2016 2017
Dist
ribu
tion
of su
gar c
once
ntra
tion
(%)
Year
≤8 g/100 mL >8 g/100 mL
Source: Lancet Public Health 32
This shift resulted from the industry’s focus on innovation, particularly through reformulation of products within the upper taxation tier. As a result of product reformulation, several products from the upper taxation tier shifted to the lower taxation tier (less than 80 g of sugar per litre of final product).
Data from the Portuguese National Tax and Customs Authority, which represent the totality of the Portuguese market in 2017, seem to provide further evidence of the impact of reformulation. Fig. 5.4 shows that sweetened beverages within the lower taxation tier saw an increase in consumption during the summer months. However, this increase is far from the absolute reduction in value seen in the upper taxation tier and was not sustained after the summer period. Decreased consumption of beverages in the upper tier continued progressively.
Fig. 5.4. Volume of sweetened beverages taxed by the Special Consumption Tax in 2017
0
10
20
30
40
50
60
70
Feb Mar Apr May Jun Jul Aug Sep Oct Nov Dec
Mill
ions
of l
itres
Month
Higher Taxation Tier Lower Taxation Tier
Source: Portuguese National Tax and Customs Authority
Lack of data representing the totality of the Portuguese market before the introduction of the tax is a shortcoming hindering a more detailed analysis. Nevertheless, analysing PROBEB’s data, allied to the available data from the Portuguese National Tax and Customs Authority, permits relevant discussion based on preliminary results.
Other factors, such as changes in consumer preferences due to marketing, cannot be excluded. Some companies that have a portfolio of products with different sugar contents rearranged their marketing budgets in order to favour less sugary drinks. As such, some industry players did not reformulate specific products, for brand-identity reasons. This strategy also explains the growing demand for zero sugar products. As stated above, more robust conclusions require a larger-scale analysis with data from a broader time window. Data from the Portuguese National Tax and Customs Authority only allow an analysis of the first 11 months of implementation. In order to make a stronger and more robust analysis, a wider period of analysis is needed. Analysing and comparing at least two years would allow more robust conclusions on annual sales trends and seasonality.

42 IMPROVING DIETARY INTAKE AND ACHIEVING FOOD PRODUCT IMPROVEMENT
Fig. 5.5 shows a shift in consumption of sweetened beverages from upper to lower tier, which corresponds to a nominal reduction of more than 5630 tons of sugar consumed by the Portuguese population through sweetened beverages; this is equivalent to a yearly reduction of 15.2% compared to 2016.
Fig. 5.5. Tons of sugar content within sweetened beverages sold by PROBEB
28
29
30
31
32
33
34
35
36
37
38
2013 2014 2015 2016 2017
1000
tons
of s
ugar
Year
Source: PROBEB
5.7.1 Impact on the manufacturing industryThe task force findings confirmed a reduction in the volume of beverages in the upper taxation tier in 2017. According to data provided by representatives of this sector in Portugal, this change is mostly due to innovative reformulation of products by players within the industry. This supports previous claims regarding reduction in sugar consumption in Portugal. The impact of public discussion generated around sugar consumption and its effect on health, and of investment in additional marketing by brands carrying products with lower sugar contents, must also be considered and further studied.
In its official report, the task force argued that the creation of additional taxation tiers could further promote innovation and product reformulation by the industry, given its more progressive nature and the incentive for companies to shift their products towards lower taxation tiers.31 Adding two additional taxation tiers and increasing the amount levied on the tier with higher sugar contents was a strong recommendation made by the task force. According to feedback given by the industry, a new tax design would further reduce energy content intake in the Portuguese population by 15%, as a result of additional incentives for product reformulation.
5.7.2 Estimated impact on mortalityIn Portugal, children and young people under 20 years of age consume the most sweetened beverages.9 Thus, the task force estimated that, in 15 to 20 years, the incidence of NCDs
related to excessive consumption of sugar, such as obesity, cardiovascular diseases, diabetes and cancer, would fall as a result of the tax. Similarly, the reduction was expected to reflect on mortality rates associated with these diseases. An evaluation using PRIME showed that the long-term process leading to reduction of NCDs incidence and NCD-related mortality had already started.33 WHO estimated that the reduction in sugar consumption attributable to sweetened beverages in 2017 would lead to a significant reduction in the number of premature deaths arising from NCDs within the next few years. According to PRIME, the tax would delay or avoid a total of at least 27 deaths every year.
The task force posited that the impact of the tax was likely to be significantly higher than the estimates provided by WHO. This was explained by the fact that PRIME did not account for the impact on children and adolescents who, curiously, are those consuming sweetened beverages the most.9 It was expected that this younger age group would benefit most from the tax.
5.7.3 Impact on obesityPortuguese data from 2015 and 2016 show that 50.2% of all teenagers (10–17 years old) consume more than 10% of their energy intake from free sugars, which is the maximum value recommended by WHO. The task force found that, one year after implementing the tax, the average caloric contents of sweetened beverages fell by 11%, which is more than double the reduction in previous years. The shift in caloric contents was a result of product reformulation. The task force also found that the total volume of sweetened beverages sold in Portugal (including companies not covered by PROBEB) fell by almost 7% as a result of the tax,31 thus supporting the aforementioned hypothesis regarding the sales volume of the industry as a whole.
Considering these outcomes, it is estimated that the proportion of teenagers consuming excess sugar would fall from 50.2% to 47.3%. If, as stated by the industry, an additional reduction of 15% in the average caloric content of sweetened beverages is achieved, the proportion of teenagers consuming excess sugar would fall further to 45%. Some 46 000 teenagers would thereby reduce their risk of obesity, diabetes and dental caries.31
Excess sugar intake – and consumption of sweetened beverages – strongly determines the risk of obesity.5 A simulation study using the average and standard deviation of body mass index (BMI) was undertaken in order to estimate the expected BMI and obesity prevalence from the reduction in sugar consumption. Assuming, once again, a 11% caloric content reduction and a 7% sales decrease, a 0.11% reduction in obesity prevalence is estimated. This corresponds to a fall of 1600 cases of obesity among people aged between 20 and 30 years in the medium term.
5.7.4 Impact on the sustainability of the SNSA conservative approach estimates a yearly investment of €7000 in health care per obesity case in Portugal.34 Consequently, the reduction in obesity prevalence resulting from implementation of the tax may lead to savings of roughly €11 million. The task force estimated that, if the
2013/2017 – 16%2016/2017 – 15.2%
POLICY OPPORTUNITIES AND CHALLENGES 43
industry continues to invest in product reformulation, savings might total €17 million per year. It was also estimated that, if the economic burden of other diseases associated with excessive consumption of sugar were taken into account, the total saving would be significantly higher. Furthermore, this estimate only accounts for direct medical costs; in some cases, direct costs due to NCDs, such as loss of productivity, exceed direct medical costs and must also be considered.35,36
Investment in health is considered an essential priority for societies. Health is known to have a multiplier effect on the economy. Improved health promotes a higher supply of labour, productivity, stock of human capital and available savings for investment. Ensuring the sustainability of health systems and making a positive contribution to
macroeconomic performance go hand in hand. In fact, this topic is among the top policy priorities across the OECD area.37,38,39,40
The effects of health on the economy are clear. Countries with weak health and education conditions find it harder to achieve sustained growth and witness wider income inequality. Evidence shows that as average life expectancy increases, so does gross domestic product (GDP).41
Based on this evidence, the task force concluded that it was reasonable to assume that the Special Consumption Tax – given its impact on mortality associated with sugar consumption and, consequently, on average life expectancy – would have a positive impact on Portuguese GDP and the economy.
5.8 Redesigning the Portuguese Special Consumption Tax Levied on Sweetened BeveragesBuilding on the evaluation of the Special Consumption Tax Levied on Sweetened Beverages and the recommendations made by the interministerial task force, the Portuguese parliament approved a new taxation design for SSBs on 29 November 2018.32
The new design of the Special Consumption Tax includes four taxation tiers. Compared to the previous model, there was a 25% increase in the tax applied to beverages with more than 80 g of added sugar per litre of final product. On the other hand, in order to promote product reformulation, the two new tiers are subject to lower rates of taxation.
The unit of taxation is the number of hectolitres of final product. The new applicable rates are:
◉ €20.00 per hectolitre, for beverages with 80 g or more of added sugar per litre of final product
◉ €8.00 per hectolitre, for beverages with 50–80 g of added sugar per litre of final product
◉ €6.00 per hectolitre, for beverages with 25–50 g of added sugar per litre of final product
◉ €1.00 per hectolitre, for beverages with less than 25 g of added sugar per litre of final product.
This new taxation design was implemented on 1 January 2019.42 Portugal is the first country to redesign its taxation model to promote innovation and maximize sugar reduction through product reformulation.
The collaboration of the Portuguese government with industry in defining this new taxation model is also ground-breaking. As a result, following implementation of the new taxation design, representatives of the sweetened beverages industry committed to reducing the caloric contents of their products by an additional 15% over the next three years. This reduction will broaden the impact of the taxation, in terms of mortality, morbidity and future savings for the SNS.
5.9 Discussion and conclusionsNCDs develop mostly as a consequence of behavioural determinants. Unhealthy eating habits play a major role as a modifiable and avoidable risk factor. According to the literature,43 strategies promoting healthy dietary habits, addressing both behavioural and environmental determinants, must cut across different sectors and make use of different approaches. Environmental interventions, such as national taxation policies, are more likely to be impactful, cost–effective and equitable compared to circumstantial interventions targeting individuals. However, creating political momentum for implementation and evaluation of national policy intervention is challenging.44
Leading public health institutions recognize the economic, social and health benefits of implementing taxes on sweetened beverages.45 Income generation must not be prioritized over health determinants, especially in the case of children and young people.46
This pricing policy will reduce inequalities among different population groups. This is because, according the Portuguese National Institute of Health (INSA), the groups that consume most sweetened beverages, such as people at lower income and education levels, are the most vulnerable to develop NCDs.47 By promoting transfer of consumption to healthier choices, such as water, which is not more expensive, this policy will reduce the risk of developing NCDs among the most vulnerable population groups.
Preliminary results from Portugal confirm the hypothesis stated in the literature reviewed and add to the growing number of case studies worldwide. The available data from Portugal show that there was relative stability of sales of sweetened beverages up until 2016. Taxing sweetened beverages led to a steep reduction in consumption and sugar contents. This policy intervention is estimated to have had a far greater impact on the population’s diet than

44 IMPROVING DIETARY INTAKE AND ACHIEVING FOOD PRODUCT IMPROVEMENT
all education and self-regulation mechanisms combined. Product reformulation, driven by a tiered tax design, largely explains the reduction in sugar consumption in Portugal.
The task force, created to evaluate the impact of the Special Consumption Tax Levied on Sweetened Beverages, suggested that the tax should be redesigned in order to achieve additional public health benefits. The intermediate tiers are designed to further promote product reformulation.
It is estimated that most of the health gains made and health expenses avoided by the tax benefit lower socioeconomic population groups. For this reason, the tax also serves as a measure to tackle health inequalities. Nevertheless, it is also key to ensure that revenues generated by this fiscal measure are invested in health promotion initiatives. This allows the creation of a multiplier effect in the positive impacts of the tax and prevents criticism from stakeholders arguing that the tax serves only revenue-generating purposes.
At the international level, food taxes are being implemented not only to promote reduction of unhealthy food consumption but also to generate revenue for health promotion measures. These policies are intended to be an opportunity to increase budgets for health promotion, which are significantly low in almost all countries. OECD Member States currently allocate, on average, around 3% of their health budget to public health and disease prevention.37
In Portugal, less than 1% of the health budget is invested in health promotion and disease prevention. Revenues from policies such as the Special Consumption Tax Levied on Sweetened Beverages should be used to increase investment in public health policy interventions.
The successes, including the recent redesign, of the Portuguese Special Consumption Tax Levied on Sweetened Beverages highlight the importance of reviewing health policy taxation in order to optimize health gains for the general population. Policy-makers, politicians and academics must collaborate to establish a flexible environment in which health policies can adapt to growing health challenges effectively and efficiently. We argue that this policy intervention has great potential in terms of public health impact and national and economic development, and could be viewed as a best practice by other countries.

POLICY OPPORTUNITIES AND CHALLENGES 45
5.10 References *
* Unless otherwise stated, all websites mentioned in the References were accessed on 1 April 2019.
1. Francisco Goiana-da-Silva – Centre for Health Policy, Institute of Global Health Innovation, Imperial College London, United Kingdom; Faculdade de Ciências da Saúde, Universidade da Beira Interior, Portugal David Cruz-e-Silva – Centre for Innovation, Technology and Policy Research, IN+, Instituto Superior Técnico, Universidade de Lisboa, Lisbon, Portugal Afonso Oom-Sousa – Imperial College Business School, Impe-rial College London, United Kingdom Alexandre Morais Nunes – Centro de Administração e Políticas Públicas, Instituto Superior de Ciências Sociais e Políticas, Universidade de Lisboa, Lisboa, Portugal Maria João Gregório – Health Directorate-General; EpiDoC Unit, Chronic Diseases Research Center (CEDOC), NOVA Med-ical School, Lisbon, Portugal; Faculty of Nutrition and Food Sciences, University of Porto, Porto, Portugal Tânia Cordeiro – Portuguese Council of Nutritionists Conceição Calhau – Nutrition and Metabolism, NOVA Medical School | Faculdade de Ciências Médicas da Universidade Nova de Lisboa; CINTESIS, Center for Health Technology Services Research, Rua Doutor Plácido da Costa, 4200-450 Porto, Portugal Carla Lopes – Department of Public Health and Forensic Sciences, and Medical Education, University of Porto Medical School; Epidemiology Research Unit (EPIUnit), Institute of Public Health, University of Porto Ana Rito – INSA, National Institute of Health, Portugal Marisa Miraldo – Imperial College Business School, Imperial College London, United Kingdom Alexandra Bento – Portuguese Council of Nutritionists Ara Darzi – Department of Surgery and Cancer, Faculty of Medi-cine, Imperial College London, United Kingdom Fernando Araújo – Centro Hospitalar Universitário São João, Faculty of Medicine, Porto University, Oporto, Portugal
2. Retrato da saúde em Portugal [Portrait of health in Portugal]. Lisbon: Ministério da Saúde [Ministry of Health]; 2018 (in Portu-guese) (https://www.sns.gov.pt/wp-content/uploads/2018/04/RETRATO-DA-SAUDE_2018_compressed.pdf).
3. Eurostat [database]. Population by age group. Luxembourg: European Statistical Office; 2018 (http://ec.europa.eu/eurostat/tgm/refreshTableAction.do?tab=table&plugin=1&pcode=t-ps00010&language=en).
4. Panagopoulos T, Barreira AP. Understanding the shrinkage phenomenon in Portugal. Faro: University of Algarve; 2013 (https://sapientia.ualg.pt/bitstream/10400.1/3983/1/cities%20growing%20smaller%20portugal.pdf).
5. Cecchini M, Sassi F, Lauer JA, Lee YY, Guajardo-Barron V, Chisholm D. Tackling of unhealthy diets, physical inactivity, and obesity: health effects and cost-effectiveness. Lancet. 2010;376(9754):1775–84. doi: 10.1016/S0140-6736(10)61514-0.
6. Brown C, Halvorson E, Cohen G, Lazorick S, Skelton J. Ad-dressing childhood obesity: opportunities for prevention. Pediatr Clin North Am. 2015;62(5):1241–61. doi: 10.1016/j.pcl.2015.05.013.
7. Rito A, Cruz de Sousa R, Mendes S, Graça P. Childhood Obesity Surveillance Initiative: COSI Portugal 2016. Lisbon: Instituto Nacional de Saúde Doutor Ricardo Jorge/Ministry of Health of Portugal; 2017 (http://repositorio.insa.pt/bit-stream/10400.18/4857/8/COSI%202016_V2_fev2018.pdf).
8. Organisation for Economic Co-operation and Development. Health at a glance 2017. Paris: OECD Publishing; 2017 (https://read.oecd-ilibrary.org/social-issues-migration-health/health-at-a-glance-2017_health_glance-2017-en#page1).
9. Lopes C, Torres D, Oliveira A, Severo M, Alarcão V, Guiomar S et al. Inquérito Alimentar Nacional e de Atividade Física [National Food, Nutrition and Physical Activity Survey] IAN-AF 2015–2016. Relatório Parte II. Porto: Universidade do Porto; 2017 (https://ciafel.fade.up.pt/modules/file_repository/data/Site/relatorio_resultados_ian_af.pdf).
10. A saúde dos Portugueses 2016 [The health of the Portuguese 2016]. Lisbon: Direção-Geral da Saúde; 2016 (in Portuguese) (https://comum.rcaap.pt/bitstream/10400.26/18278/1/A%20Saúde%20dos%20Portugueses%202016.pdf).
11. Graça P, Gregório MJ, Sousa SM, Carriço J, Correia A, Salvador C. The Portuguese National Programme for the Promotion of Healthy Eating, 2012–2015. Public Health Panorama. 2016;2(2):117–247 (http://www.euro.who.int/__data/assets/pdf_file/0005/314087/Volume-2-Issue-2-June2016.pdf).
12. Health in All Policies: Framework for Country Action. Geneva: World Health Organization; 2013 (http://www.who.int/health-promotion/conferences/8gchp/130509_hiap_framework_for_country_action_draft.pdf).
13. XXI Portuguese Constitutional Government. Government Programme. Lisbon: Portuguese Constitutional Government; 2015 (https://www.portugal.gov.pt/ficheiros-geral/programa- do-governo-pdf.aspx).
14. Deliberação do Conselho de Ministros No. 334/2016, cria um Grupo de Trabalho para a elaboração de uma estratégia para a promoção da alimentação saudável [Resolution of the Council of Ministers No. 334/2016, establishing a Working Group for the elaboration of a strategy for the promotion of healthy food]. Lisbon: Presidência do Conselho de Ministros; 2016 (in Portuguese).
15. Order No. 11418/2017 of 29 December 2017. Aprova a Estraté-gia Integrada para a Promoção da Alimentação Saudável [Approves the Integrated Strategy for the Promotion of Healthy Eating]. Diário da República [Official State Gazette] No. 249; 2017 (in Portuguese) (https://dre.pt/pesquisa/-/search/114424591/details/normal?l=1).
16. The figure is adapted from Goiana-da-Silva F, Cruz-e-Silva D, Gregório MJ, Nunes AM, Graça P, Bento A et al. Bringing government sectors together to address noncommunicable diseases: Portugal’s interministerial healthy eating strategy. Public Health Panorama. 2018;4(3):426–34.
17. Goiana-da-Silva F, Cruz-e-Silva D, Gregório MJ, Nunes AM, Graça P, Bento A et al. Bringing government sectors together to address noncommunicable diseases: Portugal’s inter-ministerial healthy eating strategy. Public Health Panorama. 2018;4(3):426–34 (http://www.euro.who.int/__data/assets/pdf_file/0018/380331/php-4-3-cs2-eng.pdf).
18. Graça P, Gregório MJ, Sousa SM, Brás S, Penedo T, Bandarra N et al. A new interministerial strategy for the promotion of healthy eating in Portugal: implementation and initial results. Health Res Policy Syst. 2018;16(1):102. doi: 10.1186/s12961-018-0380-3.
19. Action Plan for the Prevention and Control of Noncommu-nicable Diseases in the WHO European Region 2016–2025. Copenhagen: WHO Regional Office for Europe; 2016.

46 IMPROVING DIETARY INTAKE AND ACHIEVING FOOD PRODUCT IMPROVEMENT
20. Andreyeva T, Long M, Brownell K. The impact of food prices on consumption: a systematic review of research on price elastici-ty of demand for food. Am J Pub Health. 2010;100(2):216–22.
21. Powell L, Chriqui J, Wada R, Chaloupka F. Assessing the poten-tial effectiveness of food and beverage taxes and subsidies for improving public health: a systematic review of prices, demand and body weight outcomes. Obes Rev. 2013;14(2):110–28. doi: 10.1111/obr.12002.
22. Smith TA, Biing Hwan Lin, Jonq-Ying Lee. Taxing caloric sweet-ened beverages: potential effects on beverage consumption, calorie intake, and obesity. Washington (DC): US Department of Agriculture, Economic Research Service; 2010 (https://www.ers.usda.gov/webdocs/publications/44732/8310_err100_re-portsummary_1_.pdf).
23. Andreyeva T, Chaloupka F, Brownell K. Estimating the potential of taxes on sugar-sweetened beverages to reduce consump-tion and generate revenue. Prev Med. 2011;52(6):413–16. doi: 10.1016/j.ypmed.2011.03.013.
24. Mytton O, Clarke D, Rayner M. Taxing unhealthy food and drinks to improve health. Brit Med J. 2012;344:e2931. doi: 10.1136/bmj.e2931.
25. Summary report on the technical consultation on reducing sugar intake in the Eastern Mediterranean Region. Cairo: WHO Regional Office for the Eastern Mediterranean; 2015 (http://ap-plications.emro.who.int/docs/IC_Meet_Rep_2015_EN_16667.pdf).
26. Woodward-Lopez G, Kao J, Ritchie L. To what extent have sweetened beverages contributed to the obesity epidem-ic? Public Health Nutr. 2011;14(3):499–509. doi: 10.1017/S1368980010002375.
27. Ludwig DS. The glycemic index: physiological mechanisms relating to obesity, diabetes, and cardiovascular disease. JAMA. 2002;287(18):2414–23.
28. Yoshida M, McKeown NM, Rogers G, Meigs JB, Saltzman E, D’Agostino R et al. Surrogate markers of insulin resistance are associated with consumption of sugar-sweetened drinks and fruit juice in middle and older-aged adults. J Nutr. 2007;137:2121–7. doi: 10.1093/jn/137.9.2121.
29. Lopes C, Oliveira A, Afonso L, Moreira T, Durão C, Severo M et al. Consumo alimentar e nutricional de crianças em idade pré-es-colar: resultados da coorte Geração 21 [Food and nutritional intake of pre-school children: results of the Generation 21 cohort]. Porto: Instituto de Saúde Pública da Universidade do Porto; 2014 (in Portuguese) (http://epidemiologia.med.up.pt/pdfs/RelCons.pdf).
30. Goiana-da-Silva F, Nunes A, Miraldo M, Bento A, Breda J, Araújo F. Fiscalidade e saúde pública: experiência na Tributação das Bebidas Açucaradas [Taxation and public health: experience of the Tax on Sugared Beverages]. Acta Medica. 2018;31 (in Portuguese).
31. Relatório do grupo de trabalho (Order No. 2774/2018). Impacto do imposto especial sobre o consumo de bebidas açucaradas e adicionadas de edulcorantes [Report of the working group (Order No. 2774/2018). Impact of special duty on sweetened beverages]. Lisbon: Government of Portugal; 2018 (https://www.portugal.gov.pt/download-ficheiros/ficheiro.aspx-?v=a3743967-dd85-4030-87a9-b92dd2d21d77).
32. Goiana-da-Silva F, Cruz-e-Silva D, Gregorio MJ, Miraldo M, Darzi A, Araujo F. The future of the sweetened beverages tax in Portugal. Lancet Public Health. 2018;3(12):e562. doi: 10.1016/S2468-2667(18)30240-8.
33. WHO impact assessment of the Portuguese SSB tax on mortal-ity. Letter to the Portuguese government. Copenhagen: WHO Regional Office for Europe; 2018 (https://www.sns.gov.pt/wp-content/uploads/2018/09/ComOMS.pdf).
34. Kim DD, Basu A. Estimating the medical care costs of obesity in the United States: systematic review, meta-analysis, and em-pirical analysis. Value Health. 2016;19(5):602–13. doi: 10.1016/j.jval.2016.02.008.
35. Benjamin EJ, Blaha MJ, Chiuve SE, Cushman M, Das SR, Deo R et al. Heart disease and stroke statistics – 2017 update: a report from the American Heart Association. Circulation. 2017;135(10):e146–e603.
36. Cost statistics: the cost of arthritis in US adults. Atlanta (GA): Centers for Disease Control and Prevention; 2018 (https://www.cdc.gov/arthritis/data_statistics/cost.htm).
37. Organisation for Economic Co-operation and Development/European Union. Health at a glance: Europe 2016 – State of Health in the EU Cycle. Paris: OECD Publishing; 2016 (https://ec.europa.eu/health/sites/health/files/state/docs/health_glance_2016_rep_en.pdf).
38. Kasman M, Hammond RA, Werman A, Mack-Crane A, McKinnon RA. An in-depth look at the lifetime economic cost of obesity. Washington (DC): Brookings; 2015 (https://www.brookings.edu/wp-content/uploads/2015/05/0512-Obesity-Presenta-tion-v6-RM.pdf).
39. Goettler A, Grosse A, Sonntag D. Productivity loss due to over-weight and obesity: a systematic review of indirect costs. BMJ Open. 2017;7(10):e014632. doi: 10.1136/bmjopen-2016-014632.
40. Diana S, Shehzad A, Freia DB. Lifetime indirect cost of child-hood overweight and obesity: a decision analytic model. Obesity. 2016;24(1):200–6. doi: 10.1002/oby.21323.
41. Antunes JL. A Nova Medicina. Lisbon: Fundação Francisco Manuel dos Santos; 2012 (in Portuguese).
42. Law No. 71/2018 of 31 December 2018. Diário da República [Official State Gazette] No. 251; 2018 (in Portuguese) (https://dre.pt/home/-/dre/117537583/details/maximized).
43. Using price policies to promote healthier diets. Copenhagen: WHO Regional Office for Europe; 2015 (http://www.euro.who.int/__data/assets/pdf_file/0008/273662/Using-price-poli-cies-to-promote-healthier-diets.pdf).
44. von Philipsborn P, Stratil JM, Burns J, Busert LK, Pfadenhauer LM, Polus S et al. Environmental interventions to reduce the consumption of sugar-sweetened beverages and their effects on health. Cochrane Database of Systematic Reviews. 2016, Issue 7, Art. No. CD012292. doi: 10.1002/14651858.CD012292.
45. Hyseni L, Atkinson M, Bromley H, Orton L, Lloyd-Williams F, Mc-Gill R et al. The effects of policy actions to improve population dietary patterns and prevent diet-related noncommunicable diseases: scoping review. Eur J Clin Nutr. 2017;71:694–711. doi: 10.1038/ejcn.2016.234.
46. Veerman JL, Sacks G, Antonopoulos N, Martin J. The impact of a tax on sugar-sweetened beverages on health and health care costs: a modelling study. PLoS One. 2016;11:e0151460. doi: 10.1371/journal.pone.0151460.
47. Boletim Epidemiológico Observações. 2nd series, Vol. 6, No. 20. Lisbon: National Institute of Health (INSA); 2017 (http://repositorio.insa.pt/bitstream/10400.18/4881/3/Boletim_Epide-miologico_Observacoes_N20_setembro-dezembro_2017.pdf).

POLICY OPPORTUNITIES AND CHALLENGES 47
6.1 IntroductionConsumption of processed foods is high in developed countries.2 Definitions of (highly) processed food may vary. In the Netherlands, about 50% of energy intake is provided by (highly) processed foods such as cakes, biscuits, breakfast cereals, crisp bread, confectionery, processed meat and fish, sugar sweetened dairy, yoghurt, cheese, cream desserts, margarines and other fats, and alcoholic beverages.3 When bread and milk are included, the share of processed foods amounts to 80%.4 Thus, the nutritional composition of processed foods is of importance for population health. Via food reformulation, food composition of processed foods can be changed in healthier directions. In the Netherlands, food reformulation efforts have been carried out to lower trans- and saturated fatty acids, sodium/salt and sugar (caloric) contents of foods.
This paper describes reformulation activities in the Netherlands with a focus on the National Agreement to Improve Product Composition.5 This agreement started in 2014 and remains in force until the end of 2020. In addition, also other private initiatives to lower the amount of salt, saturated fat and sugar in products, were taken by the food industry, catering and hospitality sectors. For example, food reformulation was promoted via a FOP logo called “het Vinkje” (internationally known as Choices logo), which is currently being phased out. This chapter is focused on reformulation aspects of the agreement, with a description of its governance as well as monitoring aspects.
6.1.1 From Task Forces to National AgreementWhen in the early 1990s the adverse effects of trans fatty acids (TFAs) as a risk factor for coronary heart disease became clear, the Anglo-Dutch food multinational Unilever decided to eliminate TFAs from its spreads and other retail
foods.6 The decision to remove TFAs was triggered by media events and was in line with the company’s policy to “know your product and apply your knowledge”. Other producers followed their example, and by 1996 most of the retail margarines in the Netherlands contained only trace amounts of TFAs.6 This was completely a private sector initiative, without (legislative) measures of the Dutch authorities.
In 2003, the Dutch Task Force for the Improvement of Fatty Acid Composition was initiated by the Product Board for Margarine, Fats and Oils. The purpose of this is self-regulatory initiative, was to contribute to the public health goals of the Dutch government to lower saturated fatty acid (SFA) and TFA intake, via food reformulation. The members of the task force comprised Dutch suppliers and purchasers of industrial vegetable oils and fats, such as producers of potato products, bread, pastry, cakes and biscuits, snacks, margarines and vegetable fats and oils.7,8 The food groups addressed by its members covered 45% of TFA intake and 34% of SFA intake at baseline.9 Food groups without reformulation activities for TFA and SFA via the taskforce were dairy (including cheese), meat products, and for TFA crisps and (coated) nuts. The task force members monitored and reported compositional changes yearly at the food product level. The Ministry of Health, Welfare and Sports and the Netherlands Nutrition Centre were present in the task force as an observer. Impact assessments, using the reported compositional data, showed effects of changes in TFA concentrations on daily intake (from 1.0% of daily energy intake (E%) in the reference to 0.8 E% in the reformulation scenario), whereas daily SFA remained similar (around 13 E%).10
6 NETHERLANDSReformulation of food composition via public–private agreements
Elisabeth H.M. Temme, Caroline Wilson, Ivon Milder 1

48 IMPROVING DIETARY INTAKE AND ACHIEVING FOOD PRODUCT IMPROVEMENT
In 2006, the Dutch Health Council published new guidelines for nutrition that, for the first time, explicitly contained advice on maximum salt consumption at 6 g/day.11 In order to contribute to the nutrition policy that the Ministers of Health and Agriculture published in 2008, industry raised a new task force on salt reduction. The Dutch Federation of the Food and Beverages Industry was aware of both the positive results of the fatty acid composition task force and the United Kingdom strategy on salt. In 2007, this federation initiated a self-regulatory Taskforce on Salt Reduction.12 This task force, which included producers of (e.g.) sauces and soups, cheese, snacks, and pastry, aimed at a reduction of salt levels in processed foods of 12% by 2010. This was in addition to the regulations for bread as described below. The task force monitored and reported successful progress as an average reduction in sodium content for all covered product categories.13 The Dutch consumer organization periodically analysed the salt content of specific food groups and reported them to be too salty.14 In addition, monitoring was carried out by the Netherlands Food and Consumer Product Safety Authority (NVWA); these results are included in the monitoring of the National Agreement to Improve Product Composition (see Section 6.3).
6.1.2 Regulation via the Commodities ActSalt in Dutch bread is regulated by means of the Commodities Act (Warenwetbesluit Meel en Brood).15 The bread sector particularly needed the “level playing field” of regulation because of the large number of (small) bakeries, which would have made sector-wide voluntary agreements more challenging to implement. The maximum level of salt in bread has gradually decreased over the last decade. In 2009, the maximum salt content per 100 g dry matter was 2.5%; in 2011 2.1%; and in 2012 1.9%. The latest amendment to the maximum level was on 1 January 2013, 1.8% per 100 g dry matter. Based on an average dry matter content of 64%, this is approximately 1.15 g per 100 g of bread (454 mg of sodium). Monitoring of the sector using analytical methods showed the expected reductions in salt contents of bread.16 From October 2018 onwards the definition of bread that has to comply with the regulation is extended to “all bread that may be consumed on a daily basis”, with the same maximum level.17
Early experience with the self-regulatory task forces in the Netherlands, particularly for TFA, showed reduced daily intakes at population level via product reformulation. The case of the bread sector highlighted that the creation of a level playing field is important, especially when there are many small producers.
6.2 National Agreement to Improve Product CompositionIn 2014, the National Agreement to Improve Product Composition (AVP) was drawn up with the aim to reduce the salt, saturated fat and calorie content (sugar and fat) of products. The agreement had a broader scope than the original task forces and has been signed by the following parties: Dutch Food Retail Organization (CBL), Federation of the Dutch Food Industry (FNLI), Royal Dutch Hotel and Catering Association (KHN), Dutch Catering Association (Veneca), Minister of Health, Welfare and Sport (VWS). The parties jointly, each based on their own areas of responsibility, set the following objectives up to and including 2020:
◉ To reduce the salt content in the range of products so that it is easier for consumers to consume a maximum of 6 g of salt per day. Consumers with consumption in accordance with the National Dietary Guidelines can comply with the consumption of a maximum of 6 g per day by 2020 at the latest. This means that people consuming diets according to the national dietary guidelines in 2020 have average salt intakes according to recommendations (below 6 gram per day), while with previous guidelines it was estimated to be above.
◉ To reduce the saturated fat content in the range of products so that it is easier for consumers to consume a maximum of 10 E% from saturated fats per day. To achieve this by 2020.
◉ To make it easier for consumers to consume less energy. To achieve this by 2020 by, wherever possible, reducing both the energy density of products via a
reduction in sugar and/or (saturated) fat and/or a reduction in portion sizes as well as by continuing to promote consumption of fruit and vegetables.
Population/consumer-facing objectives were chosen rather than product-oriented goals to underline that a role for the consumer remains; a consumer choosing to eat foods high in salt content will probably not stay within the 6 g consumption.
For the Agreement, each year a work plan is announced by the signing parties. Preferably the food groups targeted are those that contribute significantly to the consumption of salt, saturated fat and calories in the population. Within each specific food group, the focus is preferably on the “worst in class” products e.g. food products with the highest salt content. Based on recent food consumption survey data, pie charts were made to assist prioritizing and show the foods groups contributing most to daily intakes of each specific nutrient of public health concern (see Fig. 6.1 for salt content). In addition, box plot figures per food group provided information on the variation in contents at baseline (see for example Fig. 6.2 for sodium contents of bread and savoury snacks). For these figures, the sodium content data were derived from the Netherlands food composition table (NEVO) of 2011.18 In addition, the prioritization of the food product categories could also be driven by the improvement that can be technologically achieved. High priority should be given to products that are intended for children.

POLICY OPPORTUNITIES AND CHALLENGES 49
Fig. 6.1. Food groups contributing to salt intake (including discretionary salt) in the Netherlands22
22%
20%
21%
3%
4%
4%
4%
6%
8%
8%
bread and cereal productsdiscretionary saltother foodsconfectionery / baked goodssoupssaucessavoury snacksmeat (preparations)meat (cold cuts)cheese
Fig. 6.2. Variation of sodium contents (mg/100 g) in bread and savoury snacks in the Netherlands, dotted line is the criterion for obtaining a health logo “Vinkje” (which is currently phased out)
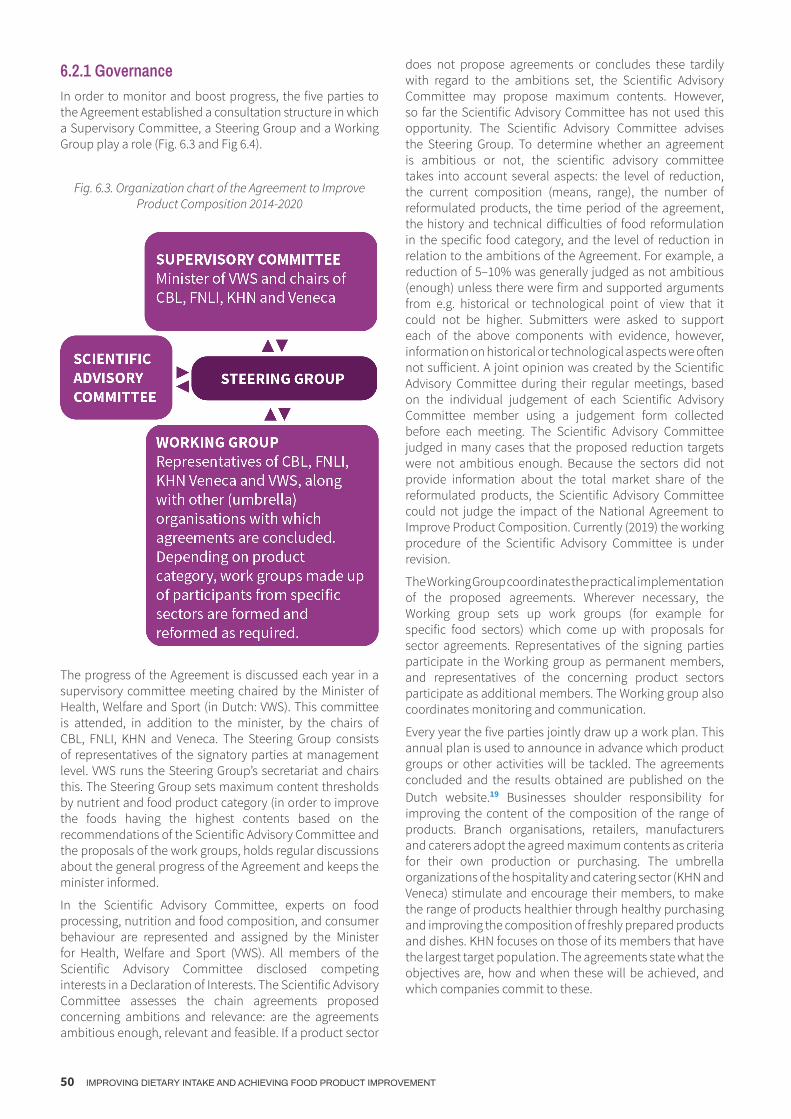
50 IMPROVING DIETARY INTAKE AND ACHIEVING FOOD PRODUCT IMPROVEMENT
6.2.1 GovernanceIn order to monitor and boost progress, the five parties to the Agreement established a consultation structure in which a Supervisory Committee, a Steering Group and a Working Group play a role (Fig. 6.3 and Fig 6.4).
Fig. 6.3. Organization chart of the Agreement to Improve Product Composition 2014-2020
The progress of the Agreement is discussed each year in a supervisory committee meeting chaired by the Minister of Health, Welfare and Sport (in Dutch: VWS). This committee is attended, in addition to the minister, by the chairs of CBL, FNLI, KHN and Veneca. The Steering Group consists of representatives of the signatory parties at management level. VWS runs the Steering Group’s secretariat and chairs this. The Steering Group sets maximum content thresholds by nutrient and food product category (in order to improve the foods having the highest contents based on the recommendations of the Scientific Advisory Committee and the proposals of the work groups, holds regular discussions about the general progress of the Agreement and keeps the minister informed.
In the Scientific Advisory Committee, experts on food processing, nutrition and food composition, and consumer behaviour are represented and assigned by the Minister for Health, Welfare and Sport (VWS). All members of the Scientific Advisory Committee disclosed competing interests in a Declaration of Interests. The Scientific Advisory Committee assesses the chain agreements proposed concerning ambitions and relevance: are the agreements ambitious enough, relevant and feasible. If a product sector
does not propose agreements or concludes these tardily with regard to the ambitions set, the Scientific Advisory Committee may propose maximum contents. However, so far the Scientific Advisory Committee has not used this opportunity. The Scientific Advisory Committee advises the Steering Group. To determine whether an agreement is ambitious or not, the scientific advisory committee takes into account several aspects: the level of reduction, the current composition (means, range), the number of reformulated products, the time period of the agreement, the history and technical difficulties of food reformulation in the specific food category, and the level of reduction in relation to the ambitions of the Agreement. For example, a reduction of 5–10% was generally judged as not ambitious (enough) unless there were firm and supported arguments from e.g. historical or technological point of view that it could not be higher. Submitters were asked to support each of the above components with evidence, however, information on historical or technological aspects were often not sufficient. A joint opinion was created by the Scientific Advisory Committee during their regular meetings, based on the individual judgement of each Scientific Advisory Committee member using a judgement form collected before each meeting. The Scientific Advisory Committee judged in many cases that the proposed reduction targets were not ambitious enough. Because the sectors did not provide information about the total market share of the reformulated products, the Scientific Advisory Committee could not judge the impact of the National Agreement to Improve Product Composition. Currently (2019) the working procedure of the Scientific Advisory Committee is under revision.
The Working Group coordinates the practical implementation of the proposed agreements. Wherever necessary, the Working group sets up work groups (for example for specific food sectors) which come up with proposals for sector agreements. Representatives of the signing parties participate in the Working group as permanent members, and representatives of the concerning product sectors participate as additional members. The Working group also coordinates monitoring and communication.
Every year the five parties jointly draw up a work plan. This annual plan is used to announce in advance which product groups or other activities will be tackled. The agreements concluded and the results obtained are published on the Dutch website.19 Businesses shoulder responsibility for improving the content of the composition of the range of products. Branch organisations, retailers, manufacturers and caterers adopt the agreed maximum contents as criteria for their own production or purchasing. The umbrella organizations of the hospitality and catering sector (KHN and Veneca) stimulate and encourage their members, to make the range of products healthier through healthy purchasing and improving the composition of freshly prepared products and dishes. KHN focuses on those of its members that have the largest target population. The agreements state what the objectives are, how and when these will be achieved, and which companies commit to these.

POLICY OPPORTUNITIES AND CHALLENGES 51
Within the framework of earlier activities, some sectors made agreements preceding the National Agreement to Improve Product Composition and already achieved results. These were adopted by the Agreement (bread, Gouda cheese, meat products, and preserved vegetables and pulses).
Fig. 6.4. Process diagram showing the assessment of chain agreements., in theory*. *The process in reality is different with the secretariat from the SAC receiving the proposals directly from the branch
organizations
6.3 Monitoring of progressThe progress of the agreements’ reformulation activities is monitored by the umbrella organisations as well as the National Institute of Public Health.
At the start and completion (and sometimes mid-term) of each agreement the umbrella organizations of the food sectors ask their members to report the actual composition of their products. Compliance with the working agreements per product group and progress of improvements of product composition is charted by the umbrella organizations. KHN charts the effect of its policy and efforts using, for example, market or trend studies. Publication of results is mainly via infographics and/or factsheet without insight in the crude data.
Product composition for salt, saturated fat and calorie content (sugar and/or (saturated) fat) is monitored at product level by the National Institute for Public Health and
the Environment (RIVM) from label type information. Analysis data for product composition resulting from research carried out by the Netherlands Food and Consumer Product Safety Authority (NVWA) were part of the monitoring until 2017. The NVWA analysed salt contents of the same foods from 2010. From 2018 onwards, the monitoring relies on data from brand specific databases only. The brand specific food database (Levensmiddelendatabank) constitute as a basis for this. Companies are encouraged to make data about their product composition available. In practice, this means to seek agreement to use brand-specific databases of major supermarkets (e.g. Albert Heijn and Jumbo) and companies supplying data to general databases like GS1 and Brandbank. In addition, it means checking the completeness (e.g. are major brands included?) and/or quality (e.g. are the data from the brand specific databases similar to actual

52 IMPROVING DIETARY INTAKE AND ACHIEVING FOOD PRODUCT IMPROVEMENT
nutrition values on the label and/or analytic results). These aspects are still under development. Good quality data are essential for a good analysis of salt, (saturated) fat and sugar content in products. If there are developments that provide opportunities for improvements and/or a simplification of the monitoring of the progress made at product level, the monitoring above may be modified to suit these.
The above monitoring relates to food composition. Monitoring of food consumption via the Dutch National Food Consumption Survey (DNFC or in Dutch VCP) is carried out every 5–10 years. This data is used in public health impact calculations of certain interventions. In addition, salt consumption is determined every 4-5 years based on 24-hour urine collection. The monitoring projects related to food reformulation and carried out by the Institute of Public Health are commissioned and financed by VWS.
6.4 Results of monitoringResults on compliance to the agreements are shown in tables 01-03. (Members of) branch organizations use publicly available information as well as product specifications collected within their sector. Results are yearly communicated in the form of an infographic.20
The monitoring of RIVM at the food level until 2017 included chemical analytical information as provided by the NVWA. The number of food groups with targets was 8 for salt, 3 for sugar and 3 for saturated fatty acid reduction. A (sector) agreement usually includes different (targets for) food subgroups. In 2016 compared to 2011, the measured salt content in certain types of bread was on average 19 percent lower and certain types of sauce, soup, canned vegetables and legumes, and crisps had a 12 to 26 percent lower salt content. Salt content as measured in other types of foods did not change significantly. Reductions found were mainly in food (sub)groups where sector agreements were made. Sugar and saturated fatty acids contents did not change.21
A Dutch adult consumes an average of 8.7 g of salt and 114 g of sugar.22 To assess potential results on daily intake level, RIVM has performed a modelling study to estimate the effects of full compliance with established agreements up to and including 2016 on the daily salt (and sugar) intake compared with the reference situation. The effects on the daily salt23 and sugar intake24 was estimated, assuming stable food consumption patterns. In addition, the additional impact of sharpening of current agreements with 10%; and that of obtaining comparable agreements in more foods or food groups (with 10% reduction in each food group) were estimated.
First, a list was made of all agreements in the food groups, including the targeted reductions up and until 2016 (see Annex, Tables 6.1–6.3). Food consumption was taken from Dutch National Food Consumption Survey 2007-2010, including adults aged 19-70 and sodium and sugar levels for the reference situation from Dutch National Food Composition Database 2011.25 In the estimations, it was assumed that all foods in a food category with a certain target
are reformulated accordingly and dietary patterns, including use of discretionary salt and sugar, remain constant. The foods that were not part of the agreement were kept at the same salt (sugar) contents as in the reference situation. Salt and sugar intakes were calculated by multiplying individual consumption and salt and sugar contents in the different scenarios.
Results showed that if all products comply with the established agreements up and until 2016, the daily salt intake could reduce with 0.4 g.24 Sharpening of current agreements with 10%”, could lead to a reduction of 0.7 g per day and expanding of agreements to more food groups (with 10% reduction) could result in a 1-gram reduction of salt in total.24 For sugar, with current agreements the sugar intake could drop by 2 g (8 kcal) per day, sharpening current agreements could reduce sugar intake with circa 5 g (20 kcal) per day. Expanding the agreements towards other food groups would result in an estimated reduction of 9 gram per day (36 kcal).
In 2006, 2010 and 2015 salt intake in the Netherlands was estimated using sodium measurements in 24h urine collection among adults in the city Doetinchem. This showed that the estimated salt intake remained unchanged.22, 26 Median estimated daily salt intakes in 2015 were 9.7g for men, and 7.4g for women. As in 2006 and 2010,27 the estimated salt intake in 2015 still exceeded the recommended maximum intake of 6 g per day set by the Dutch Health Council. To detect changes in salt intake is necessary to ensure a large enough study population to pick up the expected moderate changes in salt intakes. Power calculations of our study showed that the study had sufficient power to detect a reduction of at least 12% in daily salt intake in the total population between 2006, 2010 and 2015 given the sample size in 2015 of 289 subjects.22 In order to detect smaller reductions (of 4-5%) in the mean population intake of salt, which were more likely given the current achievements in food reformulation, would have needed a larger sampling size.
6.5 DiscussionThe challenges to achieve substantial healthier population intakes of salt, energy – sugar, fatty acids composition through food reformulations are huge both at the level of governance of a food reformulation programme, target setting, implementation and monitoring. A large number of
activities were undertaken in the Netherlands; a governance structure was put in place in 2014 including a thorough scientific evaluation of proposed ambitions set and a monitoring system. This resulted in some successes e.g. some foods show improved contents. However, at the daily

POLICY OPPORTUNITIES AND CHALLENGES 53
intake level, this did not result yet in lower intakes, except for TFA. At this moment (2019), part of the governance structure (for the scientific assessment of the agreements and alignment of target setting) is under revision and the monitoring scheme recently changed towards a monitoring of label type information. In addition, a new public-private agreement was signed in 2018 focusing on activities to reduce obesity prevalence.27 After the Agreement on Improving the Composition of Products (expires in 2020), efforts to improve the product range will continue. Within the National Prevention Agreement, a new national product-improvement system will be started, which should lead to a healthier food supply across all channels. Some observations of the process which may have been of importance for the results achieved are discussed below.
In the Agreement to Improve Product Composition 2014-2020, consumer-facing objectives were set rather than product-oriented goals to underline that a role for the consumer remains. Most reformulation activities as well as governance and scientific evaluation structure, however, are aimed at the food composition goals. To reach current salt intake reduction targets, salt content of all major salt contributing foods needs to be lowered with 30-40%.28 To achieve the ambitious target of maximum daily intake of 6g salt per day, salt reduction of foods alone is unlikely to provide a solution, although it is a contributor. More likely to be effective is a combination of strategies of food reformulation with interventions to improve food choice behaviour (e.g. more fruits and vegetables, less meat products and cheese, choosing alternatives with lower salt contents, reducing discretionary use of salt, and/or reduction of portion sizes). This vision aligns with the initial consumer-facing objectives, and may align with future sustainability objectives (e.g. achieve lowering of GHG emission and water inputs per kg food produced).
In the Netherlands, coherence between the systems for food product improvement, to inform consumers about healthy food choices can be improved, as the systems use different product classifications, nutrients and criteria. An independent commission recently recommended developing a multistage system for product improvement with minimum standards for product composition for certain nutrients e.g. salt, saturated fat, sugar, calories and fibre for all foods on the market and or all sector members.29 For the development of such a system, ex ante (preferred) and ex post analyses can predict and/or evaluate the potential impact of food reformulations proposed/needed on e.g. salt/sugar intake. From the governance perspective, an independent scientific committee could play a larger role in determining which products have priority, what changes are needed/possible and establish maximum levels. To increase this system’s chances of success it is important to mobilize support by closely involving stakeholders such as social organizations and industry. In addition, it is important that criteria set by an independent party (established by the central government) are regularly refined and aligned with international developments.30 Finally, an independent organization should monitor whether or not the products meet the criteria, and legal or other sanctions could be used to enforce compliance.
We know that a set of criteria alone is insufficient to improve food composition. Producers must be constantly encouraged to steadily improve the composition of their products. It is important to identify effective incentives, ranging from legal or financial measures, use of criteria for procurement in (semi) public sector, and in communication to the consumer (for example via a new logo on the packaging). With respect to implementation of the targets, participation in the agreements (except for bread) is in the Netherlands on a voluntary basis. For some sectors (e.g. the bread sector) a “level playing field” of regulation might be needed, while other sectors can work with voluntary commitments. International food companies need a level playing field on international level, as processed food is traded in several countries. This means also the needs for criteria setting as well as monitoring at the international level.32 With respect to the technical aspects of monitoring of the results on food product level, recently a shift was made in the Netherlands from (predominantly) using data from chemical analyses (by the NVWA/branches) to predominantly using data from food composition databases compiled of data from industry. The original aim of these databases is use in logistics for (online) sales. Due to new EU regulation,31 nutrient data are becoming more widely available. The shift towards monitoring based on these databases leads to greater availability of nutrient data. However, data quality is less certain compared to data from chemical analyses. These aspects are taken into consideration into future development of the food product monitoring in the Netherlands.
Recent reviews assessed the effectiveness of different types of population-level interventions implemented by governments for dietary salt reduction.28,32 The most promising programmes are those based on a multi-component approach, in which the incorporated initiatives are of a structural nature (such as food product reformulation or the availability of low-salt foods via public procurement). According to a systematic review of salt reduction initiatives until February 2016, 75 countries have a national salt reduction strategy.33,34 The countries observing a statistically significant decrease in average salt intake salt at population level included a multicomponent approach with industry engagement to reformulate products (n = 61), establishment of salt content targets for foods (n=39), consumer education (n=71), FOP labelling schemes (n=31), taxation on high-salt foods (n=3) and/or interventions in public institutions (n=54).34
Until now, only a limited number of countries observed significant decreased salt intakes at the population level.34 The significant decrease per day ranged from -1.15 (95% CI -1.69 to 0-.61) gram/day in Finland, -0.9 g/day in the United Kingdom (United Kingdom) 37 to -0.35 (95%CI -0.52 to -0.18) gram/day in Ireland.28 The countries with successful salt reductions at the population level started at relatively high levels 11.8 g/day in Finland and 9.5 gram per day in United Kingdom compared to 8.7 gram/day in 2006 in the Netherlands. In line with our results, several countries for example Austria and Switzerland did not show a statistically significant change in salt intake (g/day) from pre- to post-intervention.28

54 IMPROVING DIETARY INTAKE AND ACHIEVING FOOD PRODUCT IMPROVEMENT
6.6 ConclusionIn the Netherlands, various activities have been undertaken aimed at improving the composition of food products. Activities from the private sector with the industries involved for TFA and currently in the Agreement to improve Food Product Composition, a public-private partnership for reduction of salt, sugar and SFA. Although some foods show improved contents, at the daily intake level improvements are not (yet) visible, except for TFA. Changes in the working procedure of the scientific committee are made as well as the monitoring of the National Agreement to Improve Product Composition, which is into force until the end of 2020. In addition, a new 2018 public-private agreement on Prevention was signed focussing on activities to reduce obesity. Activities to improve and monitor food product composition will continue.

POLICY OPPORTUNITIES AND CHALLENGES 55
Product group Food with salt targets (average % reduction) * Agreed maximum content(s) (g/100 g)
Period agreement
Evaluation by scientific committee
Monitoring sector
Monitoring RIVM
Bread and cereal products
White-, brown-, wholegrain-, multigrain (-14%) 1.8%** 2010–2013Not evaluated***
1.78% ('Warenwetbesluit Meel en Brood. Beschikbaar op http://wetten.overheid.nl.')
-19% 22
Savoury breads: Snack sausage roll with bread dough pastry (12.7%), snack sausage roll puff pastry (-4%), cheese pasty with puff pastry (-7.1%)
1.5; 1.65; 1.5 01/04/2018–01/10/2019
Not ambitious enough NA NA
Meat (preparations), eggs, fish and meat
replacements
Cold cuts (-10%): single prepared, composed prepared, composed raw smoked/dried 2.5–2.8; 2.4; 2.3–3.2 06/2013–
06/2015Not ambitious enough
Cold cuts: -21% salt(CBL, FNLI, and NZO 2016)
-21% to+5% (NS) depending on category% 22
Meat preparations (-10%): meat balls (raw), sausages (raw), seasoned chipped meat (raw), filled meat (raw), chicken (cooked/ breaded), hamburgers (raw/cooked)
1.75; 1.55; 1.10; 1.28; 1.29; 1.43 (raw), 2.19 (cooked)
01/01/2017–31/12/2018 (01/01/2018–01/07/2019 for hamburgers)
Not ambitious enough NA NA
Preserved meats: meat cuts (e.g. corned beef, -5-10%), frankfurter sausages (-10%), smoked sausages (-5%); ragouts (-10%)
See agreement cold cuts; 1.90; 2.23; 1.00
03/2016–1/06/2018
Not ambitious enough NA NA
Meat products/preserved meats: smoked sausage (-15%) Not ambitious enough NA NA
Cheese (including surrogate and cheese
products)
Gouda cheese 48+ (-10%) NA 2006–2010 Not evaluated* -14% (NZO 2016b) NA
Gouda cheese 48+ (-10%) NA 2010–31/12/2015 Not evaluated* -8% (NZO 2016b) -11%(NS) 22
Soups Soups sold as liquid and instant prepared (-10%) 0.875 g/100g 01/01/2015–30/06/2016
Not ambitious enough NA -9% 22
Annex 6
Table A6.1. Food groups with agreements on salt content (until mid-2018)

56 IMPROVING DIETARY INTAKE AND ACHIEVING FOOD PRODUCT IMPROVEMENT
Sauces Sauces: ketchup (-10%), curry (-5%), pasta sauces (-5%) 2.15; 1.975; 1.275 01/01/2015–30/06/2016
Not ambitious enough NA
-1% (NS), Curry ketchup, -41%, Ketchup, -15%, Pasta sauces
Savoury snacks Savoury snacks: potato crisps (natural -7%/flavoured-9%), stackable crisps, coated nuts (-12%), mixed nuts (-15%)
1.20 (natural), 1.40 (flavoured); 1.80; 2.10; 1.20
01/03/2016–31/12/2018
Not ambitious enough NA NA
Ready-to-eat meals
Italian meals: pasta meals with sauce based on cheese (-10%), pasta meals with sauce of tomato or other (-10%), lasagne (-10%)
0.675; 0.675; 0.850;
01-01-2017–31-12-2018 (31-12-2019 for lasagne and oriental meals with sauce based on soy sauce)
Not ambitious enough NA NA
Oriental meals: meals based on one starch component, meals based on multiple starch component with sauce based on fat or tomato (-10%), meals with multiple starch component with sauce based on soy sauce (-10%)
1.01; 0.863; 0.885
Vegetables and pulses
Processed/canned vegetables and pulses (-25%): peas and/or carrots, corn, French/runner beans, broad beans, champignons, composes recipes, pulses
0.38; 0.38; 0.45; 0.38; 0.45; 0.5; 0.5 2011 Not evaluated* NA
-25% to -42% 22
Peas and/or carrots (-15%), corn (-25-29%), French/runner beans (-24%), broad beans (-19%) 0.32; 0.28; 0.34; 0.30 05/06/2017–
09/2018Reasonably ambitious NA NA
Mushrooms (-33%), cabbage red and cabbage red with apple (-43%), beetroot (-50%), single legumes (-50%), white beans in tomato sauce (-35%), brown beans in tomato sauce (-20%), other mixed legume recipes (-39%)
0.30; 0.40; 0.30; 0.30; 0.70; 0.40; 0.55
11/2017–11/2018
Reasonably ambitious NA NA
* The percentages in this column represent the aimed reduction in average salt content, as mentioned in the agreements. For bread, processed vegetables and pulses, stackable chips and soups the percentage salt reduction is derived in another way, for example based on the percentage reduction in maximum content or observations in other studies.** The maximum 1.8% salt (based on dry matter), with average bread moisture content 64% which is around 1.15 gram salt per 100g bread.*** These agreements preceded the Agreement.NA: not availableNS: not significant

POLICY OPPORTUNITIES AND CHALLENGES 57
Product group Food with sugar targets (average % reduction)*
Agreed maximum level(s) (g/100g)
Period agreement
Evaluation by scientific committee Monitoring sector Monitoring
RIVM
Soft drinks Soft drinks, including sports- and energy drinks and syrups (-10% calorie reduction) NA 2015–
31/12/2020 Could not be evaluatedNA (-20% calorie reduc-tion)(Nederlandse vereni-ging Frisdranken 2018)
No change**
Milk (products) and plant-based alternatives
Dairy desserts with added sugar (-5% added sugar / -3% total sugar): Yoghurt and fromage frais, custards (basic and specialties), pud-dings and mousse, dairy drinks
11.6; 6.3 (basis), 9.4 (spe-cialty’s); 18.2; 8.0
01/01/2015– 31/12/2017 Not ambitious enough NA, (NZO 2016a) No change
Other
Processed vegetables and pulses (-100%): 0 (added sugar) 05/06-2017– 09-2018 Reasonably ambitious NA NA
Peas, and/or carrots, peas, legumes
Processed vegetables: 0; 6.5; 9.7; 5.8; 0; 4.6; 1.1; 3.9; 15 (basic), 4 (extra)
11-2017– 11-2018 Reasonably ambitious NA NA
Mushrooms, cabbage red (-35%), cabbage red with apple (-33%), beetroot (-24%), single le-gumes (-100%), white beans in tomato sauce (-16%), brown beans in tomato sauce (-50%), other mixed legume recipes(-29%), apple sauce (basic -21% and extra -50%)
* Food products for which there are no agreements yet and of which the sugar content can be adapted.** This is another type of agreement, not only focused on reformulation, but also stimulating shift to lower-caloric beverages and smaller portion sizes. Only sugar contents of sugar-sweetened products were monitored, market volume information was not available.
Table A6.2. Food groups with agreements on (added) sugar content (until mid-2018)

58 IMPROVING DIETARY INTAKE AND ACHIEVING FOOD PRODUCT IMPROVEMENT
Product group Food with sugar targets (average % reduction)*
Agreed maximum level(s) (g/100g)
Period agreement
Evaluation by scientific committee Monitoring sector Monitoring
RIVM
Soft drinks Soft drinks, including sports- and energy drinks and syrups (-10% calorie reduction) NA 2015–
31/12/2020 Could not be evaluated
NA (-20% calorie reduction) (Nederlandse vereniging Frisdranken 2018)
No change**
Milk (products) and plant-based alternatives
Dairy desserts with added sugar (-5% added sugar / -3% total sugar): Yoghurt and fromage frais, custards (basic and specialties), puddings and mousse, dairy drinks
11.6; 6.3 (basis), 9.4 (specialty’s); 18.2; 8.0
01/01/2015–31/12/2017 Not ambitious enough NA, (NZO 2016a) No change
Other
Processed vegetables and pulses (-100%): 0 (added sugar) 05/06-2017– 09-2018 Reasonably ambitious NA NA
Peas, and/or carrots, peas, legumes
Processed vegetables:0; 6.5; 9.7; 5.8; 0; 4.6; 1.1; 3.9; 15 (basic), 4 (extra)
11-2017– 11-2018 Reasonably ambitious NA NA
Mushrooms, cabbage red (-35%), cabbage red with apple (-33%), beetroot (-24%), single legumes (-100%), white beans in tomato sauce (-16%), brown beans in tomato sauce (-50%), other mixed legume recipes(-29%), apple sauce (basic -21% and extra -50%)
Table A6.3. Food groups with agreements on (added) saturated fat content (until mid-2018)

POLICY OPPORTUNITIES AND CHALLENGES 59
6.7 References 1. All authors are affiliated to the National Institute for Public
Health and the Environment (RIVM).
2. Huth, P. J., V. L. Fulgoni, D. R. Keast, K. Park, and N. Auestad. 2013. ‘Major food sources of calories, added sugars, and sat-urated fat and their contribution to essential nutrient intakes in the U.S. diet: data from the National Health and Nutrition Examination Survey (2003-2006)’, Nutr J, 12: 116.
3. Slimani, N., Deharveng, G., Southgate, D. et al. Contribution of highly industrially processed foods to the nutrient intakes and patterns of middle-aged populations in the European Prospec-tive Investigation into Cancer and Nutrition study. Eur J Clin Nutr 63, S206–S225 (2009) doi:10.1038/ejcn.2009.82
4. Ocké, MC, IB Toxopeus, M Geurts, MJB Mengelers, EHM Temme, and N Hoeymans. 2017. “What is on our plate: Safe, healthy and sustainable diets in the Netherlands.” In RIVM Report 2017-0024. Bilthoven: National Institute for Public Health and the Environment (RIVM).
5. Akkoord Verbetering Productsamenstelling zout, verzadigd vet, suiker (calorieën) [Agreement on Improvement of Product Composition: salt, saturated fat, sugar (calories)]” 23 January 2014
6. Katan, MB. 2006. ‘Regulation of trans fats: The gap, the Pol-der,and McDonald’s French fries’, Atherosclerosis, Supplements 7 63–66.
7. Vetzuren., Task Force Verantwoorde. 2008. “Jaarrapportage Task Force Verantwoorde Vetzuursamenstelling 2008.” In http://www.vetzuursamenstelling.nl/download/Task-Force-jaarrapportage2008.pdf, 1-27.
8. TFVV. 2010. “VEranTwoord. Betere vetzuursamenstelling in producten met plantaardige oliën en vetten. Eindrapportage Task Force Verantwoorde Vetzuursamenstelling 2003-2010.” In. Rijswijk.
9. Temme, E.H.M., I.E.J. Milder, S. Westenbrink, I.B. Toxopeus, C.H.M. Van den Bogaard, and J.M.A. Van Raaij. 2015. “Monitor-ing productsamenstelling voor zout, verzadigd vet en suiker. RIVM Herformuleringsmonitor 2014. RIVM Briefrapport 2015-0034 [Monitoring product composition for salt, saturated fatty acid and sugar. RIVM Reformulation monitor 2014, RIVM letter report 2015-0034].” In. Bilthoven.
10. Temme, E. H., I. L. Millenaar, G. Van Donkersgoed, and S. Westenbrink. 2011. ‘Impact of fatty acid food reformulations on intake of Dutch young adults’, Acta Cardiol, 66: 721-8.
11. Health Council of the Netherlands. 2006. “Guidelines for a healthy diet 2006..” In. The Hague:: Health Council of the Netherlands
12. FNLI. 2008. ‘Actieplan Zout in Levensmiddelen’, Accessed 25/11/2018. https://www.voedingscentrum.nl/Assets/Uploads/Documents/Voedingscentrum/Professionals/FNLI-Actie-plan-Zout-2008.pdf.
13. FNLI. 2010. ‘Rapportage Actieplan Zout in Levensmiddelen Fase 1’, FNLI, Accessed 25/11/2018.
14. Consumentenbond. ‘Zout’, Accessed November 13, 2018. https://www.consumentenbond.nl/acties/zout
15. http://wetten.overheid.nl
16. NBC. ‘Vijfde Landelijke Steekproef Zoutgehalte in Brood, maart – mei 2013 [Fifth annual sampling of salt content of bread, March-May 2013]’. ———. ‘Zesde Landelijke Steekproef Zoutgehalte in Brood,
februari– april 2015 [Sixth annual sampling of salt content of bread, February-April 2015]’. ———. 2016. “Zevende en achtste Landelijke Steekproef Zout-gehalte in Brood 2016.” In. Wageningen: NBC
17. ‘Warenwetbesluit Meel en Brood. Beschikbaar op http://wet-ten.overheid.nl.’.
18. RIVM. 2011. ‘NEVO-online (Nederlands Voedingsstoffenbe-stand), NEVO-online versie 2011. [Dutch Food Composition Database NEVO-online version 2011]’, RIVM.
19. ‘Website Akkoord Verbetering Productsamenstelling’. 2014. http://www.akkoordverbeteringproductsamenstelling.nl “Akkoord Verbetering Productsamenstelling zout, verzadigd vet, suiker (calorieën) [Agreement on Improvement of Product Composition: salt, saturated fat, sugar (calories)].” In. 23 januari 2014. The Hague
20. CBL, FNLI, and NZO. 2016. ‘Improvement¬ of Product¬ Compo-sition’, FNLI, Accessed 24/11/2018. https://www.fnli.nl/wp-con-tent/uploads/2015/01/20160222_FNLI-Infographic-on-Im-provement-of-Product-Composition.pdf
21. Temme, E. H. M., M. A. H. Hendriksen, I. E. J. Milder, I. B. Toxo-peus, S. Westenbrink, H. A. M. Brants, and A. Dl van der. 2017. ‘Salt Reductions in Some Foods in The Netherlands: Monitor-ing of Food Composition and Salt Intake’, Nutrients, 9
22. van Rossum, C. T. M., H. P. Fransen, J. Verkaik-Kloosterman, E. J. M. Buurma-Rethans, and M. C. Ocke. 2011. “Dutch National Food Consumption Survey 2007-2010. Diet of children and adults aged 7 to 69 years. RIVM rapport 350050006.” In. Biltho-ven.
23. RIVM 2018b. “Geschat effect van lagere zoutgehalten in voedingsmiddelen op de dagelijkse zoutinname in Nederland, Estimated effects of lower salt contents in food on daily intakes in the Netherlands.” In, edited by RIVM. Bilthoven
24. RIVM 2018a. “Geschat effect van lagere suikergehalten in voedingsmiddelen op de dagelijkse zoutinname in Nederland, Estimated effects of lower sugar contents in food on daily intakes in the Netherlands “In, edited by RIVM. Bilthoven
25. RIVM. (2011). NEVO-online. Retrieved April 6, 2020, from https://nevo-online.rivm.nl/Default.aspx
26. Hendriksen, M. A., J. M. van Raaij, J. M. Geleijnse, C. Wilson-van den Hooven, M. C. Ocke, and D.L. van der A. 2014. ‘Monitoring salt and iodine intakes in Dutch adults between 2006 and 2010 using 24 h urinary sodium and iodine excretions’, Public Health Nutr, 17: 1431-8
27. “National Agreement on prevention. In dutch: Nationaal Pre-ventieakkoord “ In. 2018. Een gezonder Nederland. The Hague: NL Government https://www.government.nl/documents/re-ports/2019/06/30/the-national-prevention-agreement
28. Hendriksen, M. A., J. Verkaik-Kloosterman, M. W. Noort, and J. M. van Raaij. 2015. ‘Nutritional impact of sodium reduction strategies on sodium intake from processed foods’, Eur J Clin Nutr, 69: 805-10
29. Wilson- van den Hooven, E.C., R. Visschers, P.M.T. de Kok, C. de Graaf, A.J.C. Roodenburg, D. Wolvers, and M. van den Berg. 2018. “Naar een integraal systeem voorproductverbetering in Nederland
30. “Roadmap for Action on Food Product Improvement.” In. 22 February 2016. edited by Dutch Presidency EU Conference Food Product Improvement. Amsterdam.

60 IMPROVING DIETARY INTAKE AND ACHIEVING FOOD PRODUCT IMPROVEMENT
31. EU. 2011. “Verordening Nr. 1169/2011 van het Europees Parle-ment en de Raad betreffende de verstrekking van voedselinfor-matie aan consumenten.” In.
32. Trieu, K., B. Neal, C. Hawkes, E. Dunford, N. Campbell, R. Ro-driguez-Fernandez, B. Legetic, L. McLaren, A. Barberio, and J. Webster. 2015. ‘Salt Reduction Initiatives around the World – A Systematic Review of Progress towards the Global Target’, PLoS One, 10: e0130247
33. Trieu, Kathy, Rachael McLean, Claire Johnson, Joseph Alvin Santos, Thout Sudhir Raj, Norm R. C. Campbell, and Jacqui Webster. 2016. ‘The Science of Salt: A Regularly Updated Systematic Review of the Implementation of Salt Reduction Interventions (November 2015 to February 2016)’, The Journal of Clinical Hypertension, 18: 1194-204
34. McLaren, L., N. Sumar, A. M. Barberio, K. Trieu, D. L. Lorenzetti, V. Tarasuk, J. Webster, and N. R. Campbell. 2016. ‘Popula-tion-level interventions in government jurisdictions for dietary sodium reduction’, Cochrane Database Syst Rev, 9: CD010166

Albania Andorra Armenia Austria Azerbaijan Belarus BelgiumBosnia and Herzegovina Bulgaria Croatia Cyprus Czechia Denmark Estonia Finland France Georgia Germany Greece Hungary Iceland Ireland Israel Italy Kazakhstan Kyrgyzstan Latvia Lithuania Luxembourg Malta Monaco Montenegro Netherlands North Macedonia Norway Poland Portugal Republic of Moldova Romania Russian Federation San Marino Serbia Slovakia Slovenia Spain Sweden Switzerland Tajikistan Turkey Turkmenistan Ukraine United Kingdom Uzbekistan
World Health OrganizationRegional Office for Europe
UN City, Marmorvej 51, DK-2100 Copenhagen Ø, DenmarkTel.: +45 45 33 70 00 Fax: +45 45 33 70 01Email: [email protected]: www.euro.who.int
The World Health Organization (WHO) is a specialized agency of the United Nations created in 1948 with the primary responsibility for international health matters and public health. The WHO Regional Office for Europe is one of six regional offices throughout the world, each with its own programme geared to the particular health conditions of the countries it serves.
The WHO Regional Office for Europe
Member States