Home Energy Monitoring, Efficiency and Conservation All Resources and Links Available here: .
39
Home Energy Monitoring, Efficiency and Conservation All Resources and Links Available here: www.elen.ca/home-energy-monitoring
-
date post
20-Dec-2015 -
Category
Documents
-
view
227 -
download
6
Transcript of Home Energy Monitoring, Efficiency and Conservation All Resources and Links Available here: .
Home Energy Monitoring, Efficiency and Conservation
All Resources and Links Available here:www.elen.ca/home-energy-monitoring

Overview
• Your energy audit vs. professional energy audit• Definition and units of energy• Energy Monitoring: 3 levels of increasing
complexity• Room by room Electrical Energy Audit• Energy efficiency and conservation tips• References – You will be able to find all links here:
http://www.elen.ca/home-energy-monitoring/
Professional Audit versus Do-It-Yourself
Tip: Do Both
http://www.livesmartbc.ca/
What is Energy?
• Energy is the capacity to do work
What is Energy?

• Energy is the capacity to do work
Well then, what is Work?
What is Energy?

• Energy is the capacity to do work
Well then, what is Work?
• Work is the quantity of energy transferred from one system to another.
What is Energy?

• Energy is the capacity to do work
Well then, what is Work?
• Work is the quantity of energy transferred from one system to another.
What is Energy?
What is Energy?

What is Energy?

How is Energy Measured?(Units of Energy)•Therms•Calories•Joules•Ergs•Electron volts•Kilowatt-hours•Gigajoules
•Barrels of oil•TNT equivalent•Newton-meters•British Thermal Units•Quads•Foot-pound force•kiloKaiser
•Gallon of gasoline•Watt-hours•Foot poundals•Horsepower-hours•Hartrees•pferdestärkenstunde


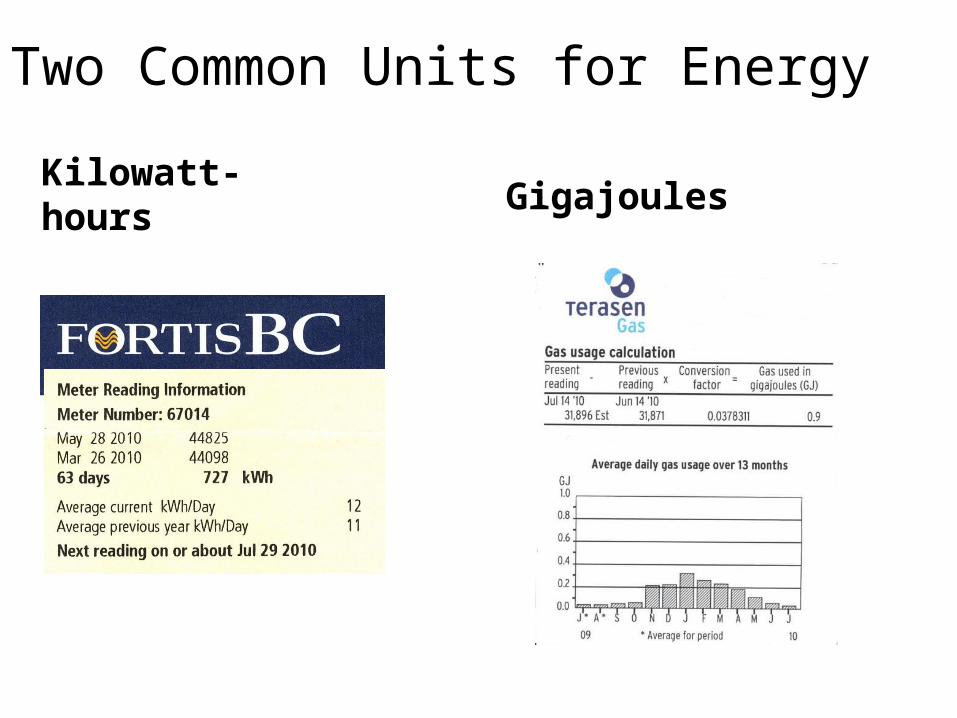
Two Common Units for Energy
Kilowatt-hoursGigajoules

The Kilowatt-Hour (kWh)1 kWh is the amount of energy used by a 1000 Watt appliance if it runs for one hour
Examples• Ten 100 watt lightbulbs on for one hour (100 W = 0.1
kW)– 10 * 0.1kW * 1 hour = 1kWh
• 5000 watt clothes dryer on for 12 minutes (5000 W = 5 kW)– 5 kW* 1/5 hour = 1kWh
• One 100 watt lightbulb on for ten hours– 0.1 kW * 10 hours = 1kWh
Source: SWHA
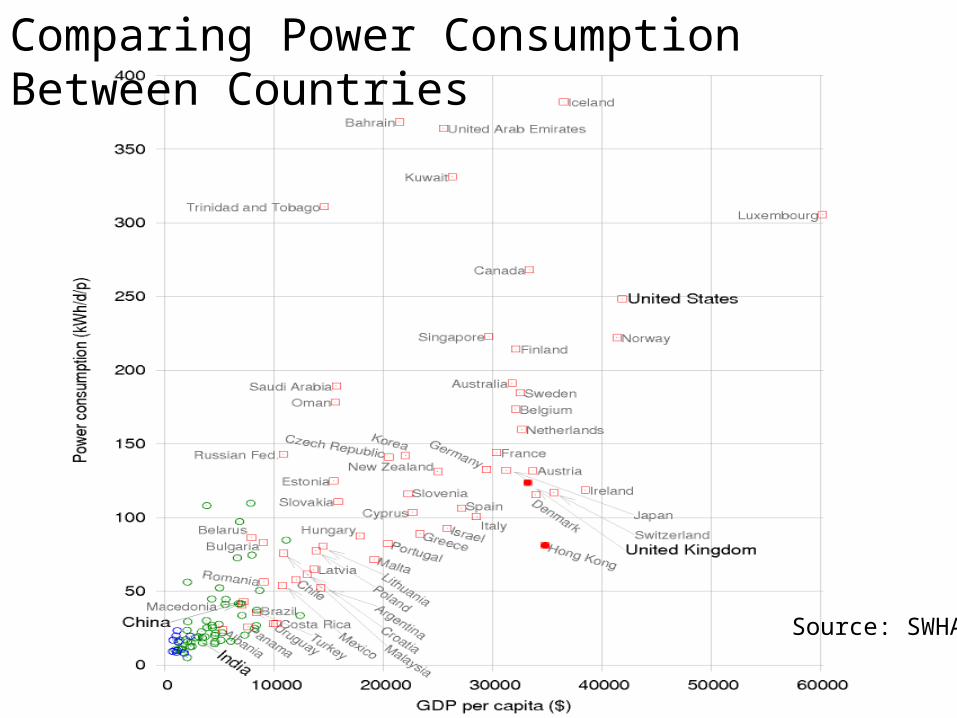
Comparing Power Consumption Between Countries
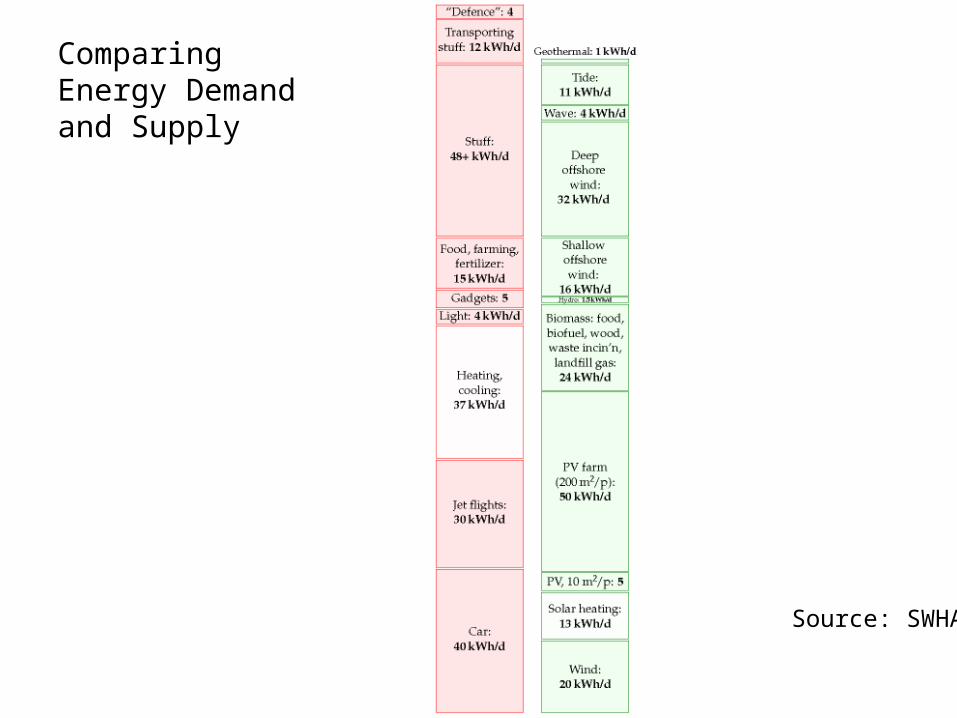
ComparingEnergy Demandand Supply
Source: SWHA

Household Energy Usage Per Day Example
Lights: 6 kWh/dayDryer: 4 kWh/day
Kitchen: 3 kWh/day
Heating or Cooling: 30 kWh/day
Electronics: 4 kWh/day
Other: 4 kWh/day
Total: 51 kWh/day

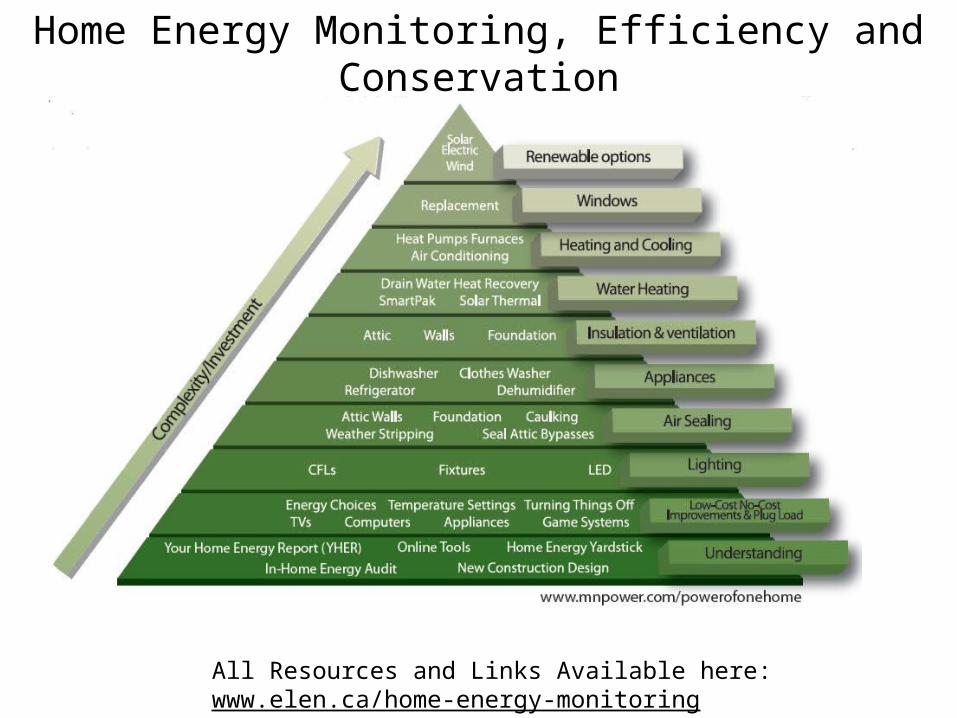
Pyramid of Conservation
Source: http://www.mnpower.com/powerofone/one_home/index.htm

Energy Monitoring
• Level 1 Diagnostic: Check Your Bill
• Level 2 Diagnostic: Check Your Meter
• Level 3 Diagnostic: Automate Meter Checking
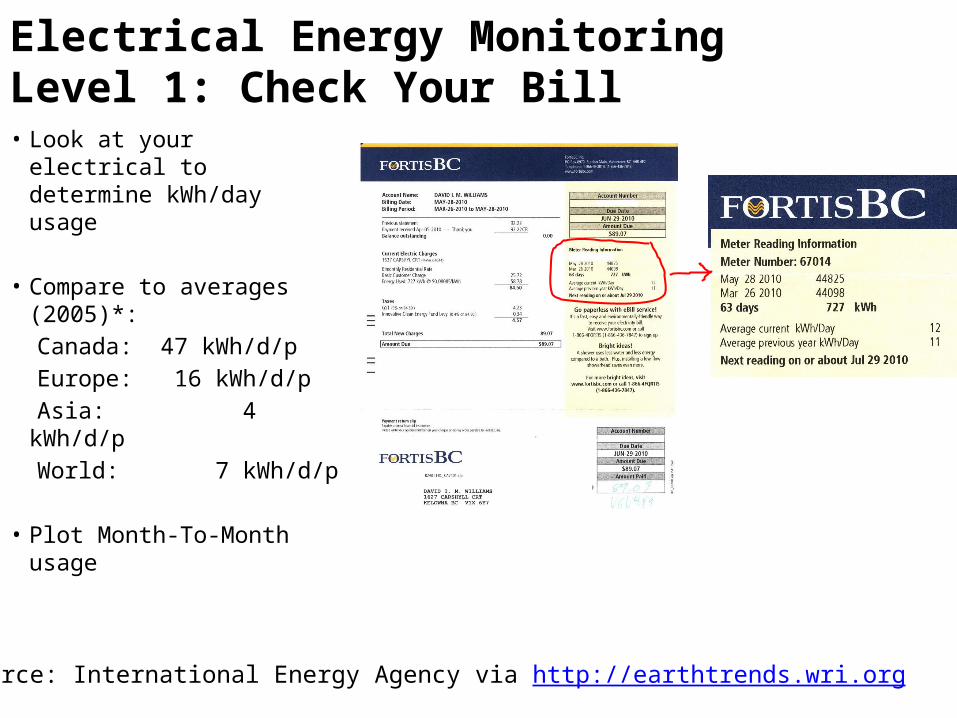
Electrical Energy Monitoring Level 1: Check Your Bill• Look at your electrical to
determine kWh/day usage
• Compare to averages (2005)*:
Canada: 47 kWh/d/p Europe: 16 kWh/d/p Asia: 4 kWh/d/p World: 7 kWh/d/p
• Plot Month-To-Month usage
*Source: International Energy Agency via http://earthtrends.wri.org

Month-Month Monitoring
Month kWh/day kWh Total $ kWh/day kWh Total $January 14 434 $45.35 14 434 $48.28February 12 336 $43.74 13 364 $46.11March 12 372 $43.74 13 403 $46.11April 11 330 $40.44 12 360 $44.54May 11 341 $40.44 12 372 $44.54June 11 330 $39.45 15 450 $53.56July 11 341 $39.45 15 465 $53.56August 13 403 $42.88 0September 13 390 $42.88 0October 12 372 $43.74 0November 12 360 $43.74 0December 14 434 $48.28 0
Avg Monthly 12.17 370.25 $43 13 237.33 $48Total Annual 4443 $514 2848 $337
Electricity Usage2009 2010
Excel Spreadsheet Available Here: www.elen.ca/home-energy-monitoring/

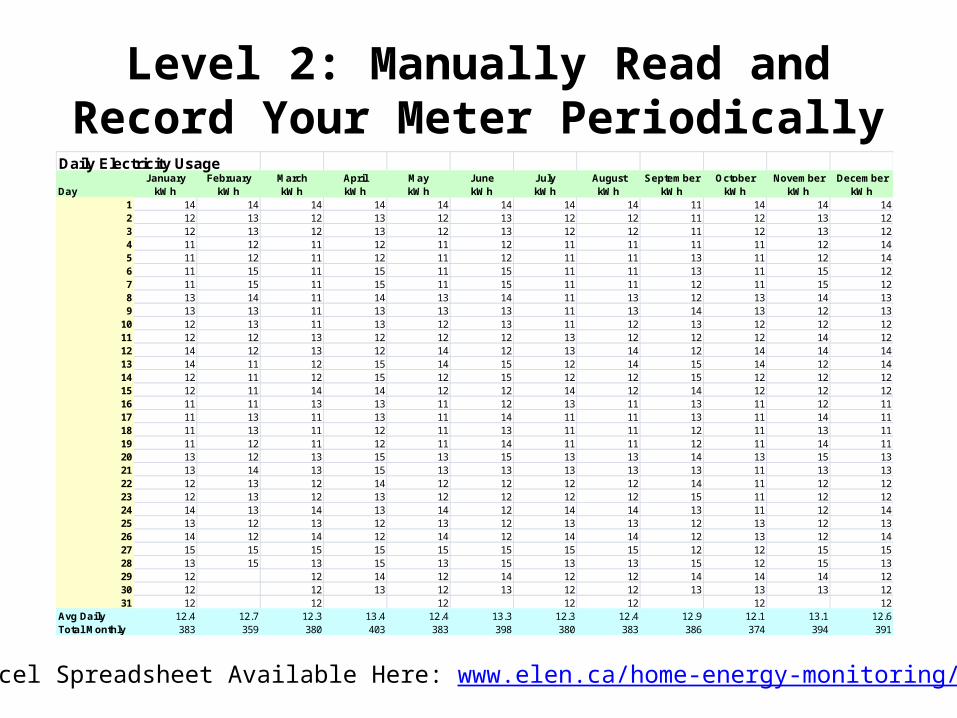
Level 2: Manually Read and Record Your Meter Periodically
Excel Spreadsheet Available Here: www.elen.ca/home-energy-monitoring/
Daily Electricity UsageJanuary February March April May June July August September October November December
Day kWh kWh kWh kWh kWh kWh kWh kWh kWh kWh kWh kWh1 14 14 14 14 14 14 14 14 11 14 14 142 12 13 12 13 12 13 12 12 11 12 13 123 12 13 12 13 12 13 12 12 11 12 13 124 11 12 11 12 11 12 11 11 11 11 12 145 11 12 11 12 11 12 11 11 13 11 12 146 11 15 11 15 11 15 11 11 13 11 15 127 11 15 11 15 11 15 11 11 12 11 15 128 13 14 11 14 13 14 11 13 12 13 14 139 13 13 11 13 13 13 11 13 14 13 12 13
10 12 13 11 13 12 13 11 12 13 12 12 1211 12 12 13 12 12 12 13 12 12 12 14 1212 14 12 13 12 14 12 13 14 12 14 14 1413 14 11 12 15 14 15 12 14 15 14 12 1414 12 11 12 15 12 15 12 12 15 12 12 1215 12 11 14 14 12 12 14 12 14 12 12 1216 11 11 13 13 11 12 13 11 13 11 12 1117 11 13 11 13 11 14 11 11 13 11 14 1118 11 13 11 12 11 13 11 11 12 11 13 1119 11 12 11 12 11 14 11 11 12 11 14 1120 13 12 13 15 13 15 13 13 14 13 15 1321 13 14 13 15 13 13 13 13 13 11 13 1322 12 13 12 14 12 12 12 12 14 11 12 1223 12 13 12 13 12 12 12 12 15 11 12 1224 14 13 14 13 14 12 14 14 13 11 12 1425 13 12 13 12 13 12 13 13 12 13 12 1326 14 12 14 12 14 12 14 14 12 13 12 1427 15 15 15 15 15 15 15 15 12 12 15 1528 13 15 13 15 13 15 13 13 15 12 15 1329 12 12 14 12 14 12 12 14 14 14 1230 12 12 13 12 13 12 12 13 13 13 1231 12 12 12 12 12 12 12
Avg Daily 12.4 12.7 12.3 13.4 12.4 13.3 12.3 12.4 12.9 12.1 13.1 12.6Total Monthly 383 359 380 403 383 398 380 383 386 374 394 391
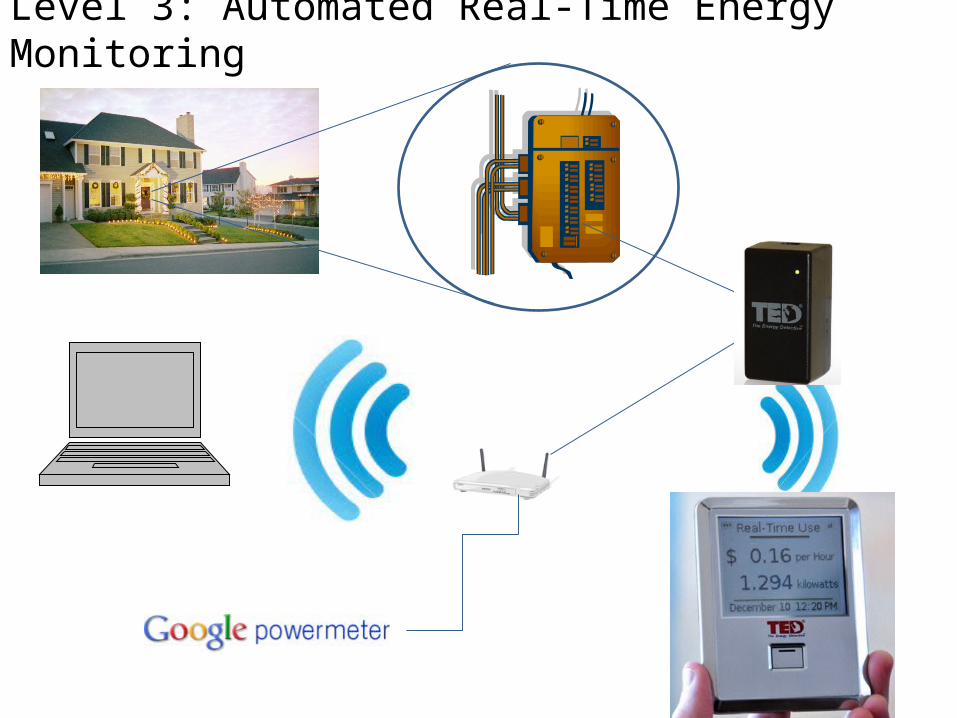
Level 3: Automated Real-Time Energy Monitoring
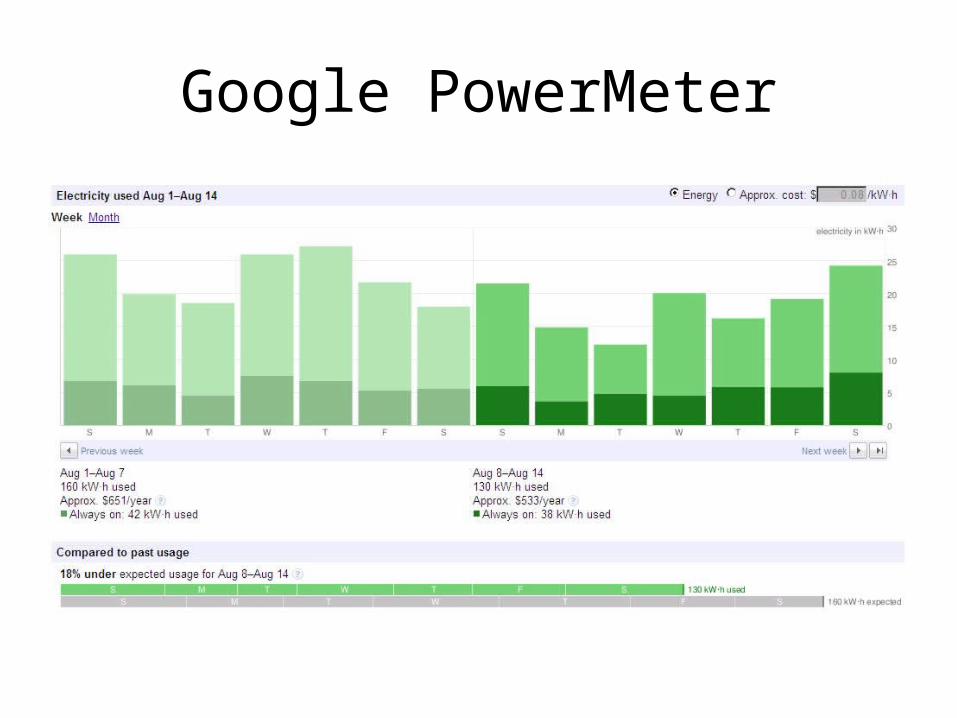
Google PowerMeter

DIY Electrical Energy Audit: Room By Room Accounting
Room By Room Energy Accounting
Lights
Kitchen QuantityPower per bulb (watts) Type
Power (watts)
Hours on/Day
Hours on/Month
Energy/Day (kWh)
Energy/Month (kWh) Cost/Month
Ceiling 1 4 40 Fluorescent 160 2 60 0.320 9.600 $0.72Ceiling 2 2 40 Fluorescent 80 0 0 0.000 0.000 $0.00Sink 1 60 Incandescent 60 0 0 0.000 0.000 $0.00EntryCeiling 3 15 CFL 45 4 120 0.180 5.400 $0.41Living RoomLamp 1 40 Fluorescent 40 0.25 7.5 0.010 0.300 $0.02Family RoomCeiling 2 25 CFL 50 3 90 0.150 4.500 $0.34Downstairs BathCeiling 4 60 Bulb 240 0.5 15 0.120 3.600 $0.27Upstairs BathWall 1 25 CFL 25 1 30 0.025 0.750 $0.06Ensuite BathWall 3 15 CFL 45 1 30 0.045 1.350 $0.10Master BedroomCeiling 2 25 CFL 50 1 30 0.050 1.500 $0.11Table 1 60 Incandescent 60 0.25 7.5 0.015 0.450 $0.03Bedroom 2Ceiling 2 40 CFL 80 0.5 15 0.040 1.200 $0.09Table 1 60 Incandescent 60 0.25 7.5 0.015 0.450 $0.03Bedroom 3Ceiling 2 40 CFL 80 0.5 15 0.040 1.200 $0.09Table 1 60 Incandescent 60 0.25 7.5 0.015 0.450 $0.03Dining RoomChandelier 6 7 CFL 42 3 90 0.126 3.780 $0.28HallwayCeiling 1 25 CFL 25 3 90 0.075 2.250 $0.17GarageCeiling 2 25 CFL 50 0.25 7.5 0.013 0.375 $0.03Ceiling 2 60 Incandescent 120 0.25 7.5 0.030 0.900 $0.07Totals
38.055 $2.85
Appliances and Electronics
Power On (W)
Power Off (W)
Power Standby (W)
Power Other (W)
Hours on/Day
Hours off/Day
Hours Stndby/day
Hours Other/day
Est. Energy/Day (kWh)
Est Phantom Load/day (kWh/day)
Est. Energy/Month (kWh)
Est. Phantom Energy/Month (kWh) Cost/Month
KitchenOven 0 0 0 0 $0.00Large Element 2000 0 0 0 1 2 0 60 0 $4.80Small Element 0 0 0 0 $0.00bake 0 0 0 0 $0.00broil 0 0 0 0 $0.00Toaster Oven 0 0 0 0 $0.00Refrigerator Used energy rating of 365 kWh/year 1 0 30 0 $2.40Kettle 0 0 0 0 $0.00Dishwasher 0 0 0 0 $0.00Blender 0 0 0 0 $0.00Microwave 0 0 0 0 $0.00Telephone 0 0 0 0 $0.00Living RoomTelevision 250 10 3 21 0.96 0.21 28.8 6.3 $2.30DVD Player 0 0 0 0 $0.00PVR 0 0 0 0 $0.00Receiver 0 0 0 0 $0.00
Excel Spreadsheet Available Here: www.elen.ca/home-energy-monitoring/

What you will learn from the room-by-room accounting:
1) Energy use trends in your house • Really makes you think about energy waste
2) What things in your house draw the most power and what use the most energy (not necessarily the same)Example:• Dryer at 5kW 45 minutes per week:
5kW * 0.75 h = 3.75kWh/weekVs.• Computer at 200 W for 40 hours per week:
0.2 kW * 40 = 8 kWh/week
3) What things in your house have high phantom loads

Room By Room Energy Accounting
Lights
Kitchen QuantityPower per bulb (watts) Type
Power (watts)
Hours on/Day
Hours on/Month
Energy/Day (kWh)
Energy/Month (kWh) Cost/Month
Ceiling 1 4 40 Fluorescent 160 2 60 0.320 9.600 $0.72Ceiling 2 2 40 Fluorescent 80 0 0 0.000 0.000 $0.00Sink 1 60 Incandescent 60 0 0 0.000 0.000 $0.00EntryCeiling 3 15 CFL 45 4 120 0.180 5.400 $0.41Living RoomLamp 1 40 Fluorescent 40 0.25 7.5 0.010 0.300 $0.02Family RoomCeiling 2 25 CFL 50 3 90 0.150 4.500 $0.34Downstairs BathCeiling 4 60 Bulb 240 0.5 15 0.120 3.600 $0.27Upstairs BathWall 1 25 CFL 25 1 30 0.025 0.750 $0.06Ensuite BathWall 3 15 CFL 45 1 30 0.045 1.350 $0.10Master BedroomCeiling 2 25 CFL 50 1 30 0.050 1.500 $0.11Table 1 60 Incandescent 60 0.25 7.5 0.015 0.450 $0.03Bedroom 2Ceiling 2 40 CFL 80 0.5 15 0.040 1.200 $0.09Table 1 60 Incandescent 60 0.25 7.5 0.015 0.450 $0.03Bedroom 3Ceiling 2 40 CFL 80 0.5 15 0.040 1.200 $0.09Table 1 60 Incandescent 60 0.25 7.5 0.015 0.450 $0.03Dining RoomChandelier 6 7 CFL 42 3 90 0.126 3.780 $0.28HallwayCeiling 1 25 CFL 25 3 90 0.075 2.250 $0.17GarageCeiling 2 25 CFL 50 0.25 7.5 0.013 0.375 $0.03Ceiling 2 60 Incandescent 120 0.25 7.5 0.030 0.900 $0.07Totals
38.055 $2.85
Appliances and Electronics
Power On (W)
Power Off (W)
Power Standby (W)
Power Other (W)
Hours on/Day
Hours off/Day
Hours Stndby/day
Hours Other/day
Est. Energy/Day (kWh)
Est Phantom Load/day (kWh/day)
Est. Energy/Month (kWh)
Est. Phantom Energy/Month (kWh) Cost/Month
KitchenOven 0 0 0 0 $0.00Large Element 2000 0 0 0 1 2 0 60 0 $4.80Small Element 0 0 0 0 $0.00bake 0 0 0 0 $0.00broil 0 0 0 0 $0.00Toaster Oven 0 0 0 0 $0.00Refrigerator Used energy rating of 365 kWh/year 1 0 30 0 $2.40Kettle 0 0 0 0 $0.00Dishwasher 0 0 0 0 $0.00Blender 0 0 0 0 $0.00Microwave 0 0 0 0 $0.00Telephone 0 0 0 0 $0.00Living RoomTelevision 250 10 3 21 0.96 0.21 28.8 6.3 $2.30DVD Player 0 0 0 0 $0.00PVR 0 0 0 0 $0.00Receiver 0 0 0 0 $0.00

Post Audit Analysis• Identify Biggest Power Consumers– E.g. Dryer: 5 kW. A/C: 3 kW. Stove: 2 kW
• Identify Biggest Energy Consumers
• Identify biggest Phantom Loads

Pyramid of Conservation
Source: http://www.mnpower.com/powerofone/one_home/index.htm
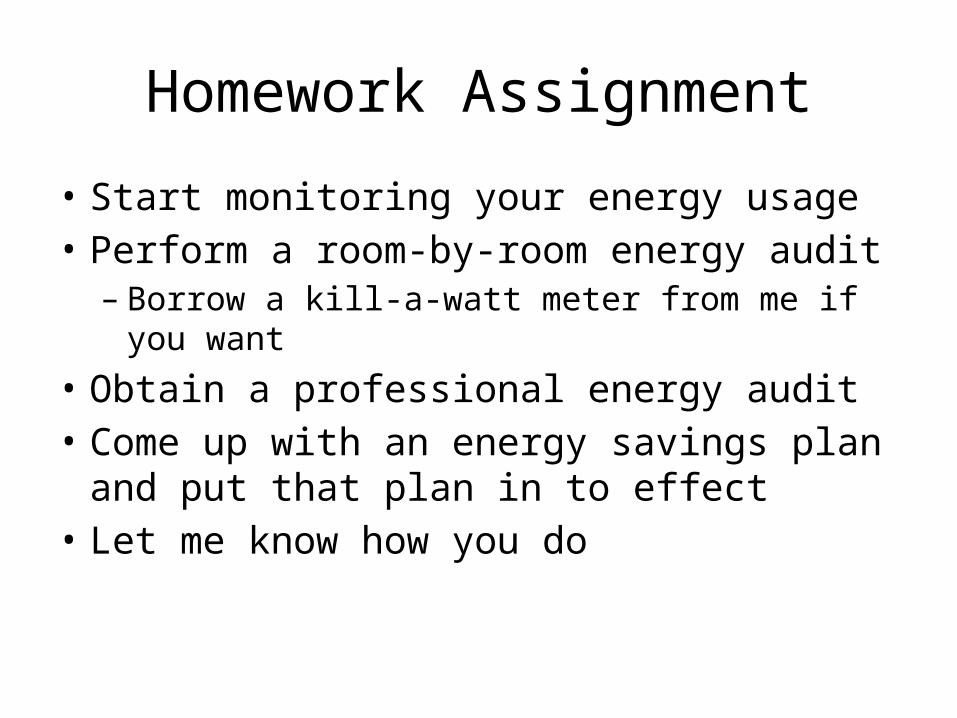
Homework Assignment
• Start monitoring your energy usage• Perform a room-by-room energy audit– Borrow a kill-a-watt meter from me if you want
• Obtain a professional energy audit• Come up with an energy savings plan and put
that plan in to effect• Let me know how you do

More Info
• These slides, More How-to’s and Links www.elen.ca/home-energy-monitoring/
• Free E-Book: Sustainability Without the Hot Air: http://www.withouthotair.com/
• http://blog.mapawatt.com/• http://www.google.com/powermeter• http://www.microsoft-hohm.com/ • Energy Efficiency Information:
http://needtoknow.nas.edu/energy/interactive/energy-efficiency.php
• BC Hydro Green Your Home: http://www.bchydro.com/guides_tips/green-your-home.html
Contact me: [email protected] post a comment on my blog: www.elen.ca/home-energy-monitoring


More Energy Saving Tips to Incorporate into Your Plan:
• Turn things off when they are not in use• Replace incandescent bulbs with CFLs• Get a programmable thermostat– Set thermostat to no less than 25C in summer• Even higher when house is unoccupied
– Set thermostat to no more than 20C in winter• Even lower when house is unoccupied
• Use a toaster oven instead of regular oven for small meals.

General Energy Savings Tips
• Insulate ducts and hot water pipes• If you need to make any upgrades to your
home heating or cooling, have a professional home energy audit (www.livesmartbc.ca)

• http://www.youtube.com/watch?v=YhLsAvsBkbs&feature=player_embedded