10. Technologies for Energy Efficiency & Conservation
76
中・東欧地域 省エネルギー対策 Energy Efficiency and Conservation for Central and Eastern European Countries October 29, 2003 10. Technologies for Energy Efficiency & Conservation 省エネルギー技術 Mr. Kazuki TANABE 田鍋 一樹 General Manager International Training & Communication Department The Energy Conservation Center, Japan (財)省エネルギーセンター 国際研修部 部 長
Transcript of 10. Technologies for Energy Efficiency & Conservation

中・東欧地域 省エネルギー対策 Energy Efficiency and Conservation for Central and Eastern European Countries
October 29, 2003
10. Technologies for Energy Efficiency & Conservation
省エネルギー技術
Mr. Kazuki TANABE 田鍋 一樹
General Manager
International Training & Communication Department The Energy Conservation Center, Japan
(財)省エネルギーセンター
国際研修部 部 長

TechnologiesTechnologies
for Energy Efficiency and Conservationfor Energy Efficiency and Conservation
-- Methodology IncludingMethodology Including Energy Management Energy Management --
October 29, 2003at JICA / TIC, Japan
Kazuki TanabeGeneral Manager
The Energy Conservation Center, Japanhttp://www.eccj.or.jp
Energy Efficiency and Conservation
for Central and Eastern European Countries, 2003

Contents
1.Energy Management
2.Measurement
3.Energy Audit
4.Management System
5.Methodology(Way of Thinking)
6.Energy Saving Technology
7. Conclusion

1. Energy ManagementEnergy ManagementEssential AspectsMeasureEffectEducation

Energy ManagementEnergy Management
Energy Saving(or Conservation)
• Energy Efficiency (by Machine, System)
• Machine Efficiency
• Energy Recovery
• Control System
• Energy Conservation(by Human)
Energy Management
Phase 1 (A)Phase 2 (B)Phase 3 (C)
ManagementSystem
* ISO9001- Quality
* ISO14001- Environment- Energy

Phase 1 : Improved Operation(A) Without Investment
Phase 2 : Equipment Improvement(B) Small Investment
Phase 3 : Dramatic Improvement(Strategy, Innovation)
(C) Large Investment
The Essential AspectsThe Essential Aspectsof Energy Managementof Energy Management

Technology and Economic Conditions
A
B
Easy Difficult
Smal
lLa
rge
Impa
ct o
n En
ergy
Con
serv
atio
nCategory of Measure
Small-groupCircle
ManagerGroup
Director Project team
◎
◎
◎
×
○
○
○
○
A
B
D
C
Measure and Implementation
A
B
C
D
Without Investment
Small Investment
Large Investment
Not Consider
D
C
Measure of ManagementMeasure of Management

Schematic Concept of Schematic Concept of ConservationConservation
““ Energy Conservation = Company Management Itself Energy Conservation = Company Management Itself ““
Profit 15% Profit 10% Profit 15%
Profit10
10090
Sales up 50% Conservation 5%Base
Very DifficultVery Difficult Rather Acceptable!Rather Acceptable!
100
85
15
15150
135
Sales Cost

Large Investment
Effect : 5%
Small Investment
Effect : 7%
Without Investment
Effect : 11%
Ener
gy c
onse
rvat
ion
prog
ress
, %““ Energy Management is most profitable Energy Management is most profitable ””
Effect of Energy ConservationEffect of Energy Conservation
Accelerated Energy Conservation Scenario
5
25
20
15
10
Management
New Tech
Inspected Tech
Enhanced Management
Facilities & Process change
23% Reduction
<<an example of audit>an example of audit>Year
A
B
C
Investment for Energy Management Support System
・ Measuring Instrument ・ Control System

Education of Energy ConservationEducation of Energy Conservation
Expert Person : Self Promotion(Designated Person) Case of Japan ( Case of Germany)
・ Knowledge (Policy, Technology, Management)
・ Audit (Measure, Inspection, Proposal)
・ Implement (Management, Small Invest, Large Invest)
・ Knowledge (Policy, Technology, Management)
・ Audit (Measure, Inspection, Proposal)
・ Implement (Management, Small Invest, Large Invest)
Expert Company : Out- Sourcing
(Energy Service Company)
Ability to promoteindependently
・ Person・ Organization・ Policy
< < Education >Education >
Case of U.S.A. and others
< < Target >Target >
~~

2. MeasurementMeasurement and ManagementExample of Measure for Industrial FurnaceExample of Measurement Instruments

Measurement (1)Measurement (1)
MeasurementMeasurement
-- Machine Machine --
Control SystemControl System
-- Line , Process Line , Process --
Total Control SystemTotal Control System
-- Works Works --
SuitableMeasuring Instrument
Technologyto Control
Synthetic Technology
for Control & Manage
Now : A little Expensive
Future : Not Expensive (to be developed)
Heat : T. P. F.・・・Elect : V.W.Pf. ・・・
Past : Very Expensive
Now : Not Expensive
Transfer Transfer
““ Energy Conservation : More than 10% Energy Conservation : More than 10% ””
Select
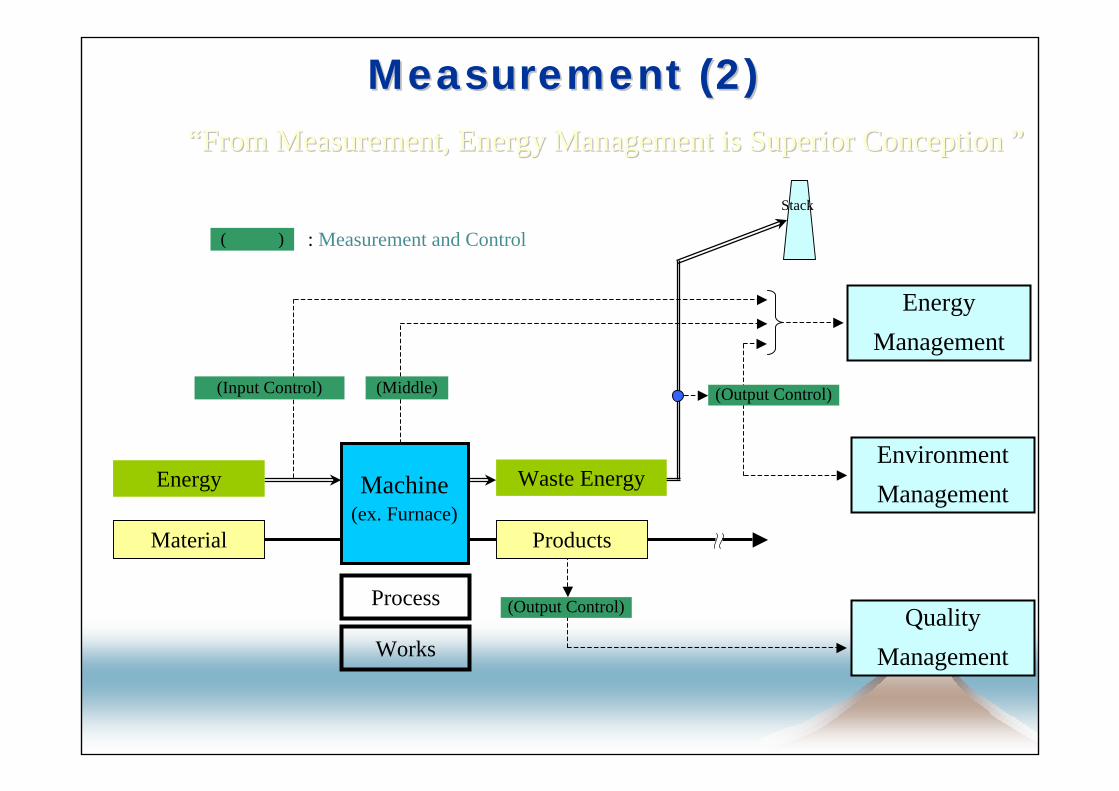
Measurement (2)Measurement (2)““From Measurement, Energy Management is Superior Conception From Measurement, Energy Management is Superior Conception ””
Process
WorksQuality
Management
Energy Management
Environment ManagementMachine
(ex. Furnace)
(Input Control)
Material
Energy
(Middle) (Output Control)
Stack
Products
Waste Energy
(Output Control)
( ) : Measurement and Control
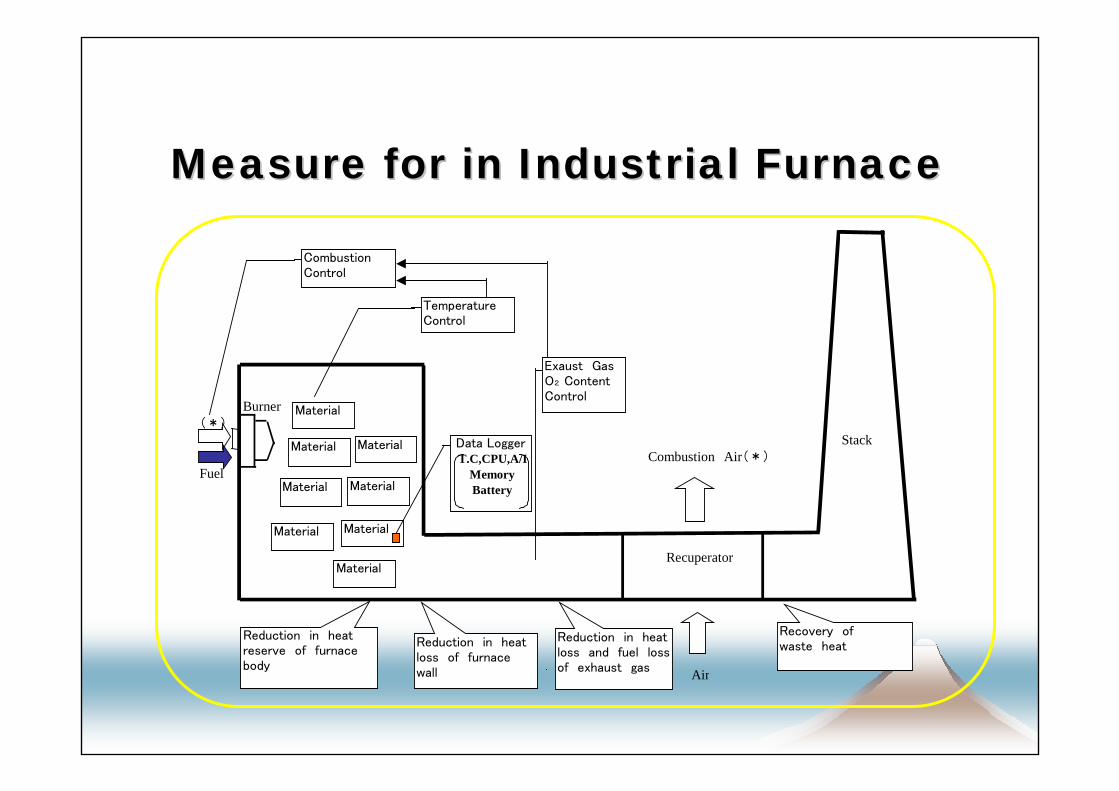
Measure for in Industrial FurnaceMeasure for in Industrial Furnace
Burner (*)
Stack Combustion Air(*)
Fuel
Recuperator
Air
Material
Material Material
Material
MaterialMaterial
Material
Material
CombustionControl
TemperatureControl
Exaust GasO2 ContentControl
Reduction in heatreserve of furnacebody
Reduction in heatloss of furnacewall
Reduction in heatloss and fuel lossof exhaust gas
Recovery ofwaste heat
Data Logger T.C,CPU,A/I
Memory Battery

Measuring Points ofMeasuring Points ofDissolution FurnaceDissolution Furnace(Number : Measuring point)(Number : Measuring point)
⑲ ⑲⑲⑲⑲
⑰⑱
⑳ ⑳ ⑳ ⑳ ⑳
⑧
⑯
2223
2223
2223
2223
2223
2132
⑮
⑮
212223
24 25
⑪⑫⑬⑭
31
⑩ ⑨
⑪⑫⑬⑭
●
●●
2223
21
⑲ 28
26
27
⑮
⑮⑳
①②③④⑤
30
⑩
⑨29
⑥⑦
⑧

Measuring Points ofMeasuring Points ofRolling Mill & Rolling Mill & Reheating Reheating FurnaceFurnace(Number : Measuring point)(Number : Measuring point)
→
⑫
⑨
⑩
⑪⑦
③
④②⑥
①⑤
⑬
Reheating Furnace
Rolling Mill
Recuperator
ElectricityFuel
Electricity
Billet
BlowerAir
⑭⑮⑯
⑰

Wiring Chart ofMeasuring Instrument
Digital Low Pressure Indicator
AC220V
OutputDC 1-5 V
to Recorder
8/6 Vinyl Tube
AC220V
AC20V/DC24V
Output Cord
DC4-20mA
DC 1-5Vto Recorder
Chant Resistance250 ohm
Pressure Transmitter
Cock
GasOutputDC 1-5 Vto Recorder
Cooling Water
Press. Air
Suction Pyrometer
Digital Low Pressure Indicator Wiring Chart
Pressure transmitter Wiring Chart
Suction Pyrometer Wiring Chart
< < Example 1 >Example 1 >

Sensor
Ultrasonic Flow Meter
AC220V
90°
DC4-20mA
Chant Resistance250 ohm
DC 1-5Vto Recorder
V methodZ method
AC220V
AC20V/DC24V
Voltex Flow Meter
Signal Cable
Flow
Output Cord
DC4-20mA
DC 1-5Vto Recorder
Chant Resistance250 ohm
Air
Sensor
Under 500 ℃
OutputDC 0-1 V
to Recorder
Hot Wire Anemo Master
Delta P
Dynamic P
Pittot Tube
Gas
OutputDC 1-5 Vto Recorder
OutputDC 1-5 Vto Recorder
Dynamic
Delta
AC220V
Ultrasonic Flow Meter Wiring Chart
Voltex Flow Meter Wiring Chart
Hot Wire Anemo Master Wiring Chart
Pittot Tube Flow Meter Wiring Chart
< < Example 2 >Example 2 >

3. Energy Audit<Survey Result>
Number of AuditEnergy Saving PotentialItems of Energy ManagementPractical Way of Energy Management
(Example in the field of Thermal Energy)

Energy Saving Potential in Industry Energy Saving Potential in Industry ((Survey 1999 by ECCJSurvey 1999 by ECCJ))
0
2
4
6
8
10
12
14
16
Petrole
um/coal
products
Chemica
ls
Precisi
on m
achineryTex
tiles
Others
Bevera
ge, to
bacco
and fe
ed
Rubber pro
ducts
Wate
rwor
ks
Ceramics
/earth
enwar
eFoo
dstuffs
Pulp, pap
er an
d paper
products
Meta
l pro
ducts
Lumber an
d woo
d products
Plastic
s
Electri
cal m
achinery
Genera
l elec
trica
l mac
hinery
Transp
ortat
ion m
achinery
Clothes
& other
textile
products
Publishing,
printin
g and re
lated
industr
iesAgr
icultu
re
Iron an
d steel
Non-fe
rrous m
etals
Wast
e trea
tmen
t
Industry
Ene
rgy
Saiv
ing
Rat
e (%
)
0
100
200
300
400
500
600
Ene
rgy
Con
sum
ptio
n (c
urde
eq.
kL
/y)
Energy Saving Rate
Energy Consumption
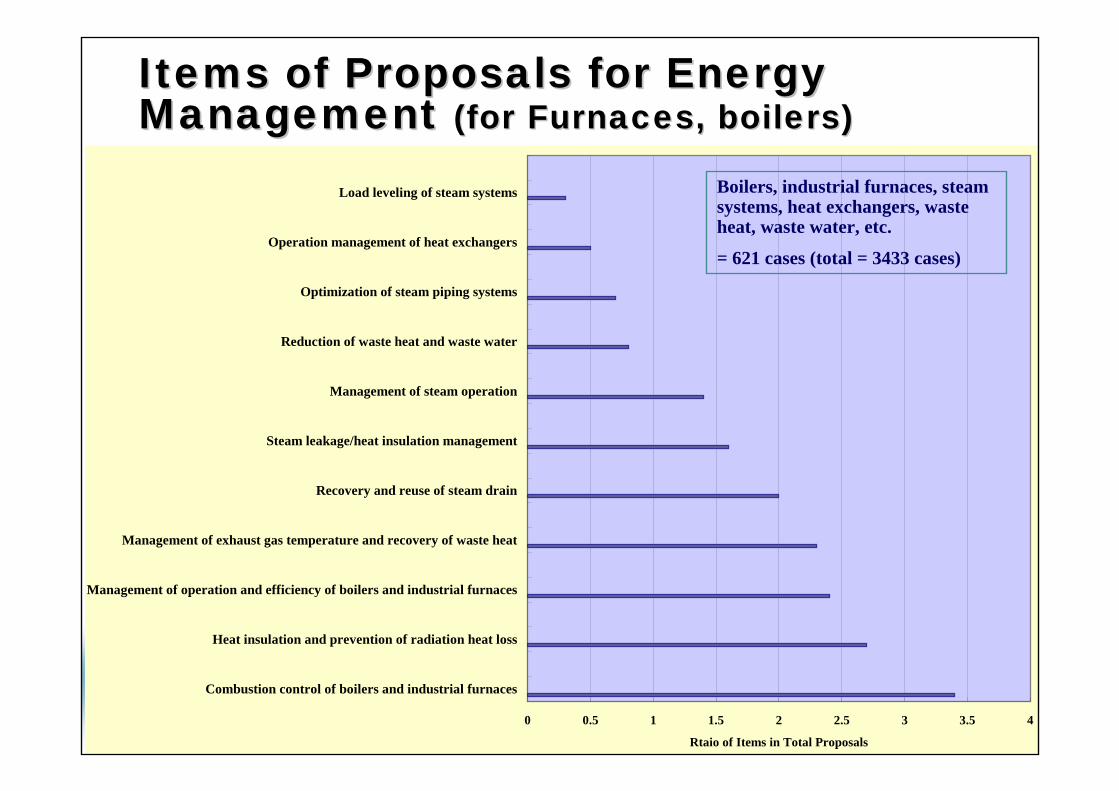
Items of Proposals for Energy Items of Proposals for Energy Management Management (for Furnaces, boilers)(for Furnaces, boilers)
0 0.5 1 1.5 2 2.5 3 3.5 4
Combustion control of boilers and industrial furnaces
Heat insulation and prevention of radiation heat loss
Management of operation and efficiency of boilers and industrial furnaces
Management of exhaust gas temperature and recovery of waste heat
Recovery and reuse of steam drain
Steam leakage/heat insulation management
Management of steam operation
Reduction of waste heat and waste water
Optimization of steam piping systems
Operation management of heat exchangers
Load leveling of steam systems
Rtaio of Items in Total Proposals
Boilers, industrial furnaces, steam systems, heat exchangers, waste heat, waste water, etc.
= 621 cases (total = 3433 cases)

Waste Heat RecoveryWaste Heat Recovery
qa : H/R inlet combustion air sensible heatqb : H/R outlet combustion air sensible heatGa : H/R inlet combustion exhaust gas sensible heatGb : H/R outlet combustion exhaust gas sensible heatF : Fuel heat value

1. The standard of rationalization of energy use 1) Air Ratio 2) Outer Wall Temperature of Furnace Wall 3) Recovery Rate of Waste Heat
2. Example / Industrial Furnace (Combustion)
Practical Management IntroductionPractical Management Introduction

Air ratio (m) = Actual Air/Theoretical Air (Volume)Air ratio=21/(21- O2) (%)
・Excess Air : The increase in exhaust gas heat loss Increase in NOx → Environmental aggravation Increase in oxidation loss → Yield aggravation
•Insufficient Air : The increase in non-combustion fuel lossGenerating of CO & Soot → Environmental
aggravation
Inner pressure of furnace : High → Blow off of a flame→ Opening heat loss
Low → Increase in invasion air→ Increase in waste gas heat loss
The Air Ratio of CombustionThe Air Ratio of Combustion

Type of Gaseous Fuel Liquid FuelMetallic Furnace Coetaneous Intermittent Continuous
Intermittent
Dissolution Furnace 1.25 1.35 1.30
1.40
For Casting (Target) 1.05~1.20 1.05~1.25 1.05~1.25 1.05~1.30
Billet Heating 1.20 - 1.25
-
Furnace (Target) 1.05~1.15 - 1.05~1.20
-
Heating Furnace 1.25 1.35 1.25 1.35
(Target) 1.05~1.20 1.05~1.30 1.05~1.20 1.05~1.30
Standard & Target air ratio for Industrial furnace
Rationalization of Combustion of FuelRationalization of Combustion of Fuel(Guideline)(Guideline)

Management Control standard of furnace wall temperature
Establishment & reconstruction
Measure Temperature of furnace wall & innerRecord furnace, work environment Observation
(Leak of combustion gas and red heat / Distortion of Furnace Body)
Maintenance Scheduled repair of Furnace wallCheck
Execution Improvement of heat insulationConstruction (selection of proper insulator)
External Surface Temperature / External Surface Temperature / PDCAPDCA

Standard and Target of external surface temperature
Bottom touched toInner Temp.(℃) Ceiling Side wall the outer space 1,300 ≦ t 140 120 180
120 110 1601,100 ≦ t <1,300 125 110 145
110 100 135900 ≦ t <1,100 110 95 120
100 90 110 t < 900 90 80 100
80 70 90
Prevention of Heat Loss by Prevention of Heat Loss by Radiation,Heat Transfer, etc.Radiation,Heat Transfer, etc.(Guideline)(Guideline)

・To improve the excess air ratio
・To recover the exhaust heat to use for air heater or recovery boiler or preheat of material to be heated in the process.
・Replace the burners to re-generative burners
(1) Combustion process

Combustion Exhaust Gas Combustion Air Preheating → Recuperator
Recuperative Burner Regenerative Burner Water supply Preheating
Waste heat Recovery Boiler
Raw Material Preheating
Fuel Preheating
Recovery Use of Waste HeatRecovery Use of Waste Heat

Re-generative Burner System
Regenerative Burner Unit
Honeycomb Type Heat Storage Unit
Honeycomb Type Heat Storage Unit
Air
Fuel
Flue Gas
Four Way Valve
30sec later
Honeycomb Type Heat Storage Unit
Honeycomb Type Heat Storage Unit
Air
Flue Gas

High Performance Industrial FurnaceRegenerative
Fuel Valve
Recuperator
Switch Valve
BlowerFan
Regenerative Burner System
(HiTAC)

High Performance Industrial Furnace
Conventional Flame
Regenerative Flame
Limit
Heat flux
Flame
Concept of High Temperature Air Combustion
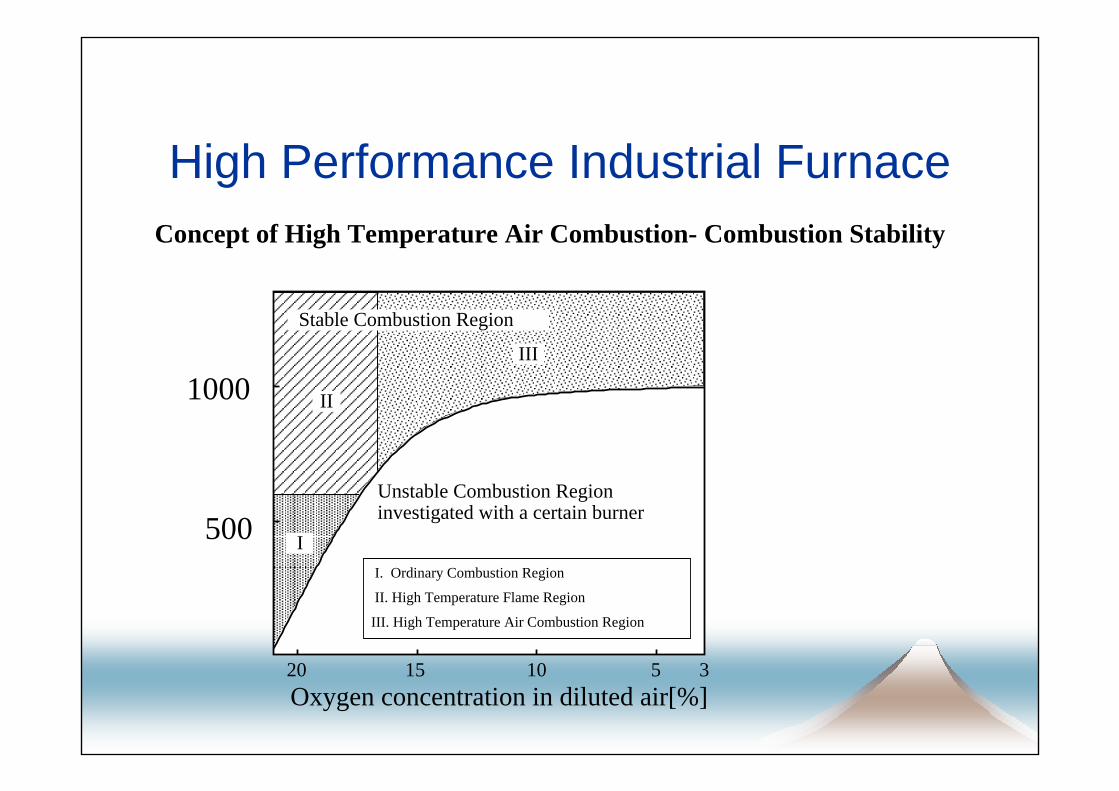
High Performance Industrial Furnace
20 10 3
I
II
III
515
Unstable Combustion Region investigated with a certain burner
I. Ordinary Combustion Region
II. High Temperature Flame Region
III. High Temperature Air Combustion Region
Stable Combustion Region
Oxygen concentration in diluted air[%]
1000
500
Concept of High Temperature Air Combustion- Combustion Stability

High Performance Industrial Furnace
O 2 [vol%]
0
200
400
600
800
1000
1200
05101520
CO 100 ppmCO 0 ppm
NOx 50ppmNOx 40ppmNOx 30ppmNOx 20ppmNOx 10ppm
Measured NOx and CO emission affected by Diluted Air Temperature and O2 concentration

4. Management SystemEnergy ‘Navi’Overview of Management SystemSystem Development
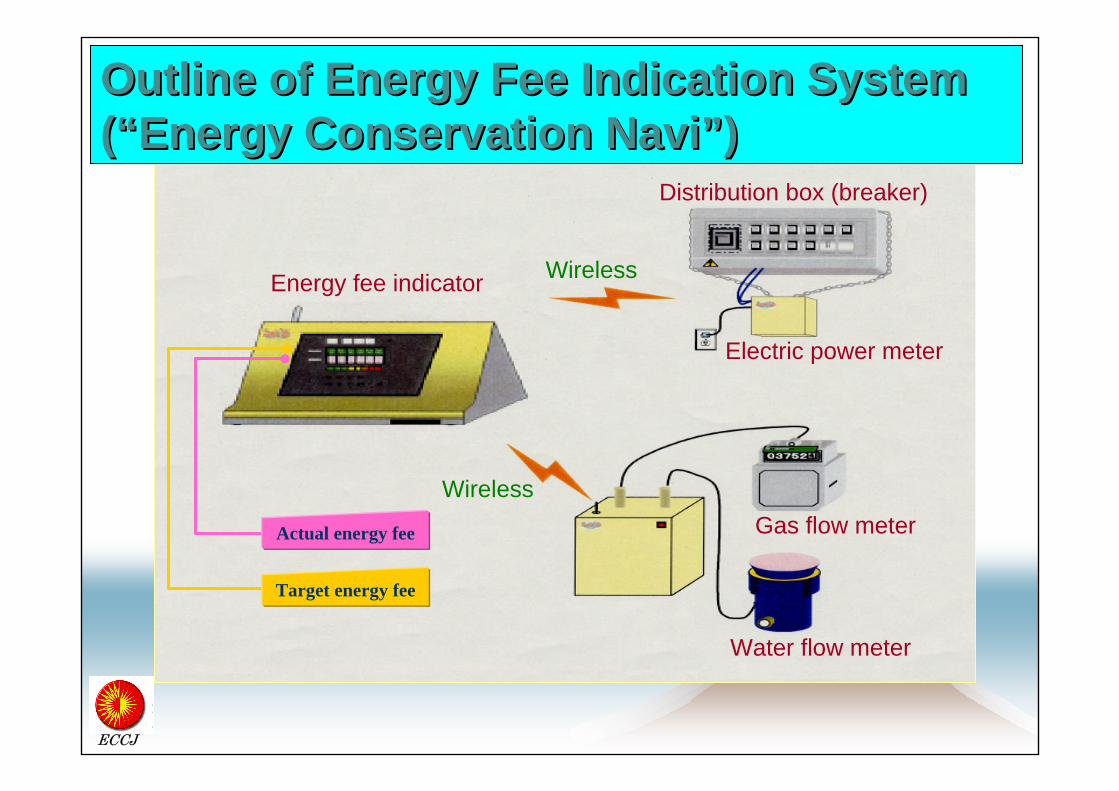
Energy fee indicator
Distribution box (breaker)
Electric power meter
Gas flow meter
Water flow meter
Wireless
Wireless
Target energy fee
Actual energy fee
ECCJ
Outline of Energy Fee Indication System Outline of Energy Fee Indication System ((““Energy ConservationEnergy Conservation NaviNavi””))

After installation(present),
1.528 million kWh
After installation(present),
1.528 million kWh
Visual Effect20% of energy saving can be attained by nature by seeing “Navi” frequently.
Before installation
(the same period ofthe preceding year),
1.915 million kWh
Before installation
(the same period ofthe preceding year),
1.915 million kWh
Reduction byReduction by
aboutabout20%20%
“Energy Conservation Navi” have been installed since November 1998 at monitors' houses. As of March 1999, Energy Conservation Navi” were installed at 800 houses across the nation.
Effect of Effect of ““Energy ConservationEnergy Conservation NaviNavi””
ECCJ

((example)example) Overview of Electricity Overview of Electricity Management SystemManagement System

Development of Energy Saving Control Technology for IT:Energy Savings of 8 to 20% in Households, Office Buildings, and Factories
1.Objective Electrical devices used in households, office buildings, shops, and factories
2.Main development items (target: 2002) Using network:
•System that controls the entire loss of electricity minimal •Information transmission interface that can be integrated into devices •Compact and highly efficient inverter used in factories
3.Provisional calculations of energy savings upon completion of the development Households : 20% Office buildings and shops : 14% Factories : 8%
ECCJ

ECCJ
Figure 3: Relationship between Current R&D and Conventional Technologies
Applicableobjective
Field
Households
People's livelihood
Office buildings
and shopsFactories
Industry
District
Autonomous body, electricity,and gas
Current R & D
Conventional technologies
(including technologies under development)
Home automation technologyECHO, NET, HEMA, etc.
Factory equipment monitoring & control
technologyField Network etc.
Automatic electricity meter reading and additional
information serviceDSM*, OpenPLANET, etc.
Development of technology for a reduction ofpower consumption
Development of a total energy saving system with a network(utilize the existing network technology)
Building monitoring & control
technologyBEMS, BACnet, etc.
*DSM:Demand Side Management

5. Methodology(Way of Thinking)
General Energy Management ItemsPromotion Method for Energy ConservationBentimark ActivityCleaner ProductionStrategy of NEDOInternational Cooperation Method

General Energy Management ItemsGeneral Energy Management Items
Management System• Organization System (CPU)
Measurement & Recording• Energy Consumption
• Daily, Monthly, On Real Time• Energy Intensity
• Products, Consumption Rate
Maintenance & Management• Equipment's, Insulation, Cleaning ...
Environmental Management• CO2 Reduction, Waste Treatment ...

Items of Thinking Items of Thinking
Stop : Stop Unnecessary EnergyRepair : Repair Equipment DefectTurn off : IntermittentReduce : Reduce Dresser, TemperatureRecover : Recover Waste EnergyReplace : Energy Source, Equipment Work Procedure

The Characteristic FactorThe Characteristic Factorfor Energy Savingfor Energy Saving
Layout Examination
Structure & Design of a
Furnace
Recovery of waste Heat
Utility Reduction
Strengthening of Facility
Management
Operation Management
Reexamination of Heating Conditions
Ener
gy S
avin
g
Efficiency
Conservation

Promotion MethodPromotion Methodfor Energy Conservationfor Energy Conservation
Establish
Setting a target
Grasp the current Energy use
Management of energy intensity
Planning improvement measures
Implementation & Improvement
Bench Mark ActivitiesGet information from other industries, countries
Very ImportantVery Important
Action
Check Do
Plan

Bench Marking of Energy Consumption Unit in Japan
Concept of Bench Marking・Bench Mark: Target with range
Best Target Data ,Target Process ・Bench Mark Data:Actual Best Data for
establishing Target・Bench Mark Activity:Activity Story in order
to achieving Best Target ・Best Practice: Best Story・Success Story:Successful Case of
Implementation to achieve Best Target

Energy Saving & Resources Saving for cleaner production
EnergyInput
Materials Input Cleaner Production
Waste
Factory
Efficiency &Conservation
Users
Efficient Use Appliances
Recycles
Wastes
CityDistrict
Recycle Factory Materials Recycle
Energy Recycle
:Energy :Material
Efficient Products

・CP includes not only the conventional technologiesfor each measure (Hard Technology), but the tech-nologies by manageable methods (Soft Technology),based on the idea of reducing the environmental burden in every process from extracting of raw materials to disposal of products and reuse.
Concepts of Cleaner Production (1)
・Technologies of Air Pollution, Water Pollution andWater Treatment were called End of Pipe .Technology Because they disposed of pollutants atoutlet. ( Against that, in Agenda 21 adopted by “United Nations Conference
on Environment and Development (Global Summit) ” in 1992,“Cleaner Production (CP)” was suggested to progress.)
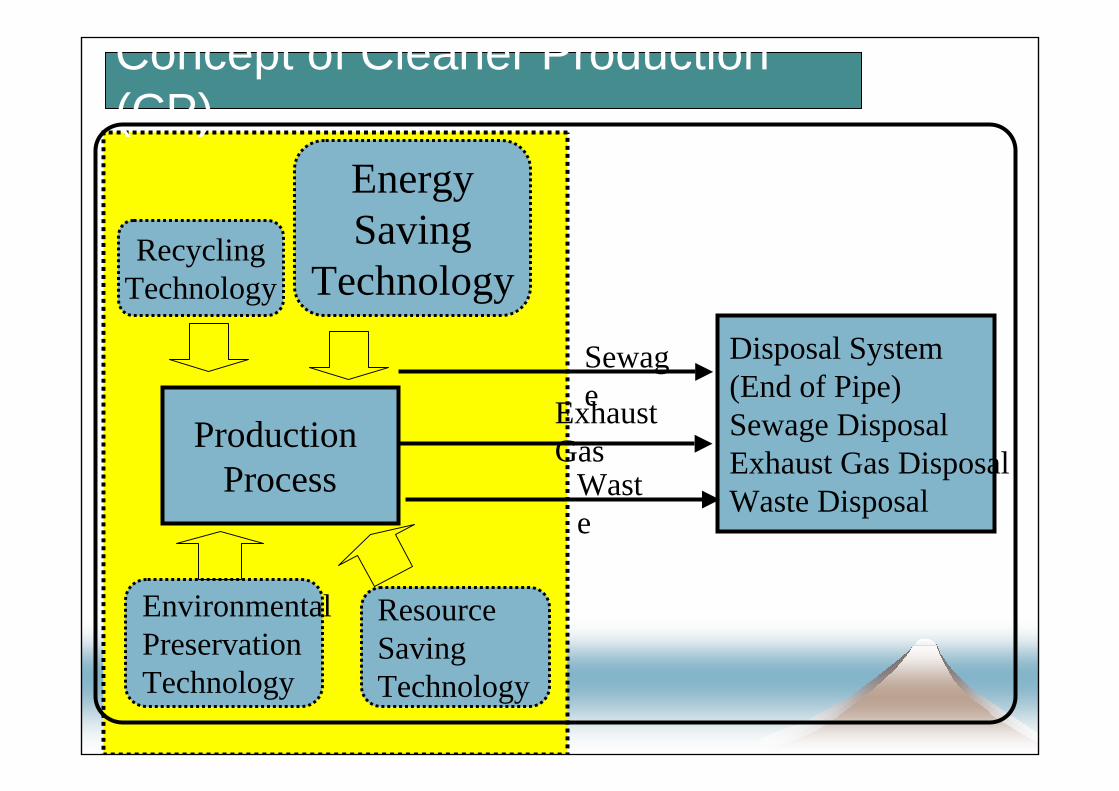
Concept of Cleaner Production (CP)
Production Process
RecyclingTechnology
EnergySaving
TechnologyDisposal System(End of Pipe)Sewage DisposalExhaust Gas DisposalWaste Disposal
SewageExhaust
GasWaste
Environmental PreservationTechnology
ResourceSavingTechnology

Objects of Cleaner Production
Cleaner Production Improvement of Environment
Energy Conservation
Protection from Pollution
Cut down of Machine break down
Improvement of Quality
Improvement of Yield rate
Cut down of Wastes
・/Products Improvement
・Material Substitution
・Improvement of Producing Process and Equipment
・Separation & Reuse
・Factory Management
・Life Cycle Management
・Training/Direction/Evaluation

Decision on introducing Cleaner Production by Top Manager
Planning on Programme and Installation of promoting organization ・Declare on introducing Cleaner Production
Check on Actual Data & Problem (Potential Items)
Analysis Potential Items & Planning Countermeasures
Estimate of Countermeasures & Selection on Action Plans
Carry out the Countermeasures & Follow-up the Results
1st.Step
2nd.Step
4th.Step
3rd.Step
5th. Step
Promoting Procedure on Programme of “CP”

Increase of Eff. of Black liquor Combustion
(26% Cut down)
Reduction by conversion of goods&Material (58%)
Reduction by Manufacturing Process(18%)
Reduction by Watertreatment (16%)
90
20
200220
450
200
400
millionton/y
1980~19951970
Reduction trend of COD of Pulp&Paper industry

Pulp&Paper(150)
Others(150)
Industries (300)Living(75)
1970
1990 78 million tons/y
375 million tons/y
Living(58)
Industries(20)
Discharge Load of BOD (Japan)

Strategy of NEDO for Environment & Strategy of NEDO for Environment & Energy Efficient TechnologyEnergy Efficient Technology(NEDO : New Energy and Industrial Technology Development Organiz(NEDO : New Energy and Industrial Technology Development Organization)ation)
1. New Sunshine Program (New Technology Development)
2. Energy Efficiency Oriented International Cooperation
3. Environment Oriented Technology
ECCJ
International Cooperation Center
Environment Technology Development Office
・ FS & Model Project・ Database Project・ Technology Transfer
・ FS & Environment Technology Project・ Technology Transfer
New energy technology research and development (The Sunshine Project)
Energy conservation technology research and development (The
Moonlight Project)The environment technology development
The New Sun-shine Program
(R&D Program on energy and environmental technologies
Global Warming Prevention
Action Plan
“ New Earth 21 “
Support for neighboring developing countries
Innovative technology development
International, large scale collaborative research
Collaborative R&D on appropriate technology
1974 1978 1989 1992 1993 2020

6. Energy Saving Technology
Common (many industries)Process (example of Iron & Steel,Ceramic, Pulp & Paper, Power Generation)Power Plant,Cascade UtilizationHiTAC (High Temperature air Combustion Technology)

Classification of Energy Saving Technology
1. Process Technology : (1) Common Technology(2) Process Technology
Production EquipmentAuxiliary Machinery & Equipment
Operation & Management
2. Energy Manager System:Heat:Thermal Conservation Technology
Electricity :Electrical Conservation Technology

Flow diagram of energy saving technologies applicable to many industries
ECCJ

Iron & Steel : Production Process and Energy Saving Technology
ECCJ
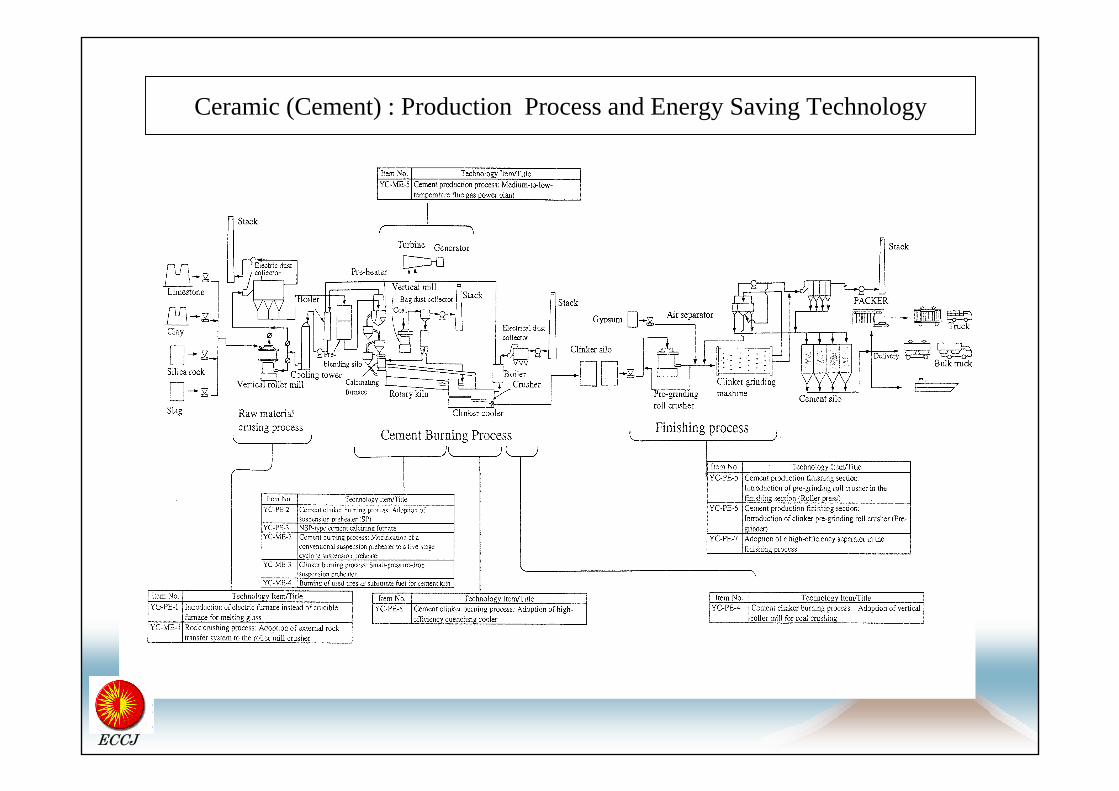
Ceramic (Cement) : Production Process and Energy Saving Technology
ECCJ
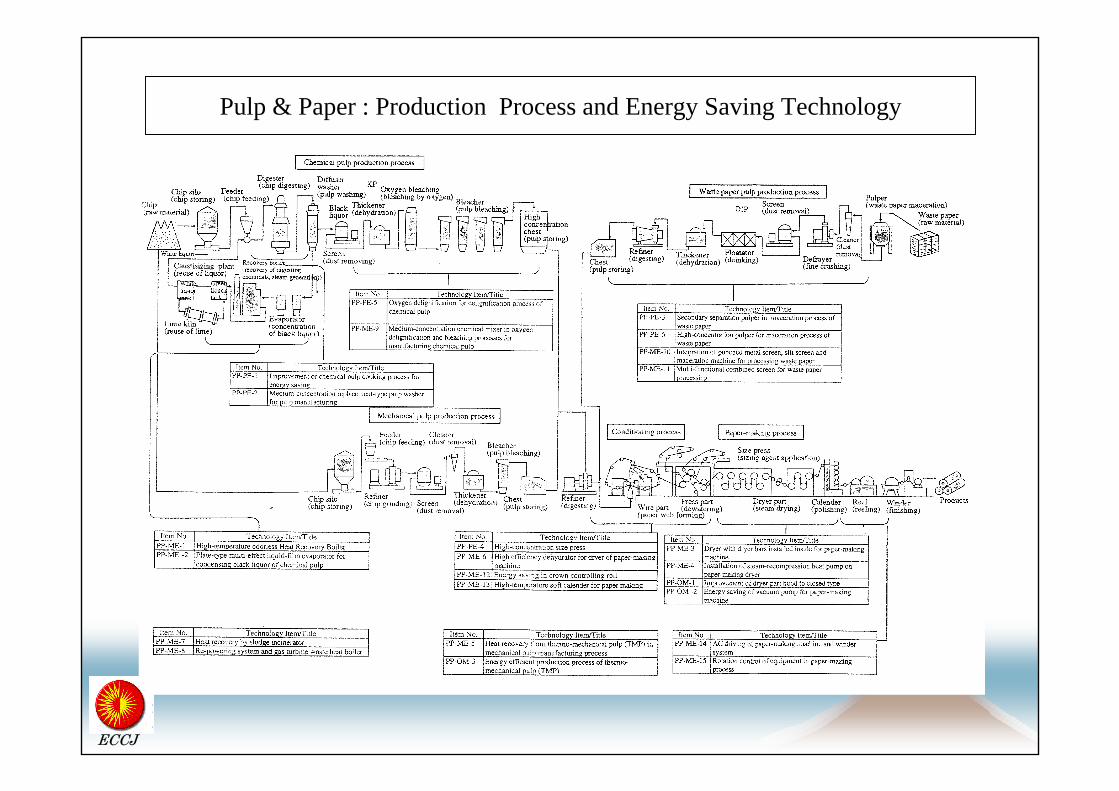
Pulp & Paper : Production Process and Energy Saving Technology
ECCJ

Electricity Generation : Power Generation and Energy Saving Technology
ECCJ
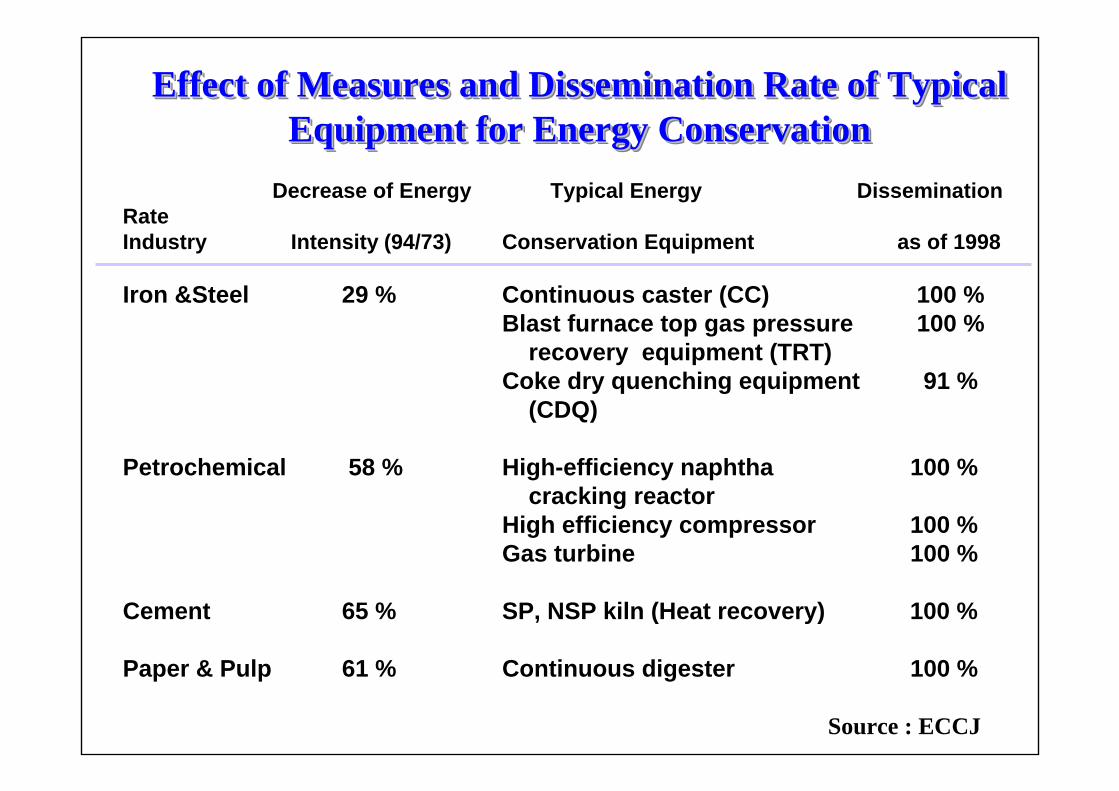
Decrease of Energy Typical Energy Dissemination RateIndustry Intensity (94/73) Conservation Equipment as of 1998
Iron &Steel 29 % Continuous caster (CC) 100 %Blast furnace top gas pressure 100 %
recovery equipment (TRT)Coke dry quenching equipment 91 %
(CDQ)
Petrochemical 58 % High-efficiency naphtha 100 %cracking reactor
High efficiency compressor 100 %Gas turbine 100 %
Cement 65 % SP, NSP kiln (Heat recovery) 100 %
Paper & Pulp 61 % Continuous digester 100 %
Source : ECCJ
Effect of Measures and Dissemination Rate of Typical Equipment for Energy Conservation
Effect of Measures and Dissemination Rate of Typical Effect of Measures and Dissemination Rate of Typical Equipment for Energy ConservationEquipment for Energy Conservation

Flow of Solid Raw materialFlow of Gas
Feed
CoolerOutlet of Kiln
Inlet of Kiln
Secondary air
Coal
Waste Plastics
CoalRotary Kiln
FDF
New type Cement Kiln
IDF
Pre-Calcination Furnace

Continuous caster (CC)

Combined cycle power generation

Trends of Gross Thermal Efficiency (HHV)and Transmission and Distribution Loss in Japan

Trends of Steam Pressure and Steam temperature on Thermal power plants in Japan

Trends of Development on Unit capacity of Thermal Power Plant in JapanO
utpu
t of T
urbi
ne g
ener
ator
(MW
)
Tandem Type( One shaft type)
Cross Type(Twine shafts
type)

Cascade Utilization of Thermal Energy
Gas / Diesel Engine
Gas Turbine
Steam Boiler
Heat Pump,Adsorption refrigerator
Steam Turbine
Bath
Hot waterAir Conditioning
Exhaust gas Boiler
Thermal Energy

Boiler
Exhaust gas(14%)
Fig.2 Gas Turbine Power Plant
Steam turbine
Generator(40%)Cooled water
(46%) AirCompressor
Gas turbine
AirFuel(100)
Exhaust gas(71%)
Fig.1 Steam Turbine Power Plant
Condenser
PumpFuel(100)
( ) : Ratio of Heating value [%]
Generator(29)
Example: Illustration of Combined Cycle Assembling

Combined Cycle Power PlantExhaust gas (27)
Steamturbine
Generator(42)Condenser
Gas turbineAircompressor
Fuel(100)Air
Exhaust gas Boiler
Water(31)
Pump

Gas turbine generator
Boiler 2Boiler 1NaphthaFurnace
ST G ST G
ST ST
Plant
ST Plant
ST
Plant Plant
ST G
Boiler 3
Boiler 5
Boiler 4
Plant
G
Vent
VentVent
A line
B line
C line
D line E line
Example

Example 2 Waste gas application

ConclusionConclusion
Energy ManagementEnergy Saving should be
Promoted Practically & SteadilyThe Results will be• Improvement in Productivity• Cost Reduction• Life Keeping of Facilities• Environmentally Friendly, Waste
Reduction

Apply the Concept of Apply the Concept of BolzmannBolzmann’’s s Principle Principle to Activity to Activity -- 11
Normal Effort : Level not Grows up Many things to do
Not Active
Very ActiveOther things to do
W : Energy input (Effort)
S : Effect

Apply the Concept ofApply the Concept of BolzmannBolzmann’’ss Principle Principle to Activity to Activity -- 22
W : Energy input (Effort)
S : Effect
Not Active
Very Active
Endeavor : Level Grows up
Level Grows up