Home Dex Report
21
$ North San Diego County Association of REALTORS® North C ount y November 2010 REP O RT October 2010 Statistics N N o o r r t t h h S S a a n n D D i i e e g g o o C C o o u u n n t t y y H H o o m m e e D D e e x x T T M M Home Dex is an excl us ive NSDCAR member be ne fi t
-
Upload
miguelnunez -
Category
Documents
-
view
231 -
download
0
Transcript of Home Dex Report

8/8/2019 Home Dex Report
http://slidepdf.com/reader/full/home-dex-report 1/20
$
North San Diego CountyAssociation of REALTORS®
North Count y
Nov em ber 2 010 REPORT
October 2010 Statistics
N N o o r r t t h h S S a a n n D D i i e e g g o o C C o o u u n n t t y y
HHoommeeDDeexx TTMM
HomeDex is an exclusive NSDCAR member benefit

8/8/2019 Home Dex Report
http://slidepdf.com/reader/full/home-dex-report 2/20
PLEASE READ
The name HomeDex™ and its contents are protected under a trademark andcopyright held by the North San Diego County Association of Realtors ® (NSDCAR). Permission is granted to NSDCAR members to use the HomeDex™
name and/or its contents in any printed materials, website or other mediaapplications – provided any and all attribution for the HomeDex™ name and itscontents is given to the North San Diego County Association of Realtors ® .Failure to do so will result in revoking permission to use the HomeDex™ nameand/or its contents
Direct written requests for permission, together with a brief description of how thename and contents would be used, to Lynn Sullivan, NSDCAR CommunicationsDirector, at [email protected] and include the proposed user’scontact information.
HomeDex™ is prepared for the North San Diego County Association ofREALTORS ® by Robert Brown, Ph.D., California State University, San Marcos.Questions may be directed to Dr. Brown at [email protected]; phone #(760)750-4196 or to NSDCAR Communications Director, Lynn Sullivan, [email protected]; phone # (760) 734-3971.
Data source: Sandicor, Inc. Statistics obtained from MLS data.
Copyright North San Diego County Association of REALTORS ®
, 2010. No portion of this text maybe reproduced, redistributed, faxed OR TRANSMITTED ELECTRONICALLY without the writtenpermission of the North San Diego County Association of REALTORS
® .
01/12/10
8/8/2019 Home Dex Report
http://slidepdf.com/reader/full/home-dex-report 3/20
North San Diego County HomeDexTM October 2010 Summary ReportSingle-Family Detached Homes
Prepared for the North San Diego County Association of REALTORS® by Robert Brown, Ph.D.Department of Economics California State University, San Marcos. Inquiries may be directed to Robert [email protected] or 760-750-4196; or Lynn Sullivan, NSDCAR Communications Director: [email protected] or760-734-3976. Data source: Sandicor, Inc. Comparisons are not based on identical samples of homes sold and do notimply statistical significance.
1 of 8
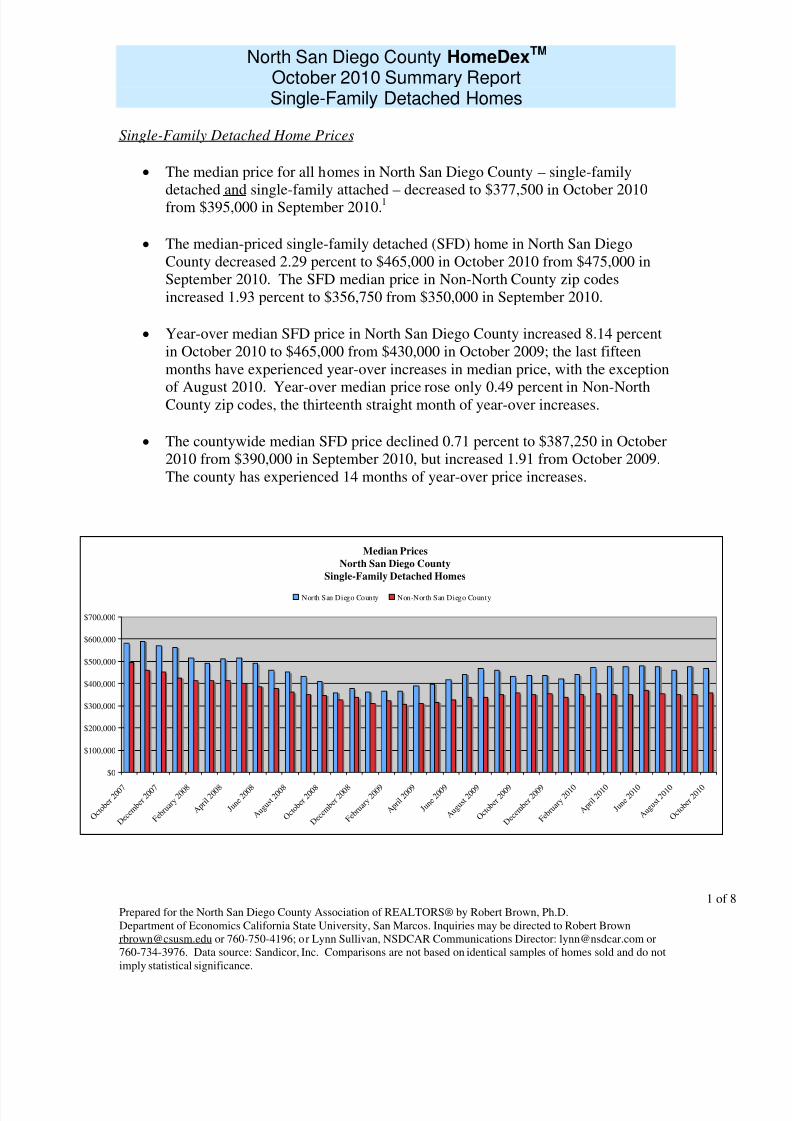
Single-Family Detached Home Prices
• The median price for all homes in North San Diego County – single-family
detached and single-family attached – decreased to $377,500 in October 2010from $395,000 in September 2010.1
• The median-priced single-family detached (SFD) home in North San DiegoCounty decreased 2.29 percent to $465,000 in October 2010 from $475,000 inSeptember 2010. The SFD median price in Non-North County zip codesincreased 1.93 percent to $356,750 from $350,000 in September 2010.
• Year-over median SFD price in North San Diego County increased 8.14 percentin October 2010 to $465,000 from $430,000 in October 2009; the last fifteenmonths have experienced year-over increases in median price, with the exception
of August 2010. Year-over median price rose only 0.49 percent in Non-NorthCounty zip codes, the thirteenth straight month of year-over increases.
• The countywide median SFD price declined 0.71 percent to $387,250 in October2010 from $390,000 in September 2010, but increased 1.91 from October 2009.The county has experienced 14 months of year-over price increases.
Median Prices
North San Diego County
Single-Family Detached Homes
$0
$100,000
$200,000
$300,000
$400,000
$500,000
$600,000
$700,000
O c t o b e r 2 0 0 7
D e c e m b e r 2 0 0 7
F e b r u
a r y 2 0 0 8
A p r i l 2 0 0 8
J u n e 2 0 0 8
A u g u s t 2 0 0 8
O c t o b e r 2 0 0 8
D e c e m b e r 2 0 0 8
F e b r u
a r y 2 0 0 9
A p r i l 2 0 0 9
J u n e 2 0 0 9
A u g u s t 2 0 0 9
O c t o b e r 2 0 0 9
D e c e m b e r 2 0 0 9
F e b r u
a r y 2 0 1 0
A p r i l 2 0 1 0
J u n e 2 0 1 0
A u g u s t 2 0 1 0
O c t o b e r 2 0 1 0
North San Diego County Non-North San Diego County
8/8/2019 Home Dex Report
http://slidepdf.com/reader/full/home-dex-report 4/20
North San Diego County HomeDexTM October 2010 Summary ReportSingle-Family Detached Homes
Prepared for the North San Diego County Association of REALTORS® by Robert Brown, Ph.D.Department of Economics California State University, San Marcos. Inquiries may be directed to Robert [email protected] or 760-750-4196; or Lynn Sullivan, NSDCAR Communications Director: [email protected] or760-734-3976. Data source: Sandicor, Inc. Comparisons are not based on identical samples of homes sold and do notimply statistical significance.
2 of 8
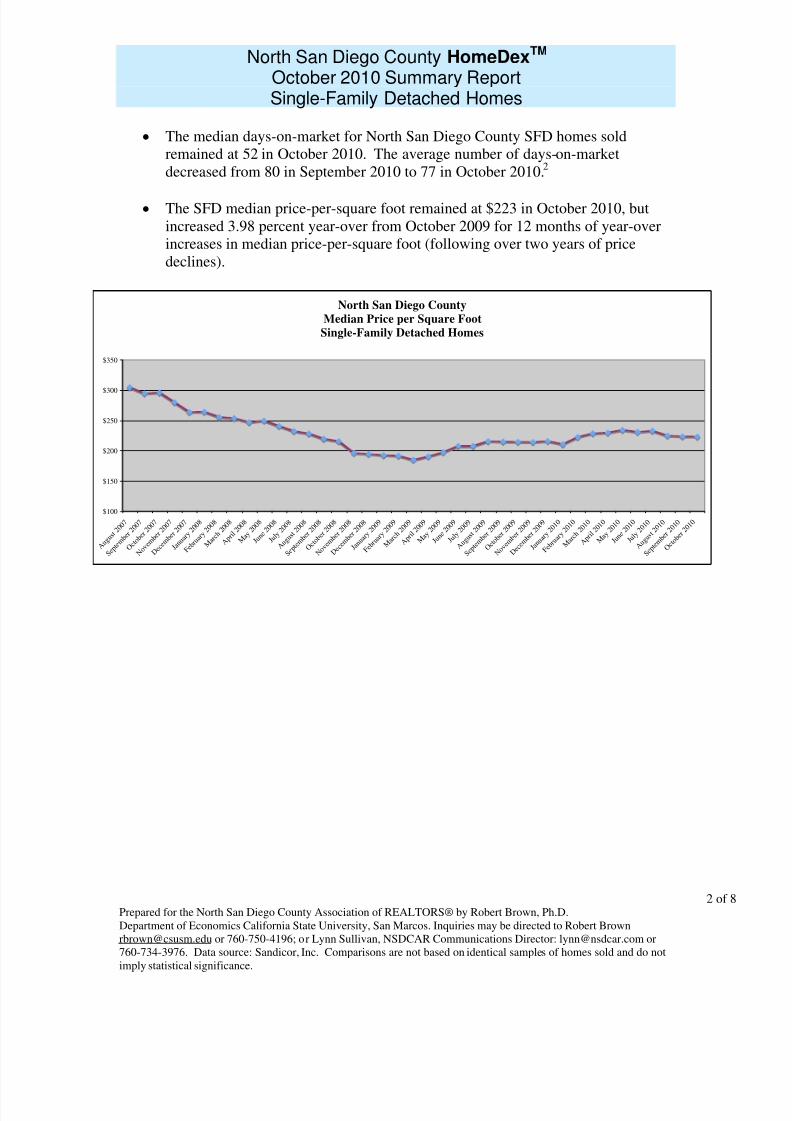
• The median days-on-market for North San Diego County SFD homes soldremained at 52 in October 2010. The average number of days-on-marketdecreased from 80 in September 2010 to 77 in October 2010.2
• The SFD median price-per-square foot remained at $223 in October 2010, butincreased 3.98 percent year-over from October 2009 for 12 months of year-overincreases in median price-per-square foot (following over two years of pricedeclines).
North San Diego County
Median Price per Square Foot
Single-Family Detached Homes
$100
$150
$200
$250
$300
$350
A u g u s t 2 0 0 7
S e p t e m b e r 2 0 0 7
O c t o b e r 2 0 0 7
N o v e m b e r 2 0 0 7
D e c e m b e r 2 0 0 7
J a n u a r y 2 0 0 8
F e b r u
a r y 2 0 0 8
M a r c h 2 0 0 8
A p r i l 2 0 0 8
M a y 2 0 0 8
J u n e 2 0 0 8
J u l y 2 0 0 8
A u g u s t 2 0 0 8
S e p t e m b e r 2 0 0 8
O c t o b e r 2 0 0 8
N o v e m b e r 2 0 0 8
D e c e m b e r 2 0 0 8
J a n u a r y 2 0 0 9
F e b r u
a r y 2 0 0 9
M a r c h 2 0 0 9
A p r i l 2 0 0 9
M a y 2 0 0 9
J u n e 2 0 0 9
J u l y 2 0 0 9
A u g u s t 2 0 0 9
S e p t e m b e r 2 0 0 9
O c t o b e r 2 0 0 9
N o v e m b e r 2 0 0 9
D e c e m b e r 2 0 0 9
J a n u a r y 2 0 1 0
F e b r u
a r y 2 0 1 0
M a r c h 2 0 1 0
A p r i l 2 0 1 0
M a y 2 0 1 0
J u n e 2 0 1 0
J u l y 2 0 1 0
A u g u s t 2 0 1 0
S e p t e m b e r 2 0 1 0
O c t o b e r 2 0 1 0
8/8/2019 Home Dex Report
http://slidepdf.com/reader/full/home-dex-report 5/20
North San Diego County HomeDexTM October 2010 Summary ReportSingle-Family Detached Homes
Prepared for the North San Diego County Association of REALTORS® by Robert Brown, Ph.D.Department of Economics California State University, San Marcos. Inquiries may be directed to Robert [email protected] or 760-750-4196; or Lynn Sullivan, NSDCAR Communications Director: [email protected] or760-734-3976. Data source: Sandicor, Inc. Comparisons are not based on identical samples of homes sold and do notimply statistical significance.
3 of 8
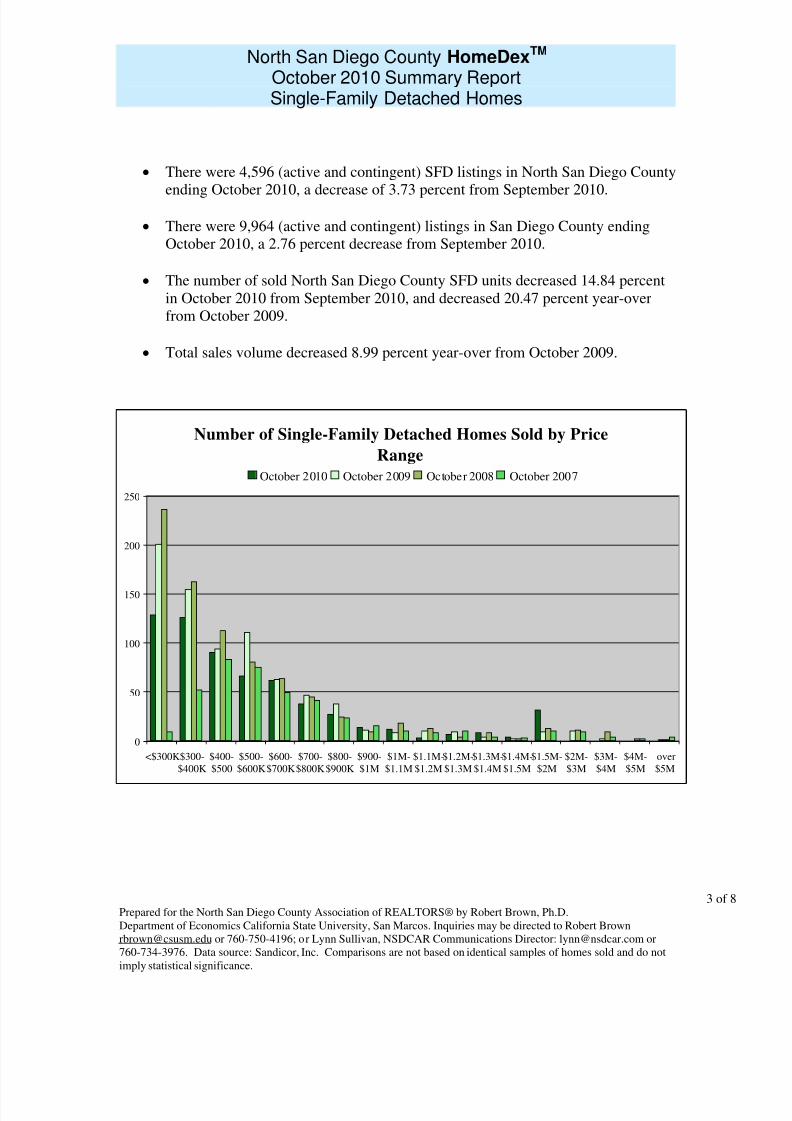
• There were 4,596 (active and contingent) SFD listings in North San Diego County
ending October 2010, a decrease of 3.73 percent from September 2010.
• There were 9,964 (active and contingent) listings in San Diego County endingOctober 2010, a 2.76 percent decrease from September 2010.
• The number of sold North San Diego County SFD units decreased 14.84 percentin October 2010 from September 2010, and decreased 20.47 percent year-overfrom October 2009.
• Total sales volume decreased 8.99 percent year-over from October 2009.
Number of Single-Family Detached Homes Sold by Price
Range
0
50
100
150
200
250
<$300K$300-$400K
$400-$500
$500-$600K
$600-$700K
$700-$800K
$800-$900K
$900-$1M
$1M-$1.1M
$1.1M-$1.2M
$1.2M-$1.3M
$1.3M-$1.4M
$1.4M-$1.5M
$1.5M-$2M
$2M-$3M
$3M-$4M
$4M-$5M
over$5M
October 2010 October 2009 October 2008 October 2007

8/8/2019 Home Dex Report
http://slidepdf.com/reader/full/home-dex-report 6/20
North San Diego County HomeDexTM October 2010 Summary ReportSingle-Family Detached Homes
Prepared for the North San Diego County Association of REALTORS® by Robert Brown, Ph.D.Department of Economics California State University, San Marcos. Inquiries may be directed to Robert [email protected] or 760-750-4196; or Lynn Sullivan, NSDCAR Communications Director: [email protected] or760-734-3976. Data source: Sandicor, Inc. Comparisons are not based on identical samples of homes sold and do notimply statistical significance.
4 of 8
Housing Affordability – Single-Family Detached Homes
• The monthly payment – including principal, interest, property taxes, and insurance
– for the median-priced SFD home in North San Diego County decreased to$2,462 in October 2010 (based on a conventional mortgage) from $2,520 inSeptember 2010. The monthly payment for the median-priced SFD home in Non-North San Diego County rose from $1,853 in September 2010 to $1,889 inOctober 2010.
• The percent of San Diego County households that could afford the median-pricedSFD home in North County increased from 26 percent in September 2010 to 27percent in October 2010, according to the North San Diego County HomeDex
TM.
Across Non-North County zip codes, the affordability percentage declined to 39percent in October 2010 from 40 percent in September 2010.3 The HomeDexTM
affordability percentage was 28 percent in North County and 37 percent in Non-North San Diego County zip codes in October 2009.
• The HomeDexTM affordability percentage for all homes in North San DiegoCounty – single-family detached and single-family attached together – rose from35 percent in September 2010 to 37 percent in October 2010.
Home Affordability Percentage
Single-Family Detached
0%
5%
10%
15%
20%
25%
30%
35%
40%
45%
O c t o b e r
2 0 0 8
N o v e m b e r
2 0 0 8
D e c e m b e r
2 0 0 8
J a n u a r y
2 0 0 9
F e b r u a r y
2 0 0 9
M a r c h 2 0 0 9
A p r i l 2 0 0 9
M a y 2 0 0 9
J u n e 2 0 0 9
J u l y 2 0 0 9
A u g u s t
2 0 0 9
S e p t e m b e r
2 0 0 9
O c t o b e r
2 0 0 9
N o v e m b e r
2 0 0 9
D e c e m b e r
2 0 0 9
J a n u a r y
2 0 1 0
F e b r u a r y
2 0 1 0
M a r c h 2 0 1 0
A p r i l 2 0 1 0
M a y 2 0 1 0
J u n e 2 0 1 0
J u l y 2 0 1 0
A u g u s t
2 0 1 0
S e p t e m b e r
2 0 1 0
O c t o b e r
2 0 1 0
North San Diego County Non-North San Diego County

8/8/2019 Home Dex Report
http://slidepdf.com/reader/full/home-dex-report 7/20
North San Diego County HomeDexTM October 2010 Summary ReportSingle-Family Detached Homes
Prepared for the North San Diego County Association of REALTORS® by Robert Brown, Ph.D.Department of Economics California State University, San Marcos. Inquiries may be directed to Robert [email protected] or 760-750-4196; or Lynn Sullivan, NSDCAR Communications Director: [email protected] or760-734-3976. Data source: Sandicor, Inc. Comparisons are not based on identical samples of homes sold and do notimply statistical significance.
5 of 8
Single-Family Detached Home Prices and Affordability by North County Zip Codes
4
North San Diego County
Single-Family Detached
Homes
October 2010
$0
$200,000
$400,000
$600,000
$800,000
$1,000,000
$1,200,000
$1,400,000
$1,600,000
$1,800,000
$2,000,000
$2,200,000
$2,400,000
$2,600,000
9 2 0 6 7 -
R A N C H O S A N T
A F E
9 2 0 1 4 -
D E L
M A R
9 2 0 7 5 -
S O L A N A
B E A
C H
9 2 0 2 4 -
E N C I N I T A S
9 2 1 3 0 -
C A R M E L
V A L L E Y
9 2 0 9 1 -
R A N C H O S A N T
A F E
9 2 0 0 7 -
C A R D I F F
B Y T H E S E A
9 2 1 2 7 -
R A N C H O B E R N
A R D O
9 2 0 1 1 -
C A R L S B A D
9 2 0 0 9 -
C A R L S B A D
9 2 0 1 0 -
C A R L S B A D
9 2 0 2 9 -
E S C O N D I D O
9 2 1 2 9 -
R A N C H O P E N A S Q U I T O S
9 2 0 0 8 -
C A R L S B A D
9 2 1 2 8 -
R A N C H O B E R N
A R D O
9 2 0 6 4 -
P O W A Y
9 2 0 7 8 -
S A N M A R C O S
9 2 0 0 3 -
B O N S A L L
9 2 0 8 2 -
V A L L E Y C E N T E R
9 2 0 2 6 -
E S C O N D I D O
9 2 0 2 5 -
E S C O N D I D O
9 2 0 6 9 -
S A N M A R C O S
9 2 0 8 1 -
V I S T
A
9 2 0 5 6 -
O C E A N S I D
E
9 2 0 8 4 -
V I S T
A
9 2 0 2 8 -
F A L L B R
O O K
9 2 0 5 4 -
O C E A N S I D
E
9 2 0 6 5 -
R A M
O N A
9 2 0 2 7 -
E S C O N D I D O
9 2 0 5 7 -
O C E A N S I D
E
9 2 0 8 3 -
V I S T
A
9 2 0 5 9 -
P A L A
North San Diego County
Housing Affordability Percentages by Zip Code
Single-Family Detached Homes
October 2010
0%
10%
20%
30%
40%
50%
60%
9 2 0 6 7 -
R A N C H O S A N T
A F E
9 2 0 1 4 -
D E L
M A R
9 2 0 7 5 -
S O L A N A
B E A
C H
9 2 0 2 4 -
E N C I N I T A S
9 2 1 3 0 -
C A R M E L
V A L L E Y
9 2 0 9 1 -
R A N C H O S A N T
A F E
9 2 0 0 7 -
C A R D I F F
B Y T H E S E A
9 2 1 2 7 -
R A N C H O B E R N
A R D O
9 2 0 1 1 -
C A R L S B A D
9 2 0 0 9 -
C A R L S B A D
9 2 0 1 0 -
C A R L S B A D
9 2 0 2 9 -
E S C O N D I D O
9 2 1 2 9 -
R A N C H O P E N A S Q U I T O S
9 2 0 0 9 -
C A R L S B A D
9 2 1 2 8 -
R A N C H O B E R N
A R D O
9 2 0 6 4 -
P O W A Y
9 2 0 7 8 -
S A N M A
R C O S
9 2 0 0 3 -
B O N S A L L
9 2 0 8 2 -
V A L L E Y C E N T E R
9 2 0 2 6 -
E S C O N D I D O
9 2 0 2 5 -
E S C O N D I D O
9 2 0 6 9 -
S A N M A
R C O S
9 2 0 8 1 -
V I S T
A
9 2 0 5 6 -
O C E A N S I D
E
9 2 0 8 4 -
V I S T
A
9 2 0 2 8 -
F A L L B R
O O K
9 2 0 5 4 -
O C E A N S I D
E
9 2 0 6 5 -
R A M
O N A
9 2 0 2 7 -
E S C O N D I D O
9 2 0 5 7 -
O C E A N S I D
E
9 2 0 8 3 -
V I S T
A
9 2 0 5 9 -
P A L A
8/8/2019 Home Dex Report
http://slidepdf.com/reader/full/home-dex-report 8/20
North San Diego County HomeDexTM October 2010 Summary ReportSingle-Family Detached Homes
Prepared for the North San Diego County Association of REALTORS® by Robert Brown, Ph.D.Department of Economics California State University, San Marcos. Inquiries may be directed to Robert [email protected] or 760-750-4196; or Lynn Sullivan, NSDCAR Communications Director: [email protected] or760-734-3976. Data source: Sandicor, Inc. Comparisons are not based on identical samples of homes sold and do notimply statistical significance.
6 of 8
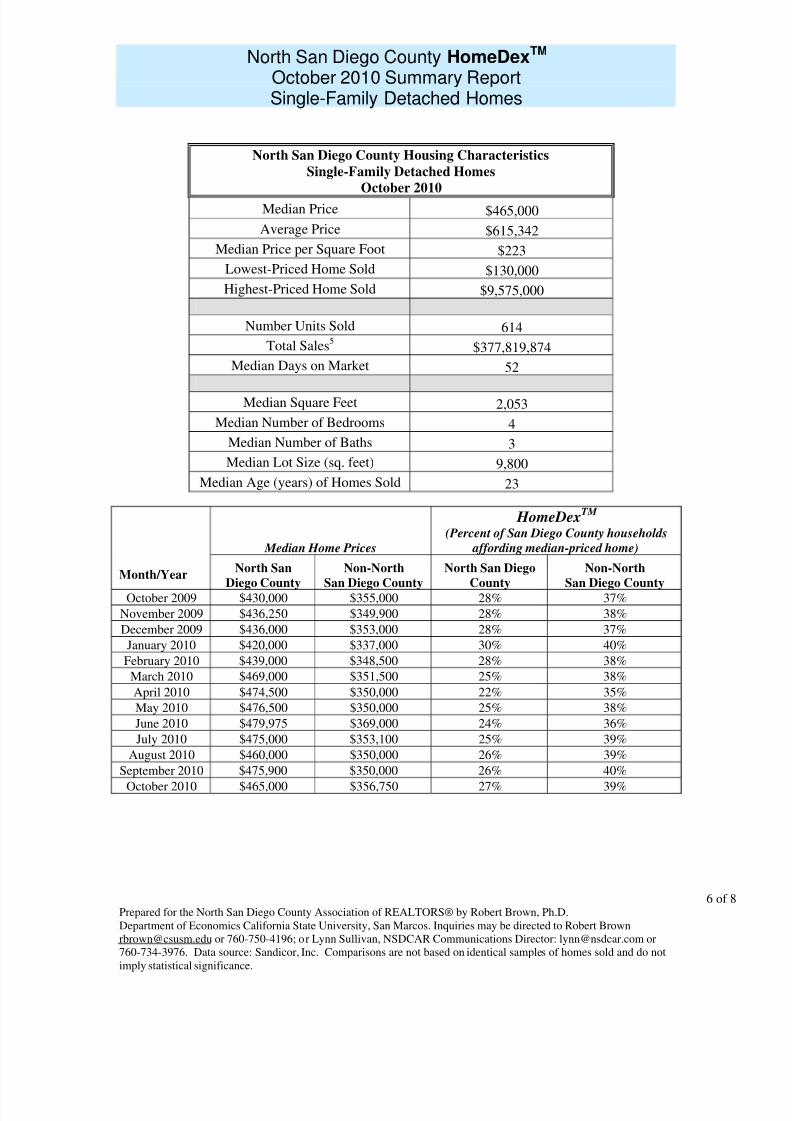
Median Home Prices
HomeDexTM
(Percent of San Diego County households
affording median-priced home)
Month/YearNorth San
Diego County
Non-North
San Diego County
North San Diego
County
Non-North
San Diego County
October 2009 $430,000 $355,000 28% 37%
November 2009 $436,250 $349,900 28% 38%
December 2009 $436,000 $353,000 28% 37%
January 2010 $420,000 $337,000 30% 40%
February 2010 $439,000 $348,500 28% 38%
March 2010 $469,000 $351,500 25% 38%
April 2010 $474,500 $350,000 22% 35%
May 2010 $476,500 $350,000 25% 38%
June 2010 $479,975 $369,000 24% 36%
July 2010 $475,000 $353,100 25% 39%
August 2010 $460,000 $350,000 26% 39%
September 2010 $475,900 $350,000 26% 40%
October 2010 $465,000 $356,750 27% 39%
North San Diego County Housing Characteristics
Single-Family Detached Homes
October 2010
Median Price $465,000
Average Price $615,342
Median Price per Square Foot $223
Lowest-Priced Home Sold $130,000
Highest-Priced Home Sold $9,575,000
Number Units Sold 614
Total Sales5 $377,819,874
Median Days on Market 52
Median Square Feet 2,053
Median Number of Bedrooms 4
Median Number of Baths 3
Median Lot Size (sq. feet) 9,800
Median Age (years) of Homes Sold 23

8/8/2019 Home Dex Report
http://slidepdf.com/reader/full/home-dex-report 9/20
North San Diego County HomeDexTM October 2010 Summary ReportSingle-Family Detached Homes
Prepared for the North San Diego County Association of REALTORS® by Robert Brown, Ph.D.Department of Economics California State University, San Marcos. Inquiries may be directed to Robert [email protected] or 760-750-4196; or Lynn Sullivan, NSDCAR Communications Director: [email protected] or760-734-3976. Data source: Sandicor, Inc. Comparisons are not based on identical samples of homes sold and do notimply statistical significance.
7 of 8
North San Diego County Zip
Codes
Oct.
2010
Afford-
ability
Oct.
2009
Afford-
ability
Oct. 2010
Median
Price
% Price
Chg. From
Oct. 2009
Oct.
2010
Sold
Listings
Median
Days on
Market
Oct.
2010
Med. Days
on Market
% Chg.
from Sep.
2010
92003 - BONSALL 30% 6% $435,000 -56% 5 74 51%
92007 - CARDIFF 10% 6% $780,000 -22% 2 61 -52%
92008 - CARLSBAD 22% 10% $542,500 -21% 12 60 90%
92009 - CARLSBAD 13% 12% $679,995 4% 32 49 5%
92010 - CARLSBAD 18% 20% $600,500 14% 4 44 1%
92011 - CARLSBAD 11% 9% $725,000 -7% 19 114 73%
92014 - DEL MAR 4% 3% $1,161,000 -8% 4 82 2%
92024 - ENCINITAS 7% 9% $987,000 30% 30 58 0%
92025 - ESCONDIDO 37% 45% $372,500 24% 22 47 18%
92026 - ESCONDIDO 35% 43% $395,000 27% 20 91 62%
92027 - ESCONDIDO 47% 53% $304,000 22% 36 36 -29%
92028 - FALLBROOK 44% 39% $326,000 -3% 42 59 2%92029 - ESCONDIDO 19% 22% $585,000 19% 13 38 -62%
92054 - OCEANSIDE 44% 42% $325,000 2% 16 52 -29%
92056 - OCEANSIDE 39% 36% $355,000 0% 31 51 9%
92057 - OCEANSIDE 49% 39% $297,500 -11% 38 35 -30%
92058 - OCEANSIDE 49% - $300,500 - 9 35 -
92059 - PALA 57% 53% $245,000 -2% 1 6 -89%
92061 - PAUMA VALLEY - - - - 0 - -
92064 - POWAY 25% 25% $492,500 9% 32 55 -27%
92065 - RAMONA 44% 42% $324,750 2% 16 50 5%
92067 - RANCHO SANTA FE 0% 2% $2,521,298 26% 10 79 -47%
92068 - SAN LUIS REY - - - - 0 - -
92069 - SAN MARCOS 38% 35% $370,500 1% 28 61 -15%
92075 - SOLANA BEACH 6% 2% $1,045,500 -40% 4 70 -7%
92078 - SAN MARCOS 27% 22% $460,000 -9% 29 60 -8%
92081 - VISTA 39% 43% $357,500 15% 14 38 -1%
92082 - VALLEY CENTER 31% 36% $425,000 18% 13 37 -40%
92083 - VISTA 57% 46% $247,000 -16% 21 106 361%
92084 - VISTA 43% 41% $334,050 4% 16 38 -10%
92091 - RANCHO SANTA FE 9% - $829,000 - 3 75 -
92127 - RANCHO BERNARDO 10% 9% $740,000 -3% 35 50 -23%
92128 - RANCHO BERNARDO 24% 17% $499,500 -12% 20 71 33%
92129 - RANCHO
PENASQUITOS 21% 19% $554,250 1% 20 31 -33%92130 - CARMEL VALLEY 7% 8% $942,500 9% 26 49 62%
"Foreclosures" refers to the number of unique addresses in some stage of foreclosure in

8/8/2019 Home Dex Report
http://slidepdf.com/reader/full/home-dex-report 10/20
North San Diego County HomeDexTM October 2010 Summary ReportSingle-Family Detached Homes
Prepared for the North San Diego County Association of REALTORS® by Robert Brown, Ph.D.Department of Economics California State University, San Marcos. Inquiries may be directed to Robert [email protected] or 760-750-4196; or Lynn Sullivan, NSDCAR Communications Director: [email protected] or760-734-3976. Data source: Sandicor, Inc. Comparisons are not based on identical samples of homes sold and do notimply statistical significance.
8 of 8
1 The median is the middle-priced home sold: Half the homes sold for more than the median, and half sold for less.2 The reported days-on-market is defined as the time between the listing and sale of a property. In the event that aproperty is re-listed then days-on-market is calculated from the new list date to sale date; therefore, the occurrence of
re-listing biases downward the reported days-on-market.3 HomeDexTM affordability percentages assume homeowners place 20 percent down and spend no more than a third of their income on housing, which in North County during October 2010 required an annual income of $98,474 for themedian-priced SFD home – an amount earned by 27 percent of San Diego County households.4 Monthly median prices and HomeDexTM household affordability percentages reported for some zip codes werecalculated from small numbers of sold listings; reported numbers may be sensitive to price variations and do not implystatistical significance.5 Total SFD sales in North County were $439,331,101 in September 2010 and $401,736,570 in October 2009.
8/8/2019 Home Dex Report
http://slidepdf.com/reader/full/home-dex-report 11/20
North San Diego County HomeDexTM October 2010 Summary ReportSingle-Family Attached Homes
Prepared for the North San Diego County Association of REALTORS® by Robert Brown, Ph.D.Department of Economics California State University, San Marcos. Inquiries may be directed to Robert [email protected]; 760-750-4196 or Lynn Sullivan, NSDCAR Communications Director: [email protected] or760-734-3976. Data source: Sandicor, Inc. Comparisons are not based on identical samples of homes sold and donot imply statistical significance.
1 of 7
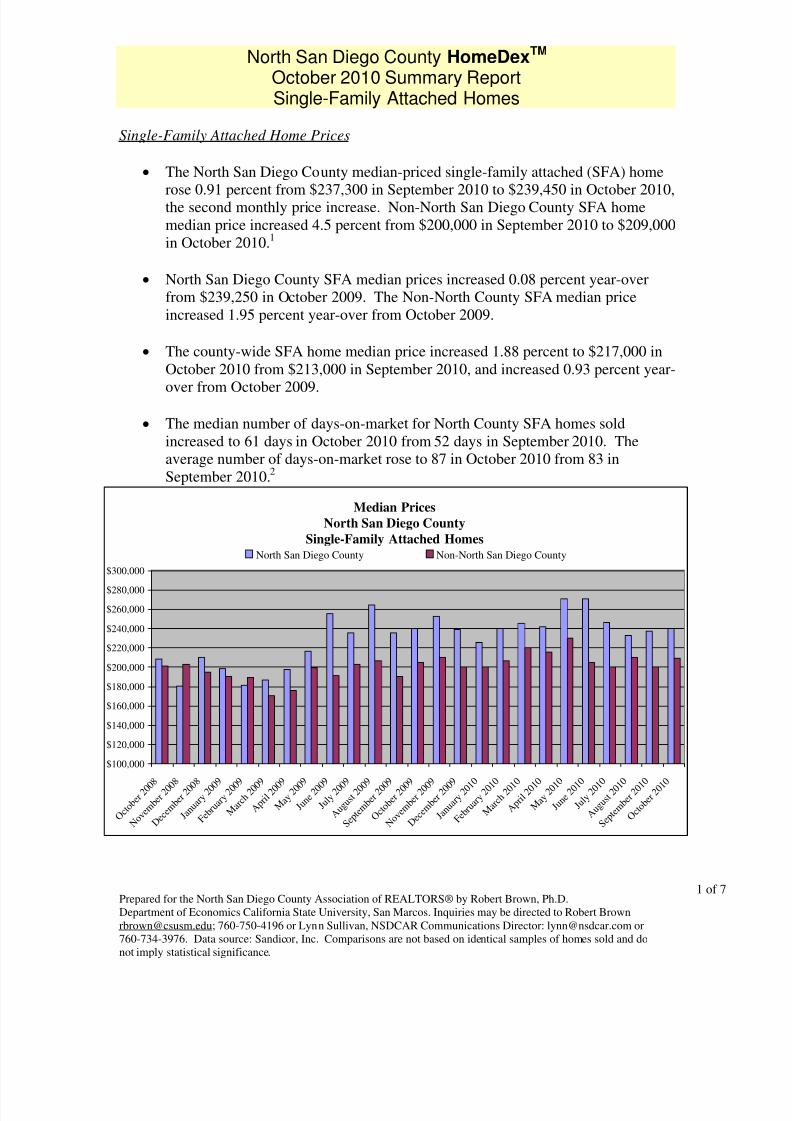
Single-Family Attached Home Prices
• The North San Diego County median-priced single-family attached (SFA) home
rose 0.91 percent from $237,300 in September 2010 to $239,450 in October 2010,the second monthly price increase. Non-North San Diego County SFA homemedian price increased 4.5 percent from $200,000 in September 2010 to $209,000in October 2010.1
• North San Diego County SFA median prices increased 0.08 percent year-overfrom $239,250 in October 2009. The Non-North County SFA median priceincreased 1.95 percent year-over from October 2009.
• The county-wide SFA home median price increased 1.88 percent to $217,000 inOctober 2010 from $213,000 in September 2010, and increased 0.93 percent year-
over from October 2009.
• The median number of days-on-market for North County SFA homes soldincreased to 61 days in October 2010 from 52 days in September 2010. Theaverage number of days-on-market rose to 87 in October 2010 from 83 inSeptember 2010.2
Median Prices
North San Diego County
Single-Family Attached Homes
$100,000
$120,000
$140,000
$160,000
$180,000
$200,000
$220,000
$240,000
$260,000
$280,000
$300,000
O c t o b e r 2 0 0 8
N o v e m b e r 2 0 0 8
D e c e m b e r 2 0 0 8
J a n u a r y 2 0 0 9
F e b r u
a r y 2 0 0 9
M a r c h
2 0 0 9 A p r i l 2 0 0 9 M a
y 2 0 0 9 J u n
e 2 0 0 9 J u l y 2 0 0 9
A u g u s t 2 0 0 9
S e p t e m b e r 2 0 0 9
O c t o b e r 2 0 0 9
N o v e m b e r 2 0 0 9
D e c e m b e r 2 0 0 9
J a n u a r y 2 0 1 0
F e b r u
a r y 2 0 1 0
M a r c h
2 0 1 0 A p r i l 2 0 1 0 M a
y 2 0 1 0 J u n
e 2 0 1 0 J u l y 2 0 1 0
A u g u s t 2 0 1 0
S e p t e m b e r 2 0 1 0
O c t o b e r 2 0 1 0
North San Diego County Non-North San Diego County

8/8/2019 Home Dex Report
http://slidepdf.com/reader/full/home-dex-report 12/20
North San Diego County HomeDexTM October 2010 Summary ReportSingle-Family Attached Homes
Prepared for the North San Diego County Association of REALTORS® by Robert Brown, Ph.D.Department of Economics California State University, San Marcos. Inquiries may be directed to Robert [email protected]; 760-750-4196 or Lynn Sullivan, NSDCAR Communications Director: [email protected] or760-734-3976. Data source: Sandicor, Inc. Comparisons are not based on identical samples of homes sold and donot imply statistical significance.
2 of 7
• The number of sold SFA units increased monthly by 5.79 percent in October 2010after an 11.6 percent decline in September 2010. In Non-North County the
number of sold units decreased 8.59 percent from September 2010, the fourthmonthly decline in sales.
• Year-over sales decreased 12.74 percent from October 2009, compared to a 21.04percent year-over decline in September 2009 in North County; in Non-NorthCounty zip codes, year-over decreased 29.04 percent.
• SFA listings (active and contingent) in North San Diego County decreased from1,719 ending September 2010 to 1,683 ending October 2010. San Diego CountySFA listings (active and contingent) decreased to 5,379 at the end of October2010 from 5,471 in September 2010.
North San Diego County
Single-Family Attached Homes Sold by Price
0
20
40
60
80
100
120
140
160
180
<$200K $200-
$300K
$300-
$400K
$400-
$500
$500-
$600K
$600-
$700K
$700-
$800K
$800-
$900K
$900-
$1M
$1M-
$1.1M
$1.1M-
$1.2M
$1.2M-
$1.3M
$1.3M-
$1.4M
$1.4M-
$1.5M
$1.5M+
October 2010 October 2009 October 2008 October 2007

8/8/2019 Home Dex Report
http://slidepdf.com/reader/full/home-dex-report 13/20
North San Diego County HomeDexTM October 2010 Summary ReportSingle-Family Attached Homes
Prepared for the North San Diego County Association of REALTORS® by Robert Brown, Ph.D.Department of Economics California State University, San Marcos. Inquiries may be directed to Robert [email protected]; 760-750-4196 or Lynn Sullivan, NSDCAR Communications Director: [email protected] or760-734-3976. Data source: Sandicor, Inc. Comparisons are not based on identical samples of homes sold and donot imply statistical significance.
3 of 7
Housing Affordability – Single-Family Attached Homes
• The monthly payment – including principal, interest, property taxes, and
insurance – for the median-priced SFA home in North County increased to $1,268in October 2010 from $1,256 in September 2010. The monthly payment for themedian-priced SFA home in Non-North San Diego County zip codes increased to$1,107 in October 2010 from $1,059 in September 2010.
• The percent of San Diego County households able to afford the median-pricedSFA home remained at 58 percent in October 2010.3 The single-family attachedhome affordability level for Non-North San Diego County zip codes declinedfrom 66 percent in September 2010 to 64 percent in October 2010.
• 55 percent of county households could afford the median-priced SFA home in
North San Diego County in October 2009, compared to 62 percent in Non-NorthCounty zip codes.
Housing Affordability Percentages
Single-Family Attached Homes
0%
10%
20%
30%
40%
50%
60%
70%
O c t o b
e r 2 0 0 8
N o v e m b
e r 2 0 0 8
D e c e m b
e r 2 0 0 8
J a n u
a r y 2
0 0 9
F e b r
u a r y
2 0 0 9
M a r c h
2 0 0 9
A p r i l
2 0 0 9
M a y
2 0 0 9
J u n e
2 0 0 9
J u l y
2 0 0 9
A u g u
s t 2 0
0 9
S e p t e
m b e r
2 0 0 9
O c t o b
e r 2 0 0 9
N o v e m b
e r 2 0 0 9
D e c e m b
e r 2 0 0 9
J a n u
a r y 2
0 1 0
F e b r
u a r y
2 0 1 0
M a r c h
2 0 1 0
A p r i l
2 0 1 0
M a y
2 0 1 0
J u n e
2 0 1 0
J u l y
2 0 1 0
A u g u
s t 2 0 1 0
S e p t e
m b e r
2 0 1 0
O c t o b
e r 2 0 1 0
North San Diego County Non-North San Diego County

8/8/2019 Home Dex Report
http://slidepdf.com/reader/full/home-dex-report 14/20
North San Diego County HomeDexTM October 2010 Summary ReportSingle-Family Attached Homes
Prepared for the North San Diego County Association of REALTORS® by Robert Brown, Ph.D.Department of Economics California State University, San Marcos. Inquiries may be directed to Robert [email protected]; 760-750-4196 or Lynn Sullivan, NSDCAR Communications Director: [email protected] or760-734-3976. Data source: Sandicor, Inc. Comparisons are not based on identical samples of homes sold and donot imply statistical significance.
4 of 7
Single-Family Attached Home Prices and Affordability by North County Zip Codes4
North San Diego County
October 2010 Median Prices
Single-Family Attached Homes
$0
$100,000
$200,000
$300,000
$400,000
$500,000
$600,000
$700,000
9 2 0 9 1 -
R A N C H O
S A N T
A F E
9 2 0 7 5 -
S O L A N A
B E A
C H
9 2 0 1 4 - D E L
M A R
9 2 0 2 4 - E
N C I N I T A S
9 2 0 1 1 - C
A R L S B A D
9 2 1 3 0 -
C A R M E
L V A L L E Y
9 2 0 0 7 -
C A R D I F F B
Y T H E S E A
9 2 0 0 8 - C
A R L S B A D
9 2 0 5 4 - O
C E A N S I D E
9 2 0 0 9 - C
A R L S B A D
9 2 0 7 8 -
S A N
M A R C O S
9 2 0 6 4 -
P O W A Y
9 2 1 2 8 -
R A N
C H O B E R N A
R D O
9 2 0 2 8 - F A
L L B R
O O K
9 2 1 2 7 -
R A N C H O B E R N A R D
O
9 2 0 1 0 - C
A R L S B A D
9 2 1 2 9 -
R A N
C H O P E N
A S Q U I T O S
9 2 0 5 6 - O
C E A N S I D E
9 2 0 8 1
- V I S T A
9 2 0 2 9 - E S
C O N D
I D O
9 2 0 5 7 - O
C E A N S I D E
9 2 0 6 9 -
S A N
M A R C O S
9 2 0 8 4
- V I S T A
9 2 0 8 3
- V I S T A
9 2 0 2 5 - E S
C O N D I D O
9 2 0 2 6 - E S
C O N D
I D O
9 2 0 2 7 - E S
C O N D
I D O
9 2 0 0 3 -
B O N S A L L
9 2 0 6 5 - R A M
O N A
Housing Affordability
Percentages
North San Diego County
October 2010
0%
10%
20%
30%
40%
50%
60%
70%
80%
90%
9 2 0 9 1 -
R A N C H O S A N T
A F E
9 2 0 7 5 -
S O L A N A
B E A
C H
9 2 0 1 4 -
D E L
M A R
9 2 0 2 4 -
E N C I N I T A S
9 2 0 1 1 -
C A R L S B
A D
9 2 1 3 0 -
C A R M
E L V A L L E Y
9 2 0 0 7 -
C A R D I F F
B Y T H E S E A
9 2 0 0 9 -
C A R L S B
A D
9 2 0 5 4 -
O C E A N S I D
E
9 2 0 0 9 -
C A R L S B
A D
9 2 0 7 8 -
S A N M A
R C O S
9 2 0 6 4 -
P O W A Y
9 2 1 2 8 -
R A N C H O
B E R N
A R D O
9 2 0 2 8 -
F A L L B R
O O K
9 2 1 2 7 -
R A N C H O
B E R N
A R D O
9 2 0 1 0 -
C A R L S B
A D
9 2 1 2 9
- R A N C H O P E N A S Q U I T O S
9 2 0 5 6 -
O C E A N S I D
E
9 2 0 8 1 -
V I S T
A
9 2 0 5 7 -
O C E A N S I D
E
9 2 0 2 9 -
E S C O N D I D O
9 2 0 6 9 -
S A N M A
R C O S
9 2 0 8 4 -
V I S T
A
9 2 0 8 3 -
V I S T
A
9 2 0 2 5 -
E S C O N D I D O
9 2 0 2 6 -
E S C O N D I D O
9 2 0 2 7 -
E S C O N D I D O
9 2 0 0 3 -
B O N S A L L
9 2 0 6 5 -
R A M O
N A

8/8/2019 Home Dex Report
http://slidepdf.com/reader/full/home-dex-report 15/20
North San Diego County HomeDexTM October 2010 Summary ReportSingle-Family Attached Homes
Prepared for the North San Diego County Association of REALTORS® by Robert Brown, Ph.D.Department of Economics California State University, San Marcos. Inquiries may be directed to Robert [email protected]; 760-750-4196 or Lynn Sullivan, NSDCAR Communications Director: [email protected] or760-734-3976. Data source: Sandicor, Inc. Comparisons are not based on identical samples of homes sold and donot imply statistical significance.
5 of 7
SFA Median Home Prices HomeDex Single-Family Attached Homes
Month/Year
North San Diego
County
Non-North
San Diego County
North San Diego
County
Non-North
San Diego County
October 2009 $239,250 $205,000 55% 62%November 2009 $252,500 $210,000 52% 62%
December 2009 $238,750 $200,000 56% 65%
January 2010 $225,000 $200,000 59% 65%
February 2010 $240,000 $205,750 56% 63%
March 2010 $245,000 $220,000 55% 60%
April 2010 $241,250 $215,500 56% 61%
May 2010 $270,000 $230,000 51% 57%
June 2010 $270,000 $205,000 51% 64%
July 2010 $246,175 $200,000 56% 66%
August 2010 $232,500 $210,000 58% 63%
September 2010 $237,300 $200,000 58% 66%
October 2010 $239,450 $209,000 58% 64%
North San Diego County Housing Characteristics
Single-Family Attached Homes
October 2010
Median Price $239,450
Average Price $277,171
Median Price per Square Foot $199
Lowest-Priced Home Sold $57,500
Highest-Priced Home Sold $1,700,000
Number Units Sold 274
Total Sales5 $75,944,838
Median Days on Market 61
Median Square Feet 1,154
Median Number of Bedrooms 2
Median Number of Baths 2
Median Age (years) of Homes Sold 26

8/8/2019 Home Dex Report
http://slidepdf.com/reader/full/home-dex-report 16/20
North San Diego County HomeDexTM October 2010 Summary ReportSingle-Family Attached Homes
Prepared for the North San Diego County Association of REALTORS® by Robert Brown, Ph.D.Department of Economics California State University, San Marcos. Inquiries may be directed to Robert [email protected]; 760-750-4196 or Lynn Sullivan, NSDCAR Communications Director: [email protected] or760-734-3976. Data source: Sandicor, Inc. Comparisons are not based on identical samples of homes sold and donot imply statistical significance.
6 of 7
North San Diego County Zip
Codes
Oct.
2010
Afford-
ability6
Oct.
2009
Afford-
ability
Oct. 2010
Median
Price
% Price
Chg. From
Oct. 2009
Oct. 2010
Sold
Listings
Median
Days on
Market
Oct. 2010
Median
Days on
Market %
Chg. from
Sep. 2010
92003 - BONSALL 89% 75% $89,000 -40% 1 173 312%
92007 - CARDIFF 41% - $346,000 - 3 70 112%
92008 - CARLSBAD 48% 32% $302,000 -23% 7 105 483%
92009 - CARLSBAD 48% 48% $300,000 6% 19 66 69%
92010 - CARLSBAD 60% 40% $230,000 -30% 5 46 59%
92011 - CARLSBAD 31% 23% $424,500 -11% 6 31 -79%
92014 - DEL MAR 23% 8% $514,900 -38% 1 168 42%
92024 - ENCINITAS 31% 35% $425,000 15% 17 30 7%
92025 - ESCONDIDO 81% 79% $130,000 -1% 7 64 -36%
92026 - ESCONDIDO 86% 86% $105,000 11% 8 44 -21%
92027 - ESCONDIDO 88% 87% $93,500 4% 8 65 14%
92028 - FALLBROOK 55% 92% $256,500 283% 2 143 79%92029 - ESCONDIDO 75% - $159,000 - 2 54 -16%
92054 - OCEANSIDE 48% 48% $302,000 8% 18 59 -48%
92056 - OCEANSIDE 69% 70% $189,900 12% 21 34 26%
92057 - OCEANSIDE 75% 78% $159,000 17% 25 39 -13%
92058 - OCEANSIDE 75% - $160,000 - 16 52 -
92059 - PALA - - - - 0 - -
92061 - PAUMA VALLEY - - - - 0 - -
92064 - POWAY 55% 41% $260,000 -20% 3 112 273%
92065 - RAMONA 90% 87% $80,000 -10% 3 61 -36%
92067 - RANCHO SANTA FE - - - - 0 - -
92068 - SAN LUIS REY - - - - 0 - -
92069 - SAN MARCOS 76% 76% $154,500 6% 14 76 32%
92075 - SOLANA BEACH 15% 18% $650,000 16% 5 127 112%92078 - SAN MARCOS 51% 45% $280,000 -7% 19 43 -57%
92081 - VISTA 74% 62% $165,000 -20% 5 43 54%
92082 - VALLEY CENTER - - - - 0 - -
92083 - VISTA 80% 70% $137,500 -20% 10 48 13%
92084 - VISTA 77% 78% $150,000 13% 3 145 99%
92091 - RANCHO SANTA FE 14% 10% $665,000 -9% 3 62 -
92127 - RANCHO BERNARDO 56% 41% $252,500 -22% 6 81 -6%
92128 - RANCHO BERNARDO 55% 47% $260,000 -10% 22 70 24%
92129 - RANCHOPENASQUITOS 63% 59% $213,500 -3% 16 54 -39%
92130 - CARMEL VALLEY 34% 24% $400,000 -15% 15 99 154%

8/8/2019 Home Dex Report
http://slidepdf.com/reader/full/home-dex-report 17/20
North San Diego County HomeDexTM October 2010 Summary ReportSingle-Family Attached Homes
Prepared for the North San Diego County Association of REALTORS® by Robert Brown, Ph.D.Department of Economics California State University, San Marcos. Inquiries may be directed to Robert [email protected]; 760-750-4196 or Lynn Sullivan, NSDCAR Communications Director: [email protected] or760-734-3976. Data source: Sandicor, Inc. Comparisons are not based on identical samples of homes sold and donot imply statistical significance.
7 of 7
1 The median is the middle-priced home sold: Half the homes sold for more than the median, and half soldfor less.2
The reported days-on-market number is defined as the time between the listing and sale of a property. Inthe event that a property is re-listed then days-on-market is calculated from the new list date to sale date;the occurrence of re-listing biases downward the reported days-on-market.3 HomeDexTM affordability percentages assume homeowners place 20 percent down and spend no morethan a third of their income on housing, which in North County during October 2010 required an annualincome of $50,709 for the median-priced SFA home – an amount earned by 58 percent of San DiegoCounty households.4 Monthly median prices and HomeDexTM numbers reported for some zip codes were calculated from smallnumbers of sold listings; reported numbers may be sensitive to price variations and do not imply statisticalsignificance.5 September 2010 total SFA sales were $69,338,350 and $88,082,861 in October 2009 for North San Diego
County. 6 See footnote 3.

8/8/2019 Home Dex Report
http://slidepdf.com/reader/full/home-dex-report 18/20
North San Diego County HomeDexTM
Foreclosure Activity Report – Ending October 2010
Prepared for the North San Diego County Association of REALTORS® by Robert Brown, Ph.D.
Department of Economics California State University, San Marcos. Direct inquiries to Robert [email protected] or 760-750-4196; or Lynn Sullivan, NSDCAR Communications Director: [email protected] or760-734-3976.
North San Diego County Zip
Codes
Number of Pre-
Foreclosure
Properties1
ending
October 2010
% Chg. from
Pre-Foreclosures
ending
September 2010
Number of Bank-
Owned ending
October 2010
% Chg. from
Bank-Owned
ending
September 2010
92003 - BONSALL 21 10.53% 34 6.25%92007 - CARDIFF 15 0.00% 8 0.00%
92008 - CARLSBAD 57 -6.56% 43 -4.44%
92009 - CARLSBAD 117 -1.68% 105 14.13%
92010 - CARLSBAD 35 12.90% 51 4.08%
92011 - CARLSBAD 34 0.00% 22 -8.33%
92014 - DEL MAR 15 -11.76% 18 12.50%
92024 - ENCINITAS 85 1.19% 55 12.24%
92025 - ESCONDIDO 95 -2.06% 109 4.81%
92026 - ESCONDIDO 165 7.84% 128 0.00%
92027 - ESCONDIDO 161 -1.23% 125 6.84%
92028 - FALLBROOK 157 6.08% 163 8.67%
92029 - ESCONDIDO 69 40.82% 38 8.57%
92054 - OCEANSIDE 106 0.95% 67 -1.47%
92056 - OCEANSIDE 164 13.10% 171 0.59%
92057 - OCEANSIDE 218 -3.96% 119 -1.65%
92059 - PALA 1 0.00% 9 0.00%
92061 - PAUMA VALLEY 4 0.00% 16 0.00%
92064 - POWAY 102 3.03% 75 13.64%
92065 - RAMONA 128 9.40% 149 4.93%
92067 - RANCHO SANTA FE 20 17.65% 22 -12.00%
92068 - SAN LUIS REY 0 - 0 -
92069 - SAN MARCOS 121 -8.33% 129 9.32%
92075 - SOLANA BEACH 20 0.00% 23 9.52%92078 - SAN MARCOS 159 1.92% 78 9.86%
92081 - VISTA 61 -3.17% 41 0.00%
92082 - VALLEY CENTER 81 -3.57% 91 4.60%
92083 - VISTA 93 -7.00% 103 1.98%
92084 - VISTA 117 0.00% 94 2.17%
92091 - RANCHO SANTA FE 7 0.00% 4 33.33%
92127 - RANCHO
BERNARDO 100 -5.66% 107 52.86%
92128 - RANCHO
BERNARDO 101 -7.34% 74 5.71%
92129 - RANCHO
PENASQUITOS 107 -0.93% 48 0.00%92130 - CARMEL VALLEY 72 2.86% 54 -6.90%
TOTALS 2,808 1.12% 2,373 5.65%
8/8/2019 Home Dex Report
http://slidepdf.com/reader/full/home-dex-report 19/20
North San Diego County HomeDexTM
Foreclosure Activity Report – Ending October 2010
Prepared for the North San Diego County Association of REALTORS® by Robert Brown, Ph.D.
Department of Economics California State University, San Marcos. Direct inquiries to Robert [email protected] or 760-750-4196; or Lynn Sullivan, NSDCAR Communications Director: [email protected] or760-734-3976.
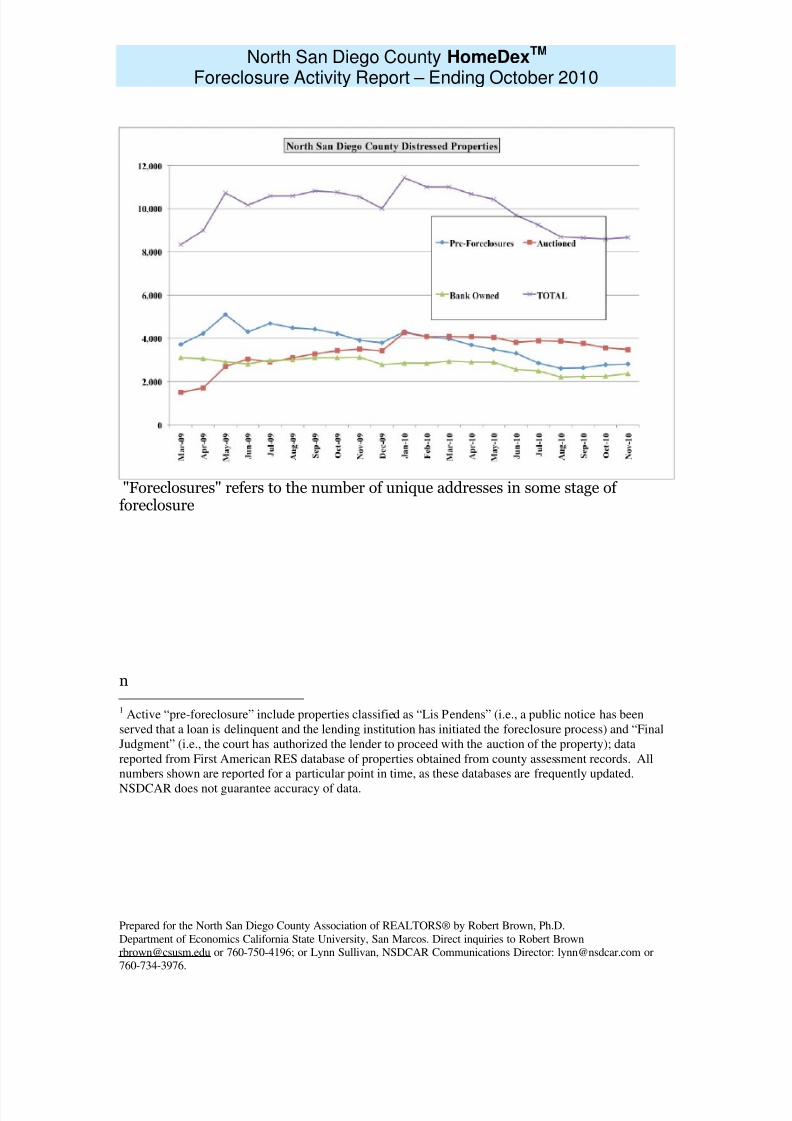
"Foreclosures" refers to the number of unique addresses in some stage of foreclosure
n
1 Active “pre-foreclosure” include properties classified as “Lis Pendens” (i.e., a public notice has been
served that a loan is delinquent and the lending institution has initiated the foreclosure process) and “Final
Judgment” (i.e., the court has authorized the lender to proceed with the auction of the property); data
reported from First American RES database of properties obtained from county assessment records. All
numbers shown are reported for a particular point in time, as these databases are frequently updated.
NSDCAR does not guarantee accuracy of data.
8/8/2019 Home Dex Report
http://slidepdf.com/reader/full/home-dex-report 20/20
Carsbad Service Center
6183 Paseo Del Norte, Ste. 150Carlsbad, CA 92009
Phone: (760) 929-2100Fax: (760) 929-2115
Carmel Valley Service Center
12707 High Bluff Drive, Suite 125San Diego, CA 92130
Phone: (858) 350-1600
Fax: (858) 350-0380
Fallbrook Service Center 126 West Beech
Fallbrook, CA 92028
Phone: (760) 728-5811Fax: (760) 728-0646
Escondido Service Center
1802 S. Escondido Blvd., Suite EEscondido, CA 92025
Phone: (760) 745-2299Fax: (760) 745-3842
“Increasing the Success and Profitability of Those We Serve”
Vista Administrative Offices &
Service Center 906 Sycamore Ave., Suite 104
Vista, CA 92081
Phone: (760) 734-3971Fax: (760) 734-3976