Historical Climate Trends in Michigan and the Great...
16
Historical Climate Trends in Michigan and the Great Lakes Region Jeffrey A. Andresen Dept. of Geography Michigan State University East Lansing, MI 48824 Prepared for the International Symposium on Climate Change in the Great Lakes Region: Decision Making Under Uncertainty Michigan State University East Lansing, MI 15-16 March, 2007
-
Upload
duongkhanh -
Category
Documents
-
view
213 -
download
0
Transcript of Historical Climate Trends in Michigan and the Great...

Historical Climate Trends in Michigan and the Great Lakes Region
Jeffrey A. Andresen Dept. of Geography
Michigan State University East Lansing, MI 48824
Prepared for the International Symposium on
Climate Change in the Great Lakes Region: Decision Making Under Uncertainty
Michigan State University
East Lansing, MI 15-16 March, 2007

Abstract Climate in Michigan and the Great Lakes region has varied markedly during past centuries and millennia as evidenced by a number of paleclimatological records. Instrumental measurement records of climatological variables during the past approximately 120 years allow more detailed identification and investigation of temporal and spatial trends in the state. Major trends across the state since the beginning of the 20th century are spatially consistent, and are temporally somewhat similar to larger scale global and hemisphere trends including warming temperatures from approximately 1900 to 1940, followed by a cooling trend from the early 1940’s to the late 1970’s which was in turn followed by a second warming trend that began around 1980 and has continued to the present. Much of the warming trend during the past 2-3 decades has been associated with warmer minimum temperatures during the winter and spring seasons. Another important trend regionally has been an increase of precipitation since approximately 1940, although this increase has leveled off somewhat during the past decade. Seasonal snowfall totals have increased significantly during the past several decades in areas of the region frequented by lake-effect snowfall, while totals have remained steady or decreased slightly in non-lake effect areas. The warmer and wetter climate of the past few decades has likely resulted in increases of some crop yields due to a reduction in water stress.

Introduction: The Current Climate The current climate of Michigan is chiefly governed by latitude, continental location, large scale circulation patterns, and by the presence of the Great Lakes, which surround the state on three sides. Day-to-day and week-to-week weather patterns are generally controlled by the position of the polar jet stream in the winter and transition seasons, with somewhat less influence in the summer, when the state is also influenced by frequent incursions of warm, humid air masses of tropical origin (Eichenlaub et. al., 1990). In general, the presence of the Great Lakes tends to moderate air temperatures in Michigan relative to locations upstream of the prevailing westerly winds (e.g. Wisconsin, southwestern Ontario), largely through an increase in cloudiness. This moderation has important agricultural implications, especially in western areas of the state where hilly topography and the cold air drainage that result allow for an extensive tree fruit industry, including apples, cherries, and peaches. The number and type of lake effect-related influences on weather and climate in Michigan and the Great Lakes region is large. Major associated climate impacts include seasonal increases or decreases in cloudiness, which in turn directly impacts insolation rates and air temperatures. In Michigan, given climatological source regions of relatively cold continental polar or arctic polar air masses in the interior sections of northern North America and the Arctic, this means a majority of lake-related cloudiness is associated with a northwesterly wind flow across the region during the fall and winter seasons. During the late spring and summer seasons when lake water temperatures are relatively cooler than air and adjacent land surfaces, the impact on cloudiness is symmetrically opposite, as the cooler water leads to relatively greater atmospheric stability, general low-level atmospheric subsidence, and to fewer clouds over and immediately downwind of the lakes. Air temperatures within Michigan are also directly impacted by the moderating effects of air flow across the lakes, with a general reduction in temperatures in downwind areas during the spring and summer seasons and an increase during the fall and winter seasons. Given enough atmospheric lift and moisture, clouds associated with wind flow over the lakes may also produce precipitation and altered precipitation patterns downwind of the lakes are among the most significant lake influences on regional climate. So-called lake effect snowfall greatly enhances the seasonal snowfall totals of areas generally within 100km of the downwind shores of the lakes. Annual weather and climate cycles in Michigan and the Great Lakes region are linked directly to changes in the location of the polar jet stream which in turn is linked to the annual cycle of solar insolation. Climatologically, the solar insolation cycle is closely related to the astronomical change of seasons, with some modifications associated with lake effect cloudiness. Solar insolation values tend reach maximum levels in late June, with annual minimum values occurring from late December into early January. Mean temperatures in Michigan typically peak in late July or early August and reach minima during late January or early February. Coldest overall temperatures tend to be observed in interior areas away from the lakes. Total annual precipitation generally increases from minimum values just under 740 mm/year in the northeastern Lower Peninsula (climatologically the driest region in the USA east of the Mississippi River) to maximum
levels of 950 mm/year or more in southwestern Lower Michigan. Total annual snowfall in the state is highly variable but generally increases from minimum values of about 90cm/year in the extreme southeastern Lower Peninsula to maximum values in the northwestern Lower and northern Upper Peninsulas, where annual mean totals in some locations exceed 550 cm/year. Seasonal snowfall totals and seasonal duration of snow cover there are climatologically among the greatest of any location in the USA east of the Rocky Mountains. In these major ‘snowbelt’ areas (e.g. the spine of the Keweenaw Peninsula), a major portion of the snowfall is associated with lake effect processes (Changnon and Jones, 1972), while over the remainder of the state the majority of snowfall is due to larger, transient scale synoptic disturbances moving through the region. Pre-Instrumental Trends Climate at a given location is defined as the, ‘average meteorological conditions in a certain area over a certain period’ (AMS, 2000). Ideally, the search for climatological patterns and trends thus requires consistent, unbiased data from as many long term sources as possible, as the magnitude of such trends may be far less than changes experienced on an annual, daily, or even hourly basis. In general, the amount and quality of data available for climatological analysis in the Great Lakes Region decreases quickly with time into the past. Routine instrumental observations began in Michigan approximately around 1820, but the number and quality of those data and as well as differences in technology with current observations before the latter half of the 19th century prevent their use in such analyses. Fortunately, while not as detailed or precise as instrumental records, there are other less direct methods of determining changes in climate. Based on fossil and other geological evidence, it is possible to demonstrate that climate in the Great Lakes Region and many other regions of the world has varied markedly over geologic time scales, ranging from humid tropical conditions during the Carboniferous and Devonian eras to frigid, glacial conditions as recently as 12,000 years ago during the end of the Pleistocene era. These major shifts are thought to be the result many factors, including tectonic drift of the continents, changes in the composition of the earth’s atmosphere, periodic changes in the earth’s tilt and orbit around the sun (Milankovitch cycles), and catastrophic singular events such as the impact of large meteorites and major volcanic eruptions. More substantial paleoclimatological evidence of regional changes in climate is available since the end of the last major glacial epoch, or about 12,000 years before present. Paleoclimatological data are typically gathered from sources such as pollen and other limnological indicator counts as well as element isotope concentrations. During early portions of the Holocene era approximately 10,000 years before present (YBP), climate in the region warmed rapidly following the end of the last major glacial epoch, resulting in a relatively mild and dry climate (versus current and recent past conditions) which lasted until about 5,000 YBP. During this period, the levels of the Great Lakes fell until the lakes became terminal or confined about 7,900 YBP (Croley and Lewis, 2006) and vegetation in the region gradually transitioned from a dominance of boreal to xeric species (Webb et al. al., 1993). Beginning about 5,000 YBP, climate cooled and

precipitation totals increased, possibly associated with a change in jet stream patterns across North America from mostly west - east or zonal to more north - south or meridional (Wright, 1992). The cooler, wetter climate favored the establishment of more mesic vegetation, which is among the primary vegetation types today. Given a more meridional jet stream flow (and an increase in frequency of polar and arctic-origin airmasses into the region), there is also evidence to suggest that the frequency and amount of lake effect precipitation increased relative to previous periods at about 3,000 YBP (Delcourt et al., 2002). Finally, during the late Holocene, the Great Lakes region experienced a period of relatively mild temperatures from approximately 800A.D. to 1300 A.D. (sometimes referred to as the ‘Medieval Warm Period’) followed by a period of relatively cool temperatures from about 1400A.D. until the late 19th Century (the ‘Little Ice Age’). Thermometer-derived observations of temperature were taken in the region during the very end of the latter period, and many extreme minimum temperature records were set that still stand today. Climate Trends Since the Late 18th Century Even with instrumental observation records of climate, the search for trends is complicated, as significant changes in climatological behavior can be introduced artificially by changes in station location, station environment, observation time, observer, and type of instrument (e.g. Karl and Williams, 1987, Andresen and Dale, 1986). In this paper, we consider data taken from the NOAA Climatological Cooperative Network (NOAA/NCDC, 1895-2006) which were quality controlled and archived by the Michigan State Climatologist in East Lansing. Temperature Trends For obtaining general temperature trends for the state, monthly temperature data averaged across all 10 climatological divisions in Michigan from 1895-2006 are presented in Figure 1. In this figure and many subsequent figures, a 9-year moving average was calculated from the yearly data and plotted on the graph (drawn as the thicker line) to illustrate longer term, roughly decadal patterns. For all moving average values, the number plotted represents the mean of a 9-year period centered on the year (e.g. a value plotted for 1905 represents an average over the period 1901-1909). From the figure, there are some discernible temperatures patterns, including:
1) A period of steady temperatures from about 1900-1930. 2) A slow cooling trend of about 0.5ºC from 1930-1980. 3) A more rapid warming trend from 1980 (about 1.3ºC).
Across the entire 112-year record, the overall change during is about +0.6ºC. The trends and temporal patterns are somewhat similar to overall global trends which include an increase in mean temperature of about +0.8ºC since 1850 (IPCC, 2007).

Figure 1. Mean average temperature for Michigan, 1895-2006. Individual years are plotted in blue and a 9-year moving average is plotted in red. The increases in temperature during the past 25 years were found to not be consistent across season or time of day. A relatively greater proportion of the regional warming appears to be associated with warmer nighttime temperatures (i.e. minimum temperatures), which is in agreement with the earlier findings of Easterling et al. (1997). Just as importantly, much of the warming occurred during the winter and spring seasons, with relatively little change in temperature found during the summer and fall seasons. The latter results are consistent with the results of Zhang et al. (2000), who found largest increases in temperature across southern Canada between 1900 and 1998 had occurred in winter and early spring. To illustrate this trend, mean winter minimum temperatures are plotted versus time in Figure 2 for Ironwood, MI, a representative site in the western Upper Peninsula. The increase in winter temperatures beginning about 1980 coincides almost exactly with the increase in statewide mean temperatures and the magnitude of warming of winter minimum temperatures during the last 25 years of record is about 2.0°C. Among the impacts resulting from the recent warmer winter temperatures is a reduction in the amount and duration of ice cover on the Great Lakes. This is well-illustrated in Figures 3 and 4, which depict time trends of the frequency of ice cover on the western arm of Grand Traverse Bay since 1851 and the number of days each winter

Figure 2. Mean winter (December-Febraury) temperatures at Ironwood, MI, 1961-2005. Individual years are plotted in blue and a 9-year moving average is plotted in red.
Figure 3. The number of years per decade that ice has covered the western arm of Grand Traverse Bay in northwestern Lower Michigan, 1851-2006. Data courtesy of Mr. James Nugent, Suttons Bay, MI and the Traverse City Chamber of Commerce, Traverse City, MI.

Figure 4. The number of days each winter season in which the combined surfaces of the Great Lakes were more than 20 percent ice covered, 1973-2003. Data courtesy of the NOAA Great Lakes Environmental Research Laboratory, Ann Arbor, MI. that more than 20 percent of the Great Lakes were covered in ice. The data in Figure 3 are unique due to the record length and completeness. They clearly suggest that ice formation on this water body has been more common in the past, with an average of 7-9 years per decade from the beginning of the record in 1981 through about 1980. Since then, the number has fallen off dramatically, with ice formation on only 1 of the past 6 years (7 years if 2006/2007 is included). While available for a much shorter period of record, satellite imagery provides a more comprehensive estimate of ice cover on the lakes. In Figure 4, the number of days appears to peak during the late 1970’s, falling to an average of less than 20 days per season during the last several years of record. These numbers are in good agreement with the results of Duguay et al. (2006), who documented similar decreases in ice cover duration as well as trends towards earlier lake ice break up in the spring season during the period 1951-2000 in nearby areas in Canada. Precipitation Trends Historical precipitation trends in the region are illustrated in Figure 5, which depicts state-level annual precipitation totals versus time averaged across over all 10 of Michigan’s climatological divisions. Precipitation generally decreased during the first 35 years of the series (1895-1930), followed by a general increasing trend beginning during the late 1930s that persisted into the 1990s. During the increase of the past several decades, there was a notable period of relatively dry conditions during the last 1950’s and early 1960’s. There is also evidence of at least a temporary leveling off in the upward

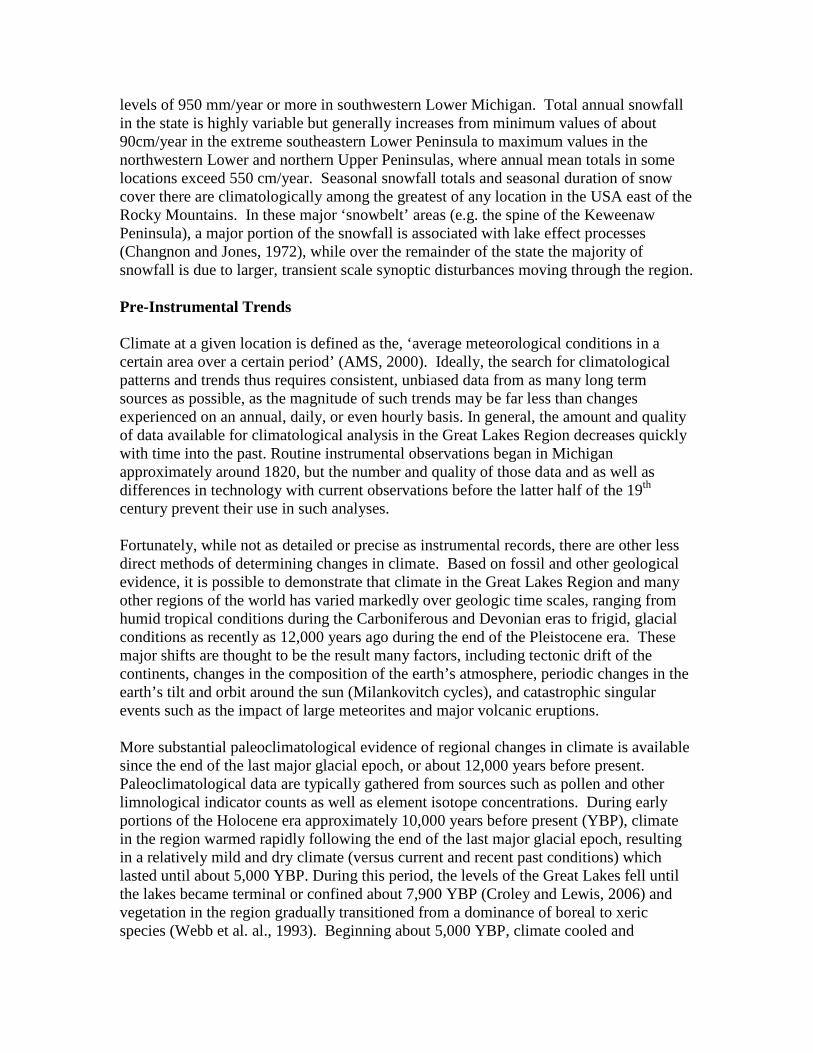
Figure 5. Total annual precipitation versus year averaged across all climatological divisions, 1895-2006. Individual years are plotted in blue and a 9-year moving average is plotted in green. precipitation trend, with drier conditions observed during the last 5-6 years. In general, annual precipitation has varied by decade, with totals ranging from approximately 650-950 mm. Overall, the 1930’s can be seen as the driest decade on record, while the 1980’s were arguably the wettest. From the 1930s through the present, annual precipitation increased approximately 1.5mm/year. It is interesting to note that this increase has not occurred as the result of an increase in the number of heavy precipitation events, as illustrated by the frequency of 25-mm precipitation events over time at East Lansing, MI (Figure 6). While somewhat variable over time, these heavy events were found to generally remain within a general range of 1-8 events per year. Statewide increases in precipitation over time were instead found to be associated with significant overall increases in the number of wet days and wet days following wet days. A representative time series of single and 2-day consecutive wet day frequencies from Caro, Michigan is given in Figure 7. The upward trends in both single and 2-day consecutive wet day frequencies are impressive, with increases of more than 30% between the 1930s and the present. Given more annual precipitation and days with precipitation over time, it is also logical to assume that cloudiness in the region has increased as well. Unfortunately, solar radiation
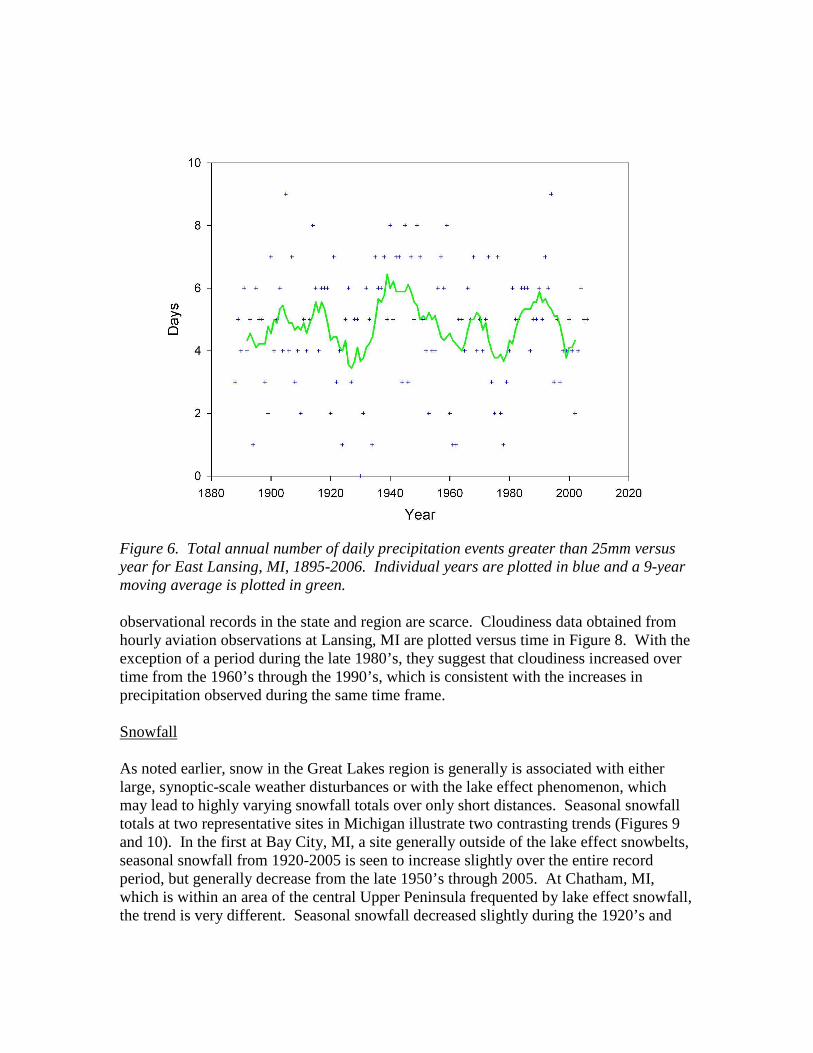
Figure 6. Total annual number of daily precipitation events greater than 25mm versus year for East Lansing, MI, 1895-2006. Individual years are plotted in blue and a 9-year moving average is plotted in green. observational records in the state and region are scarce. Cloudiness data obtained from hourly aviation observations at Lansing, MI are plotted versus time in Figure 8. With the exception of a period during the late 1980’s, they suggest that cloudiness increased over time from the 1960’s through the 1990’s, which is consistent with the increases in precipitation observed during the same time frame. Snowfall As noted earlier, snow in the Great Lakes region is generally is associated with either large, synoptic-scale weather disturbances or with the lake effect phenomenon, which may lead to highly varying snowfall totals over only short distances. Seasonal snowfall totals at two representative sites in Michigan illustrate two contrasting trends (Figures 9 and 10). In the first at Bay City, MI, a site generally outside of the lake effect snowbelts, seasonal snowfall from 1920-2005 is seen to increase slightly over the entire record period, but generally decrease from the late 1950’s through 2005. At Chatham, MI, which is within an area of the central Upper Peninsula frequented by lake effect snowfall, the trend is very different. Seasonal snowfall decreased slightly during the 1920’s and

Figure 7. Annual proportion of wet days (blue) and wet days following wet days (green) at Caro, Michigan, 1930-2000. 9-year moving averages are plotted as solid lines.
Figure8. Average annual cloud fraction versus year at Lansing, MI, 1960-1996 based on hourly aviation observations. Individual years are plotted in blue and a 9-year moving average is plotted in green.

Figure 9. Total seasonal snowfall at Bay City, MI versus time, 1920-2005. Individual years are plotted in blue and a 9-year moving average is plotted in purple.
Figure 10. Total seasonal snowfall at Chatham, MI versus time, 1920-2005. Individual years are plotted in blue and a 9-year moving average is plotted in purple.
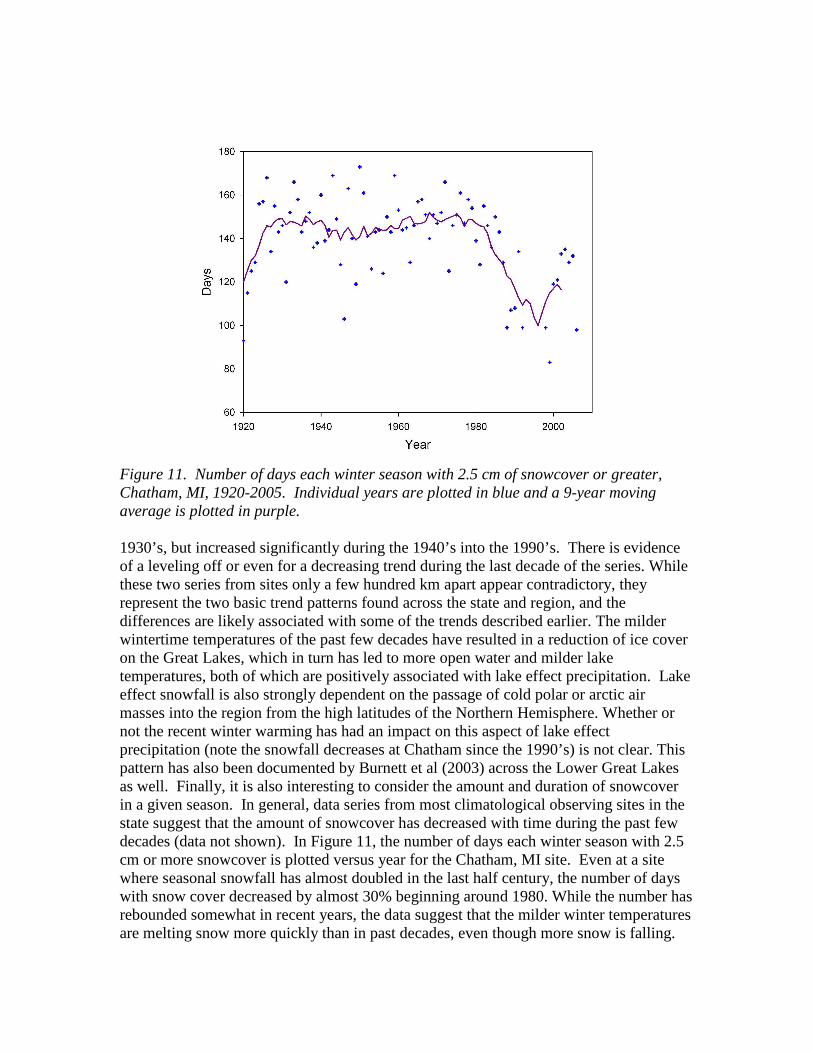
Figure 11. Number of days each winter season with 2.5 cm of snowcover or greater, Chatham, MI, 1920-2005. Individual years are plotted in blue and a 9-year moving average is plotted in purple. 1930’s, but increased significantly during the 1940’s into the 1990’s. There is evidence of a leveling off or even for a decreasing trend during the last decade of the series. While these two series from sites only a few hundred km apart appear contradictory, they represent the two basic trend patterns found across the state and region, and the differences are likely associated with some of the trends described earlier. The milder wintertime temperatures of the past few decades have resulted in a reduction of ice cover on the Great Lakes, which in turn has led to more open water and milder lake temperatures, both of which are positively associated with lake effect precipitation. Lake effect snowfall is also strongly dependent on the passage of cold polar or arctic air masses into the region from the high latitudes of the Northern Hemisphere. Whether or not the recent winter warming has had an impact on this aspect of lake effect precipitation (note the snowfall decreases at Chatham since the 1990’s) is not clear. This pattern has also been documented by Burnett et al (2003) across the Lower Great Lakes as well. Finally, it is also interesting to consider the amount and duration of snowcover in a given season. In general, data series from most climatological observing sites in the state suggest that the amount of snowcover has decreased with time during the past few decades (data not shown). In Figure 11, the number of days each winter season with 2.5 cm or more snowcover is plotted versus year for the Chatham, MI site. Even at a site where seasonal snowfall has almost doubled in the last half century, the number of days with snow cover decreased by almost 30% beginning around 1980. While the number has rebounded somewhat in recent years, the data suggest that the milder winter temperatures are melting snow more quickly than in past decades, even though more snow is falling.

Impact of Recent Climatic Trends on Agriculture: an Illustration with Corn Production As an example of the potential impacts of a changing climate on agriculture, a process-based crop simulation model, CERES-Maize (Jones and Kiniry, 1986), was utilized to simulate corn production at Coldwater, MI under historical conditions from 1900-2006. All agronomic and soil inputs in the simulations were held constant to isolate the impacts of weather and climate. Agronomic inputs included phenological coefficients of a typical current corn hybrid grown in the Great Lakes region, which were taken from the results of Andresen et al. (2001). Soil profiles used in the simulation were Marlette loam (fine-loamy, mixed mesic Haplic Glossudalf) which is representative of a fine-textured Michigan agricultural soil. Planting dates were set at 1 May (calendar day 121) for all simulations. Time series of simulated yield and total growing season precipitation versus year from these simulations are plotted Figure 12. In the figure, the correlation between the simulated yields and seasonal precipitation is clearly evident. Both variables decrease from relatively high values during the first decades of the 20th century to a low during the 1930’s followed by an increase again through the end of the record period. From the same simulations, yields from the mid 1930’s through 2006 were found to increase at an average rate of 8.1 kg/ha/year. Similarly, increases in soil moisture available to the plant at mid-season and the amount of plant available water in the soil profile across the entire season, both key variables in determining ultimate yield potential were also found to increase at rates of 0.15mm/year and 0.19mm/year, respectively. It is thus likely that some of the regional gains in agronomic productivity during the past half century have been due to wetter, less stressful growing season conditions. .

Figure 12. Simulated corn yields (blue) and total growing season precipitation (blue) versus time at Coldwater, MI, 1900-2006. References American Meteorological Society, 2000. Glossary of Meteorology, Second Edition. American Meteorological Society, Boston, MA., 855p. Andresen, J.A. and R.F. Dale, 1986. Climatic Data Bases. Proc. Ind. Acad. of Science 95:503-512. Andresen, J.A., G. Alagarswamy, J.T. Ritchie, C.A. Rotz, and A.W. LeBaron, 2001. Assessment of the Impact of Weather on Maize, Soybean, and Alfalfa Production in the Upper Great Lakes Region of the United States, 1895-1996. Agron. J. 93: 1059-1070. Burnett A.W., M.E. Kirby, H.T. Mullins, and W.P. Patterson, 2003. Increasing Great Lake-effect snowfall during the twentieth century: A regional response to global warming? J. Climate16: 3535-3542.

Changnon, S.A. and D.M.A. Jones, 1972. Review of the Influences of the Great Lakes on Weather. Water Resour. Res. 8: 360-371. Croley, T.E. and C.F.M. Lewis, 2006. Warmer and drier climates that make terminal great lakes. J. Great Lakes Res. 32:852-869. Delcourt, P.A., P.L. Nester, H.R. Delcourt, C.I. Mora, and K.H. Orvis, 2002. Holocene Lake-Effect Precipitation in Northern Michigan. Quarternary Res. 57:225-233. Duguay, C.R., T.D. Prowse, B.R. Bonsal, R.D. Brown, M.P. Lacroix, and P. Menard, 2006. Recent trends in Canadian lake ice cover. Hydrological Processes 20:781-801. Eichenlaub, V.L., J.R. Harman, F.V. Nurnberger, and H.J. Stolle, 1990. The Climatic Atlas of Michigan. Univ. of Notre Dame Press, Notre Dame, IN 46556. Easterling, D.R., B. Horton, P.D. Jones, T.C. Peterson, T.R. Karl, D.E. Parker, M.J. Salinger, V. Razuvayev, N. Plummer, P. Jamason and C.K. Folland, 1997: Maximum and minimum temperature trends for the globe. Science 277: 364-367. Intergovernmental Panel on Climate Change (IPCC), 2007. Summary for Policymakers from Climate Change 2007: The Physical Science Basis. Contribution of Working Group I to the Fourth Assessment Report to the IPCC. IPCC Secretariat, c/o World Meteorological Organization, Geneva. Available online at: http://www.ipcc.ch/SPM2feb07.pdf. Jones, C.A., and J.R. Kiniry. 1986. CERES-Maize: A Simulation Model of Maize Growth and Development. Texas A&M Univ. Press, College Station, TX, 194 p. Karl, T.R. and C.N. Williams, 1987. An Approach to Adjusting Climatological Time Series for Discontinuous Inhomogeneities. J. Clim. Appl. Met. 26: 1744-1763. NOAA/NCDC. 1895-2006. Climatological Data. National Oceanic and Atmospheric Administration, National Climatic Data Center, Asheville, NC. Webb, T., P.J. Bartlein, S.P. Harrison, and K.H. Anderson, 1993. Vegetation, lake levels, and climate in eastern North America for the past 18,000 years. In ‘Global Climates Since the last Glacial Maximum’, H.E. Wright, J.E. Kutzbach, T.Webb, W.F. Ruddiman, F.A. Street-Perot, and P.J. Bartlein, eds., pp 415-467. Univ. of Minnesota Press, Minneapolis, MN. Wright, H.E., 1992. Patterns of Holocene climatic change in the Midwestern United States. Quarternary Res. 38:129-134. Zhang, X., W.D. Hogg, and E. Mekis, 2001. Spatial and temporal characteristics of heavy precipitation events over Canada. J. Climate 14: 1923-1936.